actuarial experience study and proposed assumptions for ... experience review, jan 01 2002.pdf ·...
TRANSCRIPT
OHIO POLICE AND FIRE PENSION FUND
Actuarial Experience Study and Proposed Assumptions for January 1,2002 Actuarial Valuation ( 1 / 1 / / q ~ 7 -- ,51gr/2uo;)
i
. - 1 Copyright O 2002
T H E SEGAL COMPANY
6300 S. Syracuse Way Suite 750 Englewood, CO 801 11 -7302
T 303.71 4.9900 F 303.71 4.9990 www.segalco.com
October 1,2002
Mr. William J. Estabrook Ohio Police and Fire Pension Fund 140 East Town Street Columbus, OH 43215
Dear Bill:
We are pleased to submit this report on the actuarial experience of the Ohio Police and Fire Pension Fund for the period for January 1, 1997 to December 31, 2001. This investigation is the basis for our recommendation of the assumptions and methods to be used in the January 1, 2002 actuarial valuation.
All current assumptions and methods were reviewed as part of this study. Some of our recommendations reflect changes to the assumptions and methods as used in the January 1, 2001 actuarial valuation while other current assumptions and methods remain unchanged.
Our analysis was conducted in accordance with generally accepted actuarial principles as prescribed by the Actuarial Standards Board (ASB) and the American Academy of Actuaries. Additionally, the development of all assumptions contained herein are in accordance with the ASB Actuarial Standard of Practice (ASP) No. 27 (Selection of Ecolzonzic Assii~izptions for Meas~iring Pension Obligutions) and ASP No. 35 (Selection of Demographic and Other Non-Ecorzomic Assiimptions for Measiiring Pension Obligations).
The undersigned actuaries are experienced with performing experience studies for large public-sector pension plans and are qualified to render the opinions contained in this report.
Sincerely,
/w&-ti- Leslie L. Thompson, ASA, MAAA, EA Senior Vice President and Consulting Actuary
&F- John J. arrett, ASA, MAAA Vice President and Consulting Actuary
Benefits. Compensation and HR Consulting ATLANTA BOSTON CHICAGO CLEVELAND DENVER HARTFORD HOUSTON LOS ANGELES MINNEAPOLIS
NEW ORLEANS NEW YORK PHILADELPHIA PHOENIX SAN FRANCISCO SE4TTLE TORONTO WASHINGTON. DC
LLFQ .,4fLFA Mult~natlonal Group of Actuaries and Consultants AMSTERDAM BARCELONA GENEVA HAMBURG LONDON MELBOURNE MEXICO CITY OSLO PARIS " i r C
TABLE OF CONTENTS
I. INTRODUCTION AND SUMMARY OF KEY FINDINGS 1
IZ. ECOIVONIIC ASSUMPTIONS 5
N. ACTUARIAL COST METHOD AND ASSET VALUATION METHOD 38
V. COST EFFECTS 40
VI. HEALTH CARE COST UPDATE 4 1
APPENDIX
A. Detailed Summary of Current Recommendations B . Recommended Withdrawal Rates C. Recommended Rates of Disability Incidence D. Recommended Retirement Rates E. Recommended Healthy Active Member Mortality Rates F. Recommended Non-Disabled Retirement Mortality Rates G. Recommended Disabled Retirement Mortality Rates 13. Recommended Beneficiary Mortality Rates
I. INTRODUCTION AND SUMMARY OF KEY FINDINGS
Actuarial valuations of the Ohio Police and Fire Pension Fund are prepared to determine whether the
contribution rates are sufficient to maintain the actuarial soundness of the Fund. Each actuarial
valuation involves a projection of the benefits expected to be paid in the future to all members of the
Fund. The projection of expected future benefit payments is based on the characteristics of members
as of the valuation date, the benefit provisions in effect on that date and the expectation of future
events and conditions. The valuation process requires the use of assumptions regarding these future
events and conditions.
The assumptions used in actuarial valuatioils can be grouped in two categories: (1) economic
assumptions - the assumed long-term rates of investment return, salary increases and payroll growth,
and (2) non-economic or demographic assumptions - the assumed rates of withdrawal, disability,
retirement, and mortality. Non-economic assumptions are selected primarily on the basis of recent
experience, whlle economic assumptions rely more on a long-term perspective of expected future
trends.
If actual experience exactly matches the expected experience, the actual annual cost of the Fund will
equal the annual cost determined by the actuarial valuation. However, this result is virtually never
achieved, due to the long-term forecast of the benefit projections and the numerous assumptions used
in actuarial valuations. The Fund usually recognizes an actuarial gain or an actuarial loss each year,
reflecting the net difference between actual experience and anticipated experience. Determination of
the funding status and funding periods are updated in connection with each actuarial valuation to
reflect the net gain or loss.
The actuary provides to the Board a recommendation of the assumptions and methods used in the
actuarial valuation. The Board has the ultimate respo~lsibility for which assumptions and methods
are used in the actuarial valuation. If the assumptions on an overall basis prove to be a good
indicator of actual experience, the contribution rates for the current level of benefits will continue to
be sufficient to meet the funding policy of the Fund. On the other hand, if the assumptions
understate or overstate the actual cost of the Fund, the calculated funding period will vary
accordingly
I. INTRODUCTION AND SUMMARY OF KEY FINDINGS (continued)
Actuarial experience studies are undertaken periodically and serve as the basis for recommended
changes in actuarial assumptions and methods. A change in assumptions is recommended when it is
demonstrated that the current assuinptions do not accurately reflect the current trend determined from
analysis of the data. The data could either be actual experience, for demographic assumptions, or it
could be composed of an analysis of economic forecasts.
A change in actuarial methodology is recommended when such change adds stability to the actuarial
valuation process. Also, a change is suggested if the recommended actuarial methodology provides
an approach that better fits the funding policy. The methods considered in this study include the
actuarial cost method, the actuarial asset smoothing technique and the amortization method.
This study reviews the actuarial experience of the Ohio Police and Fire Pension Fund for the five-
year period from January 1, 1997 through December 31, 2001, compares the experience to the
current actuarial assumptions and recommends changes to the assuinptions as necessary. The
actuarial methods used in performing the valuation are also reviewed in this study and recommended
changes are provided as necessary.
We are recommending changes to the following assumptions or methods:
Withdrawal Current withdrawal rates for both Police and Fire are based on the age of the
member. We recommend that the withdrawal assumptioll for both Police and
Fire be based on both the age and service of the member. The new
assumption reflects a general decrease in the rates of withdrawal, consistent
with experience.
Disability Zncideizce Actual experience shows disability retirement occurs with greater than Rates expected frequency at ages above 53, and occurs with lower thail expected
frequency at ages below 53. We recommend changes that reflect this trend.
Occurreizce of We recommend changes to the assumed percents of the occurrence of Disability Types disability types. The data reviewed in this study shows an increased
occurrence of on-duty total and permanent disability types.
I. INTRODUCTION AND SUMMARY OF KEY FINDINGS (continued)
Retirement Rates The study indicates that actual retirement rates are slightly lower than the
current assumed rates. We recommend adjustments to reflect the latest
experience.
Active Mortality We recommend the current mortality table, 1994 Group Annuity Mortality
Table, with adjustments to the years of set-backlset-forward, as applicable,
for all member types. Also, we propose the rates for active members be sex
distinct for males and females.
Retired and We recommend the current mortality table, 1994 Group Annuity Mortality Beneficiary Mortality
Table, remain the same, but adjust the years of set-forward for all member
types.
Salary Increase The current salary increase assumption is based on age of the member. W e
propose t h s assumption be based on years of service, to better fit the salary
increases reflected in the five years of analyzed experience. W e also
recommend the salary increase assumption utilize the building block
approach in accordailce with ASP No. 27.
Administrative Currently, administrative expenses are split between normal cost and Expense investment returns. We recommend loading the expected administrative
expenses to normal cost.
Asset Valuatiorz We recommend a method which smoothes the difference between the actual Method and expected return on the market value of assets over a five-year period. In
addition, we recommend a change in the prescribed corridor above or below
market value to be 10% the first year (for the January 1, 2002 actuarial
valuation) and increase to 20% the following year.
. ' I. INTRODUCTION AND SUMMARY OF KEY FINDINGS (continued)
I - - The net impact to the Fund of the reconmended assumptions and methods is a 15-year decrease in
- the funding period, as compared to the results of Segal's parallel valuation as of January 1, 2001.
This impact is primarily attributed to the change in the asset valuation method.
The remainder of this report provides our analysis and recommendation for each actuarial assumption
and method, as well as the impact of the recommendations developed, as of January 1, 2001.
I Appendices A-H provide detailed summaries of all assumptions in tabular formats. I.
11. ECONOMIC ASSUMPTIONS
The economic assumptions have a significant impact on the development of plan liabilities. Changes
to these assumptions can substantially alter the results calculated by the actuary. The goal of our
analysis is to produce a consistent set of economic assumptions that appropriately reflect the future
economic trends.
The primary economic assumptions that affect the Fund's calculated funding period are:
h Investment return
P Salary increases
P Payroll growth
The current economic assumptions used in the 2001 actuarial valuation for the Ohio Police and Fire
Pension Fund, are as follows:
Investment return 8.25% per annum, net of expenses.
Salary increases Age-related from 7.0% at ages 25-30, 5.75% at ages 31-34,
and 5.0% for ages greater than 34.
Payroll growth 4.0% per annum.
The Actuarial Standards Board (ASB) has adopted Actuarial Standard of Practice No. 27 (ASP 27),
(Selection of Economic Assumptions for Measuring Pension Obligations) to provide actuaries
guidance in developing economic assumptions. A key feature of the ASB's guidance is the
"building block" approach in developing economic assumptions. This approach requires the actuary
to consider the key component parts of major assumptions and determine reasonable best-estimates
for each component.
Under this approach, we consider the investment rate of return assumption as the combination of an
inflation component and a real rate of return component. The conlponents of the salary increase
assumption are inflation, productivity and merit. The inflation component is included in all of the
economic assumptions, and therefore is a key to developing a consistent set of assumptions.
HH. ECONOMIC ASSUMPTIONS (continued)
A. Inflation
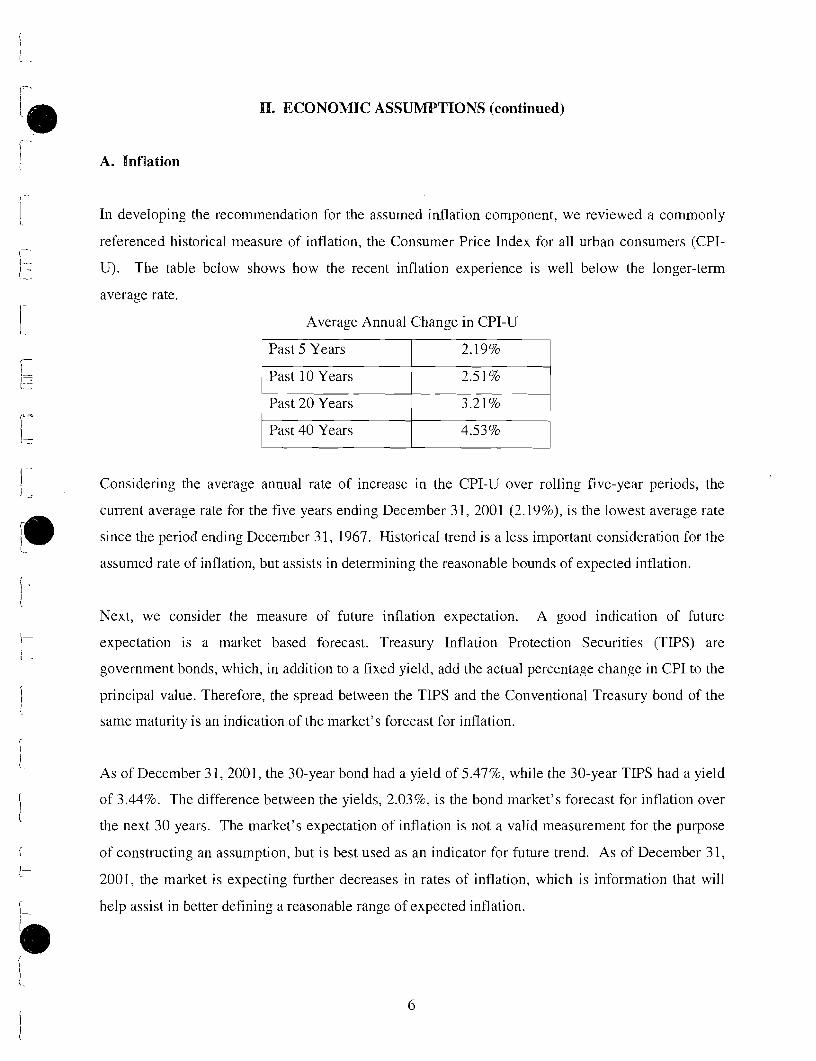
In developing the recommendation for the assumed inflation component, we reviewed a commonly
referenced historical measure of inflation, the Consumer Price Index for all urban consumers (CPI-
U). The table below shows how the recent inflation experience is well below the longer-term
average rate.
Average Annual Change in CPI-U
Past 5 Years
Considering the average annual rate of increase in the CPI-U over rolling five-year periods, the
current average rate for the five years ending December 31, 2001 (2.19%), is the lowest average rate
since the period ending December 31, 1967. Historical trend is a less important consideration for the
assumed rate of inflation, but assists in determining the reasonable bounds of expected inflation.
1 Past 20 Years
Past 40 Years
Next, we consider the measure of future inflation expectation. A good indication of future
expectation is a market based forecast. Treasury Inflation Protection Securities (TIPS) are
government bonds, which, in addition to a fixed yield, add the actual percentage change in CPI to the
principal value. Therefore, the spread between the TIPS and the Collventional Treasury bond of the
same maturity is an indication of the market's forecast for inflation.
3.21%
4.53% 1
As of December 31,2001, the 30-year bond had a yield of 5.4796, while the 30-year TIPS had a yield
of 3.44%. The difference between the yields, 2.0396, is the bond market's forecast for inflation over
the next 30 years. The market's expectation of inflation is not a valid measurement for the purpose
of constructing an assumption, but is best used as an indicator for future trend. As of December 31,
2001, the market is expecting further decreases in rates of inflation, which is information that will
help assist in better defining a reasonable range of expected inflation.
11. ECONOMIC ASSUMPTIONS (continued)
A. Inflation (continued)
The typical range of future expected inflation for actuarial assumptions in recent years is between
3.0% and 4.0%. Considering this trend, as well as the Bond Market's low hture expectation, we
have determined the current reasonable range to be between 2.5% and 3.5%.
As a check of the validity of this reasonable range, we reference the 2002 Anizual Report of the
Board of Trustees of the Federal Old-Age and Survivors Iizsuraizce and Disability Iizs~i~.aizce Tr~ist
Fuizds (2002 OASDI Trustees Report). The range of inflation rates in this report was 2.0% for low-
cost projection and 4.0% for high-cost projection.
Once the reasonable range is set, we determine the specific point in the range, which is the best
estimate of long-term future inflation rates. Because we find no compelling reasons to favor either
the high or low end of the range, we recommend the mid-point, 3.0%, as the best estimate for the
future annual rate of inflation. This conclusion was also reached in the 2002 OASDI Trustees report.
In that report, 3.0% was used as the best estimate of future increase in inflation.
Current Inflation component assumption - 4.0%
Recommended Inflation component assumption - 3.0%
B. Investment Rate of Return
The investment rate of return assumption is developed using the "building block" approach as
outlined in the ASP 27. Under this approach, the investment rate of return assumption is made up of
two components; the inflation component and the real investment rate of return component. The
reasonable range of the inflation component determined above is coinbined with the reasonable range
of the real rate of return component. This reasonable range is then evaluated and refined. The final
recommendation is a specific point in this best-estimate range.
11. ECONOMIC ASSUMPTIONS (continued)
B. Investment Rate of Return (continued)
In developing the reasonable range for the real rate of return, we consider the historical returns of the
Fund's two major asset classes, Stocks and Bonds. First, over the long term, U.S. Stocks (S&P 500)
have averaged an annual rate of return of 10.796, while U.S. Bonds have averaged a 5.7% annual rate
of return according to Ibbotson Associates historical market data. Removing the average annual rate
of inflation since 1926 of 3.1%, and considering the range of common allocations (40% stock and
60% bond to 67% stock and 33% bond, based on historical data), we determined the initial range for
the real rate of return to be 4.75% to 6.0% for a similarly diversified fund.
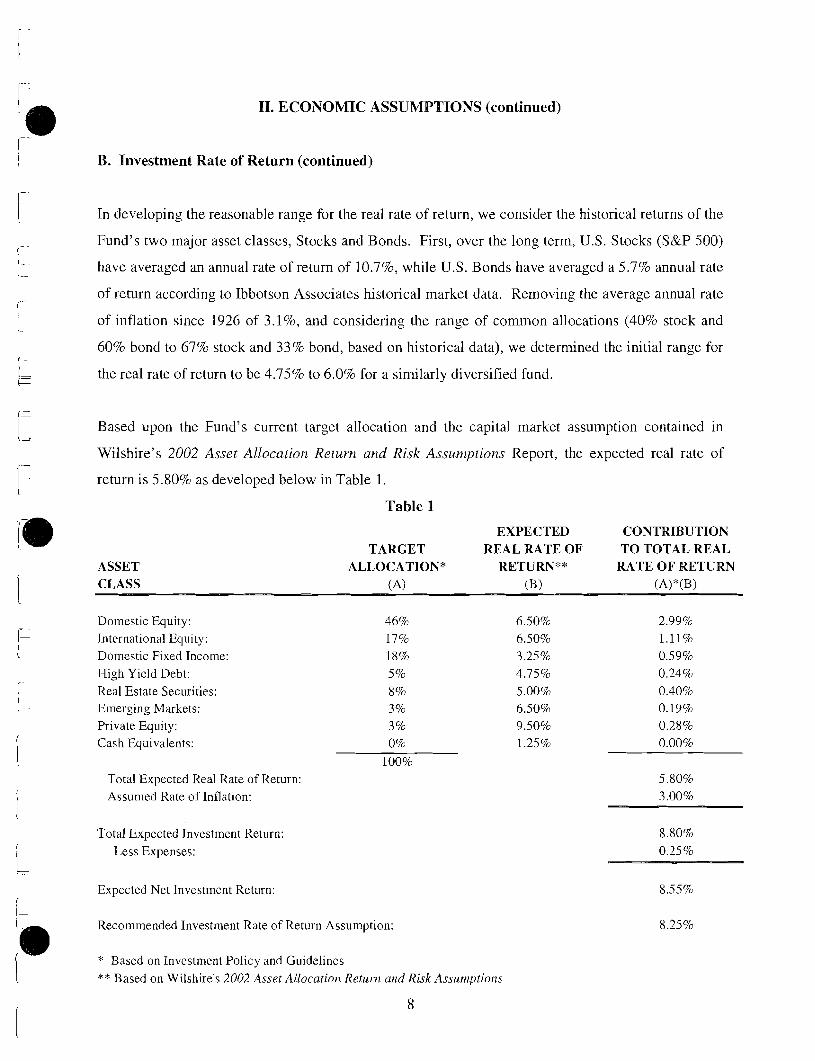
Based upon the Fund's current target allocation and the capital market assumption contained in
Wilshire's 2002 Asset Allocation Return and Risk Assumptions Report, the expected real rate of
return is 5.80% as developed below in Table 1.
Table 1
EXPECTED CONTRIBUTION TARGET REAL RATE OF TO TOTAL REAL
ASSET ALLOCATION* RETURN** RATE OF RETURN CLASS (A) (B) (A)"(B)
Domestic Equity: International Equity: Domestic Fixed Income: High Yield Debt: Real Estate Securities: Emerging Markets: Private Equity: Cash Equivalents:
Total Expected Real Rate of Return: Assumed Rate of Inflation:
Total Expected Investment Return: Less Expenses:
Expected Net Investment Return:
Recommended Investment Rate of Return Assumption:
* Based on Investment Policy and Guidelines ** Based on Wilshire's 2002 Asset Allocatioi7. Return and Risk Assunzptiori.s
8
11. ECONOMIC ASSUMPTIONS (continued)
B. Investment Rate of Return (continued)
The 5.80% expected real rate of return falls in the upper half of the reasonable range, which is
consistent with the higher equity asset allocation of the Fund. Combining the best-estimate range
with the assumed rate of inflation of 3.0% yields a gross investment rate of return assuinption
between 7.75% and 9.00%. Removing a 0.25% allowance for investment expenses results in a net
investment return assumption range between 7.50% to 8.75%. A review of 114 other statewide
retirement plans contained in the Public Pension Coordinating Council Survey reveals all but ten
have an investment return assumption between 7.50% and 8.75%.
The current assumption is 8.25%, which is well within the reasonable range developed for this
assumption. Therefore, we recommend no change to the current investment rate of return
assumption of 8.2570. This recommendation is based upon the following observations:
1. The assumption reinains reasonable when considering the long-term expected returns for a
similarly allocated fund based upon long-term historical data.
2. The assumption reinains reasonable when we consider the expected investment rate of return
of the Fund's target allocation based upon the expected future return assumptions of the
Fund's asset consultant.
3. The assumption remains reasonable when we consider the investment return assumption
utilized by like funds.
4. The assumption remains reasonable when considering the historical performance of the
actual Fund compared to its benchmark. Specifically, the Fund has outperformed it's
benchmark, (48% of Wilshire 5000, 18% of Lehman Aggregate, 1770 of MSCI EAFE Index,
8% of Wilshire Real Estate Fund, 370 MSCI Emerging Markets Free, 5% CSFB Developed
Countries High Yield, 1% of Wilshire 5000 + 5%) by an average of 0.28% annually.
Cuirent investment rate of return assumption - 8.25%
Recommended investment rate of return assulnption - 8.25%
Although the overall assumption is the same, we recommend the components of the assumption
change to a 3.0% inflation component and a 5.25% real rate of return component.
9
11. ECONOMIC ASSUMPTIONS (continued)
C. Salary Growth Assumption
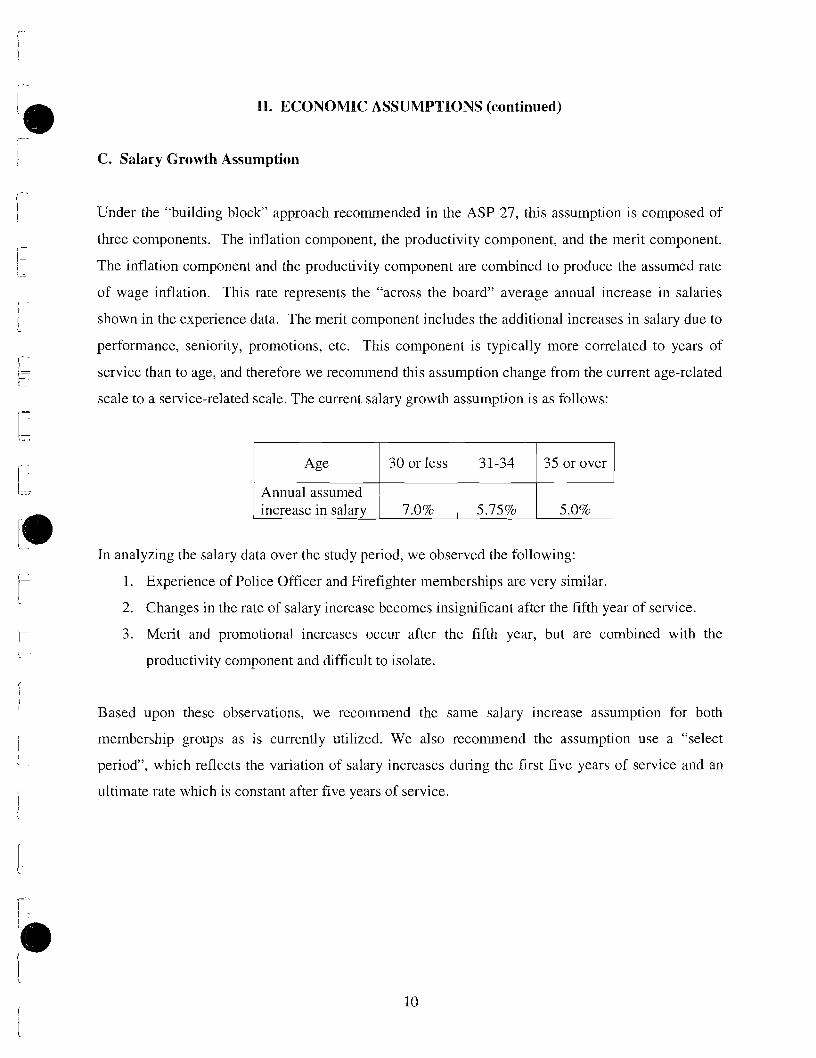
Under the "building block" approach recommended in the ASP 27, this assumption is composed of
three components. The inflation component, the productivity component, and the merit component.
The inflation component and the productivity component are combined to produce the assumed rate
of wage inflation. This rate represents the "across the board" average annual increase in salaries
shown in the experience data. The merit component includes the additional increases in salary due to
performance, seniority, promotions, etc. This component is typically more correlated to years of
service than to age, and therefore we recommend this assumption change from the current age-related
scale to a service-related scale. The current salary growth assumption is as follows:
In analyzing the salary data over the study period, we observed the following:
1. Experience of Police Officer and Firefighter memberships are very similar.
2. Changes in the rate of salary increase becomes insignificant after the fifth year of service.
3. Merit and promotional increases occur after the fifth year, but are combined with the
productivity cornpoilent and difficult to isolate.
Based upon these observations, we recommend the same salary increase assumption for both
meinbership groups as is currently utilized. We also recommend the assumption use a "select
period", which reflects the variation of salary increases during the first five years of service and an
ultimate rate which is constant after five years of service.
n. ECONOMIC ASSUMPTIONS (continued)
C. Salary Growth Assumption (continued)
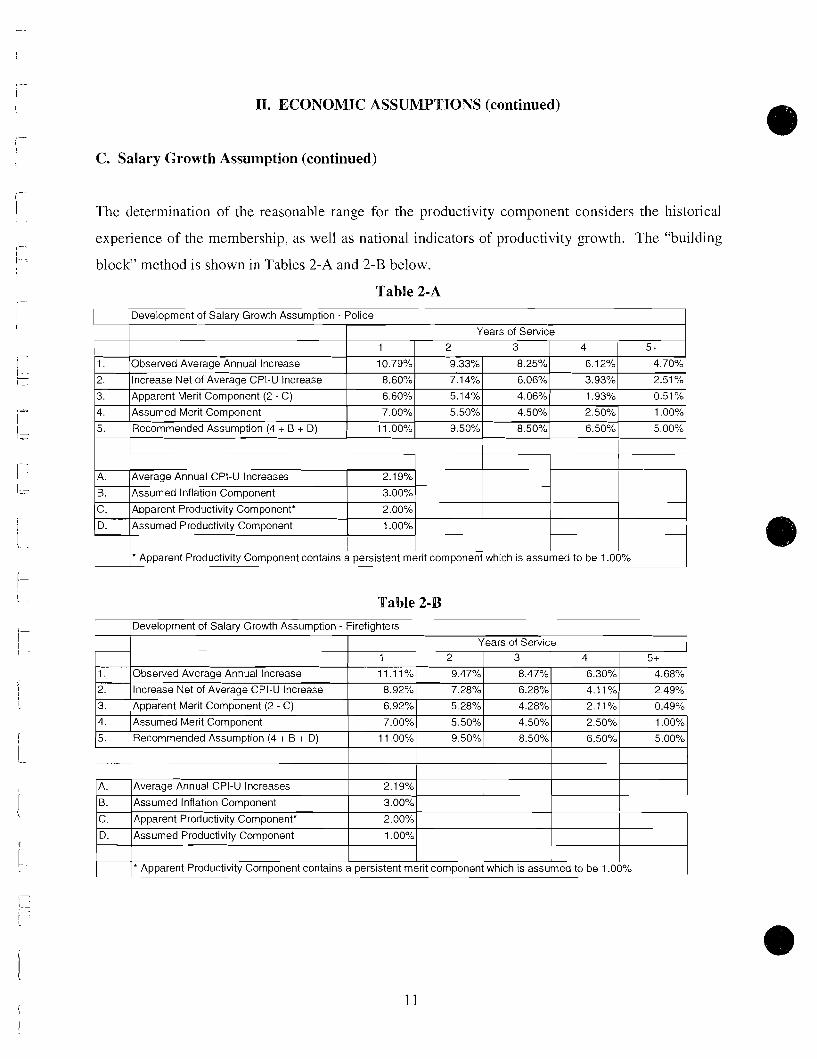
The determination of the reasonable range for the productivity component considers the historical
experience of the membership, as well as national indicators of productivity growth. The "building
block" method is shown in Tables 2-A and 2-B below.
Table 2-A 1 Development of Salary Growth ~ s s u e t i o n - Police I
1
1.
2.
3.
4.
5.
I L-U Apparent Productivity Component contains a persistent merit component which is assumed to H -
Years of Service
B.
C.
D.
Table 2-B
-
Observed Average Annual Increase
Increase Net of Average CPI-U Increase
Apparent Merit Component (2 - C)
Assumed Merit Component
Recommended Assumption (4 + B + D)
1 ~ e v e l o ~ m e ~ s s ~
Years of Service
Assumed Inflation Component
Apparent Productivity Component*
Assumed Productivity Component
1
10.79%
8.60%
6.60%
7.00%
1 1 .OO%
3.00%
2.00%
1 .OO%
1.
2.
3.
4.
5.
2
9.33%
7.14%
5.14%
5.50%
9.50%
A.
B.
Observed Average Annual Increase
Increase Net of Average CPI-U Increase
Apparent Merit Component (2 - C)
Assumed Merit Component
Recommended Assumption (4 + B + D)
3
C. Apparent Productivity Component* 2.00%
D. Assumed Productivity Component 1 .OO%
Average Annual CPI-U Increases
Assumed Inflation Component
4 j 5+
1
11.11%
8.92%
6.92%
7.00%
1 1 .OO%
2.1 9%
3.00% ------
8.25%
6.06%
4.06%
4.50%
8.50%
2
9.47%
7.28%
5.28%
5.50%
9.50%
3
8.47%
6.28%
4.28%
4.50%
8.50%
4 5+
6.30%
4.11%
2.11%
2.50%
6.50%
4.68%
2.49%
0.49%
1 .OO%
5.00%
11. ECONOMIC ASSUMPTIONS (continued)
43. Salary Growth Assumption (continued)
Analysis of the experience data reveals that the average annual rate of salary growth stabilizes after
five years of service. Because merit and promotional increases continue after the fifth year of
service, we must consider that the apparent productivity component includes this ongoing merit and
promotional increase. The data yields an apparent productivity growth component of 2.0%. The
possible range of actual productivity growth included in the data is between 0%, assuming all the
apparent increase is due to ongoing merit and promotion, and 2.0% assuming there are no merit and
promotion increases. Broader measurements are used to refine this initial reasonable range.
Nationally, the measure of productivity growth in recent years has increased, however it is not clear
if this trend will continue for the long-term. The 2002 OASDI Trustee report provides an expected
range of the real-wage increases (the average increase in wages above inflation) between 0.6% and
1.6%. Additionally, the range of increases in average wages (comparable to wage inflation or
inflation plus productivity) was 3.6% to 4.6%. We agree with these reasonable ranges.
Splitting the 2.0% apparent productivity component evenly between assumed true productivity
growth and assumed ongoing merit and promotional increases yields a productivity component of
1.0%, which is well within the 0.6% to 1.6% reasonable range. The resulting wage inflation (price
inflation plus productivity) assumption is 4.0%, well within the 3.6% to 4.6% range contained in the
2002 OASDI Trustees report. Since we have no data to indicate a more reasonable assignment of the
apparent productivity increases between assumed productivity and assumed ongoing merit and
promotion, we are satisfied with this assumption.
II. ECONOMIC ASSUMPTIONS (continued)
D. Payroll Growth Assumption
Unlike the other economic assumptions, the payroll growth assumption plays no part in the
calculation of the Fund's liabilities. It does, however, have a material impact upon the determination
of the funding period. Under the current funding method, the amortization of the Unfunded Actuarial
Accrued Liability over the funding period is calculated to be level as a percent of payroll. This
calculation requires an assumption of the future annual increase i11 total covered payroll over the
funding period. The Governmental Accounting Standards Board (GASB) requires this assumption
not reflect increases in payroll due to increases in the number of plan members, but only inflation
related increases. The reasonable range for this assumption is typically determined from the assumed
rate of price inflation, 3.0%, to the assumed rate of wage-inflation, 4.0%. Plans that demonstrate
higher actual payroll growth increases can justify using assumed wage-inflation as the payroll growth
assumption.
The average of the total active member payroll of the Fund has increased nearly 6.5% anilually since
1997. The average annual increase in the number of active members is 1.8% per year. The result is
an average annual increase in payroll of 4.6%, net of the effect of increase in active members.
Therefore, we recommend continued use of the current 4.0% payroll growth assumption, which
reflects the use of the assumed rate of wage-inflation of 4.0% (price inflation: 3.0% plus assumed
productivity: 1.0%).
III. NON-ECONOMIC ASSUMPTIONS
Most of the assumptions discussed in thls section are demographic in nature, and rely heavily on the
experience data and it's credibility. The actuary often uses professional judgement in applying a
level of credibility to experience data.
A primary analysis tool used in measuring the effectiveness of demographic assumptions is the actual
to-expected ratio, or AE ratio. This ratio is simply the number of actual occurrences divided by the
number of occurrences expected by applying the assumption. An A/E ratio greater than one results
from more actual occurrences than anticipated in the assumed rates, and an AE ratio less than one
results from less actual occurrences than anticipated in the assumed rates. An A/E ratio of one is not
always the most desired result. For example, the trend of decreasing mortaljty rates is well
documented, therefore the proposed mortality assumption should reflect the current mortality rates
from the data with a margin to appropriately account for the expected trend of mortality
improvement. An AE ratio greater than one is typically desired when the active population has
historically demonstrated improvement in rates of mortality.
III. NON-ECONOMIC ASSUMPTIONS (continued)
A. Withdrawals Among Active Employees
Current Actuarial Assumptions
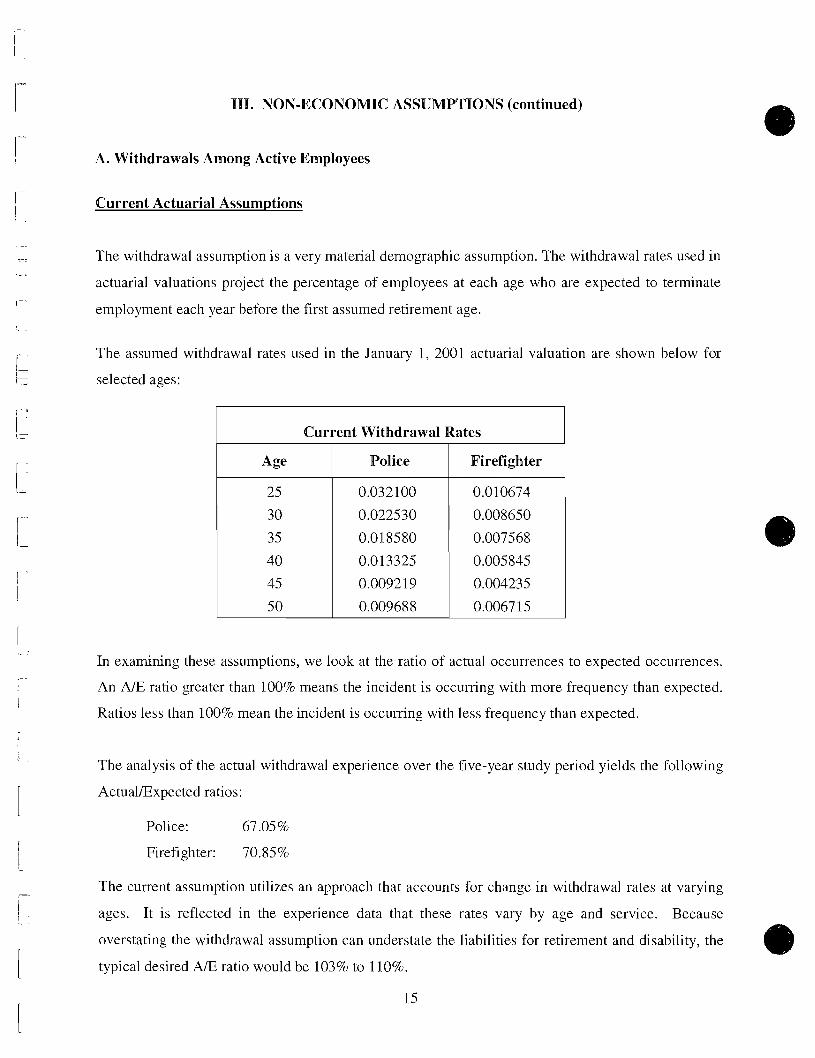
The withdrawal assumption is a very material demographic assumption. The withdrawal rates used in
actuarial valuations project the percentage of employees at each age who are expected to terminate
employment each year before the first assumed retirement age.
The assumed withdrawal rates used in the January 1, 2001 actuarial valuation are shown below for
selected ages:
In examining these assumptions, we look at the ratio of actual occurrences to expected occurrences.
An A/E ratio greater than 100% means the incident is occurring with more frequency than expected.
Ratios less than 100% mean the incident is occurring with less frequency than expected.
Current Withdrawal Rates
The analysis of the actual withdrawal experience over the five-year study period yields the following
Actual/Expected ratios:
Age
25
30
3 5
40
4-5
5 0
Police: 67.05 %
Firefighter: 70.85%
The current assumption utilizes an approach that accounts for change in withdrawal rates at varying
ages. It is reflected in the experience data that these rates vary by age and service. Because
overstating the withdrawal assumption can understate the liabilities for retirement and disability, the
typical desired A/E ratio would be 103% to 1 10%.
15
Police
0.032100
0.022530
0.018580
0.013325
0.009219
0.009688
Firefighter
0.010674
0.008650
0.007568
0.005845
0.004235
0.0067 15
111. NON-ECONOMIC ASSUMPTIONS (continued)
A. Withdrawals Among Active Employees (continued)
Membership Experience
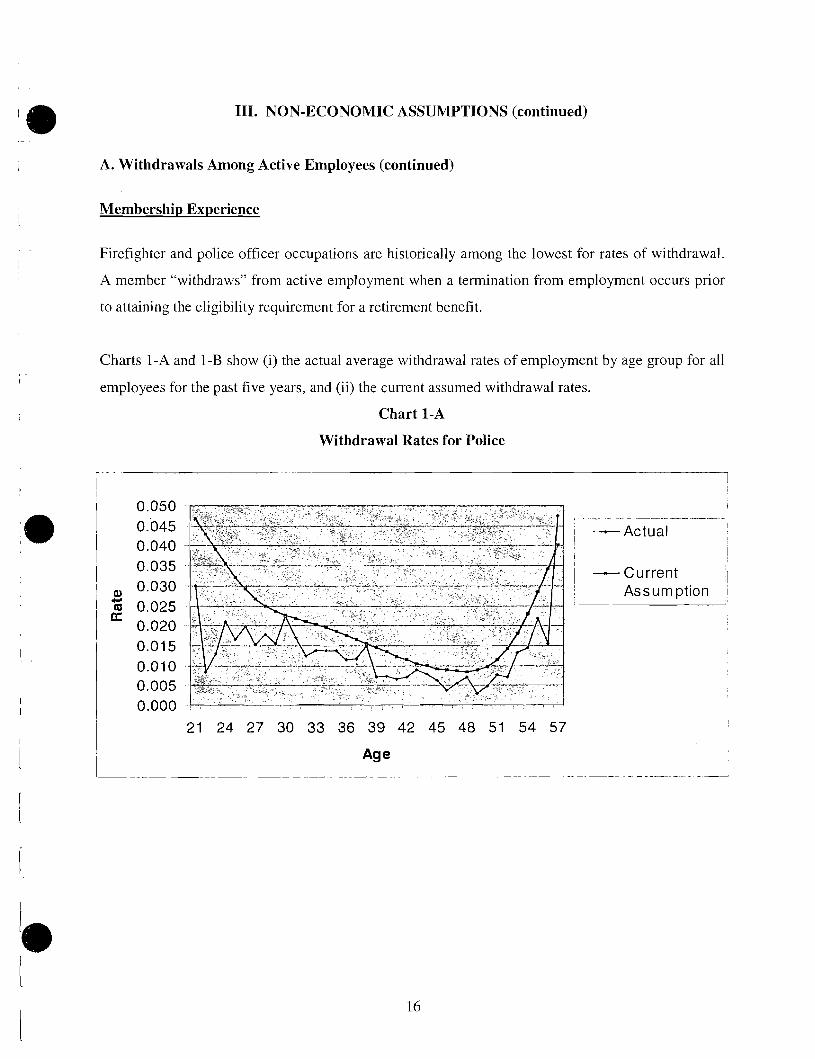
Firefighter and police officer occupations are historically among the lowest for rates of withdrawal.
A member "withdraws" from active employment when a termination from employment occurs prior
to attaining the eligibility requirement for a retirement benefit.
Charts 1-A and 1-B show (i) the actual average withdrawal rates of employment by age group for all
employees for the past five years, and (ii) the current assumed withdrawal rates.
Chart 1-A
Withdrawal Rates for Police
1 -Current I !
Assumption I
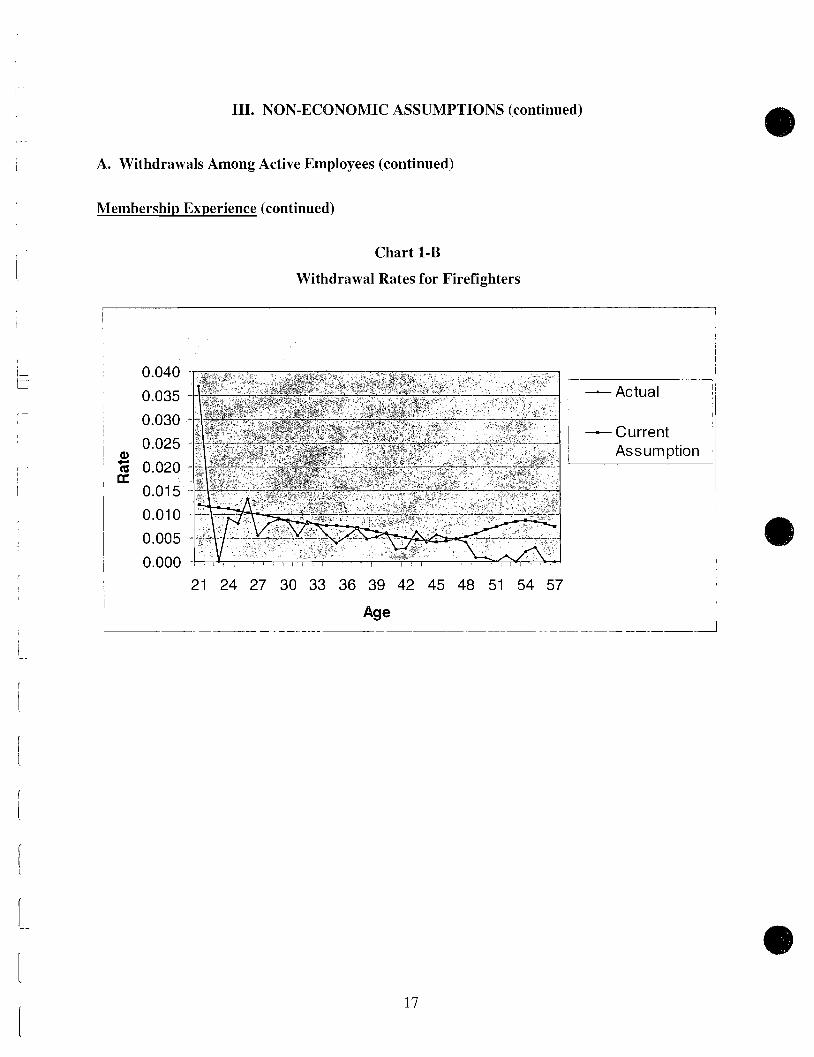
111. NON-ECONOMIC ASSUMPTIONS (continued)
A. Withdrawals Among Active Employees (continued)
Membership Experience (continued)
Chart 1-B
Withdrawal Rates for Firefighters
j -Current , I
1- Assumption I 1
i
111. NON-ECONOMIC ASSUMPTIONS (continued)
A. Withdrawals Among Active Employees (continued)
Findings and Recommendations
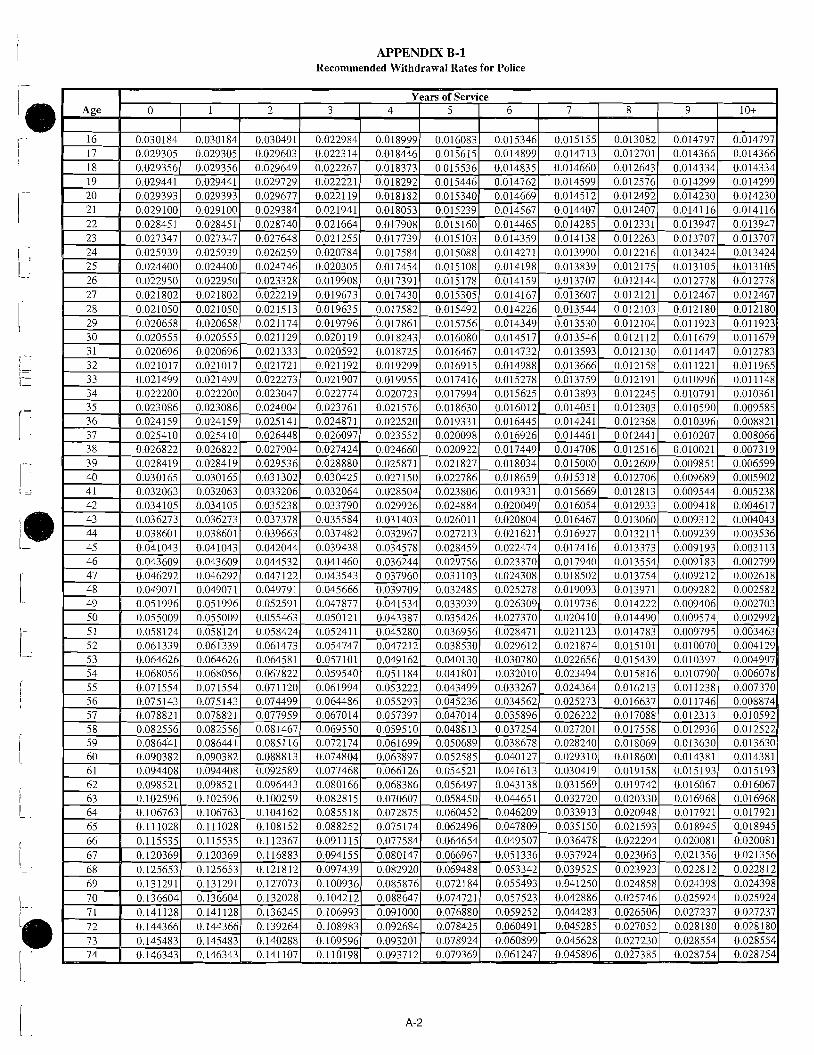
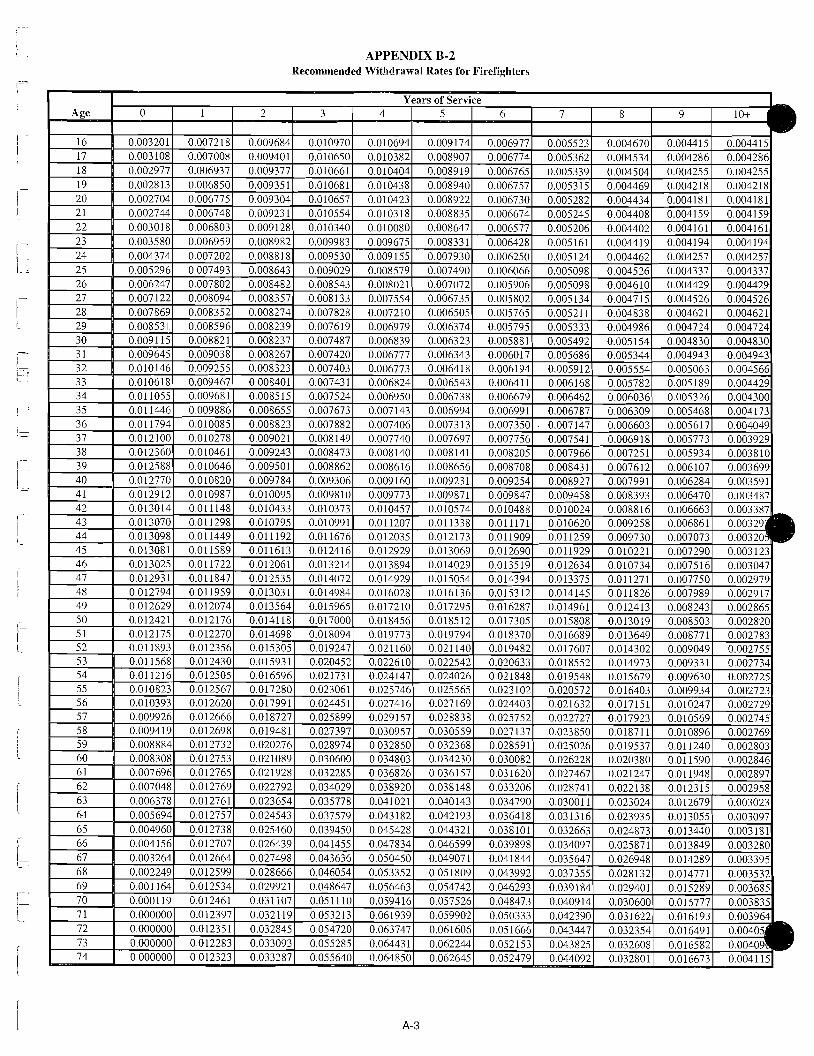
We recommend the withdrawal assumption utilize a select and ultimate approach to reflect the higher
correlation of age and service to rates of withdrawal. Under such an approach, a select period is
determined for the years of service which material changes in withdrawal rates occur. Once this
select period is determined, the ultimate rate for each age is the average rate of withdrawal for
members of that age with years of service beyond the select period. It is common for the select
period to last 5 to 15 years. We determined the select periods for both police officer and firefighter
members to be the first ten years of service. The ultimate rates vary by age but reflect the average
rate of withdrawal for members that age with more than ten years of service.
To develop our recommended rates of withdrawal, we first graduated the actual rates of withdrawal
using the Whitaker - Henderson B graduation method. The data reflects a general decrease in the
rate of withdrawal for both police and firefighters. This trend has been common in other large public
employee groups, but there is no indication that this reduction in withdrawal rates is permanent or a
temporary result of the tightened labor markets in recent years. We feel the experience data is not
completely credible for determining the rates of withdrawal for future years. Therefore, we are
reco~nmending rates that partially reflect the lower rates of withdrawal from recent exposure, but also
partially reflect the historically higher rates.
The complete tables of recommeilded withdrawal rates for police and fire members are shown in
Appendices B-1 and B-2.
The Actual/Expected ratio of the recommended assumption is as follows:
Police: 92.4.1 %
Firefighter: 94.86%
As can be seen, the current experience study data is given partial credibility. Recommended
rates reflect that future withdrawal will not be as low as shown in the current data, but will be
lower than the previous expectation.
111. NON-ECONOMIC ASSUMPTIONS (continued)
B. Disability Retirements
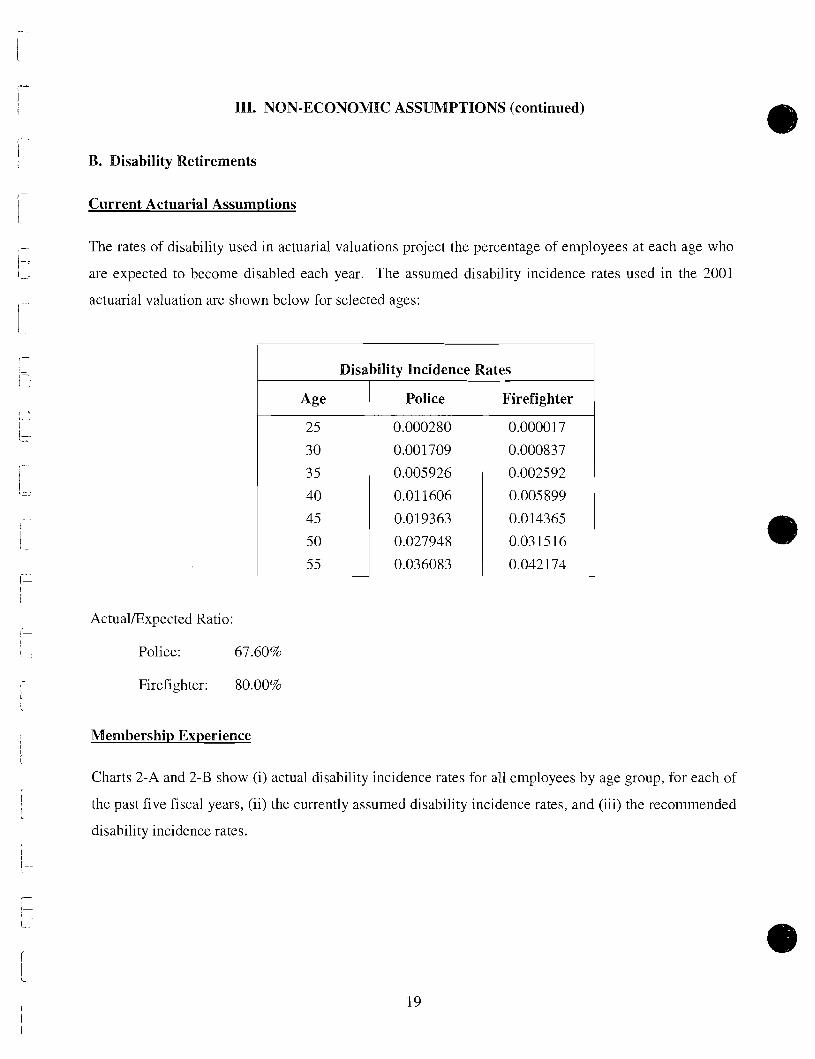
Current Actuarial Assumptions
The rates of disability used in actuarial valuations project the percentage of en~ployees at each age who
are expected to become disabled each year. The assumed disability incidence rates used in the 2001
actuarial valuation are shown below for selected ages:
I Disability Incidence Rates I I Age 1 Police T i i r e f i g h t e r 1
Actual~Expected Ratio:
Police: 67.60%
Firefighter: 80.00%
Membership Experience
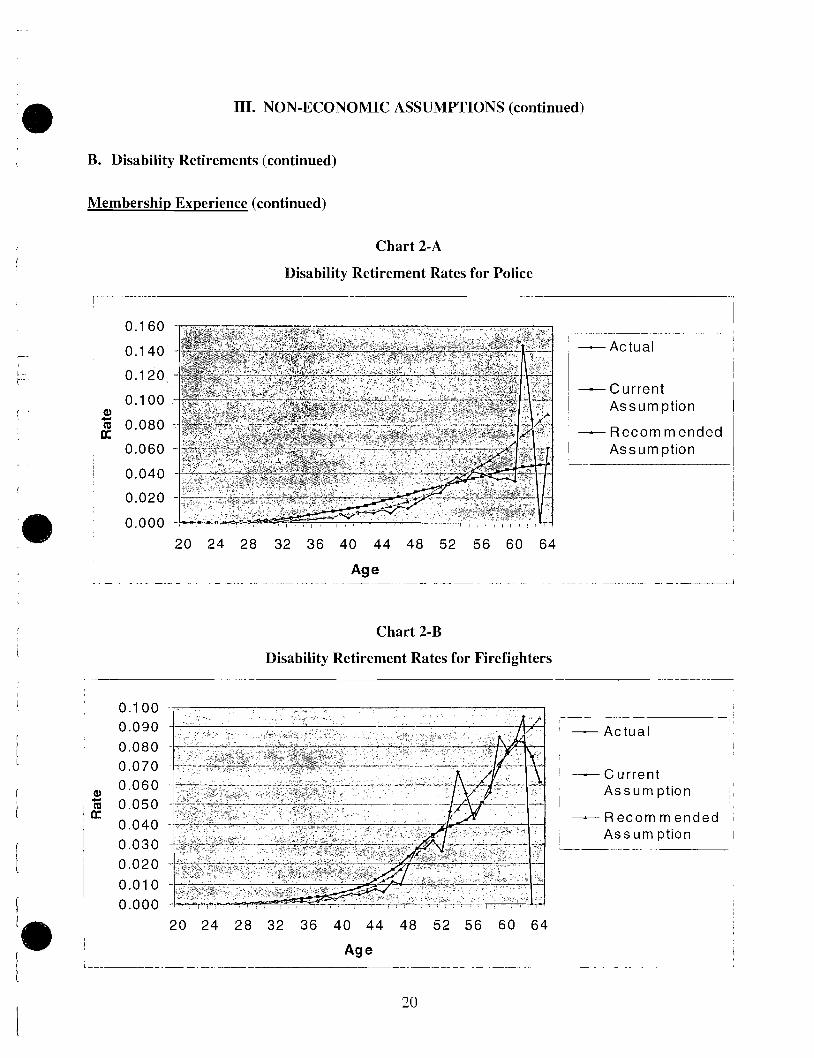
Charts 2-A and 2-B show (i) actual disability incidence rates for all employees by age group, for each of
the past five fiscal years, (ii) the currently assumed disability incidence rates, and (iii) the recommended
disability incidence rates.
111. NON-ECONOMIC ASSUMPTIONS (continued)
B. Disability Retirements (continued)
Membership Experience (continued)
Chart 2-A
Disability Retirement Rates for Police
- - - - - - - - Actual
1 C u r r e n t i Assumption
- Recom mended I Assumption
Chart 2-B
Disability Retirement Rates for Firefighters - - - - - -. - - -
I
I - Current
i Assumption I
- Recom mended I I
I Assum ption h - - -- -- .
I
HI. NON-ECONOMIC ASSUMPTIONS (continued)
B. Disability Retirements (continued)
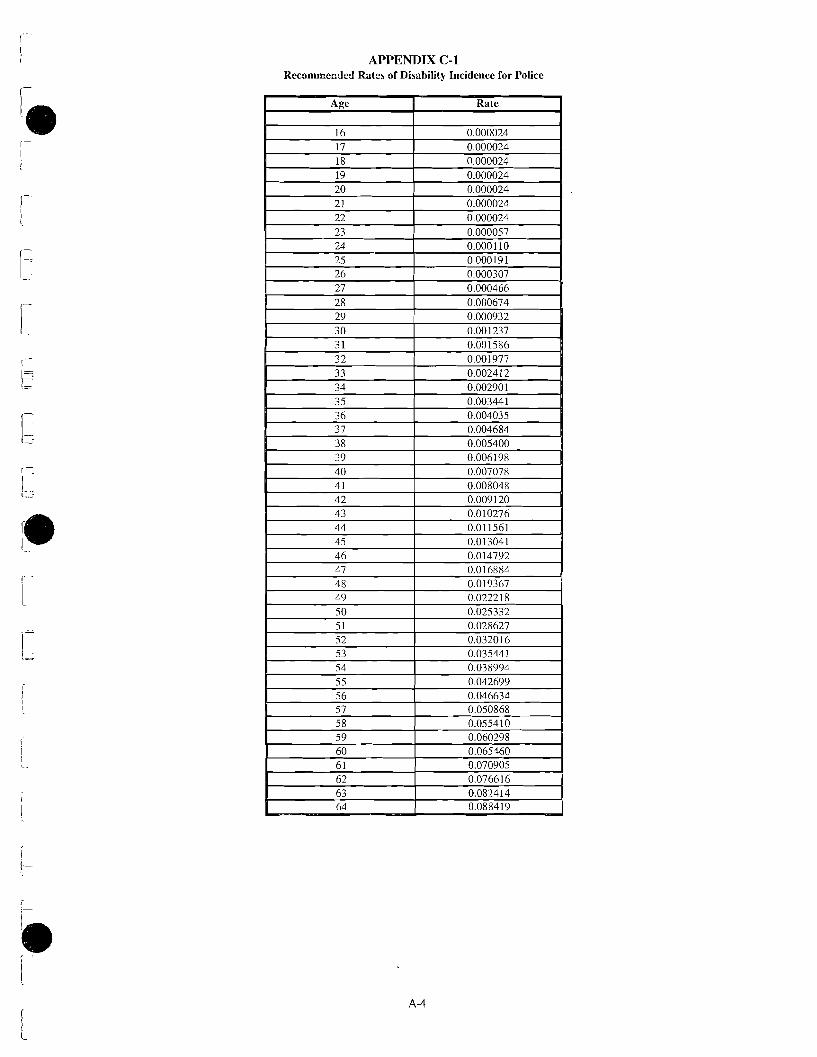
Findings and Recommendations
Actual experience shows disability retirement occurs with greater than expected frequency at ages above
53, and occurs with lower than expected frequency at ages below 53. We recommend changes that
reflect t h s trend.
The current assumption AIE ratio reflects less actual disabilities than expected. We recoinrnend an
assuinption that partially reflects the decrease in the rate of disability incidence as seen in the data.
The complete tables of recommended rates for disability incidence for police and fire members are
shown in Appendices C-1 and C-2.
The Actual~Expected ratio of the recommended assumption is as follows:
Police: 84.44%
Firefighter: 89.72%
III. NON-ECONOMIC ASSUMPTIONS (continued)
B. Disability Retirements (continued)
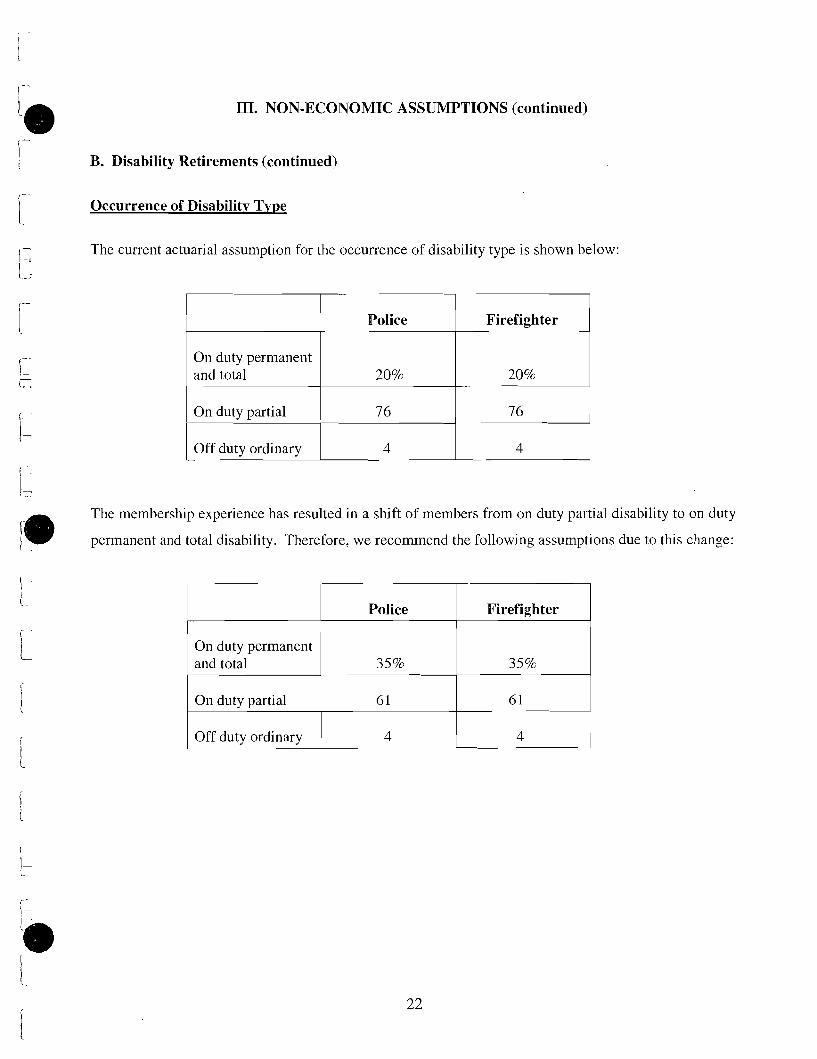
Occurrence of Disabilitv Tvpe
The current actuarial assumption for the occurrence of disability type is shown below:
On duty permanent and total
Police
On duty partial 7 6
Firefighter
The membership experience has resulted in a shift of members from on duty partial disability to on duty
permanent and total disability. Therefore, we recommend the following assumptions due to this change:
Off duty ordinary ~ 4 4
1 On duty permanent 1
Police
and total H
Firefighter
1 Off duty ordinary 1 4 I 4 I
On duty partial 6 1 6 1 pp
111. NON-EC0NC)MIC ASSUNIPTIONS (continued)
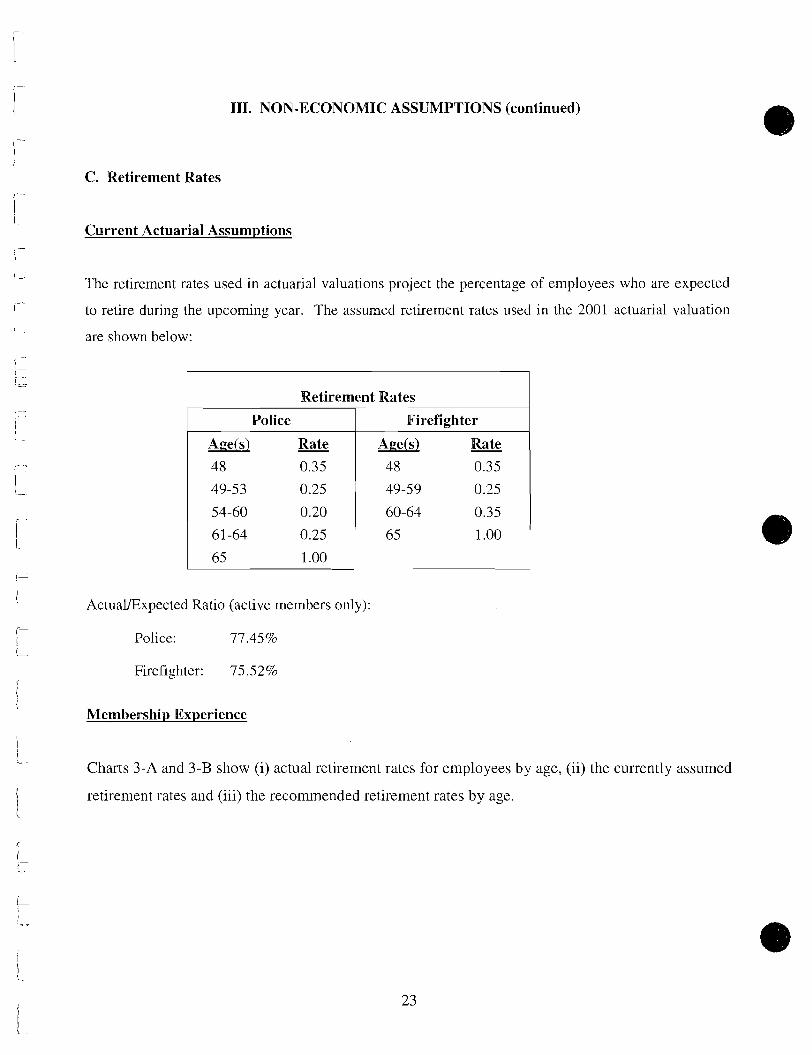
C. Retirement Rates
Current Actuarial Assumptions
The retirement rates used in actuarial valuations project the percentage of employees who are expected
to retire during the upcorniilg year. The assumed retirement rates used in the 2001 actuarial valuatioil
are shown below:
Retirement Rates
Police Firefighter
Actual/Expected Ratio (active members only):
Police: 77.45%
Firefighter: 75.52%
Mernbershir, Experience
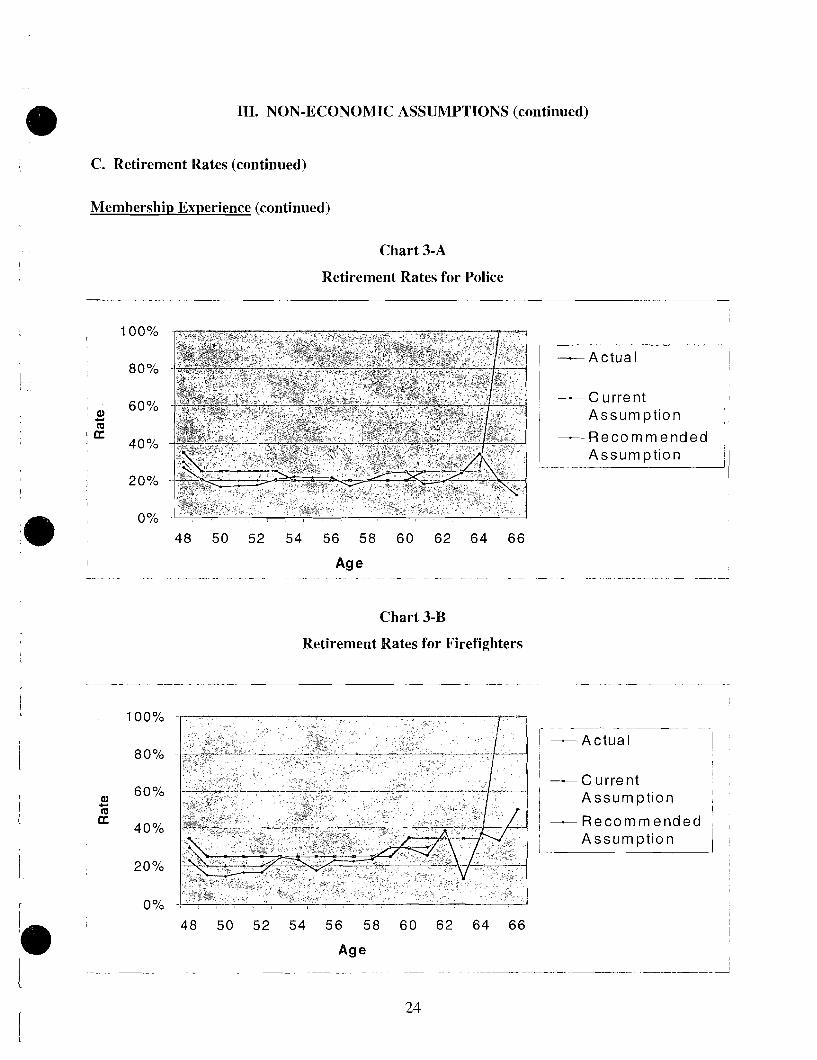
Charts 3-A and 3-B show (i) actual retirement rates for employees by age, (ii) the currently assumed
retirement rates and (iii) the recommended retirement rates by age.
111. NON-ECONONIIC ASSUMPTIONS (continued)
C. Retirement Rates (continued)
Membership Experience (continued)
Chart 3-A
Retirement Rates for Police
I C u r r e n t 1
1 Assumpt ion -Recommended
Assumpt ion - - - - - - I
Chart 3-B
Retirement Rates for Firefighters
I I ----Current I
! Assumpt ion 1 I
1 -Recommended ? I
I Assumpt ion 1 I ;
111. NON-ECONOMIC ASSUMPTIONS (continued)
43. Retirement Rates (continued)
Findings and Recommendations
Tlis experience study measures the number of active members who retire each year (i.e., it does not
measure those who retire from inactive vested status).
Generally, the experience study shows the current retirement assumption is reasonable for most service
years. We recommend slight decreases in the assumed retirement rates of younger retirement eligible
members as shown in Charts 3-A and 3-B.
The Actual/Expected ratio of the recommended assumption is as follows:
Police: 88.38%
Firefighter: 84.12%
The complete tables of recommended retirement rates for police and firefighter members are shown in
Appendices D- 1 and D-2.
111. NON-ECONOMIC ASSUMPTIONS (continued)
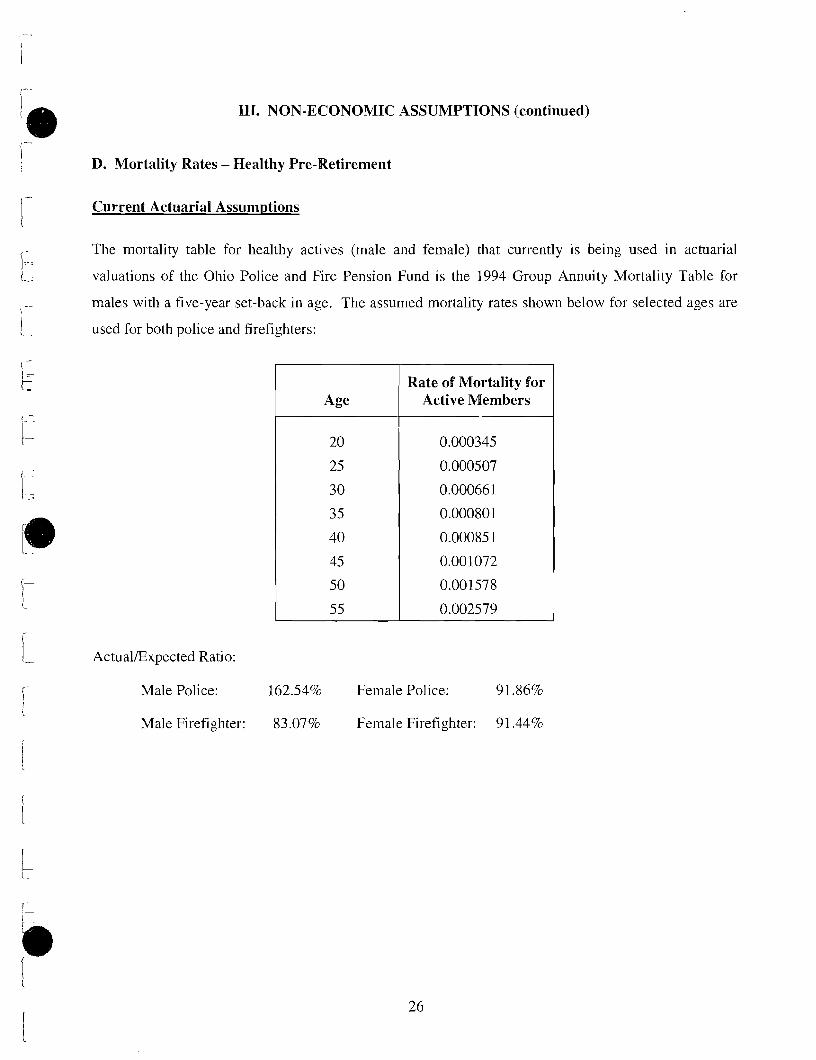
D. Mortality Rates - Healthy Pre-Retirement
Current Actuarial Assumptions
The mortality table for healthy actives (male and female) that currently is being used in actuarial
valuations of the Ohio Police and Fire Pension Fund is the 1994 Group Annuity Mortality Table for
males with a five-year set-back in age. The assumed mortality rates shown below for selected ages are
used for both police and firefighters:
Actual/Expected Ratio:
Male Police: 162.54% Female Police: 91 36%
Male Firefighter: 83.07% Female Firefighter: 91.44%
Age Rate of Mortality for
Active Members
III. NON-ECONOMIC ASSUMPTIONS (continued)
D. Mortality Rates - Healthy Pre-Retirement (continued)
Findings and Recommendations
We reconmend the use of a sex distinct mortality assumption due to the increase in number of female
active members in both einployee groups (Police 9.85% female; Firefighters 2.50% female). We
recommend the continued use of the current mortality table for the January 1, 2002 actuarial valuation
for police active male members. Although the Ah3 ratio for active, male police officers is high, we
recommend no change in the assumption because of the following reasons:
1. The assumed number of active deaths are small and therefore data that reflects only five
more deaths than assumed can cause the Ah3 ratio to spike.
2. We consider the data to contain anomalies that don't reflect the future expectation for
active, male police officer mortality.
We recommend the mortality assumption for the male active firefighters change to use the 1994 Group
Annuity Mortality Table (males) with a seven-year set-back in age. Also, we propose to use a sex
distinct assumption for both police officer and firefighter female members, as the 1994 Group Annuity
Mortality Table (females) with a three-year set-forward in age.
The complete tables of reconunended mortality rates for healthy active police and firefighter members
are shown in Appendices E-1 and E-2.
The Actual~Expected ratio under the recommended assumptions was unchanged or increased as follows:
Male Police: 162.54% Female Police: 99.05%
Male Firefighter: 92.69% Female Firefighter: 100.70%
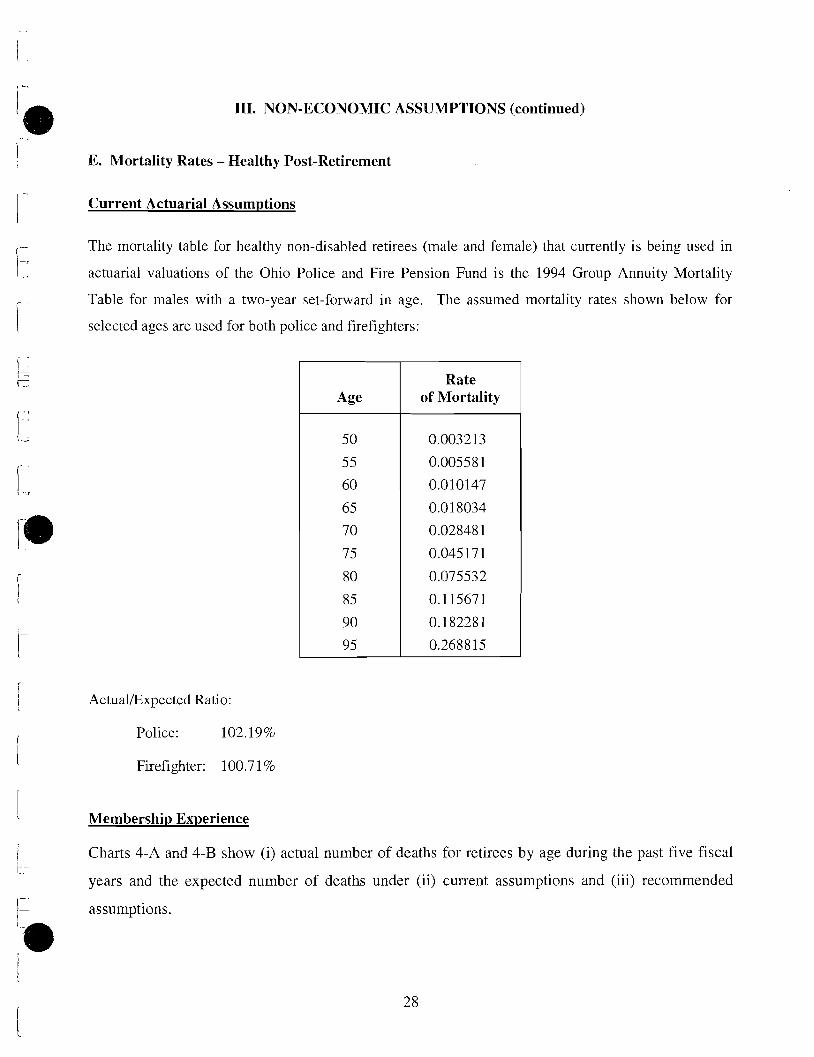
111. NON-ECONOMIC ASSUMPTIONS (continued)
- I E. Mortality Rates - Healthy Post-Retirement
I -- Current Actuarial Assumptions
(- The mortality table for healthy non-disabled retirees (male and female) that currently is being used in
1-1 actuarial valuations of the Ohio Police and Fire Pension Fund is the 1994 Group Annuity Mortality
i Table for males with a two-year set-forward in age. The assumed mortality rates shown below for
selected ages are used for both police and firefighters:
i i Actual/Expected Ratio:
Age
50
5 5
60
65
70
7 5
80
8 5
90
95
1 Police: 102.19%
Rate of Mortality
0.003213
0.005581
0.010147
0.01 8034
0.02848 1
0.045171
0.075532
0.1 15671
0.182281
0.268815
I Firefighter: 100.7 1%
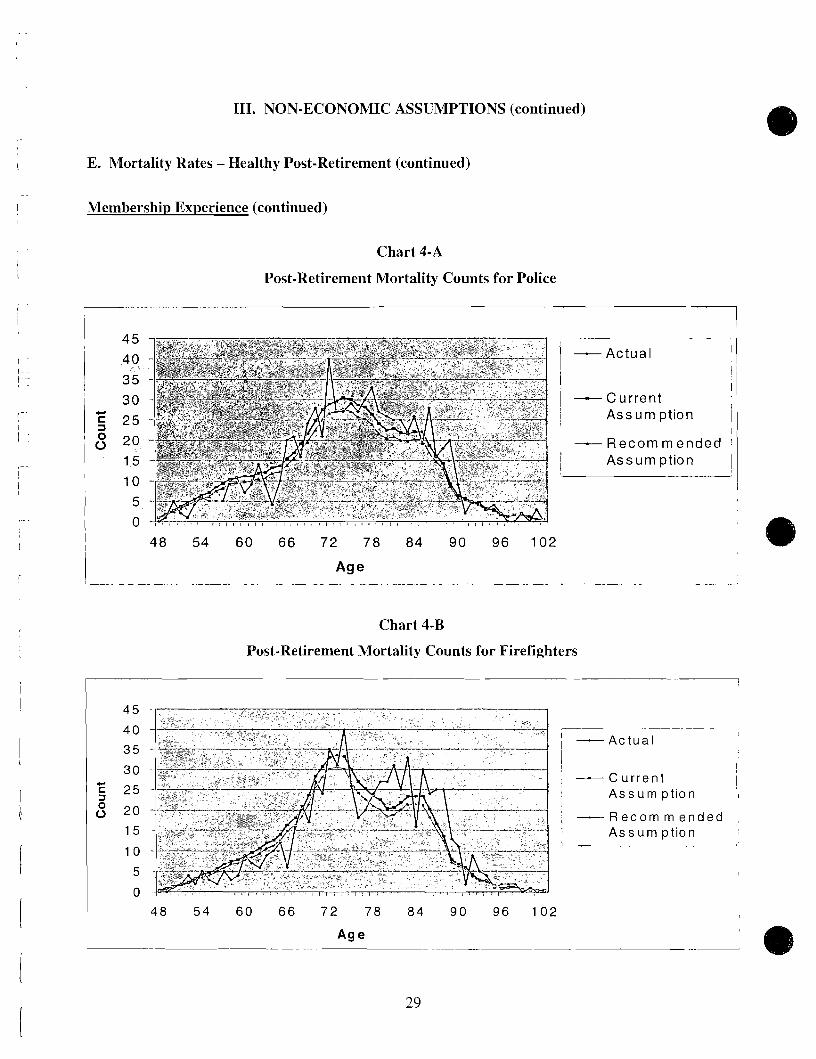
1 Membership Experience
! Charts 4-A and 4-B show (i) actual number of deaths for retirees by age during the past five fiscal ir
years and the expected number of deaths under (ii) current assumptions and (iii) recommended
I1 I assumptions.
111. NON-ECONONLIC ASSUMPTIONS (continued)
E. Mortality Rates - Healthy Post-Retirement (continued)
Membership Experience (continued)
Chart 4-A
Post-Retirement Mortality Counts for Police
- Current Assum ption
- R e c o m m e n d e d
Assumpt ion ' I
Chart 4-B
Post-Retirement Mortality Counts for Firefighters
-- -. --A - A c t u a l
- C u r r e n t A s s u m p t i o n
- R e c o m m e n d e d A s s u m p t i on
111. NON-ECONONIIC ASSUMPTIONS (continued)
E. Mortality Rates - Healthy Post-Retirement (continued)
Findings and Recommendations
We recommend the continued use of the current mortality table for males and females for the January 1,
2002 actuarial valuation, with a change from a two-year set-forward to a one-year set-forward in age for
both police and firefighters.
The complete table of recormnended mortality rates for non-disabled retirees, both police and fire, is
shown jn Appendix F.
The Actual/Expected ratio of the recommended assumptions is as follows:
Police: 112.57%
Firefighters: 1 10.85%
111. NON-ECONOMIC ASSUMPTIONS (continued)
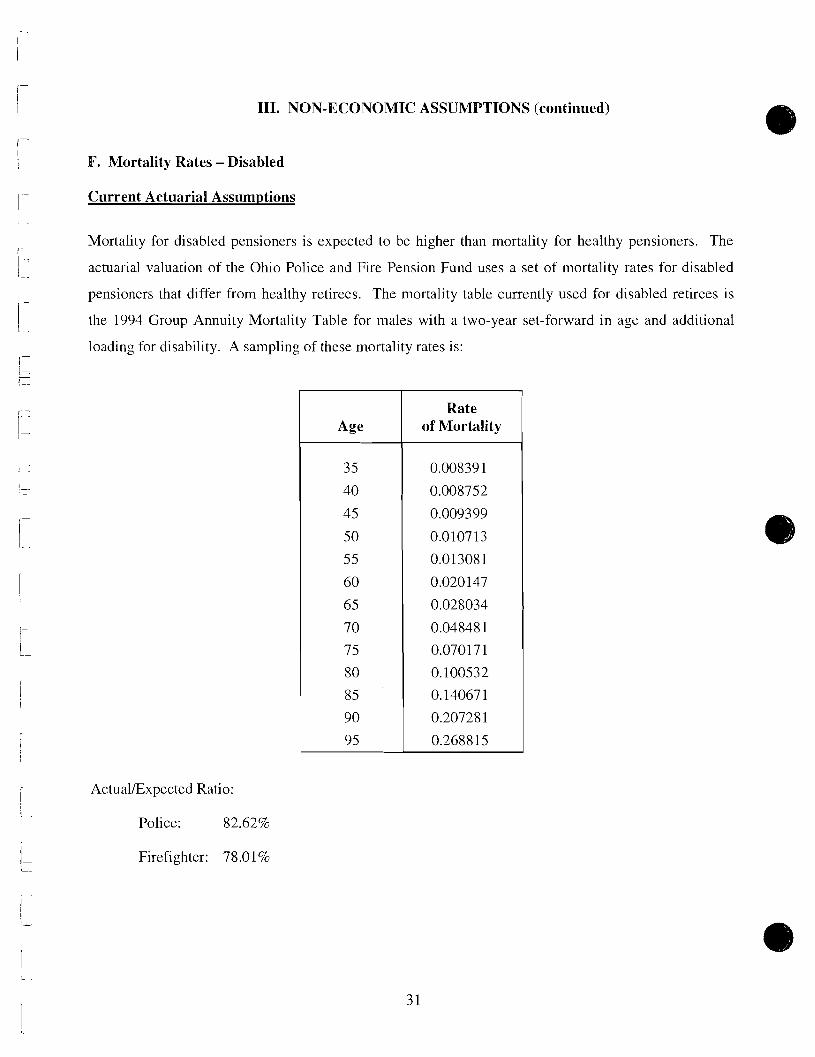
F. Mortality Rates - Disabled
Current Actuarial Assumptions
Mortality for disabled pensioners is expected to be higher than mortality for healthy pensioners. The
actuarial valuation of the Ohio Police and Fire Pension Fund uses a set of mortality rates for disabled
pensioners that differ from healthy retirees. The mortality table currently used for disabled retirees is
the 1994 Group Annuity Mortality Table for males with a two-year set-forward in age and additional
loading for disability. A sampling of these mortality rates is:
Actual/Expected Ratio:
Police: 82.62%
Firefighter: 78.01%
Age
35
40
45
50
55
60
65
7 0
7 5
80
85
90
95
Rate of Mortality
0.00839 1
0.008752
0.009399
0.010713
0.013081
0.020147
0.028034
0.048481
0.07017 1
0.100532
0.14067 1
0.207281
0.2688 15
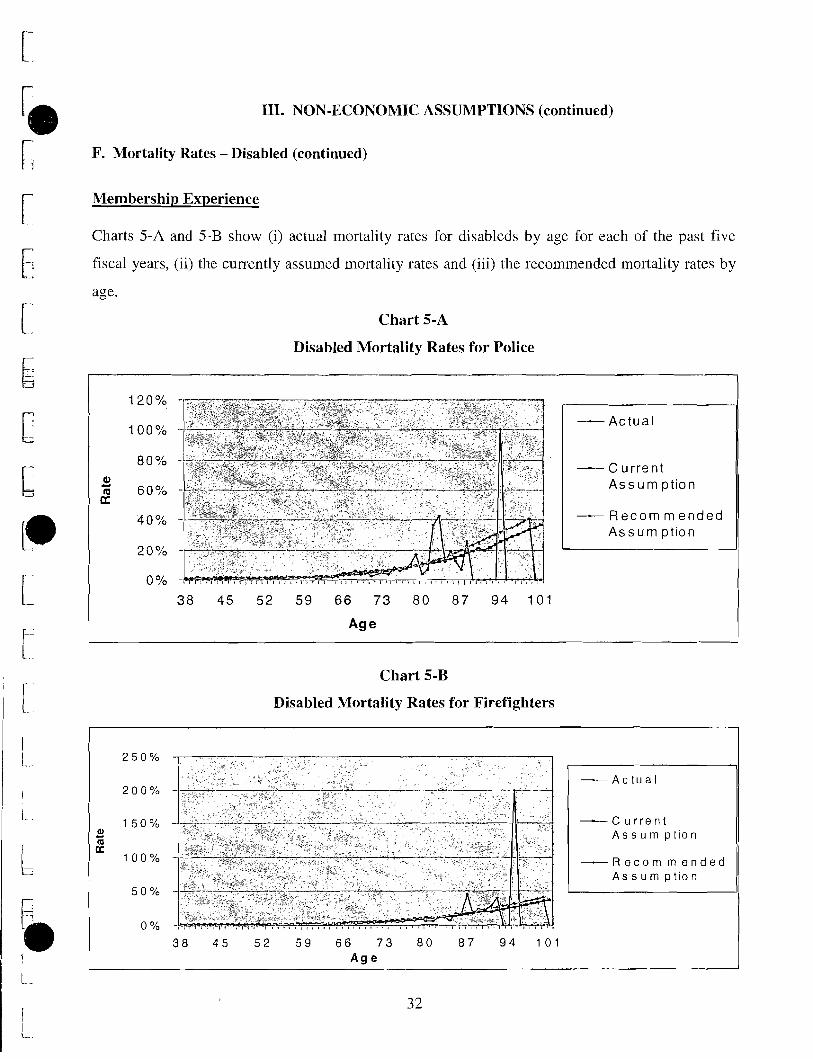
III. NON-ECONOMIC ASSUMPTIONS (continued)
F. Mortality Rates - Disabled (continued)
Membership Experience
Charts 5-A and 5-B show (i) actual mortality rates for disableds by age for each of the past five
fiscal years, (ii) the currently assumed mortality rates and (iii) the recommended mortality rates by
age.
Chart 5-A
Disabled Mortality Rates for Police
- Actua l
- C u r r e n t A s s u m p t i o n
I - R e c o m m e n d e d A s s u m p t i o n
Chart 5-B
Disabled Mortality Rates for Firefighters
- C u r r e n t A s s u m p t i o n
I - R e c o r n m e n d e d A s s u m p t i o n
III. NON-ECONOMIC ASSUMPTIONS (continued)
F. Mortality Rates - Disabled (continued)
Findings and Recommendations
We recommend changing the assumption to continue to use the 1994 Group Annuity Mortality
Table for males, but using a six-year set-forward in age for police and five-year set-forward in age
for firefighters, and no additional loading.
The complete tables of recommended mortality rates for disabled retirees are shown in Appendices
G-1 and G-2.
The ActualExpected ratio of the reconmended assumptions is as follows:
PoIice: 106.27%
Firefighters: 102.63%
111. NON-ECONOMIC ASSUNIPTIONS (continued)
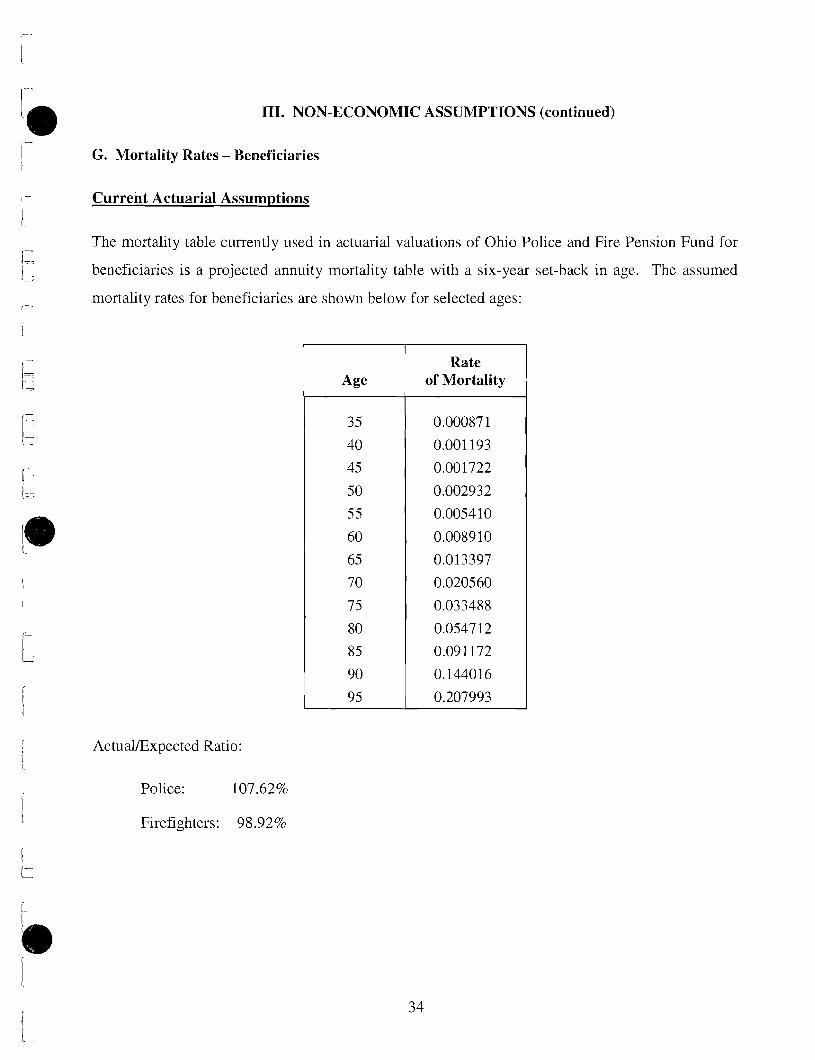
G. Mortality Rates - Beneficiaries
Current Actuarial Assumptions
The mortality table currently used in actuarial valuations of Ohio Police and Fire Pensioil Fund for
beneficiaries is a projected annuity mortality table with a six-year set-back in age. The assumed
mortality rates for beneficiaries are show~l below for selected ages:
Actual/Expected Ratio:
Police: 107.62%
Firefighters: 98.92%
111. NON-ECONOMIC ASSUMPTIONS (continued)
6. Mortality Rates - Beneficiaries (continued)
Membership Experience
The current assuinption A/E ratio for firefighter's beneficiaries is below 100%. T h s reflects no margin
for continued decline in the rates of mortality.
Findings and Recommendations
We recommend changing the assumption to use the 1994 Group Annuity Mortality Table for females
with a two-year set-forward in age for police and firefighters. Tlis change will add a margin in the
rates, especially for firefighter's beneficiaries, to account for future mortality improvement.
The complete table of recommended mortality probabilities for beneficiaries is shown in Appendix H.
The ActualIExpected ratio of the recommended assumptions is as follows:
Police: 11 8.40%
Firefighters: 108.33%
111. NON-ECONOMIC ASSUMPTIONS (continued)
H. Dependent Children
Current Actuarial Assumptions
Each active member is currently assumed to have two dependent children born when the member was
age 26. One-third of dependent children are currently assumed to continue as students beyond age 18 to
age 22.
Findings and Recornendations
Same as the current assumption, with the modification of assuming all dependent children continue as
students to age 22.

111. NON-ECONOMIC ASSUMPTIONS (continued)
I. Percent of Members Married
Current Actuarial Assumptions
Currently 85% of the members are assumed to be married, and females are assumed to be three years
younger than males.
Findings and Recommendations
The current assumption remains reasonable.
IV. ACTUARIAL COST METHOD AND ASSET VALUATION METHOD
Actuarial Cost Method
The actuarial cost method is the procedure used to allocate the cost of the plan among different plan
years. A portion of the value of benefits is attributable to past service (actuarial accrued liability) and
the remainder (the present value of future normal costs) is attributable to future service. Recent
actuarial valuations have been based on the actuarial cost method known as the Entry Age Norinal
Actuarial Cost Method. This method produces costs that remain relatively level as a percentage of
covered payroll. Under the Entry Age Normal Cost Method, the total contribution requirement has two
components - an annual normal cost, and a payment with respect to the unfunded actuarial accrued
liability. The annual normal cost is calculated for each inember as the level percentage of pay required
over the member's period of covered employment to pay the total expected benefits. If the actuarial
assunlptions are met, the total normal cost rate will remain level as a percentage of payroll.
The actuarial accrued liability is the present value of benefits allocated to years prior to the actuarial
valuation date. It reflects the average liability allocated for past service when the plan was established,
as well as adjustments for plan amendments, changes in assumptions, and experience gains and losses.
The unfunded actuarial accrued liability is the amount of the accrued liability in excess of the actuarial
value of assets. It is paid (amortized) in installments over a period of years, i.e. the funding period.
We recommend that the current actuarial cost method be continued with an adjustment to the normal
cost load to include the budgeted pension-related administrative expenses. The current method loads the
normal cost with the budgeted pension-related administrative expenses in excess of 0.05% of the
valuation assets.
Actuarial Asset Valuation Method
The purpose of an actuarial asset valuation method is to smooth the normal volatility of the markets and
dampen the effect this volatility has on determining the funding period of the Fund. The current asset
valuation method recognizes the book value of all Fund assets, except common and preferred stocks.
This method recognizes the realized and unrealized gain and losses in the equity portion of the Fund
over a four-year period.
IV. ACTUARIAL COST METHOD AND ASSET VALUATION METHOD (continued) e Actuarial Asset Valuation Method (continued)
A criticism of this method is it is more likely to understate the valuation assets in relation to market
value. We feel a change to this methodology is necessary as was recommended in the most recent
actuarial audit of the Fund.
The recoinrnended method would take the full market value of assets at the beginning of the year and
the cash flow during the year, and determine an expected return on the average value during the year.
This expected return calculation uses the 8.25% assumed rate of investment return, which is then
compared with the actual return, and the difference is recognized 20% per year over five years. The
actuarial value of assets in any year is equal to the market value less the amounts deferred. This method
does not favor the understatement of the asset value.
We recommend the method further adjust the actuarial value of assets to remain within a prescribed
corridor above or below inarket value, which is typically 20% above and below market value.
Therefore, the resulting actuarial value of assets determined above, would be adjusted as necessary, to
not be less than 80% or greater than 120% of the market value of the assets. Also, we recommend the
Board utilize this corridor to "phase-in" the effects of the change to this method. Specifically, we
recommend the corridor to be 10% in the first year (for the January 1, 2002 actuarial valuation) and
increase the following year to 20%.
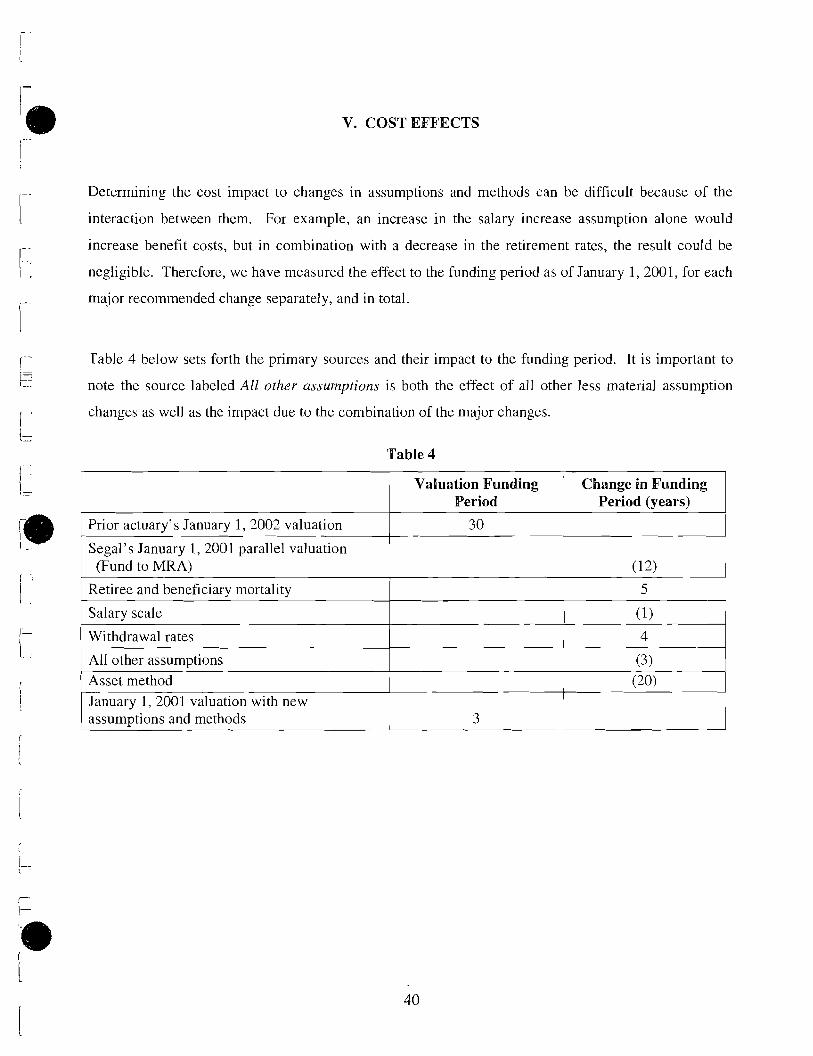
V. COST EFFECTS
Determining the cost impact to changes in assumptions and methods can be difficult because of the
interaction between them. For example, an increase in the salary increase assumption alone would
increase benefit costs, but in combination with a decrease in the retirement rates, the result could be
negligible. Therefore, we have measured the effect to the funding period as of January 1, 2001, for each
major recommended change separately, and in total.
Table 4 below sets forth the primary sources and their impact to the funding period. It is important to
note the source labeled All other assurnptiorzs is both the effect of all other less material assumption
changes as well as the impact due to the combination of the major changes.
Table 4
I Valuation Funding I Change in Funding Period 1 Period (years)
I Prior actuary's January 1, 2002 valuation I 3 0 1 I Segal's January 1 , 2001 parallel valuation
(Fund to MRA)
I Retiree and beneficiary mortality 1 5 1 Salary scale (11
Withdrawal rates
All other assumptions Asset method January 1, 2001 valuation with new assum~tions and methods
1
3
4
(31 (20)
VI. HEALTH CARE COST UPDATE
In an effort to provide the Board continuity of services, we have continued to update the exhibits
contained in prior experience studies concerning health care costs. The assumptions and methods used
in the course of our analysis of the Health Care Stabilization Fund (HCSF) are not reviewed as part of
this report but will be developed and recommended using the same sound actuarial techniques as used in
this study. The followi~lg Tables 3-A and 3-B display the colitinuation of health care cost increases.
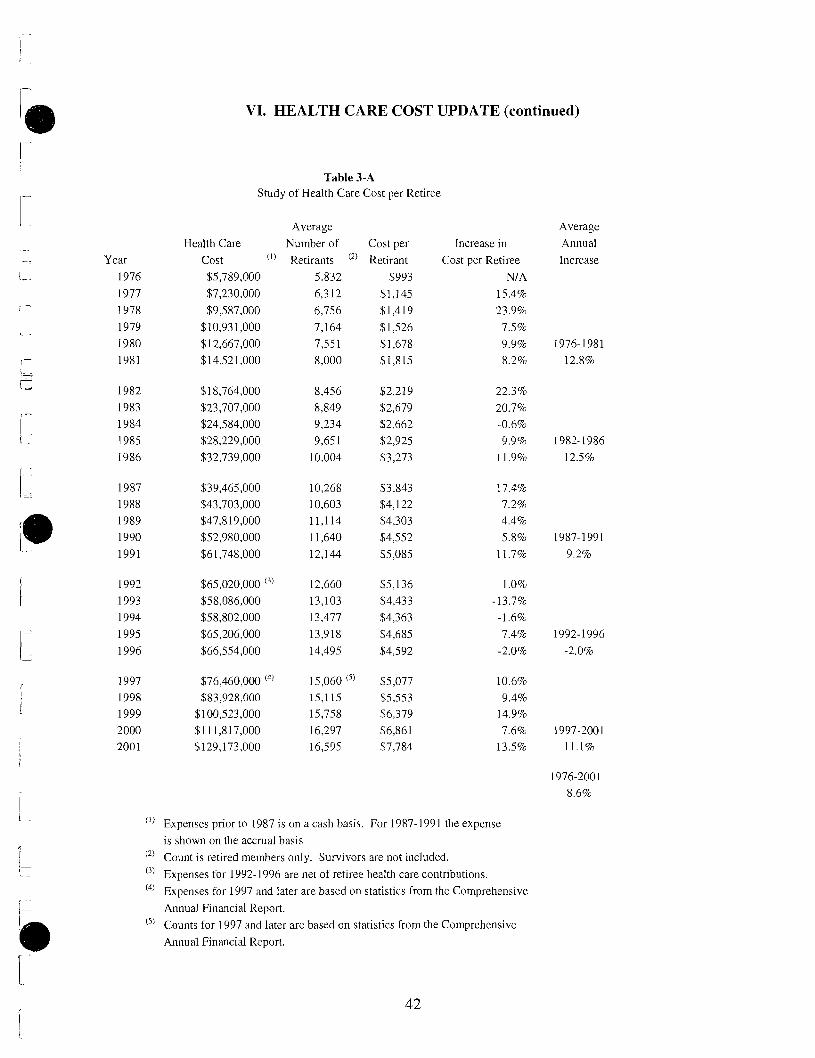
VI. HEALTH CARE COST UPDATE (continued)
Year 1976 1977 1978 1979 1980 1981
Table 3-A Study of Health Care Cost per Retiree
Health Care Cost (1'
$5,789,000 $7,230,000
$9,587,000 $10,93 1,000 $12,667,000 $14,521,000
Average Number of Retirants (2)
5,832 6,312
6,756 7,164 75.5 1 8,000
Cost per Retirant
$993 $1,145 $1,419 $1,526 $1,678 $1,815
Increase in
Cost per Retiree N/A
15.4% 23.9% 7.5% 9.9% 8.2%
Average Annual
Increase
( I ) Expenses prior to 1987 is on a cash basis. For 1987-1 991 the expense
is shown on the accrual basis (2' Count is retired members only. Survivors are not included. (3) Expenses for 1992-1996 are net of retiree health care contributions.
(') Expenses for 1997 and later are based on statistics from the Comprehensive Annual Financial Report. Counts for 1997 and later are based on statistics from the Comprehensive
Annual Financial Report.
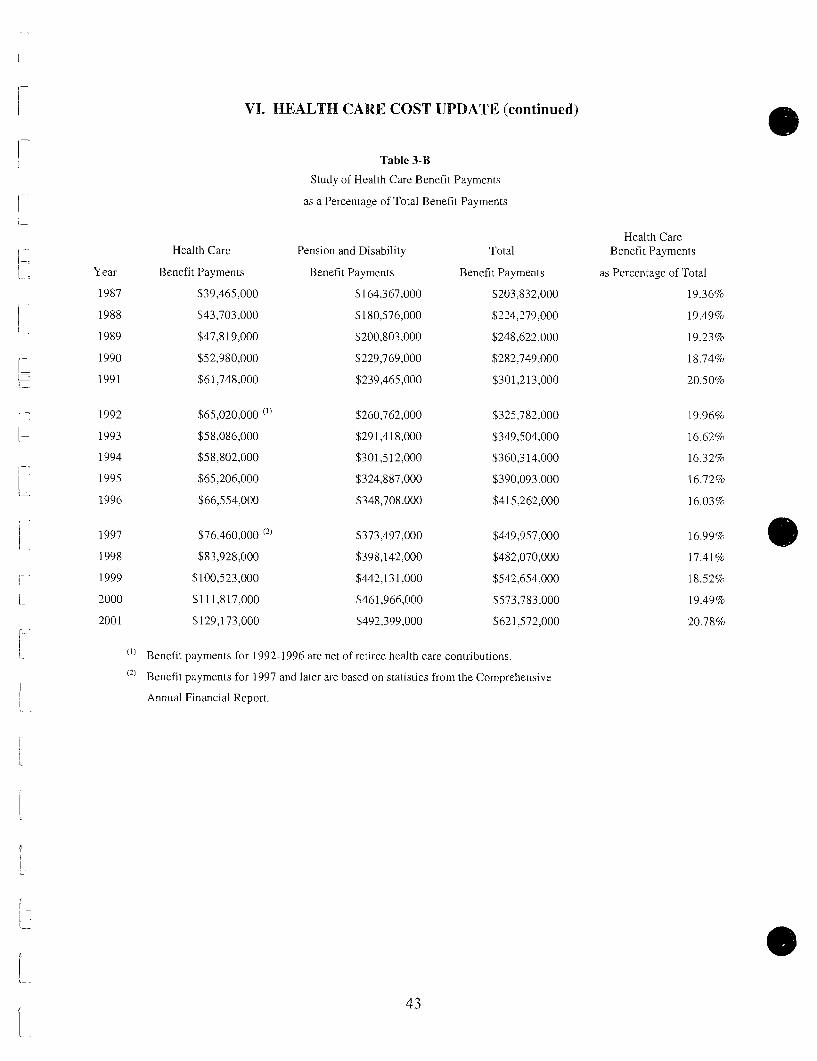
VI. HEALTH CARE COST UPDATE (continued)
Table 3-B
Study of Health Care Benefit Payments
as a Percentage of Total Benefit Payments
Health Care Pension and Disability Total Health Care
Benefit Payments
Year Benefit Payments Benefit Payments Benefit Payments as Percentage of Total
1987 $39,465,000 $164,367,000 $203:832,000 19.36%
1988 $43,703,000 $180,576,000 $224,279,000 19.49%
"' Benefit payments for 199&- 1996 are net of retiree health care conlributions. "' Benefit payments for 1997 and later are based on statistics from the Comprehensive
Annual Financial Report.
APPENDIX B-1 Recommended Withdrawal Rates for Police
APPENDIX B-2 Recommended Withdrawal Rates for Firefighters
APPENDIX C-1 Recommended Rates of Disability Incidence for Police
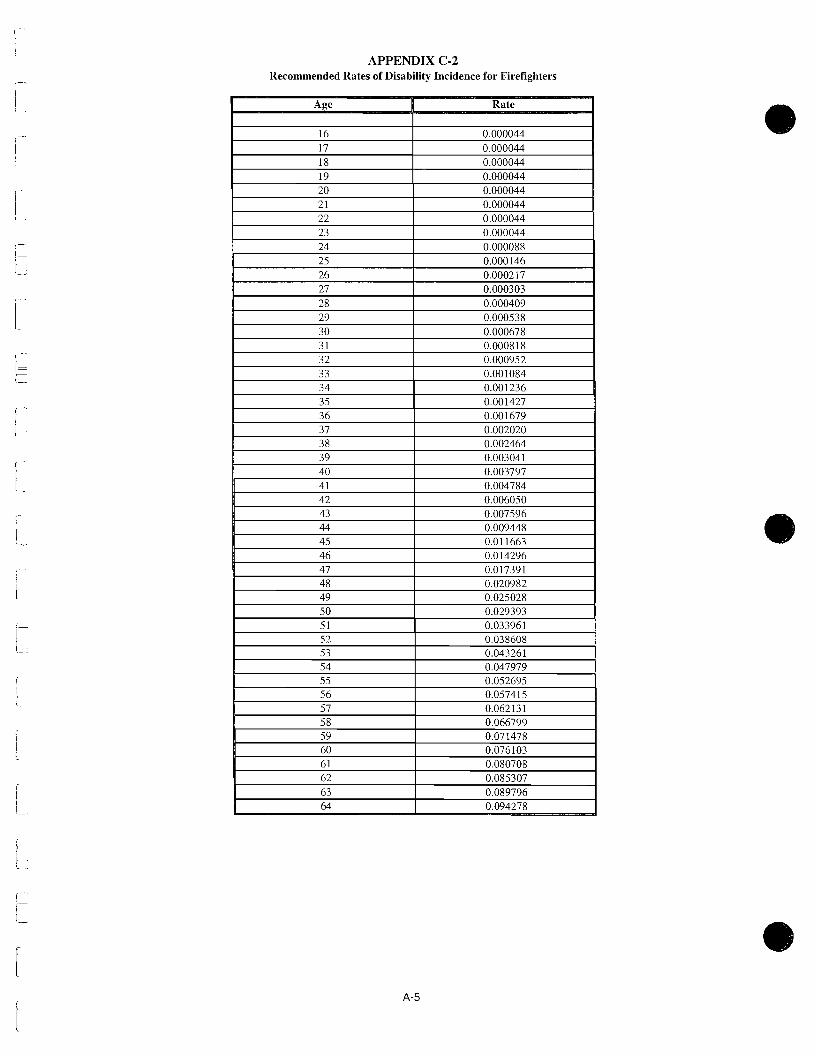
APPENDIX C-2 Recommended Rates of Disability Incidence for Firefighters
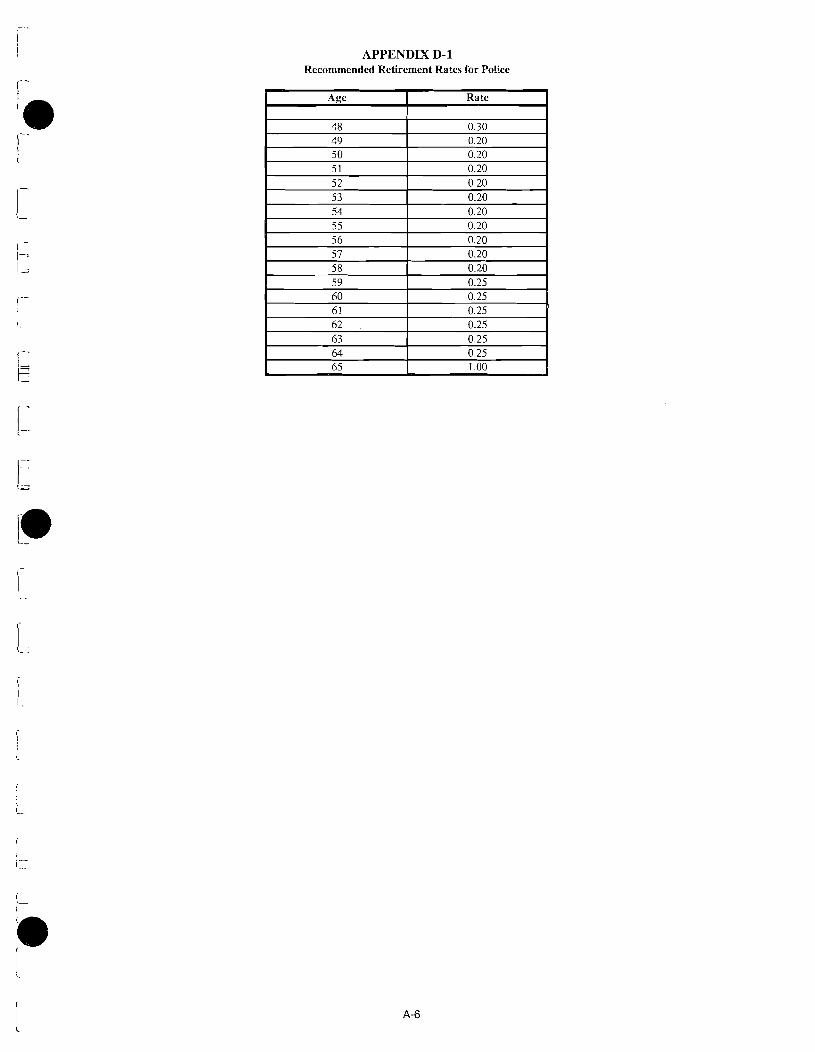
APPENDIX D-1 Recommended Retirement Rates Ibr Police
Age
48 49 50 51 52 53 54 55 56 57 58 59 60 61 62 63 64 65
Rate
0.30 0.20 0.20 0.20 0.20 0.20 0.20 0.20 0.20 0.20 0.20 0.25 0.25 0.25 0.25 0.25 0.25 1 .OO

APPENDIX D-2 Recommended Retirement Rates for Firefighters
Age
48 49 50 5 1 52 53 54 55 5 6 57 5 8 59 60 6 1 62 63 64 65
Rate
0.30 0.20 0.20 0.20 0.20 0.25 0.25 0.25 0.25 0.25 0.25 0.30 0.30 0.30 0.35 0.35 0.35 1 .OO
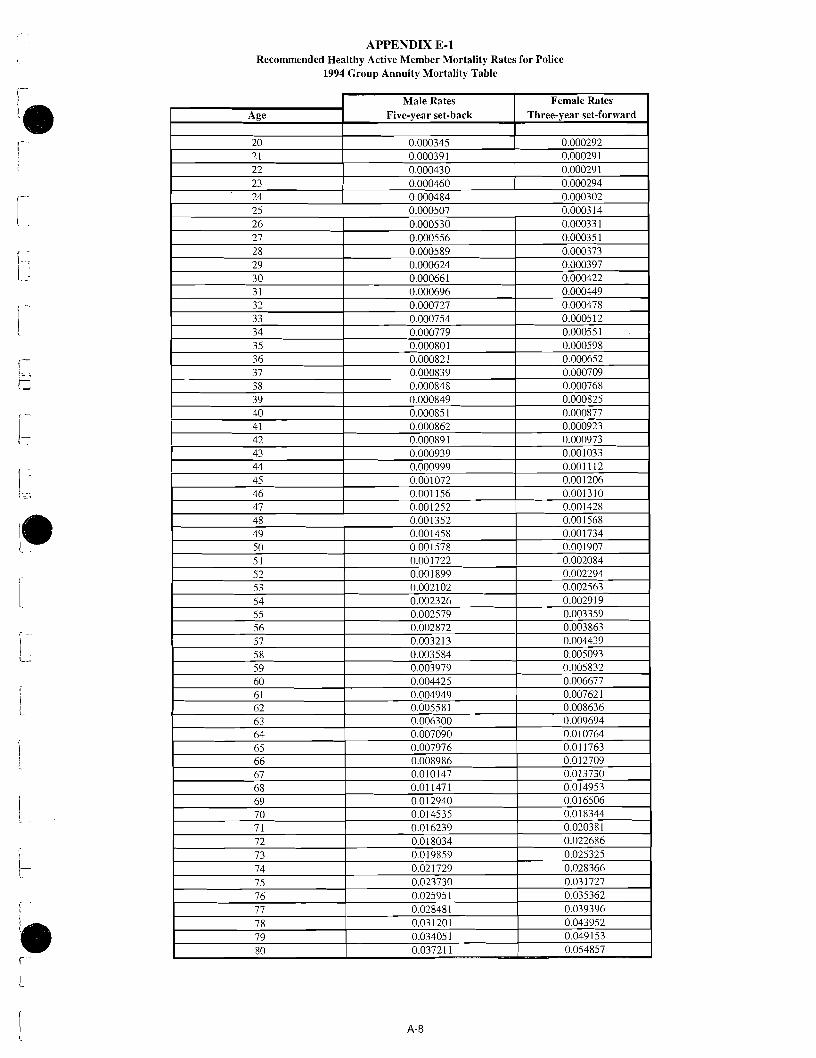
APPENDIX E-1 Recommended Healthy Active Member Mortality Rates for Police
1994 Group Annuity Mortality Table

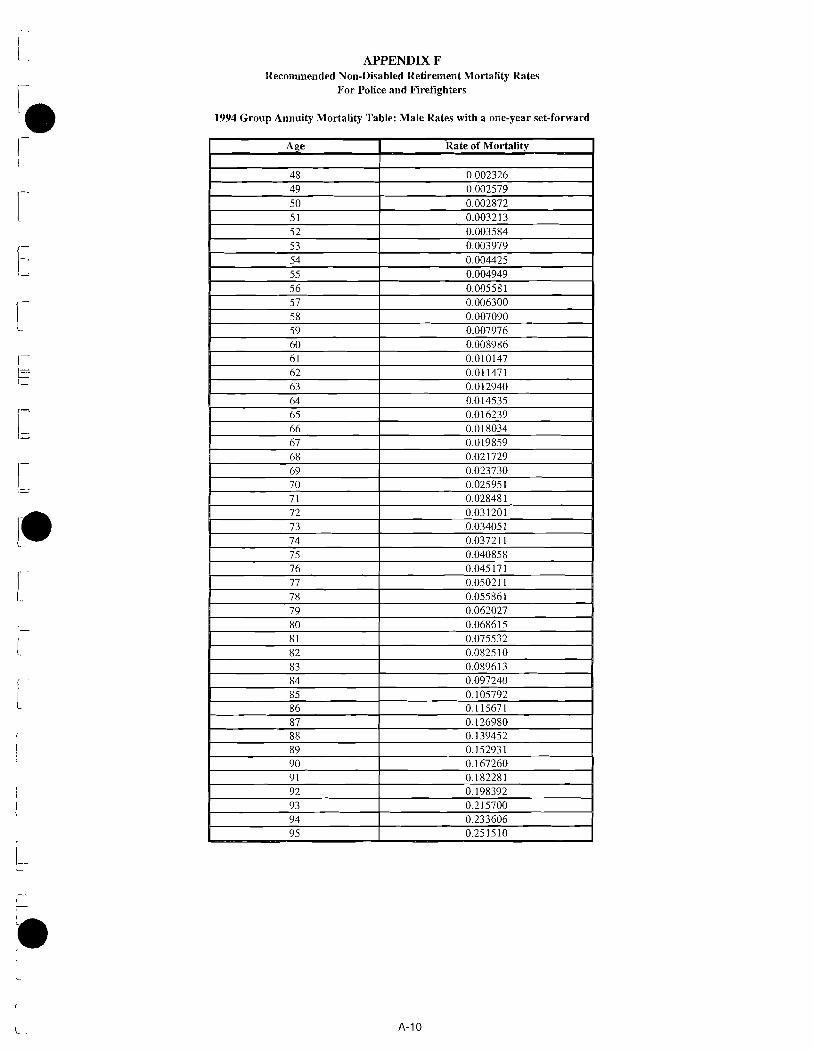
APPENDIX F Recommended Non-Disabled Retirement Mortality Rates
For Police and Firefighters
1994 Group Annuity Mortality Table: Male Rates with a one-year set-forward

APPENDIX G-1 Recommended Disabled Retiree Mortality Rates for Police
1994 Group Annuity Mortality Table: Male rates with a six-year set-forward
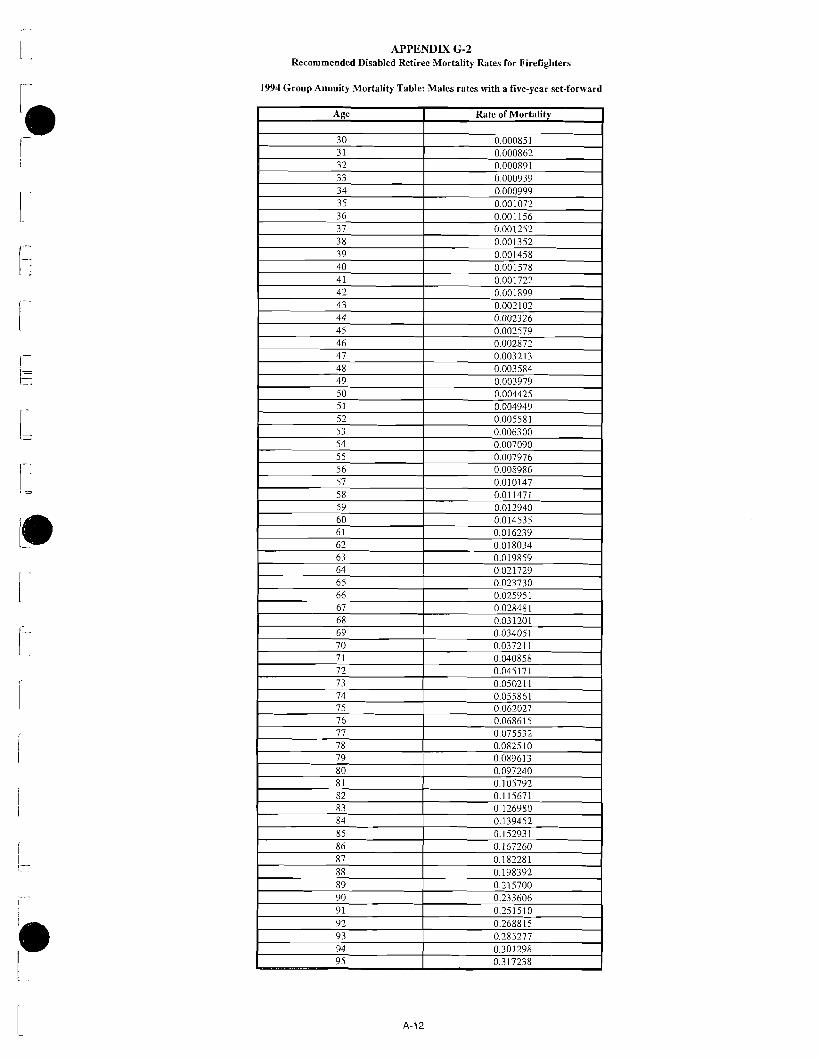
APPENDM 6-2 Recommended Disabled Retiree Mortality Rates for Firefighters
1994 Group Annuity Mortality Table: Males rates with a five-year set-forward
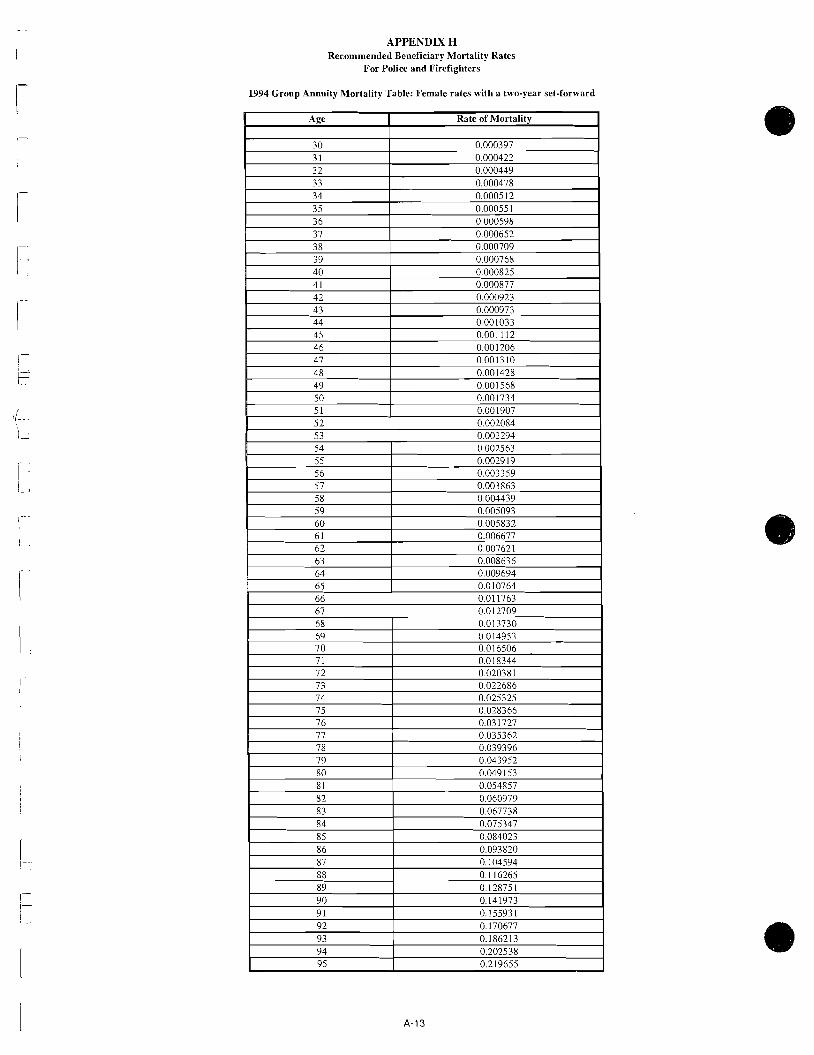
APPENDIX H Recommended Beneficiary Mortality Rates
For Police and Firefighters
1994 Group Annuity Mortality Table: Female rates with a two-year set-forward
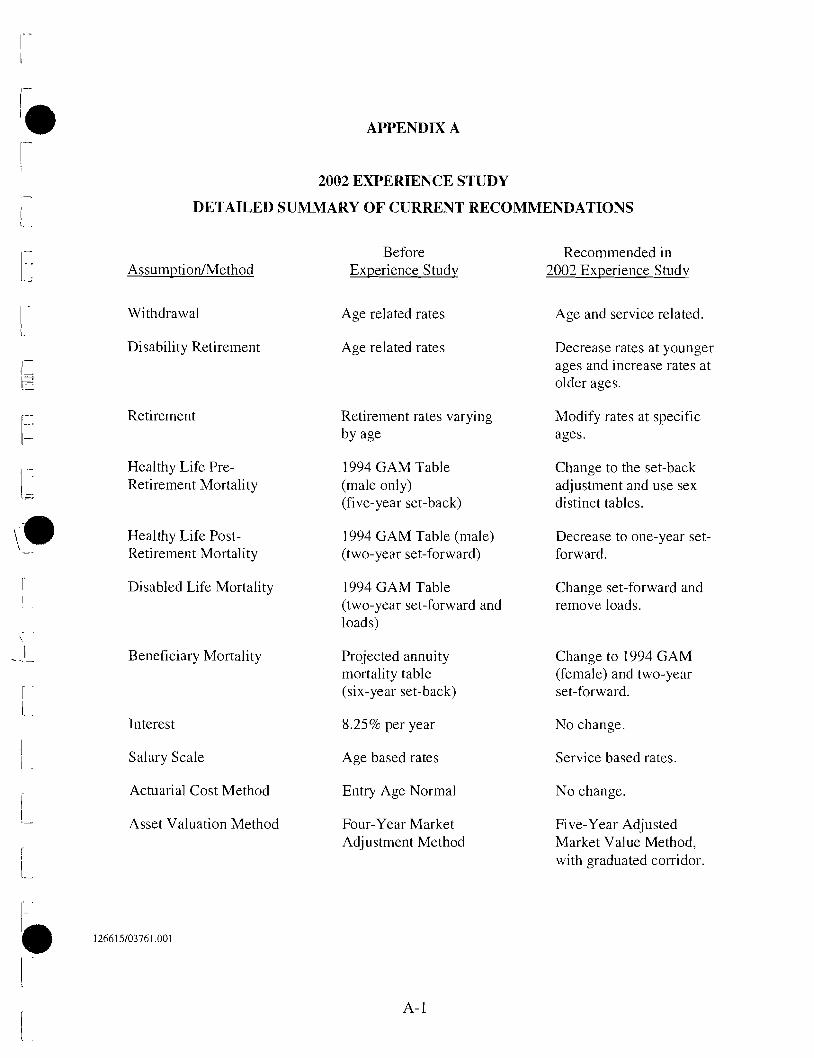
2002 EXPERENCE STUDY
DETAILED SUMMARY OF CURRENT RECOMNIENDATIONS
Before Recommended in Assumption/Method Experience Study 2002 Experience S tudv
Withdrawal Age related rates Age and service related.
Disability Retirement Age related rates Decrease rates at younger ages and increase rates at older ages.
Retirement Retirement rates varying Modify rates at specific by age ages.
Healthy Life Pre- 1994 GAM Table Retirement Mortality (male only)
(five-year set-back)
Change to the set-back adjustment and use sex distinct tables.
Healthy Life Post- 1994 GAM Table (male) Decrease to one-year set- Retirement Mortality (two-year set-forward) forward.
Disabled Life Mortality 1994 GAM Table Change set-forward and (two-year set-forward and remove loads. loads)
Beneficiary Mortality Projected annuity mortality table (six-year set-back)
Change to 1994 GAM (female) and two-year set-forward.
Interest 8.25% per year No change.
Salary Scale Age based rates Service based rates.
Actuarial Cost Method Entry Age Normal No change.
Asset Valuation Method Four-Year Market Adjustment Method
Five-Year Adjusted Market Value Method, with graduated corridor