actuarial valuation report - boe.lausd.net · proprietary and confidential 2017 lausd gasb opeb...
TRANSCRIPT
Proprietary and Confidential
Actuarial Valuation Report Los Angeles Unified School District
Postretirement Health Benefits
As of June 30, 2017
Proprietary and Confidential
2017 LAUSD GASB OPEB Report Final - 2018-03-12.docx March 12, 2018 i
Executive Summary
Background
The Los Angeles Unified School District (LAUSD) provides retiree healthcare benefits for eligible retirees
employed by the District at retirement who meet the eligibility conditions based on their date of hire.
Under the plan, LAUSD pays for eligible retirees’ medical, dental, and vision plan premiums. Employees
who meet the service eligibility requirements outlined in the plan summary receive lifetime benefits for
themselves and their spouses.
GASB 45 for Fiscal Year Ending June 30, 2017
The annual costs and information for fiscal year ending (FYE) 2018 were calculated based on the prior
actuarial valuation using methods and assumptions in accordance with Governmental Accounting
Standards Board (GASB) Statement 45, which was initially adopted by LAUSD for FYE June 30, 2008.
This report includes final disclosure information under GASB 45.
GASB 75
In June 2015, GASB released Statement 75, which is effective for the FYE June 30, 2018. This July 1,
2017 valuation is based on census data provided as of July 1, 2017 for the purpose of providing GASB 75
financial statement information, including final expense for FYE June 30, 2018.
The measurement date for results shown in this valuation report is June 30, 2017.
Two key differences resulting from the new accounting guidance compared to GASB 45 are:
Balance Sheet Liability Recognition – Under the transition to GASB 75, approximately $8.75 billion is
added to the LAUSD balance sheet ($7.52 billion Net OPEB Obligation under GASB 45 compared to
estimated $16.27 billion unfunded liability under GASB 75) as of July 1, 2017.
Annual Expense Amount and Volatility – The GASB 75 Annual OPEB Expense of approximately $835
million for FYE 2018 and $786 million (estimated) for FYE 2019 can be compared to the GASB 45
Annual OPEB Cost of $1,141 million for FYE 2017. The expense under GASB 75 is lower due to
recognition of liability through the GASB 75 transition and recognition of subsequent actuarial gains
over an amortization period that is relatively short compared to that used for GASB 45.
It is important to note that only current active and retired participants are valued in this actuarial study.
Future new entrants or any projected growth in LAUSD’s employee population are not considered.
Proprietary and Confidential
2017 LAUSD GASB OPEB Report Final - 2018-03-12.docx March 12, 2018 ii
Summary of Results
Liabilities
There are a few terms to understand related to the Plan’s liabilities. The Present Value of Benefits (PVB)
represents the actuarial present value of all future benefits expected to be paid to current employees and
retirees. The Actuarial Accrued Liability (AAL) is the portion of the PVB attributable to past service. The
Normal Cost is the portion of the PVB that is allocated to the current plan year for active employees.
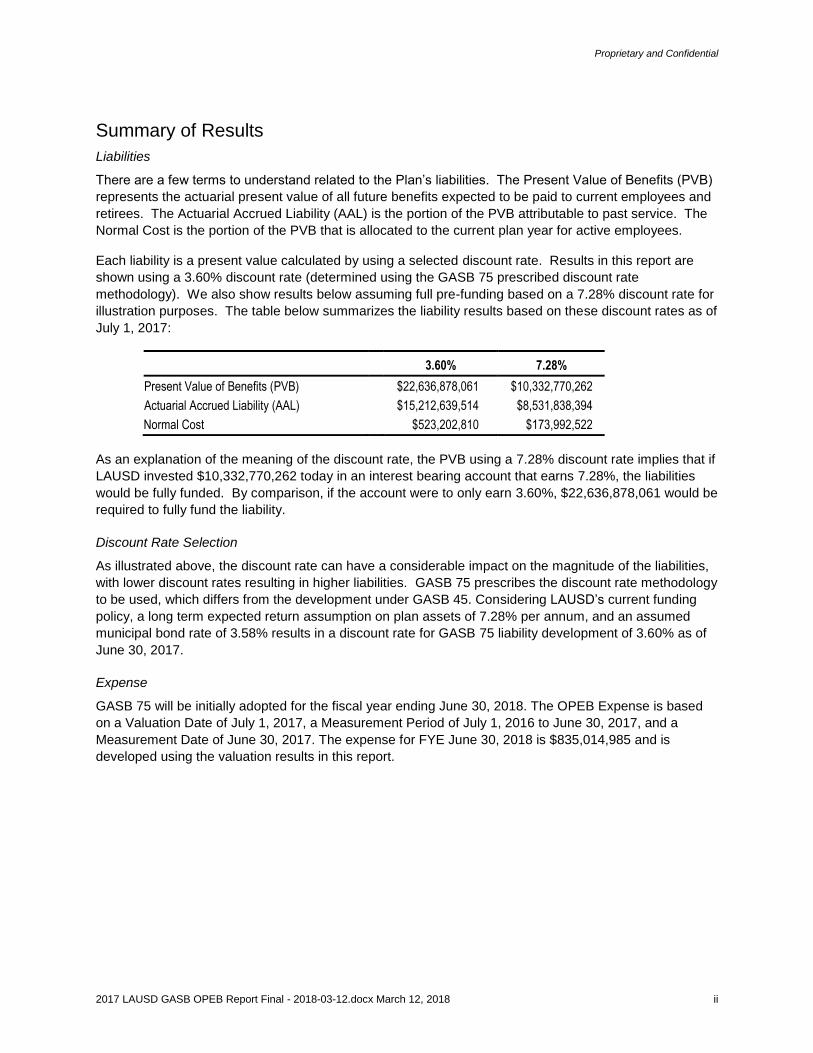
Each liability is a present value calculated by using a selected discount rate. Results in this report are
shown using a 3.60% discount rate (determined using the GASB 75 prescribed discount rate
methodology). We also show results below assuming full pre-funding based on a 7.28% discount rate for
illustration purposes. The table below summarizes the liability results based on these discount rates as of
July 1, 2017:
3.60% 7.28%
Present Value of Benefits (PVB) $22,636,878,061 $10,332,770,262
Actuarial Accrued Liability (AAL) $15,212,639,514 $8,531,838,394
Normal Cost $523,202,810 $173,992,522
As an explanation of the meaning of the discount rate, the PVB using a 7.28% discount rate implies that if
LAUSD invested $10,332,770,262 today in an interest bearing account that earns 7.28%, the liabilities
would be fully funded. By comparison, if the account were to only earn 3.60%, $22,636,878,061 would be
required to fully fund the liability.
Discount Rate Selection
As illustrated above, the discount rate can have a considerable impact on the magnitude of the liabilities,
with lower discount rates resulting in higher liabilities. GASB 75 prescribes the discount rate methodology
to be used, which differs from the development under GASB 45. Considering LAUSD’s current funding
policy, a long term expected return assumption on plan assets of 7.28% per annum, and an assumed
municipal bond rate of 3.58% results in a discount rate for GASB 75 liability development of 3.60% as of
June 30, 2017.
Expense
GASB 75 will be initially adopted for the fiscal year ending June 30, 2018. The OPEB Expense is based
on a Valuation Date of July 1, 2017, a Measurement Period of July 1, 2016 to June 30, 2017, and a
Measurement Date of June 30, 2017. The expense for FYE June 30, 2018 is $835,014,985 and is
developed using the valuation results in this report.
Proprietary and Confidential
2017 LAUSD GASB OPEB Report Final - 2018-03-12.docx March 12, 2018 iii
Comparison to Prior Valuation
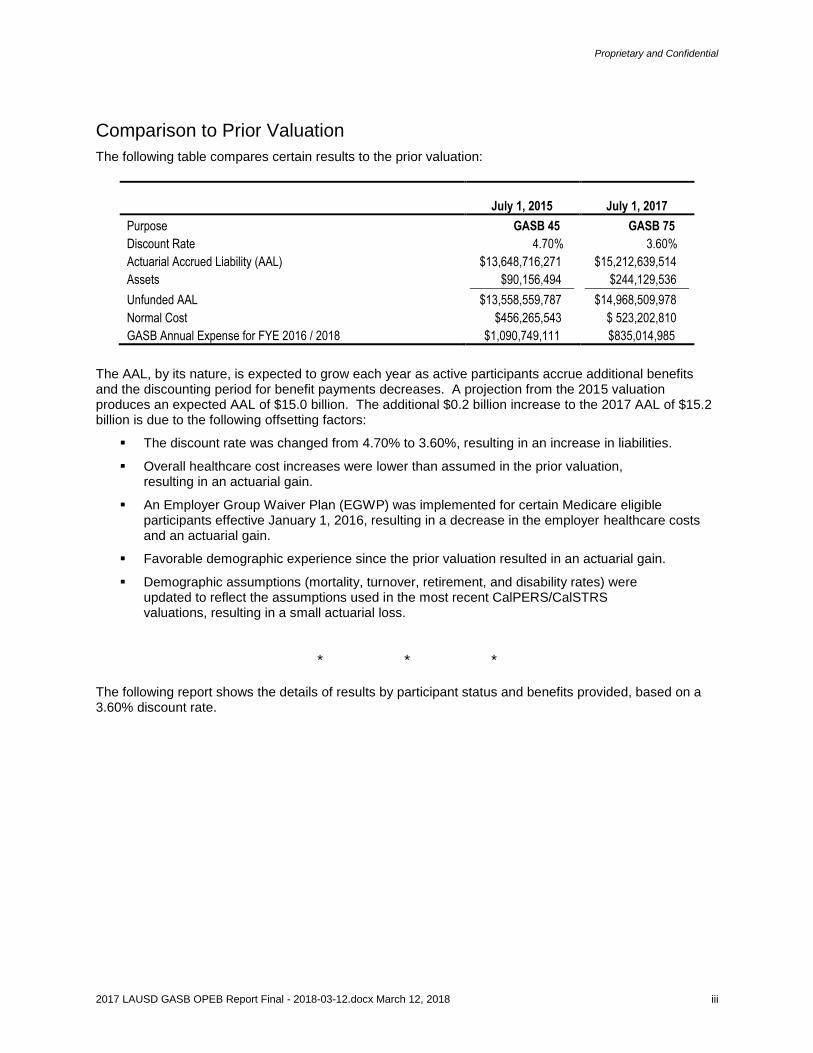
The following table compares certain results to the prior valuation:
July 1, 2015
July 1, 2017
Purpose GASB 45 GASB 75
Discount Rate 4.70% 3.60%
Actuarial Accrued Liability (AAL) $13,648,716,271 $15,212,639,514
Assets $90,156,494 $244,129,536
Unfunded AAL $13,558,559,787 $14,968,509,978
Normal Cost $456,265,543 $ 523,202,810
GASB Annual Expense for FYE 2016 / 2018 $1,090,749,111 $835,014,985
The AAL, by its nature, is expected to grow each year as active participants accrue additional benefits and the discounting period for benefit payments decreases. A projection from the 2015 valuation produces an expected AAL of $15.0 billion. The additional $0.2 billion increase to the 2017 AAL of $15.2 billion is due to the following offsetting factors:
The discount rate was changed from 4.70% to 3.60%, resulting in an increase in liabilities.
Overall healthcare cost increases were lower than assumed in the prior valuation, resulting in an actuarial gain.
An Employer Group Waiver Plan (EGWP) was implemented for certain Medicare eligible participants effective January 1, 2016, resulting in a decrease in the employer healthcare costs and an actuarial gain.
Favorable demographic experience since the prior valuation resulted in an actuarial gain.
Demographic assumptions (mortality, turnover, retirement, and disability rates) were updated to reflect the assumptions used in the most recent CalPERS/CalSTRS valuations, resulting in a small actuarial loss.
* * *
The following report shows the details of results by participant status and benefits provided, based on a 3.60% discount rate.

Proprietary and Confidential
2017 LAUSD GASB OPEB Report Final - 2018-03-12.docx March 12, 2018 iv
Table of Contents
Actuarial Valuation Certificate 1
Plan Liabilities 3
Plan Assets 5
Projected Benefit Payments 6
GASB 45 Reporting and Disclosure Information For Fiscal Year Ending June 30, 2017 7
GASB 75 Reporting and Disclosure Information For Fiscal Year Ending June 30, 2018 8
Participant Information 18
Summary of Principal Plan Provisions 21
Actuarial Assumptions and Methods 23
Appendix 33
Funding Considerations 34
GASB 75 Expense Estimate For Fiscal Year Ending June 30, 2019 35
Proprietary and Confidential
2017 LAUSD GASB OPEB Report Final - 2018-03-12.docx March 12, 2018 1
Actuarial Valuation Certificate
This report documents the results of the July 1, 2017 actuarial valuation for the Los Angeles Unified
School District Postretirement Health Benefits. The information provided in this report is intended strictly
for documenting:
The Annual Required Contribution and Disclosure items under Governmental Accounting Standards Board (GASB) Statement 45 for Fiscal year ending June 30, 2017.
Disclosure items under Governmental Accounting Standards Board (GASB) Statement 75 for Fiscal year ending June 30, 2018.
Determinations for purposes other than the financial accounting and reporting requirements may be
significantly different from the results in this report. Thus, the use of this report for purposes other than
those expressed here may not be appropriate.
This valuation has been conducted in accordance with generally accepted actuarial principles and
practices, including the applicable Actuarial Standards of Practice as issued by the Actuarial Standards
Board. In addition, the valuation results are based on our understanding of the financial accounting and
reporting requirements under U.S. Generally Accepted Accounting Principles as set forth in
Governmental Accounting Standards Board (GASB) Statements 45 and 75, including any guidance or
interpretations provided by LAUSD and/or its auditors prior to the issuance of this report. The information
in this report is not intended to supersede or supplant the advice and interpretations of LAUSD’s auditors.
Additional disclosures may be required under GASB 74.
Future actuarial measurements may differ significantly from the current measurements presented in this report due (but not limited to) to such factors as the following:
Plan experience differing from that anticipated by the economic or demographic assumptions
Changes in economic or demographic assumptions
Increases or decreases expected as part of the natural operation of the methodology used for these measurements (such as the end of an amortization period or additional cost or contribution requirements based on the plan’s funded status)
Changes in plan provisions or applicable law; and
Issuance of additional regulatory guidance
Due to the limited scope of our assignment, we did not perform an analysis of the potential range of such future measurements.
Funded status measurements shown in this report are determined based on various measures of plan assets and liabilities. For entity and plan disclosure and reporting purposes, funded status is determined using plan assets measured at market value. Plan liabilities are measured based on the interest rates and other assumptions summarized in the Actuarial Assumptions and Methods section of this report. These funded status measurements may not be appropriate for assessing the sufficiency of plan assets to cover the estimated cost of settling the plan’s benefit obligations, and funded status measurements for LAUSD and plan disclosure and reporting purposes may not be appropriate for assessing the need for or the amount of future contributions. In conducting the valuation, we have relied on personnel, plan design, health care claim cost, and asset information supplied by LAUSD as of the valuation date. While we cannot verify the accuracy of all the information, the supplied information was reviewed for consistency
Proprietary and Confidential
2017 LAUSD GASB OPEB Report Final - 2018-03-12.docx March 12, 2018 2
and reasonableness. As a result of this review, we have no reason to doubt the substantial accuracy or completeness of the information and believe that it has produced appropriate results.
The actuarial assumptions and methods used in this valuation are described in the Actuarial Assumptions and Methods section of this report. LAUSD selected the economic and demographic assumptions and prescribed them for use for purposes of compliance with GASB 75. Aon provided guidance with respect to these assumptions, and it is our belief that the assumptions represent reasonable expectations of anticipated plan experience.
The undersigned are familiar with the near-term and long-term aspects of OPEB valuations and collectively meet the Qualification Standards of the American Academy of Actuaries necessary to render the actuarial opinions contained herein. The information provided in this report is dependent upon various factors as documented throughout this report, which may be subject to change. Each section of this report is considered to be an integral part of the actuarial opinions.
To our knowledge, no colleague of Aon providing services to the Plan Sponsor has any material direct or indirect financial interest in the Plan Sponsor. Thus, we believe there is no relationship existing that might affect our capacity to prepare and certify this actuarial report for the Plan Sponsor.
Respectfully submitted,
Bradley J. Au, EA, MAAA Aon +213.996.1729 [email protected]
Stephen Lambert-Oswald, FSA, EA Aon +813.636.3084 [email protected]
Cheukming Ku, FSA, EA Aon +949.823.8548 [email protected]
Aon 707 Wilshire Boulevard Suite 2600 Los Angeles, CA 90017
March 12, 2018

Proprietary and Confidential
2017 LAUSD GASB OPEB Report Final - 2018-03-12.docx March 12, 2018 3
Plan Liabilities
The liabilities shown in this exhibit were calculated using a 3.60% discount rate as of the July 1, 2017 valuation date.
The Present Value of Benefits (PVB) represents the actuarial present value of all benefits ever to be paid to current employees and retirees. The PVB follows:
Total
PVB
Medical-Pre Medicare
Active $5,110,685,627
Retiree $482,928,210
Subtotal $5,593,613,837
Medical-Post Medicare
Active $11,552,175,578
Retiree $3,874,305,714
Subtotal $15,426,481,292
Subtotal Medical $21,020,095,129
Dental
Active $1,043,533,173
Retirees $344,350,083
Subtotal $1,387,883,256
Vision
Active $172,129,184
Retirees $56,770,492
Subtotal $228,899,676
All Benefits
Active $17,878,523,562
Retirees $4,758,355,499
Total PVB $22,636,878,061
PVB Per Participant
Active $294,394
Retirees $123,587
Proprietary and Confidential
2017 LAUSD GASB OPEB Report Final - 2018-03-12.docx March 12, 2018 4
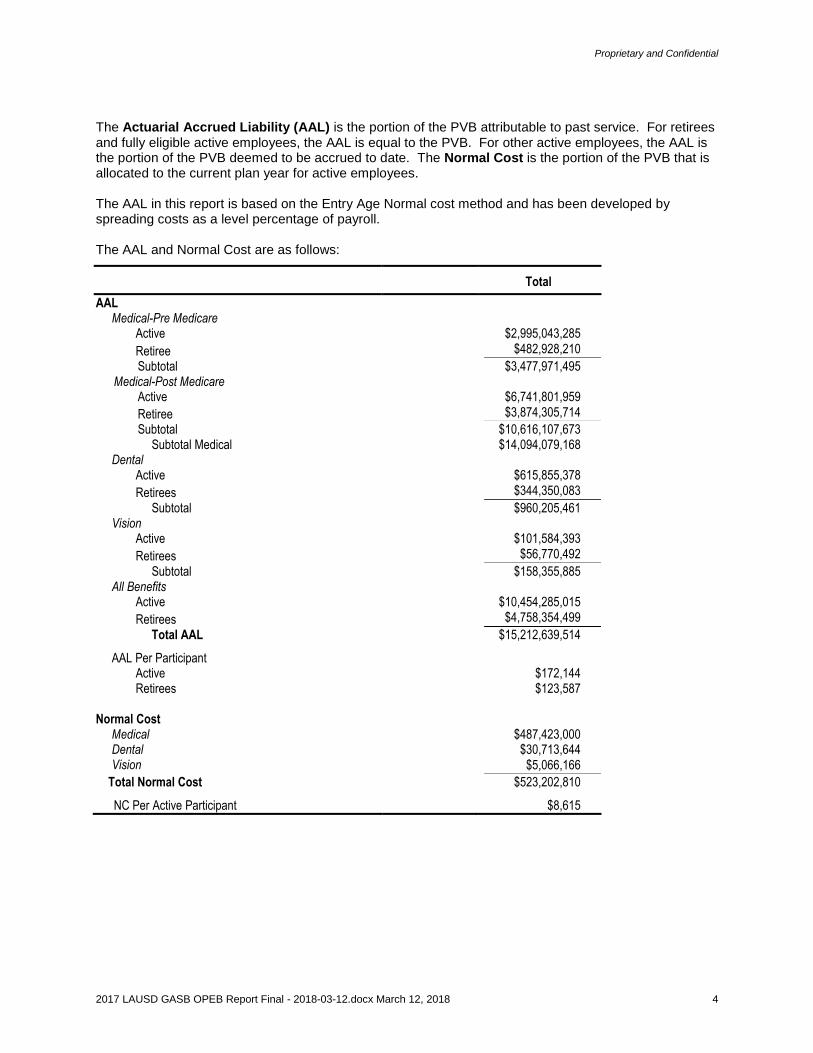
The Actuarial Accrued Liability (AAL) is the portion of the PVB attributable to past service. For retirees and fully eligible active employees, the AAL is equal to the PVB. For other active employees, the AAL is the portion of the PVB deemed to be accrued to date. The Normal Cost is the portion of the PVB that is allocated to the current plan year for active employees. The AAL in this report is based on the Entry Age Normal cost method and has been developed by spreading costs as a level percentage of payroll. The AAL and Normal Cost are as follows:
Total
AAL Medical-Pre Medicare
Active $2,995,043,285
Retiree $482,928,210
Subtotal $3,477,971,495 Medical-Post Medicare
Active $6,741,801,959
Retiree $3,874,305,714
Subtotal $10,616,107,673 Subtotal Medical $14,094,079,168
Dental Active $615,855,378
Retirees $344,350,083
Subtotal $960,205,461 Vision
Active $101,584,393
Retirees $56,770,492
Subtotal $158,355,885 All Benefits
Active $10,454,285,015
Retirees $4,758,354,499
Total AAL $15,212,639,514
AAL Per Participant Active $172,144 Retirees $123,587
Normal Cost Medical $487,423,000 Dental Vision
$30,713,644 $5,066,166
Total Normal Cost $523,202,810
NC Per Active Participant $8,615
Proprietary and Confidential
2017 LAUSD GASB OPEB Report Final - 2018-03-12.docx March 12, 2018 5
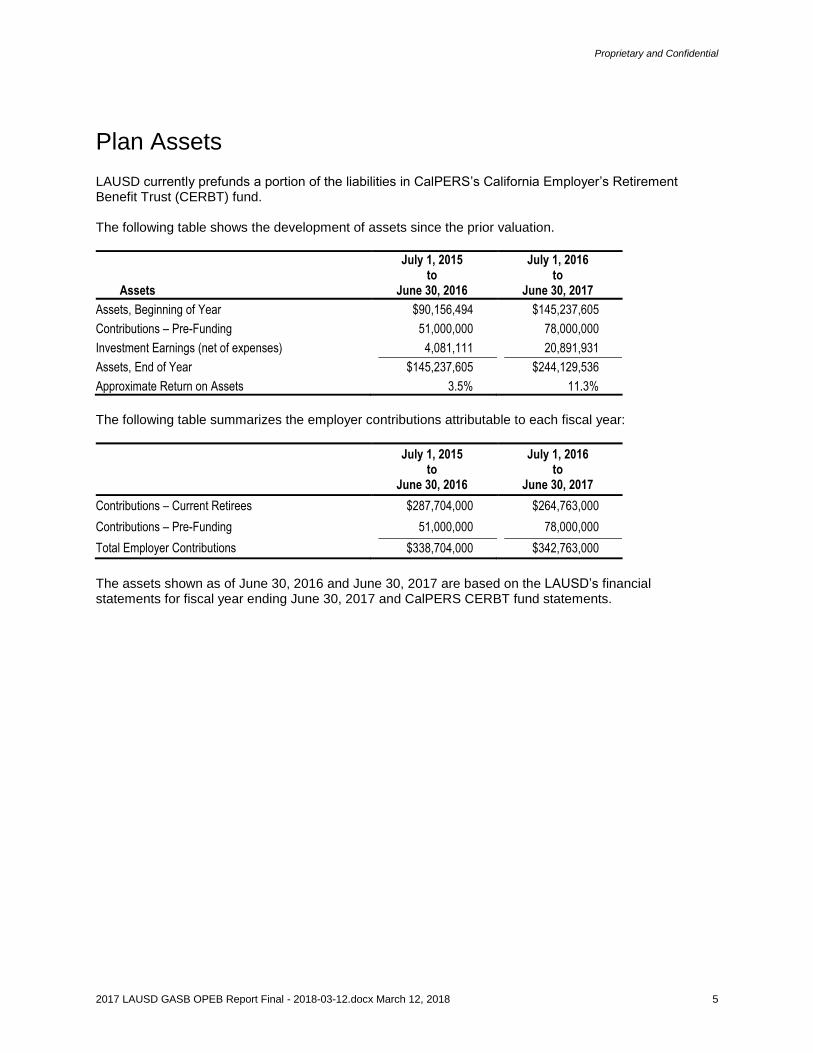
Plan Assets
LAUSD currently prefunds a portion of the liabilities in CalPERS’s California Employer’s Retirement Benefit Trust (CERBT) fund. The following table shows the development of assets since the prior valuation.
Assets
July 1, 2015 to
June 30, 2016
July 1, 2016 to
June 30, 2017
Assets, Beginning of Year $90,156,494 $145,237,605
Contributions – Pre-Funding 51,000,000 78,000,000
Investment Earnings (net of expenses) 4,081,111 20,891,931
Assets, End of Year $145,237,605 $244,129,536
Approximate Return on Assets 3.5% 11.3%
The following table summarizes the employer contributions attributable to each fiscal year:
July 1, 2015 to
June 30, 2016
July 1, 2016 to
June 30, 2017
Contributions – Current Retirees $287,704,000 $264,763,000
Contributions – Pre-Funding 51,000,000 78,000,000
Total Employer Contributions $338,704,000 $342,763,000
The assets shown as of June 30, 2016 and June 30, 2017 are based on the LAUSD’s financial statements for fiscal year ending June 30, 2017 and CalPERS CERBT fund statements.
Proprietary and Confidential
2017 LAUSD GASB OPEB Report Final - 2018-03-12.docx March 12, 2018 6
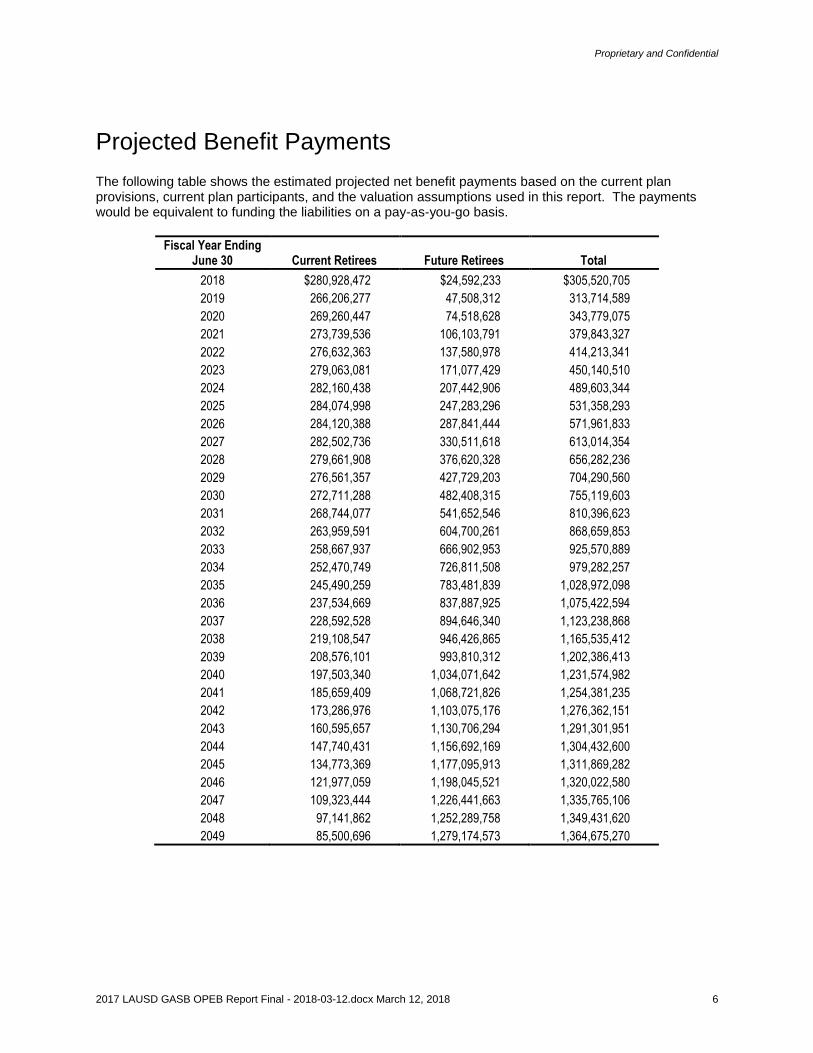
Projected Benefit Payments
The following table shows the estimated projected net benefit payments based on the current plan provisions, current plan participants, and the valuation assumptions used in this report. The payments would be equivalent to funding the liabilities on a pay-as-you-go basis.
Fiscal Year Ending June 30 Current Retirees Future Retirees Total
2018 $280,928,472 $24,592,233 $305,520,705
2019 266,206,277 47,508,312 313,714,589
2020 269,260,447 74,518,628 343,779,075
2021 273,739,536 106,103,791 379,843,327
2022 276,632,363 137,580,978 414,213,341
2023 279,063,081 171,077,429 450,140,510
2024 282,160,438 207,442,906 489,603,344
2025 284,074,998 247,283,296 531,358,293
2026 284,120,388 287,841,444 571,961,833
2027 282,502,736 330,511,618 613,014,354
2028 279,661,908 376,620,328 656,282,236
2029 276,561,357 427,729,203 704,290,560
2030 272,711,288 482,408,315 755,119,603
2031 268,744,077 541,652,546 810,396,623
2032 263,959,591 604,700,261 868,659,853
2033 258,667,937 666,902,953 925,570,889
2034 252,470,749 726,811,508 979,282,257
2035 245,490,259 783,481,839 1,028,972,098
2036 237,534,669 837,887,925 1,075,422,594
2037 228,592,528 894,646,340 1,123,238,868
2038 219,108,547 946,426,865 1,165,535,412
2039 208,576,101 993,810,312 1,202,386,413
2040 197,503,340 1,034,071,642 1,231,574,982
2041 185,659,409 1,068,721,826 1,254,381,235
2042 173,286,976 1,103,075,176 1,276,362,151
2043 160,595,657 1,130,706,294 1,291,301,951
2044 147,740,431 1,156,692,169 1,304,432,600
2045 134,773,369 1,177,095,913 1,311,869,282
2046 121,977,059 1,198,045,521 1,320,022,580
2047 109,323,444 1,226,441,663 1,335,765,106
2048 97,141,862 1,252,289,758 1,349,431,620
2049 85,500,696 1,279,174,573 1,364,675,270
Proprietary and Confidential
2017 LAUSD GASB OPEB Report Final - 2018-03-12.docx March 12, 2018 7
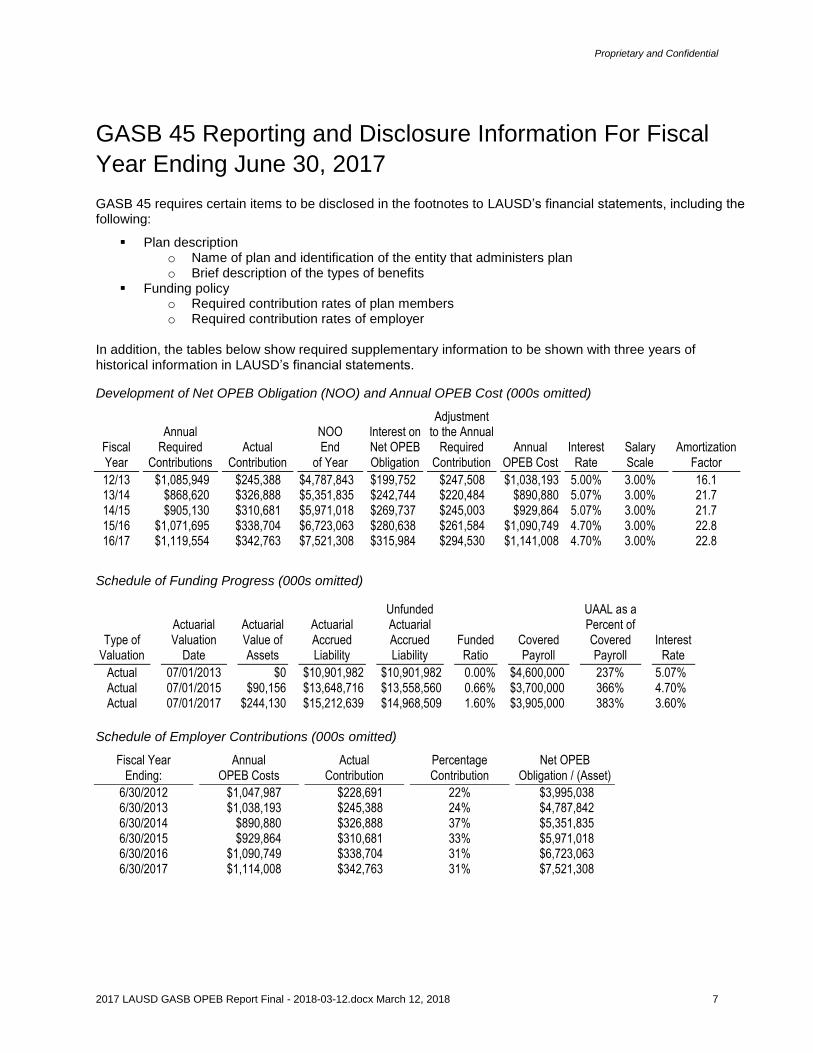
GASB 45 Reporting and Disclosure Information For Fiscal
Year Ending June 30, 2017
GASB 45 requires certain items to be disclosed in the footnotes to LAUSD’s financial statements, including the following:
Plan description o Name of plan and identification of the entity that administers plan o Brief description of the types of benefits
Funding policy o Required contribution rates of plan members o Required contribution rates of employer
In addition, the tables below show required supplementary information to be shown with three years of historical information in LAUSD’s financial statements.
Development of Net OPEB Obligation (NOO) and Annual OPEB Cost (000s omitted)
Fiscal Year
Annual
Required Contributions
Actual Contribution
NOO End
of Year
Interest on Net OPEB Obligation
Adjustment to the Annual
Required Contribution
Annual
OPEB Cost
Interest Rate
Salary Scale
Amortization Factor
12/13 $1,085,949 $245,388 $4,787,843 $199,752 $247,508 $1,038,193 5.00% 3.00% 16.1 13/14 $868,620 $326,888 $5,351,835 $242,744 $220,484 $890,880 5.07% 3.00% 21.7 14/15 $905,130 $310,681 $5,971,018 $269,737 $245,003 $929,864 5.07% 3.00% 21.7 15/16 $1,071,695 $338,704 $6,723,063 $280,638 $261,584 $1,090,749 4.70% 3.00% 22.8 16/17 $1,119,554 $342,763 $7,521,308 $315,984 $294,530 $1,141,008 4.70% 3.00% 22.8
Schedule of Funding Progress (000s omitted)
Type of Valuation
Actuarial Valuation
Date
Actuarial Value of Assets
Actuarial Accrued Liability
Unfunded Actuarial Accrued Liability
Funded Ratio
Covered Payroll
UAAL as a Percent of Covered Payroll
Interest Rate
Actual 07/01/2013 $0 $10,901,982 $10,901,982 0.00% $4,600,000 237% 5.07% Actual 07/01/2015 $90,156 $13,648,716 $13,558,560 0.66% $3,700,000 366% 4.70% Actual 07/01/2017 $244,130 $15,212,639 $14,968,509 1.60% $3,905,000 383% 3.60%
Schedule of Employer Contributions (000s omitted)
Fiscal Year Ending:
Annual OPEB Costs
Actual Contribution
Percentage Contribution
Net OPEB Obligation / (Asset)
6/30/2012 $1,047,987 $228,691 22% $3,995,038 6/30/2013 $1,038,193 $245,388 24% $4,787,842 6/30/2014 $890,880 $326,888 37% $5,351,835 6/30/2015 $929,864 $310,681 33% $5,971,018 6/30/2016 $1,090,749 $338,704 31% $6,723,063 6/30/2017 $1,114,008 $342,763 31% $7,521,308

Proprietary and Confidential
2017 LAUSD GASB OPEB Report Final - 2018-03-12.docx March 12, 2018 8
GASB 75 Reporting and Disclosure Information For Fiscal
Year Ending June 30, 2018
Development of GASB 75 Net OPEB Expense
The measurement period for the fiscal year ending 6/30/2018 is 7/1/2016 to 6/30/2017.
Calculation Details
The following table illustrates the Net OPEB Liability under GASB 75.
Fiscal Year Ending 6/30/2017 (Used For Fiscal Year GASB 75 Ending Transition)
1 6/30/2018
(1) OPEB Liability
(a) Retired Participants and Beneficiaries
Receiving Payment $ 5,282,580,519 $ 4,758,354,499
(b) Active Participants $ 11,131,398,702 $ 10,454,285,015
(c) Total $ 16,413,979,221 $ 15,212,639,514
(2) Plan Fiduciary Net Position $ 145,237,605 $ 244,129,536
(3) Net OPEB Liability $ 16,268,741,616 $ 14,968,509,978
(4) Plan Fiduciary Net Position as a Percentage of the Total OPEB Liability 0.88% 1.60%
(5) Deferred Outflow of Resources for Contributions Made After Measurement Date $ 342,763,000 TBD
GASB 75 Transition
(1) Net OPEB Obligation at last day of 2017 Fiscal Year $7,521,308,535
(2) Amount for Transition to GASB 75 $8,747,433,081
(3) Liability under GASB 75 at first day of 2018 Fiscal Year $16,268,741,616
1 Based on a backward projection of the July 1, 2017 valuation results adjusted to reflect the discount rate (2.90%) as of June 30, 2016.
Proprietary and Confidential
2017 LAUSD GASB OPEB Report Final - 2018-03-12.docx March 12, 2018 9
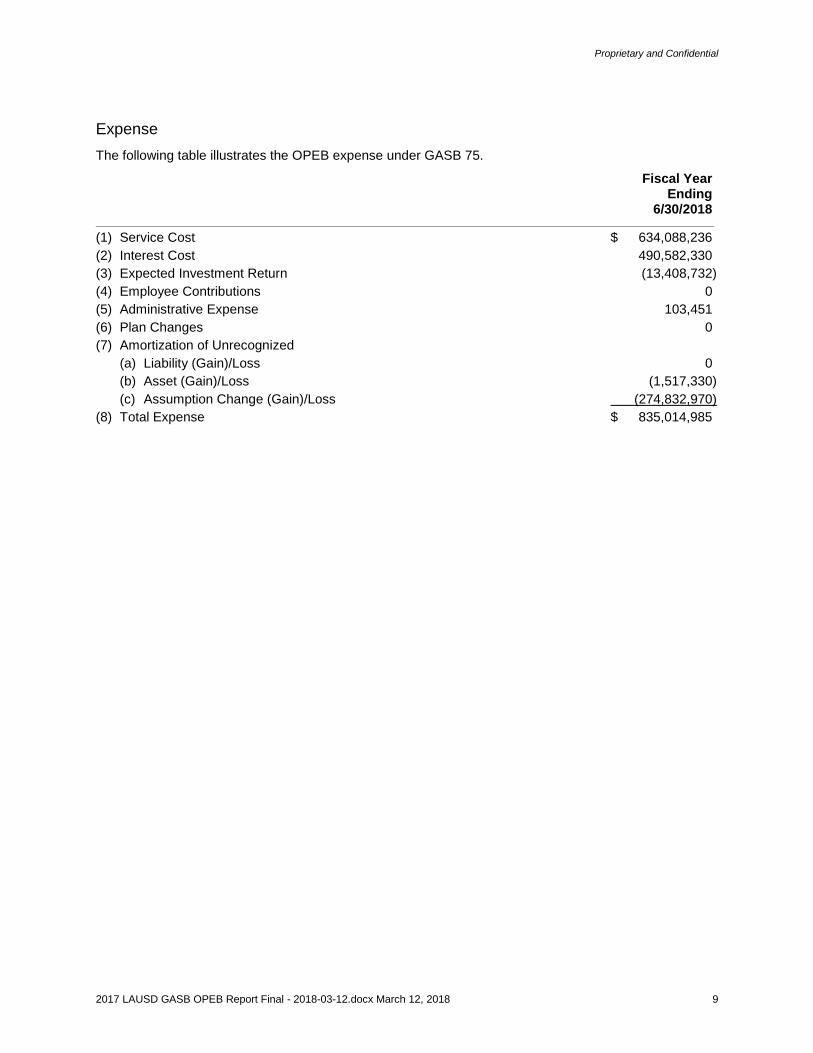
Expense
The following table illustrates the OPEB expense under GASB 75.
Fiscal Year Ending 6/30/2018
(1) Service Cost $ 634,088,236
(2) Interest Cost 490,582,330
(3) Expected Investment Return (13,408,732)
(4) Employee Contributions 0
(5) Administrative Expense 103,451
(6) Plan Changes 0
(7) Amortization of Unrecognized
(a) Liability (Gain)/Loss 0
(b) Asset (Gain)/Loss (1,517,330)
(c) Assumption Change (Gain)/Loss (274,832,970)
(8) Total Expense $ 835,014,985
Proprietary and Confidential
2017 LAUSD GASB OPEB Report Final - 2018-03-12.docx March 12, 2018 10
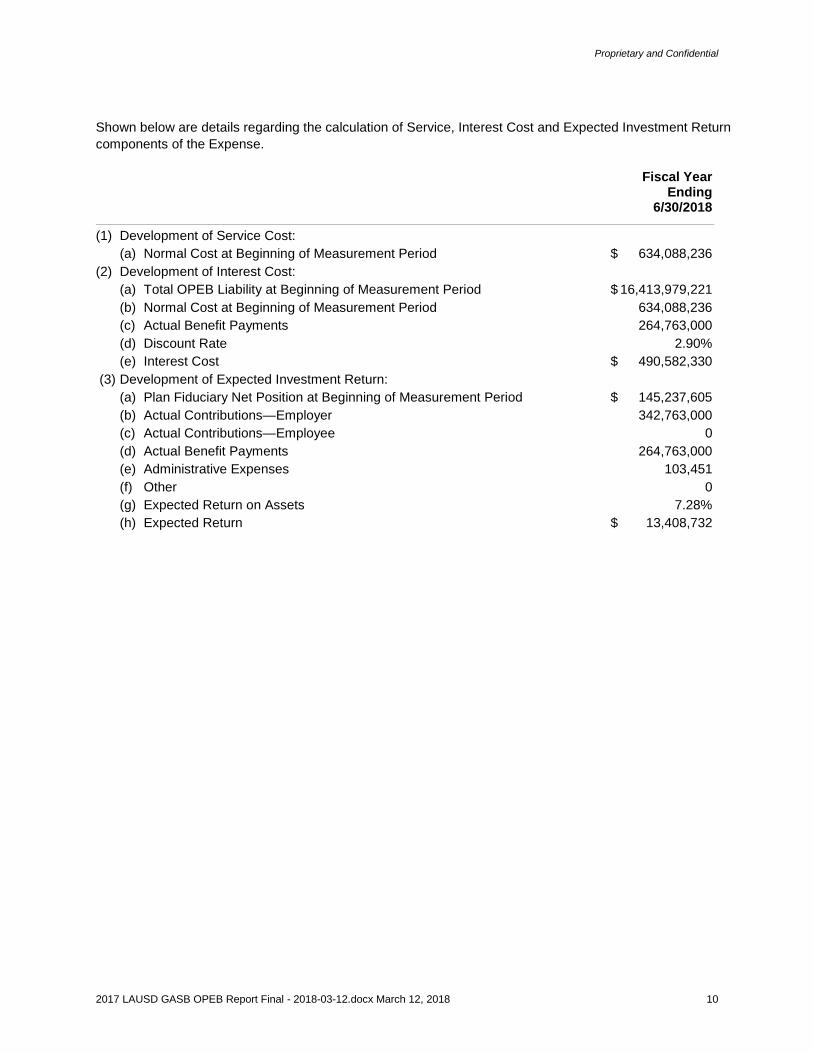
Shown below are details regarding the calculation of Service, Interest Cost and Expected Investment Return
components of the Expense.
Fiscal Year Ending 6/30/2018
(1) Development of Service Cost:
(a) Normal Cost at Beginning of Measurement Period $ 634,088,236
(2) Development of Interest Cost:
(a) Total OPEB Liability at Beginning of Measurement Period $ 16,413,979,221
(b) Normal Cost at Beginning of Measurement Period 634,088,236
(c) Actual Benefit Payments 264,763,000
(d) Discount Rate 2.90%
(e) Interest Cost $ 490,582,330
(3) Development of Expected Investment Return:
(a) Plan Fiduciary Net Position at Beginning of Measurement Period $ 145,237,605
(b) Actual Contributions—Employer 342,763,000
(c) Actual Contributions—Employee 0
(d) Actual Benefit Payments 264,763,000
(e) Administrative Expenses 103,451
(f) Other 0
(g) Expected Return on Assets 7.28%
(h) Expected Return $ 13,408,732
Proprietary and Confidential
2017 LAUSD GASB OPEB Report Final - 2018-03-12.docx March 12, 2018 11
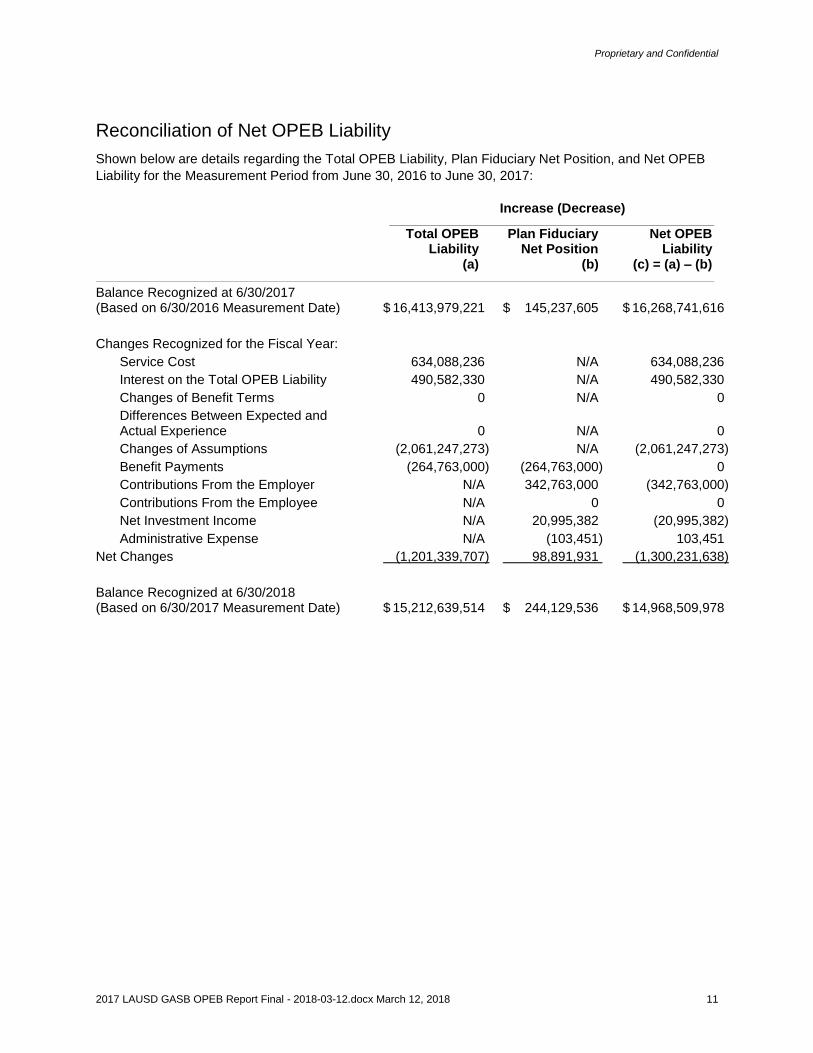
Reconciliation of Net OPEB Liability
Shown below are details regarding the Total OPEB Liability, Plan Fiduciary Net Position, and Net OPEB
Liability for the Measurement Period from June 30, 2016 to June 30, 2017:
Increase (Decrease)
Total OPEB Plan Fiduciary Net OPEB Liability Net Position Liability (a) (b) (c) = (a) – (b)
Balance Recognized at 6/30/2017 (Based on 6/30/2016 Measurement Date) $ 16,413,979,221 $ 145,237,605 $ 16,268,741,616
Changes Recognized for the Fiscal Year:
Service Cost 634,088,236 N/A 634,088,236
Interest on the Total OPEB Liability 490,582,330 N/A 490,582,330
Changes of Benefit Terms 0 N/A 0
Differences Between Expected and Actual Experience 0 N/A 0
Changes of Assumptions (2,061,247,273) N/A (2,061,247,273)
Benefit Payments (264,763,000) (264,763,000) 0
Contributions From the Employer N/A 342,763,000 (342,763,000)
Contributions From the Employee N/A 0 0
Net Investment Income N/A 20,995,382 (20,995,382)
Administrative Expense N/A (103,451) 103,451
Net Changes (1,201,339,707) 98,891,931 (1,300,231,638)
Balance Recognized at 6/30/2018 (Based on 6/30/2017 Measurement Date) $ 15,212,639,514 $ 244,129,536 $ 14,968,509,978
Proprietary and Confidential
2017 LAUSD GASB OPEB Report Final - 2018-03-12.docx March 12, 2018 12
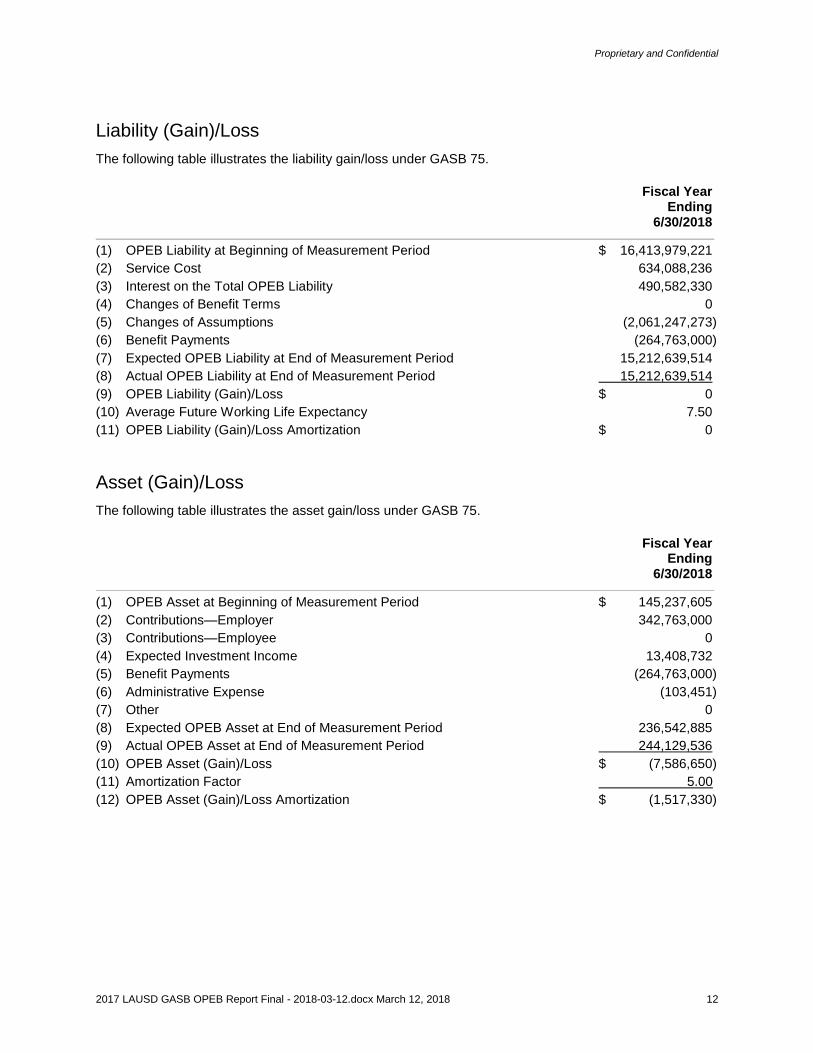
Liability (Gain)/Loss
The following table illustrates the liability gain/loss under GASB 75.
Fiscal Year Ending 6/30/2018
(1) OPEB Liability at Beginning of Measurement Period $ 16,413,979,221
(2) Service Cost 634,088,236
(3) Interest on the Total OPEB Liability 490,582,330
(4) Changes of Benefit Terms 0
(5) Changes of Assumptions (2,061,247,273)
(6) Benefit Payments (264,763,000)
(7) Expected OPEB Liability at End of Measurement Period 15,212,639,514
(8) Actual OPEB Liability at End of Measurement Period 15,212,639,514
(9) OPEB Liability (Gain)/Loss $ 0
(10) Average Future Working Life Expectancy 7.50
(11) OPEB Liability (Gain)/Loss Amortization $ 0
Asset (Gain)/Loss
The following table illustrates the asset gain/loss under GASB 75.
Fiscal Year Ending 6/30/2018
(1) OPEB Asset at Beginning of Measurement Period $ 145,237,605
(2) Contributions—Employer 342,763,000
(3) Contributions—Employee 0
(4) Expected Investment Income 13,408,732
(5) Benefit Payments (264,763,000)
(6) Administrative Expense (103,451)
(7) Other 0
(8) Expected OPEB Asset at End of Measurement Period 236,542,885
(9) Actual OPEB Asset at End of Measurement Period 244,129,536
(10) OPEB Asset (Gain)/Loss $ (7,586,650)
(11) Amortization Factor 5.00
(12) OPEB Asset (Gain)/Loss Amortization $ (1,517,330)
Proprietary and Confidential
2017 LAUSD GASB OPEB Report Final - 2018-03-12.docx March 12, 2018 13
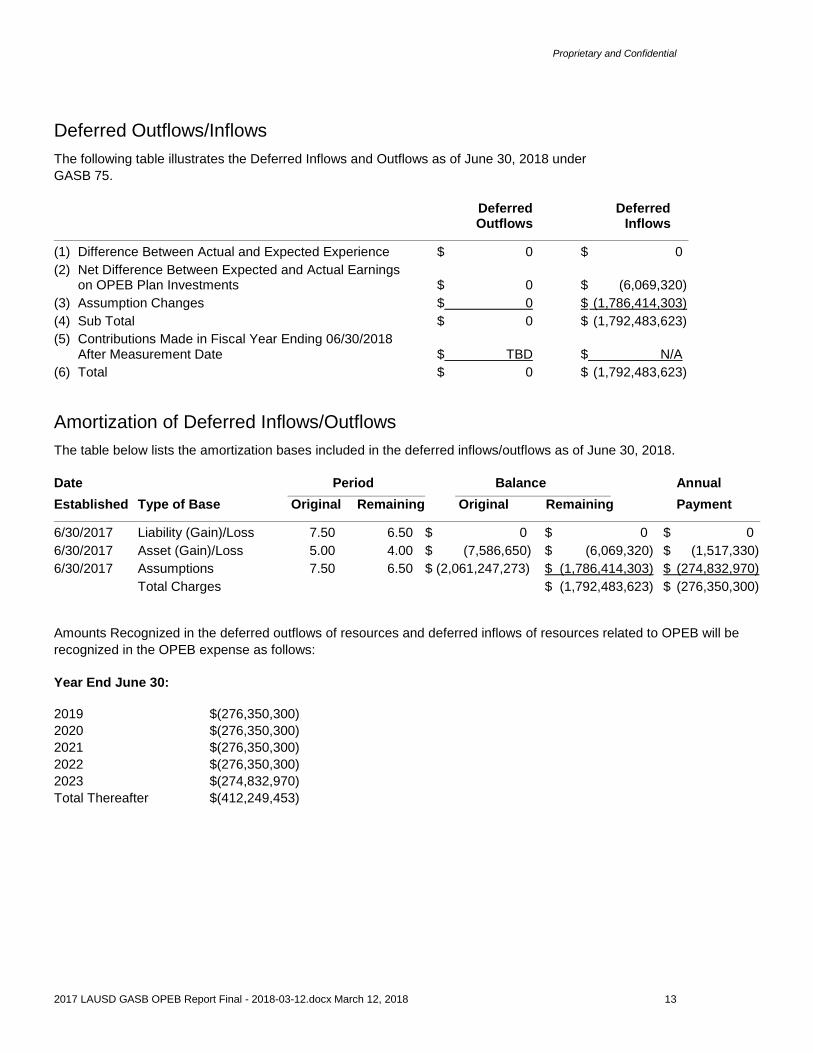
Deferred Outflows/Inflows
The following table illustrates the Deferred Inflows and Outflows as of June 30, 2018 under
GASB 75.
Deferred Deferred Outflows Inflows
(1) Difference Between Actual and Expected Experience $ 0 $ 0
(2) Net Difference Between Expected and Actual Earnings on OPEB Plan Investments $ 0 $ (6,069,320)
(3) Assumption Changes $ 0 $ (1,786,414,303)
(4) Sub Total $ 0 $ (1,792,483,623)
(5) Contributions Made in Fiscal Year Ending 06/30/2018 After Measurement Date $ TBD $ N/A
(6) Total $ 0 $ (1,792,483,623)
Amortization of Deferred Inflows/Outflows
The table below lists the amortization bases included in the deferred inflows/outflows as of June 30, 2018.
Date Period Balance Annual
Established Type of Base Original Remaining Original Remaining Payment
6/30/2017 Liability (Gain)/Loss 7.50 6.50 $ 0 $ 0 $ 0
6/30/2017 Asset (Gain)/Loss 5.00 4.00 $ (7,586,650) $ (6,069,320) $ (1,517,330)
6/30/2017 Assumptions 7.50 6.50 $ (2,061,247,273) $ (1,786,414,303) $ (274,832,970)
Total Charges $ (1,792,483,623) $ (276,350,300)
Amounts Recognized in the deferred outflows of resources and deferred inflows of resources related to OPEB will be
recognized in the OPEB expense as follows:
Year End June 30:
2019 $(276,350,300)
2020 $(276,350,300)
2021 $(276,350,300)
2022 $(276,350,300)
2023 $(274,832,970)
Total Thereafter $(412,249,453)

Proprietary and Confidential
2017 LAUSD GASB OPEB Report Final - 2018-03-12.docx March 12, 2018 14
Plan Fiduciary Net Position Projection
The following table illustrates the projection of the fiduciary net position for use in the calculation of the discount rate
as of June 30, 2018.
($ in thousands)
Year Ending
Beginning Fiduciary Net
Position Total
Contributions Benefit
Payments Administrative
Expenses Investment
Earnings
Ending Fiduciary Net
Position1
June 302 (a) (b) (c) (d) (e) (f)
2018 244,130 425,521 305,521 0 22,336 386,466
2019 386,466 293,386 313,715 0 27,595 393,732
2020 393,732 302,749 343,779 0 27,390 380,092
2021 380,092 318,160 379,843 0 25,668 344,077
2022 344,077 324,840 414,213 0 22,060 276,765
2023 276,765 333,320 450,141 0 16,184 176,128
2024 176,128 344,602 489,603 0 7,857 38,984
2025 38,984 357,337 531,358 0 0 0
2026 0 366,483 571,962 0 0 0
2027 0 365,973 613,014 0 0 0
2028 0 368,623 656,282 0 0 0
2029 0 375,627 704,291 0 0 0
2030 0 384,212 755,120 0 0 0
2031 0 392,674 810,397 0 0 0
2032 0 390,829 868,660 0 0 0
2033 0 386,258 925,571 0 0 0
2034 0 382,496 979,282 0 0 0
2035 0 374,269 1,028,972 0 0 0
2036 0 357,937 1,075,423 0 0 0
2037 0 331,144 1,123,239 0 0 0
2038 0 296,998 1,165,535 0 0 0
2039 0 260,862 1,202,386 0 0 0
2040 0 218,196 1,231,575 0 0 0
2041 0 163,048 1,254,381 0 0 0
2042 0 90,535 1,276,362 0 0 0
2043 0 19,756 1,291,302 0 0 0
2044 0 0 1,304,433 0 0 0
2045 0 0 1,311,869 0 0 0
2046 0 0 1,320,023 0 0 0
2047 0 0 1,335,765 0 0 0
1 (f)=(a) + (b) – (c) – (d) + (e)
2 Years later than 2047 were omitted from this table.
Proprietary and Confidential
2017 LAUSD GASB OPEB Report Final - 2018-03-12.docx March 12, 2018 15
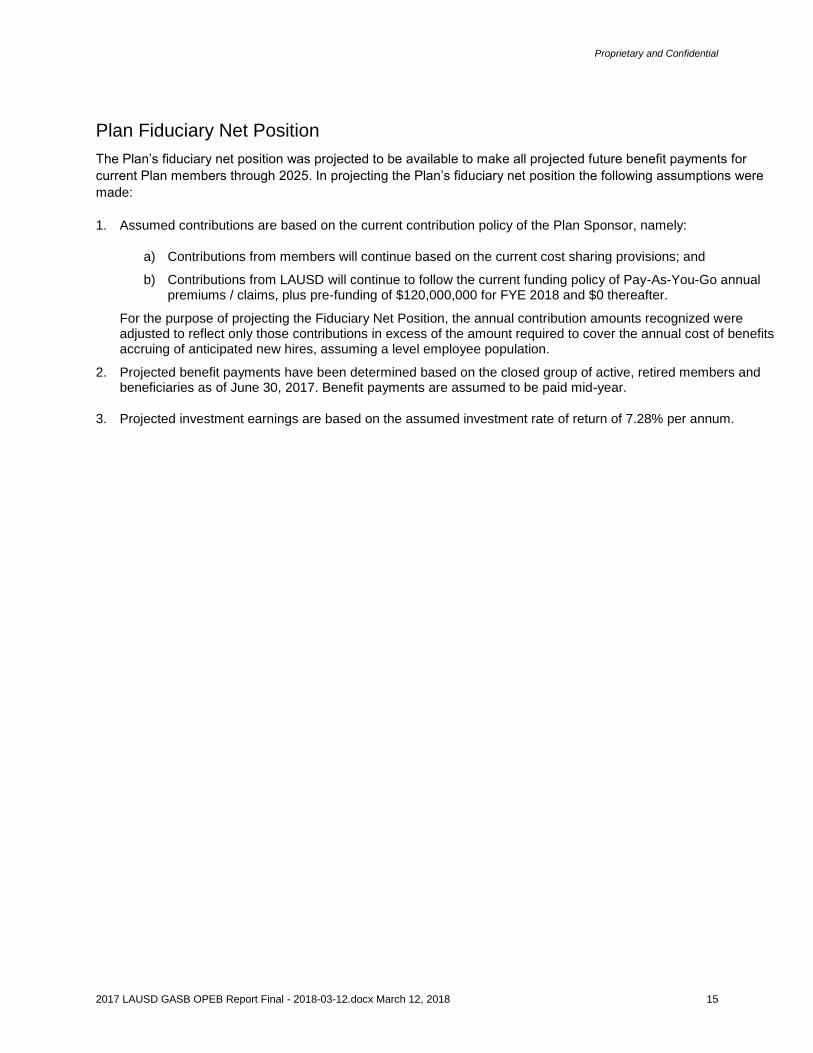
Plan Fiduciary Net Position
The Plan’s fiduciary net position was projected to be available to make all projected future benefit payments for
current Plan members through 2025. In projecting the Plan’s fiduciary net position the following assumptions were
made:
1. Assumed contributions are based on the current contribution policy of the Plan Sponsor, namely:
a) Contributions from members will continue based on the current cost sharing provisions; and
b) Contributions from LAUSD will continue to follow the current funding policy of Pay-As-You-Go annual premiums / claims, plus pre-funding of $120,000,000 for FYE 2018 and $0 thereafter.
For the purpose of projecting the Fiduciary Net Position, the annual contribution amounts recognized were adjusted to reflect only those contributions in excess of the amount required to cover the annual cost of benefits accruing of anticipated new hires, assuming a level employee population.
2. Projected benefit payments have been determined based on the closed group of active, retired members and beneficiaries as of June 30, 2017. Benefit payments are assumed to be paid mid-year.
3. Projected investment earnings are based on the assumed investment rate of return of 7.28% per annum.
Proprietary and Confidential
2017 LAUSD GASB OPEB Report Final - 2018-03-12.docx March 12, 2018 16
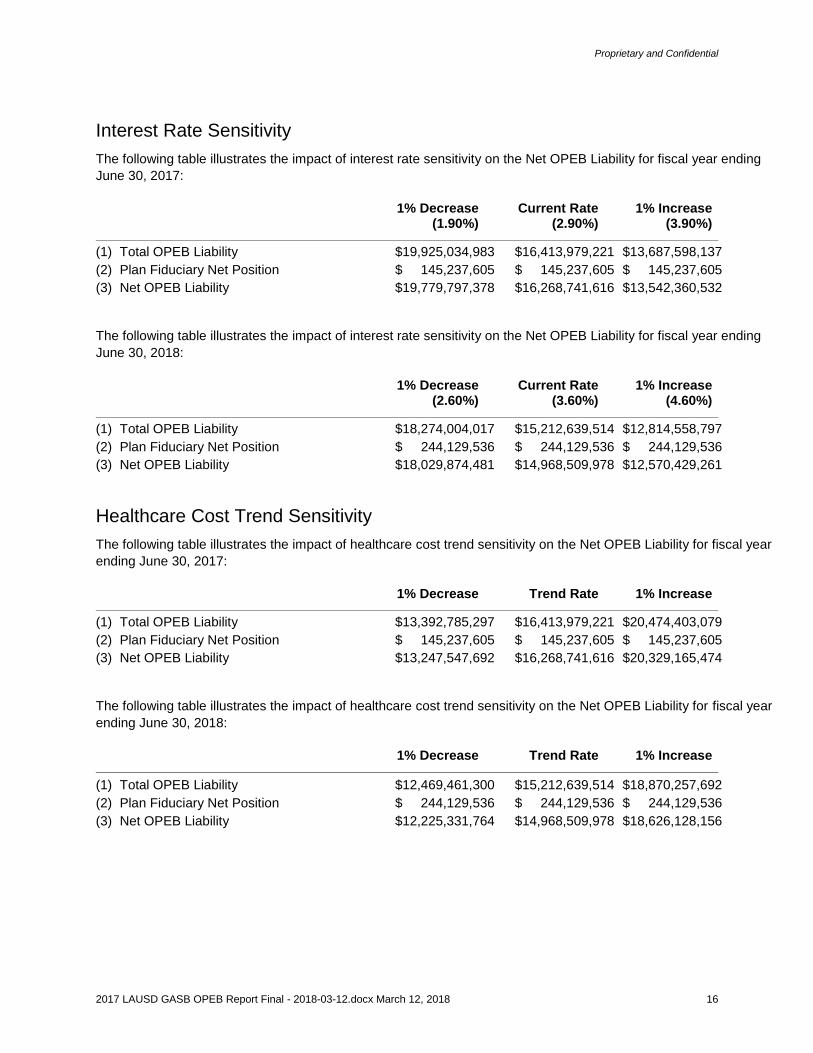
Interest Rate Sensitivity
The following table illustrates the impact of interest rate sensitivity on the Net OPEB Liability for fiscal year ending
June 30, 2017:
1% Decrease Current Rate 1% Increase (1.90%) (2.90%) (3.90%)
(1) Total OPEB Liability $19,925,034,983 $16,413,979,221 $13,687,598,137
(2) Plan Fiduciary Net Position $ 145,237,605 $ 145,237,605 $ 145,237,605
(3) Net OPEB Liability $19,779,797,378 $16,268,741,616 $13,542,360,532
The following table illustrates the impact of interest rate sensitivity on the Net OPEB Liability for fiscal year ending
June 30, 2018:
1% Decrease Current Rate 1% Increase (2.60%) (3.60%) (4.60%)
(1) Total OPEB Liability $18,274,004,017 $15,212,639,514 $12,814,558,797
(2) Plan Fiduciary Net Position $ 244,129,536 $ 244,129,536 $ 244,129,536
(3) Net OPEB Liability $18,029,874,481 $14,968,509,978 $12,570,429,261
Healthcare Cost Trend Sensitivity
The following table illustrates the impact of healthcare cost trend sensitivity on the Net OPEB Liability for fiscal year
ending June 30, 2017:
1% Decrease Trend Rate 1% Increase
(1) Total OPEB Liability $13,392,785,297 $16,413,979,221 $20,474,403,079
(2) Plan Fiduciary Net Position $ 145,237,605 $ 145,237,605 $ 145,237,605
(3) Net OPEB Liability $13,247,547,692 $16,268,741,616 $20,329,165,474
The following table illustrates the impact of healthcare cost trend sensitivity on the Net OPEB Liability for fiscal year
ending June 30, 2018:
1% Decrease Trend Rate 1% Increase
(1) Total OPEB Liability $12,469,461,300 $15,212,639,514 $18,870,257,692
(2) Plan Fiduciary Net Position $ 244,129,536 $ 244,129,536 $ 244,129,536
(3) Net OPEB Liability $12,225,331,764 $14,968,509,978 $18,626,128,156
Proprietary and Confidential
2017 LAUSD GASB OPEB Report Final - 2018-03-12.docx March 12, 2018 17
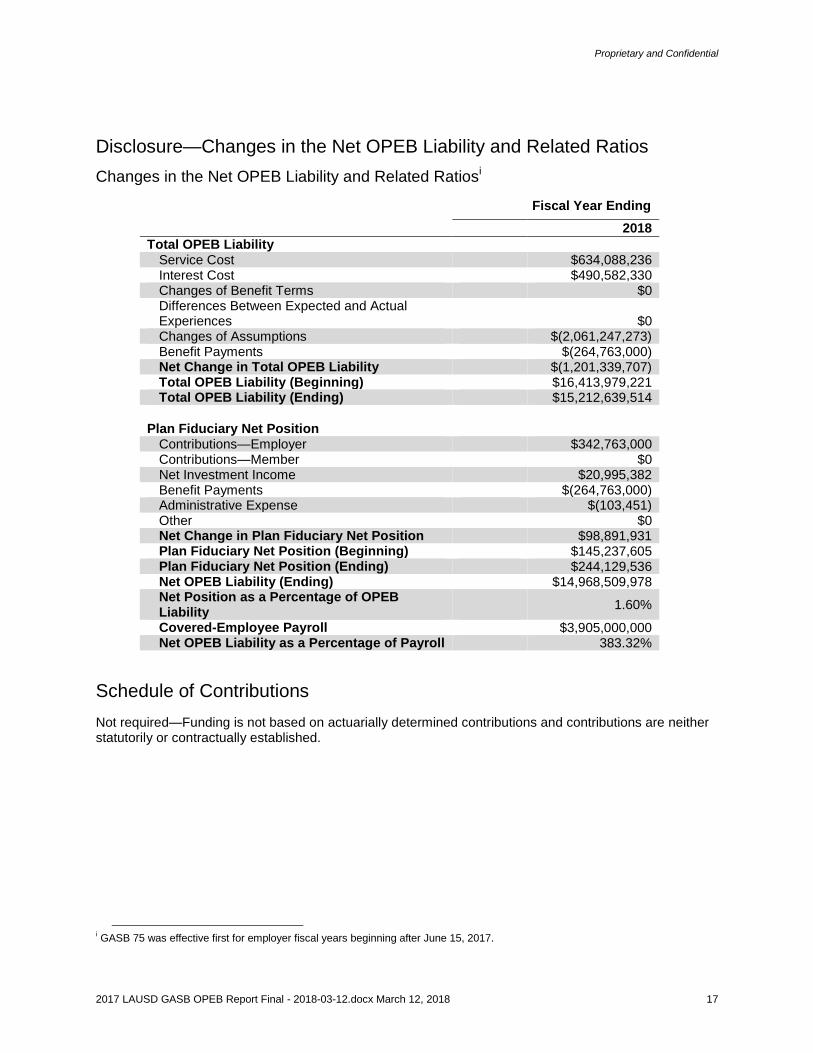
Disclosure—Changes in the Net OPEB Liability and Related Ratios
Changes in the Net OPEB Liability and Related Ratiosi
Fiscal Year Ending
2018
Total OPEB Liability Service Cost $634,088,236 Interest Cost $490,582,330 Changes of Benefit Terms $0 Differences Between Expected and Actual Experiences $0 Changes of Assumptions $(2,061,247,273) Benefit Payments $(264,763,000) Net Change in Total OPEB Liability $(1,201,339,707) Total OPEB Liability (Beginning) $16,413,979,221 Total OPEB Liability (Ending) $15,212,639,514
Plan Fiduciary Net Position Contributions—Employer $342,763,000 Contributions—Member $0 Net Investment Income $20,995,382 Benefit Payments $(264,763,000) Administrative Expense $(103,451) Other $0 Net Change in Plan Fiduciary Net Position $98,891,931 Plan Fiduciary Net Position (Beginning) $145,237,605 Plan Fiduciary Net Position (Ending) $244,129,536 Net OPEB Liability (Ending) $14,968,509,978 Net Position as a Percentage of OPEB Liability
1.60%
Covered-Employee Payroll $3,905,000,000 Net OPEB Liability as a Percentage of Payroll 383.32%
Schedule of Contributions
Not required—Funding is not based on actuarially determined contributions and contributions are neither statutorily or contractually established.
i GASB 75 was effective first for employer fiscal years beginning after June 15, 2017.
Proprietary and Confidential
2017 LAUSD GASB OPEB Report Final - 2018-03-12.docx March 12, 2018 18
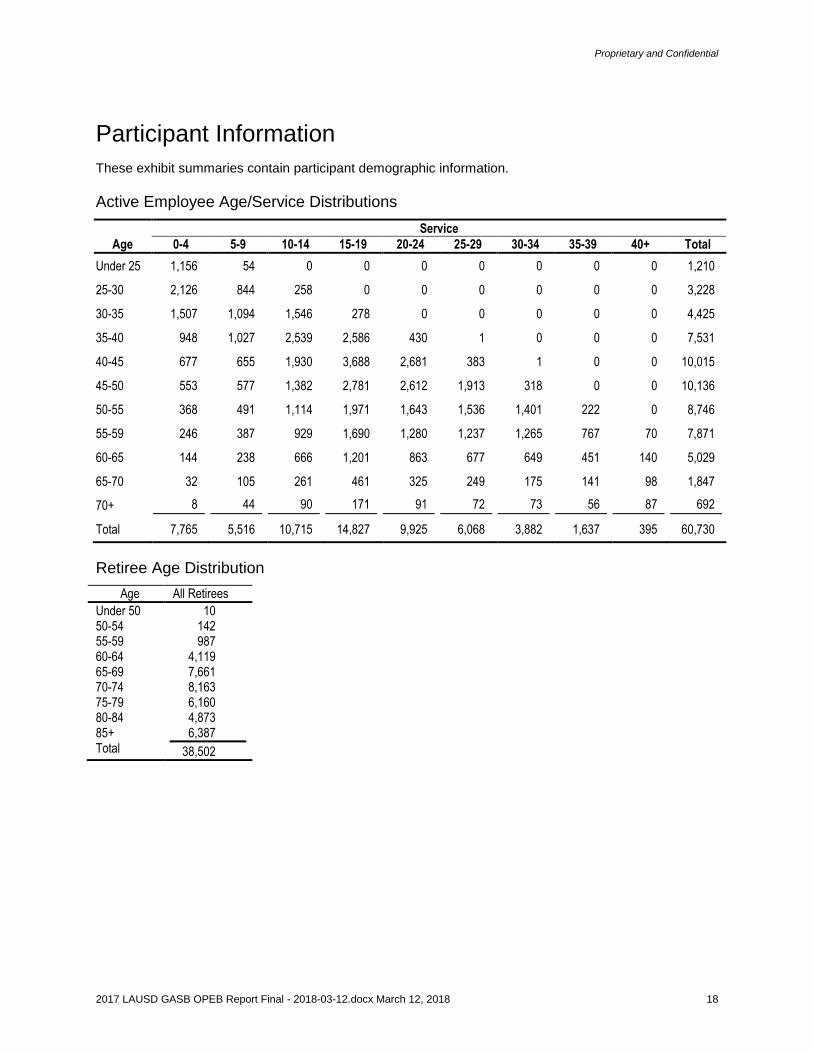
Participant Information
These exhibit summaries contain participant demographic information.
Active Employee Age/Service Distributions
Service
Age 0-4 5-9 10-14 15-19 20-24 25-29 30-34 35-39 40+ Total
Under 25 1,156 54 0 0 0 0 0 0 0 1,210
25-30 2,126 844 258 0 0 0 0 0 0 3,228
30-35 1,507 1,094 1,546 278 0 0 0 0 0 4,425
35-40 948 1,027 2,539 2,586 430 1 0 0 0 7,531
40-45 677 655 1,930 3,688 2,681 383 1 0 0 10,015
45-50 553 577 1,382 2,781 2,612 1,913 318 0 0 10,136
50-55 368 491 1,114 1,971 1,643 1,536 1,401 222 0 8,746
55-59 246 387 929 1,690 1,280 1,237 1,265 767 70 7,871
60-65 144 238 666 1,201 863 677 649 451 140 5,029
65-70 32 105 261 461 325 249 175 141 98 1,847
70+ 8 44 90 171 91 72 73 56 87 692
Total 7,765 5,516 10,715 14,827 9,925 6,068 3,882 1,637 395 60,730
Retiree Age Distribution
Age All Retirees
Under 50 10 50-54 142 55-59 987 60-64 4,119 65-69 7,661 70-74 8,163 75-79 6,160 80-84 4,873 85+ 6,387 Total 38,502
Proprietary and Confidential
2017 LAUSD GASB OPEB Report Final - 2018-03-12.docx March 12, 2018 19
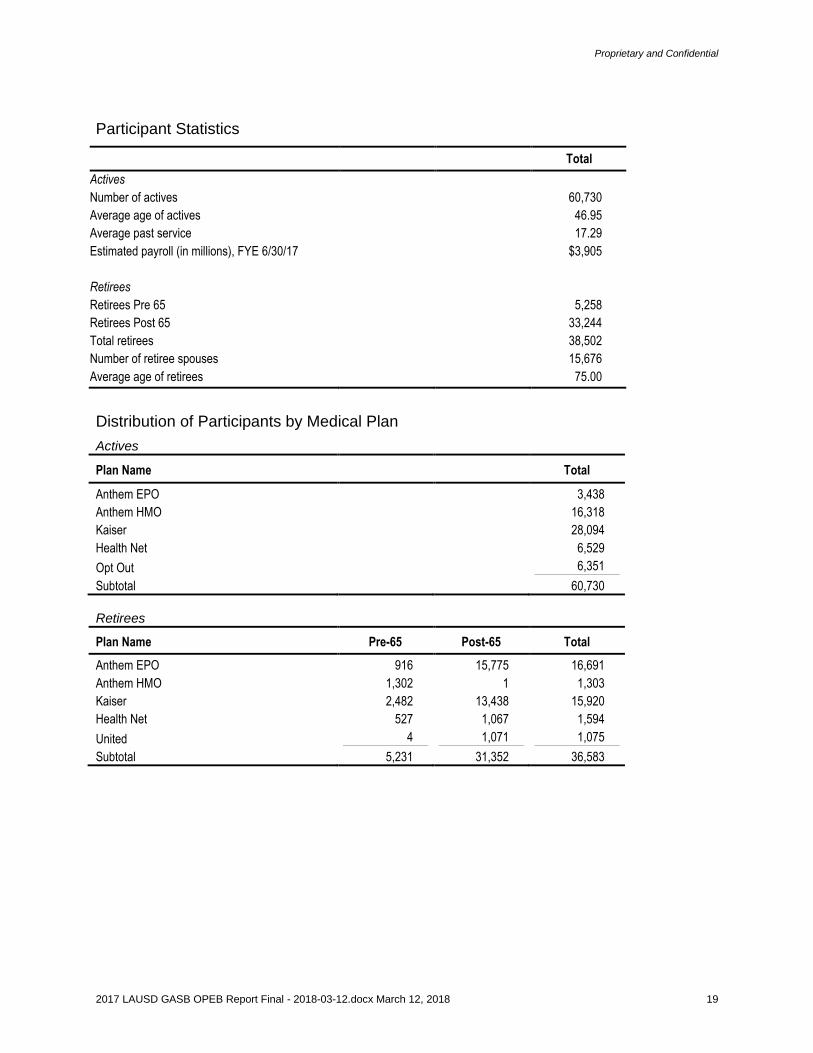
Participant Statistics
Total
Actives
Number of actives 60,730
Average age of actives 46.95
Average past service 17.29
Estimated payroll (in millions), FYE 6/30/17 $3,905
Retirees
Retirees Pre 65 5,258 Retirees Post 65 33,244
Total retirees 38,502
Number of retiree spouses 15,676
Average age of retirees 75.00
Distribution of Participants by Medical Plan
Actives
Plan Name Total
Anthem EPO 3,438
Anthem HMO 16,318
Kaiser 28,094
Health Net 6,529
Opt Out 6,351
Subtotal 60,730
Retirees
Plan Name Pre-65 Post-65 Total
Anthem EPO 916 15,775 16,691
Anthem HMO 1,302 1 1,303
Kaiser 2,482 13,438 15,920
Health Net 527 1,067 1,594
United 4 1,071 1,075
Subtotal 5,231 31,352 36,583
Proprietary and Confidential
2017 LAUSD GASB OPEB Report Final - 2018-03-12.docx March 12, 2018 20
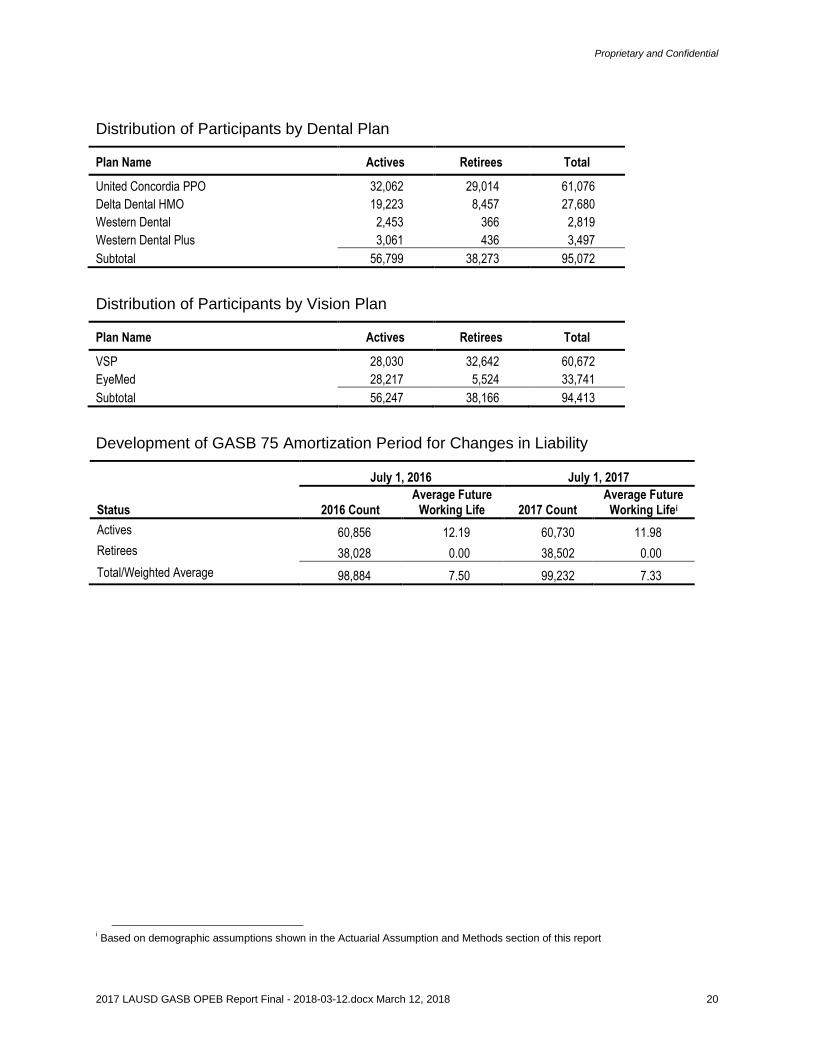
Distribution of Participants by Dental Plan
Plan Name Actives Retirees Total
United Concordia PPO 32,062 29,014 61,076
Delta Dental HMO 19,223 8,457 27,680
Western Dental 2,453 366 2,819
Western Dental Plus 3,061 436 3,497
Subtotal 56,799 38,273 95,072
Distribution of Participants by Vision Plan
Plan Name Actives Retirees Total
VSP 28,030 32,642 60,672
EyeMed 28,217 5,524 33,741
Subtotal 56,247 38,166 94,413
Development of GASB 75 Amortization Period for Changes in Liability
July 1, 2016 July 1, 2017
Status 2016 Count Average Future
Working Life 2017 Count Average Future
Working Lifei
Actives 60,856 12.19 60,730 11.98
Retirees 38,028 0.00 38,502 0.00
Total/Weighted Average 98,884 7.50 99,232 7.33
i Based on demographic assumptions shown in the Actuarial Assumption and Methods section of this report
Proprietary and Confidential
2017 LAUSD GASB OPEB Report Final - 2018-03-12.docx March 12, 2018 21
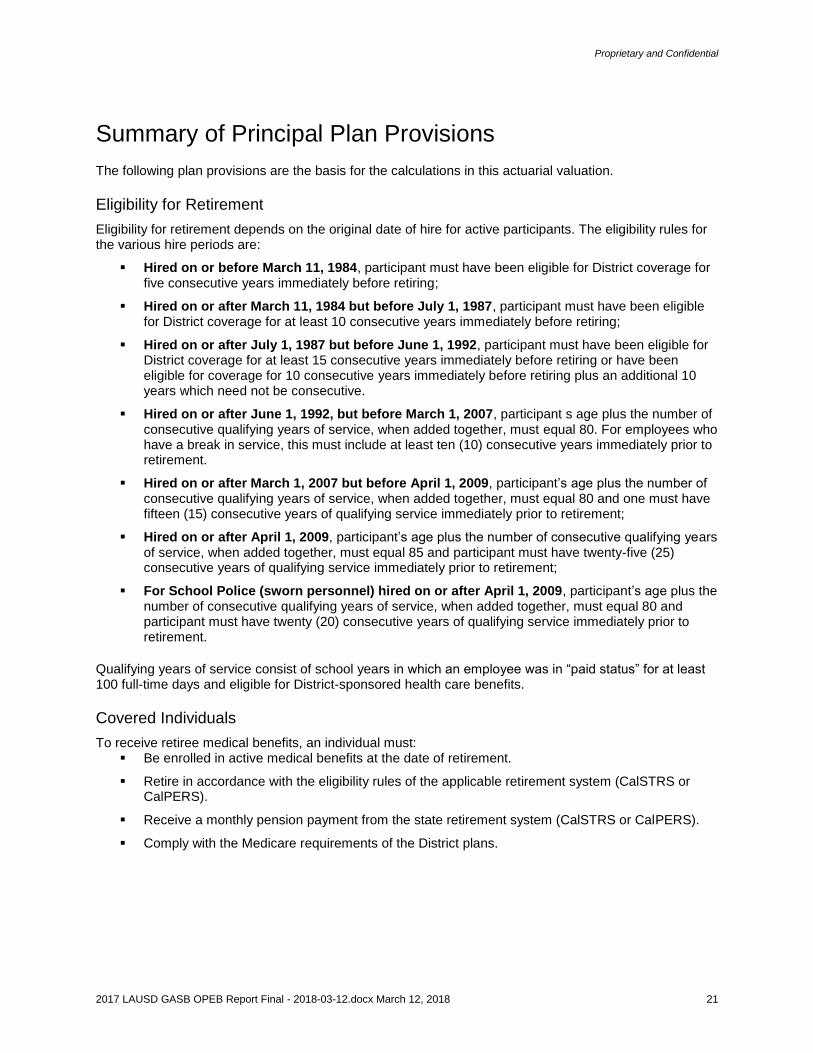
Summary of Principal Plan Provisions
The following plan provisions are the basis for the calculations in this actuarial valuation.
Eligibility for Retirement
Eligibility for retirement depends on the original date of hire for active participants. The eligibility rules for the various hire periods are:
Hired on or before March 11, 1984, participant must have been eligible for District coverage for five consecutive years immediately before retiring;
Hired on or after March 11, 1984 but before July 1, 1987, participant must have been eligible for District coverage for at least 10 consecutive years immediately before retiring;
Hired on or after July 1, 1987 but before June 1, 1992, participant must have been eligible for District coverage for at least 15 consecutive years immediately before retiring or have been eligible for coverage for 10 consecutive years immediately before retiring plus an additional 10 years which need not be consecutive.
Hired on or after June 1, 1992, but before March 1, 2007, participant s age plus the number of consecutive qualifying years of service, when added together, must equal 80. For employees who have a break in service, this must include at least ten (10) consecutive years immediately prior to retirement.
Hired on or after March 1, 2007 but before April 1, 2009, participant’s age plus the number of consecutive qualifying years of service, when added together, must equal 80 and one must have fifteen (15) consecutive years of qualifying service immediately prior to retirement;
Hired on or after April 1, 2009, participant’s age plus the number of consecutive qualifying years of service, when added together, must equal 85 and participant must have twenty-five (25) consecutive years of qualifying service immediately prior to retirement;
For School Police (sworn personnel) hired on or after April 1, 2009, participant’s age plus the number of consecutive qualifying years of service, when added together, must equal 80 and participant must have twenty (20) consecutive years of qualifying service immediately prior to retirement.
Qualifying years of service consist of school years in which an employee was in “paid status” for at least 100 full-time days and eligible for District-sponsored health care benefits.
Covered Individuals
To receive retiree medical benefits, an individual must: Be enrolled in active medical benefits at the date of retirement.
Retire in accordance with the eligibility rules of the applicable retirement system (CalSTRS or CalPERS).
Receive a monthly pension payment from the state retirement system (CalSTRS or CalPERS).
Comply with the Medicare requirements of the District plans.
Proprietary and Confidential
2017 LAUSD GASB OPEB Report Final - 2018-03-12.docx March 12, 2018 22
Dependents
Eligible dependents are also covered by the District for the life of the retiree. Upon the retiree’s death, eligible dependents may continue coverage under the plan but will generally have to pay 100% of premium and plan costs.
Plans Available
Medical: Kaiser, HealthNet, Secure Horizons (65+ only), Anthem HMO (under 65 only) and Anthem EPO. All plans are fully-insured.
Dental: United Concordia PPO, Delta Dental HMO, Western Dental, Western Dental Plus. All plans are fully-insured. Vision: VSP and EyeMed. All plans are fully-insured.
Proprietary and Confidential
2017 LAUSD GASB OPEB Report Final - 2018-03-12.docx March 12, 2018 23
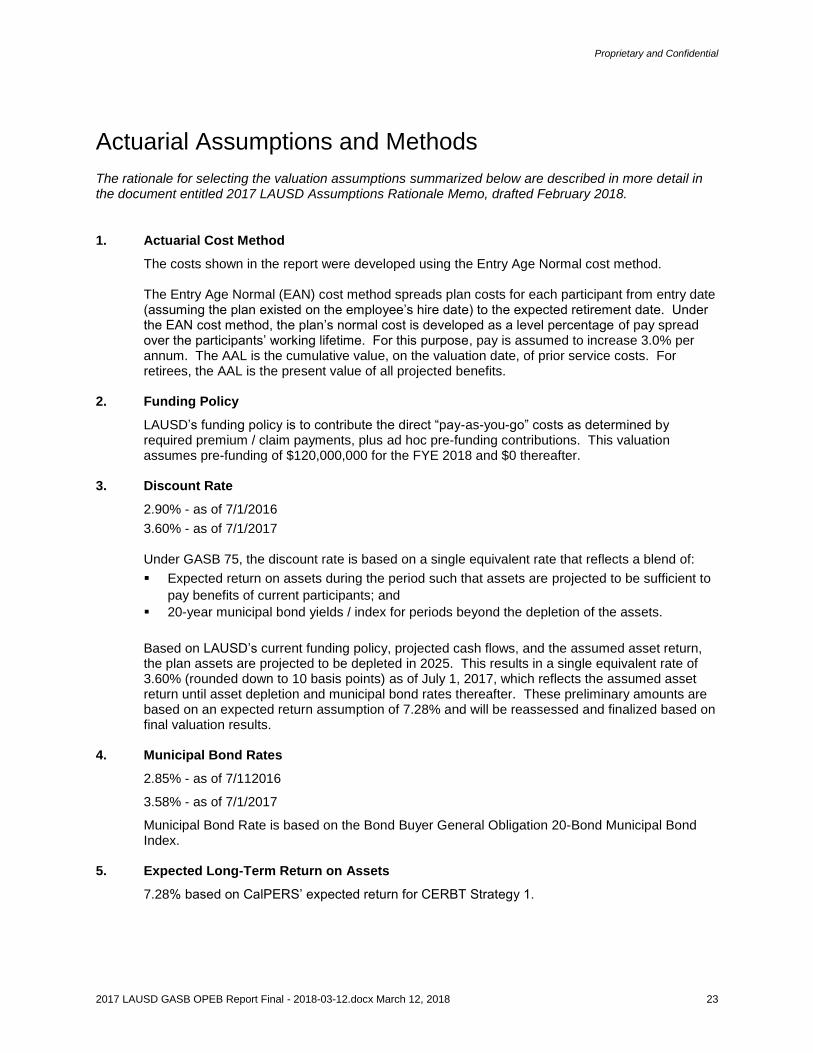
Actuarial Assumptions and Methods
The rationale for selecting the valuation assumptions summarized below are described in more detail in the document entitled 2017 LAUSD Assumptions Rationale Memo, drafted February 2018.
1. Actuarial Cost Method
The costs shown in the report were developed using the Entry Age Normal cost method. The Entry Age Normal (EAN) cost method spreads plan costs for each participant from entry date (assuming the plan existed on the employee’s hire date) to the expected retirement date. Under the EAN cost method, the plan’s normal cost is developed as a level percentage of pay spread over the participants’ working lifetime. For this purpose, pay is assumed to increase 3.0% per annum. The AAL is the cumulative value, on the valuation date, of prior service costs. For retirees, the AAL is the present value of all projected benefits.
2. Funding Policy
LAUSD’s funding policy is to contribute the direct “pay-as-you-go” costs as determined by required premium / claim payments, plus ad hoc pre-funding contributions. This valuation assumes pre-funding of $120,000,000 for the FYE 2018 and $0 thereafter.
3. Discount Rate
2.90% - as of 7/1/2016
3.60% - as of 7/1/2017 Under GASB 75, the discount rate is based on a single equivalent rate that reflects a blend of:
Expected return on assets during the period such that assets are projected to be sufficient to
pay benefits of current participants; and
20-year municipal bond yields / index for periods beyond the depletion of the assets.
Based on LAUSD’s current funding policy, projected cash flows, and the assumed asset return, the plan assets are projected to be depleted in 2025. This results in a single equivalent rate of 3.60% (rounded down to 10 basis points) as of July 1, 2017, which reflects the assumed asset return until asset depletion and municipal bond rates thereafter. These preliminary amounts are based on an expected return assumption of 7.28% and will be reassessed and finalized based on final valuation results.
4. Municipal Bond Rates
2.85% - as of 7/112016
3.58% - as of 7/1/2017
Municipal Bond Rate is based on the Bond Buyer General Obligation 20-Bond Municipal Bond Index.
5. Expected Long-Term Return on Assets
7.28% based on CalPERS’ expected return for CERBT Strategy 1.
Proprietary and Confidential
2017 LAUSD GASB OPEB Report Final - 2018-03-12.docx March 12, 2018 24
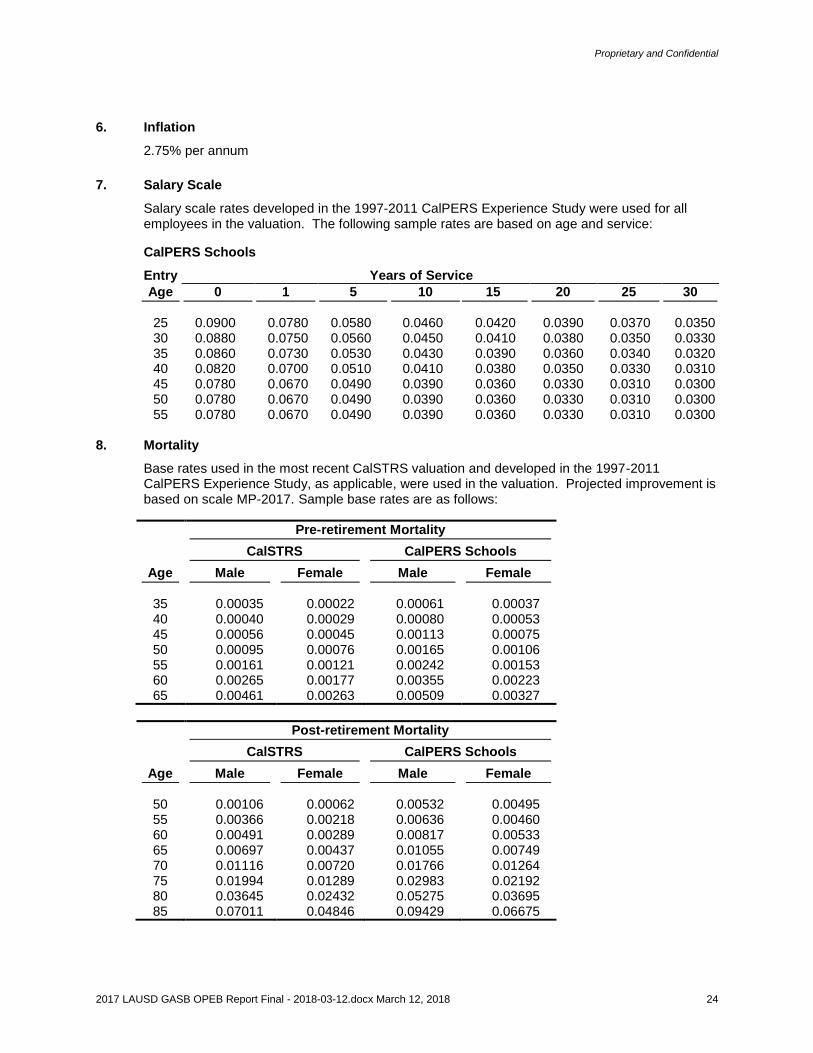
6. Inflation
2.75% per annum
7. Salary Scale
Salary scale rates developed in the 1997-2011 CalPERS Experience Study were used for all employees in the valuation. The following sample rates are based on age and service:
CalPERS Schools
Entry Years of Service
Age 0 1 5 10 15 20 25 30
25 0.0900 0.0780 0.0580 0.0460 0.0420 0.0390 0.0370 0.0350 30 0.0880 0.0750 0.0560 0.0450 0.0410 0.0380 0.0350 0.0330 35 0.0860 0.0730 0.0530 0.0430 0.0390 0.0360 0.0340 0.0320 40 0.0820 0.0700 0.0510 0.0410 0.0380 0.0350 0.0330 0.0310 45 0.0780 0.0670 0.0490 0.0390 0.0360 0.0330 0.0310 0.0300 50 0.0780 0.0670 0.0490 0.0390 0.0360 0.0330 0.0310 0.0300 55 0.0780 0.0670 0.0490 0.0390 0.0360 0.0330 0.0310 0.0300
8. Mortality
Base rates used in the most recent CalSTRS valuation and developed in the 1997-2011 CalPERS Experience Study, as applicable, were used in the valuation. Projected improvement is based on scale MP-2017. Sample base rates are as follows:
Pre-retirement Mortality
CalSTRS CalPERS Schools
Age Male Female Male Female
35 0.00035 0.00022 0.00061 0.00037 40 0.00040 0.00029 0.00080 0.00053 45 0.00056 0.00045 0.00113 0.00075 50 0.00095 0.00076 0.00165 0.00106 55 0.00161 0.00121 0.00242 0.00153 60 0.00265 0.00177 0.00355 0.00223 65 0.00461 0.00263 0.00509 0.00327
Post-retirement Mortality
CalSTRS CalPERS Schools
Age Male Female Male Female
50 0.00106 0.00062 0.00532 0.00495 55 0.00366 0.00218 0.00636 0.00460 60 0.00491 0.00289 0.00817 0.00533 65 0.00697 0.00437 0.01055 0.00749 70 0.01116 0.00720 0.01766 0.01264 75 0.01994 0.01289 0.02983 0.02192 80 0.03645 0.02432 0.05275 0.03695 85 0.07011 0.04846 0.09429 0.06675
Proprietary and Confidential
2017 LAUSD GASB OPEB Report Final - 2018-03-12.docx March 12, 2018 25
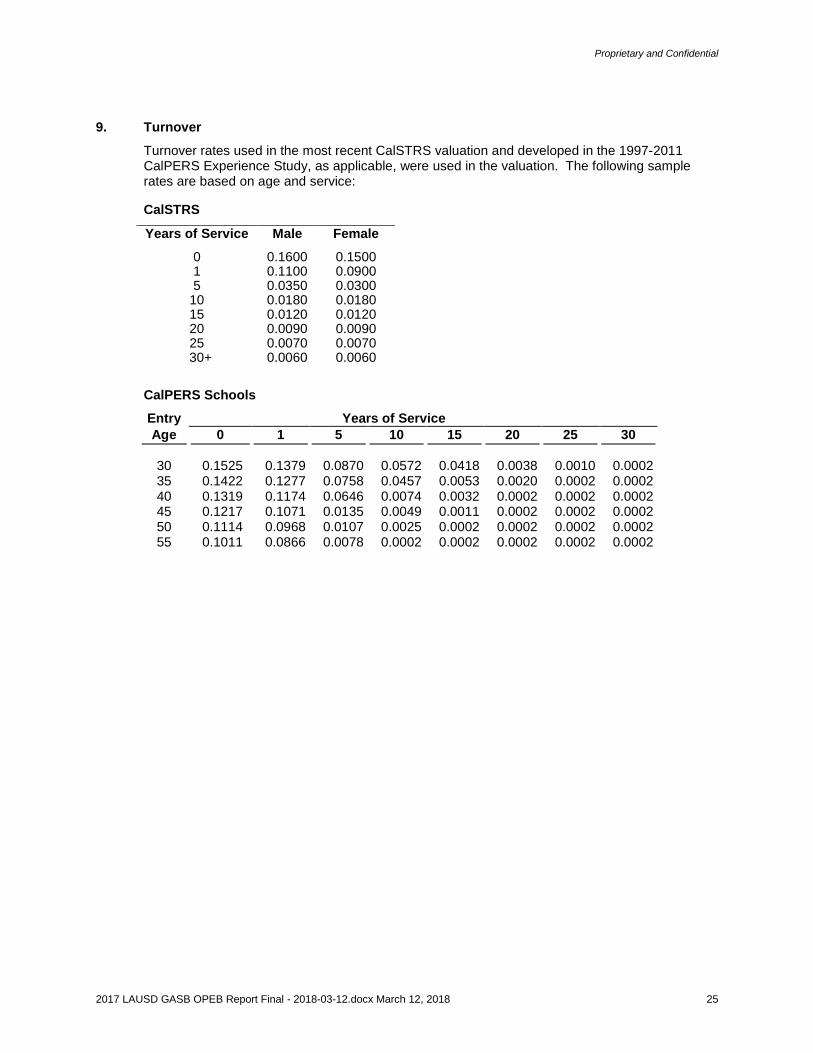
9. Turnover
Turnover rates used in the most recent CalSTRS valuation and developed in the 1997-2011 CalPERS Experience Study, as applicable, were used in the valuation. The following sample rates are based on age and service:
CalSTRS
Years of Service Male Female
0 0.1600 0.1500 1 0.1100 0.0900 5 0.0350 0.0300
10 0.0180 0.0180 15 0.0120 0.0120 20 0.0090 0.0090 25 0.0070 0.0070
30+ 0.0060 0.0060
CalPERS Schools
Entry Years of Service
Age 0 1 5 10 15 20 25 30
30 0.1525 0.1379 0.0870 0.0572 0.0418 0.0038 0.0010 0.0002 35 0.1422 0.1277 0.0758 0.0457 0.0053 0.0020 0.0002 0.0002 40 0.1319 0.1174 0.0646 0.0074 0.0032 0.0002 0.0002 0.0002 45 0.1217 0.1071 0.0135 0.0049 0.0011 0.0002 0.0002 0.0002 50 0.1114 0.0968 0.0107 0.0025 0.0002 0.0002 0.0002 0.0002 55 0.1011 0.0866 0.0078 0.0002 0.0002 0.0002 0.0002 0.0002
Proprietary and Confidential
2017 LAUSD GASB OPEB Report Final - 2018-03-12.docx March 12, 2018 26
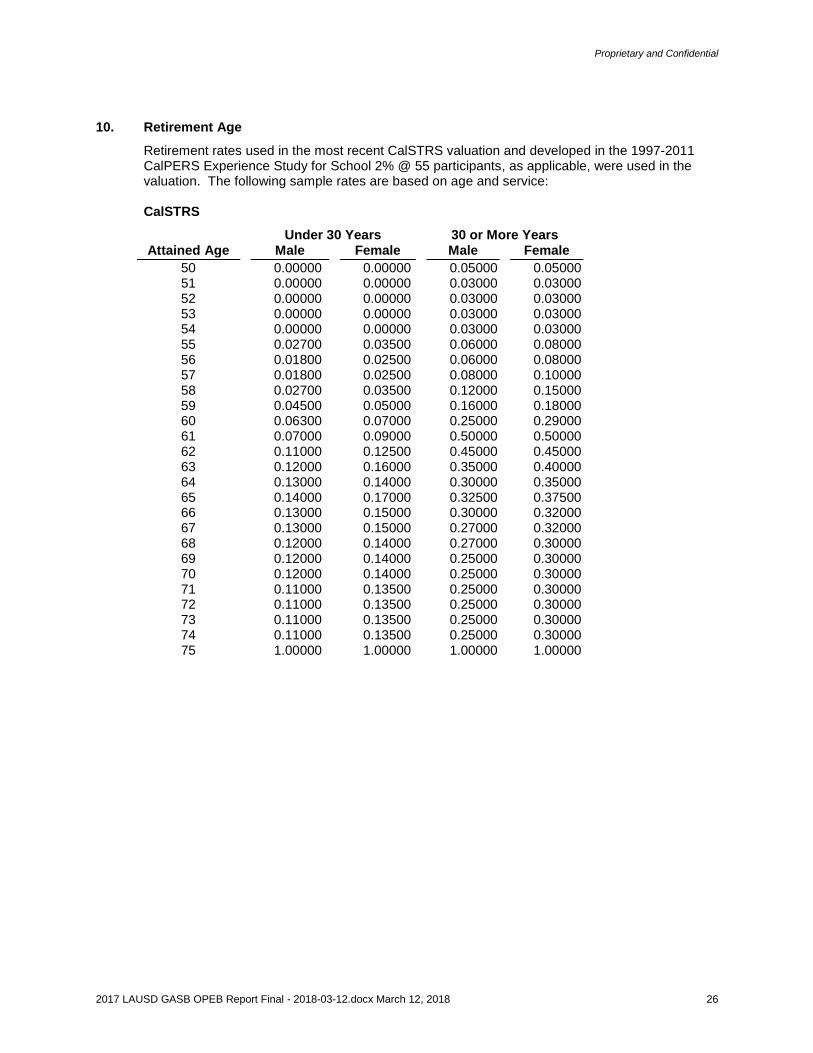
10. Retirement Age
Retirement rates used in the most recent CalSTRS valuation and developed in the 1997-2011 CalPERS Experience Study for School 2% @ 55 participants, as applicable, were used in the valuation. The following sample rates are based on age and service: CalSTRS
Under 30 Years 30 or More Years Attained Age Male Female Male Female
50 0.00000 0.00000 0.05000 0.05000 51 0.00000 0.00000 0.03000 0.03000 52 0.00000 0.00000 0.03000 0.03000 53 0.00000 0.00000 0.03000 0.03000 54 0.00000 0.00000 0.03000 0.03000 55 0.02700 0.03500 0.06000 0.08000 56 0.01800 0.02500 0.06000 0.08000 57 0.01800 0.02500 0.08000 0.10000 58 0.02700 0.03500 0.12000 0.15000 59 0.04500 0.05000 0.16000 0.18000 60 0.06300 0.07000 0.25000 0.29000 61 0.07000 0.09000 0.50000 0.50000 62 0.11000 0.12500 0.45000 0.45000 63 0.12000 0.16000 0.35000 0.40000 64 0.13000 0.14000 0.30000 0.35000 65 0.14000 0.17000 0.32500 0.37500 66 0.13000 0.15000 0.30000 0.32000 67 0.13000 0.15000 0.27000 0.32000 68 0.12000 0.14000 0.27000 0.30000 69 0.12000 0.14000 0.25000 0.30000 70 0.12000 0.14000 0.25000 0.30000 71 0.11000 0.13500 0.25000 0.30000 72 0.11000 0.13500 0.25000 0.30000 73 0.11000 0.13500 0.25000 0.30000 74 0.11000 0.13500 0.25000 0.30000 75 1.00000 1.00000 1.00000 1.00000
Proprietary and Confidential
2017 LAUSD GASB OPEB Report Final - 2018-03-12.docx March 12, 2018 27
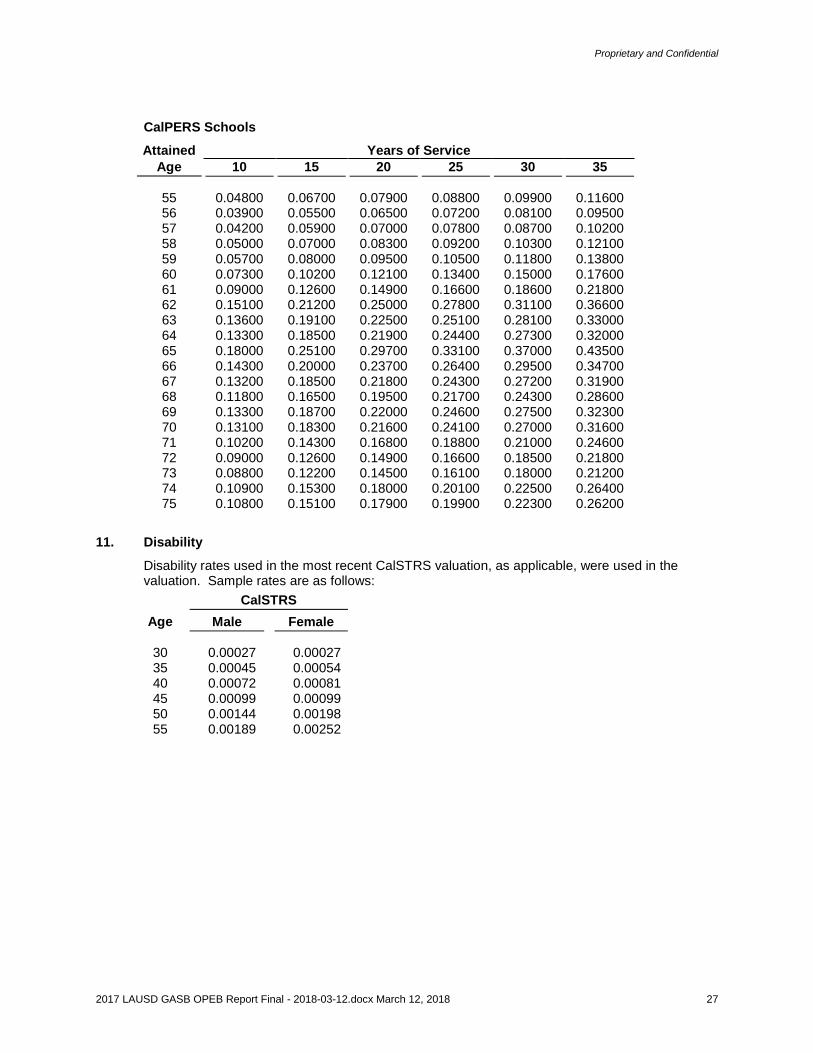
CalPERS Schools
Attained Years of Service
Age 10 15 20 25 30 35
55 0.04800 0.06700 0.07900 0.08800 0.09900 0.11600 56 0.03900 0.05500 0.06500 0.07200 0.08100 0.09500 57 0.04200 0.05900 0.07000 0.07800 0.08700 0.10200 58 0.05000 0.07000 0.08300 0.09200 0.10300 0.12100 59 0.05700 0.08000 0.09500 0.10500 0.11800 0.13800 60 0.07300 0.10200 0.12100 0.13400 0.15000 0.17600 61 0.09000 0.12600 0.14900 0.16600 0.18600 0.21800 62 0.15100 0.21200 0.25000 0.27800 0.31100 0.36600 63 0.13600 0.19100 0.22500 0.25100 0.28100 0.33000 64 0.13300 0.18500 0.21900 0.24400 0.27300 0.32000 65 0.18000 0.25100 0.29700 0.33100 0.37000 0.43500 66 0.14300 0.20000 0.23700 0.26400 0.29500 0.34700 67 0.13200 0.18500 0.21800 0.24300 0.27200 0.31900 68 0.11800 0.16500 0.19500 0.21700 0.24300 0.28600 69 0.13300 0.18700 0.22000 0.24600 0.27500 0.32300 70 0.13100 0.18300 0.21600 0.24100 0.27000 0.31600 71 0.10200 0.14300 0.16800 0.18800 0.21000 0.24600 72 0.09000 0.12600 0.14900 0.16600 0.18500 0.21800 73 0.08800 0.12200 0.14500 0.16100 0.18000 0.21200 74 0.10900 0.15300 0.18000 0.20100 0.22500 0.26400 75 0.10800 0.15100 0.17900 0.19900 0.22300 0.26200
11. Disability
Disability rates used in the most recent CalSTRS valuation, as applicable, were used in the valuation. Sample rates are as follows:
CalSTRS
Age Male Female
30 0.00027 0.00027 35 0.00045 0.00054 40 0.00072 0.00081 45 0.00099 0.00099 50 0.00144 0.00198 55 0.00189 0.00252
Proprietary and Confidential
2017 LAUSD GASB OPEB Report Final - 2018-03-12.docx March 12, 2018 28
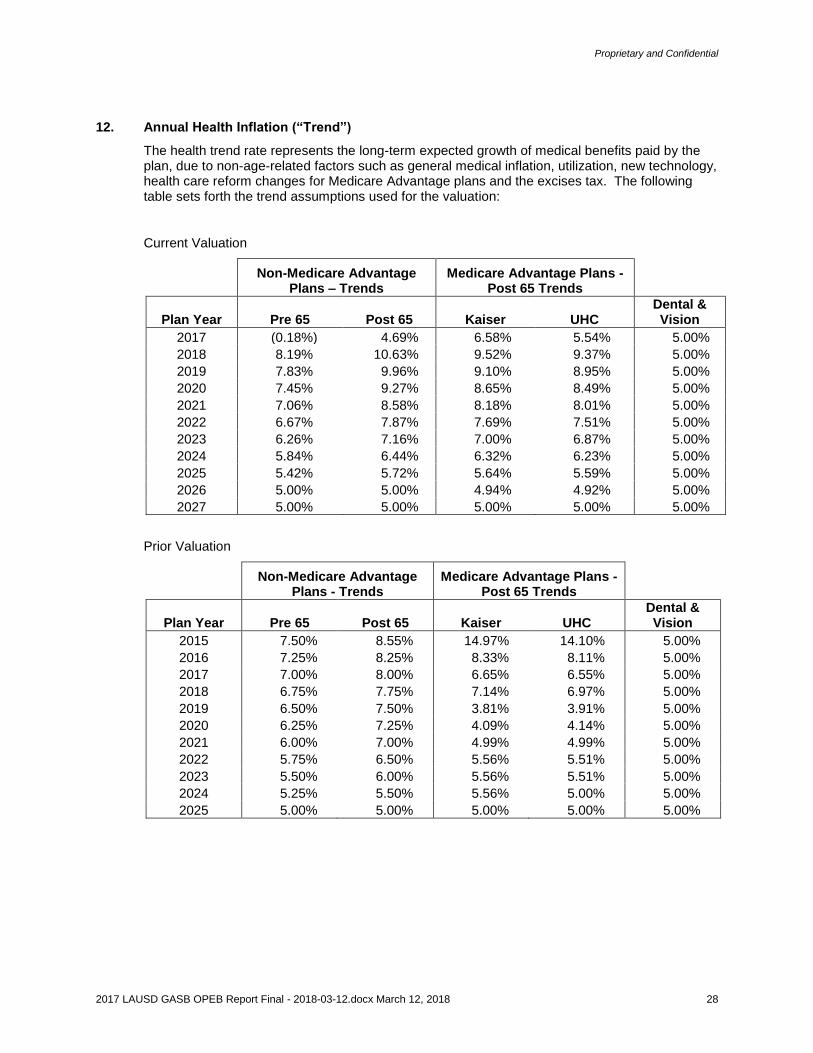
12. Annual Health Inflation (“Trend”)
The health trend rate represents the long-term expected growth of medical benefits paid by the plan, due to non-age-related factors such as general medical inflation, utilization, new technology, health care reform changes for Medicare Advantage plans and the excises tax. The following table sets forth the trend assumptions used for the valuation:
Current Valuation
Non-Medicare Advantage
Plans – Trends Medicare Advantage Plans -
Post 65 Trends
Plan Year Pre 65 Post 65 Kaiser UHC Dental & Vision
2017 (0.18%) 4.69% 6.58% 5.54% 5.00%
2018 8.19% 10.63% 9.52% 9.37% 5.00%
2019 7.83% 9.96% 9.10% 8.95% 5.00%
2020 7.45% 9.27% 8.65% 8.49% 5.00%
2021 7.06% 8.58% 8.18% 8.01% 5.00%
2022 6.67% 7.87% 7.69% 7.51% 5.00%
2023 6.26% 7.16% 7.00% 6.87% 5.00%
2024 5.84% 6.44% 6.32% 6.23% 5.00%
2025 5.42% 5.72% 5.64% 5.59% 5.00%
2026 5.00% 5.00% 4.94% 4.92% 5.00%
2027 5.00% 5.00% 5.00% 5.00% 5.00%
Prior Valuation
Non-Medicare Advantage
Plans - Trends Medicare Advantage Plans -
Post 65 Trends
Plan Year Pre 65 Post 65 Kaiser UHC Dental & Vision
2015 7.50% 8.55% 14.97% 14.10% 5.00%
2016 7.25% 8.25% 8.33% 8.11% 5.00%
2017 7.00% 8.00% 6.65% 6.55% 5.00%
2018 6.75% 7.75% 7.14% 6.97% 5.00%
2019 6.50% 7.50% 3.81% 3.91% 5.00%
2020 6.25% 7.25% 4.09% 4.14% 5.00%
2021 6.00% 7.00% 4.99% 4.99% 5.00%
2022 5.75% 6.50% 5.56% 5.51% 5.00%
2023 5.50% 6.00% 5.56% 5.51% 5.00%
2024 5.25% 5.50% 5.56% 5.00% 5.00%
2025 5.00% 5.00% 5.00% 5.00% 5.00%
Proprietary and Confidential
2017 LAUSD GASB OPEB Report Final - 2018-03-12.docx March 12, 2018 29
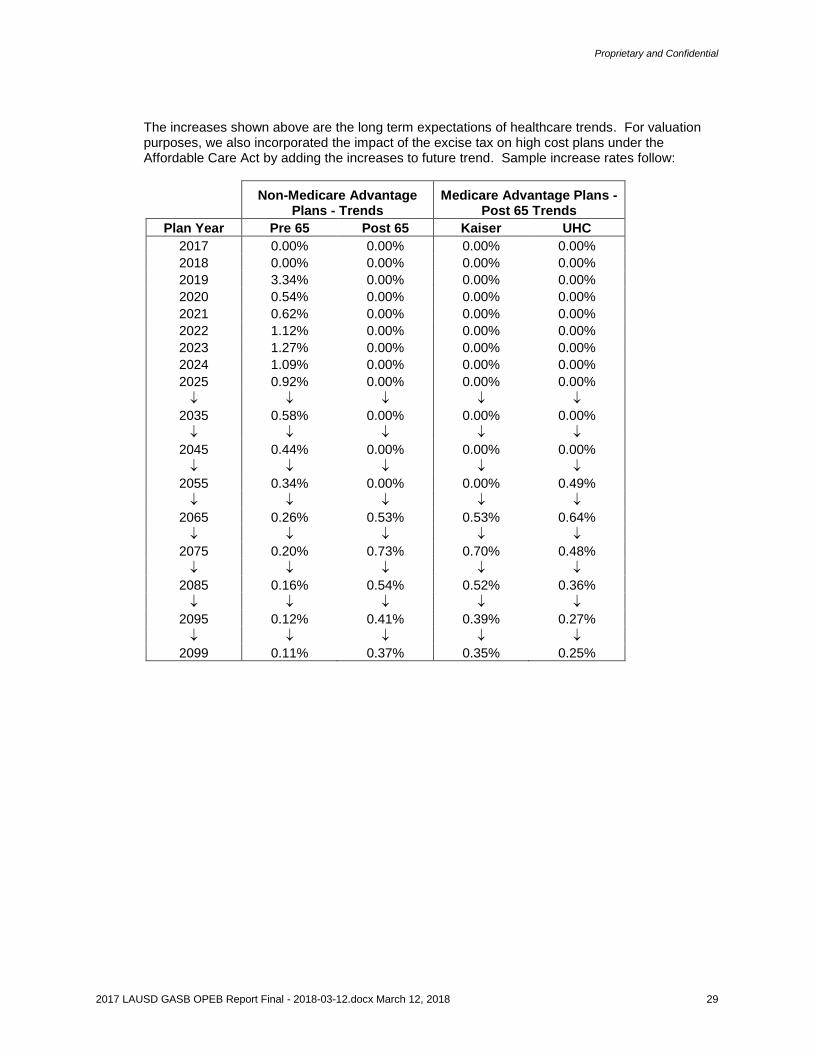
The increases shown above are the long term expectations of healthcare trends. For valuation purposes, we also incorporated the impact of the excise tax on high cost plans under the Affordable Care Act by adding the increases to future trend. Sample increase rates follow:
Non-Medicare Advantage
Plans - Trends Medicare Advantage Plans -
Post 65 Trends
Plan Year Pre 65 Post 65 Kaiser UHC
2017 0.00% 0.00% 0.00% 0.00%
2018 0.00% 0.00% 0.00% 0.00%
2019 3.34% 0.00% 0.00% 0.00%
2020 0.54% 0.00% 0.00% 0.00%
2021 0.62% 0.00% 0.00% 0.00%
2022 1.12% 0.00% 0.00% 0.00%
2023 1.27% 0.00% 0.00% 0.00%
2024 1.09% 0.00% 0.00% 0.00%
2025 0.92% 0.00% 0.00% 0.00%
2035 0.58% 0.00% 0.00% 0.00%
2045 0.44% 0.00% 0.00% 0.00%
2055 0.34% 0.00% 0.00% 0.49%
2065 0.26% 0.53% 0.53% 0.64%
2075 0.20% 0.73% 0.70% 0.48%
2085 0.16% 0.54% 0.52% 0.36%
2095 0.12% 0.41% 0.39% 0.27%
2099 0.11% 0.37% 0.35% 0.25%
Proprietary and Confidential
2017 LAUSD GASB OPEB Report Final - 2018-03-12.docx March 12, 2018 30
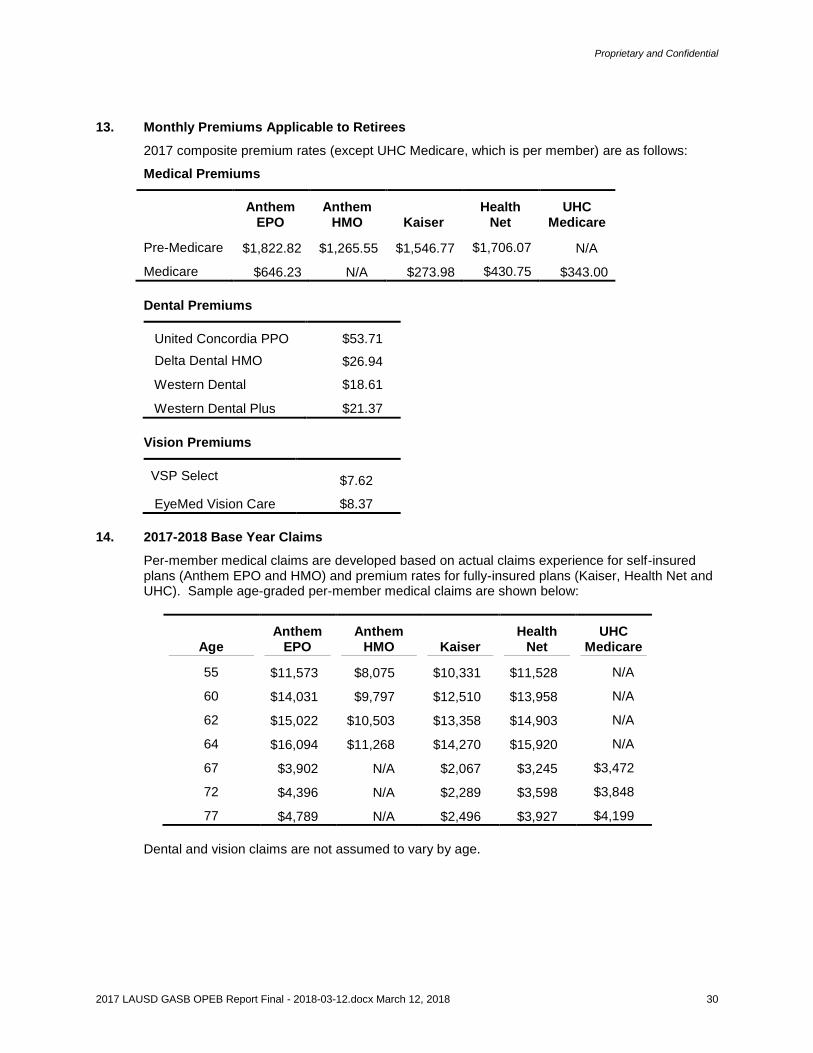
13. Monthly Premiums Applicable to Retirees
2017 composite premium rates (except UHC Medicare, which is per member) are as follows:
Medical Premiums
Anthem
EPO Anthem
HMO Kaiser Health
Net UHC
Medicare
Pre-Medicare $1,822.82 $1,265.55 $1,546.77 $1,706.07 N/A
Medicare $646.23 N/A $273.98 $430.75 $343.00
Dental Premiums
United Concordia PPO $53.71
Delta Dental HMO $26.94
Western Dental $18.61
Western Dental Plus $21.37
Vision Premiums
VSP Select $7.62
EyeMed Vision Care $8.37
14. 2017-2018 Base Year Claims
Per-member medical claims are developed based on actual claims experience for self-insured plans (Anthem EPO and HMO) and premium rates for fully-insured plans (Kaiser, Health Net and UHC). Sample age-graded per-member medical claims are shown below:
Age Anthem
EPO Anthem
HMO Kaiser Health
Net UHC
Medicare
55 $11,573 $8,075 $10,331 $11,528 N/A
60 $14,031 $9,797 $12,510 $13,958 N/A
62 $15,022 $10,503 $13,358 $14,903 N/A
64 $16,094 $11,268 $14,270 $15,920 N/A
67 $3,902 N/A $2,067 $3,245 $3,472
72 $4,396 N/A $2,289 $3,598 $3,848
77 $4,789 N/A $2,496 $3,927 $4,199
Dental and vision claims are not assumed to vary by age.
Proprietary and Confidential
2017 LAUSD GASB OPEB Report Final - 2018-03-12.docx March 12, 2018 31
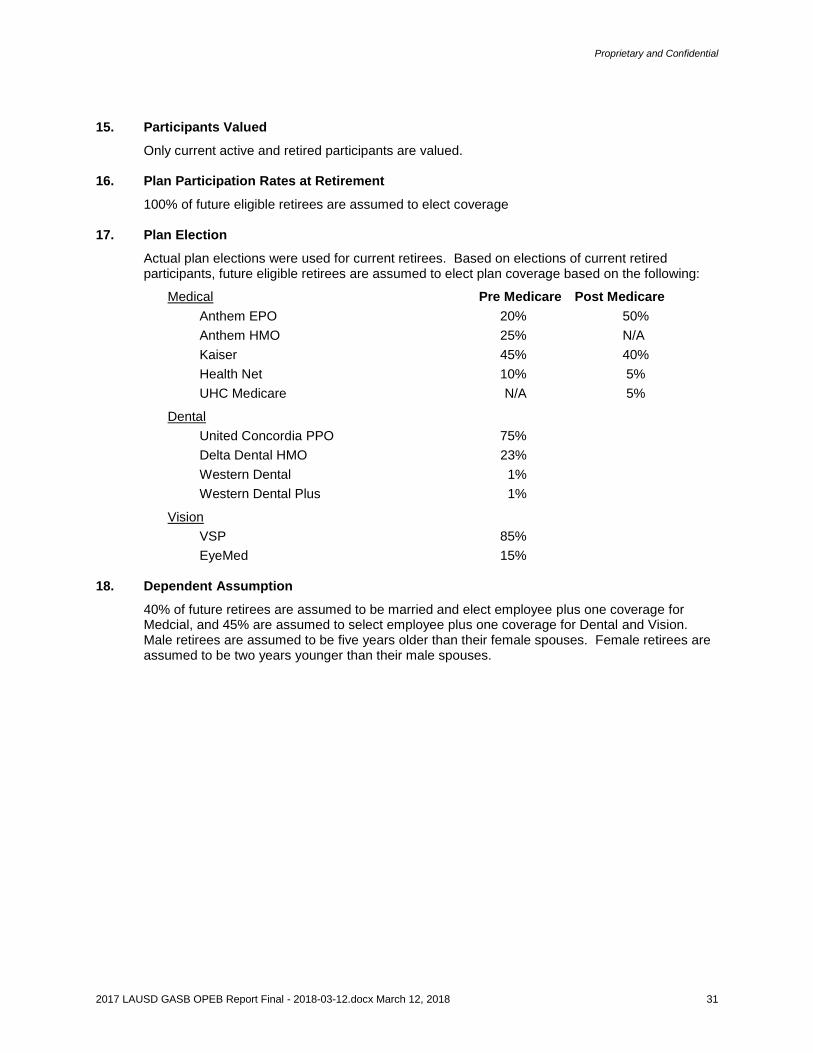
15. Participants Valued
Only current active and retired participants are valued.
16. Plan Participation Rates at Retirement
100% of future eligible retirees are assumed to elect coverage 17. Plan Election
Actual plan elections were used for current retirees. Based on elections of current retired participants, future eligible retirees are assumed to elect plan coverage based on the following:
Medical Pre Medicare Post Medicare
Anthem EPO 20% 50%
Anthem HMO 25% N/A
Kaiser 45% 40%
Health Net 10% 5%
UHC Medicare N/A 5%
Dental
United Concordia PPO 75%
Delta Dental HMO 23%
Western Dental 1%
Western Dental Plus 1%
Vision
VSP 85%
EyeMed 15%
18. Dependent Assumption
40% of future retirees are assumed to be married and elect employee plus one coverage for Medcial, and 45% are assumed to select employee plus one coverage for Dental and Vision. Male retirees are assumed to be five years older than their female spouses. Female retirees are assumed to be two years younger than their male spouses.
Proprietary and Confidential
2017 LAUSD GASB OPEB Report Final - 2018-03-12.docx March 12, 2018 32
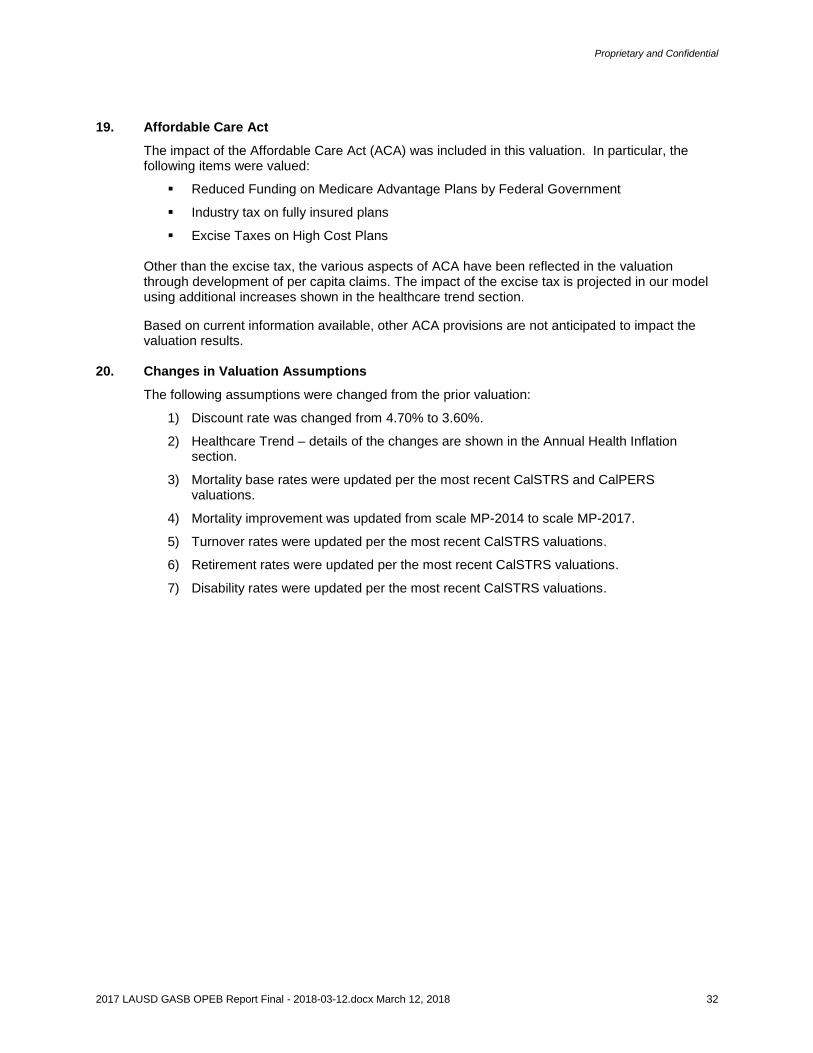
19. Affordable Care Act
The impact of the Affordable Care Act (ACA) was included in this valuation. In particular, the following items were valued:
Reduced Funding on Medicare Advantage Plans by Federal Government
Industry tax on fully insured plans
Excise Taxes on High Cost Plans
Other than the excise tax, the various aspects of ACA have been reflected in the valuation through development of per capita claims. The impact of the excise tax is projected in our model using additional increases shown in the healthcare trend section.
Based on current information available, other ACA provisions are not anticipated to impact the valuation results.
20. Changes in Valuation Assumptions
The following assumptions were changed from the prior valuation:
1) Discount rate was changed from 4.70% to 3.60%.
2) Healthcare Trend – details of the changes are shown in the Annual Health Inflation section.
3) Mortality base rates were updated per the most recent CalSTRS and CalPERS valuations.
4) Mortality improvement was updated from scale MP-2014 to scale MP-2017.
5) Turnover rates were updated per the most recent CalSTRS valuations.
6) Retirement rates were updated per the most recent CalSTRS valuations.
7) Disability rates were updated per the most recent CalSTRS valuations.
Proprietary and Confidential
2017 LAUSD GASB OPEB Report Final - 2018-03-12.docx March 12, 2018 33
Appendix
Proprietary and Confidential
2017 LAUSD GASB OPEB Report Final - 2018-03-12.docx March 12, 2018 34
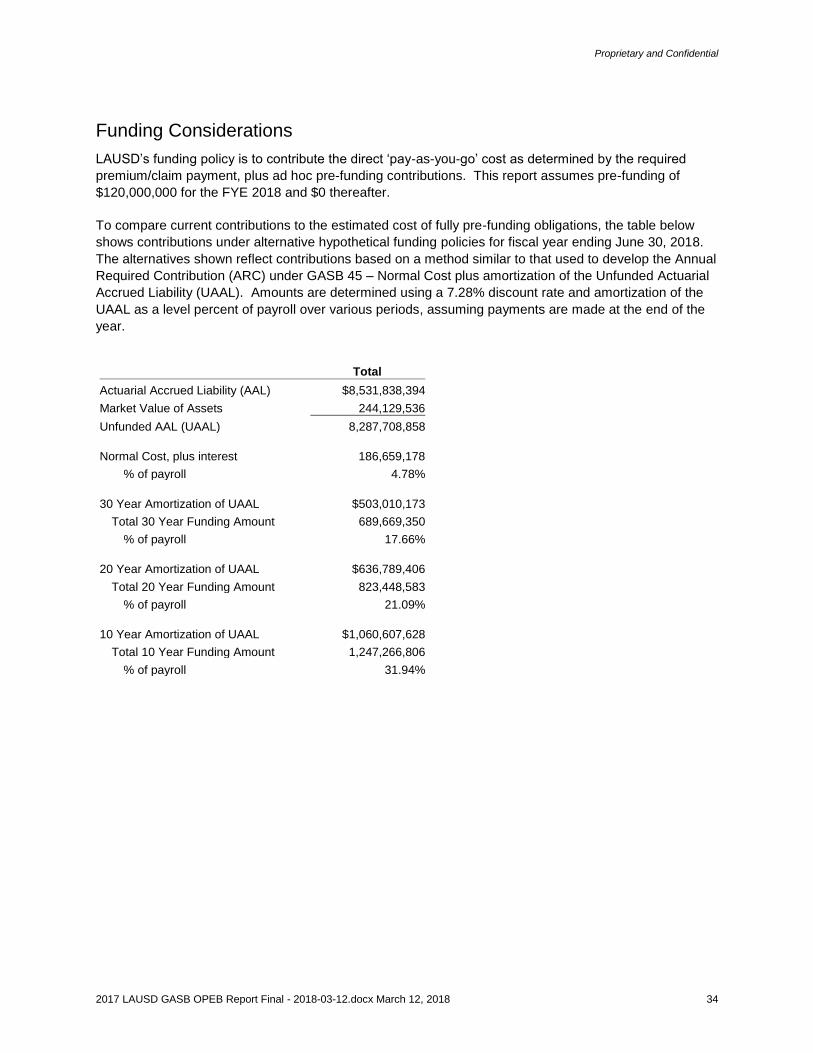
Funding Considerations
LAUSD’s funding policy is to contribute the direct ‘pay-as-you-go’ cost as determined by the required
premium/claim payment, plus ad hoc pre-funding contributions. This report assumes pre-funding of
$120,000,000 for the FYE 2018 and $0 thereafter.
To compare current contributions to the estimated cost of fully pre-funding obligations, the table below
shows contributions under alternative hypothetical funding policies for fiscal year ending June 30, 2018.
The alternatives shown reflect contributions based on a method similar to that used to develop the Annual
Required Contribution (ARC) under GASB 45 – Normal Cost plus amortization of the Unfunded Actuarial
Accrued Liability (UAAL). Amounts are determined using a 7.28% discount rate and amortization of the
UAAL as a level percent of payroll over various periods, assuming payments are made at the end of the
year.
Total
Actuarial Accrued Liability (AAL) $8,531,838,394
Market Value of Assets 244,129,536
Unfunded AAL (UAAL) 8,287,708,858
Normal Cost, plus interest 186,659,178
% of payroll 4.78%
30 Year Amortization of UAAL $503,010,173
Total 30 Year Funding Amount 689,669,350
% of payroll 17.66%
20 Year Amortization of UAAL $636,789,406
Total 20 Year Funding Amount 823,448,583
% of payroll 21.09%
10 Year Amortization of UAAL $1,060,607,628
Total 10 Year Funding Amount 1,247,266,806
% of payroll 31.94%
Proprietary and Confidential
2017 LAUSD GASB OPEB Report Final - 2018-03-12.docx March 12, 2018 35
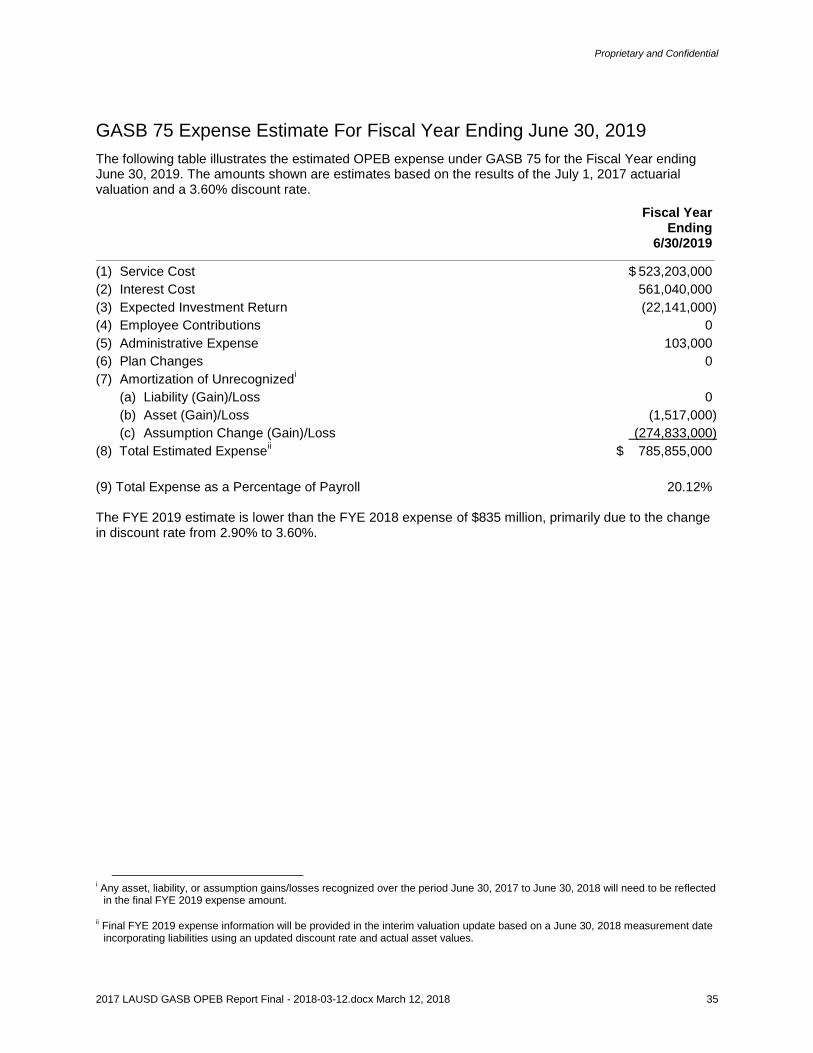
GASB 75 Expense Estimate For Fiscal Year Ending June 30, 2019
The following table illustrates the estimated OPEB expense under GASB 75 for the Fiscal Year ending June 30, 2019. The amounts shown are estimates based on the results of the July 1, 2017 actuarial valuation and a 3.60% discount rate.
Fiscal Year Ending 6/30/2019
(1) Service Cost $ 523,203,000
(2) Interest Cost 561,040,000
(3) Expected Investment Return (22,141,000)
(4) Employee Contributions 0
(5) Administrative Expense 103,000
(6) Plan Changes 0
(7) Amortization of Unrecognizedi
(a) Liability (Gain)/Loss 0
(b) Asset (Gain)/Loss (1,517,000)
(c) Assumption Change (Gain)/Loss (274,833,000)
(8) Total Estimated Expenseii $ 785,855,000
(9) Total Expense as a Percentage of Payroll 20.12% The FYE 2019 estimate is lower than the FYE 2018 expense of $835 million, primarily due to the change in discount rate from 2.90% to 3.60%.
i Any asset, liability, or assumption gains/losses recognized over the period June 30, 2017 to June 30, 2018 will need to be reflected
in the final FYE 2019 expense amount.
ii Final FYE 2019 expense information will be provided in the interim valuation update based on a June 30, 2018 measurement date incorporating liabilities using an updated discount rate and actual asset values.