actuator-line cfd modelling of tidal-stream turbines in arrays · b david d. apsley...
TRANSCRIPT
Journal of Ocean Engineering and Marine Energy (2018) 4:259–271https://doi.org/10.1007/s40722-018-0120-3
RESEARCH ART ICLE
Actuator-line CFDmodelling of tidal-stream turbines in arrays
David D. Apsley1 · Tim Stallard1 · Peter K. Stansby1
Received: 27 February 2018 / Accepted: 3 September 2018 / Published online: 9 October 2018© The Author(s) 2018
AbstractCFD modelling of tidal turbines in arrays is described and assessed against experimental studies of turbines operating eitherat constant speed or constant torque. Rotor blades are represented by rotating actuator lines, whilst supports are representedby partially-blocked-out cells. For a single turbine the model successfully reproduces towing-tank measurements of thrustand power coefficients across a range of tip-speed ratios. For two turbines staggered streamwise, it is demonstrated that loadsmay be reduced or augmented, according as the downstream turbine is in the wake or bypass flow of the upstream turbine.When the downstream turbine is partially in the wake, individual blades are subject to large cyclic load fluctuations. Arrayperformance is evaluated by comparison with experimental data, modelling up to 12 turbines in up to three staggered rows.The speed of each turbine is continuously adjusted in response to flow-induced torque. Distribution of thrust coefficientswithin the array is well reproduced, but there is greater discrepancy in angular speed. With actuator representation of blades,the choice of turbulence model has little effect on load coefficients for an isolated turbine or row of turbines, but a significanteffect on the wake, and hence on downstream turbines in an array.
Keywords Tidal-stream turbines · CFD · Actuator-line methods · Turbine arrays
1 Introduction
Tidal energy represents a promising, yet largely under-exploited, source of renewable energy, offering high energydensity and predictable generating periods. Public oppositionto the expense and unknown environmental consequencesof large barrages have led to consideration of tidal-streamdevices—predominantly axial-flow turbines—which aim toextract the kinetic energy of a tidal current rather than thepotential energy built up by impounding water. In numeroussites around the world, narrow straits lead to tidal currents inexcess of 2.5 m s−1, where tidal-stream energy is expectedto become commercially viable (Black and Veatch 2005).A large number of demonstration devices have been testedat the EMEC site in the Orkney Isles and the FORCE site inNova Scotia’s Bay of Fundy, whilst grid-connected arrays areunder construction in the Pentland Firth off Scotland (Mey-Gen) and Raz Blanchard off Normandy (Alstom/GDF Suezand OpenHydro/EDF).
B David D. [email protected]
1 University of Manchester, Sackville St.,Manchester M13 9PL, UK
Unsurprisingly, given the cost of designing and testingradically new devices, tidal-stream technology is stronglyinfluenced by the more mature technology of wind power.Most devices are of the three-bladed, horizontal-axis type.Marine turbines, however, face many additional challengesnot relevant to wind power; for example: the need for muchmore substantial blades, nacelle and support; ability to deployin a short time window; difficulty of access for maintenance;bio-fouling; marine debris; cavitation; fluctuating loads dueto site-specific turbulence; velocity shear and waves.
Small-scale laboratory studies have been conducted intowing tanks and flumes (Bahaj et al. 2007; Stallard et al.2013; Olczak et al. 2016), but these can cover only a lim-ited range of operating conditions and are subject to scaleeffects. Theoretical studies include the wind-turbine-derivedblade-element-momentum theory (BEMT) and, increasingly,computational fluid dynamics (CFD). CFD has been used toundertake geometry-resolved simulations of real devices inboth low-turbulent flow (McNaughton et al. 2014) and real-istic site turbulence and velocity shear (Afgan et al. 2013;Ahmed et al. 2017). However, it is computationally imprac-tical to represent accurately both near-blade and wake fieldsfor multiple devices simultaneously and for a representativeset of operating conditions including turbulence and waves.
123
260 Journal of Ocean Engineering and Marine Energy (2018) 4:259–271
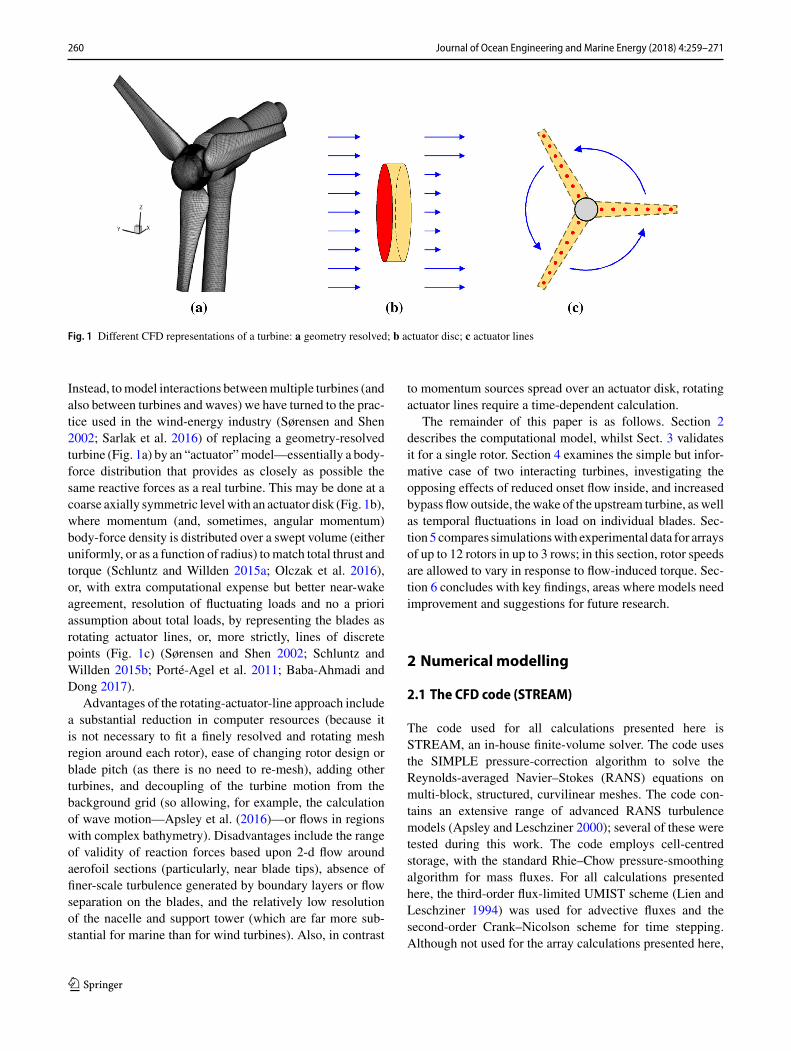
Fig. 1 Different CFD representations of a turbine: a geometry resolved; b actuator disc; c actuator lines
Instead, tomodel interactions betweenmultiple turbines (andalso between turbines and waves) we have turned to the prac-tice used in the wind-energy industry (Sørensen and Shen2002; Sarlak et al. 2016) of replacing a geometry-resolvedturbine (Fig. 1a) by an “actuator”model—essentially a body-force distribution that provides as closely as possible thesame reactive forces as a real turbine. This may be done at acoarse axially symmetric levelwith an actuator disk (Fig. 1b),where momentum (and, sometimes, angular momentum)body-force density is distributed over a swept volume (eitheruniformly, or as a function of radius) tomatch total thrust andtorque (Schluntz and Willden 2015a; Olczak et al. 2016),or, with extra computational expense but better near-wakeagreement, resolution of fluctuating loads and no a prioriassumption about total loads, by representing the blades asrotating actuator lines, or, more strictly, lines of discretepoints (Fig. 1c) (Sørensen and Shen 2002; Schluntz andWillden 2015b; Porté-Agel et al. 2011; Baba-Ahmadi andDong 2017).
Advantages of the rotating-actuator-line approach includea substantial reduction in computer resources (because itis not necessary to fit a finely resolved and rotating meshregion around each rotor), ease of changing rotor design orblade pitch (as there is no need to re-mesh), adding otherturbines, and decoupling of the turbine motion from thebackground grid (so allowing, for example, the calculationof wave motion—Apsley et al. (2016)—or flows in regionswith complex bathymetry). Disadvantages include the rangeof validity of reaction forces based upon 2-d flow aroundaerofoil sections (particularly, near blade tips), absence offiner-scale turbulence generated by boundary layers or flowseparation on the blades, and the relatively low resolutionof the nacelle and support tower (which are far more sub-stantial for marine than for wind turbines). Also, in contrast
to momentum sources spread over an actuator disk, rotatingactuator lines require a time-dependent calculation.
The remainder of this paper is as follows. Section 2describes the computational model, whilst Sect. 3 validatesit for a single rotor. Section 4 examines the simple but infor-mative case of two interacting turbines, investigating theopposing effects of reduced onset flow inside, and increasedbypass flowoutside, thewake of the upstream turbine, aswellas temporal fluctuations in load on individual blades. Sec-tion5 compares simulationswith experimental data for arraysof up to 12 rotors in up to 3 rows; in this section, rotor speedsare allowed to vary in response to flow-induced torque. Sec-tion 6 concludes with key findings, areas where models needimprovement and suggestions for future research.
2 Numerical modelling
2.1 The CFD code (STREAM)
The code used for all calculations presented here isSTREAM, an in-house finite-volume solver. The code usesthe SIMPLE pressure-correction algorithm to solve theReynolds-averaged Navier–Stokes (RANS) equations onmulti-block, structured, curvilinear meshes. The code con-tains an extensive range of advanced RANS turbulencemodels (Apsley and Leschziner 2000); several of these weretested during this work. The code employs cell-centredstorage, with the standard Rhie–Chow pressure-smoothingalgorithm for mass fluxes. For all calculations presentedhere, the third-order flux-limited UMIST scheme (Lien andLeschziner 1994) was used for advective fluxes and thesecond-order Crank–Nicolson scheme for time stepping.Although not used for the array calculations presented here,
123

Journal of Ocean Engineering and Marine Energy (2018) 4:259–271 261
STREAM has the capacity (Apsley and Hu 2003) to usea moving-mesh, surface-fitting approach at the free sur-face rather than the volume-of-fluid (VOF) method whichis prevalent in general-purpose commercial codes; the free-surface capability is currently being used to investigateturbine performance in waves (Apsley et al. 2016).
MPI parallelisation is by blockwise domain decomposi-tion. All calculations presented herewere runwith up to eightcores, either on a desktop PC or the Computational SharedFacility (CSF) at the University of Manchester.
2.2 Rotor representation
Drawing on the actuator-line model of Sørensen and Shen(2002), with more recent guidance on parameters by Sarlaket al. (2016), the turbine rotor is replaced by rotating linesof actuator points (Fig. 1c). The body forces associated withthese are derived from 2-d aerofoil theory, selected for thepredefined blade geometry (shape, chord and blade angle) ateach radial distance and the local approach-flow velocity.
At the start of each time step, the lines of points represent-ing each blade are rotated to a new angle using the currentangular velocity. For computational efficiency, the cell indexof each actuator point within the computational mesh is iden-tified and stored in memory at this instant, as are the set ofnon-zero transferweighting functions between actuator pointand the relatively small number of local cells affected byit—see Eq. (2). (The cell-search process would have to berepeated if the background mesh changed within a time step,for example if stretching due to wave motion was extendedthrough the whole water column.)
At each inner iteration (cycle of the SIMPLE algorithm)the local approach-flow velocity Ua at an actuator point iscombined with the instantaneous blade velocity (�r tangen-tially) and projected onto the plane perpendicular to the bladeto determine the relative velocity Urel. For predefined twistangle β(r), this determines angle of attack α and, thence,using chord c(r) and prescribed blade section lift and dragcoefficientsCL(α,r) andCD(α,r), an actuator force for radiallength �r of
Fp � 1
2ρU 2
rel(c�r )(CDeD + CLeL), (1)
where eD and eL are unit vectors along and normal to thelocal relative velocity Urel in this blade section (Fig. 2).
“Approach-flow velocity” Ua is not straightforward toestablish, since taking the fluid-velocity part by interpolationto the actuator point in the CFD simulation involves using avalue that is itself within the volume affected by the actuatorbody forces. Physically, the flow is distorted by local circu-lation associated with blade lift and to loss of momentumflux by drag. An attempt to incorporate the local circulation
uax
urel
u + ray
D
L
F
Fig. 2 Forces on a blade section
was made by Schluntz and Willden (2015b), who sampleda triplet of surrounding points on the assumption that theflow is adequately described by approach flow plus circularvortex; however, their modification has not been made here.Note, however, that for large TSR, the approach velocity tothe blade element in its own reference frame is dominatedby the motion of the blade itself, which does not rely oninterpolation within the flow field.
Each isolated point force Fp is distributed over a widervolume of scale σ as a force density:
f(x) � Fpe−(x−xp)2/σ 2
σ 3π3/2 , (2)
where x is cell centre and xp an actuator point. This is mul-tiplied by cell volume to produce the body force for thatcell. As weighting factors are evaluated at the cell centre,a small amount of rescaling is needed to ensure that thesesum to 1.0. f falls to 1% of its maximum at 2.1σ ; in thiswork, the search for influence is cut off at 2.5σ . Sarlak et al.(2016) provide guidance on σ. Here, a value of roughly twotimes the local cell size (V1/3, where V is cell volume) wasused. Numerical experiment showed that 30 equally spacedactuator points along each blade was sufficient to obtainnumber-independent results.
Lookup tables are created to interpolate for chord c(r),blade angle β(r) and lift and drag coefficients CL(α,r) andCD(α,r). Manufacturers’ data prescribe the first two. Whereexperimentally derived aerofoil data are not available, wehave used data from XFoil simulations to determine forcecoefficients. In principle, particularly at laboratory scale, CL
andCD have aweak dependence onReynolds number, whichchanges with local flow speed, but this has not been consid-ered here and the lookup tables use values based on a typicalchord-based Reynolds number for each case.
At blade ends, flow leaks around the tips from the high-pressure side to the suction side, reducing pressure differenceand loads, as well as creating tip vortices. Because they haveno directmeans of reacting to this pressure difference, BEMT
123
262 Journal of Ocean Engineering and Marine Energy (2018) 4:259–271
calculations often use tip-correction factors to reduce dragand lift forces. However, in common with blade-resolvingCFD, actuator-line approaches do see the pressure changesin response to the reaction forces and any radial componentof velocity is removed by projection when evaluating actua-tor forces. We believe that this makes explicit tip correctionsunnecessary; they have not been used in the simulations pre-sented here and the agreement with experiment for a singlerotor (Sect. 3) is better without them.
Time-step-dependence tests for a single rotor yielded a(conservative) �t �T rot/250, where T rot is the turbine rota-tion period, which varies with tip-speed ratio (TSR). Withthis value of �t, the distance swept by a rotor tip in one timestep (�R�t) was the same or smaller than the grid spacingin the vicinity of the rotor.
2.3 Nacelle and support-structure representation
The nacelle and support structure for tidal-stream turbinesare far more substantial than their wind-turbine counterparts.Ignoring a nacellewould fail to incorporate its blocking effectand provide a low-resistance route for streamlines to bypassthe actuators representing the blades. Ignoring the supportmast eliminates the fluctuating load on individual blades asthey pass in front of it. However, creating a grid that com-pletely resolves and aligns with the non-rotor structures runscounter to the desire to decouple the turbine from a simplebackground grid.
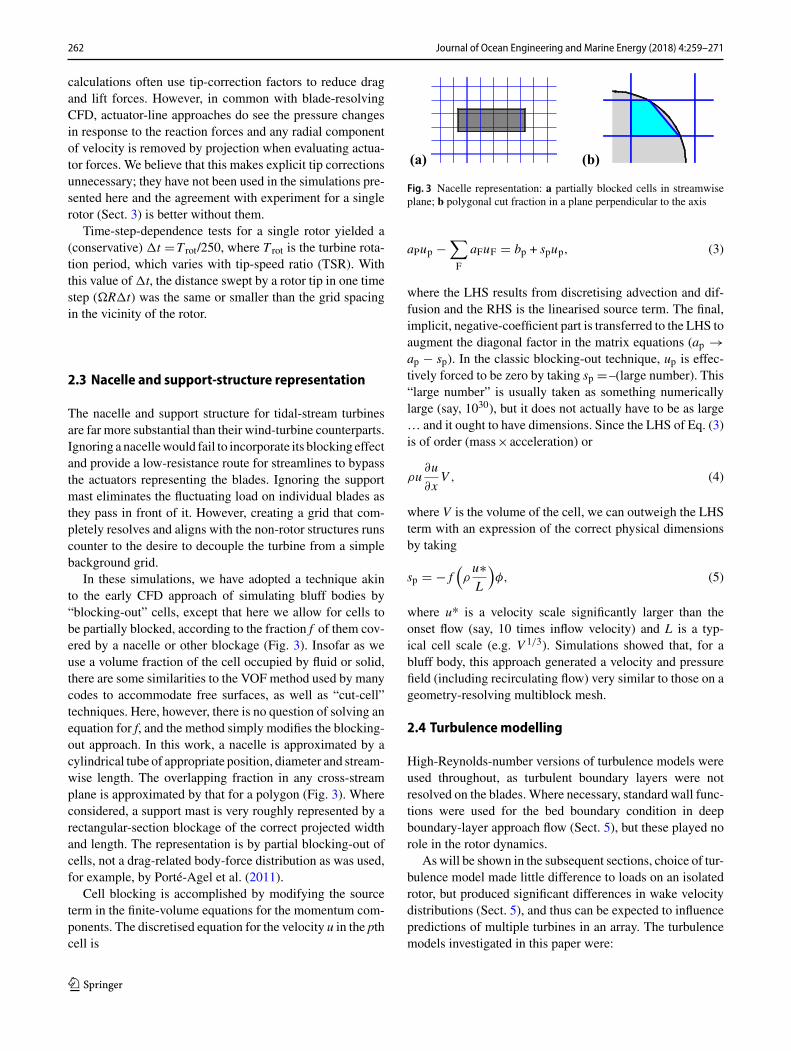
In these simulations, we have adopted a technique akinto the early CFD approach of simulating bluff bodies by“blocking-out” cells, except that here we allow for cells tobe partially blocked, according to the fraction f of them cov-ered by a nacelle or other blockage (Fig. 3). Insofar as weuse a volume fraction of the cell occupied by fluid or solid,there are some similarities to the VOF method used by manycodes to accommodate free surfaces, as well as “cut-cell”techniques. Here, however, there is no question of solving anequation for f, and the method simply modifies the blocking-out approach. In this work, a nacelle is approximated by acylindrical tube of appropriate position, diameter and stream-wise length. The overlapping fraction in any cross-streamplane is approximated by that for a polygon (Fig. 3). Whereconsidered, a support mast is very roughly represented by arectangular-section blockage of the correct projected widthand length. The representation is by partial blocking-out ofcells, not a drag-related body-force distribution as was used,for example, by Porté-Agel et al. (2011).
Cell blocking is accomplished by modifying the sourceterm in the finite-volume equations for the momentum com-ponents. The discretised equation for the velocity u in the pthcell is
(a) (b)
Fig. 3 Nacelle representation: a partially blocked cells in streamwiseplane; b polygonal cut fraction in a plane perpendicular to the axis
aPup −∑
F
aFuF � bp + spup, (3)
where the LHS results from discretising advection and dif-fusion and the RHS is the linearised source term. The final,implicit, negative-coefficient part is transferred to the LHS toaugment the diagonal factor in the matrix equations (ap →ap − sp). In the classic blocking-out technique, up is effec-tively forced to be zero by taking sp �–(large number). This“large number” is usually taken as something numericallylarge (say, 1030), but it does not actually have to be as large… and it ought to have dimensions. Since the LHS of Eq. (3)is of order (mass×acceleration) or
ρu∂u
∂xV , (4)
where V is the volume of the cell, we can outweigh the LHSterm with an expression of the correct physical dimensionsby taking
sp � − f(ρu∗L
)φ, (5)
where u* is a velocity scale significantly larger than theonset flow (say, 10 times inflow velocity) and L is a typ-ical cell scale (e.g. V 1/3). Simulations showed that, for abluff body, this approach generated a velocity and pressurefield (including recirculating flow) very similar to those on ageometry-resolving multiblock mesh.
2.4 Turbulencemodelling
High-Reynolds-number versions of turbulence models wereused throughout, as turbulent boundary layers were notresolved on the blades. Where necessary, standard wall func-tions were used for the bed boundary condition in deepboundary-layer approach flow (Sect. 5), but these played norole in the rotor dynamics.
As will be shown in the subsequent sections, choice of tur-bulence model made little difference to loads on an isolatedrotor, but produced significant differences in wake velocitydistributions (Sect. 5), and thus can be expected to influencepredictions of multiple turbines in an array. The turbulencemodels investigated in this paper were:
123
Journal of Ocean Engineering and Marine Energy (2018) 4:259–271 263
• the “standard” k-ε model of Launder and Spalding (1974);• the realisable (linear) k-ε model of Shih et al. (1995);• the SST k-ω model of Menter (1994);• the Reynolds-stress-transport model of Gibson and Laun-der (1978).
For the full forms of the turbulencemodels, one is referredto the original references, or the summary in Apsley andLeschziner (2000). However, we draw attention here to twoparticular models. The literature shows that the SST k-ωmodel is an extremely popular turbulence closure for exter-nal flows in general and aerofoils in particular. This modelis a hybrid of k-ω (near-wall) and k-ε (free-stream) closuresexpressed in k-ω form, with additional shear-stress limit-ing near solid boundaries. However, in our actuator modelthere are no solid boundaries associated with the blades, sothat this model would simply revert to a k-ε-type model andthe shear-stress limiting (which depends on wall distance)does not occur. Differences from the standard k-ε model hereare thus solely due to the coefficients in the length-scale-determining equation. There are also significant differencesbetween the standard k-ε model and the realisable model ofShih et al. (1995). These stem from the strain sensitivity builtinto the latter’s eddy-viscosity formulation and length-scale-determining (ε) equation. It is the strain dependence of theseterms which suppresses the excessive production of turbu-lence that is found with the standard k-ε model in highlystraining flows.
The standard k-ε model is found to be excessively diffu-sive in the highly strained flow near the turbine disk, leadingto more rapid breakdown of flow structures in the near wake.However, the decay rate further downstream was more accu-rately predicted by the standard k-ε model (see Sect. 5.2) sothat, as a significant emphasis was to be placed on array sim-ulations, this is, except where specified, the model employedin calculations in this paper.
3 Validation for a single rotor
Bahaj et al. (2007) published measurements with a three-bladed axial-flow turbine in a towing tank and a cavitationflume. Here, we attempt to simulate the former, equivalent toa low-turbulence uniform onset flow in a fixed domain. Forthe CFD simulation, cross-stream dimensions were the sameas the towing tank, thus accurately reproducing the blockageratio. The upper surface was treated as a stress-free rigid lid(effectively, a symmetry plane) since, at lowFroude numbers,the surface displacement due to the presence of the turbineis small.
Blade twist β(r) and chord c(r) distributions were as spec-ified inBahaj et al. (2007), whilst aerofoil section coefficientsCD(α,r) and CL(α,r) were generated by XFoil. Bahaj et al.
reported results for two blade pitches, but only the 20° pitchangle at blade root (“design case”) has been simulated here.Simulations were undertaken with a nacelle of the samediameter and length as the experiments, but the support strutwas deemed sufficiently far downstream tobeneglected in theCFD simulations, as only time-averaged loading and power,not wake velocities, were to be compared.
In design conditions, nominally TSR�6, where
TSR � ΩR
U0, (6)
is tip-speed ratio, numerical tests with successively finergrids demonstrated that satisfactory grid independence forload coefficients was obtained with a mesh extending 3Dupstream and 7D downstream of the rotor (where D �2Ris the rotor diameter), with a background mesh of 690,000cells, clustered at the centre of the rotor and allowed to expanduniformly in all directions. With a low-turbulence, uniformapproach flow, the total number of cells was found to be lessimportant than the size of cells in the vicinity of the rotor(here, 0.01D at rotor centre, but expanding outward). Forparallelisation on a multi-core desktop PC the domain wasdivided into eight streamwise blocks. Calculation times wereof the order of a few hours, with final loads being obtainedrapidly, but wake velocity evolving for longer.
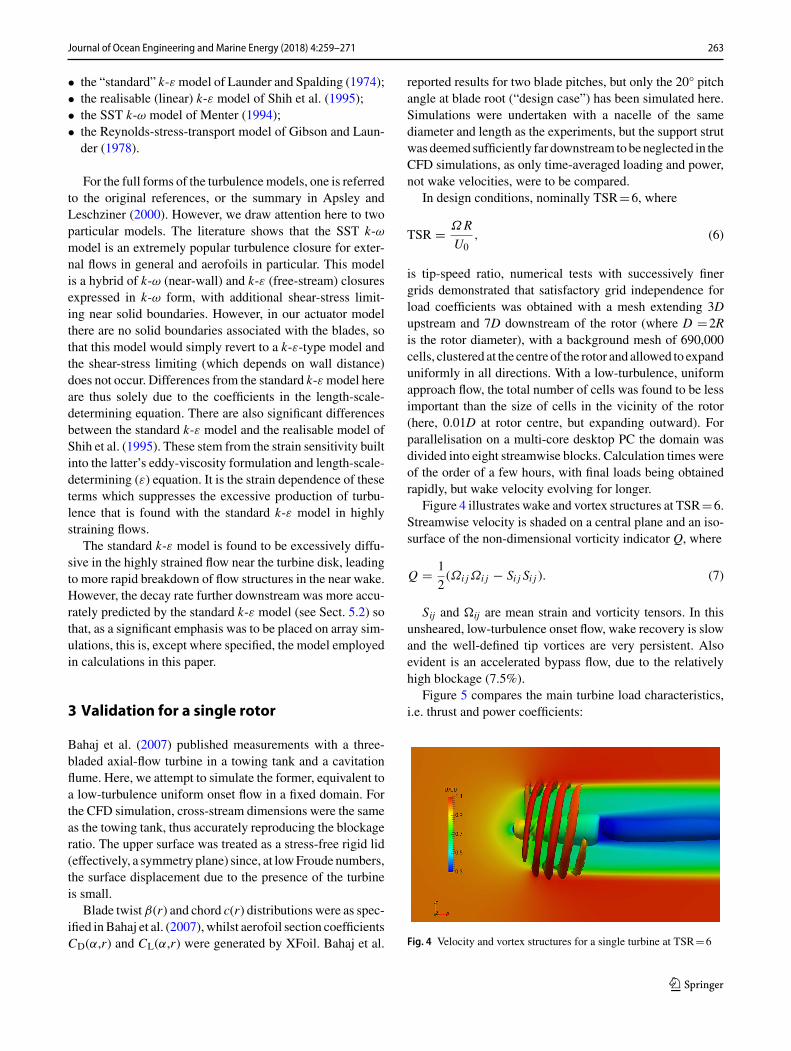
Figure 4 illustrates wake and vortex structures at TSR�6.Streamwise velocity is shaded on a central plane and an iso-surface of the non-dimensional vorticity indicator Q, where
Q � 1
2(Ωi jΩi j − Si j Si j ). (7)
Sij and �ij are mean strain and vorticity tensors. In thisunsheared, low-turbulence onset flow, wake recovery is slowand the well-defined tip vortices are very persistent. Alsoevident is an accelerated bypass flow, due to the relativelyhigh blockage (7.5%).
Figure 5 compares the main turbine load characteristics,i.e. thrust and power coefficients:
Fig. 4 Velocity and vortex structures for a single turbine at TSR�6
123

264 Journal of Ocean Engineering and Marine Energy (2018) 4:259–271
Fig. 5 Thrust and power coefficients as a function of TSR, comparedwith the data of Bahaj et al. (2007)
CT � thrust12ρU
20 A
, CP � power12ρU
30 A
, (8)
across a range of TSR with the measurements of Bahaj et al.(2007). Thrust and torque are directly related to momentumdeficit and angular momentum in the near wake. In Fig. 5(but not our subsequent sections), corrections for blockagehave been performed in the same way as in Bahaj et al.’spaper, because the original uncorrected load coefficientswere not provided in that paper. Computed thrust is slightlylow, but power is well predicted across the whole rangetested, and particularly so near design conditions (TSR�6).Actuator-line computations demonstrate the significant fall-off in power at off-design TSR that simple BEMT models(e.g. Batten et al. 2008) are not able to replicate.
Figure 5 also shows that, for a single turbine and an actu-ator representation of blades, choice of turbulence modelmakes little difference to predicted loads on an isolatedturbine. By contrast, Sect. 5 will show that it can make asignificant difference to velocities in the wake.
4 Two interacting turbines
An actuator approach makes it particularly straightforwardto accommodate additional turbines and/or change their rel-ative positions. Only minor changes are necessary to refinethe background non-uniform, but still Cartesian, grid in thevicinity of rotors. In this section, to illustrate the effects asso-ciated with multiple rotors in a narrow channel we consider a(hypothetical) interaction between two rotors with the same
geometry and channel dimensions as Sect. 3, with the rotorsrunning at fixed angular speed. In Sect. 5 we compare withexperimental data from more extensive arrays, with rotorsable to establish their own speed according to the hydrody-namic torque.
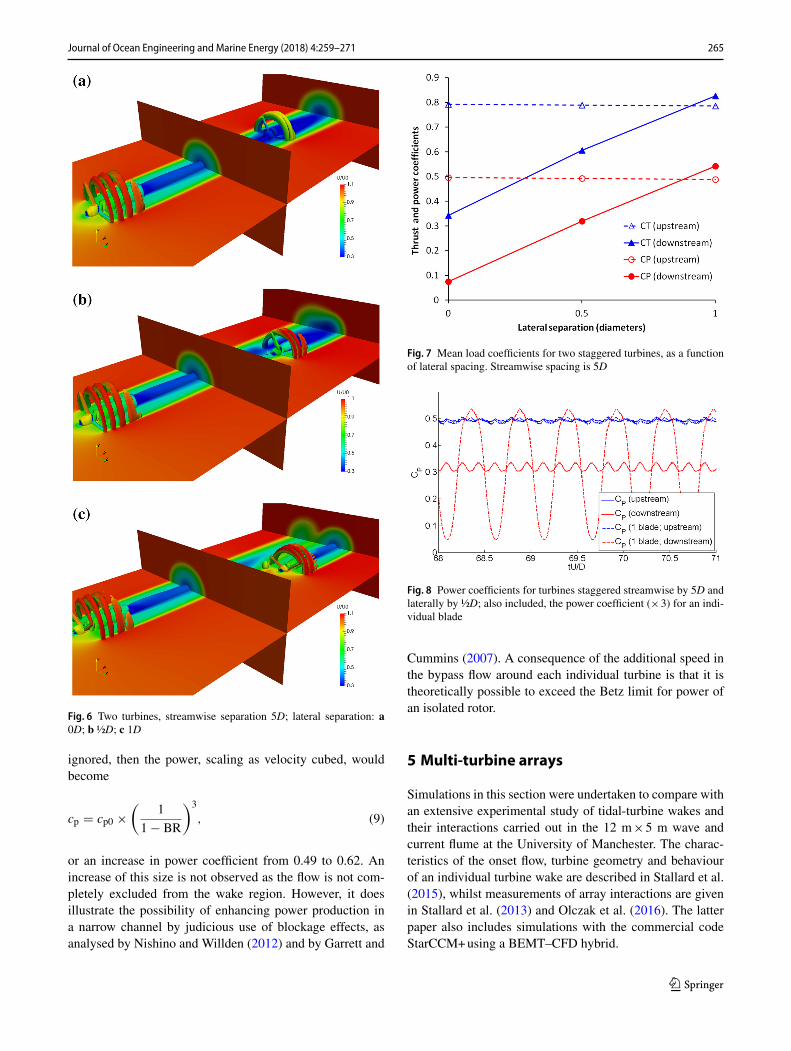
Figure 6 shows predicted wake velocity distributions fortwo turbines separated streamwise by 5D and laterally by 0,½ and 1D (between centrelines). The computational domainis similar to that in Sect. 3, but has been extended down-stream. In this Section, a fixed rotation speed (TSR�6,based on onset flow far upstream) is used for both turbines,although the downstream device will experience a differ-ent onset velocity, dependent on its position; for this turbine“tip-speed ratio” is nominal. In the low-turbulence flow here,wakes develop slowly, so that turbine interactions are exag-gerated; in real marine flows, turbulence and velocity shearpromotemore rapidwake recovery. Figure 7 shows the result-ing power and thrust coefficients.
In all cases, the upstream turbine experiences essentiallythe same loading as the individual turbine of Sect. 3. (Block-age corrections have not been applied here, resulting in smallchanges of load-coefficient values from the previous section.)However, the lateral position of the second turbine leads tolarge differences in load. This has significant implications forthe layout of real turbine arrays, where onset flow directionmay change over the tidal cycle.
In Fig. 6a, the second turbine is directly downstream ofthe first turbine. Unsurprisingly, its load coefficients are sub-stantially reduced, but the reduction is exaggerated here, as,for more realistic turbulence levels, wakes would spread andrecover more rapidly.
In Fig. 6b, the downstream turbine is “half-shaded” by theupstream turbine (i.e. lateral separation between centrelinesis ½D). The whole-rotor power coefficients in Fig. 7 showthe expected reduction in thrust and mean power. However,Fig. 8, which plots power coefficients for the whole rotor andfor an individual blade on each turbine (scaled by the bladecount of 3), indicates how individual blades on the down-stream turbine experience huge cyclical changes in loadingas they rotate in and out of the upstream turbine’s wake, withimplications for fatigue damage. By contrast, blades on theupstream turbine suffer only small fluctuations, solely as aresult of their changing position relative to the surface orbed.
For the case shown in Fig. 6c, with lateral spacing 1D,Fig. 7 shows that the downstream turbine can actually expe-rience greater thrust and torque than the upstream turbine. Inthis instance, the downstream turbine is effectively in thebypass flow of the upstream turbine. Because of the rel-atively large channel blockage ratio (BR�0.075 for eachdevice) and low wake-spreading rate in the low-turbulenceonset flow, this results in a higher onset velocity to the down-stream turbine. If the wake region flow was to be completely
123
Journal of Ocean Engineering and Marine Energy (2018) 4:259–271 265
Fig. 6 Two turbines, streamwise separation 5D; lateral separation: a0D; b ½D; c 1D
ignored, then the power, scaling as velocity cubed, wouldbecome
cp � cp0 ×(
1
1 − BR
)3
, (9)
or an increase in power coefficient from 0.49 to 0.62. Anincrease of this size is not observed as the flow is not com-pletely excluded from the wake region. However, it doesillustrate the possibility of enhancing power production ina narrow channel by judicious use of blockage effects, asanalysed by Nishino and Willden (2012) and by Garrett and
Fig. 7 Mean load coefficients for two staggered turbines, as a functionof lateral spacing. Streamwise spacing is 5D
Fig. 8 Power coefficients for turbines staggered streamwise by 5D andlaterally by ½D; also included, the power coefficient (×3) for an indi-vidual blade
Cummins (2007). A consequence of the additional speed inthe bypass flow around each individual turbine is that it istheoretically possible to exceed the Betz limit for power ofan isolated rotor.
5 Multi-turbine arrays
Simulations in this section were undertaken to compare withan extensive experimental study of tidal-turbine wakes andtheir interactions carried out in the 12 m×5 m wave andcurrent flume at the University of Manchester. The charac-teristics of the onset flow, turbine geometry and behaviourof an individual turbine wake are described in Stallard et al.(2015), whilst measurements of array interactions are givenin Stallard et al. (2013) and Olczak et al. (2016). The latterpaper also includes simulations with the commercial codeStarCCM+using a BEMT–CFD hybrid.
123

266 Journal of Ocean Engineering and Marine Energy (2018) 4:259–271
5.1 Flow, geometry and array configurations
The flume width is 5 m. Experiments were conducted withdepth-averaged velocity 0.463 m s−1 in water of depth0.45 m. In contrast to the low-turbulence flows of the pre-vious two sections, a screen at inflow was used to producea deep turbulent boundary layer with (streamwise) turbu-lence intensity of about 10%. To prevent undesirable profiledevelopment upstream of the turbine in the CFD simulations,fully developed inflow profiles of all transport variables weresupplied by a precursor 1-d boundary-layer simulation withthe given bulk velocity and water depth, for the same ver-tical mesh distribution and turbulence model. The resultingnon-dimensional mean-velocity profile (for the standard k-εmodel) is shown in Fig. 9 and compared to the experimen-tal data (actually, the smooth-wall log-law fit, with frictionvelocity uτ �0.0187 m s−1, cited by Olczak et al. (2016),as individual data points were unavailable). A fully devel-oped mean-velocity profile matches the experimental datareasonably well, but the simulated turbulence intensities areabout half those in the experiments, irrespective of turbulencemodel. Increasing turbulence levels to match these wouldhave led to significant evolution of the mean velocity profileupstream of the turbine.
Identical turbine rotors were deployed, with diameter0.27 m, a Göttingen 804 blade section and radially vary-
Fig. 9 Inflow mean velocity profile
ing pitch and chord as given in Stallard et al. (2015). Theparticular blade was chosen so that the variation of thrustcoefficient with tip-speed ratio was similar to that for a real-istic full-scale turbine, despite the much lower Reynoldsnumber inherent in experimental measurements at this scale.At this Reynolds number, the maximum power coefficientis about 0.3, occurring around TSR�4.5. Blade-sectionaldrag and lift coefficients, CL- and CD, were also given inStallard et al. (2015), based on an earlier report. However,for simulations with torque-driven variations in speed, theCFD simulations showed a propensity to stall in downstreamrows of turbines; this was found to be due to the resultingtorque coefficient falling off too fast at low-to-moderate TSR.New coefficients were therefore generated with XFoil which,although showing little difference in a BEMT model neardesign TSR, maintained sufficient torque at lower speeds.Turbines were centred at mid-depth. Cross-sectional chan-nel blockage per turbine is 2.5%.
Each experimental rotor had a gearbox and mast support-ing it from an overhead gantry. Due to their potential effect onturbine wakes, simple blocked-cell representations of these(with the same maximum streamwise, spanwise and verti-cal dimensions) were included in the CFD simulations, inaccordance with Sect. 2.3. These additional components hada minor impact on loads, affecting the fluctuating rather thanmean load coefficients, but the vertical support had moreeffect on wake velocities, where it served to disrupt tip vor-tices.
Results are reported here for a single turbine (as ref-erence, and to investigate the effect of turbulence model),one row of five turbines, and two or three staggered rowsof turbines (in arrays of up to 12 devices). In all casesconsidered computationally, lateral separation between tur-bine centres was 1.5D and streamwise separation betweenrows was 4D, although many more array configurations withlarger lateral and streamwise separations were examinedexperimentally (Olczak et al. 2016). The array configura-tions simulated are described in Sect. 5.3, where we discussloading.
Unlike the cases covered by previous sections, rotor speedis not fixed for the multi-turbine simulations in this section.Whilst full-scale turbines may employ a number of tech-niques to control speed, including pitch control and stallcontrol, in the flume experiments a retarding torque wasapplied to each rotor with a torque-speed characteristic suchthat an isolated rotor would operate at a TSR of 4.5. Toattempt to mimic this in the CFD simulation, for the multi-rotor arrays each rotor speed � is updated every time step inaccordance with the angular momentum equation:
123

Journal of Ocean Engineering and Marine Energy (2018) 4:259–271 267
Fig. 10 Retarding torque distribution applied in the CFD simulations
IdΩ
dt� T − Tretard, (10)
where I is the moment of inertia, T the hydrodynamic torque(derived from the actuator force distribution) and T retard theapplied retarding torque. In this instance, we used (Fig. 10):
Tretard �{T0 (� ≥ �0)
T0(
��0
)(� < �0),
(11)
where T0 is the hydrodynamic torque operating on a single,isolated rotor turning at angular velocity�0 corresponding toTSR�4.5. Moment of inertia I is not known in this case, butit affects only relaxation time and fluctuations about steadystate, not the mean rotation speed. As only average rotationrates were available from the experiments, it was sufficienthere simply to set I large enough to suppress large fluctua-tions in speed.
5.2 Simulation results for a single rotor
A single rotor, operating near maximum power and a fixedspeed, with TSR�4.5 was studied as a precursor to the full-wake simulations in Sect. 5.3. Both TSR and the thrust andpower coefficients, CT and CP, use the rotor-disk-averagedonset velocity for non-dimensionalisation. The predictedmean thrust coefficient is 0.767, in reasonably good agree-mentwith the experiment (~0.81). The power coefficient wasnot measured directly in the experiments, but the predictedmean value of 0.291 is in good agreement with a BEMTmodel. There are additional cyclic fluctuations of a few percent in both thrust and power coefficients due to tower cross-ing and velocity shear in the approach flow.
Wake development was reported in Stallard et al. (2013).Figure 11 shows time-averaged mean-velocity deficit (nor-malised by disk-average onset velocity) on the hub axis as a
Fig. 11 Streamwise mean-velocity deficit for a single rotor in a shearflow
function of streamwise distance, with the turbulence modelsdescribed in Sect. 2.4.
A significant finding of this particular set of flume mea-surements was the substantial centreline velocity deficitreported from the flume measurements (corresponding toa near-zero absolute velocity) extending several diametersdownstream of the rotor plane. Indeed, there is experimentalevidence (both here, and in other turbine studies) of a shortregion where the centreline mean velocity deficit actuallyincreases slightlywith downstreamdistance in the nearwake,possibly a consequence of fluid being drawn away from theaxis towards the very-low-pressure core of the encircling tipvortices, in contrast with a non-rotating wake typified by amonotonic velocity recovery. Beyond the vortical near-wakeregion, the centreline velocity is, by continuity, a fairly goodindicator of wake spreading rate.
In contrast to load and approach-flow predictions, simula-tions of the centreline velocity deficit varied substantiallybetween different turbulence closures downstream of therotor disk. In general, the standard k-ε model predictedgreater turbulence levels and diffusive wake recovery, withmuch greater velocities (smaller velocity deficit) in the regionfrom 1 to 4 diameters downstream. The realisable k-ε modelof Shih et al. (1995) has a shear-dependent eddy-viscositycoefficient Cμ which acts to suppress production of turbu-lence in strongly straining flows, thus reducing diffusion.This gave better agreement in the near wake, but insufficientwake recovery further downstream. Reynolds-stress trans-port models (and we tried others besides the Gibson andLaunder (1978) model reported here) showed a short regionof increasing velocity deficit on the centreline, which washinted at in the experimental measurements. However, againthe wake further downstream decayed more slowly in simu-lations than experiments; this may be a consequence of thelower free-stream turbulence in the former. Second-moment-closure models do not fit comfortably with the actuator-linerepresentation of blades because they depend too strongly on
123
268 Journal of Ocean Engineering and Marine Energy (2018) 4:259–271
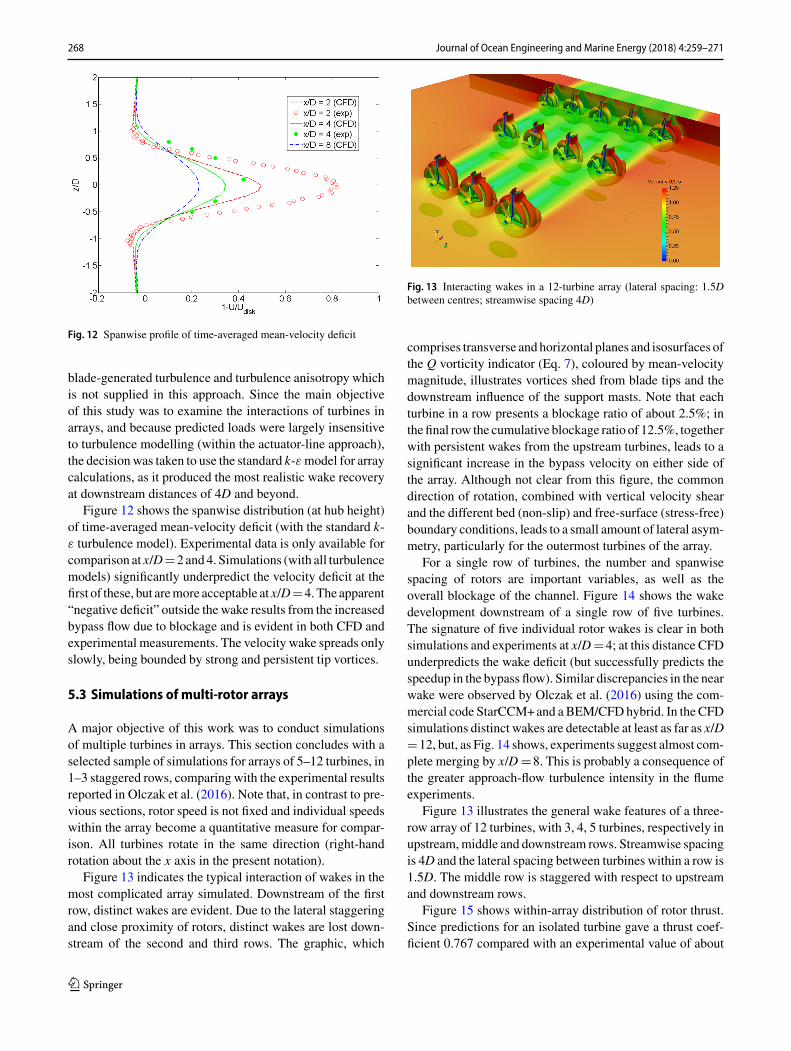
Fig. 12 Spanwise profile of time-averaged mean-velocity deficit
blade-generated turbulence and turbulence anisotropy whichis not supplied in this approach. Since the main objectiveof this study was to examine the interactions of turbines inarrays, and because predicted loads were largely insensitiveto turbulence modelling (within the actuator-line approach),the decisionwas taken to use the standard k-εmodel for arraycalculations, as it produced the most realistic wake recoveryat downstream distances of 4D and beyond.
Figure 12 shows the spanwise distribution (at hub height)of time-averaged mean-velocity deficit (with the standard k-ε turbulence model). Experimental data is only available forcomparison at x/D�2 and4. Simulations (with all turbulencemodels) significantly underpredict the velocity deficit at thefirst of these, but aremore acceptable at x/D�4.The apparent“negative deficit” outside the wake results from the increasedbypass flow due to blockage and is evident in both CFD andexperimental measurements. The velocity wake spreads onlyslowly, being bounded by strong and persistent tip vortices.
5.3 Simulations of multi-rotor arrays
A major objective of this work was to conduct simulationsof multiple turbines in arrays. This section concludes with aselected sample of simulations for arrays of 5–12 turbines, in1–3 staggered rows, comparing with the experimental resultsreported in Olczak et al. (2016). Note that, in contrast to pre-vious sections, rotor speed is not fixed and individual speedswithin the array become a quantitative measure for compar-ison. All turbines rotate in the same direction (right-handrotation about the x axis in the present notation).
Figure 13 indicates the typical interaction of wakes in themost complicated array simulated. Downstream of the firstrow, distinct wakes are evident. Due to the lateral staggeringand close proximity of rotors, distinct wakes are lost down-stream of the second and third rows. The graphic, which
Fig. 13 Interacting wakes in a 12-turbine array (lateral spacing: 1.5Dbetween centres; streamwise spacing 4D)
comprises transverse and horizontal planes and isosurfaces ofthe Q vorticity indicator (Eq. 7), coloured by mean-velocitymagnitude, illustrates vortices shed from blade tips and thedownstream influence of the support masts. Note that eachturbine in a row presents a blockage ratio of about 2.5%; inthe final row the cumulative blockage ratio of 12.5%, togetherwith persistent wakes from the upstream turbines, leads to asignificant increase in the bypass velocity on either side ofthe array. Although not clear from this figure, the commondirection of rotation, combined with vertical velocity shearand the different bed (non-slip) and free-surface (stress-free)boundary conditions, leads to a small amount of lateral asym-metry, particularly for the outermost turbines of the array.
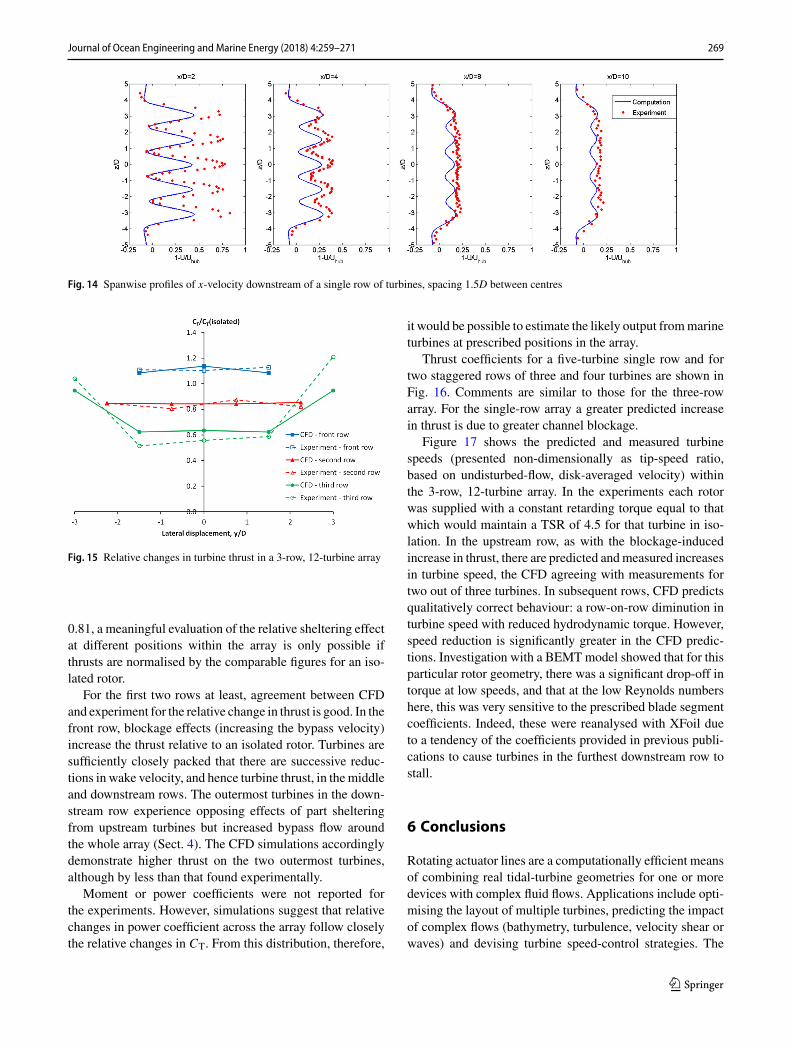
For a single row of turbines, the number and spanwisespacing of rotors are important variables, as well as theoverall blockage of the channel. Figure 14 shows the wakedevelopment downstream of a single row of five turbines.The signature of five individual rotor wakes is clear in bothsimulations and experiments at x/D�4; at this distance CFDunderpredicts the wake deficit (but successfully predicts thespeedup in the bypass flow). Similar discrepancies in the nearwake were observed by Olczak et al. (2016) using the com-mercial code StarCCM+and aBEM/CFDhybrid. In the CFDsimulations distinct wakes are detectable at least as far as x/D�12, but, as Fig. 14 shows, experiments suggest almost com-plete merging by x/D �8. This is probably a consequence ofthe greater approach-flow turbulence intensity in the flumeexperiments.
Figure 13 illustrates the general wake features of a three-row array of 12 turbines, with 3, 4, 5 turbines, respectively inupstream,middle and downstream rows. Streamwise spacingis 4D and the lateral spacing between turbines within a row is1.5D. The middle row is staggered with respect to upstreamand downstream rows.
Figure 15 shows within-array distribution of rotor thrust.Since predictions for an isolated turbine gave a thrust coef-ficient 0.767 compared with an experimental value of about
123
Journal of Ocean Engineering and Marine Energy (2018) 4:259–271 269
Fig. 14 Spanwise profiles of x-velocity downstream of a single row of turbines, spacing 1.5D between centres
Fig. 15 Relative changes in turbine thrust in a 3-row, 12-turbine array
0.81, a meaningful evaluation of the relative sheltering effectat different positions within the array is only possible ifthrusts are normalised by the comparable figures for an iso-lated rotor.
For the first two rows at least, agreement between CFDand experiment for the relative change in thrust is good. In thefront row, blockage effects (increasing the bypass velocity)increase the thrust relative to an isolated rotor. Turbines aresufficiently closely packed that there are successive reduc-tions in wake velocity, and hence turbine thrust, in themiddleand downstream rows. The outermost turbines in the down-stream row experience opposing effects of part shelteringfrom upstream turbines but increased bypass flow aroundthe whole array (Sect. 4). The CFD simulations accordinglydemonstrate higher thrust on the two outermost turbines,although by less than that found experimentally.
Moment or power coefficients were not reported forthe experiments. However, simulations suggest that relativechanges in power coefficient across the array follow closelythe relative changes in CT. From this distribution, therefore,
it would be possible to estimate the likely output frommarineturbines at prescribed positions in the array.
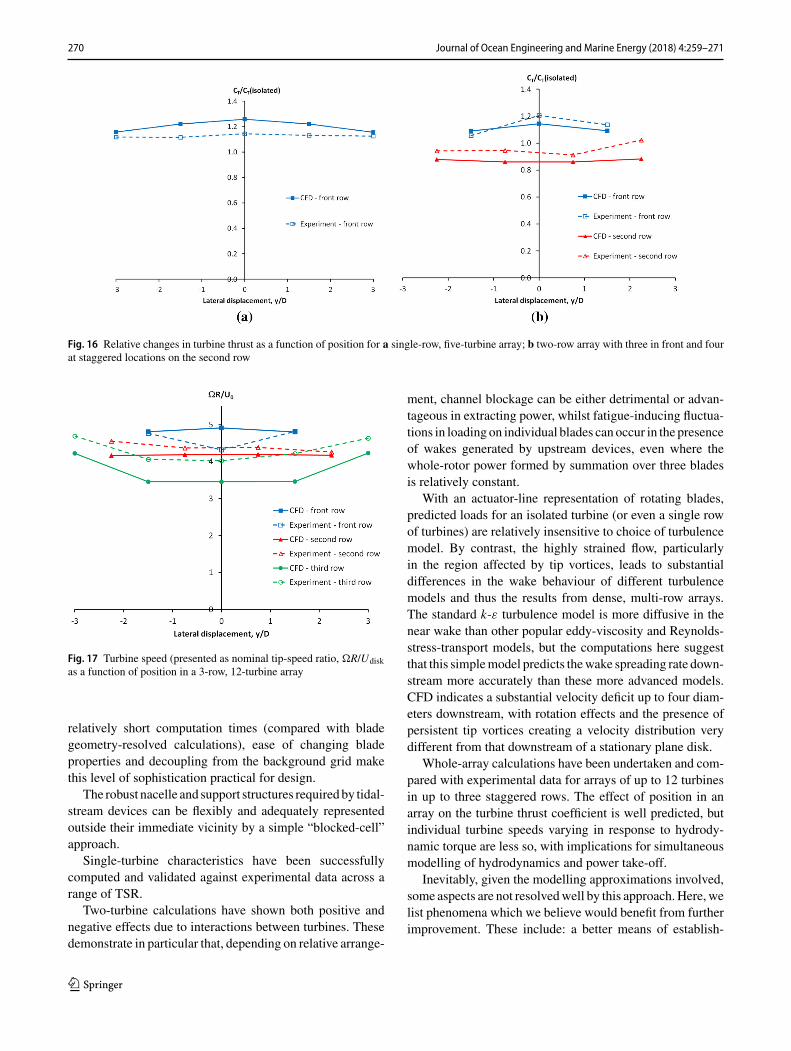
Thrust coefficients for a five-turbine single row and fortwo staggered rows of three and four turbines are shown inFig. 16. Comments are similar to those for the three-rowarray. For the single-row array a greater predicted increasein thrust is due to greater channel blockage.
Figure 17 shows the predicted and measured turbinespeeds (presented non-dimensionally as tip-speed ratio,based on undisturbed-flow, disk-averaged velocity) withinthe 3-row, 12-turbine array. In the experiments each rotorwas supplied with a constant retarding torque equal to thatwhich would maintain a TSR of 4.5 for that turbine in iso-lation. In the upstream row, as with the blockage-inducedincrease in thrust, there are predicted andmeasured increasesin turbine speed, the CFD agreeing with measurements fortwo out of three turbines. In subsequent rows, CFD predictsqualitatively correct behaviour: a row-on-row diminution inturbine speed with reduced hydrodynamic torque. However,speed reduction is significantly greater in the CFD predic-tions. Investigation with a BEMTmodel showed that for thisparticular rotor geometry, there was a significant drop-off intorque at low speeds, and that at the low Reynolds numbershere, this was very sensitive to the prescribed blade segmentcoefficients. Indeed, these were reanalysed with XFoil dueto a tendency of the coefficients provided in previous publi-cations to cause turbines in the furthest downstream row tostall.
6 Conclusions
Rotating actuator lines are a computationally efficient meansof combining real tidal-turbine geometries for one or moredevices with complex fluid flows. Applications include opti-mising the layout of multiple turbines, predicting the impactof complex flows (bathymetry, turbulence, velocity shear orwaves) and devising turbine speed-control strategies. The
123
270 Journal of Ocean Engineering and Marine Energy (2018) 4:259–271
Fig. 16 Relative changes in turbine thrust as a function of position for a single-row, five-turbine array; b two-row array with three in front and fourat staggered locations on the second row
Fig. 17 Turbine speed (presented as nominal tip-speed ratio, �R/Udiskas a function of position in a 3-row, 12-turbine array
relatively short computation times (compared with bladegeometry-resolved calculations), ease of changing bladeproperties and decoupling from the background grid makethis level of sophistication practical for design.
The robust nacelle and support structures requiredby tidal-stream devices can be flexibly and adequately representedoutside their immediate vicinity by a simple “blocked-cell”approach.
Single-turbine characteristics have been successfullycomputed and validated against experimental data across arange of TSR.
Two-turbine calculations have shown both positive andnegative effects due to interactions between turbines. Thesedemonstrate in particular that, depending on relative arrange-
ment, channel blockage can be either detrimental or advan-tageous in extracting power, whilst fatigue-inducing fluctua-tions in loading on individual blades can occur in the presenceof wakes generated by upstream devices, even where thewhole-rotor power formed by summation over three bladesis relatively constant.
With an actuator-line representation of rotating blades,predicted loads for an isolated turbine (or even a single rowof turbines) are relatively insensitive to choice of turbulencemodel. By contrast, the highly strained flow, particularlyin the region affected by tip vortices, leads to substantialdifferences in the wake behaviour of different turbulencemodels and thus the results from dense, multi-row arrays.The standard k-ε turbulence model is more diffusive in thenear wake than other popular eddy-viscosity and Reynolds-stress-transport models, but the computations here suggestthat this simplemodel predicts thewake spreading rate down-stream more accurately than these more advanced models.CFD indicates a substantial velocity deficit up to four diam-eters downstream, with rotation effects and the presence ofpersistent tip vortices creating a velocity distribution verydifferent from that downstream of a stationary plane disk.
Whole-array calculations have been undertaken and com-pared with experimental data for arrays of up to 12 turbinesin up to three staggered rows. The effect of position in anarray on the turbine thrust coefficient is well predicted, butindividual turbine speeds varying in response to hydrody-namic torque are less so, with implications for simultaneousmodelling of hydrodynamics and power take-off.
Inevitably, given the modelling approximations involved,some aspects are not resolvedwell by this approach.Here, welist phenomena which we believe would benefit from furtherimprovement. These include: a better means of establish-
123

Journal of Ocean Engineering and Marine Energy (2018) 4:259–271 271
ing “approach-flow velocity” for individual blade elements;examination of the influence of radial flow and transientbehaviour on the blades; influence of high turbulence inten-sity on sectional lift and drag coefficients; inclusion ofturbulence sources to represent generation in blade boundarylayers.
Future work will include integration with a realistic drive-train model and speed-control strategy, and the modelling ofturbine interaction with waves.
In summary, themain advances expressed in this paper are:the application of, and validation of, actuator-line methodsto arrays; the use of torque-controlled, variable-speed rotors;the inclusion of bulk effects of support tower and nacelle.
Open Access This article is distributed under the terms of the CreativeCommons Attribution 4.0 International License (http://creativecommons.org/licenses/by/4.0/), which permits unrestricted use, distribution,and reproduction in any medium, provided you give appropriate creditto the original author(s) and the source, provide a link to the CreativeCommons license, and indicate if changes were made.
References
Afgan I, McNaughton J, Apsley DD, Rolfo S, Stallard T, Stansby PK(2013) Turbulent flow and loading on a tidal stream turbine byLES and RANS. Int J Heat Fluid Flow 43:96–108
Ahmed U, Apsley DD, Afgan I, Stallard T, Stansby PK (2017) Fluctu-ating loads on a tidal turbine due to velocity shear and turbulence:comparison of CFD with field data. Renew Energy 112:235–246
Apsley DD, Hu W (2003) CFD simulation of two- and three-dimensional free-surface flow. Int J Numer Methods Fluids42:465–491
Apsley DD, Leschziner MA (2000) Advanced turbulence modelling ofseparated flow in a diffuser, Flow. Turbul Combust 63:81–112
Apsley DD, Stallard T, Stansby PK (2016) Actuator-line CFD mod-elling of tidal-stream turbines. In: 2nd international conferenceon marine renewable energy (CORE2016), Glasgow
Baba-Ahmadi MH, Dong P (2017) Numerical simulations of wakecharacteristics of a horizontal axis tidal stream turbine using actu-ator line model. Renew Energy 113:669–678
Bahaj AS, Molland AF, Chaplin JR, Batten WMJ (2007) Power andthrust measurements of marine current turbines under varioushydrodynamic flow conditions in a cavitation tunnel and a towingtank. Renew Energy 32:407–426
Batten WMJ, Bahaj AS, Molland AF, Chaplin JR (2008) The predic-tion of the hydrodynamic performance of marine current turbines.Renew Energy 33:1085–1096
Black and Veatch (2005) Phase II UK tidal stream energy resourceassessment. Rep. 107799/D/2200/03 for carbon trust
Garrett C, Cummins P (2007) The efficiency of a turbine in a tidalchannel. J Fluid Mech 588:243–251
Gibson MM, Launder BE (1978) Ground effects on pressure fluctua-tions in the atmospheric boundary layer. J FluidMech 86:491–511
Launder BE, Spalding DB (1974) The numerical computation of tur-bulent flows. Comput Method Appl Mech Eng 3:269–289
Lien FS, Leschziner MA (1994) A general non-orthogonal collo-cated finite volume algorithm for turbulent flow at all speedsincorporating second-moment turbulence-transport closure, Part1: computational implementation.CompMethodsApplMechEng114:123–148
McNaughton J, Afgan I, Apsley DD, Rolfo S, Stallard T, Stansby PK(2014) A simple sliding-mesh interface procedure and its applica-tion to the CFD simulation of a tidal-stream turbine. Int J NumerMethods Fluids 74:250–269
Menter FR (1994) Two-equation eddy-viscosity turbulence models forengineering applications. AIAA J 32:1598–1605
Nishino T, Willden RHJ (2012) Effects of 3-D channel blockage andturbulent wake mixing on the limit of power extraction by tidalturbines. Int J Heat Fluid Flow 37:123–135
Olczak A, Stallard T, Feng T, Stansby PK (2016) Comparison of aRANSblade elementmodel for tidal turbine arrayswith laboratoryscale measurements of wake velocity and rotor thrust. J FluidsStruct 64:87–106
Porté-Agel F, Wu Y-T, Lu H, Conzemius RJ (2011) Large-eddy simu-lation of atmospheric boundary layer flow through wind turbinesand wind farms. J Wind Eng Ind Aerodyn 99:154–168
Sarlak H, Nishino T, Martìnez-Tossas LA, Meneveau C, Sørensen JN(2016) Assessment of blockage effects on thewake characteristicsand power of wind turbines. Renew Energy 93:340–352
Schluntz J,WilldenRHJ (2015a) The effect of blockage on tidal turbinerotor design and performance. Renew Energy 81:432–441
Schluntz J, Willden RHJ (2015b) An actuator line method with novelblade flow field coupling based on potential flow equivalence.Wind Energy 18:1469–1485
Shih T-H, Liou WW, Shammir A, Yang Z, Zhu J (1995) A new k-εeddy-viscosity model for high Reynolds number turbulent flows.Comput Fluids 24:227–238
Sørensen JN, Shen WZ (2002) Numerical modelling of wind turbinewakes. J Fluids Eng 124:393–399
Stallard T, Collings R, Feng T, Whelan J (2013) Interactions betweentidal turbine wakes: experimental study of a group of 3-bladedrotors. Phil Trans R Soc A Math Phys Eng Sci 871:20120159
Stallard T, Feng T, Stansby PK (2015) Experimental study of the meanwake of a tidal stream rotor in a shallow turbulent flow. J FluidsStruct 54:235–246
Publisher’s Note Springer Nature remains neutral with regard to juris-dictional claims in published maps and institutional affiliations.
123