acute hospital bed capacity
TRANSCRIPT

8/8/2019 Acute Hospital Bed Capacity
http://slidepdf.com/reader/full/acute-hospital-bed-capacity 1/94

8/8/2019 Acute Hospital Bed Capacity
http://slidepdf.com/reader/full/acute-hospital-bed-capacity 2/94
Baile Átha Cliath
Arna Fhoilsiú ag Oifig an tSoláthair
Le ceannach díreach ón
Oifig Dhíolta Foilseachán Rialtais,
Teach Sun Alliance, Sráid Theach Laighean, Baile Átha Cliath 2,
nó tríd an bpost ó
Foil seacháin Rial tais an Rannóg Post-Tráchta,
4 - 5 Bóthar Fhaearchair, Baile Átha Cliath 2,
(Teil: 01-6476834/35/36/37; Fax 01-4752760)
nó trí aon díoltóir leabhar.
© Government of Ireland 2002
Dublin
Published by the Stationery Office.
To be purchased directly from the
Government Publications Sales Office,
Sun Alliance House, Molesworth Street, Dublin 2,
or by mail order from
Government Publications, Postal Trade Section,
4 - 5 Harcourt Road, Dublin 2,
(Tel: 01-6476834/35/36/37; Fax: 01-4752760)
or through any bookseller.
Available from : www.doh.ie
€5Pn. 10847
ISBN 0-7557-1186-6

8/8/2019 Acute Hospital Bed Capacity
http://slidepdf.com/reader/full/acute-hospital-bed-capacity 3/94
Acute HospitalBed CapacityA National Review

8/8/2019 Acute Hospital Bed Capacity
http://slidepdf.com/reader/full/acute-hospital-bed-capacity 4/94
Minister for Health and Children’s Foreword
It gives me great pleasure to publish the National Review of Acute HospitalBed Capacity, the most comprehensive exercise of its kind ever conducted inthis country.
For some time, it has been evident that the capacity of our acute hospitalsystem has not kept pace with the increasing demands being imposed on it.The consequences of that under-capacity are well known, i.e. cancellation ofelective admissions, long delays in accident and emergency departments,waiting lists for elective procedures and unacceptably high bed occupancy levelsin the major hospitals.
In the Programme for Prosperity and Fairness , the Government committed itself to arrange a detailed reviewof acute hospital bed capacity to be carried out by the Department of Health and Children in conjunction
with the Department of Finance and in consultation with the Social Partners. In conducting this exercise,my Department also consulted with the health boards and Eastern Regional Health Authority, bodiesrepresenting health professionals working in the acute hospital system and representatives of thecommunity and voluntary sectors.
This Review is the product of that exercise. It reviews changes in acute hospital capacity and acti vity over theperiod 1980 to 2000; i t provides an estimate of the number of additional beds required to eliminate currentgaps in capacity, it examines the factors that are likely to increase the need for additional beds and itprovides an assessment of the additional capacity required up to 2011. It also outlines strategies that couldbe adopted to reduce the number of additional beds required.
Estimating future demands, particularly demands for hospital services, is not an exact science and theReview outl ines a range of variables which affect the determination of acute hospital bed requirements.
Having carefully considered all the relevant factors and having particular regard to the developments inrelation to Primary Care and Services for Older People envisaged in Quality and Fairness: A Health System for You , the Government have decided to provide for an additional 3,000 acute hospital beds by 2011. Thisrepresents a planned increase of over 25%in acute hospital bed capacity and is the most ambitious suchcommitment in the hospital system since the foundation of the State. It is a clear demonstration of thepriority which this Government accords to the health services. The first 650 of the extra beds wil l beprovided during 2002 of which 450 will be in the public system and 200 will be contracted from the privatehospital sector. These beds will provide addit ional capacity for the treatment of public patients on wait inglists.
Of course, it is not enough to provide additional hospital beds; there wil l be a need for a substantialincrease in the number of medical, nursing and other hospital staff. Quality and Fairness: A Health System for You sets out a range of ini tiatives that are being, or wil l be, taken to recruit and retain the additional
staff required.
The Government have also decided to establish a National Hospitals Agency to oversee the reconfigurationof the hospital system and to prepare a strategic plan for the expansion of capacity announced in the HealthStrategy. Pending the establishment of the Agency, my Department will init iate steps to determine the mostappropriate distribution of the additional capacity by specialty and by region, in consultation with healthboards and the ERHA, professional bodies and other relevant interests.
Finally, I wish to thank all who have contributed to the preparation of this report, and to acknowledge thepivotal role played by Clinical Epidemiologist, Dr. Mary Codd, who acted as Consultant to my Department forthis exercise. The Report has been of inestimable value in developing the Health Strategy and in providing aframework for further reviews of bed capacity in the years ahead.
Micheál Martin, T.D.Minister for Health and Children 2
A c u t e H o s p i t a l B e d C a p a c i t y
A N a t i o n a l R e v i e w

8/8/2019 Acute Hospital Bed Capacity
http://slidepdf.com/reader/full/acute-hospital-bed-capacity 5/94
3
A c u t eH o s pi t al B e d C a p a c
i t y
A N a t i on al R evi ew
Table of Contents
Foreword 2
Abbreviations 4
List of Tables 5
List of Figures 6
Executive Summary 8
Introduction 12
Section 1 Context for Review of Acute Hospital Bed Capacity 16
Section 2 International Comparisons of Hospital Bed Capacity 22
Section 3 Trends in Acute Hospital Activity, 1995 to 2000 28
Section 4 Age-specific Acute Hospital Activity, 2000 42
Section 5 Current Indicators of Inadequate Hospital Bed Capacity 50
Section 6 Factors which will increase the need for Hospital Beds 60
Section 7 Strategies to reduce the need for Hospital Beds 68
Section 8 Estimating National Bed Need 78
Bibliography 82
Appendix 1 87
Appendix 2 89
Appendix 3 91

8/8/2019 Acute Hospital Bed Capacity
http://slidepdf.com/reader/full/acute-hospital-bed-capacity 6/94
Abbreviations
A&E Accident and Emergency
AC Audit Commission
ALOS Average Length of Stay
BADS Brit ish Association of Day Surgery
DOHC Department of Health and Children
DRG Diagnosis Related Group
ENT Ear, Nose and Throat
ERHA Eastern Regional Health Authori ty
ESRI Economic and Social Research Insti tute
EU European Union
HCAB Health Care Advisory Board
HIPE Hospital In-Patient Enquiry
ICD International Classification of Diseases
ICSI Intensive Care Society of Ireland
ICU Intensive Care Unit
IMR Integrated Management Report
LOS Length of Stay
MDC Major Diagnostic Category
NHS National Health Service
OECD Organisation for Economic Co-operation and Development
UK United Kingdom
USA United States of America
VFM Value for Money
4
A c u t e H o s p i t a l B e d C a p a c i t y
A N a t i o n a l R e v i e w

8/8/2019 Acute Hospital Bed Capacity
http://slidepdf.com/reader/full/acute-hospital-bed-capacity 7/94
5
A c u t eH o s pi t al B e d C a p a c
i t y
A N a t i on al R evi ew
List of Tables
Table S.1 Additional Acute Hospital Beds Required in Ireland to 2011 10
Table 1.1 Acute Hospital Beds, Inpatients, Average Length of Stay, Day Cases and Outpatients 18in Ireland, 1980 to 2000
Table 1.2 Populat ion of Ireland: Summary Stat ist ics for the Years 1981 to 2000(E) 19
Table 1.3 Acute Hospital Beds per Capita, 1981 to 2000 20
Table 1.4 Acute Hospital Bed Designations in Ireland, 2000 20
Table 7.1 Summary of International Studies of Inappropriate Bed Use 69
Table 7.2 Bed Days Lost due to Delayed Discharge, 2000 70
Table 7.3 Elective Surgery in Ireland, excluding Obstetrics, 2000: Total, AC‘Basket ’ and BADS 73‘Trolley’ of procedures and operations
Table 7.4 Potential to increase Day Surgery and Inpatient Bed Days gained by Specialty 74
Table 8.1 Additional Acute Hospital Beds Required in Ireland to 2011 80

8/8/2019 Acute Hospital Bed Capacity
http://slidepdf.com/reader/full/acute-hospital-bed-capacity 8/94

8/8/2019 Acute Hospital Bed Capacity
http://slidepdf.com/reader/full/acute-hospital-bed-capacity 9/94
Figure 6.1 Projected Demographic Changes by Age Category to 2011 and 2026 62
Figure 6.2 Estimated Impact of Projected Demographic Changes on Bed Need 63
Figure 6.3 Estimated Impact of Demand for Healthcare on Bed Need 66
Figure 7.1 Estimated Impact of Measures to reduce Delayed Discharge on Bed Need 70
Figure 7.2 Estimated Potential to use Available Capacity 71
Figure 7.3 Estimated Impact of additional Day Surgery on Bed Need 73
Figure 7.4 Estimated Impact of adherence to an 80/20 ratio of Public/Private beds on Bed Need 75
Figure 8.1 Factors which Impact on the need for Acute Hospital Beds 79
7
A c u t eH o s pi t al B e d C a p a c
i t y
A N a t i on al R evi ew

8/8/2019 Acute Hospital Bed Capacity
http://slidepdf.com/reader/full/acute-hospital-bed-capacity 10/94
Executive Summary
8/8/2019 Acute Hospital Bed Capacity
http://slidepdf.com/reader/full/acute-hospital-bed-capacity 11/94
The Programme for Prosperity and Fairness outlined the commitment of the Government to a review ofhospital bed capacity in both acute and non-acute settings, to be carried out by the Department ofHealth and Children in conjunction with the Department of Finance and in consultation with the SocialPartners. The focus of this report is on bed capacity in publicly-funded acute hospitals in Ireland. Thecapacity needs of the sub-acute sector have been assessed separately in the context of the HealthStrategy, Quality and Fairness: A Health System for You.
This Review provides an historical perspective on acute hospital activity over the last two decades,including changes in bed numbers, inpatient numbers, average length of stay and day activity. Itexamines and reports on current acute hospital bed capacity and clinical activity, and it suggests aframework for the estimation of future bed requirements based on current acti vity levels, currentindicators of inadequate capacity, increasing patient demand, potential changes to clinical practice andprojected demographic changes.
Estimating future need is a challenge. A health system is not a fixed system, but is a dynamic processwith continuously changing inputs and expectations. Demands on acute hospitals may change overtime and may be unpredictable. A reasonable approach, however, is to use current activity as a basis forpredicting future need, taking account of immediate pressures, the expected impact of patient demandand projected demographic changes and measures with the potential to reduce the need for extra beds.This is the approach taken in this Review.
The facts in relation to current acute hospital activity in Ireland are as follows:
• the number of acute hospital beds in 2000 (11,832) is approximately 6,000 lower than the numberin 1980 (17,665);
• the number of acute hospital beds per capita in Ireland is one of the lowest among EU and OECD
countries at 3.1 beds per 1,000 population; this compares with 5.1 per 1,000 population in 1980;
• despite the reduction in bed stock since 1980, total hospital activity, excluding outpatients, hasincreased by 57%since 1980. Outpatient attendances have increased by 37%since 1980;
• the increase in total hospital activity, excluding outpatients, is largely due to a marked increase inday activity. In 1980, approximately 8,000 day case treatments were recorded, consti tuting 2%of allnon-outpatient care. In 2000, there were approximately 320,000 day cases, representing 38%of all hospital activity and 68%of elective hospital activity;
• inpatient activity levels have been maintained, primarily as a consequence of a steady decline inaverage length of stay (ALOS). The ALOSis now 6.6 days, reduced from 9.7 days in 1980;
• since 1995 total hospital acti vity, i.e. inpatients plus day cases, has increased by 20%. Inpatientactivity has increased by 2%despite a 1%decrease in bed numbers;
• currently, 71%of inpatients are admitted through A&E departments. These emergency admissionsshow a preponderance of older patients with medical conditions: 82%of medical inpatients areadmitted as emergencies; 37%of surgical inpatients are admitted as emergencies;
• the age-specific distribut ions of inpatients and bed day use show that older people have adisproportionate need for hospital services. In 2000, people over 65 years consti tuted 11%of thetotal population, comprised 27%of the acute hospital inpatient population and consumed 46%ofacute hospital inpatient bed days;
• the proportion of inpatients who are medical has increased steadily, with a concomitant decline inthe proportion of surgical inpatients. In 2000, these proportions were 75%and 25%respectively. This
is out of step with current bed designations, resulting in encroachment by medical patients onsurgical beds and cancellation of surgical procedures;
9
A c u t eH o s pi t al B e d C a p a c
i t y
A N a t i on al R evi ew

8/8/2019 Acute Hospital Bed Capacity
http://slidepdf.com/reader/full/acute-hospital-bed-capacity 12/94
• bed occupancy levels are unacceptably high in the major hospitals. Twenty-three hospitals haveoccupancy levels of greater than an internationally recognised measure of ful l occupancy of 85%.Among these hospitals the average occupancy level is 95%; the range of occupancy is from 85%to 123%;
• wait ing lists continue to put pressure on an acute hospital system which is unable to accommodateelecti ve admissions. Current waiting lists are comprised primarily of patients await ing surgicalprocedures in ENT, General Surgery, Gynaecology, Ophthalmology, Orthopaedics and Plastic Surgery.There are currently almost 27,000 patients nationally who have waited three months or more for electiveinpatient treatment;
• demographic projections for Ireland suggest that by 2011 the population aged 65+ will have increasedby 20%from 421,600 to 503,900. By 2026, people aged 65+ wil l have almost doubled in number to anestimated 767,300, and will consti tute 16.4%of the population. This is a factor of major significance inplanning for the provision of acute hospital services;
• demand for healthcare is increasing, related to better education, increased expectations, economic
prosperity and technological advances in healthcare, permitting earlier and improved diagnosis andtreatment.
Estimation of current and future bed requirements has been carried out taking account of current activitylevels, current pressures, increasing patient demand, potential changes to clinical practice and projecteddemographic changes. The outcomes in terms of bed numbers are presented in Table S1. The gross estimate of addit ional bed need takes account of those diff iculties in the hospital system which require immediateattention (occupancy levels and waiting lists) and factors which will increase the need for beds in the future(demographic changes and demand). The net estimate assumes parallel investment in strategies aimed atreducing the need for acute hospital beds. These include additional communi ty support services andfacil it ies to allow for timely discharge of patients to more appropriate settings, additional day facil it ies to
allow for substi tut ion of inpatient with day surgery and improved management of existing bed stock.
Table S.1: Additional Acute Hospital Beds Required in Ireland to 2011
Acute Hospital Bed Complement in 2000 11,832
Current Indicators of Inadequate Bed Capacity
Additional beds required to reduce average bed occupancy in major hospitals 883*
Additional beds required to facili tate treatment of Waiting List pat ients 492*
Factors which will Increase the Need for Acute Beds
Additional beds required due to projected demographic changes 1,630*
Addi tional beds requi red to cope wi th increased demand for heal thcare 1,330†
Additional Inpatient Beds Required (Gross Estimate) 4,335
Strategies with the Potential to Reduce Need for Additional Beds
Investment in measures to reduce delayed discharge from acute hospitals 675
Potential use of available capacity in some hospitals 200
Substitution of elective inpatient surgery with day surgery 290
Treatment of one-third of waiting list patients on a day basis 170
Improved management of public and private beds for elective patients 160
Potential Capacity within the Existing System 1,495
Additional Inpatient Beds Required (Net Estimate) 2,840
Additional Days Beds Required (in addition to Net Estimate) 190* Adjusted for 85%occupancy† Application of the estimate of demand to existing bed complement corrected for occupancy
10
A c u t e H o s p i t a l B e d C a p a c i t y
A N a t i o n a l R e v i e w

8/8/2019 Acute Hospital Bed Capacity
http://slidepdf.com/reader/full/acute-hospital-bed-capacity 13/94
Correction of current high occupancy levels in major hospitals accounts for 20%of the estimated grossneed; Waiting Lists account for approximately 11%. By far the greatest need wil l be incurred byprojected demographic changes (38%) and by increasing demand for healthcare (31%). Among thestrategies with the potential to reduce the need for additional beds, investment in measures to reducedelayed discharge from acute hospitals would have the greatest impact. This alone could ‘provide’ 16%of the capacity required. Investment in day facil it ies, and a substantial shift of elective inpatient surgeryto day surgery could reduce the need for additional beds by 11%. The potential to use available capacityin some hospitals could provide a further 5%of the need. Strict adherence to an 80/20 ratio of publicand private beds for elective patients has the potential to contribute 4%of the need identified.
It is essential to record that combined implementation of all of these strategies will not resolve thecurrent capacity deficit. It could provide up to one-third of the beds needed. However, at least two-thirds of the required capacity must be added to the system, in conjunction with significant parallelinvestment in the strategies outlined.
This Review addresses the issue of hospital bed capacity on a national basis. Assessment of bed needsby region and by specialty wil l fall within the remit of the proposed National Hospitals Agency asoutlined in Quality and Fairness: A Health System for You . Pending the establishment of the agency, theDOHCwil l ini tiate steps to determine the most appropriate distribution of addit ional capacity by regionand specialty in consultation with the health boards and the ERHA, with professional bodies and otherrelevant interests.
It is recognised that acute hospital care is just one component of a healthcare delivery system. Hospitalservices cannot be evaluated in isolation from primary care, community services and specialist careservices. The need for hospital services is influenced by the availability and accessibi li ty of thoseservices which can reduce the need for acute interventions, can enable safe discharge to community or
home and can act as either substitutes for, or complements to, hospital services. It is also recognisedthat adding beds is only part of the solution to the diff iculties being experienced in the acute hospitalsystem. Clearly, beds must be managed, staffed and resourced in order to be effective. They are,however, the cornerstone of service provision in the acute hospital system.
It is unlikely that this Review will meet with universal approval. However, it is hoped that, as the firstsystematic attempt to estimate acute hospital bed need in Ireland, it will act as a catalyst for informeddebate and planning and provide a framework for future analyses of hospital bed capacity.
11
A c u t eH o s pi t al B e d C a p a c
i t y
A N a t i on al R evi ew

8/8/2019 Acute Hospital Bed Capacity
http://slidepdf.com/reader/full/acute-hospital-bed-capacity 14/94
Introduction

8/8/2019 Acute Hospital Bed Capacity
http://slidepdf.com/reader/full/acute-hospital-bed-capacity 15/94
Introduction
Background
The Programme for Prosperity and Fairness outlined the commitment of the Government to a reviewof hospital bed capacity in both acute and non-acute settings, to be carried out by the Department ofHealth and Children in conjunction with the Department of Finance and in consultation with the SocialPartners.1 The focus of this report is on bed capacity in publ icly-funded acute hospitals in Ireland. Thecapacity needs of the sub-acute sector have been assessed separately and are included in the HealthStrategy; Quality and Fairness: A Health System For You.2
The purposes of this Review were:
• to provide an historical overview of acute hospital bed complement and activity in Ireland over the
last two decades to identify changes which may be relevant to the current provision of acutehospital services;
• to examine and report on the current bed complement and utilisation of beds in acute publicly-funded hospitals; and
• to estimate the need for change to current bed complement and utilisation patterns, taking accountof factors which impact on demand for acute hospital beds at this time and into the future.
Consultation Process
The review involved consultation with the Department of Finance, the Health Boards and the ERHA.Submissions were invited from each Health Board and the ERHA in relation to perceived capacity needs
in their areas and meetings were held with their representatives. Meetings were also held with the IrishHospital Consultants Association, the Irish Nurses Organisation, the Intensive Care Society of Ireland, theConference of Religious in Ireland and the St. Vincent de Paul Society. In addition, representations werereceived from the Irish Medical Organisation.
Professional Services
Information from the consultation process identified common themes and needs throughout thecountry, arrived at by varying methods and levels of analysis. The DOHCcontracted the professionalservices of Mary B. Codd, MD, PhD, to collate that information, to take the lead on an objective analysisof acute hospital bed capacity nationally and to produce this report. The professional services of Ms.Lorna Reilly, Executive Assistant, are also acknowledged.
Structure of the Review
Section 1 outlines the context for a review of acute hospital bed capacity in Ireland. Changes in acutehospital bed numbers and hospital activity between 1980 and 2000 are reviewed, as are populationchanges over the same period.
Section 2 compares current acute hospital beds per capita with similar data from OECD countries.Recent experiences of selected countries in relation to hospital bed capacity are presented.
Section 3 describes trends in acute hospital activity in Ireland since 1995, based on Hospital In-PatientEnquiry (HIPE) data. Specif ic attention is given to changes in the relative distributions of medical and
surgical patients, and the increasingly high proport ion of medical patients admitted through A&Edepartments.
13
A c u t eH o s pi t al B e d C a p a c
i t y
A N a t i on al R evi ew

8/8/2019 Acute Hospital Bed Capacity
http://slidepdf.com/reader/full/acute-hospital-bed-capacity 16/94
Section 4 examines acute hospital activity in 2000 with particular attention to the age-specificdistributions of inpatients and bed days used as the basis for estimates of future bed requirement dueto demographic changes.
Section 5 examines current indicators of inadequate hospital bed capacity and estimates the addit ionalbeds which would be required to deal with high bed occupancy levels and waiting lists.
Section 6 estimates the additional beds required to accommodate the emerging pressures of a changingdemographic profile and increasing demand for healthcare to 2011.
Section 7 discusses the potential impact of measures which might reduce the need for hospital beds,including the potential to discharge patients in a timely manner and the potential to substi tuteinpatient with day surgery.
Section 8 combines data from all previous sections to provide estimates of the addit ional number ofbeds needed in the acute hospital sector over the next ten years.
The analyses in this Review are based on data made available from relevant agencies. These include:all acute hospitals through the Information Management Unit and Acute Hospitals’ Division, DOHC, theEconomic and Social Research Insti tute (ESRI), the Central Statistics Office (CSO), the Intensive CareSociety of Ireland (ICSI), health boards and the ERHA and individual hospitals for selected data.Assessing the validity of the data was outside the remit of this exercise. Certain limitations of theavailable data may have precluded more accurate estimation of need. Much of the data and theanalyses supporting this Review have been compiled in a Technical Report entitled Acute Hospital Bed Capacity: A National Review, Technical Report incorporating Supporting Data and Analyses . This isavailable on request from the Acute Hospitals’ Division, DOHC, Hawkins House, Hawkins Street, Dublin 2or on the DOHCwebsite, www.doh.ie.
14
A c u t e H o s p i t a l B e d C a p a c i t y
A N a t i o n a l R e v i e w

8/8/2019 Acute Hospital Bed Capacity
http://slidepdf.com/reader/full/acute-hospital-bed-capacity 17/94
15
A c u t eH o s pi t al B e d C a p a c
i t y
A N a t i on al R evi ew
8/8/2019 Acute Hospital Bed Capacity
http://slidepdf.com/reader/full/acute-hospital-bed-capacity 18/94
SECTI ON 1
Context for Review
of Acute Hospital
Bed Capacity

8/8/2019 Acute Hospital Bed Capacity
http://slidepdf.com/reader/full/acute-hospital-bed-capacity 19/94
1.1 Introduction
This section outlines the context for a review of acute hospital bed capacity in Ireland. Changes in acutehospital bed numbers and hospital activity between 1980 and 2000 are reviewed, as are populationchanges over the same period.
1.2 Context
Acute hospitals in Ireland are experiencing significant di ff iculties in the delivery of services at this time.There are capacity issues, staffing and resource issues, and dissatisfaction among patients and thegeneral public. Issues which exacerbate or are symptomatic of inadequate capacity include:
• high attendance rates at the A&E departments of acute hospitals;
• long delays in A&E for treatment and/or admission;
• insufficient acute hospital beds to facil itate admission to hospital;
• increasing proportions of hospital beds occupied by patients admitted through A&E;
• cancellation of elective admissions and procedures;
• long waiting lists for elective procedures;
• acute hospital beds occupied by persons no longer in need of acute care; and
• unacceptably high bed occupancy levels in major acute hospitals.
Many are also compounded by shortages of staff and other resources. The net result is that servicedelivery is compromised. It is recognised that adding beds to the system is just part of the solution.They are, however, the cornerstone of service provision in the acute hospital, and the resource to whichall other resources are mapped. Changes in bed complement may be the result of forces unrelated tohealth or healthcare, but have important consequences for service deli very. A review of changes inacute hospital bed complement in Ireland over 20 years to the present time provides a backdrop to thecapacity issues currently being experienced.
1.3 Hospital Bed Complement and Activity, 1980 to 2000
Health Statistics for Ireland are published each year by the Department of Health and Children.
Included are statistics pertaining to publ icly-funded hospital services, such as number of acute hospitalbeds, number of inpatients discharged, average length of stay (ALOS) and number of day cases. Inrecent years reports have provided specialty statistics for all hospitals. Outpatient statistics are alsoprovided. Data for these reports come directly from publicly-funded hospitals in the form of a monthlyIntegrated Management Report (IMR).
Annual Health Statistics reports for each year, from 1980 to 1996 inclusive, were reviewed,3-16 togetherwith data for the years 1997 to 2000 which have not yet been published in Health Statistics reports.17
The acute hospitals included in this analysis are as listed in Section H, Acute Hospital Services, HealthStatistics 199916 and are listed in the Technical Report .see p.14 The number of acute beds, inpatients, daycases, outpatients and ALOSare presented in Table 1.1 and Figure 1.1.
17
A c u t eH o s pi t al B e d C a p a c
i t y
A N a t i on al R evi ew

8/8/2019 Acute Hospital Bed Capacity
http://slidepdf.com/reader/full/acute-hospital-bed-capacity 20/94
Table 1.1: Acute Hospital Beds, Inpatients, Average Length of Stay (ALOS), Day Cases andOutpatients in Ireland, 1980 to 2000
Year Ref. Beds† Inpatients ALOS Day Cases Outpatients*1980 (3) 17,665 543,698 9.7 8,377 1,460,198
1981 (4) 17,668 562,633 9.4 8,796 1,452,060
1982 (5) 17,582 570,743 9.0 11,879 1,528,242
1983 (6) 17,633 565,658 8.6 18,387 NA
1984 (7) 17,636 560,969 7.5 20,486 1,552,508
1985 (8) 17,223 570,628 7.5 NA 1,574,489
1986 (8) 16,878 566,105 7.4 50,136 1,621,035
1987 (9) 15,225 512,004 7.3 85,167^ 1,524,726
1988 (10) 13,632 491,474 7.0 107,352^ 1,581,185
1989 (11) 13,634 507,048 6.9 119,131^ 1,580,052
1990 (11) 13,753 522,864 6.9 124,748^ 1,675,529
1991 (12) 13,806 520,571 6.8 142,394^ 1,757,173
1992 (13) 12,136 511,586 6.7 155,326^ 1,805,038
1993 (14) 11,809 522,662 6.7 187,101^ 1,818,515
1994 (15) 11,853 522,803 6.6 193,018^ 1,858,648
1995 (16) 11,953 529,393 6.6 207,308^ 1,890,702
1996 (16) 11,937 537,557 6.7 233,908 1,901,292
1997 (17) 11,861 536,236 6.5 249,472 1,928,734
1998 (17) 11,788 537,841 6.5 270,240 1,963,504
1999 (17) 11,781 531,456 6.6 296,533 1,930,942
2000 (17) 11,832 548,834 6.6 319,837 2,006,332
†Excludes day beds NA = Not available
*Outpatients includes new and return attendances
^ The difference between these figures and those reported in the Annual Health Statistics Reports is that thefigures here have been adjusted for day care provided in District Hospitals during those years
N u m b e r
1 9 8 0
1 9 9 7
1 9 9 6
1 9 9 5
1 9 9 4
1 9 9 1
1 9 9 3
1 9 9 2
1 9 9 0
1 9 8 9
1 9 8 8
1 9 8 7
1 9 8 6
1 9 8 1
1 9 8 5
1 9 8 4
1 9 8 3
1 9 8 2
1 9 9 8
2 0 0 0
1 9 9 9
Inpatients Day cases 0
100000
200000
300000
400000
500000
600000
0
5000
10000
15000
20000
Beds
Figure 1.1: Inpatients, Beds and Day Cases in Ireland, 1980 to 2000
Year
B e d s
18
A c u t e H o s p i t a l B e d C a p a c i t y
A N a t i o n a l R e v i e w

8/8/2019 Acute Hospital Bed Capacity
http://slidepdf.com/reader/full/acute-hospital-bed-capacity 21/94
The number of inpatient beds in Ireland decreased from 17,665 in 1980 to 11,832 in 2000. Approximately4,000 inpatient beds were removed from the system between 1984 and 1988. A further 2,000 wereremoved between 1991 and 1993. The number of inpatient beds has remained relatively unchanged since1993. The number of day beds increased from 26 in 1980 to 562 in 2000.
Despite the reduction in bed stock, the number of inpatients treated has remained remarkably constantover the 20-year period as a whole. In 2000, a total of 549,000 inpatients were treated in public hospitalscompared with 544,000 in 1980. It is worth noting that inpatient numbers peaked at 571,000 in 1985 justprior to the removal of acute beds in 1986 and subsequent years.
Inpatient activity levels have been maintained primarily through a steady decline in ALOS. The ALOSnowappears to have stabil ised at 6.6 days, reduced from 9.7 days in 1980. Since 1993, the number of inpatientbeds has remained quite static. However, due to population growth, the number of beds per capita hasdecreased. The number of inpatients has increased. The consequence is that occupancy levels in manyacute hospitals have reached an all-time high.
There has been a dramatic increase in the volume of hospital-based care which is provided on a daybasis. In 1980, day acti vity consti tuted just 2%of all non-outpatient care in hospitals in Ireland. In 2000,38%of all non-outpatient care, exclusive of obstetric care, was provided on a day basis. This demonstratesthat day activity is now an important component of hospital activity.
The number of outpatients seen in the acute hospitals is now approximately 2 million per annum. Thishas increased by 37%since 1980.
Taken together, these data point to an ever-increasing demand for hospital-based care. Hospitals havebecome increasingly busy with fewer beds and higher total numbers of patients.
1.4 Population of Ireland, 1981 to 2000The population of Ireland changed lit tle between 1981 and 1996, either in size or structure (Table 1.2).The total population increased by less than 200,000 (5%) in the 15-year period. The proport ion of childrendecreased from 30%to 24%. The number of older people (65+ years) increased by 45,000, representing anincrease from 10.7%to 11.4%of the total population.
Table 1.2: Population of Ireland: Summary Statistics for the Years 1981 to 2000(E)
1981* 1986* 1991* 1996* 2000 (E)
Age Group N % N % N % N % N %
0-14 1,043,729 30.3 1,024,701 28.9 940,574 26.7 859,424 23.7 824,400 22.0
15-64 2,030,722 59.0 2,131,587 60.2 2,182,245 61.9 2,352,781 64.9 2,538,600 67.065-74 237,057 6.9 240,494 6.8 240,077 6.8 239,351 6.6 238,600 6.2
75+ 131,897 3.8 143,861 4.1 162,823 4.6 174,531 4.8 185,500 4.8
TOTAL 3,443,405 100.0 3,540,643 100.0 3,525,719 100.0 3,626,087 100.0 3,787,100 100.0
* = Census year
(E) = Estimated Source: Central Statistics Office, Dublin
By contrast, the population has grown by approximately 161,000 in the last five years. Virtually all thisgrowth has been in the working age groups due to economic prosperity and net immigration. There arefewer children, now 22%of the population. There are approximately 10,200 more people aged 65+ butthis group sti ll consti tutes just 11%of the total population.
19
A c u t eH o s pi t al B e d C a p a c
i t y
A N a t i on al R evi ew

8/8/2019 Acute Hospital Bed Capacity
http://slidepdf.com/reader/full/acute-hospital-bed-capacity 22/94
1.5 Acute Hospital Beds per Capita, 1981 to 2000
Table 1.3 shows the change in acute hospital beds per 1,000 population from 1981 to 2000. Althoughthe number of acute hospital beds has changed lit tle since 1993, the number per capita in 2000 hasfallen to an all time low of 3.1 per 1,000 due to population growth.
Table 1.3: Acute Hospital Beds per Capita, 1981 to 2000
Year Beds Population Beds per 1,000
1981 17,668 3,443,405 5.1
1986 16,878 3,540,643 4.8
1991 13,806 3,525,719 3.9
1996 11,937 3,626,087 3.3
2000 11,832 3,787,100 (E) 3.1
(E) = Estimated
The current distribution of acute hospital beds by broad clinical category in 2000 is given in Table 1.4.These data are provided by the hospitals to the DOHCon a monthly basis using the IMR.
Table 1.4: Acute Hospital Bed Designations in Ireland, 2000
Clinical Category IMR Bed Designations
N %
General Medicine 4,590 (39)
General Surgery 4,417 (37)
Obstetrics 1,068 (9)
Paediatrics 1,177 (10)
Acute Psychiatry 580 (5)
TOTAL 11,832 (100)
This is the basis upon which the analysis of future bed requirement, taking account of current acti vity,and existing and emerging pressures is based.
1.6 Admission to Acute Hospitals in Ireland
Admission to an acute hospital may be planned (electi ve) or may be required as a matter of urgency(emergency). Elective admissions are those which occur as a consequence of referral to hospital by ageneral practitioner or medical consultant, a visit to the hospital outpatient department or a plannedtransfer from another hospital. Patients who present to, or are referred to, the A&E department and areadmitted to hospital following assessment of need, are deemed to be emergency admissions.
A total of 1.2 million A&E attendances were recorded in Ireland in 2000. This is an increase of almost20%from 1.0 million in 1988, the first year for which A&E attendance was reported in Annual HealthStatistics. To what can the increasing number of A&Eattendances be attributed? The following factorsalmost certainly contribute:
• population growth from approximately 3.4 mill ion in 1980 to approximately 3.8 mill ion in 2000;
• limited availability of ‘out of hours’ primary care services;
• financial disincentives to use primary care as the first option; and
• societal expectations regarding the ready availability and accessibil ity of A&E facilit ies.20
A c u t e H o s p i t a l B e d C a p a c i t y
A N a t i o n a l R e v i e w

8/8/2019 Acute Hospital Bed Capacity
http://slidepdf.com/reader/full/acute-hospital-bed-capacity 23/94
21
A c u t eH o s pi t al B e d C a p a c
i t y
A N a t i on al R evi ew
Approximately one-quarter of A&E attendees are admitted to hospital. In the context of essentiallystatic bed numbers and increasing A&E attendances, this means that an increasing proportion of acutehospital beds are occupied by patients admitted through A&E. There is no established ‘correct ’ ratio ofemergency to elective admissions. Suffice it to say that emergency admissions, by their nature, takeprecedence over elective admissions.
Explanations for the increasing proportion of inpatient admissions which are deemed to beemergencies include:
• increasing attendances at A&E for the reasons outlined above;
• increasing longevity due to better health care and social circumstances;
• changing age distribution of the population (more older people); and
• changing tradit ional care structures in society.
Consequences of current pressures for hospital admission
Increasing pressure to admit emergency patients results in frequent cancellation of planned admissionsfor elective procedures, deferment or cancellation of electi ve procedures for patients in hospital and thepersistence of wait ing lists. It has become increasingly difficult to plan admissions to acute hospitalsand to execute those plans. As a consequence, an emerging practice has been to refer patients to A&Ewho should be admitted electively, but for whom attendance at A&E offers the only prospect of beingadmitted.
The relentless pressure from A&E for admission has also resulted in bed occupancy levels in many acutehospitals which are unacceptably high. A contributing factor is the number of older patients and
patients with chronic conditions admitted through A&E. Many cannot be discharged when their acutecare has been completed because of a lack of appropriate facil it ies for their placement or support .Therefore, acute beds are inappropriately occupied by patients who are medically fit for discharge.Appropriate bed ‘turnover’ is impeded. Meanwhile, the pressure from A&E to admit needy patientscontinues. Delays of several hours awaiting admission are common.
In short, current acute hospital bed capacity in Ireland is unable to respond adequately to the demandsto which it is subjected. Adding capacity is one potential solution. Examining ways in which currentcapacity could be used more effectively and efficiently is another. It is unlikely that one solution can befound for such a complex problem. More likely is that a combination of measures wil l be required.

8/8/2019 Acute Hospital Bed Capacity
http://slidepdf.com/reader/full/acute-hospital-bed-capacity 24/94
SECTI ON 2
International
Comparisons of
Hospital Bed
Capacity

8/8/2019 Acute Hospital Bed Capacity
http://slidepdf.com/reader/full/acute-hospital-bed-capacity 25/94
2.1 Introduction
This section examines hospital bed complement and average length of stay in Ireland in the context ofsimilar data from other countries. Similar efforts at reviews of bed capacity internationally are outl ined.
2.2 OECD Comparisons of Hospital Bed Capacity
The Organisation for Economic Co-operation and Development (OECD), in an analysis of the IrishHealthcare System (1997), stated that the system ‘has resulted in good provision of healthcare at relatively low cost to the taxpayer’ .18 The report also identified significant improvements in hospitalproductivity and found that the ALOSin hospital had been reduced by an amount greater than thatachieved in other OECD countries. The average bed occupancy is one of the highest in the OECD. Inaddition, the reduction in the number of hospital beds was much greater than seen in other OECD
countries. Ireland, on this basis, has shown remarkable productivity gains in hospitals in comparisonto other developed countries.
Some of the above measures of acute hospital infrastructure and acti vity have been examined in moredetail using the OECD Health Data 2000 .19 They include inpatient care beds per 1,000 population, acutebeds per 1,000 population, ALOSand acute bed occupancy levels.
Inpatient Care Beds per 1,000 Population
OECD Definition: Inpatient care beds are those beds accommodating patients who are formally admitted(or ‘hospitalised’) to an insti tut ion for treatment and/or care and who stay for a minimum of one nightin the hospital or other insti tut ion providing inpatient care. Inpatient care is delivered in hospitals,
other nursing and residential care facilities or in establishments which are classified according to theirfocus of care under the ambulatory care industry but perform inpatient care as a secondary acti vity.19
Data for 1996, the most recent year for which the majori ty of OECD countries provided such data, arepresented graphicall y in Figure 2.1. Details of what comprises inpatient care beds and the sources ofinformation for each country are given in the Technical Report .see p.14
Source: OECD Health Data 2000. A Comparative Analysis of 29 Countries. OECD
Health Policy Unit, Paris, France
Figure 2.1: Inpatient Care Beds per 1,000 Population: OECD Countries, 1996
0
5
10
15
20
M e x i c o
T u r k e y
I r e l
a n d
S p a i n
U S A
P o r t u g a l
S w e d e n U K
C a n a d a
K o r e a
D e n m a r k
G r e e c e
P o l a n d
N e w
Z e a l a n d I t a
l y
B e l g i u m
L u x e m b o u r g
A u s t r a l i a
F r a n c e
H u n g a r y
F i n l a n d
C z e c h R e p
A u s t r i a
G e r m a n y
N e t h e r l a n
d s
N o r w a y
J a p a n
B e d s / 1 , 0
0 0 p o p u l a t i o n
23
A c u t eH o s pi t al B e d C a p a c
i t y
A N a t i on al R evi ew

8/8/2019 Acute Hospital Bed Capacity
http://slidepdf.com/reader/full/acute-hospital-bed-capacity 26/94
The number of inpatient care beds per capita ranged from 1.2 per 1,000 in Mexico to 16.2 per 1,000 inJapan. The number of inpatient care beds in Ireland is among the lowest in OECD countries and thelowest among EU countries at 3.7 per 1,000. Among EU countries, the Netherlands had the highest percapita number of inpatient beds with 11.2 per 1,000 (1996 data).
With such a broad range of inpatient beds per capita, it is relevant to examine the type of bedsincluded in this category. All countries include acute care beds. Most countries include psychiatric bedsand some countries include long-term care beds. Long-term care beds are not included in the data forIreland. Other countries which also exclude long-term care beds from the category ‘Inpatient Care Beds’,are Norway, Germany, Poland, Greece, Denmark, Canada, UK, Portugal, and USA. Even among thisgroup, Ireland sti ll has the lowest per capita number of inpatient beds.
Acute Care Beds per 1,000 Population
OECD Definition: Acute care beds are those beds accommodating patients where the principal clinicalintent is to do one or more of the following:19
• manage labour (obstetric);
• cure illness or provide definit ive treatment of injury;
• perform surgery;
• relieve symptoms of il lness or injury (excluding pall iative care);
• reduce severity of il lness or injury;
• protect against exacerbation and/or complication of an illness and/or injury which could threatenlife or normal functions; or
• perform diagnostic or therapeutic procedures.
Data for 1996 are presented graphically in Figure 2.2. Details of what comprises acute care beds and thesources of information for each country are provided in the Technical Report .see p.14
Source: OECD Health Data 2000. A Comparat ive Analysis of 29 Countries. OECD
Health Policy Unit, Paris, France
Figure 2.2: Acute Care Beds per 1,000 Population: OECD Countries, 1996
0
1
2
3
4
5
6
7
8
T u r k e y U .
K .
S w e d e n
C a n a d a
S p a i n U S
A
N o r w a y
P o r t u g a l
I r e l
a n d
D e n m a r k
F i n l a n
d
N e t h e r l a n
d s
K o r e a
A u s t r a l i a
F r a n c e
S w i t z e r l a n
d
L u x e m b o u r g
I t a l y
H u n g a r y
A u s t r i a
C z e c h R e p
G e r m a n y
B e d s / 1 , 0
0 0 p o p u l a t i o n
24
A c u t e H o s p i t a l B e d C a p a c i t y
A N a t i o n a l R e v i e w

8/8/2019 Acute Hospital Bed Capacity
http://slidepdf.com/reader/full/acute-hospital-bed-capacity 27/94
25
A c u t eH o s pi t al B e d C a p a c
i t y
A N a t i on al R evi ew
The number of acute care beds ranged from 2.1 per 1,000 in Turkey to 7.3 per 1,000 in Germany. Thenumber of acute care beds in Ireland (3.4 per 1,000; 1996 data) is 14th of 22 OECD countries and 9th of13 EU countries for which data are available. In general, acute care beds do not include psychiatric orlong-term care beds. Beds in private hospitals in Ireland are not included.
Average Length of Stay
OECD Definition: Average length of stay is computed by dividing the number of days stayed (from thedate of admission in an inpatient institution) by the number of discharges + deaths during the year.Data for 1996 are presented graphically in Figure 2.3.
Source: OECD Health Data, 2000. A Comparative Analysis of 29 Countries. OECD
Health Policy Unit, Paris, France
Of 22 countries for which data are available, Ireland lies in 13th posit ion with ALOSof 6.6 days.
Commentary
The OECD data would suggest that the number of inpatient care beds in Ireland is inadequate whencompared with levels in EU and other developed countries, even allowing for the fact that long-termcare beds are not included in the Irish data. Data for nine other countries are also presented exclusiveof long-term care beds; all of them have higher per capita number of inpatient care beds than Ireland.The number of acute care beds in Ireland is towards the middle to lower part of the OECD range.Countries such as Portugal, Norway, USA, Spain, Canada and the UK have a larger stock of inpatientbeds which are not classified as acute care beds and which potentially alleviate the pressure on acutebeds. Other characteristics of health systems with a low acute bed utilisation rate, such as USA, includethe existence of a large range of ambulatory and intermediate care facilit ies and active management ofhospital utilisation.20 These are not yet as developed in the Irish healthcare system. As outlined in theOECD Review 1997, on objective criteria such as reduction in acute bed numbers and reduction in ALOS,the productivity of the Irish hospital system is deemed to be high and to have exceeded that in OECDcountries.18 However, it is reasonable to suggest that such productivity on objective criteria is now
interfering with service delivery as previously outlined.
Figure 2.3: Average Length of Stay (days): OECD Countries, 1996
0
2
4
6
8
10
12
U K
S w e d
e n
F i n l
a n d T u
r k e y
D e n m
a r k F r
a n c e U S A
N o r w
a y
A u s t r a
l i a
I r e l
a n d
A u s t r i a
P o r t u g a l
S p a i n I t a l y
H u n g a r y
B e l g i u m
C z e c h R e p
N e t h e
r l a n d s
L u x e
m b o
u r g
G e r m
a n y K o
r e a
S w i t z e
r l a n d
D a y s

8/8/2019 Acute Hospital Bed Capacity
http://slidepdf.com/reader/full/acute-hospital-bed-capacity 28/94
2.3 Other International Reviews of Bed Capacity
Concerns about the adequacy of existing acute hospital bed capacity are not unique to Ireland. Withinthe recent past a National Beds Inquiry was undertaken in the UK.20, 21 It reviewed historical trends inacute health services, examined local and international variations in services and trends, assessed thekey drivers of future service requirements, reviewed dif ferent models of care and explored a range ofprojections of future activity.
The length of hospital wait ing lists and the recurrence of winter pressures on emergency beds suggestedthat present hospital services were not well matched to patient needs. At the same time, there wascontinuing evidence of inappropriate and avoidable use of hospital beds. The key drivers of futureservice requirements examined included demographic changes, technological advances in healthcare,and their impact on changes in clinical practice, the behaviour of increasingly well-informed customersand carers, i.e. demand, and cost-effectiveness of alternative forms of care. Of all of these, the currentuse of hospital beds by older patients was seen as the most important predictor of future hospital bed
requirement. In the UK, persons aged 65+ consti tute 16%of the population and occupy almost two-thirds of general and acute hospitals beds, accounting for over half the recent growth in emergencyadmissions.21 A review of acute hospitals carried out in Northern Ireland identi fied simi lar drivers ofneed for hospital services.22 Commentaries on the National Beds Inquiry identified that the fact thatbed capacity had not kept pace with need and suggested that the reductions in bed stock had “gone toofar”. 23, 24
In the USA, after a period of excess capacity in the 1990s, hospitals are now experiencing significantdif ficulties in meeting inpatient demand. Occupancy rates have increased from 50%to 85%and above.A study of approximately 3,000 acute hospitals nationwide, carried out by the Healthcare AdvisoryBoard, has identified increased demand for health services, population changes and fixed bed capacityas the reasons for increased occupancy rates.25
26
A c u t e H o s p i t a l B e d C a p a c i t y
A N a t i o n a l R e v i e w

8/8/2019 Acute Hospital Bed Capacity
http://slidepdf.com/reader/full/acute-hospital-bed-capacity 29/94
27
A c u t eH o s pi t al B e d C a p a c
i t y
A N a t i on al R evi ew
8/8/2019 Acute Hospital Bed Capacity
http://slidepdf.com/reader/full/acute-hospital-bed-capacity 30/94
SECTI ON 3
Trends in Acute
Hospital Activity
1995 to 2000

8/8/2019 Acute Hospital Bed Capacity
http://slidepdf.com/reader/full/acute-hospital-bed-capacity 31/94
3.1 Introduction
This section analyses the trends in acute hospital activity in Ireland from 1995 to 2000 inclusive. Theanalysis is based on data recorded in the national HIPE database collated by the Economic and SocialResearch Institute (ESRI) on behalf of the DOHC. Specific attention is given to changes in the relativedistributions of medical and surgical patients and the impact this has on current hospital activity.
3.2 Methodology
The HIPE Database
The HIPE database is a computer-based information system designed to record completed episodes of
care in acute hospitals in Ireland. Thus it records discharges rather than admissions. HIPE data arecollated in all acute hospitals in the country, including maternity and paediatric hospitals. While therewere concerns about the quality of HIPE data in the early years of the database, they are regarded asbeing virtually complete for the acute hospitals since 1995. The maternity hospitals entered the HIPEsystem later, however, and it is estimated that full coverage of obstetric acti vity was not accomplishedunt il 1999 (ESRI, personal communication). For this reason data on trends in acute hospital activitybetween 1995 and 2000 are presented excluding obstetric data.
The HIPE database comprises demographic, administrative and clinical data on inpatients and day casesin acute hospitals. It does not include outpatient data. Clinical data, extracted from relevant clinicalrecords for that admission, are coded according to the International Classification of Disease (ICD)System.26 Details of the data items recorded in the HIPE database are available in the Technical Report .see p.14 Of relevance to this Review is the abil ity to identify hospital patients as inpatients or day
cases, emergency or elective admissions, public or private patients, and to analyse their age, length ofstay in hospital and principal diagnoses and/or procedures from the HIPE data.
The strengths of the HIPE database include the following:
• it provides the basis for analysis of hospital activity on a national basis;
• the completeness and accuracy of data are high. It is estimated that 98%of acute hospital activity isnow reported to the national HIPE database annually (Information Management Unit (IMU), DOHC,personal communication);
• clinical activity data can be produced by Diagnosis Related Group (DRG) and by Major DiagnosticCategory (MDC).
Limitations of the HIPE database include the following:
• data are essentially confined to acute publicly-funded hospitals. There are no data from mostprivate hospitals or from convalescent or nursing homes;
• entries are based on episodes of care rather than individual patients; thus a patient who has beenadmitted repeatedly wil l be represented several t imes in the database.
Data Analysis
HIPE data for each year 1995 through 2000 were analysed using SAS.27 Patients were identified asinpatients or day casesbased on source of admission, duration of stay and destination on discharge.
Inpatients were deemed to be emergency or elective based on source of admission. Emergency patientsare inpatients; elective patients may be inpatients or day cases.
29
A c u t eH o s pi t al B e d C a p a c
i t y
A N a t i on al R evi ew

8/8/2019 Acute Hospital Bed Capacity
http://slidepdf.com/reader/full/acute-hospital-bed-capacity 32/94
Patients were divided into two distinct clinical categories, ‘medical’ or ‘surgical ’, based on ICD-codeddiagnostic and procedural data, the rationale being that, while all patients are unique, groups ofpatients have demographic, diagnostic and therapeutic attributes in common which determine to somedegree their level of resource requirement. ‘Surgical’ patients are defined by the procedure which hasbeen performed which in turn distinguishes them from ‘medical’ patients.28 (Technical Report see p.14).
Presentation of Results
The following parameters of clinical activity are presented:
• A&E attendances;
• the proportion of A&E attendees admitted to hospital;
• total admissions (i.e. inpatients and day cases);
• inpatients discharged;
• emergency and elective inpatients discharged;
• inpatient bed days used;
• average length of stay;
• day cases treated;
• the proportion of all patients and of elective patients treated as day cases; and
• outpatient attendances.
Results are presented graphically. All data upon which Figures are based are provided in Appendix I.Numbers of patients/attendances and rates per 1,000 population are presented for each year, 1995through 2000, to identify recent trends in hospital acti vity. Rates per 1,000 were estimated using specificCSO population estimations for each year. These data are provided in the Technical Report .see p.14
Reporting both numbers and rates per 1,000 is of value. The former indicates the service load for acutehospitals, while the latter measures change in activity, ‘corrected’ for change in population size.
30
A c u t e H o s p i t a l B e d C a p a c i t y
A N a t i o n a l R e v i e w

8/8/2019 Acute Hospital Bed Capacity
http://slidepdf.com/reader/full/acute-hospital-bed-capacity 33/94
31
A c u t eH o s pi t al B e d C a p a c
i t y
A N a t i on al R evi ew
3.3 Patients Treated in Acute Hospitals
A&E Department Activity, 1995 to 2000
A&E activity is reported by hospitals as number of attendances. The proport ion of A&E attendeesadmitted was computed from emergency admission data in the HIPE database.
In 1995 there were 1,199,452 A&E attendances in Ireland. The number increased by 2.5%to 1,229,303between 1995 and 1999 (data for 2000 are provisional at this time). The proportion of A&E attendees
admitted to hospital has been quite consistent between 1995 and 1999 at approximately 25%.
Total Admissions, 1995 to 2000
Included in this category are all patients (inpatients and day cases) admitted to acute hospitals.
In 1995 there were 594,620 admissions to acute hospitals, excluding obstetric admissions. The totalnumber of admissions to acute hospitals increased by 20%to 711,694 between 1995 and 2000. Therewas a 14%increase in the rate of admissions per 1,000 population between 1995 and 2000.
Figure 3.2: Total Admissions, excluding Obstetric Patients, 1995 to 2000
0
100
200
300
400
500
600
700
800
0
20
40
60
80
100
120
140
160
180
200
1995 1996 1997 1998 1999 2000
Number Rate
T h o u s a n d s R
a t e / 1 , 0 0 0
Figure 3.1: A&E Attendances and %of A&E Attendees admitted to Hospital, 1995 to 2000
0
300
600
900
1200
1500
0
10
20
30
40
50
60
70
80
90
100
1995 1996 1997 1998 1999 2000
%Admitted Attendances
T h o u s a n d s
%

8/8/2019 Acute Hospital Bed Capacity
http://slidepdf.com/reader/full/acute-hospital-bed-capacity 34/94
Inpatients Discharged, 1995 to 2000
Total admissions may be separated into inpatient admissions and day cases. Inpatients refer to those
patients who are admitted to hospital, either electively or as an emergency, and who require the use ofa hospital bed overnight.
The number of inpatients discharged increased by 2%between 1995 and 2000. However, the inpatientrate per 1,000 population decreased by 3%due to population growth. This indicates that, although thenumber of inpatients increased, the per capita availability of inpatient services was reduced. Thus
hospital inpatient capacity has not kept pace with population growth over the last five years.
Emergency Admissions, 1995 to 2000
Hospital admission may be planned (elective) or required as a matter of urgency (emergency). Theproport ion of inpatient admissions which are emergency has a significant bearing on the scope forelective treatment. Figure 3.4 shows the proportions of inpatients admitted as emergencies from 1995to 2000.
Inpatients admitted through A&E increased from 291,121 (67.2%) in 1995 to 314,241 (71.2%) in 2000.This represents and overall increase of 8%, or an average annual increase of 1.6%.
Figure 3.4: %of Inpatients, excluding Obstetric Inpatients,admitted as Emergencies, 1995 to 2000
50
55
60
65
70
75
1995 1996 1997 1998 1999 2000
67.2 67.668.6
69.971.1 71.2
%
Figure 3.3: Inpatients Discharged, excluding Obstetric Inpatients, 1995 to 2000
0
100
200
300
400
500
0
40
80
120
160
1995 1996 1997 1998 1999 2000
Number Rate
T h o
u s a n d s R
a t e /
1 , 0 0 0
32
A c u t e H o s p i t a l B e d C a p a c i t y
A N a t i o n a l R e v i e w

8/8/2019 Acute Hospital Bed Capacity
http://slidepdf.com/reader/full/acute-hospital-bed-capacity 35/94
33
A c u t eH o s pi t al B e d C a p a c
i t y
A N a t i on al R evi ew
Bed Days Used and Average Length of Stay, 1995 to 2000
A measure of the burden of care incurred by inpatients is the number of bed days used in the course of
their hospital stay. Bed days are computed from length of stay data for each inpatient. ALOSiscomputed from total number of bed days divided by total inpatients.
The number of bed days used decreased by 3%between 1995 and 2000, related to a small reduction inbed numbers (see Table 1.1) and bed closures. It is notable that, despite fewer bed days available forthese reasons, more inpatients were treated and ALOSactually decreased slightly over this period.Average lengths of stay decreased from 7.2 to 6.9 days over the period.
Day Cases, 1995 to 2000
Day cases refer to those patients who are admitted to hospital for care and/or treatment which can takeplace on a day basis, who do not require the use of a hospital bed overnight and who are discharged asplanned.
The number of day cases increased by 68%between 1995 and 2000 from 161,404 to 270,577, an average
annual increase of 13.5%. The rate of day acti vity per 1,000 population increased by 60%over theperiod.
Figure 3.6: Day Cases, excluding Obstetric Day Cases, 1995 to 2000
0
50
100
150
200
250
300
350
0
20
40
60
80
1995 1996 1997 1998 1999 2000
Number Rate
T h o u s a n d s R
a t e / 1 , 0 0 0
Figure 3.5: Bed Days Used and Average Length of Stay, excluding Obstetric Inpatients, 1995 to 2000
0 500,000 1,000,000 1,500,000 2,000,000 2,500,000 3,000,000 3,500,000
1995
1996
1997
1998
1999
2000
1995
1996
1997
1998
1999
2000
6.0 6.5 7.0 7.5
Inpatients Bed Days Used ALOS

8/8/2019 Acute Hospital Bed Capacity
http://slidepdf.com/reader/full/acute-hospital-bed-capacity 36/94
Proportion of All Patients and Elective Patients treated as Day Cases, 1995 to 2000
An important indicator of the changing profile of hospital practice is the proportion of patients treated
on a day basis. In reporting this figure it is important to distinguish between two possibledenominators, i.e. of all patients treated or of elective patients treated.
The proportion of all patients treated on a day basis in 2000 was 38%. This had increased steadily from27%in 1995. The proportion of elective patients treated on a day basis in 2000 was 68%. This hadincreased from 53%in 1995.
Outpatient Attendances, 1995 to 2000
Data on outpatients are recorded as number of attendances at consultant-controlled outpatient clinics.
The number of outpatient attendances increased by 6%between 1995 and 2000, except for a dip in1999, most likely related to the nurses’ strike during which outpatient clinics were cancelled. This is anaverage annual increase of 1.2%.
Figure 3.8: Outpatient Attendances: Numbers and Rates per 1,000 Population, 1995 to 2000
1800
1840
1880
1920
1960
2000
500
505
510
515
520
525
530
535
1995 1996 1997 1998 1999 2000
Number Rate
T h o u s a n
d s R
a t e / 1 , 0 0 0
Figure 3.7: %Treated as Day Cases, excluding Obstetric Day Cases, 1995 to 2000
0
10
20
30
40
50
60
70
80
1995 1996 1997 1998 1999 2000
%
%of All %of Elective
34
A c u t e H o s p i t a l B e d C a p a c i t y
A N a t i o n a l R e v i e w

8/8/2019 Acute Hospital Bed Capacity
http://slidepdf.com/reader/full/acute-hospital-bed-capacity 37/94
3.4 Medicine vs Surgery: The Evolving Relationship
Examining trends in hospital activity would be incomplete without some analysis of activity by broadclinical category. An increasingly important basis for acti vity analysis is whether patients are ‘medical’ or‘surgical ’. At an operational level, services in acute hospitals are organised along medical and surgicallines, consultant clinical staff are appointed as physicians or surgeons and facil it ies required by medicaland surgical specialties differ. Patient volumes, bed day use and activity levels also differ betweenmedical and surgical specialties. The relationship between medical and surgical specialties is in acontinuous state of flux as diagnostic and treatment technologies and possibi li ties continue to evolve.
Medicine vs Surgery: Total Admissions, 1995 to 2000
Analysis by clinical category of the data presented in Figure 3.2 for total admissions (i.e. inpatient andday cases) are presented in Figure 3.9.
Almost three-quarters of all admissions to the acute hospitals are ‘medical’ admissions. The totalnumber of admissions to acute hospitals increased by 20%between 1995 and 2000 (Figure 3.2). Theincrease was greater for ‘medical’ patients (23%) than for ‘surgical ’ patients (11%). As a consequence theproportion of all admissions which are ‘medical’ has increased from 72%in 1995 to 74%in 2000.
Figure 3.9: Medicine vs Surgery: Total Admissions, excluding ObstetricPatients, 1995 to 2000
0
100
200
300
400
500
600
1995 1996 1997 1998 1999 2000
Medical Surgical
T h o u s a n d s
35
A c u t eH o s pi t al B e d C a p a c
i t y
A N a t i on al R evi ew
8/8/2019 Acute Hospital Bed Capacity
http://slidepdf.com/reader/full/acute-hospital-bed-capacity 38/94
36
A c u t e H o s p i t a l B e d C a p a c i t y
A N a t i o n a l R e v i e w
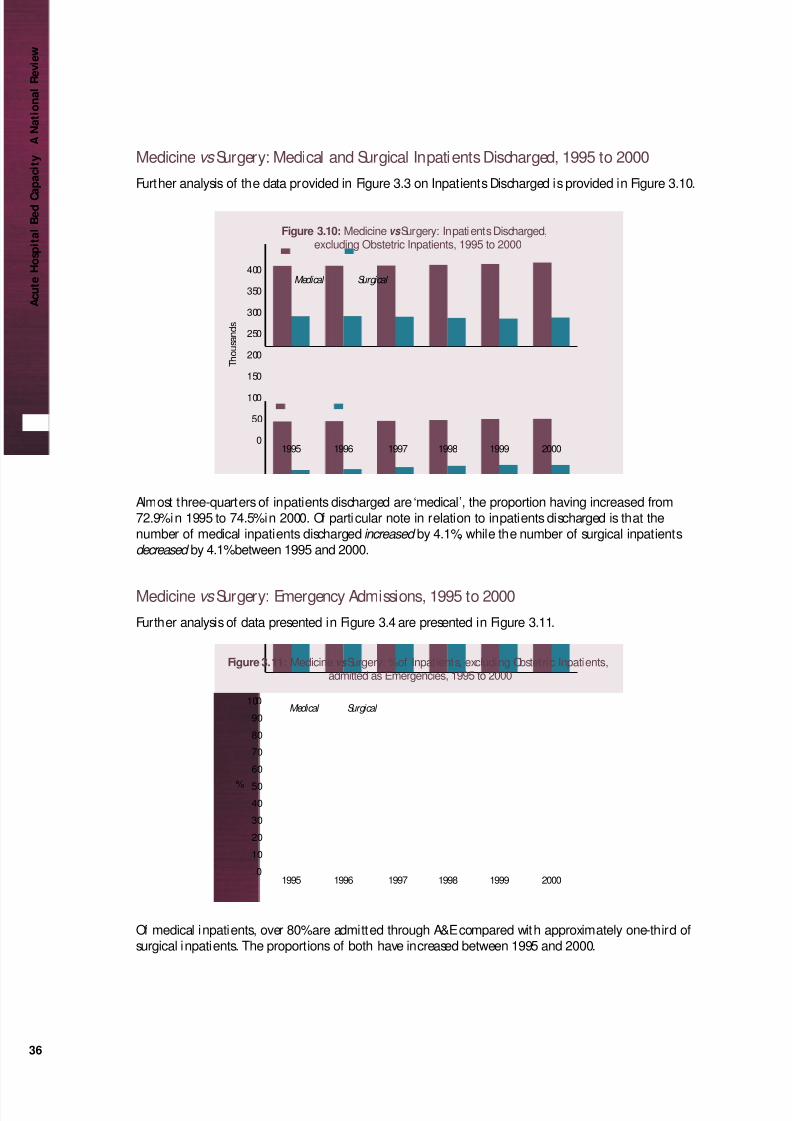
Medicine vs Surgery: Medical and Surgical Inpatients Discharged, 1995 to 2000
Further analysis of the data provided in Figure 3.3 on Inpatients Discharged is provided in Figure 3.10.
Almost three-quarters of inpatients discharged are ‘medical’, the proportion having increased from72.9%in 1995 to 74.5%in 2000. Of particular note in relation to inpatients discharged is that thenumber of medical inpatients discharged increased by 4.1%, while the number of surgical inpatientsdecreased by 4.1%between 1995 and 2000.
Medicine vs Surgery: Emergency Admissions, 1995 to 2000
Further analysis of data presented in Figure 3.4 are presented in Figure 3.11.
Of medical inpatients, over 80%are admitted through A&E compared with approximately one-third ofsurgical inpatients. The proportions of both have increased between 1995 and 2000.
Figure 3.11: Medicine vs Surgery: %of Inpatients, excluding Obstetric Inpatients,admitted as Emergencies, 1995 to 2000
0
10
20
30
40
50
60
70
80
90
100
1995 1996 1997 1998 1999 2000
%
Medical Surgical
Figure 3.10: Medicine vs Surgery: Inpatients Discharged,excluding Obstetric Inpatients, 1995 to 2000
0
50
100
150
200
250
300
350
400
1995 1996 1997 1998 1999 2000
T h o u s a n d s
Medical Surgical

8/8/2019 Acute Hospital Bed Capacity
http://slidepdf.com/reader/full/acute-hospital-bed-capacity 39/94
37
A c u t eH o s pi t al B e d C a p a c
i t y
A N a t i on al R evi ew
Medicine vs Surgery: Bed Days Used and ALOS, 1995 to 2000
Data provided in Figure 3.5 are examined by clinical category in Figure 3.12.
The overall reduction in bed days used from 1995 to 2000 was 3%. This obscures the fact that there wasa significant difference between ‘medical’ and ‘surgical ’ patients. The reduction in the numbers of beddays used by ‘medical’ patients was negligible (less than 1%) while the numbers of bed days used by‘surgical ’ patients decreased by 8%over the period. Although ALOSdecreased over the period for bothmedical and surgical patients, ALOSfor surgical patients was higher in each year than for medicalpatients. Almost three-quarters of all bed days are taken up by medical patients.
Medicine vs Surgery: Day Cases, 1995 to 2000
Further analysis of data presented in Figure 3.6 are presented in Figure 3.13.
The overall number of day cases increased by 68%between 1995 and 2000. This was due to a 76%increase in ‘medical’ day cases and a 48%increase in ‘surgical ’ day cases.
Figure 3.13: Medicine vs Surgery: Day Cases excluding Obstetric Day Cases, 1995 to 2000
0
50
100
150
200
250
1995 1996 1997 1998 1999 2000
T h o u s a n
d s
Medical Surgical
Figure 3.12: Medicine vs Surgery: Bed Days Used and Average Length of Stay,excluding Obstetric Inpatients, 1995 to 2000
0 500000 1000000 1500000 2000000 2500000 6 7 8
2000 2000
1999 1999
1998 1998
1997 1997
1996 1996
1995 1995
Surgical Medical

8/8/2019 Acute Hospital Bed Capacity
http://slidepdf.com/reader/full/acute-hospital-bed-capacity 40/94
38
A c u t e H o s p i t a l B e d C a p a c i t y
A N a t i o n a l R e v i e w
Figure 3.14 examines the proportion of all medical and surgical patients and the proportion of elective medicaland surgical patients treated on a day basis.
The proportions of all medical and all surgical patients treated on a day basis increased gradually from 1995 to2000 (25%to 38%of all medical patients; 29%to 39%of all surgical patients).
The proportions of elective medical and elective surgical patients treated on a day basis also increased from 1995to 2000 (64%to 78%of elective medical patients; 38%to 50%of elective surgical patients), but were significantlydifferent from each other each year. This is due to the fact that over 80%of medical inpatients are emergencyadmissions. Thus ‘medical’ day cases account for a very high proportion of elective medical activity. It is of note,however, that the increase in ‘medical’ day activity was significantly higher at 70%than the increase in ‘surgical ’day activity (48%). This points to a potential area for further increases in day activity which wil l be analysed inSection 7.
Medicine vs Surgery: Bed Designations vs Clinical Activity
Designation of beds to clinical categories and specialt ies takes place within hospitals. Bed designations byspecialty are reported monthly and annually to DOHCalong with clinical activity data.
From the data reported by hospitals, beds designated to ‘medical’ and ‘surgical ’ specialties were collated (detailprovided in the Technical Report see p.14). For the purposes of this exercise only those beds designated for use bymedical and surgical patients are examined. From HIPE data, bed days used by ‘medical’ and ‘surgical ’ patients,defined as previously outlined, were collated. Bed days used by children (0-14), obstetric patients and acutepsychiatric patients were excluded.
What is clear from this comparison is that current utilisation of ‘medical’ and ‘surgical ’ beds is out of step withcurrent bed designations. It confirms the anecdotal evidence of encroachment by medical patients on surgicalbeds in situations of fixed bed capacity. Given the high proportion of medical inpatients admitted asemergencies (82%), elective surgical patients are being cancelled to make space for emergency medical patients.
Figure 3.15: Medicine vs Surgery: Bed Designations vs Clinical Activity
Medical
Bed Designations Clinical Activity
Surgical Medical Surgical
Figure 3.14: Medicine vs Surgery: Proport ions of All Patients and of Elective Patients treated as Day Cases, 1995 to 2000
1995 1996 1997 1998 1999 2000
% %
Medical
%of All %of Elective
Surgical
0
20
40
60
80
100
1995 1996 1997 1998 1999 2000
Medical Surgical
0
20
40
60
80
100

8/8/2019 Acute Hospital Bed Capacity
http://slidepdf.com/reader/full/acute-hospital-bed-capacity 41/94
39
A c u t eH o s pi t al B e d C a p a c
i t y
A N a t i on al R evi ew
3.5 Summary
Points of note in relation to changes in total acute hospital acti vity from 1995 to 2000 are as follows:
• The number of attendances at A&E departments increased by 2.5%. Approximately 25%of A&E
attendees are admitted to hospital.
• Total admissions (inpatients and day cases) increased by 20%, an average annual increase of
approximately 3.9%.
• The number of inpatients discharged increased by 2%.
• The proportion of inpatients admitted as emergencies increased from 67%to 72%.
• The number of bed days used decreased by 3%related to a small reduction in bed numbers and bed
closures. It is notable, however, that the number of inpatients treated actually increased and ALOSdecreased from 7.2 to 6.9 days.
• There was a marked increase in day activity. Numbers increased by 68%, an average annual increase
of 13.5%.
• Day activity now accounts for 38%of all non-outpatient activity and 68%of elective activity. This
points to the increasing importance of day work in catering for the health needs of the population.
• The number of outpatient attendances increased by 1.2%per annum to 2000.
The increase in total admissions, driven predominantly by the dramatic increase in day activity, is far in
excess of any increase that might be expected due to the increase in the size of the population. The fact
that the increase in inpatient activity is small (rates per 1,000 actually decreased) is a reflection of thefact that inpatient facil it ies, beds, staff and other resources, have not kept pace with the population
growth. This is further supported by the apparent diversion of a considerable body of work to day
facil it ies and the continuation of wait ing lists for elective procedures.
Points of note in relation to Medical and Surgical acti vity from 1995 to 2000 are as follows:
• Medical patients account for almost three-quarters of all patients treated and inpatient bed days
used in acute hospitals. The proportion has increased from 72%to 74%over the period.
• The increase in total admissions (i.e. inpatients plus day cases) was more marked for medical
admissions (23%) than for surgical admissions (11%).
• The number of medical inpatients increased by 4.1%. This was matched by a concomitant decreasein surgical admissions.
• The proportion of medical inpatients admitted as emergencies is high and increasing (80%to 82.8%).
The proportion of surgical inpatients admitted as emergencies is much lower and ranged from
32.6%to 37.4%over the period reviewed.
• The reduction in bed days used (3%overall ) was borne almost entirely by surgical patients. Bed days
used by medical patients decreased by less than 1%compared with an 8%decrease in bed days used
by surgical patients
• The increase in day acti vity (68%overall ) was accounted for by a 75%increase in medical day activity
and a 48%increase in surgical day activity. The proportion of elective medical work carried out on a
day basis is very high at 78%. Approximately 50%of elective surgical work is done on a day basis.

8/8/2019 Acute Hospital Bed Capacity
http://slidepdf.com/reader/full/acute-hospital-bed-capacity 42/94
40
A c u t e H o s p i t a l B e d C a p a c i t y
A N a t i o n a l R e v i e w
• There is now a marked discrepancy between the proport ions of acute hospital beds which aredesignated as ‘medical’ and ‘surgical ’ and activity in those clinical categories, as evidenced by bedday use. The discrepancies almost certainly relate to the high proportion of medical inpatientsadmitted as emergencies and the preponderance of older patients among those emergency medicaladmissions. These data support the documented reduction in elective surgical admissions and theuse of surgical facili ties by medical patients.
Ireland is not unique in the experience of the preponderance of medical patients admittedpredominantly through A&E departments. The emerging experience in the USA is identical. The HealthCare Advisory Board has stated that: “Over time it is reasonable to assume that medical admissions willdominate care delivery at most hospitals”. In its study the HCAB also points out that “hospitals lookingto increase procedure volumes must first add enough beds to accommodate increasing medicaldemand. Additional inpatient beds intended for surgery-only patients are sure to be filled by anymedical overflow first. In the long run there is no way that hospitals can continue to subsidise ‘medical’care. The largest challenge for hospitals and the healthcare system as a whole will be in developing
alternative, less costly models for treating chronic medical conditions”.25

8/8/2019 Acute Hospital Bed Capacity
http://slidepdf.com/reader/full/acute-hospital-bed-capacity 43/94

8/8/2019 Acute Hospital Bed Capacity
http://slidepdf.com/reader/full/acute-hospital-bed-capacity 44/94
SECTI ON 4
Age-specific Acute
Hospital Activity
2000

8/8/2019 Acute Hospital Bed Capacity
http://slidepdf.com/reader/full/acute-hospital-bed-capacity 45/94
43
A c u t eH o s pi t al B e d C a p a c
i t y
A N a t i on al R evi ew
4.1 Introduction
This section analyses the age-specif ic profi le of acute hospital activity in 2000 to identify utilisationpatterns by age. This is key to the estimation of future need incurred by projected demographicchanges. The analysis is based on data recorded in the national HIPE database collated by the ESRI onbehalf of the DOHC.
4.2 The HIPE database
A general description of the HIPE database was provided in Section 3.2. Specific to this section is thefact that obstetric acti vity data are included in the analysis and presentation of results. By 2000 theywere ful ly reflected in the HIPE database, and estimates of future bed requirements should also includematernity beds. HIPE data were broken down by age category for this analysis. The analysis of
inpatients and day cases, emergency and elective admission, and medical and surgical patients were asoutl ined in Section 3.2.
4.3 Age-specific Acute Hospital Activity, 2000
Age-specific Distributions of Inpatients Discharged, 2000
The age-specific distribution of inpatient numbers shows that 16%were children, 57%were aged 15-64years and 27%were aged 65+. The peaks in the 15-24 and 25-34 year age categories are primari ly dueto obstetric activity.
Inpatient rates per 1,000 population are strongly age-related, as evidenced by the increasing age-specif ic rates with advancing age. This is a factor of particular significance in view of projecteddemographic changes for Ireland in the coming decades.
Figure 4.1: Age-specif ic Distri butions of Inpatients Discharged, 2000
Number Rate
T h o u s a n d s
Age Categor y
R a t e / 1 , 0 0 0
0
20
40
60
80
100
120
140
85+75-8465-7455-6445-5435-4425-3415-245-140-40
100
200
300
400
500
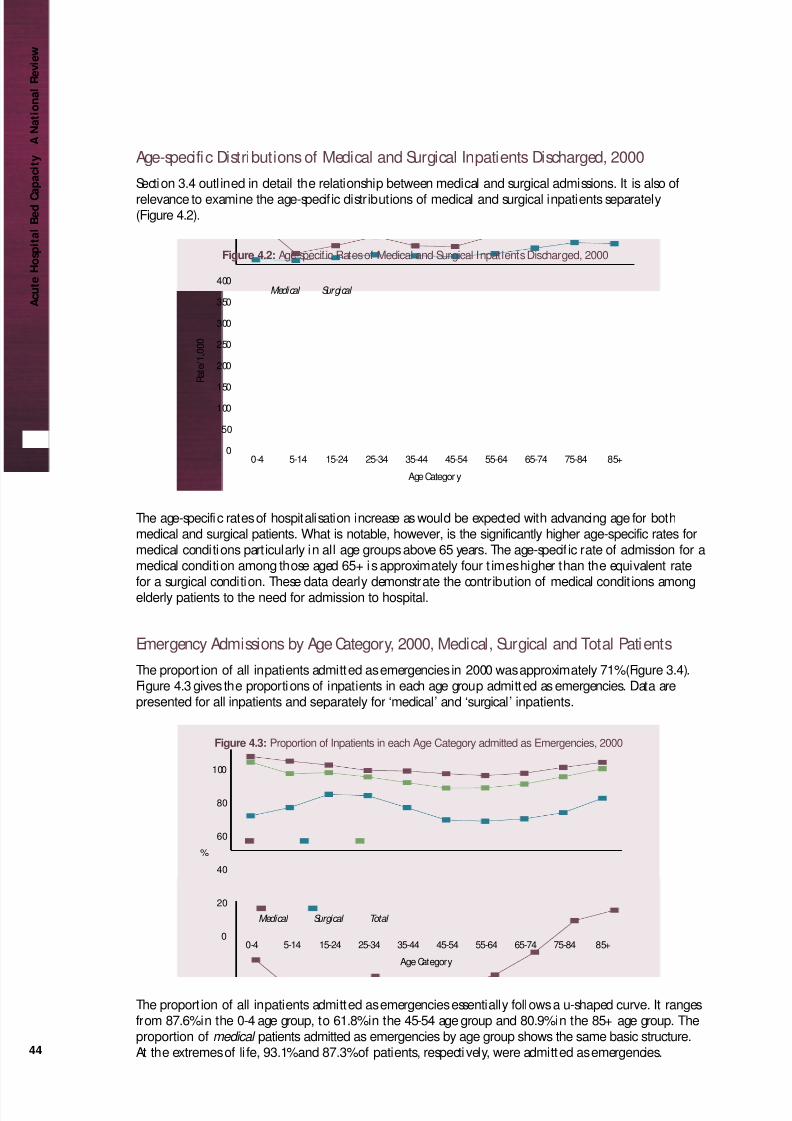
8/8/2019 Acute Hospital Bed Capacity
http://slidepdf.com/reader/full/acute-hospital-bed-capacity 46/94
Age-specific Distributions of Medical and Surgical Inpatients Discharged, 2000
Section 3.4 outl ined in detail the relationship between medical and surgical admissions. It is also of
relevance to examine the age-specific distributions of medical and surgical inpatients separately(Figure 4.2).
The age-specific rates of hospitalisation increase as would be expected with advancing age for bothmedical and surgical patients. What is notable, however, is the significantly higher age-specific rates formedical conditions particularly in all age groups above 65 years. The age-specif ic rate of admission for amedical condition among those aged 65+ is approximately four t imes higher than the equivalent ratefor a surgical condition. These data clearly demonstrate the contribution of medical condit ions amongelderly patients to the need for admission to hospital.
Emergency Admissions by Age Category, 2000, Medical, Surgical and Total Patients
The proport ion of all inpatients admitted as emergencies in 2000 was approximately 71%(Figure 3.4).Figure 4.3 gives the proportions of inpatients in each age group admitted as emergencies. Data arepresented for all inpatients and separately for ‘medical’ and ‘surgical ’ inpatients.
The proport ion of all inpatients admitted as emergencies essentially follows a u-shaped curve. It rangesfrom 87.6%in the 0-4 age group, to 61.8%in the 45-54 age group and 80.9%in the 85+ age group. Theproportion of medical patients admitted as emergencies by age group shows the same basic structure.At the extremes of li fe, 93.1%and 87.3%of patients, respectively, were admitted as emergencies.
Figure 4.3: Proportion of Inpatients in each Age Category admitted as Emergencies, 2000
Medical Surgical Total
%
Age Category
0
20
40
60
80
100
85+75-8465-7455-6445-5435-4425-3415-245-140-4
Figure 4.2: Age-specific Rates of Medical and Surgical Inpatients Discharged, 2000
Medical Surgical
R a t e / 1 , 0
0 0
Age Categor y
0
50
100
150
200
250
300
350
400
85+75-8465-7455-6445-5435-4425-3415-245-140-4
44
A c u t e H o s p i t a l B e d C a p a c i t y
A N a t i o n a l R e v i e w
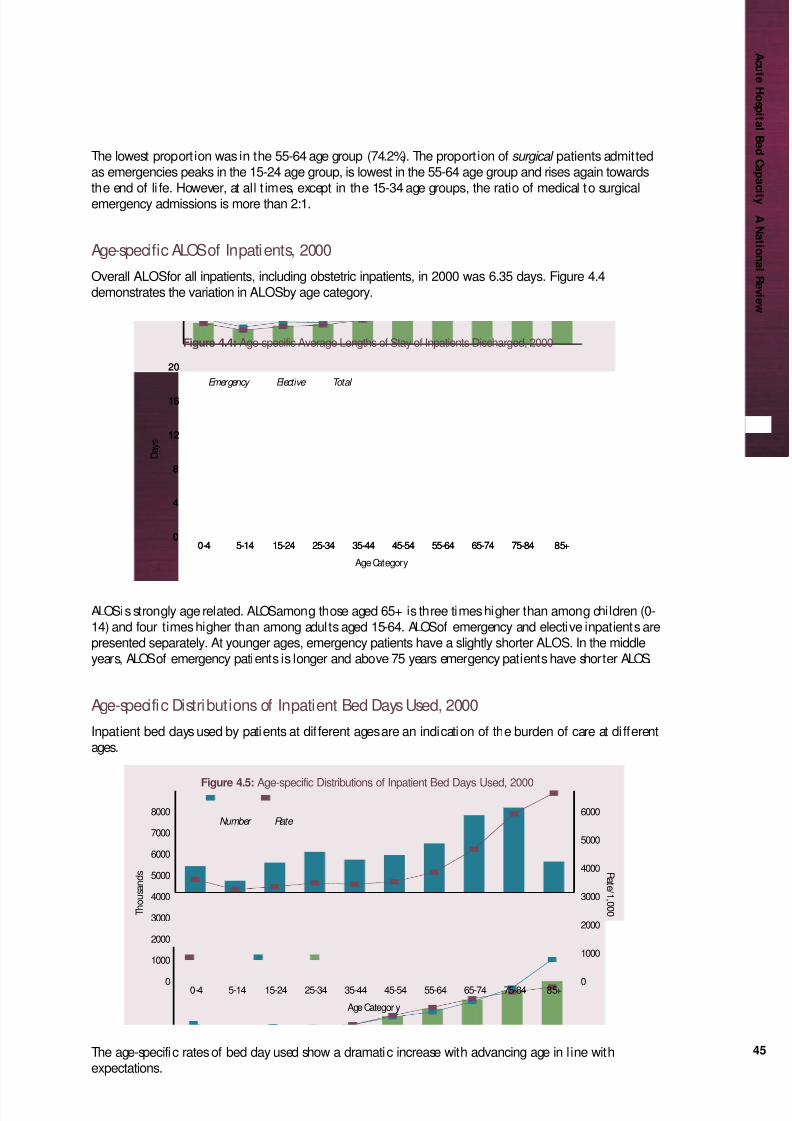
8/8/2019 Acute Hospital Bed Capacity
http://slidepdf.com/reader/full/acute-hospital-bed-capacity 47/94
45
A c u t eH o s pi t al B e d C a p a c
i t y
A N a t i on al R evi ew
The lowest proport ion was in the 55-64 age group (74.2%). The proport ion of surgical patients admittedas emergencies peaks in the 15-24 age group, is lowest in the 55-64 age group and rises again towardsthe end of li fe. However, at all t imes, except in the 15-34 age groups, the ratio of medical to surgicalemergency admissions is more than 2:1.
Age-specific ALOSof Inpatients, 2000
Overall ALOSfor all inpatients, including obstetric inpatients, in 2000 was 6.35 days. Figure 4.4demonstrates the variation in ALOSby age category.
ALOSis strongly age related. ALOSamong those aged 65+ is three times higher than among children (0-14) and four times higher than among adults aged 15-64. ALOSof emergency and elective inpatients arepresented separately. At younger ages, emergency patients have a slightly shorter ALOS. In the middleyears, ALOSof emergency patients is longer and above 75 years emergency patients have shorter ALOS.
Age-specific Distributions of Inpatient Bed Days Used, 2000
Inpatient bed days used by patients at dif ferent ages are an indication of the burden of care at di fferentages.
The age-specific rates of bed day used show a dramatic increase with advancing age in l ine withexpectations.
Figure 4.5: Age-specific Distributions of Inpatient Bed Days Used, 2000
Number Rate
T h o u s a n d s
Age Categor y
R a t e / 1 , 0 0 0
0
1000
2000
3000
4000
5000
6000
7000
8000
85+75-8465-7455-6445-5435-4425-3415-245-140-4 0
1000
2000
3000
4000
5000
6000
Figure 4.4: Age-specific Average Lengths of Stay of Inpatients Discharged, 2000
Emergency Elective Total
D a y s
Age Category
0
4
8
12
16
20
85+75-8465-7455-6445-5435-4425-3415-245-140-40
4
8
12
16
20
85+75-8465-7455-6445-5435-4425-3415-245-140-4

8/8/2019 Acute Hospital Bed Capacity
http://slidepdf.com/reader/full/acute-hospital-bed-capacity 48/94
As with inpatient data, shown in Figures 4.1 and 4.2, bed day use by medical patients is higher at allages than bed day use by surgical patients, but shows marked divergence in older age groups.
Medical patients consumed 73%of the bed days used. Medical patients aged 75+ consumed 80%of thebed days used by all patients aged 75+.
The rate of bed day use in patients aged 65-74 and 75+ is significantly out of keeping with theirproportions either in the general population or in the inpatient population. Children, who constitute22%of the national population, comprise 16%of the inpatient population and required 9%of the beddays used. Persons aged 65+, who consti tute 11%of the national population and 27%of the inpatientpopulation, consumed 46%of the bed days used.
Figure 4.7: Age-specific Proportions of Inpatients Discharged and Bed Days Used, 2000
0 10 20 30 40 50
%Bed Days Used %Inpatients
A g e C a t e g o r y
%
65+46
27
15-4424.5
39
0-149
16
45-6420.5
18
Figure 4.6: Age-specific Rates of Bed Days Used by Medical and Surgical Inpatients, 2000
Medical Surgical
R a t e / 1 , 0
0 0
Age Categor y
0
1000
2000
3000
4000
5000
85+75-8465-7455-6445-5435-4425-3415-245-140-4
46
A c u t e H o s p i t a l B e d C a p a c i t y
A N a t i o n a l R e v i e w

8/8/2019 Acute Hospital Bed Capacity
http://slidepdf.com/reader/full/acute-hospital-bed-capacity 49/94
47
A c u t eH o s pi t al B e d C a p a c
i t y
A N a t i on al R evi ew
Age-specific Distributions of Day Cases, 2000
Of particular interest in the age-specif ic distribution of day cases is that treatment on a day basis is notconfined to younger ages but extends also to the older age groups. The age-specific rates of day activitypeak in the 65-74 year age category and decrease thereafter. This is driven largely by the age-specificdistribut ion of medical day activity (Figure 4.9).
Figure 4.9: Age-specific Rates of Medical and Surgical Day Cases, 2000
Medical Surgical
R a t e / 1 , 0
0 0
Age Category
0
30
60
90
120
150
85+75-8465-7455-6445-5435-4425-3415-245-140-4
Figure 4.8: Age-specific distributions of day cases, 2000
T h o u s a n d s
Age category
0
100
200
300
400
500
85+75-8465-7455-6445-5435-4425-3415-240
20
40
60
80
100
120
140
160
180
R a t e / 1 , 0 0 0
Number Rate
Figure 4.8: Age-specific Distributions of Day Cases, 2000
Age Categor y

8/8/2019 Acute Hospital Bed Capacity
http://slidepdf.com/reader/full/acute-hospital-bed-capacity 50/94
Proportion of Elective Patients treated as Day Cases, 2000
Figure 4.10 presents the proportion of elective activity which is performed on a day basis by age
category with a view to identifying possible targets for increasing day activity.
Overall, 65%of elective activity is done on a day basis (68%when obstetric activity is excluded). A muchhigher proportion of elective medical work is done on a day basis than elective surgical work (74%vs
49%). When the age-specific distributions are examined, it would appear that medical day activity is highacross the age range except in the older age category. Elective surgical activity, on the other hand,
decreases steadily from 63.5%(0-4) to 38.2%in the 65-74 year age group. Reasons for this are unclearand should be explored. This may represent an opportunity for change given investment in appropriatesurgical day facilities. This is addressed further in Section 7.
4.3 Summary
• The age-specific distributions of total patients treated, inpatients discharged and, in particular, beddays used show a clear pattern of increase with advancing years. This is particularly so for inpatientswith medical conditions. In the year 2000 persons aged 65+ consti tuted 11%of the nationalpopulation, comprised 27%of the inpatient population and consumed 46%of the bed days used inacute hospitals nationally. These data are of particular significance in the estimation of future acutebed requirements due to projected demographic changes in Ireland.
• Overall, approximately 71%of inpatients were admitted as emergencies in 2000. This obscures thefact that approximately 82%of medical patients, who constitute three-quarters of all inpatients,were admitted as emergencies, compared with 37%of surgical patients. Among medical patients thetwo groups with the highest proportions admitted as emergencies were children and those aged75+. These data have important planning implications for any proposed changes to primary care,community services and A&E services if they are to impact on emergency medical admissions.
• The age-specific distribution of day activity shows that the volume of day acti vity increases acrossthe age range up to, and including, patients aged 65-74. Thereafter, day activity decreases. Thispattern is dictated primari ly by the age-specif ic distribution of medical day cases.
• The proportions of elective patients treated on a day basis by age group suggest that there may bepotential for increased surgical day work throughout the age range given investment in appropriatesurgical day facilities.
Figure 4.10: Age-specific Proportions of Elective Patients treated as Day Cases, 2000
Medical Surgical Total
%
Age Category
0
20
40
60
80
100
85+75-8465-7455-6445-5435-4425-3415-245-140-4
48
A c u t e H o s p i t a l B e d C a p a c i t y
A N a t i o n a l R e v i e w

8/8/2019 Acute Hospital Bed Capacity
http://slidepdf.com/reader/full/acute-hospital-bed-capacity 51/94
49
A c u t eH o s pi t al B e d C a p a c
i t y
A N a t i on al R evi ew

8/8/2019 Acute Hospital Bed Capacity
http://slidepdf.com/reader/full/acute-hospital-bed-capacity 52/94
SECTI ON 5
Current Indicators
of Inadequate
Hospital Bed
Capacity

8/8/2019 Acute Hospital Bed Capacity
http://slidepdf.com/reader/full/acute-hospital-bed-capacity 53/94
51
A c u t eH o s pi t al B e d C a p a c
i t y
A N a t i on al R evi ew
5.1 Introduction
This section examines indicators of inadequate hospital bed capacity in Ireland at this time. Theimmediate need for additional bed capacity may be measured by analysis of acute bed occupancylevels and current wait ing lists. The level of bed occupancy is a key determining factor in the admissionof a patient, whether emergency or elective, to hospital. If all beds are occupied emergency patientsmust wait; elective admissions will be cancelled. Emergency admissions, by their nature, takeprecedence over elective admissions. Thus, in a situation of fixed bed capacity and increasingemergency admissions, bed occupancy will be high and waiting lists for elective admissions will persist.
5.2 Acute Bed Occupancy
Context
It might be thought that all beds in all hospitals should be occupied at all times (100%occupancy) formaximum efficiency and patient throughput. For several years hospitals have been under pressure toreduce bed capacity and increase occupancy rates to achieve optimal operational efficiency.29 Thismight be possible if admission to hospital was a regular phenomenon with an identifiable pattern. Inreali ty, hospital admission patterns can be highly irregular with li tt le predictabil ity. Hospitals admittingonly elective patients can manage admissions and discharges in a planned way and can potentiallyoperate at a high occupancy level. Hospitals which offer emergency services are subject to random andpotentially significant fluctuations in demand for admission and must be in a position to cater forthese. It is, therefore, necessary to operate at a level of occupancy which, at least some of the time, isless than 100%in order to cater for unpredictable demand. The UK Emergency Services Action Team
(ESAT) has stated that the ability of hospitals to respond to peaks and troughs in the demand forservices means running at bed occupancy levels which are high enough to avoid inefficiencies and lowenough to avoid unresponsiveness.20, 30 Defining the ‘optimal’ average level of bed occupancy toaccomplish this is a challenge.
‘Optimal’ Bed Occupancy
‘Optimal’ occupancy for a given hospital will be determined by factors such as:
• the type of hospital, i.e. acute general, specialist, sub-acute, etc.
• the size of the hospital;
• the catchment area and population served;
• the nature of admissions accepted, i .e. elective, emergency or both;
• the nature of services offered, i.e. secondary care, tert iary referral services or both;
• the casemix of patients admitted; and
• staff ing levels and levels of other resources.
Planning for a mean occupancy of even 90%guarantees that hospitals wil l have insufficient numbers ofbeds on a substantial number of days because of inevitable variations in daily admissions.31 Estimatesof the ‘optimal’ average occupancy level for acute hospitals with emergency admissions range from
approximately 75%to 85%. The Health Care Advisory Board (HCAB) study in the USA identified problemswith emergency admissions and ambulance diversions when occupancy rates exceed 75%, and haverecommended maintenance of an average occupancy level of 70%to 75%to ensure optimal functioningof the hospital as a whole.25 A study from the York Health Economics Consortium, University of York,

8/8/2019 Acute Hospital Bed Capacity
http://slidepdf.com/reader/full/acute-hospital-bed-capacity 54/94
estimated that the abili ty to admit emergency patients and the risk of cancellation of elective patientsincreases once average bed occupancy levels exceed 85%. Regular bed shortages and periodic bed crisesoccur at higher occupancy levels.29 The ESAT study modelled the abil ity of the NHSto respond todemand at varying levels of occupancy, and estimated that above 82%average occupancy cancellations‘take off ’. Average occupancy rates of 82%were also shown to be associated with ‘trolley waits’ in A&Eand patients outposted to ‘foreign’ wards. That critical level is somewhat dependent on hospital sizeand is slightly delayed in the larger hospital.30 There is general agreement in the literature thatoccupancy levels above 85%are associated with significant limitations on the abil ity of acute hospitalsto respond to demand, with long delays in A&E for admission and cancellation of electi ve admissionsand procedures. It has been estimated that, while 85%average occupancy may be appropriate forhospitals with more than 150 beds, somewhat lower average occupancy levels are required for smallerhospitals.32
For the purposes of this exercise, an average bed occupancy of 85% has been chosen as thebenchmark against which the need for additional bed capacity in Ireland will be assessed.
Measuring Bed Occupancy
Inpatient bed occupancy is the most widely used measure of hospital capacity.25 Occupancy is measuredby recording the number of bed days used as a function of the number of bed days available.16
% Occupancy = Bed Days Used (N) x 100Bed Days Available (N)
where: bed days used = sum of LOSof each inpatient;bed days available = number of beds x number of days on which available
Although this would appear qui te straightforward, there are several potential sources of error andvariation in the measurement of bed occupancy. They include the following:
• certain beds may be included inappropriately in the computation of bed days available, e.g. bedswhich are temporarily closed or unstaffed, and specialised beds not available for general use;
• bed occupancy is typically recorded at midnight, thus overlooking the daytime peak which typicallyoccurs before patients are discharged and while others are waiting to be admitted. The HCAB citethe need to adjust for daytime peak/turnover which could be as high as 20%to 25%;25
• bed occupancy rates reported are usually average annual rates, thus obscuring important daily,weekly, seasonal and incident-related variation in occupancy and ignoring the duration of peaks andtroughs in occupancy levels.
Ideally, bed occupancy should be measured on staffed beds at noon, excluding beds which should notbe included. If assessing the occupancy of medical and surgical beds, beds for other specialt ies e.g.obstetrics, paediatrics and psychiatry should ideally be excluded to give a ‘purer’ measure of medicaland surgical bed occupancy.25
52
A c u t e H o s p i t a l B e d C a p a c i t y
A N a t i o n a l R e v i e w

8/8/2019 Acute Hospital Bed Capacity
http://slidepdf.com/reader/full/acute-hospital-bed-capacity 55/94
53
A c u t eH o s pi t al B e d C a p a c
i t y
A N a t i on al R evi ew
Current Bed Occupancy in Ireland
Data on hospital bed occupancy levels in Ireland are derived from the monthly IMR’s returned by allhospitals to the DOHC. Included is the average number of inpatient beds, the number of available beddays, number of inpatients discharged and the number of bed days used. Instructions for thecompletion of IMR data by hospitals outl ine the need to adjust the number of available bed days for 5-day beds, closed beds or extra beds.
IMR data would indicate that overall bed occupancy in 2000 was 83.3%. However, occupancy levels inthe major hospitals were higher and ranged from 85.9%to 94.7%. Submissions on bed requirementsinvited by DOHCfrom each Health Board and the ERHA in May 2000 identified high bed occupancy asone of the main concerns. High occupancy levels were cited as one of the reasons for lengthy delays inA&E departments when admission to hospital is required. Hospitals reported occupancy levels of 90%to100%at various times.
A comparison of acute care occupancy levels for 1996 across OECD countries revealed that Ireland hadthe highest average occupancy level (83%) when compared with those for whom this information isavailable (Figure 5.1).
*Selected = Countries for which 1996 data are available
Source: OECD Health Data, 2000. A Comparative Analysis of 29 Countries. OECD
Health Policy Unit, Paris
Figure 5.1: Acute Care Occupancy Rates (%): Selected* OECD Countries, 1996
0
20
40
60
80
100
T u r k e
y U S
A
A u s t r a
l i a
P o r t u g a l
I t a l y
N e t h e
r l a n d
s
C z e c h R e
p
H u n g a r
y
F r a n
c e
A u s t r i a
S p a i n
S w e d
e n U . K .
G e r m
a n y
D e n m
a r k
N o r w
a y
I r e l
a n d
%

8/8/2019 Acute Hospital Bed Capacity
http://slidepdf.com/reader/full/acute-hospital-bed-capacity 56/94
Estimation of Impact on Bed Need
The objecti ve of this exercise is to estimate the additional bed capacity which would be required toreduce average occupancy levels to 85%in those hospitals currently running at higher levels.
Figure 5.2: Estimated Impact of Average Bed Occupancy Levels on Bed Need
Step 1 Average bed occupancy level in 2000 for all hospitals nationwide (IMR data)
Average occupancy 83.3%
Step 2 Average bed occupancy level adjusted for 5-day beds and bed closures, reducing bed days
available by 107,500 (Details in Technical Report see p.14)
Average adjusted occupancy 85.4%
Step 3 Hospitals with average adjusted occupancy level greater than 85%identifiedNumber of hospitals 23
Number of beds 6,138
Average occupancy level 95.1%
Range of occupancy levels 85.6%- 123.3%
Step 4 Additional beds required to reduce average occupancy level from 95%to 85%
(approximately 12%increase in bed complement) in 23 hospitals computed (Details in
Technical Report see p.14)
Estimate of Impact Approximately 850 additional beds @ 85%occupancy
Intensive Care Unit (ICU) Occupancy Levels
A related issue is the occupancy levels being experienced in the ICU’s of acute hospitals. In a recentsurvey of the five major teaching hospitals in the ERHA, the average ICU occupancy was 97%.33 AverageICU occupancy level was 95%for the two paediatric hospitals and 91%for two major hospitals outsidethe EHRA. The European Society of Intensive Care Medicine has recommended an average occupancylevel of 75%for intensive care beds.34 Any computation of addit ional beds required to alleviate bedoccupancy levels must take this into account.
In 2000 there were 38 hospitals in Ireland with 259 ICU beds. This represents 2.2%of all acute beds,which is in line with internationally accepted levels.35,36 The issue here is not so much the addition ofICU beds, as the addit ion of general hospital capacity to allow for timely discharge from ICU.33 The
HCAB has emphasised the need to reduce inappropriate utilisation in ICU before expanding ICUcapacity.25
In estimating additional need due to ICU occupancy, it is assumed that the average occupancy of theICU beds is at least the same as the occupancy of the hospital as a whole. The computation of need foradditional beds based on ICU occupancy was adjusted to eliminate ‘double counting’ related to thedif ferent benchmarks used, i.e. 85%for general hospital beds, 75%for ICU beds. (details in the Technical Report see p.14)
54
A c u t e H o s p i t a l B e d C a p a c i t y
A N a t i o n a l R e v i e w

8/8/2019 Acute Hospital Bed Capacity
http://slidepdf.com/reader/full/acute-hospital-bed-capacity 57/94
55
A c u t eH o s pi t al B e d C a p a c
i t y
A N a t i on al R evi ew
Figure 5.3: Estimated Impact of ICU Occupancy Levels on Bed Need
Step 1 Average occupancy level for ICU’s nationwide computed
Number of hospitals 38
Number of ICU beds 259
Average adjusted occupancy 88.0%
Range of occupancy levels 71.5%- 123.3%
Step 2 ICU beds in hospitals with occupancy greater than 85%identified
Number of hospitals 19
Number of ICU beds 152
Additional beds due to occupancy greater than 85%computed in Step 2, Figure 5.2
Result To reduce ICU occupancy from 85%to 75%, 27 beds required
Step 3 ICU beds in hospitals with occupancy less than 85%identi fiedNumber of hospitals 19
Number of ICU beds 107
Average occupancy 78.2%
Result To reduce ICU occupancy from 78.2%to 75%, 6 beds required
Estimate of Impact Approximately 33 beds required (75%occupancy)
Conclusion
It is estimated that approximately 883 beds are required to adjust for the high average bed occupancylevels being experienced in the major hospitals and ICU’s nationwide. It is important to note that thisassessment is based only on those hospitals with average occupancy levels greater than 85%. In relationto the estimate of need based on ICU occupancy, it is important to note that the additional beds neednot be ICU beds. This is in line with experience elsewhere.25

8/8/2019 Acute Hospital Bed Capacity
http://slidepdf.com/reader/full/acute-hospital-bed-capacity 58/94
5.3 Waiting Lists for Elective Procedures
Context
The pattern of referral of patients to hospital for elective treatment is irregular and unpredictable. Totreat all patients at the time they are referred would require an excess capacity in some periods to allowfor adequate capacity in peak periods.37 The probabili ty of excess capacity can be reduced if patientscan be placed on a waiting list for elective procedures and their treatment planned to coincide withsome predetermined schedule of treatment.37 What is at issue is not so much the existence of a waitinglist as the size of the list and the duration of the wait. This is not unique to Ireland. Waiting lists areused extensively as performance indicators in healthcare.38
Trends in clinical activity in Ireland since 1995 show that inpatient numbers increased by 2%even
though bed numbers decreased by approximately 1%. Even more striking is that medical inpatientsincreased by 4%matched by a decrease in surgical inpatients. In order to meet the waiting list targetsoutl ined in the Health Strategy, Qual ity and Fairness: A Health System for You , hospitals must find a wayto increase surgical activity. Given that the wait ing list is an ‘inpatient ’ list, this can only happen if thecapacity of hospitals is increased to meet the need.
This raises an issue in relation to the need to retain the additional capacity required on an ongoingbasis. Evidence from the UK has shown that increased admissions from waiting lists related to variouswaiting list initiatives improved waiting times, but did not reduce list size. 38, 39 This is corroborated byresearch data showing that additions to waiting lists are negatively influenced by waiting time.40, 41 Thecorollary of this is that as wait ing times decrease, new patients are added. It suggests that the abili ty tomeet need influences patients and their doctors to translate previously unmet need into demand forhospital services,39 and points to the need for a longer term investment in capacity to adequately
address waiting lists, wait ing times and unmet need.
Compilation of Waiting Lists
Patients who require certain electi ve treatments are placed on waiting lists by consultant staff inindividual hospitals usually following an outpatient visit. Waiting list data are collated by the DOHC,based on quarterly returns from the Health Boards and ERHA. Data are provided by specialty, as definedby the specialty of the outpatient clinic.
There are certain limitations to existing waiting list data which should be noted:
• the age of the patient is not routinely recorded centrally. Limi ted information on ‘age’ is available
for certain specialties. Patients are designated as children or adults in respect of the targetspecialties of Cardiac Surgery, ENT, Gynaecology, Ophthalmology, Orthopaedic Surgery, PlasticSurgery, General Surgery, Urology and Vascular Surgery;
• there is no standardised recording of the procedure awaited. Thus, the type and number ofprocedures awaited by specialty is not available centrally;
• it is not possible to accurately assess whether a proportion of the procedures awaited by patients onthe ‘inpatient ’ waiting list could be done on a day basis;
• information on area of residence of the patient is not recorded centrally.
It is anticipated that these information gaps will be addressed in the context of revised waiting list
arrangements proposed in the Health Strategy.
56
A c u t e H o s p i t a l B e d C a p a c i t y
A N a t i o n a l R e v i e w

8/8/2019 Acute Hospital Bed Capacity
http://slidepdf.com/reader/full/acute-hospital-bed-capacity 59/94
Current Waiting Lists in Ireland
As of June 30, 2001 there were 26,659 patients nationally wait ing 3 months or more for electiveinpatient procedures. Figure 5.4 shows the numbers awaiting treatment by specialty.
The specialties with the highest number awaiting elective treatment are ENT, Orthopaedics, GeneralSurgery, Ophthalmology, Vascular Surgery, Plastic Surgery, Urology and Gynaecology. Approximately 90%of patients are await ing surgical treatment.
Estimation of Impact on Bed Need
The objecti ve of this exercise is to estimate the additional beds which would be required to ensure thatpatients awaiting electi ve procedures do not wait longer than three months. Certain assumptions mustbe made. In relation to the need for inpatient admission, one calculation has been done assuming thatall waiting list patients require inpatient admission. A second calculation assumes that approximatelyone-third of waiting list patients could be treated on a day basis. In relation to procedures awaited andALOS, it is assumed that the profi le of procedures and the ALOSof the waiting list patients are similar tothose of inpatients in the same specialties admitted electively. Estimates are provided in Figure 5.5.
Figure 5.4: Public Inpatient Waiting List, 30 June 2001
0 1000 2000 3000 4000 5000
ENT
Orthopaedics
Surgery
Ophthalmology
Vascular
Plastic Sx
Urology
Gynaecology
Cardiology
Cardiac Sx
Other
4,940
4,264
3,403
2,855
2,244
2,172
1,455
1,183
1,138
420
2,585
57
A c u t eH o s pi t al B e d C a p a c
i t y
A N a t i on al R evi ew

8/8/2019 Acute Hospital Bed Capacity
http://slidepdf.com/reader/full/acute-hospital-bed-capacity 60/94
Figure 5.5: Estimated Impact of Wait ing Lists on Bed Need
Step 1 The number of patients in each specialty awaiting treatment for three months or more,
June 2001
Step 2 ALOSfor elective inpatients in each specialty x number of patients on the Waiting List in
that specialty = Bed Days required
Step 3 Beds required @ 85%occupancy computed
Estimate of Impact Assumption Additional Beds Required Additional
@ 85%occupancy Day Cases
• All waiting list patients 492 0
require inpatient treatment
• Approximately one-third of 322 9,330
wait ing list patients could
be treated as day cases
If all wait ing list patients require inpatient admission, 492 beds would be required. If approximatelyone-third of waiting list patients could be treated on a day basis, 322 beds would be required. However,additional facilities to treat 9,500 additional surgical day cases would be required, includingapproximately 40 day beds. Details are provided in the Technical Report . see p.14
Conclusion
The higher estimate of the number of beds required to cater for waiting list patients arises logicallyfrom the assumption that all waiting list patients require inpatient admission. The lower estimate ofthe number of beds required is contingent upon significant development of day surgery facil it ies and ashift in treatment emphasis to day surgery.
58
A c u t e H o s p i t a l B e d C a p a c i t y
A N a t i o n a l R e v i e w

8/8/2019 Acute Hospital Bed Capacity
http://slidepdf.com/reader/full/acute-hospital-bed-capacity 61/94
59
A c u t eH o s pi t al B e d C a p a c
i t y
A N a t i on al R evi ew

8/8/2019 Acute Hospital Bed Capacity
http://slidepdf.com/reader/full/acute-hospital-bed-capacity 62/94
SECTI ON 6
Factors which will
increase the need
for Hospital Beds

8/8/2019 Acute Hospital Bed Capacity
http://slidepdf.com/reader/full/acute-hospital-bed-capacity 63/94
61
A c u t eH o s pi t al B e d C a p a c
i t y
A N a t i on al R evi ew
6.1 Introduction
This section examines factors which will increase the need for acute hospital beds in Ireland over thenext decade. Paramount among these are the demographic changes projected to occur and increasingdemand for healthcare over and above that due to demographic change.
6.2 Projected Demographic Changes
Context
Projected demographic changes refer to changes in the size and age structure of the population whichare predicted to take place over the coming decades. Ireland has had a unique demographic profi le inrecent years compared with other EU countries, as evidenced by a higher proportion under 15 yearsand 15-44 years and a lower proport ion of elderly people16 (details in the Technical Report see p.14). That isabout to change. For almost 30 years, up to 1981, the birth rate remained stable at approximately 22per 1,000 population. Between 1981 and 1998 the birth rate dropped by 33%to 14.5 per 1,000.16
Mortality has decreased steadily from 11.7 per 1,000 in 1953 to 8.5 per 1,000 in 1998. 16 The recentpopulation growth is due to a combination of increased longevity and net immigration to the adultworking population due to improved economic circumstances. These factors combined wil l determinethe age structure of the Irish population in the coming decades. The OECD recognises that the Irishpopulation is now entering a phase when the number of older people will start to grow more rapidlythan the total population and this will affect the demand for health services.19
The importance of demographic changes to health policy cannot be underestimated, and should be
planned for, since the age-sex composit ion of the population for several decades is known.42
Projecting Demographic Changes
Population projections based on census data are carried out by the CSO by applying a mathematicalmodel to a number of assumptions about factors that affect the population. The factors are ferti li ty(high, medium, low), mortality and migration (high, low). Details of each level of these assumptions aregiven in the Technical Report .see p.14 Population projections differ depending on what combination ofassumptions is used. Projections of the size and age structure of the population, based on census yearsup to and including 1996, have been made up to 2031.16
Figure 6.1 and the accompanying table give the projected population changes for Ireland to 2011 and2026 using the M1F1 assumption (see Technical Report see p.14).

8/8/2019 Acute Hospital Bed Capacity
http://slidepdf.com/reader/full/acute-hospital-bed-capacity 64/94
2000 (Estimated) 2011 (Projected) 2026 (Projected)
N % N % N %
0-14 824,400 21.8 931,100 21.9 904,900 19.4
15-39 1,500,300 39.6 1,528,200 35.9 1,434,800 30.7
40-64 1,038,300 27.4 1,291,600 30.4 1,565,000 33.5
65-74 238,600 6.3 296,400 7.0 445,400 9.5
75-84 143,800 3.8 157,200 3.7 252,600 5.4
85+ 41,700 1.1 50,300 1.2 69,300 1.5
Total 3,787,100 100.0 4,254,800 100.0 4,672,000 100.0
Currently, 22%of the population are children, 67%are adults (15-64) and 11.2%are aged 65+. The totalpopulation is projected to increase by 23%by 2011. The proport ions of children and those aged 15-39years will decrease. The proportions in all age groups above 40 years will increase. The number aged
65+ will increase by approximately 80,000, but will sti ll consti tute just 11.9%of the population. A majorshift occurs thereafter. By 2026, 16.4%of the population (n=767,300) wil l be aged 65+.
Estimation of Impact on Bed Need
The objective of this exercise is to assess the likely impact of projected demographic changes for Irelandon hospital bed requirement by 2011. Based on recent trends in fertil ity and migration, the CSOrecommendation in relation to this exercise was to use projections derived using the M1F1 assumptions,i.e. the higher estimate of population growth.
The need for additional beds was estimated by applying the age-specific rates of bed day use in 2000 tothe age distribut ion of the projected population in 2011.
Figure 6.1: Projected Demographic Changes by Age Category to 2011 and 2026
0 500 1000 1500 2000
0-14
15-39
40-64
65-74
75-84
85+2000 (Estimated)
2011 (Projected)
2026 (Projected)
A g e C a t e g o r y
Population in Thousands
62
A c u t e H o s p i t a l B e d C a p a c i t y
A N a t i o n a l R e v i e w

8/8/2019 Acute Hospital Bed Capacity
http://slidepdf.com/reader/full/acute-hospital-bed-capacity 65/94
63
A c u t eH o s pi t al B e d C a p a c
i t y
A N a t i on al R evi ew
Figure 6.2: Estimated Impact of Projected Demographic Changes on Bed Need
Step 1 CSO population projections to 2011 using the M1F1 assumption
Step 2 Application of age-specif ic bed day use in 2000 to the projected population in 2011.
Estimation of additional bed days/beds required at 85%occupancy
Age Group Bed Days Used Projected Additional Beds Req’d
in 2000 Population in 2011 @ 85%Occupancy
N Rate/1,000 N N
0-14 300,082 364.0 931,100 125
15-39 698,665 465.6 1,528,200 41
40-64 798,020 768.5 1,291,600 627
65-74 608,318 2549.5 296,400 475
75-84 668,723 4650.3 157,200 200
85+ 244,622 5866.2 50,300 163
TOTAL 3,318,430 876.2 4,254,800 1,631
Estimate of Impact Approximately 1,630 beds required @ 85%occupancy
ConclusionThe estimations outl ined above of acute bed need suggest that approximately 1,630 additional beds wil lbe required by 2011 in order to meet demographic changes. These estimates are based on theassumption that current treatment patterns and practices regarding admission to hospital in Irelandcontinue unchanged and in the absence of other developments which might reduce that need. Itshould be noted that even greater changes to the age profi le of the population are projected to takeplace after 2011.

8/8/2019 Acute Hospital Bed Capacity
http://slidepdf.com/reader/full/acute-hospital-bed-capacity 66/94
6.3 Changes in Demand for Healthcare
Context
There are two definitions of ‘demand’ which are potentially relevant to healthcare. They are: “ request made as of right or peremptorily ” and “ desire of would-be purchasers or users for commodity ” .43 One canthink of services to which people are entit led and therefore are likely to demand as of right, whileother services might fall into the category of ‘desirable’ but not ‘essential’. It is also relevant to considerthat perceptions of services which are deemed to be ‘essential’ and those which might regarded as‘desirable’ may vary over time. This may be due to changing patterns of disease occurrence, changesin the availability and efficacy of diagnostic and therapeutic interventions, and changing economiccircumstances in a given health care environment. Furthermore, each individual’s perception of‘essential’ and ‘desirable’ services will be influenced by their age, their own health status and that of
their families and, potentially, by their social and economic circumstances.
That demand for healthcare is increasing has been noted by several authors.21, 25, 44-48 Reasons giveninclude:
• a larger, better educated and more demanding middle class; 21, 45
• increased expectations. There is now substantial li terature on the growth of ‘consumerism’ inhealthcare, ranging from issues of healthcare quality, satisfaction guarantee, patient power, itscontribution to health care reform, consumer participation, the desire for information and inputinto decision making;44, 46
• higher per capita income. As people become wealthier they demand, not simply more healthcare,but also more convenience, higher levels of comfort and a more personalised service;47, 48
• previously unmet need. Comparative studies demonstrate that the rates of certain procedures perhead of population between populations with simi lar epidemiology of disease can point to unmetneed in certain areas. This applies to a number of areas within the Irish healthcare system, such asthe number of patients who could be placed on wait ing lists for elective procedures, but for whomthe prospect of a lengthy wait is unacceptable;
• increasing demand for acti ve intervention of chronic conditions;21, 48 and
• increasingly accessible health information through the media, health promotion efforts and internetaccess.
Several authors suggest that supply factors may be just as important as demand factors in determining
overall healthcare development and costs.25, 44, 48
Among them are:
• the increasing range of available medications for prophylaxis, secondary prevention and treatment;
• technological advances in diagnosis and treatment; and
• development of new services, e.g. screening and minimally invasive surgery.
Advances in technology are seen as a double-edged sword, with new diagnostic capabilities potentiallycontributing to an increased need for inpatient services.25
The OECD Economic Survey of healthcare in Ireland suggested that the pressure on the Irish healthservices induced by demographic change “ is likely to be outweighed by the increasing expectations of healthcare as consumer incomes grow ” .19
64
A c u t e H o s p i t a l B e d C a p a c i t y
A N a t i o n a l R e v i e w

8/8/2019 Acute Hospital Bed Capacity
http://slidepdf.com/reader/full/acute-hospital-bed-capacity 67/94
Measuring Increased Demand
Despite the list of possible reasons for changing demand, demand for hospital care is poorlyunderstood and under researched.31 Variables used to measure demand include inpatient admissions,forecasted admissions, outpatient visits, and the casemix index.49
Other indices such as occupancy rates, number of hospital beds and wage rates are also measured, buthave more to do with estimation of hospital costs than with demand.49
Demand for Healthcare in Ireland
Some estimate of increasing demand for healthcare in Ireland can be derived from the following data:
• increasing attendance at A&Edepartments. Since 1988 attendances at A&E have increased by 22%,
during which time the population increased in size by approximately 7%(1988-2000);
• increasing attendances at hospital outpatient departments: In 1980, there were 1.46 million visitsto the outpatient departments of acute hospitals. In 2000 there were approximately 2 millionoutpatients visits, an overall increase of 37%, or an average annual increase of 1.8%, during whichperiod the population increased by 10%(1980-2000);
• increasing day activity: The increase in day activity in Ireland has been dramatic. Since 1980 thenumber of day cases has increased from approximately 8,500 to 320,000. There has been a 68%increase in the number of day cases treated since 1995, an average annual increase of 13.5%;
• inpatient admissions: Taken as a whole inpatient admissions have remained relatively stable over20 years, despite a 40%reduction in acute hospital beds. This remarkable phenomenon has been
accomplished through a steady reduction in ALOS. There was a 2%increase in inpatient admissionsbetween 1995 and 2000 despite a slight reduction in bed numbers and bed closures;
• doctor consultations per capita. The OECD has compiled consultation data for member countriesfor selected years. The median number of consultations per capita increased by 12%between 1980and 1996, or an average annual increase of 0.7%.19
Between 1980 and 2000 the population of Ireland increased by an average of 0.5%per annum. Clearly,with the exception of inpatient admissions, other hospital and healthcare activity has increasedsignificantly beyond that which might be expected due to population growth alone.
Estimation of Impact on Bed Need
The objecti ve of this exercise is to estimate the impact of increasing demand for hospital care in Irelandover the next decade. Planners differ in their assumptions about future growth in demand. Someassume increases in demand in excess of those suggested by population growth. Others ignore theseexogenous factors, and in a few cases assumptions have been made that demand may be reduced. 31
The Health Care Advisory Board regard a conservative estimate of increasing demand as that due todemographic changes alone. In the USA this has been estimated as being 1.6%per annum from 2000-2006. A moderate increase in demand of 3.5%per annum includes that due to demographic change(1.6%per annum) and factors such as those outl ined above (1.9%per annum). In a review of bedcapacity carried out by the ERHA an estimate of demand of 0.5%per annum was used.
65
A c u t eH o s pi t al B e d C a p a c
i t y
A N a t i on al R evi ew

8/8/2019 Acute Hospital Bed Capacity
http://slidepdf.com/reader/full/acute-hospital-bed-capacity 68/94
For the purposes of this exercise, supported by the acti vity data outlined, an estimated increase indemand of 1%per annum has been selected. Over 10 years to 2011, this represents a compound totaladjustment of 10.46%to existing bed complement. The assumption is that demand increases in a linearfashion over the decade. This may not be the case if, for example, there is a significant change in theeconomy, or a significant advance in an area of medicine likely to result in a sudden increase indemand.
Figure 6.3: Estimated Impact of Demand for Healthcare on Bed Need
Step 1 Review of the evidence pertaining to increased demand for healthcare
Step 2 1%per annum increase in demand = 10.46%cumulative increase over 10 years
Step 3 Applied to the existing bed complement (11,832) corrected for current occupancy levels in
the major hospitals (+ 883)
Estimate of Impact Approximately 1,330 beds required
Conclusion
It is estimated that an additional 1330 beds are required, over and above those required due toprojected demographic change, to accommodate increasing demand for healthcare over the comingdecade.
66
A c u t e H o s p i t a l B e d C a p a c i t y
A N a t i o n a l R e v i e w

8/8/2019 Acute Hospital Bed Capacity
http://slidepdf.com/reader/full/acute-hospital-bed-capacity 69/94
67
A c u t eH o s pi t al B e d C a p a c
i t y
A N a t i on al R evi ew

8/8/2019 Acute Hospital Bed Capacity
http://slidepdf.com/reader/full/acute-hospital-bed-capacity 70/94
SECTI ON 7
Strategies to
reduce the need
for Hospital Beds
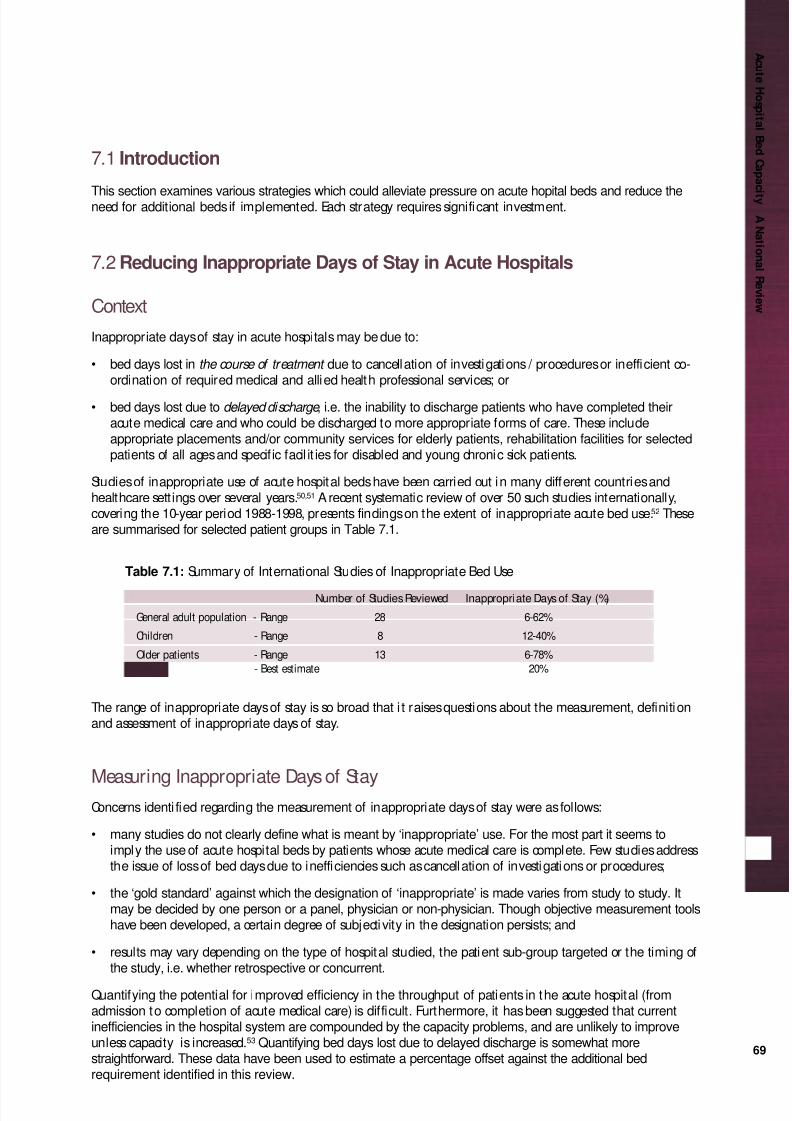
8/8/2019 Acute Hospital Bed Capacity
http://slidepdf.com/reader/full/acute-hospital-bed-capacity 71/94
69
A c u t eH o s pi t al B e d C a p a c
i t y
A N a t i on al R evi ew
7.1 Introduction
This section examines various strategies which could alleviate pressure on acute hopital beds and reduce theneed for additional beds if implemented. Each strategy requires significant investment.
7.2 Reducing Inappropriate Days of Stay in Acute Hospitals
Context
Inappropriate days of stay in acute hospitals may be due to:
• bed days lost in the course of treatment due to cancellation of investigations / procedures or inefficient co-ordination of required medical and allied health professional services; or
• bed days lost due to delayed discharge , i.e. the inability to discharge patients who have completed theiracute medical care and who could be discharged to more appropriate forms of care. These includeappropriate placements and/or community services for elderly patients, rehabilitation facilities for selectedpatients of all ages and specific facil it ies for disabled and young chronic sick patients.
Studies of inappropriate use of acute hospital beds have been carried out in many different countries andhealthcare settings over several years.50,51 A recent systematic review of over 50 such studies internationally,covering the 10-year period 1988-1998, presents findings on the extent of inappropriate acute bed use.52 Theseare summarised for selected patient groups in Table 7.1.
Table 7.1: Summary of International Studies of Inappropriate Bed Use
Number of Studies Reviewed Inappropriate Days of Stay (%)
General adult population - Range 28 6-62%
Children - Range 8 12-40%
Older patients - Range 13 6-78%
- Best estimate 20%
The range of inappropriate days of stay is so broad that i t raises questions about the measurement, definitionand assessment of inappropriate days of stay.
Measuring Inappropriate Days of StayConcerns identi fied regarding the measurement of inappropriate days of stay were as follows:
• many studies do not clearly define what is meant by ‘inappropriate’ use. For the most part it seems toimply the use of acute hospital beds by patients whose acute medical care is complete. Few studies addressthe issue of loss of bed days due to inefficiencies such as cancellation of investigations or procedures;
• the ‘gold standard’ against which the designation of ‘inappropriate’ is made varies from study to study. Itmay be decided by one person or a panel, physician or non-physician. Though objective measurement toolshave been developed, a certain degree of subjecti vity in the designation persists; and
• results may vary depending on the type of hospital studied, the patient sub-group targeted or the timing ofthe study, i.e. whether retrospective or concurrent.
Quantifying the potential for improved efficiency in the throughput of patients in the acute hospital (fromadmission to completion of acute medical care) is difficult. Furthermore, it has been suggested that currentinefficiencies in the hospital system are compounded by the capacity problems, and are unlikely to improveunless capacity is increased.53 Quantifying bed days lost due to delayed discharge is somewhat morestraightforward. These data have been used to estimate a percentage offset against the additional bedrequirement identified in this review.

8/8/2019 Acute Hospital Bed Capacity
http://slidepdf.com/reader/full/acute-hospital-bed-capacity 72/94
Delayed Discharge in Ireland
Data from the Health Board submissions (May 2000) suggested that the proportion of bed days lost due todelayed discharge in several hospitals is in the region of 10-12%. These tended to be the hospitals with highaverage bed occupancy levels, i.e. greater than 85%occupancy.
An indepth study of delayed discharge was carried out at one major hospital during the year 2000. Thereasons for delayed discharge and the number of bed days lost were recorded by age group. Data areprovided in Table 7.2.
Table 7.2: Bed Days Lost due to Delayed Discharge, 2000 (Reproduced with permission)
Reasons for Delayed Discharge Age <65 yrs Age≥65 yrs Total
Awaiting: N % N % N %
Long-term care 2,861 50.2 6,743 49.5 9,604 49.7
Rehabilitation placement 1,292 23.0 2,134 15.6 3,426 17.7
Bed in another hospital 449 8.0 879 6.4 1,328 6.9Hospice bed 292 5.1 564 4.2 856 4.4
Short-term convalescence 83 1.4 683 5.0 766 4.0
Private nursing home placement 15 0.3 251 1.8 266 1.4
Housing allocation 18 0.3 85 0.6 103 0.5
Social / Community support 598 10.4 1,828 13.4 2,426 12.6
Adapted housing / Equipment 21 0.3 241 1.9 262 1.4
Transport 50 0.8 33 0.2 83 0.4
Miscellaneous 16 0.2 187 1.4 203 1.0
TOTAL 5,695 100.0 13,628 100.0 19,323 100.0
The total of 19,323 bed days lost due to delayed discharge represented approximately 12%of bed days used
in that hospital that year. Major points of note are:• 85%of bed days lost were due to lack of appropriate placement facil it ies (long-term care, rehabil itation,
hospice care, convalescence, etc.);• 15%of bed days lost were due to inadequate social / community support services to enable return to home;• patients over 65 years accounted for 70%of the bed days lost;• patients awaiting placement for rehabilitation accounted for 18%of the bed days lost. The need for
rehabilitation was not confined to those in older age groups.
Estimation of Impact on Bed Need
The objecti ve of this assessment is to estimate the number of acute hospital beds which could be madeavailable if patients who have completed their medical treatment could be discharged without delay.It is considered that 12%is a reasonable estimate of the proportion of bed days which are lost due
to delayed discharge, at least in the major hospitals.
Figure 7.1: Estimated Impact of Measures to reduce Delayed Discharge on Bed Need
Step 1 Estimation of the %of bed days lost due to delayed discharge (approximately 12%)
Step 2 Bed days used in hospitals with average occupancy greater than 85%
(IMR data, 2000) = 2,053,901
Step 3 Estimate of bed days lost due to delayed discharge in hospitals with occupancy
greater than 85%= 246,468
Estimate of Impact Approximately 675 beds could be made available
Conclusion
It is estimated that the equivalent of 675 beds could be made available in acute hospitals if measures toreduce delayed discharge were put in place. These include appropriate placement facilit ies and communi tysupport services, both of which require significant investment and organisation in order to be effecti ve.
70
A c u t e H o s p i t a l B e d C a p a c i t y
A N a t i o n a l R e v i e w

8/8/2019 Acute Hospital Bed Capacity
http://slidepdf.com/reader/full/acute-hospital-bed-capacity 73/94
71
A c u t eH o s pi t al B e d C a p a c
i t y
A N a t i on al R evi ew
7.3 Potential use of Capacity in Hospitals with Average Occupancy less than 85%
ContextSection 5 considered the issue of ‘optimal’ average bed occupancy and provided an estimate of the number ofadditional beds which would be required to reduce average occupancy levels in major hospitals to 85%. Somehospitals have reported average occupancy levels less than 85%. The issue is whether there is capacity in thesehospitals which could be used to alleviate part of the occupancy problem of the major hospitals.
Measuring Potential Available Capacity
The issues to consider in estimating the potential capacity available in the system are as follows:
• hospitals with reported average occupancy levels less than 85%are primarily those without A&E departments.None of these hospitals have regional or national specialt ies. Some are single specialty hospitals;
• ‘optimal’ average occupancy level is, in part, dependent on hospital size, with appropriate occupancy beinglower for smaller hospitals;32
• transferring patients from hospitals with greater than 85%occupancy to those with less must take account ofthe need for, and availability of, specialist services and resources to treat multi-system disease;
• hospitals with less than 85%occupancy include some maternity and paediatric hospitals, and others whichcould not cater for patients from an acute general hospital; and
• any assessment of the potential movement from one hospital to another must take account of geographicallocation.
Potential Available Capacity Nationwide
For the assessment of potential capacity which might be available, account should be taken of recommendedoccupancy levels for smaller hospitals.32 Data on hospital bed occupancy levels are derived from monthly IMR’sreturned by all hospitals to the DOHC. IMR data for 2000 indicate that there were 26 hospitals with reportedaverage occupancy less than that which is regarded as appropriate for size. The average occupancy of thesehospitals was 75.4%. Details are provided in the Technical Report .see p.14
Estimation of Impact on Bed Need
Estimation of capacity which might be available for use nationwide is given in Figure 5.4. Even within this, thereare issues of transfer of patients, distance to travel and specialty issues which may make it less than feasible toutilise that capacity.
Figure 7.2: Estimated Potential to use Avail able Capacity
Step 1 Hospitals, excluding maternity and paediatric hospitals, with potential available capacity
Number of hospitals 26
Number of beds in these hospitals 4,753
Average occupancy level 75.4%
Range of reported occupancy levels 21.6%-84.6%
Step 2 Adjustment for hospital size, specialty restrictions and geographic restrictions
Details in the Technical Report .see p.14
Estimate of Impact Approximately 200 beds could be made available
Conclusion
An assessment of the potential use of capacity in hospitals with average occupancy less than 85%would suggestthat the equivalent of 200 beds might be available for use. However, the use of this capacity is contingent uponnecessary investment to cater for different types of patients.

8/8/2019 Acute Hospital Bed Capacity
http://slidepdf.com/reader/full/acute-hospital-bed-capacity 74/94
7.4 Substitution of Elective Inpatient Surgery with Day Surgery
Context
The traditional role of hospitals is being challenged in all industrialised countries. Faced with increasingcosts due to new technologies, increasing demand and ageing populations, there is increasing pressure todevelop strategies to contain costs and improve efficiency.54 Increasing the number of proceduresundertaken as day cases represents one such strategy. This has been facilitated by significant developmentsin anaesthesia, minimally invasive surgery and post-operative analgesia.55 Ambulatory surgery wasintroduced in 1970 and has been practised most extensively in the USA, where it is estimated that by nowapproximately 75%of all surgical procedures are performed on a day basis.55 Other developed countries arecatching up. The UK Government has set a target of 75%of all elective surgical procedures to be carried outas day cases.56
The emergence of day activity as a significant component of hospital-based care in Ireland has been profiledin Section 3. Of elective patients treated in publicly-funded hospitals in 2000, 68%were treated as day cases.Day activity is expected to continue to grow in volume. What is at issue is the ability of day work tosubstitute for inpatient work. Many plans assume that growth in day cases will represent a directsubstitution for inpatient work.31 Evidence shows, however, that much of the growth is the result of newtechniques and technology,31 and does not necessarily substitute for inpatient work.
Measuring the Potential to Substitute Inpatient with Day Work
To assess the potential to substitute inpatient with day work, it is best to examine medical and surgical dayactivity separately.
Medical day activity: This consti tutes almost three-quarters of all day work. It is comprised predominantlyof procedures on the digesti ve system and treatment of patients with cancer. Medical day acti vity is expectedto continue to increase due to advances in medical technology, telemedicine and increased demand. It isunlikely, however, that this will substitute for inpatient work and may even contribute to inpatient needs.25
In 2000, 78%of elective medical patients in Ireland were treated on a day basis.
Surgical day activity: Any attempt to substitute inpatient with day work is likely to be most successful iftargeted at elective surgical procedures. The advent of minimally invasive surgical techniques, in particularlaparoscopic surgery, allows for expansion in the variety and complexity of procedures which can safely bedone on a day basis.55 In 2000, 50%of elective surgical patients in Ireland were treated on a day basis. Inorder to increase this proportion investment in day facilities is essential, though changes in clinical practiceand patient acceptance of day procedures are also important.
Benchmarks for the proport ions of selected surgical procedures which can be carried out as day cases havebeen established by the UK Audit Commission (AC)57, 58 and the British Association of Day Surgery (BADS).56
The AC‘Basket ’ of 20 procedures accounts for “a substantial proport ion of day surgery and covers all themain surgical specialties”.58These procedures have been assessed by expert clinicians as generally suitablefor day surgery, but of sufficient complexity to make it unusual for them to be carried out as outpatients.The BADShas modified and updated the AC ‘Basket ’, adding 20 more procedures, of which i t is suggestedthat 50%could be done as day cases. This is called the BADS ‘Trolley’ of procedures.56 The data compiled bythe ACand BADSare based on elective admissions and are confined to selected procedures from individualspecialt ies. The combined list of ACand BADSprocedures are given in Appendix III.
Day Surgery in Ireland
To examine the proportion of elective surgery performed on a day basis in Ireland, HIPE data for 2000 wereanalysed. Data are presented in Table 7.3. ‘Procedures’ refers to the types of surgical procedures carried out;‘operations’ refers to the numbers of those procedures performed. Data are given separately for all elective surgery, and for the AC‘Basket ’ and the BADS‘Trolley’ of procedures.72
A c u t e H o s p i t a l B e d C a p a c i t y
A N a t i o n a l R e v i e w

8/8/2019 Acute Hospital Bed Capacity
http://slidepdf.com/reader/full/acute-hospital-bed-capacity 75/94
73
A c u t eH o s pi t al B e d C a p a c
i t y
A N a t i on al R evi ew
Table 7.3: Elective Surgery in Ireland, excluding Obstetrics 2000:Total, AC‘Basket ’ and BADS‘Trolley’ of procedures and operations
Elective Surgery All AC‘basket ’ BADS‘Trolley’ AC+ BADS
Procedure types All 19 20 39
Operations 141,919 48,708 12,963 61,671
Day based 71,493 29,178 5,343 34,521
(50%) (60%) (41%) (56%)
LOSof inpatients (days)
Mean 5.8 2.5 4.9 3.2
Median 3.0 2 4 3
Of all elective operations (141,919), 50%were done on a day basis. The 19 procedures of the AC‘Basket ’resulted in 48,708 elective operations, of which 60%were done on a day basis. The 20 procedures of theBADS‘Trolley’ resulted in 12,963 operations, of which 41%were done on a day basis.
Estimation of Impact on Bed Need
The objecti ve of this exercise was to estimate the number of inpatient beds which could be madeavailable by substi tution of electi ve inpatient surgery with day surgery.
This computation makes important assumptions:
1. that a certain proportion of elective surgical procedures, currently being performed as inpatientprocedures, could be done on a day basis;
2. that the benchmarks derived by the UK ACand BADSare relevant and feasible in Ireland; and
3. that the bed days which could be freed up can be computed from current lengths of stay of electi veinpatients having those procedures.
Figure 7.3: Estimated Impact of additional Day Surgery on Bed Need
Step 1 Identif ication of the proportion of each procedure of the AC/ BADS‘Trolley’ carried out as
day cases in Ireland in 2000 (Appendix III)
Step 2 Comparison of the proportion carried out as day cases in Ireland with the UK benchmark
proportion for each procedure (Appendix III)
Step 3 Estimation of the number of inpatient procedures which could be transferred to day if the UK
benchmarks applied in Ireland (n = 11,692) (Appendix III)
Step 4 Estimation of the number of inpatient bed days which could be made available, using the
ALOSfor elective inpatients for each procedure (Technical Report see p.14)
Estimate of Impact Approximately 36,700 bed days could be made available
The results of Steps 1 to 4 for each procedure of the ACand BADSare given in Appendix III. Table 7.4summarises the findings by surgical specialty.

8/8/2019 Acute Hospital Bed Capacity
http://slidepdf.com/reader/full/acute-hospital-bed-capacity 76/94
Table 7.4: Potential to Increase Day Surgery and Inpatient Bed Days gained by specialty
Specialty Elective Treated as Additional Estimated Estimated
Patients 2000 Day Cases Day Cases possible* Bed Days Beds mademade available available
General Surgery 15,872 6,440 (41%) 3,143 11,001 30
Urology 14,012 9,944 (71%) 977 5,247 14
Orthopaedic Surgery 5,774 3,722 (64%) 710 1,589 4
Ophthalmology 10,430 5,333 (51%) 3,649 8,991 25
ENT 6,772 4,723 (70%) 752 2,477 7
Gynaecology 8,811 4,359 (49%) 2,461 7,402 20
TOTAL 61,671 34,521 (56%) 11,692 36,707 100
*Using UK benchmark proportions for each procedure
Of the 39 procedure types included in this analysis, it is estimated that an addit ional 11,692 day casescould be performed in Ireland based on the UK benchmark proportions. The consequences of this areas follows:
• estimated 36,707 bed days made available;
• estimated 100 beds made available;
• the proport ion of these electi ve surgical procedures carried out as day cases increased from 56%to75%.
The largest contribution accrues from General Surgery (30%), fol lowed by Ophthalmology (25%) andGynaecology (20%). Clearly, these proport ions are influenced to some degree by the procedures includedin this analysis. Nonetheless, it points to the potential for increasing day work in these specialties.
This analysis has identified that 75%of the elective surgical procedures analysed could be done on a daybasis. If this proportion applied to all elective surgical procedures in Ireland the results would be asfollows:
• approximately 35,000 additional day procedures would be performed annually;
• approximately 105,000 bed days could be made available (based on median LOSfor elective surgicalinpatients of 3 days);
• approximately 290 inpatient beds could be made available; and
• a minimum of 150 additional day beds would be required.
The transfer of this significant number of elective surgical procedures from inpatient to day surgerywould necessitate significant investment in day surgery facilities and resources. Based on theassumption that each patient requiring day surgery occupies a day bed each working day, this wouldnecessitate a minimum of 150 additional day beds.
Conclusion
On the basis of the above data it is evident that there is scope for additional increase in day activity inIreland over and above that which will occur due to increased demand and advances in medicaltechnology. Many new day surgery episodes represent additional acti vity rather than substi tution forinpatients. A priority therefore must now be to achieve transfer of inpatient surgery to day surgery, so
that resources can be released for other inpatient surgery. A national target of 75%of elective surgery tobe performed on a day basis should be considered.
74
A c u t e H o s p i t a l B e d C a p a c i t y
A N a t i o n a l R e v i e w

8/8/2019 Acute Hospital Bed Capacity
http://slidepdf.com/reader/full/acute-hospital-bed-capacity 77/94
75
A c u t eH o s pi t al B e d C a p a c
i t y
A N a t i on al R evi ew
7.5 Improved Management of Private Beds in Public Hospitals
Context
Under the present arrangements, 80 per cent of beds in acute hospitals may be designated as publ icwhile 20 per cent may be private. In general, this ratio is operating reasonably well in the case ofemergency admissions. The position regarding elective (planned or non-emergency) admissions is lesssatisfactory.2 The concern is that treatment of elective private patients in public hospitals is contributingto extended waiting times for some public patients.
In the context of estimating the need for additional bed capacity in public hospitals, it therefore seemsappropriate to estimate the number of beds which could be made available for use by public patientsby strict adherence to an 80/20 ratio of public and private beds.
Estimation of Impact on Bed Need
This estimation is based on the assumption that the 80/20 ratio of public and private beds existsthroughout the acute public hospital system.
Data on the eligibil ity status (i.e. public or private) of patients are available in the HIPE database. Whilethe proportions of patients who are public and private is informative, the proportions of bed days used by elective public and private patients is more useful for this exercise. The steps to estimation of impactare outlined below:
Figure 7.4: Estimated Impact of adherence to an 80/20 ratio of Public/Private beds on Bed Need
Step 1 Public/Private status of emergency and elective inpatients in publ ic hospitals extracted
from HIPE data 2000
Public Private
Emergency 79% 21%
Elective 70% 30%
Step 2 Bed days used by elective public and private inpatients in public hospitals (excluding
hospitals with no private patients and excluding maternity hospitals)
Public Private
Bed days used N 596,920 220,645
% 73% 27%
Step 3 Addit ional bed days which could be made available to public patients if 80/20 ratio applied
= 57,132 (Details in Technical Report see p.14)
Estimate of Impact Approximately 160 beds could be made available
Conclusion
Approximately 160 beds could be made available for use by elective public patients by strict adherenceto an 80/20 ratio of public/private beds in publ ic hospitals.

8/8/2019 Acute Hospital Bed Capacity
http://slidepdf.com/reader/full/acute-hospital-bed-capacity 78/94
7.6 Reformed Structure and Functioning of Primary Care
Context
A significant programme of change aimed at strengthening the structure and functioning of PrimaryCare in Ireland has been proposed in Primary Care: A New Direction as part of the new Health Strategy.59
Experience from elsewhere would suggest that significant enhancements to Primary Care servicesinitially result in an increase in the demand for acute hospital services. This may be due toidentif ication of previously unmet need and need for specialist services in the population. Ult imatelyit is expected that the need for acute hospital services would be reduced by enhanced Primary Care.
Estimated Impact on Bed Need
The impact that the proposed changes to Primary Care may have on the need for additional acutehospital facil it ies are dif ficult to quanti fy. The following data would be required:
• the proportion of A&E attendees who go to A&E as their first opt ion, but who could be treated bytheir GP;
• the proportion of A&E attendees who could be treated by their GP but to whom GP services are notavailable when needed;
• the proportion of A&E attendees who are referred there by their GP and the condit ions with whichthey are referred; and
• the proportion of A&E attendees who could not be treated by their GP.
In addition, it would be desirable to know the need that GP’s have for other hospital services e.g.outpatient appointments, diagnostic tests, minor procedures and treatment services. With data of thisnature, planning for the relocation of certain diagnostic and therapeutic functions to Primary Carecould get under way.
Conclusion
For the purposes of this Review it is not possible to make any adjustment at this time to the estimatednumber of acute hospital beds required on the basis of anticipated changes in Primary Care.
76
A c u t e H o s p i t a l B e d C a p a c i t y
A N a t i o n a l R e v i e w

8/8/2019 Acute Hospital Bed Capacity
http://slidepdf.com/reader/full/acute-hospital-bed-capacity 79/94
7.7 Measures to Reduce Emergency Admissions to Acute Hospitals
Context
The proportion of inpatients admitted through A&E departments currently runs at 71%. This hasincreased from 67%in 1995. As outlined in Section 3, emergency admissions are predominantly olderpatients with medical conditions: of medical inpatients 82%are admitted as emergency. This compareswith 37%of surgical inpatients admitted through A&E. Measures to ensure appropriateness ofadmission from A&E have been called for.
Reforming A&E
A substantial programme of improvements in A&E departments is planned under the Health Strategy.2
Significant initiatives will be taken to improve the operation of A&E departments by directing patientsto the most appropriate forms of care and ensuring those that need treatment are seen as quickly aspossible. These include:
• additional A&E consultants to be appointed to facilitate rapid clinical decision making;
• triage procedures to be put in place;
• minor injury units to be established to facil itate treatment of non-urgent patients;
• chest pain clinics and respiratory clinics to be established;
• diagnostic services to be organised to ensure increased access;
• advanced nurse practitioners to be appointed; and
• information systems to be developed.
Estimated Impact on Bed Need
Quanti fying the impact of these combined measures on emergency admissions and, therefore, on theneed for acute hospital beds is difficult. For the purposes of this Review, it is not possible to make anyadjustment at this time to the estimated need for acute hospital beds on the basis of the planneddevelopments in A&E departments.
77
A c u t eH o s pi t al B e d C a p a c
i t y
A N a t i on al R evi ew

8/8/2019 Acute Hospital Bed Capacity
http://slidepdf.com/reader/full/acute-hospital-bed-capacity 80/94
SECTI ON 8
Estimating
National
Bed Need

8/8/2019 Acute Hospital Bed Capacity
http://slidepdf.com/reader/full/acute-hospital-bed-capacity 81/94
In so far as possible, data on potential determinants of acute hospital bed need in Ireland have beencollated from available sources. Some data upon which estimates have been made are provisional atthis time, such as the population estimates for 2000. These cannot be confirmed unti l the next censustakes place. Assumptions made in relation to individual determinants have been outlined. Determinantsof bed requirement have been treated in what would appear to be a logical sequence. No analyticalmodel is likely to capture all of the real life factors which contribute to such a complex issue. Somefactors are readily identifiable and quantifiable; others are not.
The impact of each factor is presented in terms of the number of beds ‘required’ or made available.This ‘univariate’ approach to analysis has both strengths and limitations. Its strength is that it shows therelative importance of individual determinants on the need for additional hospital beds. Its limi tationis that many of the factors identified in this review, and profiled in Figure. 8.1, operate simultaneouslyand interactively in a complex manner which is difficult to model.
In so far as is possible numerical estimates of beds needed or made available have been derived. Theresults are presented in Table 8.1. The gross estimate of addit ional bed need takes account of thosedifficulties in the hospital system which require immediate attention (occupancy levels and waitinglists) and factors which will increase the need for beds in the future (demographic changes anddemand). The net estimate assumes parallel investment in strategies aimed at reducing the need foracute hospital beds. These include additional community support services and facilities to allow for
timely discharge of patients to more appropriate settings, addit ional day facilit ies to allow forsubstitut ion of inpatient with day surgery and improved management of existing bed stock.
Figure 8.1: Factors which Impact on the need for Acute Hospital Beds
Recent Population
Changes
Improved Efficiency in
Hospitals
Waiting Lists
Measures to reduce
Delayed Discharge
Adherence to Public/
Private Mix Ratio
Substi tution of Inpatient
with Day
Procedures
Acute Bed Occupancy
Levels
Increasing Expectations /Demand
Advances in Medical Technology
Projected Demographic
Changes
Reformed Primary
Care
Reforms to OPD and A&E
Services
ACUTEHOSPITAL
BEDS
Current Acute
Hospital Activity
79
A c u t eH o s pi t al B e d C a p a c
i t y
A N a t i on al R evi ew

8/8/2019 Acute Hospital Bed Capacity
http://slidepdf.com/reader/full/acute-hospital-bed-capacity 82/94
Table 8.1: Additional Acute Hospital Beds Required in Ireland to 2011
Acute Hospital Bed Complement in 2000 11,832
Current Indicators of Inadequate Bed Capacity
Addit ional beds required to reduce average bed occupancy in major hospitals 883*
Additional beds required to facili tate treatment of Waiting List pat ients 492*
Factors which will Increase the Need for Acute Beds
Additional beds required due to projected demographic changes 1,630*
Addi tional beds requi red to cope wi th increased demand for heal thcare 1,330†
Additional Inpatient Beds Required (Gross Estimate) 4,335
Strategies with the Potential to Reduce Need for Additional Beds
Investment in measures to reduce delayed discharge from acute hospi tals 675
Potential use of available capacity in some hospitals 200
Substitution of elective inpatient surgery with day surgery 290
Treatment of one-third of waiting list patients on a day basis 170
Improved management of public and private beds for elective patients 160
Potential Capacity within the Existing System 1,495
Additional Inpatient Beds Required (Net Estimate) 2,840
Additional days beds Required (in addition to net estimate) 190
* Adjusted for 85%occupancy† Application of the estimate of demand to existing bed complement corrected for occupancy
Correction of current high occupancy levels in major hospitals accounts for 20%of the estimated grossneed; Wait ing Lists account for approximately 11%. By far the greatest need wil l be incurred byprojected demographic changes (38%) and by increasing demand for healthcare (31%). Among thestrategies with the potential to reduce the need for additional beds, investment in measures to reducedelayed discharge from acute hospitals would have the greatest impact. This alone could ‘provide’ 16%of the capacity required. Investment in day facil it ies, and a substantial shift of elective inpatient surgeryto day surgery, could reduce the need for addit ional beds by 11%. Strict adherence to an 80/20 ratio ofpublic and private beds for elective patients, has the potential to contribute 4%of the need identi fied.The potential to use available capacity in some hospitals could provide a further 5%of the need.
It is essential to record that combined implementation of all of these strategies will not resolve thecurrent capacity deficit. It could provide up to one-third of beds needed. However, at least two-thirds ofthe required capacity must be added to the system, in conjunction with significant parallel investment
in the strategies outlined.
80
A c u t e H o s p i t a l B e d C a p a c i t y
A N a t i o n a l R e v i e w

8/8/2019 Acute Hospital Bed Capacity
http://slidepdf.com/reader/full/acute-hospital-bed-capacity 83/94
81
A c u t eH o s pi t al B e d C a p a c
i t y
A N a t i on al R evi ew

8/8/2019 Acute Hospital Bed Capacity
http://slidepdf.com/reader/full/acute-hospital-bed-capacity 84/94
Bibliography

8/8/2019 Acute Hospital Bed Capacity
http://slidepdf.com/reader/full/acute-hospital-bed-capacity 85/94
Bibliography
1. Programme for Prosperity and Fairness . National Agreement Report. Government of Ireland, Apri l 2000.2. Quality and Fairness: A Health System for You . Health Strategy, Department of Health and Children, Dublin.
The Stationery Off ice, Dublin 2001.
3. Statistical information relevant to the Health Services 1982. Prepared by the Planning Unit, Department of
Health. The Stationery Off ice, Dubl in. 1982;p.41-66
4. Statistical Information relevant to the Health Services 1983. Prepared by the Planning Unit, Department of
Health. The Stationery Off ice, Dubl in. 1983;p.41-66
5. Statistical Information relevant to the Health Services 1984. Prepared by the Planning Unit, Department of
Health. The Stationery Off ice, Dubl in. 1984;p.47-74
6. Statistical Information relevant to the Health Services 1985. Prepared by the Planning Unit, Department of
Health. The Stationery Off ice, Dubl in. 1985;p.52-76
7. Health Statistics 1986. Prepared by the Planning Unit, Department of Health. The Stationery Office, Dublin.1986;p.52-76
8. Health Statistics 1987. Prepared by the Planning Unit, Department of Health. The Stationery Off ice, Dublin.
1987;p.61-82
9. Health Statistics 1988. Prepared by the Planning Unit, Department of Health. The Stationery Off ice, Dublin.
1988;p.53-95
10. Health Statistics 1989. Prepared by the Planning Unit, Department of Health. The Stationery Off ice, Dublin.
1990;p.63-109
11. Health Statistics 1990. Prepared by the Planning Unit, Department of Health. The Stationery Off ice, Dublin.
1991;p.69-135
12. Health Statistics 1991. Prepared by the Planning Unit, Department of Health. The Stationery Off ice, Dublin.
1992;p.70-104
13. Health Statistics 1992. Prepared by the Planning Unit, Department of Health. The Stationery Off ice, Dublin.
1993;p.74-105
14. Health Statistics 1993. Prepared by the Planning Unit, Department of Health. The Stationery Off ice, Dublin.
1995;p.76-117
15. Health Statistics 1994. Prepared by the Planning Unit, Department of Health. The Stationery Off ice, Dublin.
1996.
16. Health Statistics 1999. Prepared by Information Management Unit, Department of Health & Children. The
Stationery Office, Dublin, 1999.
17. Health Statistics 1997 to 2000. Prepared by Information Management Unit , Department of Health & Children.
Personal communication.
18. OECD Economic Surveys, 1996-1997, Ireland. (p116-151)
19. OECD Health Data 2000. A Comparative Analysis of 29 Countries. OECD Health Policy Unit , Paris, France, 2000.
20. Shaping the Future NHS: Long Term Planning for Hospitals and Related Services. Consultation Document on the
Findings of The National Beds Inqui ry. Department of Health, London, 2000.
21. Shaping the Future NHS: Long Term Planning for Hospitals and Related Services. Consultation Document on the
Findings of the National Beds Inqui ry - Support ing Analysis. Department of Health, London, 2000.
22. Acute Hospitals Review Group Report. Department of Health, Social Services and Public Safety, Northern
Ireland, June 2001.
23. Pollock AM, Dunningan MG. Beds in the NHS: The National Bed Inquiry exposed contradictions in government
policy. BMJ 2000;320:461-62.
24. Yamey G. Government inquiry finds inadequate beds provision. BMJ 2000;320:463.
25. Health Care Advisory Board. A Delicate Balance: Managing the Inpatient Enterprise for Profitable Growth. The
Advisory Board Company, Washington, DC, USA, 2001.
83
A c u t eH o s pi t al B e d C a p a c
i t y
A N a t i on al R evi ew
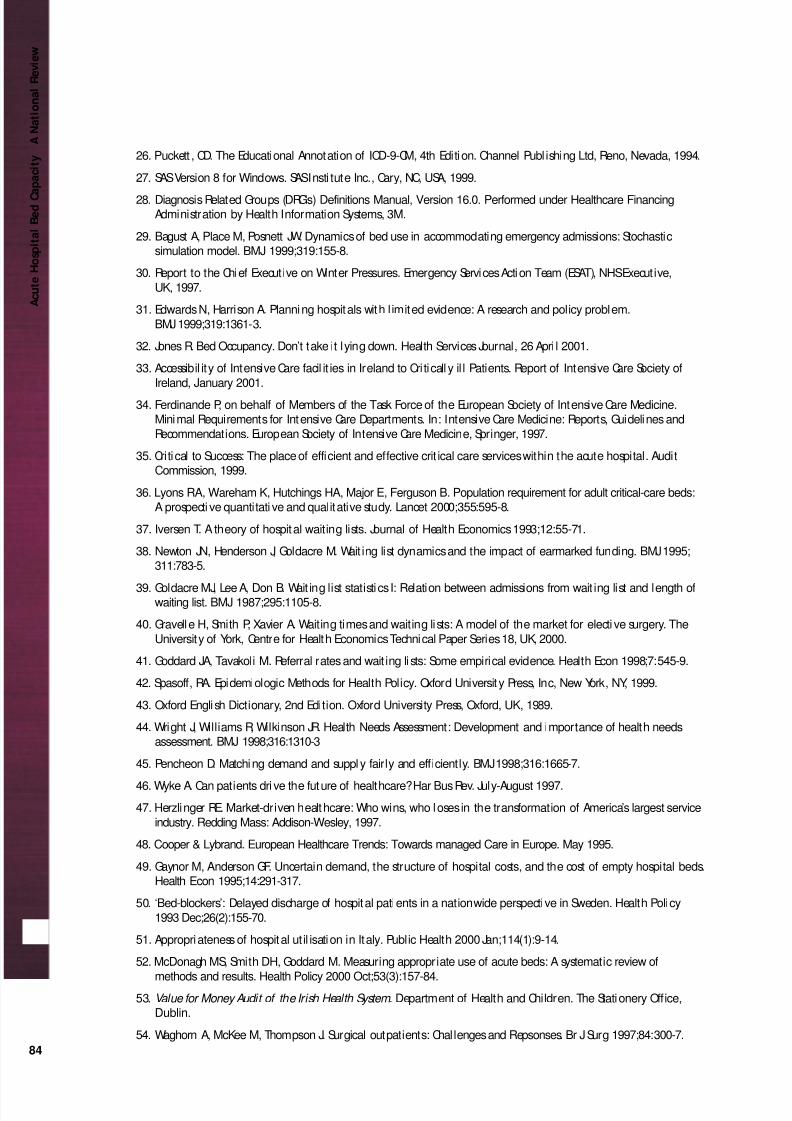
8/8/2019 Acute Hospital Bed Capacity
http://slidepdf.com/reader/full/acute-hospital-bed-capacity 86/94
26. Puckett , CD. The Educational Annotation of ICD-9-CM, 4th Edition. Channel Publ ishing Ltd, Reno, Nevada, 1994.
27. SASVersion 8 for Windows. SASInsti tute Inc., Cary, NC, USA, 1999.
28. Diagnosis Related Groups (DRG’s) Definitions Manual, Version 16.0. Performed under Healthcare FinancingAdministration by Health Information Systems, 3M.
29. Bagust A, Place M, Posnett JW. Dynamics of bed use in accommodating emergency admissions: Stochastic
simulation model. BMJ 1999;319:155-8.
30. Report to the Chief Executive on Winter Pressures. Emergency Services Action Team (ESAT), NHSExecutive,
UK, 1997.
31. Edwards N, Harrison A. Planning hospitals with l imited evidence: A research and policy problem.
BMJ 1999;319:1361-3.
32. Jones R. Bed Occupancy. Don’t take it lying down. Health Services Journal, 26 Apri l 2001.
33. Accessibil ity of Intensive Care facil it ies in Ireland to Criticall y il l Patients. Report of Intensive Care Society of
Ireland, January 2001.
34. Ferdinande P, on behalf of Members of the Task Force of the European Society of Intensive Care Medicine.
Minimal Requirements for Intensive Care Departments. In: Intensive Care Medicine: Reports, Guidelines and
Recommendations. European Society of Intensive Care Medicine, Springer, 1997.
35. Critical to Success: The place of efficient and effective crit ical care services within the acute hospital. Audit
Commission, 1999.
36. Lyons RA, Wareham K, Hutchings HA, Major E, Ferguson B. Population requirement for adult critical-care beds:
A prospecti ve quantitati ve and qualitative study. Lancet 2000;355:595-8.
37. Iversen T. A theory of hospital waiting lists. Journal of Health Economics 1993;12:55-71.
38. Newton JN, Henderson J, Goldacre M. Wait ing list dynamics and the impact of earmarked funding. BMJ 1995;
311:783-5.
39. Goldacre MJ, Lee A, Don B. Wait ing list statistics I: Relation between admissions from wait ing list and length ofwaiting list. BMJ 1987;295:1105-8.
40. Gravelle H, Smith P, Xavier A. Waiting times and waiting lists: A model of the market for electi ve surgery. The
University of York, Centre for Health Economics Technical Paper Series 18, UK, 2000.
41. Goddard JA, Tavakoli M. Referral rates and wait ing lists: Some empirical evidence. Health Econ 1998;7:545-9.
42. Spasoff, RA. Epidemiologic Methods for Health Policy. Oxford University Press, Inc, New York, NY, 1999.
43. Oxford English Dictionary, 2nd Edition. Oxford University Press, Oxford, UK, 1989.
44. Wright J, Williams R, Wilkinson JR. Health Needs Assessment: Development and importance of health needs
assessment. BMJ 1998;316:1310-3
45. Pencheon D. Matching demand and supply fairly and efficiently. BMJ 1998;316:1665-7.
46. Wyke A. Can patients dri ve the future of healthcare? Har Bus Rev. July-August 1997.
47. Herzlinger RE. Market-driven healthcare: Who wins, who loses in the transformation of America’s largest service
industry. Redding Mass: Addison-Wesley, 1997.
48. Cooper & Lybrand. European Healthcare Trends: Towards managed Care in Europe. May 1995.
49. Gaynor M, Anderson GF. Uncertain demand, the structure of hospital costs, and the cost of empty hospital beds.
Health Econ 1995;14:291-317.
50. ‘Bed-blockers’: Delayed discharge of hospital patients in a nationwide perspective in Sweden. Health Policy
1993 Dec;26(2):155-70.
51. Appropriateness of hospital util isation in Italy. Public Health 2000 Jan;114(1):9-14.
52. McDonagh MS, Smith DH, Goddard M. Measuring appropriate use of acute beds: A systematic review of
methods and results. Health Policy 2000 Oct;53(3):157-84.53. Value for Money Audit of the Irish Health System . Department of Health and Children. The Stationery Office,
Dublin.
54. Waghorn A, McKee M, Thompson J. Surgical outpatients: Challenges and Repsonses. Br J Surg 1997;84:300-7.
84
A c u t e H o s p i t a l B e d C a p a c i t y
A N a t i o n a l R e v i e w

8/8/2019 Acute Hospital Bed Capacity
http://slidepdf.com/reader/full/acute-hospital-bed-capacity 87/94
55. Corvera CU, Kirkwood KS. Recent advances, General surgery. BMJ 1997;315:586-9.
56. Brit ish Association of Day Surgery and Newchurch Limited. Day Surgery Benchmarking in the UK 1999/2000.
The Journal of One Day Surgery. Autumn 2001.
57. The Audit Commission for Local Authorities and the National Health Service in England and Wales. “A Shortcut
to Better Services: Day Surgery in England and Wales”. HMSO, London, 1990.
58. The Audit Commission for Local Authorities and the National Health Service in England and Wales. “Day Surgery
Follow Up: Progress against indicators from A Shortcut to Better Services”. HMSO, London, November 1998.
59. Primary Care: A New Direction. Department of Health and Children, Dublin. The Stationery Off ice,
Dublin, 2001.
85
A c u t eH o s pi t al B e d C a p a c
i t y
A N a t i on al R evi ew

8/8/2019 Acute Hospital Bed Capacity
http://slidepdf.com/reader/full/acute-hospital-bed-capacity 88/94
Appendices

8/8/2019 Acute Hospital Bed Capacity
http://slidepdf.com/reader/full/acute-hospital-bed-capacity 89/94
Appendix I
Figure 3.1: A&E Attendances and %of A&E Attendees admitted, 1995 to 2000
A&E 1995 1996 1997 1998 1999 2000
Attendances 1,199,452 1,193,777 1,213,321 1,242,343 1,229,303 1,202,635
%Admitted 24.3 24.6 24.5 24.3 24.9 26.1
Figure 3.2: Total Admissions, excluding Obstetric Patients, 1995 to 2000
Admissions 1995 1996 1997 1998 1999 2000
Number 594,620 625,690 639,635 656,314 676,854 711,694
Rate/1,000 165.1 172.5 174.7 177.1 180.7 187.9
Figure 3.3: Inpatients Discharged, excluding Obstetric Inpatients, 1995 to 2000
Inpatients 1995 1996 1997 1998 1999 2000
Number 433,216 435,131 433,459 431,181 430,932 441,117
Rate/1,000 120.3 120.0 118.4 116.4 115.0 116.5
Figure 3.5: Bed Days Used and Average Length of Stay, excluding Obstetric Inpatients, 1995 to 2000
Inpatients 1995 1996 1997 1998 1999 2000
Bed Days Used 3,124,128 3,048,817 2,992,141 3,021,412 2,998,626 3,033,428
Inpatients 433,216 435,131 433,459 431,181 430,932 441,117
ALOS 7.21 7.01 6.90 7.01 6.96 6.88
Figure 3.6: Day Cases, excluding Obstetric Day Cases, 1995 to 2000
Day Cases 1995 1996 1997 1998 1999 2000
Number 161,404 190,559 206,176 225,133 245,922 270,577
Rate/1,000 44.8 52.5 56.3 60.8 65.7 71.4
Figure 3.7: %Treated as Day Cases, excluding Obstetric Day Cases, 1995 to 2000
Day Cases 1995 1996 1997 1998 1999 2000
%of All Patients 27.1 30.5 32.2 34.3 36.3 38.0%of Elective Patients 53.2 57.5 60.2 63.5 66.4 68.1
Figure 3.8: Outpatient Attendances: Numbers and Rates/1,000 Population, 1995 to 2000
OPD 1995 1996 1997 1998 1999 2000
Attendances 1,890,702 1,901,292 1,928,734 1,963,504 1,930,942 2,006,332
Rate/1,000 525 524 527 530 516 530
Figure 3.9: Medicine vs Surgery: Total Admissions, excluding Obstetric Patients, 1995 to 2000
Admissions 1995 1996 1997 1998 1999 2000
Medical (N) 428,803 452,497 465,361 483,216 501,482 527,650
Surgical (N) 165,817 173,193 174,274 173,098 175,372 184,044
87
A c u t eH o s pi t al B e d C a p a c
i t y
A N a t i on al R evi ew

8/8/2019 Acute Hospital Bed Capacity
http://slidepdf.com/reader/full/acute-hospital-bed-capacity 90/94
Figure 3.10: Medicine vs Surgery: Inpatients Discharged, excluding Obstetric Inpatients, 1995 to 2000
Inpatients 1995 1996 1997 1998 1999 2000
Medical (N) 315,765 316,504 317,028 319,552 322,166 328,566
Surgical (N) 117,451 118,627 116,431 111,629 108,766 112,551
Figure 3.11: Medicine vs Surgery: %of Inpatients, excluding Obstetr ic Inpatients, admitted as Emergencies,
1995 to 2000
Inpatients 1995 1996 1997 1998 1999 2000
Medical 80.0 80.4 80.8 81.6 82.5 82.8
Surgical 32.6 33.5 35.2 36.8 37.5 37.4
Figure 3.12: Medicine vs Surgery: Bed Days Used and Average Length of Stay, excluding Obstetric Inpatients,
1995 to 2000
Inpatients 1995 1996 1997 1998 1999 2000
Bed Days Used
Medical 2,215,480 2,153,622 2,118,420 2,153,753 2,172,913 2,196,840
Surgical 908,648 895,195 873,721 867,659 825,713 836,588
ALOS
Medical 7.02 6.80 6.68 6.74 6.74 6.69
Surgical 7.74 7.54 7.50 7.77 7.59 7.43
Figure 3.13: Medicine vs Surgery: Day Cases excluding Obstetric Day Cases, 1995 to 2000
Day Cases 1995 1996 1997 1998 1999 2000
Medical (N) 113,038 135,993 148,333 163,664 179,316 199,084
Surgical (N) 48,366 54,566 57,843 61,469 66,606 71,493
Figure 3.14: Medicine vs Surgery: Proportions of all Patients and of Electi ve Patients treated as Day Cases,
1995 to 2000
Day Cases 1995 1996 1997 1998 1999 2000
%of All Patients
Medical 26.4 30.1 31.9 33.9 35.8 37.7
Surgical 29.2 31.5 33.2 35.5 38.0 38.8
%of Elective PatientsMedical 64.2 68.7 70.9 73.6 76.1 77.9
Surgical 37.9 40.9 43.4 46.5 49.5 50.4
Figure 3.15: Medicine vs Surgery: Bed Designations vs Clinical Acti vity
Clinical Category Bed Designations Bed Days Used
N % N %
Medical 4,590 51 1,896,496 71
Surgical 4,417 49 782,548 29
Total 9,007 100 2,379,044 100
88
A c u t e H o s p i t a l B e d C a p a c i t y
A N a t i o n a l R e v i e w

8/8/2019 Acute Hospital Bed Capacity
http://slidepdf.com/reader/full/acute-hospital-bed-capacity 91/94
Appendix II
Figure 4.1: Age-specif ic Distributions of Inpatients Discharged, 2000
Inpatients 0-4 5-14 15-24 25-34 35-44 45-54 55-64 65-74 75-84 85+ Total
Number 50,174 32,800 64,953 82,872 55,201 46,387 49,761 63,220 58,910 18,598 522,876
Rate/1,000 189.3 58.6 94.8 145.3 105.1 100.5 154.8 265.0 409.7 446.0 138.1
Figure 4.2: Age-specific Rates of Medical and Surgical Inpatients Discharged, 2000
Rate/1,000 0-4 5-14 15-24 25-34 35-44 45-54 55-64 65-74 75-84 85+ Total
Medical 171.5 42.8 72.5 108.2 71.9 69.5 113.1 201.8 325.0 365.6 104.4
Surgical 17.7 15.8 25.9 37.1 33.2 31.0 41.6 63.2 84.7 80.4 33.7
Figure 4.3: Proportion of Inpatients in each age category admitted as Emergencies, 2000
% 0-4 5-14 15-24 25-34 35-44 45-54 55-64 65-74 75-84 85+ Total
Total 87.6 76.1 77.0 72.8 67.2 61.8 62.0 65.7 73.0 80.9 71.8
Medical 93.1 88.5 84.6 79.2 78.7 76 74.2 76.5 82.3 87.3 81.6
Surgical 34.2 42.4 55.6 54.2 42.3 30.1 28.9 31.2 37.4 51.7 41.5
Figure 4.4: Age-specific Average Length of Stay of Inpatients Discharged, 2000
ALOS 0-4 5-14 15-24 25-34 35-44 45-54 55-64 65-74 75-84 85+ Total
Total 4.1 2.9 3.6 3.9 4.7 6.4 7.8 9.6 11.4 13.2 6.3
Emergency 4.0 2.7 3.4 3.7 4.7 6.5 8.1 9.8 11.1 12.1 6.2
Elective 4.9 3.3 4.3 4.2 4.7 6.2 7.2 9.2 11.9 17.5 6.8
Figure 4.5: Age-specific Distributions of Inpatient Bed Days Used, 2000
Bed Days Used 0-4 5-14 15-24 25-34 35-44 45-54 55-64 65-74 75-84 85+ Total
N x 1,000 2,064 937 2,363 3,200 2,584 2,959 3,861 6,083 6,687 2,446 33,184
Rate/1,000 778.6 167.5 358.0 561.0 492.0 641.1 1200.9 2549.5 4650.4 5866.2 876.3
Figure 4.6: Age-specific Distr ibutions of Bed Days Used by Medical and Surgical Inpatients, 2000
Rate/1,000 0-4 5-14 15-24 25-34 35-44 45-54 55-64 65-74 75-84 85+ TotalMedical 682.9 117.2 245.3 375.8 310.7 416.3 813.5 1835.9 3626.1 4838.9 634.0
Surgical 95.6 50.3 112.7 185.2 181.3 224.7 387.4 713.6 1024.2 1027.3 242.3
Figure 4.8: Age-specific Distr ibutions of Day Cases, 2000
Day Cases 0-4 5-14 15-24 25-34 35-44 45-54 55-64 65-74 75-84 85+ Total
Number 12,977 15,508 22,436 29,546 38,409 45,266 44,348 39,739 21,222 3,827 273,278
Rate/1,000 49.0 27.7 34.0 51.8 73.1 98.1 137.9 166.6 147.6 91.8 72.2
89
A c u t eH o s pi t al B e d C a p a c
i t y
A N a t i on al R evi ew

8/8/2019 Acute Hospital Bed Capacity
http://slidepdf.com/reader/full/acute-hospital-bed-capacity 92/94
Figure 4.9: Age-specif ic Rates of Medical and Surgical Day Cases, 2000
Rate/1,000 0-4 5-14 15-24 25-34 35-44 45-54 55-64 65-74 75-84 85+ Total
Medical 28.6 14.2 21.5 33.8 52.3 77.4 116.8 139.7 111.2 58.9 53.2
Surgical 20.3 13.5 12.5 18.0 20.8 20.7 21.1 26.9 36.4 32.9 18.9
Figure 4.10: Age-specific Proportions of Electi ve Patients treated as Day Cases, 2000
% 0-4 5-14 15-24 25-34 35-44 45-54 55-64 65-74 75-84 85+ Total
Total 67.5 66.4 60.0 56.8 68.0 71.9 70.1 64.7 57.1 51.9 65.0
Medical 70.7 74.3 65.8 60.1 77.4 82.2 80.0 74.7 65.8 56.0 73.5
Surgical 63.5 59.7 52.1 51.4 52.1 48.8 41.6 38.2 40.7 45.8 49.0
90
A c u t e H o s p i t a l B e d C a p a c i t y
A N a t i o n a l R e v i e w

8/8/2019 Acute Hospital Bed Capacity
http://slidepdf.com/reader/full/acute-hospital-bed-capacity 93/94
Appendix IIIBenchmarking day surgery: Elective operations in Ireland in 2000, the number and %done on a day basis,
the UK benchmark %for each procedure and estimation of additional day surgery possible in I reland.
Procedure ICD Codes Elective Done on a UK Estimated
Operat ions in Day Basis Benchmark Addi tional
Ireland, 2000 N % % Day Cases*
General Surgery
Inguinal hernia repair 53.0-1 3,718 899 24% 46% 811
Excision of breast lump 85.11-9, 85.20-1 3,753 2,845 76% 69%
Anal fissure excision 49.31, 49.39 151 101 67% 74% 11
Varicose vein stripping or ligation 38.50-9 3,606 1,203 33% 60% 961
Laparoscopic cholecystectomy 51.23 2,442 86 4% 50% 1,135
Thoracoscopic sympathectomy 05.22-3 34 2 6% 50% 15
Breast cancer wide excision 85.22, 85.23 348 18 7% 50% 156
Haemorrhoidectomy 49.4 1,677 1,268 76% 50%Subcutaneous mammectomy 85.3 143 18 13% 50% 54
Sub Total 15,872 6,440 41% 3,142
Urology
Cystoscopy 57.31-9 9,589 7,765 81% 79%
Circumcision 64.0 2,358 1,798 76% 82% 136
Orchidopexy 62.5 613 365 60% 81% 132
Urethrotomy 58.0 30 6 20% 50% 9
Bladder neck incision 57.91 63 3 5% 50% 29
Laser prostatectomy 60.2 1,359 7 1% 50% 673
Sub Total 14,012 9,944 71% 977
Orthopaedic Surgery
Dupuytren's contracture excision 82.12, 82.35 312 41 13% 45% 99
Carpal tunnel decompression 04.43-9 837 479 57% 91% 283
Arthroscopy 80.20-9 2,793 1,964 70% 76% 159
Excision of ganglion 82.21-9, 83.31-9 513 403 79% 92% 69
Hallux valgus 77.51-3 173 46 27% 50% 41
Arthroscopic menisectomy 80.6 1,024 788 77% 50%
Arthroscopic shoulder surgery 81.82 122 1 1% 50% 60
Sub Total 5,774 3,722 64% 710
Ophthalmology
Cataract extraction 13.11-72 6,969 2,407 35% 85% 3,517
Correction of squint 15.11-99 249 69 28% 81% 133
Eyelid surgery 08.0-9 3,212 2,857 89% 50%
Sub Total 10,430 5,333 51% 3,649
ENT
Myringotomy 20.01-9 4,067 3,588 88% 91% 113
Submucous resection 21.5 154 10 7% 23% 25
Reduction of nasal fracture 21.71-9 891 768 86% 91% 43
Operation for bat ears 18.5 278 118 43% 73% 85
Submandibular gland excision 26.0-26.9 317 75 24% 50% 84
Superficial parotidectomy
Partial thyroidectomy 06.2, 06.3 347 4 1% 50% 170
Rhinoplasty 21.84-7 214 14 7% 50% 93
Dentoalveolar surgery 24.0-8 194 131 68% 50%
Tympanoplasty 19.4-6 310 15 5% 50% 140
Sub Total 6,772 4,723 70% 752
GynaecologyDilatation and curettage 69.01-9 4,993 3,051 61% 80% 943
Laparoscopy / sterilisation 54.21 2,864 1,304 46% 82% 1,044
Transcervical resection endometrium 68.5 954 4 0% 50% 473
Sub Total 8,811 4,359 49% 2,461
GRAND TOTAL 61,671 34,521 56% 11,692
*Minor inconsistencies in totals are due to “rounding” of proportions of elective operations done as day cases.
91
A c u t eH o s pi t al B e d C a p a c
i t y
A N a t i on al R evi ew

8/8/2019 Acute Hospital Bed Capacity
http://slidepdf.com/reader/full/acute-hospital-bed-capacity 94/94