ad-a123 873 range determination and evaluation of laser …
TRANSCRIPT

AD-A123 873 RANGE DETERMINATION AND EVALUATION OF LASER SPECKLE 17 A INTERFEROMETRY (U )ARMY MI SSILE COMMAND REDSTONE
ARSENAL AL GROUND EUI PM ENT AND. T LVANDIVE R ET AL.
UN~eSSIFED 2 FE 82ORSM/RL-2-3TR B-ADE950340 F/G 20/ NL

MiCRCO~yRES LUO L2.8= LHA.T
l11111= AI 13 2 2
11111 i0
1111 .62 11 -
MICROCOPY RESOLUTION TEST CHARTNATIONAL BUREAU OF STANDARDS
19 6 3 -A
II

TECHNICAL REPORT RL-82-3
RANGE DETERMINATION AND EVALUATION OF LASERSPECKLE INTERFEROMETRY
Terry L. VandiverSandra W. CameronRobert N. EvansTom W. YostStructures DirectoratUS Army Muasil@ Laboratory
FEBRUARY 1982
Approved for public release; distibution unlimited.
'9LCD
DTIC
SIFOFW 1021. 1 JUL 7ii PREVIOUS EDITION IS OSOLETE
. ........................ N m

DISPOSITION INSTRUCTIONS
DESTROY THIS REPORT WHEN IT IS NO LONGER NEEDED. DO NOT
RETURN IT TO THE ORIGINATOR.
DISCLAIMER
THE FINDINGS IN THIS REPORT ARE NOT TO BE CONSTRUED AS ANOFFICIAL DEPARTMENT OF THE ARMY POSITION UNLESS SO DESIG-NATED BY OTHER AUTHORIZED DOCUMENTS.
TRADE NAMES
USE OF TRADE NAMES OR MANUFACTURERS IN THIS REPORT DOESNOT CONSTITUTE AN OFFICIAL INDORSEMENT OR APPROVAL OFTHE USE OF SUCH COMMERCIAL HARDWARE OR SOFTWARE.
i i

TUhrLARqTFT RDSECURITY CLASSIFICATION OF THIS PAGE (WMen Date EntereM
REPORT DOCUMENTATION PAGE BEFOR COPTING ORM
I. REPORT NUMBER 2. GOVT ACCESSION NO. 3. RECIPIENT'S CATALOG NUMBERTR-RL-82-3 ,Z A ,--,. I- S
4. TITLE (end Subtitle) 5. TYPE OF REPORT & PERIOD COVERED
Range Determination and Evaluation of Laser Technical Report
Speckle Interferometry 6. PERFORMING ORG. REPORT NUMBER
7. AUTHOR(.) S. CONTRACT OR GRANT NUMER(e)
Terry L. Vandiver Tom W. Yost
Robert N. Evans
Sandra W. Cameron9. PERFORMING ORGANIZATION NAME AND ADDRESS 10. PROGRAM ELEMENT. PROJECT. TASK
Commander, US Army Missile Command AREA & WORK UNIT NUMBERS
ATTN: DRSMI-RL
Redstone Arsenal, Alabama 35898
II. CONTROLLING OFFICE NAME AND ADDRESS 12. REPORT DATECommander, US Army Missile Command 22 Feb 1982
ATTN: DRSMI-RPT IS. NUMBER OF PAGESRedstone Arsenal, Alabama 35898
14. MONITORING AGENCY NAME & ADDRESS(I1 dilerent from Controlling Office) 1S. SECURITY CLASS. (of this report)
UnclassifiedISa. DECL ASSI FICATION/DOWNGRADING
SCHEDULE
16. DISTRIBUTION STATEMENT (of thie Report)
Approved for public release; distribution unlimited.
17. DISTRIBUTION STATEMENT (of the abstracte entered In Block 20, If different from Report)
1S. SUPPLEMENTARY NOTES
19. KEY WORDS (Continue on reverse side If neceoeary nd Identify by block number)
Speckle Interferometry Laser Optics
Interferogram Young's Fringes
Angular Displacement
20. ABSTRACT (Contiue m reverse efib f neceeay MW Ide* tify by block numebe,)The objective of the effort was to determine the range of laser speckle
interferometry. An XP-250 Epoxy E-glass specimen was illuminated by an opticalprocess utilizing an argon laser as a coherent light source. The displacementwas achieved by angular rotation about a reference point. Geometric and trigo-
nometric functions were used to analytically determine magnitudes and directionsof displacement. The optical setups and a description of the computer system toanalyze the interferogram is also presented. An analytical-experimental
(over)
DD I rJm 147M EDInoN oF I NOV S IS OWSOLETE
SECURITY CLASSIFICATION OF THIS PAGE (When Dte Bnterd

UNC LASS [F1 ED
SECURITY CLASSIFICATION OF THIS PAGEUtlm Date oMe,,
20. (Continued)
:;aparison of displacements and rotation angle is also included. A
statistical analysis including standard deviation and coefficient of
variation was utilized.
Unclassified
SECURITY CLASSIICATION OF THIS PAGErften Data Entered)

TABLE OF CONTENTS
Page
I. INTRODUCTION.................................................... 5
II. OPTICAL TEST SETUP AND PROCEDURE............................... 5
III. DATA ANALYSIS................................................... 9
A. Computer Scan System....................................... 9B. Displacement Determination................................. 9
1. Analytical Consideration............................... 92. Experimental Consideration............................. 14
IV. RESULTS........................................................ 14
V. SUMMARY AND CONCLUSIONS........................................ 23
REFERENCES..................................................... 39
APPENDIX- COMPUTER CODES...................................... 31
Acceioni~t Fo g
H~rS RAJ1

LIST OF TABLES
TABLE Page
1. Vertical Scan Data SRD-39 (0.10° Rotation) .................... 20
2. Vertical Scan Data SRD-40 (0.150 Rotation) .................... 21
3. Vertical Scan Data SRD-41 (0.20 Rotation) .................... 22
4. Horizontal Scan Data SRD-39 (0.100 Rotation) .................. 24
5. Horizontal Scan Data SRD-39 (0.100 Rotation) .................. 25
6. Horizontal Scan Data SRD-40 (0.150 Rotation) .................. 26
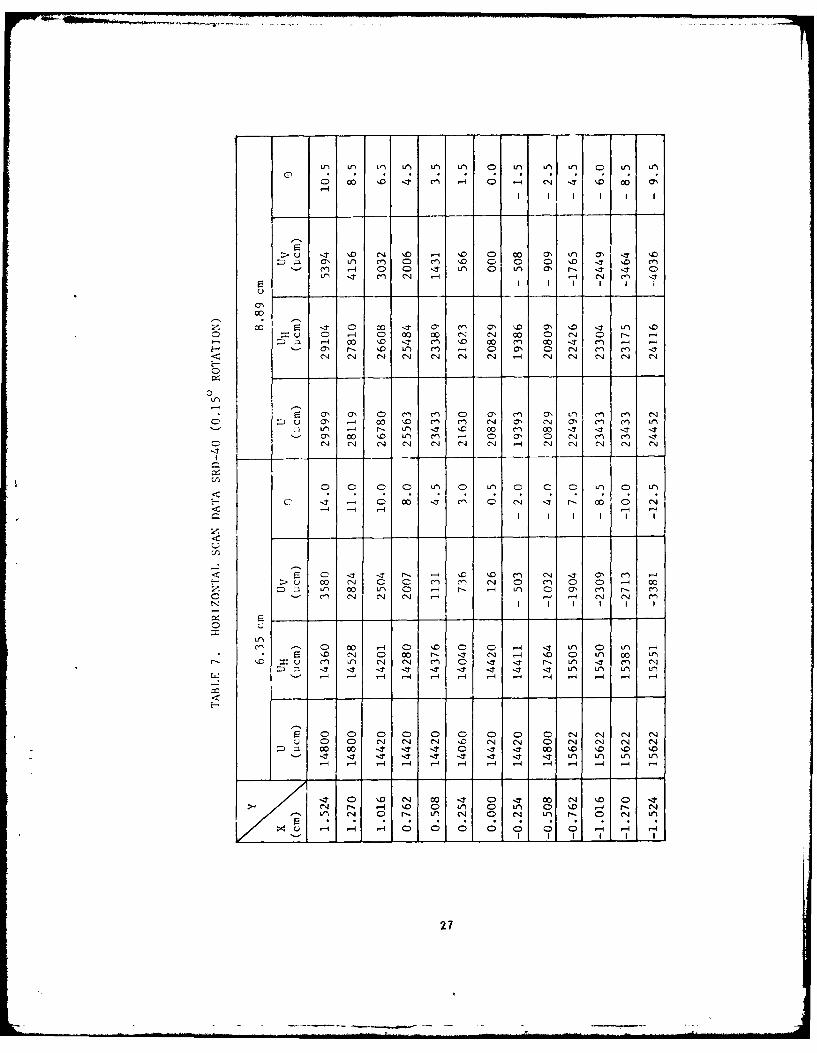
7. Horizontal Scan Data SRD-40 (0.150 Rotation) .................. 27
8. Horizontal Scan Data SRD-41 (0.20° Rotation) .................. 28
9. Horizontal Scan Data SRD-41 (0.200 Rotation) .................. 29
2

Figure LIST OF ILLUSTRATIONS Pg
Figuxre mna tetstup(athge...............
1. Experimental test set-up (sketch)...............................67
3. Translation stage with specimen ................................. 8
4. Computer analysis system ....................................... 10
5. Typical fringe pattern ......................................... 11
6. Scan coordinate system ......................................... 12
7. Geometrical angular Lotation ................................... 13
8. X-Y translation stage .......................................... 15
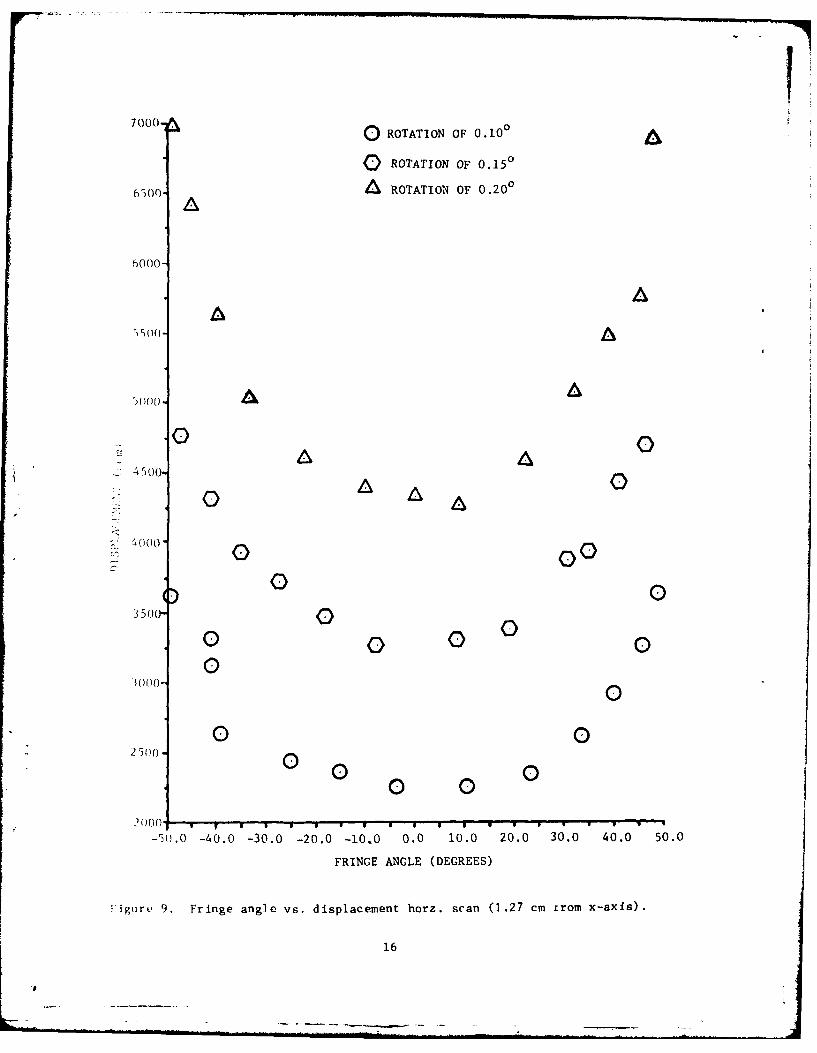
9. Fringe angle vs displacement horz. scan (1.27 cm fromx-axis) ....................................................... 16
10. Fringe angle vs displacement horz. scan (3.81 cm fromx-axis) ....................................................... 17
11. Fringe angle vs displacement horz. scan (6.35 cm from
x-axis) ....................................................... 18
S12. Fringe angle vs displacement horz. scan (8.89 cm from
)x-axis) ....................................................... 19
31

LIST OF SYMBOLS
Symbois Definition
D Spacing between FringesL Experimental DisplacementT Length of Axis of RotationU11 Horizontal Displacement Component
UV Vertical Displacement Component
Ue Experimental Inplane Displacement
X Horizontal CoordinateY Vertical Coordinatef Distance from Interferogram to
Analyzer Screenm Fringe Orders Film Scale Factor
a Rotation Angle
0 Angle Opposite ae Fringe Angle of OrientationX Wavelength of Laser Light
4
.l .........

I. INTRODUCTION
The primary objective of this research task was to determine the displace-ment range of laser speckle interferometry. Interferometry utilizes lightinterference phenomena for non-destructive, sensitive determinations of in-plane displacements. The displacement data can be differentiated to obtainstrains which can in turn be correlated with shearing stresses [1].
The laboratory setup for preparation of the interferograms utilized anargon laser as a coherent light source to illuminate the specimen. The inter-ferograms were prepared by double exposure photography techniques. Analysis ofthe interfcrograms employed a computer aided scanning system that was developedprimarily for evaluation of speckle interferometric data.
Conventional techniques of measuring surface strain and displacement datautilize strain gages, dial gages and various other electromechanical sensingdevices. Although such methods are extremely accurate, information is limitedto very small regions [2]. These techniques are ideal for homogeneous materials;however, nonconventional applications are required for anisotropic nonhomogen-eous materials such as composites. Laser speckle interferometric data providesthe investigator with non-contact full-field information over an entire regionof interest.
II. OPTICAL TEST SETUP AND PROCEDURE
The experimental test arrangement used to determine the interferogramrange is shown in Figures 1 and 2. A Spectra Physics argon laser adjusted at0.50 watts was used as a coherent light source to illuminate the specimen. Adouble exposure photography technique using AGFA - GEVAERT Holotest lOE-56glass film plates was used to prepare the interferograms. The interferogramswere developed with conventional photography techniques.
Figure 3 shows the specimen setup used in speckle range determination.The translation stage was positioned on a vibration free table by means of amagnetic base. A lens positioner assembly was mounted on the translationtable with 2 polished steel rods 1.27 cm in diameter. A mounting blockextending from the lens positioner contained 2 small steel rods on which therotation stage was mounted. The specimen was attached to a small block that wasbolted on the rotation table.
Three people were involved in preparing a complete set of interferograms.One person rotated the specimen between each exposure by means of a micrometercontrol. Another person on the optics side of the setup shielded the lensbetween each exposure so as not to destroy the interferograms. A third personmonirozed the remote shutter control, timer, and lights. The complete inter-"ferogram preparation process was done in the dark. Any leakage bf white lighton the film plate would destroy the interferogram.
A double exposure photography technique was utilized to make the inter-ferograms. The first exposure was made with the specimen rotated 0.050 froma center reference point. Next the camera lens is covered to prevent over-exposure of the film plates; the specimen is rotated 0.100 and a secondexposure is taken. The time required for each exposure is four seconds.
5

f TRANSLATION TABLE
ARGONLASER
FILMER
RECORD
APERTURES-
/REOTEO
SHUTTER
BEAMSTEERING
/VIRATION-..FREETABLE
Figure 1. Experimental test setup (sketch).
6

Figure 2. Experimental test setup (photo).
7

I.1. DATA ANALYSIS
A. Computer Scan System
The experimental displacement data was collected by the interfero-metric analysis system shown in Figure 4. This system utilizes an opticalsetup and computer hardware which was developed primarily for applications inspeckle interferometric data analysis. The interferograms were placed in aviewing window of the x-y translation table and reilluminated by a HeNe laserbeam. The illumination produces a fringe pattern on a diffuser screen whichincluded a 3600 protractor used to measure the displacement angle of thefringes. The displacement of the region illuminqted is inversely proportionalto the spacing between fringes. The direction of displacement is along anaxis orthogonal to the fringe orientation. A typical fringe pattern is shownin Figure 5.
A very small region of the interferogram is illuminated and, there-fore, the data yields the displacement at a point. In order to obtain acomplete description of the surface, the interferograms were scanned by thex-y translation table using the coordinate system shown in Figure 6. Thetranslation stage is capable of 0.0025 cm incremental movements with a0.00025 cm repositioning accuracy. The location of the desired point on theinterferogram was controlled by translation stage stepping motors which werein turn controlled by the computer. The computer program used to control thescan pattern and calculate the displacements appears in the Appendix.
B. Displacement Determination
1. Analytical Considerations
A sketch of the geometry utilized to analytically determinethe displacement is presented in Figure 7.
Equidistant rotation of length T about a center point producpdan isoscele3 triangle which could be analyzed with the law of sines formulationas given by Leithold [3]. The angle of rotation was detecmined by turningthe micrometer 7.9 microns per 0.100 while making the interferograms. Withtwo sides and an angle known, the displacement can now be determined.
L T
SIN a = SINE (1)
SIN a
so L = SIN S T (2)
where L = Displacementa = Angle of Rotation
- 1800 - (90 + )
T = Length of axis of rotation
9

U)
4-I:5
"41
00
10)

Figure 5. Typical fringe pattern.
11

11.43
8.89 ...
6.35 .
3.81POINT OFROTATION
1.27 X
1.27
_. 2
Figure 6. Scan coordinate system (dimensions in cm).
12
............... -

L
T T
POINT OFROTATION
Figure 7. Geometrical angular rotation.
13

2. Experimental Considerations
A computer aided scanning system was utilized to analyze theinterferograms experimentally. The interferograms were placed on an x-ytranslation table controlled by a computer program. The scanning setup usedto project halos of the interferograms onto a diffuser screen is shown inFigure 8. The computer controlled translation table housing the interfero-gram was moved in a raster pattern through a stationary laser beam. Fringespacing and the angle of orientation at each data point were entered intothe computer which in turn calculated the displacements from:
U = m-fs (3)
where UO = Experimental inplane displacement
D = Spacing between fringesm = Fringe order
f = Distance from interferogram toanalyzer screen
s = Film scale factorX = Wavelength of laser light
I'hle complete derivation of Equation (3) appears in Mullinix [4]. The verticaland horizontal components of displacements were also determined from:
mlfs
U - D cos 0 (4)
mXfs
UH = sin 0 (5)UH D
'I>c wavelength of the HeNe laser used in the interferometric analysis is, 28,. The film scale factor is found by dividing the true length of the. i'cinen by the image length on the interferogram. The computer programsit il ized in the analysis appear in the Appendix.
IV. RESULTS
The primary purpose of this research project was to determine the,;.iximum and minimum effective range of laser speckle interferometry. The
:m x imurn range determined by the method described was 35149.0 I'cm with an,rror of 1.627 from the analytical value. The minimum range was found to be(,.85.8 ;cm with an error of 3.037. The average error, or total coefficient,)f variation for analytical and experimental values of all points scanned(iaibles I through 3) was 5.967. This error could be attributed to dis-, rpancies in angular rotation of the specimen, inaccurate measurements takenhir computer scan program, and reader error.
Horizontal scan plots (Figures 9 through 12) indicate that there is alircct relationship between angle of rotation and amount of displacement.i,,,ire 9 shows that, as the angle of rotation increases from 0.100 to 0.200
14

MIRROR POST(WITH 2 FRONT SURFACE
TO DIFFUSER SCREEN M,,,
(LOCATION OFINTERFEROGRAM)
STEPPING MOTORS
He e
LASER BEAM
X-Y TRANSLATIONK STAGE
TRANSLATIONDIRECTIONS
Figure 8. X-Y translation stage.
15
7000 ~0 ROTATION OF 0.100
Q ROTATION OF 0.150
6500. ROTATION OF 0.200
60[00,
AA
)O000
AA
0 A A A
:500035)00- A A
0 0 0 00 00
30)0- 00 000
000- 0
0 02500-0
0 0 00 0
-50.0 -40.0 -30.0 -20.0 -10.0 0.0 10.0 20.0 30.0 40.0 50.0
FRINGE ANGLE (DEGREES)
Figure 9. Fringe angle vs. displacement horz. scan (1.27 cm rrom x-axis).
16

16000-
G ROTATION OF 0.100
0 ROTATION OF 0.15 0
15000- ROTATION OF 0.200A A
14000- A
AA
13000- A
12000-
11000 0
10000-
9000- 0 0
C
8000-
E) G70-
6000 1 1 1 1" 1 1 1 1 ' 1 ' 1 1-25.0 -20.0 -15.0 -10.0 -5.0 0.0 5.0 10.0 15.0 20.0 25.0
FRINGE ANGLE (DEGREES)
Figure 10. Fringe angle vs. displacement horiz. scan (3.81 cm from x-axis).
17
- --- ---- ---- ---- --

2bO0('- ROTATION OF 0.100
252 50 ROTATION OF 0.15 0
2%00- g A ROTATION OF 0.200
23730 -SA A
'2250-o21 )00 -
2U0000
AA ASI 6 )0-
/ I
1 750-
1 )00-
3750 0 0 014000-
3,25)-
S2300-
175- 0 0 0 0 D000O 000
i 1 ()(IC) I I I I - I
-20.0 -16.0 -12.0 -8.0 -4.0 0.0 4.0 8.0 12.0 16.0 20.0
FRINGE ANGLE (DEGREES)
Figure 11 . Fringe angle vs. displacement horz. scan (6.35 cm from x-axis).
18

i]1
36000- ROTATION OF 0.100
0 ROTATION OF 0.150
34000- ROTATION OF 0.200
32000-
30000 A
A28000-
26000-
- 241,00-
00 022000- 0
20000-
00)E18000 0 Oo oo 0
16000. 5 * I ii I I I
-10.0 -8.0 -6.0 -4.0 -2.0 0.0 2.0 4.0 6.0 8.0 10.0
FRINGE ANGLE (DEGREES)
Figure 12. Fringe angle vs. displacement hortz. scan (8.89 cm from x-axis).
19

0TABLE 1. VERTICAL SCAN DATA SRD-39 (0.10 ROTATION)
y Ue - 1cm COEFFICIENT
CENTER -OFCENTERVARIATION
SCAN (cm) ANALYTICAL EXPERIMENTAl DEVIATION
0.000 - -0,254 ....
_0.508 887 686 201 22.68
0,762 1330 1308 22 1.66
1.016 1773 1731 43 2.40
1.270 2217 2295 79 3.43
1,524 2660 2678 18 0.671.778 3103 3308 205 6.20
2.032 3546 3800 254 6.67
2.286 3990 4105 115 2.80
2.540 4433 4535 102 2.26
2,794 4876 5160 284 5.503.048 5320 5624 304 5.40
3.302 5763 5798 35 0.60
3.556 6206 6539 333 5.09
.810 6650 6858 209 3.044.064 7093 7210 117 1.62
4.318 7536 7600 64 0.84
4.572 7979 7811 169 2.12
4.826 8423 8270 153 1.815.080 8866 9071 205 2.25
5.334 9309 9532 223 2.33
5.588 9753 10415 662 6.35
5.842 10196 10815 619 5.72
6.096 10639 11027 388 3.52
-6,35 11083 11637 555 4.76
6.604 11526 11966 440 3.67
6.858 11969 13390 1421 10.61
7.112 12413 13390 978 7.30
7.366 12856 14060 1204 8.56
7.620 13299 14800 1500 10.14
7.874 13742 14420 678 4.70
8.128 14186 15200 1014 6.678.382 14629 15622 993 6.35
8.636 15072 15622 549 3.52
8.890 15516 16541 1025 6.20
9.144 15959 17042 1083 6.35
9.398 16402 17575 1172 6.67
9.652 16846 18746 1901 10.14
9.906 17289 18746 1457 7.77
0.16 - -
20

TABLE 2. VERTICAL SCAN DATA SRD-40 (0.150 ROTATION)
CUE - COEFFICIEN
CENTER OF
SCAN (cm) ANALYTICAL EXPERIMENTAL DEVIATION VARIATION
0.000 - - - -
0.254 665 686 20.8 3.03
0.508 1330 1339 9 0.69
0.762 1995 2045 50 2.45
1.016 2660 2616 44 1.66
1.270 3327 3308 19 0.57
1.524 3990 3800 190 4.76
1.778 4655 4610 45 0.97
2.032 5320 5021 299 5.61
2.286 5985 5514 471 7.87
2,540 6650 6113 537 8.07
2.794 7315 6695 620 8.47
3.048 7980 7921 59 0.74
3.302 8645 8034 611 7.06
3.556 9310 8394 916 9.84
3.810 9975 9071 904 9.06
4.064 10640 9696 943 8.87
4.318 11305 10815 498 4.33
4.572 11970 11248 722 6.03
4.826 12635 11248 1387 10.98
5.080 13299 11966 1334 10.03
5.334 13964 12497 1467 10.51
5.588 14629 11966 2664 18.21
5.842 15294 13079 2216 14.49
6.096 15959 13390 2569 16.10
6.350 16624 14060 2565 15.43
6.604 17289 14060 3230 18.68
6.858 17954 14800 3155 17.57
7.112 18619 15200 3420 18.37
7.366 19284 16068 3216 16.68
7.620 19949 17042 2907 14.57
7.874 20614 18141 2473 12.00
8.128 21279 18746 2533 11.90
8.382 21944 20085 1859 8.47
8.636 22609 20085 2524 11.16
8.890 23274 21630 1644 7.06
9.144 23939 22495 1444 6.03
9.398 24604 24452 152 0.62
9.b52 25269 24452 817 3.23
9.906 25934 25563 371 1.43
10.16 - - -
21
.. . . .-.- _.,,. - . .... --. . .

TABLE 3. VERTICAL SCAN DATA SRD-41 (0.200 ROTATION)
_ __________COEFFICIENT
CENTER OFSCAN (cm) ANALYTICAL EXPERIMENTAL DEVIATION VARIATION
0.000 - -
0.254 887 781 106 11.91
0.508 1773 1814 41 5.73
0.762 2660 2744 84 3.05
1.016 3547 3559 13 0.36
1.270 4433 4228 205" 4.62
1.524 "5320 4890 430 8.07
1.778 6207 5739 468 7.54
2.032 7093 7030 63 0.89
2.286 7980 7600 380 4.76
2.540 8866 8270 596 6.72
2.794 9753 9373 380 3.89
3.048 10640 10815 176 1.62
3.302 11525 11248 278 2.413.556 12413 11477 936 7.54
3.810 13299 12497 802 6.03
4.064 14186 13390 796 5.61
4.318 15073 14800 273 1.81
4.572 15959 16068 109 0.68
4.826 16846 18141 1296 7.14
5.080 17733 18746 1014 5.41
5.334 18619 19393 773 3.99
5.588 19506 18746 760 3.89
5.842 20392 20085 307 1.51
6.096 21279 21630 351 1.62
6.350 22166 24452 2286 9.3r
6.604 23052 23433 380 1.62
6.858 23939 244;2 513 2.10
7.112 24826 26780 1955 7.3,
7.366 25712 26780 3068 3.99
7.620 26599 28119 1520 5.41
7.874 27485 28119 634 2.25
8,128 28372 29599 1227 4.15
B382 29259 2934Q 1.158.636 30145 31244 1098 3.52
8.890 31032 33082 2050 6.20
9.144 31919 33082 1162 3.51
9.398 32805 33082 276 0.84
9.652 33692 33082 610 1.84
9.906 34579 _35149 571 1.62
10.16 - - -
22

at a fixed Y 1.27 cm value, there is a proportional increase in the dis-placements. In addition, it is seen that the displacements are symmetricalabout the center line of the specimen, which is located where the fringe angleis zero. Data for these plots are displayed in Tables 4 through 9.
V. SUMMARY AND CONCLUSIONS
The laser speckle interferometric range was determined by applying anoptical process that utilizes a coherent laser light source for precise
determination of linear inplane displacements. The analysis of the interfero-grams was accomplished by a computer aided scanning system designed primarilyfor evaluating interferometric data. This nondestructive, highly sensitive
method of analysis is extremely accurate and provides the investigator withful!-field displacement data. A full-field reconstructed optical Fouriertransform image of the displacement region can also be produced by thiscechn ique.
For this research task, a composite test specimen was scanned bothvertically and horizontally at four specified regions. The maximum andminimum displacement was determined to be 35149.0ijcm and 685.8icm, respectively.Horizontal scan evaluation indicated that the rotational angle and the amountof displacement increase proportionally. This research exercise demonstratesthe capability to capture deformation under load of rotating objects such as
helicopter blades and high speed turbine vanes. A pulsed high energy coherentlight source and high resolution multiple exposure film would be required tocapture the interferometric data. The interferogram could be investigatedwoth qualitatively for anomalies in the structures as well as quantitatively
to provide deformation under load profiles for engineering design applications.
Attempts have been made by Swinson [51 to increase the effective rangeof laser speckle interferometry coupled with accoustical interferometry throughsandwiching techniques. The technique introduces a rigid body shift into thedeformed state of a test object to increase the number of readable fringes;after which, the rigid body effects are subtracted out of the analysis.There is a definite need for rapid advancement in the state-of-the-art of laserspeckle interferometry to include the most advanced methods of computeranalysis and optical image processing.
23
_ _... .. . ' - ... . Hi ' - -' .°-

c'n 00 In -4 rl -1 0 r'n r- *-4 LPn 00 NlN -4 - ~ - --4 CN
>' .ft '.0 ff) C'I '0 '0 0 a r, -- 4 ON 00 a'~u fl- r-. N- 0' m, U) CD a, O' 7 ,-4 1-4 0-A 00 .- 4 '0 N 00 11 cni 00 Cl) 00 m~ 0c
-4l 4 -rj
00
F- 1
-. tN 1.t 0' t-.. 0 - 0 '0 en:Du C- ) 0n "r "1 N1 C)i 0 a, N4 rn
H 0 CN .0 00 Lf4 (N Ur) 00 a' r- a' a'10 ~ ~ ~ ~ ~ ~ ~ ~ '- '0 '0 '0 '0 '0 '0 . . . 'D0 'D . .
00 -7 - -0 0-1 0
a'4 x Nn cc -CN c4U Ln4 c 0 0 m' T1'- - .0 '.0 '0 '0 '0 '.0 '0 '0r- r- N-
) 00 0) 0 0D 0) 0 0 C0 0 a'1
- Cl) C) CN ~ -4 N 'T -
Hr -4 r n r- L) -
cc cc~~4 Lf '4 a' c-NC4 04 0N N4 -
N~0 r, 'n Nc .a'- 0'0 0 cqN
cc u
N-
mu,- cc cl 1-4 -1 c c4 '0 C1 ' 0 N cc m ~ mI-~ Z~i cc c-i a'i C1 ~ ' 4 C'0 11 0' C4
Q CN L N0 ,-4 -4 NZ N. NIo N1 0n CN .l
c" N N N Nq N- N- mN e
C14 r- -t 0 C) a') a' C 0 L4 r- 04cc
N - ' CD0 t 0 '0 ,-4 N- N
Ax I II
24

00~ 0 VU : C- 0 C14 m 0 t 0 00 0
a, cy , 0 cn C> u) r-4 co 0r
> u \ 3' a% C(I C14 00 0 C 0 f -4 -.1O f:Dv - ' r- '.N 0 - N 0 -4 zr C14'' C1 ,-4 -4 1-4 -4 Nl N1 fn
H * -,t C r- N, 00 r-4 -1 0 N '0 C-,00~ 0 CD %D C,-4 'T 'D Le) C) 0 % 0
c '0 N '10 0 fLr LP1 Lr 0r -.i ,ICD' 0 3 00 00 r, r- '0 N- r- ' 0 rO - 00O ~ ~ ~ ~ ~ 1 N 4 ,-A -4 - i - - ,4 ,4 ,4 - -
m'3' C 00 -4 LI) 4I) Ln Lr C14 -1 Lfn 'ce CN 0' 0 .4? Ir- r- r, N- - -.1 -z r- -7
00 mO Lr Url V- f ) Lf) L1) tf) C0 .- q EnI -S 0 0'l C31 00 r, r- \0 r, C- r- 00 r- 00
'- N r-' -4 --4 - 4 , -4 -4 H -4 -1
Co
4 0 00 .0 0'l L4 0- 0n 0 r- 0n I
> .4 -4) 03 '0 00 ,-4 ,-4 kn0 0 NZD - -a, CN %C r- c '- l 0 m O
00 ~~~ -4 n -- a, C -I I _j UI C
>u I 0 -A -4 -4 1 -4~ -4 -4 -q
fl1 r, 0' 0 00 r- 0, 0- 0- 00 \D
N ~ I NN -r, ~4 N
I C
(N '0 -' 3 0 In ' T N o C0 1. 0
'0 r- -4 -o N) V- U) C-- Z4 r- '0 C4vl C14 C- L-4 c -Lr - -,4 Lr
1-0 C; N 4 4 N - 0 - 0A - . 4 ~'
25

0 0 Ii*' UJ 0rL)L 0 0> L )
IT C- fn 0 N Lf) ONN -4 r4 . 0. 4 -
> li r - 00 N- -. T 0) C) m" cn 0 ClmU 00 CO 0 1 cNJ CO 0 cq a -ll IT 4 .-o ' r- m~ %D -4 LO r- C1 r- C Nm C4 C1 -4 -1 C4 C1 C
z u -- -
00
H cn~ ~ E 0 Ln 40 N- V) - - 0 ID a', LJr aO u (1 ~-4 N~ N- 0 CN (31 m 0 T al CN;a 0, -4 0' N- LrN m' -4 00 N- N -4 It0- Co 0, oo Co 0O C 0 00 0 ) ) C
0 E4 ID -li a,4 4 r-L)
-4U 0 c - - - - -CN C4 q .1- l 1 - 1
'0 in) Nl a' ,( C' N 0 0 'c00C (N
im a' 0 ' CO C O 0 0 0 0
-4 -1 1 C 4 -4 IT '-
0 Nn 0 o 0 n 0 0 l 0 r 0 00 00z 0 OD4 Lf) a, a' 00 r- mO N- ) en" 0 N
rz -:r C'N mN C1- (J 4 <C) <C.. 1 -4 CI I4 C) I, c 1 C1 .
::D u 0 a, U' a 0 0 C O N- - C' Mf "' Co
'o- C N CO 00 IT C.) s CO C-< C I0o C) Nn N V4 N 4 N - C
0. CD0--
N2
0 00 o .e-4 0 .- 4 N -T 0 a,
> u -zr 1. N . i'0 0 00 a', Lf) 0' -'r '.:: ; a, L11 m~ 0 n 'D 0 0 0 '.0 --T 'D en
M 4 0 CD z LI1 0 tr a, P-. T :r 0
C9f --T C) (N0 -4- '-4 Cl Y L )
0 u 0 ,-4 0 00 00 (NI 04 Co0 CN 4 -
F- 0 r, '0 .- ) m -10 C ON (D ci m - -
u- '.- a -4 00 LIm C~l m- " a, 0l a, en n V)(n r- (N ) ( r (N 00 mN (N -IT -Z -.1 -
CD a' a 0 0' cn 0 a' C) L-) 0~C ~'- a' CO '0 00 cZ n l -' I - 0 CN -
-- 5-
-- -:T -- -0 No l
u 0 01 0 0 rn 0 "P 0) m 0 CD 0- 00
D 01 -s 00 0" 0 -A r-- 1 (N C) ON Co 0l en
-4 ,- - - -4
0 Ln eq oq m 0 I I IT m I~
S0 -D C) C- C~ '0 '0 C) 0N -.1 a' C1 C-4H > 0 C N 0 01 C4 ~1 0 ~ l 0 C 0 -4 Co4
;:: 00 Co (1 01 -It CP 0- a'T -o r-0 10 %-4 -4 -4 (N (N4 (N4 r-4 -1 (N4 (NJ
-' 0 Vo- 0 ) 0 0 Lf) 0 (Po r r
Co C
4u - -1 1-4 C 0 -0 4 4 0 4 '
27

U1 V) ) Lf) Le) C) ) V) Lt)
cN - - -4 -4 CN
uC 00 '0 C14 -.1 t- c0 C0 t - M a, 0 0 N.:: r-a, 0 IT a,- 0 C 4 "N 11 -7 N -4 IT7a,~ 'D0 C,4 r 00 r- C) 0) 0 C) 00 -,Tzr 11- CV) (4 -4 .-.4 IT 11 -V " f
0
~ ~ I L(r -4 0 C) - rt c. 0 0 '0 '. oou cn M r~- a, 'D f' 0 C 'o C4 (N 0N 0
0 0 -. C '0 C) ff) C -.? C) Ul) r- 01N 0N 1-4M) c-. C-4 -.7 C~C) (N fn (cn M, ZP M -T
-- 4
I ( C-4 ) C C r- 0 0 0. C) C )CC) u CN 0) '.0 a, 0, P, 04 N0 C C Cw :D::I .D00 C) m -.7 C) -7t C) r- C 0 0 cc C
'.- Lr) -.1 M~ C4 (N C~ N cl M' I. -. -7-4- 4 - 4 -4 -4 -4 -4 - 4 -
C)
V) 11o C)C) in C) C) C) C4L m tf1 C L
-7 -7 n (1) (N ~ -4 (N C,) (n -T Ln
en ID VI m r, 0 In I 0
NN
C) L r C* m. it- al 00 C) r a,7 r- a,C'4 :Z -u C4 -11 '0 m~- '0 C) i-. r- 00r C- ini i
'- rN) 0~ (N CN ,-4 -44 (N t) -7 -4 T IT-T IT T ITI
;: r--.D . - o C 7%ci cl N I
00 i -i r- 0 0ll '.0 rn- N- .0 '0.0)
.4 C14 -0 (z 0 C'r C' C (N 0 C r- -SL)C) r N 14 NJ UN 0 r C -%D 1-.7 -
'.-~~ ~~ ~~ 0 -4- ) It N C 1 .
'. L ~ i ~ u -7 7 -. .7It 28'0 .

TABLE 9. HORIZONTAL SCAN DATA SRD-41 (0.20' ROTATION)
(cm 6.35 cm
xU UH UV(m(wcm) ( Jcm) Ojcm)
1.524 25563 24957 5533 12.5
1.270 23433 23040 4270 10.5
1.016 21630 21364 3384 9.0
0.762 20085 19935 2448 7.0
0.508 18746 1.8675 1634 5.0
0.254 18746 18743 327 1.0
0.000 18746 18743 - 327 - 1.0
-0.254 19393 19356 -1184 - 3.5
-0.508 19393 19303 -1859 - 5.5
-0.762 21630 21512 -2261 - 6.0
-1.016 22495 22218 -3519 - 9.0
-1.270 23433 22962 -4672 -11.5
-1.524 24452 23383 -7149 -17.0
NOTI:: Data at 8.89 cm out of range.
29

APPENDIX
COMPUTER CODES
31

Program Name: SCAN
Program Function: To evaluate interferograms, compute horizontal and
vertical components of displacement as well as total
displacement.
Input: 1) Stage to be advance - x-direction or y-direction
2) Stage Increment - Distance moved between scan points
3) Film scale factor - Ratio of real object to image on
interferogram
4) Distance to diffuser screen - Distance from interferogram
to diffuser screen
5) Displacement - Distance measured manually between fringes
6) Angle - Angle of orientation of fringes
Output: 1) - Total Distance from Initial Scan Point
2) - Total Displacement
3) - Horizontal Component of Displacement
4) - Vertical Component of Displacement
33
-.~ a

COMMON DD (2,200)WRITE(5,1)
1 FORMAT ('MANUAL YOUNG FRINGE ANALYZER')WRITE(5,2)
2 FORMAT ('STAGE TO BE ADVANCED? O=X, 1=Y)')READ(5,3) IA
3 FORMAT(11)WRITE(5,4)
4 FORMAT('STAGE INCREMENT?')READ(5,5) IC
5 FORMAT(I4)WRITE(5,6)
6 FORMAT('FILM SCALE FACTOR?')READ(5,7) SF
7 FORMAT(F10.O)WRITE(5,17)
17 FORMAT('DISTANCE FROM INTERFEROGRAM TO DIFFUSER SCREEN?')READ(5,7) XICC=0
8 ICC=ICC+1ICP=C-1WRITE (5,9)
9 FORMAT( 'DISPLACEMENT?')RrAD(5,7) DWRITE(5,10)
10 F(RMAT('ANGLE?')READ(5,7) AA=A*3. 14159/180.IF(D.EQ.O) COTO 13IF(D.LT.O) COTO 15U=(SF* .0000249133*X)/DU1=Ul*COS (A)U 2=U *SIN (A)H=FL'IOAT( (ICC-.1)*IC)* .001WRITE(5,1l) H,U,U1,U2
11 PORMAT(311 H=,FIO.3,5X,2HU=,F12.6)l311tll=,F12 .6,5X,311U2=,F12.6)
12 DD(1,1ICC)=U1DD(2 , CC)=U2GOTO 14
13 DD(1,ICC)=O.LD(2, 1CC) =.
14 IF(IA.EQ.1) CALL YADV(IC,5)IF(IA.EQ.O) CALL XADV(IC,5)GOTO 8
15 ICC=(1-ICC)YICIF(IA.EQ.1) CALL YADV(ICC,5)IF(IA.EQ.O) CALL YADV(ICC,5)WRITE(5,16)
16 FnRMAT('ANALYSIS ENDED')fop
END)
34

SCAN PROGRAM (CONTINUED)
SUBROUTINE YADV (IS, IR)IS=NO. STEPS (+-FWD,-=REV)IR=ADVANCE RATE OF STAGEx=OIF(IS.GT.O) GOTO 3IF=IABS(IS)DO 2 I=1,IP,lCALL IPOKE("167772 ,"O20000)
DO 7 K=1, IR,1
DO 1 J=1,IR,l
Y= SIN (X)CONTINUEGOTO 6CONTINUEDO 5 1I=1,IS,lCALL IPOKE("167772,"OIOOOO)DO 8 KK=1,IR,lY=SIN(X)CALL IPOKE("167772 ,"0OOOOO)DO 4 JJ=1,IR,IY=SIN(X)CONTINUECONTINUERETURNEND
35

SCAN PROGRAM (CONTINUED)
SUBROUTINE XADV(IS,IR)IS=NO. STEPS (+=FWD,-=REV)IR=ADVANCE RATE OF STAGEx=OIF(IS.GT.O) GOTO 3IP=IABS(IS)DO 2 I=1,IP,lCALL IPOKE("167772,"lOOOOO)Do 7 K=1,IR,1Y=SIN(X)CALL IPOKE("167772 ,"OOOOOO)DO 1 J1I,IR,lY=SIN(X)CONTINUEGOTO 6CONTINUEDO 5 ll=1,l5,1CALL IPOKE("167772,"040000)DO 8 KK=l,IR,1Y= SIN (X)CALL IPOKE("167772,"OOOOOO)Do 4 JJ=1,IR,lY=SIN(X)CONTINUECONTINUERETURNEND
36

Program Name: Move
Program Function: To move translation stage and interferogram to initialscan position
Input: Input X,Y -Four digit value for positive or negativemovement in X and Y directions
output: Motion of translation stages0.0025cm Incremental Movements0.00025cm Reposition Accuracy
3 WRITE(5,l)I FORMAT('INPUT X,Y-214')
READ(5,2) IX,IY2 FORMATC2l4)
IF(IX.EQ.O.AND.IY.EQ.O) GOTO 4CALL XADV(IX,5)CALL YADV(IY,5)COTO 3
4 CONTINUESTOPENDSUBROUTINE YADV(IS,IR)
C IS=NO. STEPS (+=FWD,-=REV)IR=ADVM4CE RATE OF STAGEx=O.IF(IS.GT.O) COTO 3IP=IABSCIS)
DO 2 I=1,IP,lCALL IPOKE("167772,"020000)DO 7 K-l,IR,l
7 Y=SIN(X)CALL IPOKE("167772, "000000)DO 1 J-l,IR,l
1 Y=SIN(X)2 CONTINUE
GOTO 63 CONTINUE
DO S 1I-1,IS'l* CALL IPOKE("167772 ,"0l0000)
DO 8 KKI1,IR,l8 Y=SIN(X)
CALL IPOKE("167772,"000000)DO 4 JJ-l,IR,l
4 Y-SINCX)5 CONTINUE6 CONTINUE
RETURNENDSUBROUTINE XADV (IS, IR)
C IS-NO. STEPS C+-mFWD,--REV)
37

MOVE PROGRAM (CONTINUED)
C IR=ADVANCE RATE OF STAGEx=OIF(IS.GT.O) GOTO 3IP=IABS(IS)DO 2 I=1,IP,1CALL LPOKE("1167772,"100000)DO 7 K=1,IR,I
7 Y=SIN(X)CALL IPOKE("167772,"OOOOOO)DO 1 J=I,IR,l
I Y=SIN(X)2 CONTINUE
COTO 63 CONTINUE
DO 5 II=1,IS,lCALL IP'OKE("167772 ,"040000)DO 8 KK=1,IR,l
8 Y=SIN(X)CALL IPOKE("167772,"OOOOOO)DO 4 JJ=I,IR,1
4 Y=SIN(X)5 CONTINUE6 CONTINUE
RETURNEND
38

REFERENCES
1. Vandiver, T. L., "Whole-Field Experimental Stress Analysis Using LaserSpeckle Interferometry", U.S. Army Missile Lab, Redstone Arsenal, Alabama,Technical Report No. RL-81-10, 14 Feb 1981.
2. Leendertz, J., "Interferometric Displacement Measurement of ScatteringSurfaces Utilizing Speckle Effect," Journal of Physics E, Vol. 3, 1970,p.214.
3. Leithold, L., "The Calculus with Analytic Geometry", Harper and Row,
1972.
4. Mullinix, B. R., Ranson, W. F., Swinson, W. F., and Cost, T. L.,
"Quantification of Flaws in Fibered Composite Structures Using Inter-ferometric Fringe Patterns," U.S. Army Missile Command, Redstone Arsenal,Alabama, Technical Report RL-76-18, 20 April 1976.
5. Swinson, W. F., "Acoustical Holography and Acoustical Interferometry withYoung's Fringes", U.S. Army Missile Lab, Redstone Arsenal, Alabama,
Technical Report RL-82-1, 5 October 1981.
39

DISTRIBUTION
No. of
Copies
CommanderEdgewood ArsenslATTN: SAREA-TS-AAberdeen Proving Ground, Maryland 21010
CommanderPicatinny ArsenalATTN: SARPA-TS-S, Mr. M. CostelloDover, New Jersey 07801
CommanderRock Island ArsenalResearch and DevelopmentATTN: 9320Rock Island, Illinois 61201
CommanderUS Army Aviation Systems CommandATTN: DRSAV-EESt. Louis, Missouri 63166
CommanderUS Army Test and Evaluation CommandATTN: DRSTE-RAAberdeen Proving Ground, Maryland 21005
Chi e fBureau of Naval WeaponsDepartment of the NavyWashington, DC 20390
ChiefL1rea1 :m snrps
Department of the NavyWashington, DC 20315
Naval Research LaboratoryATTN: Dr. M. M. KrafftCone 9430Washington DC 20375
CommanderWright Air Development DivisionATTN: ASRCWrient-Patterson AFB, Onio 45433
48

DISTRIBUTION (CONTINUED)
No. ofcopis
DirectorArmy Materials and Mechanics Research Center
ATTN: DRXMR-PL 1
DRXMR-MT, Mr. Farrow I
Watertown, Massachusetts 02172
CommanderWhite Sands Missile RangeATTN: STEWS-AD-LWhite Sands Missile Range, New Mexico 88002
Jet Propulsion LaboratoryCalifornia Institute of Technology
ATTN: Library/Acquisitions 111-113 1
4800 Oak Grove DrivePasadena, California 91103
Sandia LaboratoriesATTN: Library
P. 0. Box 969Livermore, California 94550
CommanderUS Army Air Defense SchoolATTN: ATSA-CD-MMFort Bliss, Texas 79916
CommanderUS Army Materiel Development and Readiness Command
ATTN: DRCMTWashington, DC 20315
CommanderRock Island ArsenalATTN: BARRI-KLPL-Technical Library
Rock Island, Illinois 61201 1
Commander (Code 233)Naval Weapons CenterATTN: Library Division
China Lake, California 93555
41

DISTRIBUTION (CONTINUED)
No. ofCopies
Department of the ArmyUS Army Research OfficeATTN: Information Processing OfficeP. 0. Box 19911Research Triangle Park, North Carolina 27709
HeadquartersDepartment of the Army Office of the DCS for
Research Development and AcquisitionATTN: DAMA-ARZ 2Washington, DC 20310
DirectorAir Force Materiel LaboratoryATTN: AFML-DO-LibraryWright-Patterson AFB, Ohio 45433
US Army Materiel System Analysis ActivityATTN: DRXSY-MP 2Aberdeen Proving Ground, Maryland 21005
CommancerUS Army Materiel Development and Readiness CommandATTN: DRCRD
DRCDL 15001 Eisenhower AvenueAlexandria, Virginia 22333
DirectorDefense Advanced Research Projects Agency 11400 Wilson BoulevardArlington, Virginia 22209
DRSMI-LP, Mr. Voigt 1-R, Dr. McCorkle I-RL, Mr. Cobb-RLA, Dr. Richardson 1
Mr. Vandiver 25-RPR 5-RPT (Record Set) 1
(Reference Set) I
42