ad-a260 320 - defense technical information · pdf file · 2011-05-14ad-a260 320...
TRANSCRIPT
AD-A260 320
AD________
CONTRACT NO: DAMD17-87-C-7053
TITLE: DEVELOPMENT OF A MULTI-FREQUENCY JET VENTILATOR FOR USEUNDER BATTLEFIELD CONDITIONS
PRINCIPAL INVESTIGATOR: B. C. WeinbergE. H. GluckH. McDonald
CONTRACTING ORGANIZATION: Scientific Research Associates, Inc.P.O. Box 1058Glastonburg, CT 06033DTIQ
REPORT DATE: June 12, 1987 ELECTELECTE
TYPE OF REPORT: Phase I Final Report U F
PREPARED FOR: U.S. ARMY MEDICAL RESEARCH AND DEVELOPMENT COMMANDFort Detrick, Frederick, Maryland 21702-5012
DISTRIBUTION STATEMENT: Approved for public release;distribution unlimited
The findings in this report are not to be construed as anofficial Department of the Army position unless so designated byother authorized documents.
2 93-oi27 6t11hirslllt (C ý

REPORT D CForm Approved
SDOCUMENTATION PAGE OM8 No. 0704-0188Pu O1c reDornnq ourden for trhi cOllocion of ,ntormation is estimated to averaqe 1 ,our der resoorse. ,ncluding the time for reviewing fl••tructiofln. searcfisnq existlng data sources,;ather rnq and manltaJnin the Iata needed. and CO'oieting and re•e•ing the collection of information Send comments regarding this b4rden estimate or any other asoect of this( ollecton ft tnformat on. cnciuoing suggestions for reducing this Ourden to ffash•nqton Headquarters Services. Directorate for information Ooerations and Recoort. 12 15 JeffersonDavis Hlqhi¥a. Suite 1204. Arlington. JA 22202-4302. and to the Office of Management and Budget. Psoerwork Reduction Project (0704-0188). Washington. DC 20S03
1. AGENCY USE ONLY (Leave blank) 2. REPORT DATE 3. REPORT TYPE AND DATES COVERED
12 June 1987 Phase I Final4. TITLE AND SUBTITLE S. FUNDING NUMBERS
Development of a Multi-Frequency Jet Ventilator Contract No.for use Under Battlefield Conditions DAMD17-87-C-7053
6. AUTHOR(S)B. C. Weinberg; E. H. Gluck; H. McDonald
7. PERFORMING ORGANIZATION NAME(S) AND ADORESS(ES) 8. PERFORMING ORGANIZATION
Scientific Research Associates, Inc. REPORT NUMBER
P.O. Box 1058Glastonburg, CT 06033
9. SPONSORING/ MONITORING AGENCY NAME(S) AND ADDRESS(ES) 10. SPONSORING/ MONITORING
U.S. Army Medical Research & Development Command AGENCY REPORT NUMBER
Fort DetrickFrederick, Maryland 21702-5012
11. SUPPLEMENTARY NOTES
12a. DISTRIBUTION I AVAILABILITY STATEMENT 12b. DISTRIBUTION CODE
Approved for public release; distribution unlimitjd
13. ABSTRACT (Maximum 200words)Accesion ForNTIS CRA&IDTIC TABUnannounced E]Justification
y ..................................................
Distribution I
Availability Codes
i Avail and orIC QUAL IT NSLPECTED 3 Dist 1 Special
14. SUBJECT TERMS 15. NUMBER OF PAGES
Ultra-high frequency jet ventilator, penetrating chestwounds, SBIR, RAD II, Trauma, Breathing 16. PRICE CODE
17. SECURITY CLASSIFICATION 18. SECURITY CLASSIFICATION 19. SECURITY CLASSIFICATION 20. LIMITATION OF ABSTRACT
OF REPORT OF THIS PAGE OF ABSTRACT
Unclassified Unclassified II_ INSN 7540-01-280-5500 Standard Form 298 (Rev 2-89)
Prescribed tP AN$i Std 119-1S296-102

A
APPENDIX B
U.&. DEPARTMENT OF DEFENSE DOD No. S8I
SMALL BUSINESS INNOVATION RESEARCH PROGRAMPHASE 1 - FY I=
PROJECT SUMMARY
Topic No. .A8-214 Military Department/Agency Army
Name and Address of Proposing Small Business Firm
Scientific Research Associates, Inc.P.O. Box 1058Glastonbury, CT 06033
Name and Title of Principal Investigator
Bernard C. Weinberg, Senior Research Scientist
Title Proposed by Small Business Firm
Development of a Multi-frequency Jet Ventilator for use under Battlefield Conditions
Technical Abstract (Limit your abstract to 200 words with no classified or proprietary information/data.)The primary objective of the Phase I study was to investigate the effectiveness of
ultra-high frequency jet ventilation in sustaining wounded with penetrating chestinjuries. To this effect, an experimental program was undertaken to simulate suchinjuries on animals by creating a reproducible wound in the laboratory. A broncho-pleural cutaneous fistula was surgically induced in ten pigs and their progress withthree different modes of ventilation: conventional, conventional jet and ultra-highfrequency jet, were monitored. Blood gases and vital signs were taken and the flowthrough the fistula was measured. The data obtained in these experiments demonstrate asignificant benefit in oxygen loading as evidenced by an improved a/A ratio during
ultra-high frequency jet ventilation as compared to either conventional jet orconventional ventilation. There was also a marked decrease in the gas flow through thebronchopleural fistula in ultra-high frequency jet ventilation as compared to the othertwo modes. Statistical analyses confirm that the observed differences werestatistically significant. These results indicate that ultra-high frequency jetventilation offers significant advantages and benefits in ventilating lungs in which alarge bronchopleural fistula has formed. A secondary objective was to investigatemethods for measuring the resonant frequency of the lung system in conjunction with jetventilation. Results demonstrated the feasibility of the proposed approach.
Anticipated Benefits/Potential Commercial Applications of the Research or DevelopmentThe results of the Phase I experimental program indicate that the ultra-high
frequency jet ventilator could be very beneficial in ventilating wounded withpenetrating chest injuries. In view of its portability and rugged construction, itwould find application on the battlefield. Under such conditions it would be useful inthe emergency treatment of wounded. It would also find application in both a militaryand civilian hospital setting in those cases where other methods of ventilation areineffective or could be detrimental to the patient. The long term goal for the civilian_Aher.nr In rn have the portable ventilator built and dAlstributed to trauma units.
List a maximum of 8 Key Words that describe the Project.
Ultra-high frequency jet ventilator, penetrating chest wounds
Nott' on this page Is clasfed or poprtary Infornationrdat

J
TABLE OF CONTENTS
Page
1. INTRODUCTION ............. ...... ............................ 1
2. PHASE I TECHNICAL OBJECTIVES ............. .................. 5
3. DESCRIPTION OF THE MULTIFREQUENCY JET VENTILATOR ........... 5
4. SIMULATION OF A PENETRATING CHEST WOUND .................... 7
4a. Materials and Methods 7.............................. 7
4b. Statistical Analysis ............. . . ................. 9
4c. Discussion of Results ................................. 15
5. RESONANT FREQUENCY OF THE LUNG SYSTEM ...................... 18
5a. Background ............... ..... ..................... 18
5b. Discussion of Experimental Procedure and Results ....... 20
6. CONCLUSIONS AND RECOMMENDATIONS ............................ 22
7o ACKNOWLEDGEMENTS ......................................... 22
REFERENCES .................................................... 23
TABLES ........... 24
APPENDIX I...................... ......................... ...... 44
FIGURES ............................. 47

I. INTRODUCTION
A significant factor in the survivability and eventual recovery of
battlefield wounded is that medical attention be given promptly, in many
instances prior to reaching a MEDEVAC Unit. One of the more serious cases is
that of wounds directly involving the chest necessitating ventilatory support
to sustain life. Conventional methods may be of marginal value, and could even
further hinder recovery by adding to chest trauma. Clearly, a portable
ventilation device that could be used on site by medics without stressing the
chest area would be very valuable.
In recent years there has been increased interest in novel ways of
ventilating patients (cf. Refs. 1, 3, 4), to better treat their diseases while
not exaggerating or introducing other disorders that may result as a
consequence of the ventilating procedure. The most common way of ventilating a
patient is to mimic the normal breathing pattern of healthy individuals. In
this process, air is convected through the lungs at the breathing frequency by
pushing fresh gases through the airways either by applying a positive pressure
at the airway inlet or a negative pressure around the thorax. In either case,
the frequency is kept at the breathing frequency while the tidal volume is
equal to the amount inhaled during normal breathing.
The procedure, while very effective in a nontraumatized chest, may not be
suitable for patients suffering from penetrating chest wall injuries or severe
trauma to or near the thoracic cavity. In these cases, the patient's lungs do
not respond properly either due to alveolar damage resulting in reduced
quantities of 02 reaching the blood, or due to the creation of fistula tracts.
Other clinical examples of situations where normal breathing frequency and
tidal volumes might be detrimental to the well-being of the patient are: (1)
Bronchoplural Fistula, (2) Adult Respiratory Distress Syndrome, and (3) Flail
Chest.
Positive pressure ventilation has been utilized for pulmonary support for
the last 25 years. Over the past 5 to 10 years, detrimental aspects of
positive pressure ventilation have come to the foreground. These associated
problems include baro-trauma, decrease in cardiac output with resultant
decreased tissue perfusion, and the necessity for tight occlusion of the upper
airway, which can frequently result in tracheal stenosis and other tracheal
complications. High frequency jet ventilation has been prevalent in Europe for
-1-

the last ten years. Rather than supplying breaths at the normal breathing
frequency of 1/3 Hz (20 breaths/minute), in high frequency jet ventilation
breaths are delivered at frequencies as high as 2 Hz (120 breaths per minute).
Its major advantage over positive pressure ventilators of the usual type is the
decreased intrathoracic pressure leading to less cardiac impairment and,
therefore, fewer problems associated with decreased tissue perfusion with
oxygen. The smaller tidal volume used by high frequency jet ventilators also
results in less baro-trauma. Ventilation of this nature can be accomplished
even with an uncuffed endotracheal tube, therefore, eliminating the problems
associated with pressure necrosis of the trachea.
Recently, attempts have been made to use a different mode of ventilation,
i.e. ultra-high frequency jet ventilation. This process is completely
different from the two previous processes because it augments mass transport
rather than relying upon the movement of gases in bulk quantities into the
gas-exchanging areas of the lungs. It offers all the advantages of the high
frequency jet such as low intrathoracic pressure and negligible effect on
cardiac output, and could be used either with a cuffed or uncuffed endotracheal
tube. Its further usefulness is that the process by which it achieves enhanced
ventilation, augmented mass transport, will establish the highest possible
oxygen content in the arterial blood and will be most efficient in the
elimination of carbon dioxide. Because of minimal chest wall movement
associated with the technique, it will lend itself to use in patients with
penetrating chest wall wounds and/or trauma of the rib cage.
Ultra-high frequency jet ventilation will augment mass transport only at
very high frequencies typically in the range of 5 Hz to 20 Hz (300 to 1200
breaths per minute). Although there is extensive theoretical and experimental
basis for the process (cf. Ref. 4, 8, 9, 10, and 11) there are only limited
positive clinical findings reported in the literature. The reason for this
situation is that the methods previously used to produce the ultra-high jet
frequencies could not deliver the required tidal volumes to adequately
ventilate the patient.
Recently, we at Scientific Research Associates in conjunction with
Hartford Lung Physicians have constructed a prototype multifrequency jet
ventilator which does not have the limitation mentioned above and has been
successfully used in laboratory and clinical tests on pigs. The test results
which are described in Appendix 1 have been extremely positive and encourage us
-2-
to believe that our ventilator can be of significant benefit to patients
suffering from injuries and diseases of the type described above. Since the
portable model of the ventilator is rugged and lightweight, and can easily be
maintained and sterilized, containing only one moving part - a solenoid
actuated pneumatic valve, we believe that it could be very attractive for use
under battlefield conditions or other emergency situations. A more complete
description of the operation of the ventilator is given in Section 3.
More recently the in-hospital version of the ventilator, the APT 1010, has
been used to ventilate patients with ARDS under FDA approved trials at Hartford
Hospital. As of 1 June 1987, ten patients have been ventilated on the APT
1010, with some up to 10 days. Four out of five patients with ARDS of less
than forty eight hours have recovered from their lung injury when ventilated on
the APT 1010. Although no statistical conclusions as yet can be drawn from
these results it is noteworthy that the national average for recovery from ARDS
is approximately 30%. In addition, since ARDS can be a complicating factor in
lung trauma, the encouraging results obtained in the FDA trials indicate that
this form of ventilatory support may be useful for treating some of the
sequelae of penetrating chest wounds.
As noted above, our multifrequency jet ventilator would be advantageous
for use with penetrating chest wounds. Further, it could also be of benefit in
the presence of a noxious chemical environment where paralysis of the chest
area or burning and scarring of the internal membranes could lead to impaired
breathing. In such cases, which usually occur under adverse conditions where
highly trained medics are unavailable but immediate care is required, the
multifrequency jet ventilator would be of great value. Transcutaneous
cricothyroidostomy could be administered by relatively untrained medics
employing our ventilator to give the required immediate care until the patient
is evacuated to a more suitable environment. Thereafter, our ventilator could
be operated in its normal mode. Furthermore, the augmented mass transport that
results may also facilitate the removal of the noxious gases more rapidly.
The results of the animal experiments conducted to date (cf. Appendix 1 for
a complete description of these studies) indicate that the present device was
superior to conventional positive pressure ventilation in providing the highest
oxygen levels in the blood. These experiments, however, do not precisely
simulate injuries and diseases sustained under battlefield conditions. It was,
therefore, the principal objective of the Phase I effort to conduct a series of
-3-
animal experiments that would establish the efficacy of the ventilator and the
ventilation technique for treating battlefield sustained injuries, namely
penetrating chest wounds.
The other objective of the Phase I research effort was to investigate a
method for measuring the resonant frequency of the lung system that could be
used in conjunction with the multifrequency jet ventilator. Our experiments
with pigs have indicated that significant improvement in oxygenation can be
obtained at a unique "optimum" frequency, which varies from animal to animal.
It is expected that similar behavior exists for humans. We believe that this
frequency may be related to the natural or resonant frequency of the lungs.
Furthermore, the method used to measure the resonant frequency could also be
applied to determining the patient's lung mechanics, thereby aiding in the
evaluation of his recuperative progress.
The results of SRA's Phase I study for a simulated penetrating chest wound
in an animal show that ultra-high frequency jet ventilation was superior to
other forms of ventilation by enhancing 02 loading. In addition, there was
significantly lower flows through the broncho-pleural fistula when the animal
was ventilated with the ultra-high frequency jet. Although the data collected
were for laboratory controlled reproducible injuries in animals, these results
clearly indicate that ultra-high frequency jet ventilation could also be
effective in sustaining humans with similar types of injuries.
In the following sections the report describes in detail the experiments
conducted, the statistical analysis of the data and the conclusions reached.
The report is divided into five sections. Section 2 is a summary of the Phase
I technical objectives. Section 3 provides a brief description of the
multifrequency jet ventilator used in the experimental program. This is
followed in Section 4 with a description of the experimental program, protocol,
results and a statistical analysis of the data. In Section 5, a description of
the apparatus for measuring the resonant frequency of the lung system is
described, as well as a discussion of the results obtained. Section 6 contains
the conclusions and recommendations.
-4-

2. PHASE I TECHNICAL OBJECTIVES
The Phase I technical objectives were as follows:
1. Determine the effectiveness of three different modes of mechanical
ventilation in treating simulated penetrating chest injuries by
performing laboratory tests on animals employing the following modes
of ventilation:
(a) conventional ventilation (6 - 30 BPM)
(b) high frequency jet (120 - 180 BPM)
(c) ultra-high frequency jet (> 300 BPM)
2. Construct a device that could be used in conjunction with the
multifrequency jet ventilator to measure the resonant frequency of the
lung system and investigate what relation exists between the natural
frequency and the 'optimum' ventilation frequency.
3. DESCRIPTION OF THE MULTIFREQUENCY JET VENTILATOR
As described in Section 1, augmented mass transport can be used
beneficially to ventilate the lungs. This phenomenon combines two diverse
disciplines, fluid mechanics and pulmonary medicine. The collaboration of
Scientific Research Associates and Hartford Lung Physicians, each with
expertise in their respective fields, offers a unique opportunity to
investigate this area from multiple viewpoints, leading to a better
understanding of the physical processes that are involved. Indeed, the design
development and construction of our prototype high frequency jet ventilator
could not have been accomplished without this interdisciplinary collaboration.
The device we have built is a multifrequency jet ventilator of the
solenoid valve type. It can operate throughout the useful frequency range
including those employed in positive pressure ventilation, high frequency jet
and the present ultra-high frequency jet, with the frequency chosen to best
treat the patient. The operating frequency can be varied from 1/15 Hz (4
breaths/min) to more than 50 Hz (3000 breaths per minute) and the inspiratory
time can range from 5% to 95%. Specifically, one is able to vary the
frequency, the driving pressure of the gas, and the fraction of the cycle time
during which the solenoid valve is open. These in turn control tidal volume,
-5-_

the I/E (inspiratory to expiratory) ratio, and the respiratory rate of the
patient. The major components of the ventilator include a control module
(electornic control and power system), a power module (solenoid valve and
pressure regulator) and a motive module (motive nozzle, entrainment plus
humidification system). The electronic controlling device is specifically
designed to enhance the opening and closing of the solenoid valve, such that
even at high frequencies a virtually square wave pattern of gas is emitted with
each pulse. This allows larger tidal volumes for a given driving pressure,
frequency and inspiratory time.
The ventilator works on the following basis: A high pressure gas source
enters into the solenoid valve, the electronic controlling device opens and
closes the solenoid valve according to preset conditions. The time that the
valve is open is set by the frequency and the inspiratory time. This plus the
driving pressure will result in a given tidal volume. The gas is then
transported through low compliant tubing to the motive nozzle in the
entrainment module. The entrainment module has a low velocity flow of
humidified gas through it; part of which is entrained by the high velocity jet
issued by the motive nozzle during the inspiratory part of the cycle, the
exhaled gas is removed along with the low velocity gas flow through the
entrainment module.
In the past, one of the major obstacles in the way of the development of
such an ultra-high frequency jet ventilator was the inability to deliver
adequate tidal volumes to the patient in the desired range of frequencies. The
joint efforts of Scientific Research Associates and Hartford Lung Physicians
were able to overcome this difficulty by introducing several novel innovations
into the design. These included a specialized electronic circuit to drive the
solenoid valve, allowing it to open and close significantly faster than in its
normal mode of operation and aerodynamically designed components for use in the
entrainment module to efficiently entrain oxygen rich humidified gas and to
remove exhaled C0 2 .
There are two versions of the APT 1010 multifrequency jet ventilator, an
in-hospital unit and a portable unit. Although both versions have the same
basic components there are several distinct differences between them. The
in-hospital unit, as required by the FDA, has built-in safety alarm systems as
well as other monitoring equipment. It is intended for prolonged use in the
intensive care unit and hence mobility is not a significant concern. In order
-6-

to effect the desired functions the unit is microprocessor controlled. Such a
microprocessor system permits many enhancements which have been included in the
APT 1010, viz. a sophisticated data acquisition system and a data archival and
retrieval system. It should be noted, however, that subsequent prototype units
have been reduced in size to an extent that, with an appropriate battery power
source, could be made portable if deemed necessary.
In contrast to the in-hospital unit, the portable unit is intended for
emergency, temporary use and therefore does not require the complete complement
of sensors and safety alarm systems. This permits the unit to be built with
simplified electronic controls. Hence, the unit can be made extremely small,
light weight and rugged and requiring minimal power consumption.
4. SIMULATION OF A PENETRATING CHEST WOUND
4a. Materials and Methods
As noted previously, the pig was used as the test animal. There are
several reasons for this. First, large animals can be readily obtained, in
weights approaching that of an adult human. Second, since the pig's lungs are
less efficient than those of a human, being less compliant and having less
collateral ventilation between alveoli positive conclusions reached in the
study would carry over to humans. For other animals such as dogs results may
be inclusive. Third, the pig also has other physiological similarities with
humans. The experiments were conducted at the Hartford Hospital Animal
Laboratory where our previous tests were held.
Yorkshire female swine weighing between 80 and 100 pounds were used as
test animals. No two were from the same litter. The animals were supplied by
the breeder
Earl Parsons and Sons
Mill valley Road
Hadley, Mass. 01035
Prior to surgery, the preanesthesia administered to the animal was
atropine with dosage .02 mg/lb and acepromezine with dosage 5 mg/lb. During
the experiments, Nembutal (pentobarbital) and Pavulon (pancrium bromide) were
administered intravenously at the rate of 21 mg per half hour and 3-6 mg per
half hour, respectively. At the conclusion of the experiment the pig was given
40 meq of potassium chloride in a 20 cc bolus as the euthanesia agent.
-7-

After the animals were sedated and anesthetized a carotid arterial line
was placed and a Swan-Ganz catheter was inserted through the internal jugular
artery. Additional venous accesses were also placed. The animal was then
intubated and placed on the APT 1010 ultra-high frequency jet ventilator and
optimal gas exchange was achieved by varying the driving pressure (10-50 psi)
and/or the frequency in the range of 7.5 Hz and the I/E ratio was set to 30%.
Following this, the animal was switched to a volume limited conventional
ventilator and tidal volume and respiratory rate were varied to achieve optimal
gas exchange. Respiratory rates varied from 8-20 breaths per minute and tidal
volumes between 600-1200 ml. During this period baseline arterial blood gases
and cardiac output were obtained and arterial pressure was monitored as well as
other physiological data, i.e. pulse, blood pressure, pulmonary artery pressure
(PAP), pulmonary capillary wedge pressure (PCW) and pH. The mean arterial
pressure and saturation were computed using the collected data.
After the stabilization period and having obtained the baseline values
surgery began. The animal was placed back on the APT 1010 and a thoracotomy
was performed. A right upper lobe lobectomy was then carried out. The
bronchial stump was connected to a Fleishe pneumotac through a plastic cannula
and rubber tubing of similar diameter. The Fleishe pneumotac has previously
been calibrated for various flows in the pulmonary laboratory. The thoracic
cavity was left open to the atmosphere. This surgical procedure was easily
reproducible, which was important in obtaining statistically meaningful data.
During the procedure the pig was ventilated using the ultra-high frequency jet
ventilator at 7.5 Hz. This mode of ventilatory support was requested by the
surgeon, Dr. Rocco Orlando, since it minimized chest movement and permitted the
procedure to be easily performed.
The experimental procedure called for randomization of the three different
modes of ventilation, i.e. ultra-high frequency jet ventilation (frequency of
5-10 Hz.), conventional ventilation (frequency 1-3 Hz.) and conventional
ventilation with 8-20 breaths per minute. Each experimental sequence consisted
of randomly selecting one of the three •rodes of ventilation, followed by random
selection of the second and then the third. The animal was allowed to
equilibrate for 10 minutes before any hemodynamic cy arterial blood gas
measurements were made in each mode of ventilation. At the end of completing
one series of experiments the randomization again was carried out. If the
animal survived, three sets of data were collected for each animal in each of--8--

the ventilatory modes, or nine data points were gathered for each experimental
animal. Hemodynamic data consisted of arterial blood pressure, cardiac output,
pulmonary artery pressure and pulmonary capillary wedge pressure. Arterial
blood gases were analyzed using a Corning arterial blood gas analyzer.
Bronchopleural fistula flow was obtained by integrating the flow curves
obtained through the Fleishe pneumotac using a K+E planometer. The Fleishe
pneumotac was checked at the end of the experiment to ensure that no changes in
calibration factors had occurred. A complete listing of all data taken and
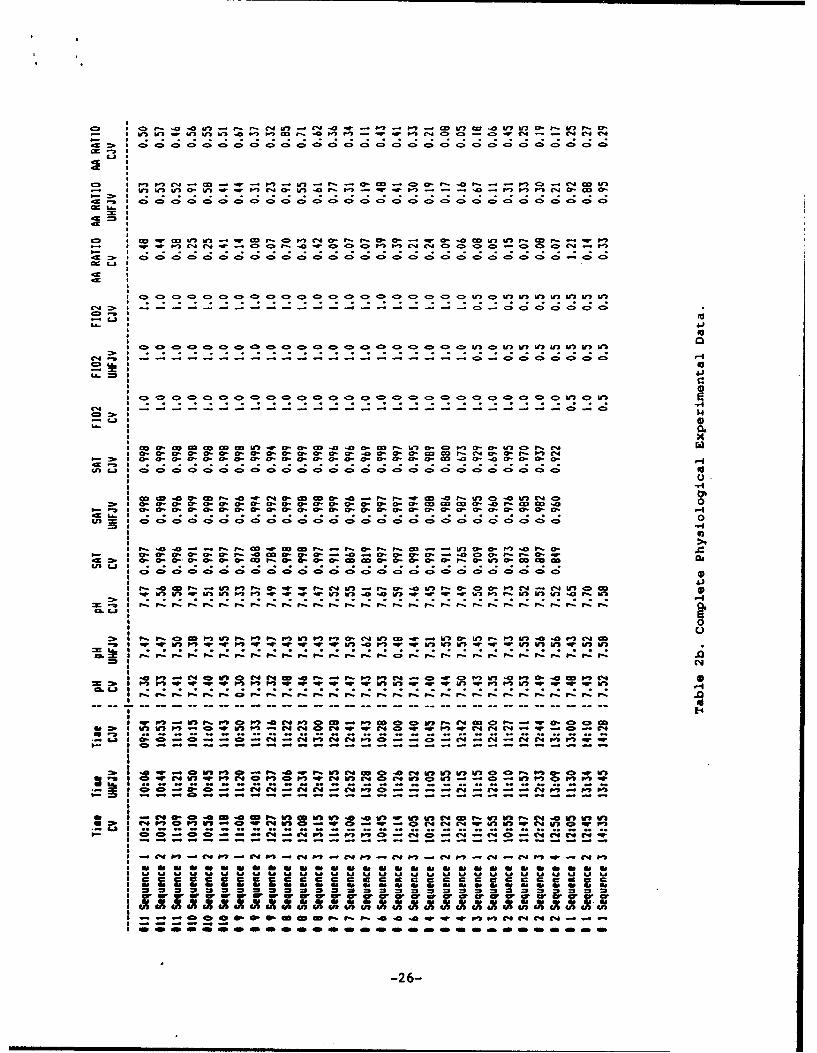
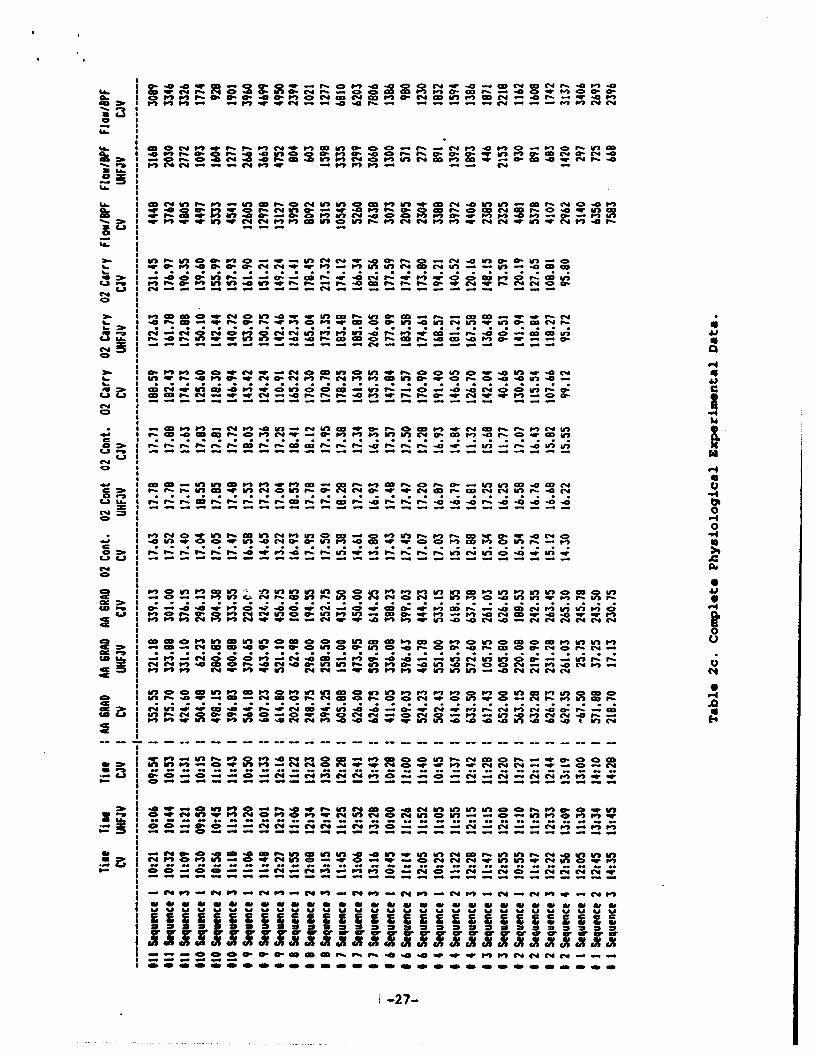
definitions of parameters are given in Table 1.
Eleven experiments (with eleven animals) were conducted. Of these eleven,
data taken in ten experiments were used in the statistical analysis due to the
early demise of animal #5. The data used in the statistical analysis are shown
in Tables 2 through 4. Table 2 shows the raw data in spreadsheet form, while
Tables 3 and 4 present the data for the unbalanced and balanced design,
respectively (cf., Section 4b). The data was analyzed using STATGRAPHICS, a PC
based statistical package marketed by STSC, and all variables were considered.
A value of a-.05 was considered significant.
4b. Statistical Analysis
The hypothesis that was tested in the series of experiments is that
ultra-high frequency jet ventilation is superior to other modes of ventilation
in the physiological simulation of penetrating chest wounds in pigs, i.e. a
bronchoplueral fistula. The hypothesis was tested by considering a sequence of
ten experiments employing the protocol described previously and measuring the
physiological animal parameters and flow through the fistula to determine how
well the animal was ventilated. Statistical analysis of these data is used to
draw conclusions concerning the veracity of the hypothesis.
The goal of the experimental design is to examine the performance of
three modes of ventilation by eliminating the test order effect and screening
out the test timing and animal effects. Special care was taken in designing
the experimental setup that was employed. In view of the nature of the present
series of animal experiments associated with the variability of the animals
themselves as well as their progressive deterioration as the test proceeded,
test timing, which may be a significant effect, must be taken into account.
Hence, the following conditions were met for the duration of the experiments:
-9-

(1) Every testing day the procedure for running any particular ventilator
was kept the same;
(2) The system parameter setup for running one particular ventilator was
kept the same;
(3) A three-way layout randomized block design was employed.
With regard to item (3) the randomized block design is described in the
previous section. An a posteriori estimate of randomness was conducted at the
termination of the experimental program. The results of this test which
confirm the randomness of the data are shown in Table 5. It should be noted
that the randomized block design differs somewhat from the standard 3x3 Latin
square design in that each sequence of the three ventilator tests per animal is
randomly chosen before the beginning of the sequence rather than at the outset
of the experiment.
The experiment has the following tabulated design:
Ventilator
Animal # Test timing order A B C
Itl 1)(m) (n)
t2 () () C)t3 () () ()
2t () C) ()
t2 () C) ()
t3 () () ()
3t C) () ()
t2 () () ()
t3 () C) ()
10 tl
t2 () () ()
t3 () () C)-10-
where 1, m and n is a random choice of permutations of the three ventilators
which can eliminate the test order effect.
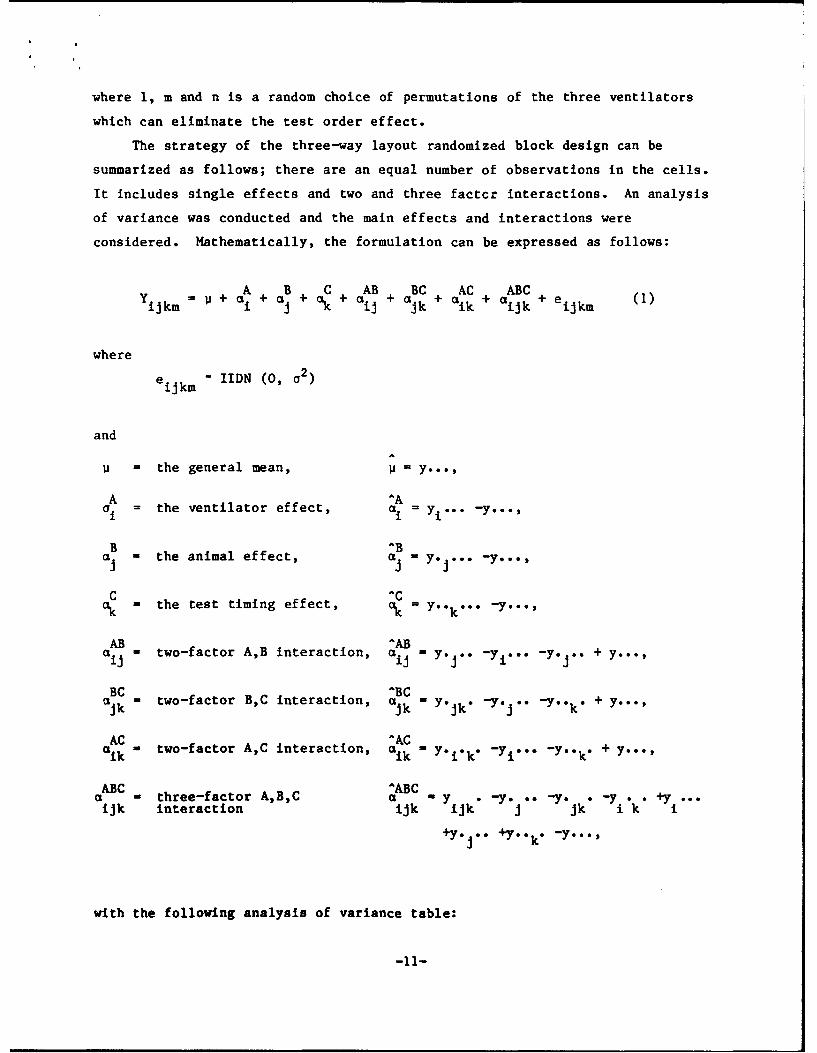
The strategy of the three-way layout randomized block design can be
summarized as follows; there are an equal number of observations in the cells.
It includes single effects and two and three factcr interactions. An analysis
of variance was conducted and the main effects and interactions were
considered. Mathematically, the formulation can be expressed as follows:
A B C AB BC AC ABCYijkm U+ai+a + +ai +ajk+ aik + 'ikk ei (1)
where
eij"km IIDN (0, 02)
and
= the general mean, =
A 'AI', the ventilator effect, Li y1 "" -y..-,
B -B"aj = the animal effect, a = y.e .*. -y...,
C "" = the test timing effect, C = Y''k " " -
AB ^AB" = two-factor A,B interaction, aij = Y*J'" -ye.." -y. 1'" + Y...
BC ^BCCk -k two-factor B,C interaction, a = Yejk" "" "" -Y''k" + Y..'
AC ACaik - two-factor A,C interaction, aik ' Y'i'k" -yi''" -Y"k" + y''
ABC ^ABC= three-factor A,B,C aBC " -ye -yo -y ". +
ujk interaction =tk ijk j jk i k
+y. J6 +Y.k.* -y...,
with the following analysis of variance table:
-11-
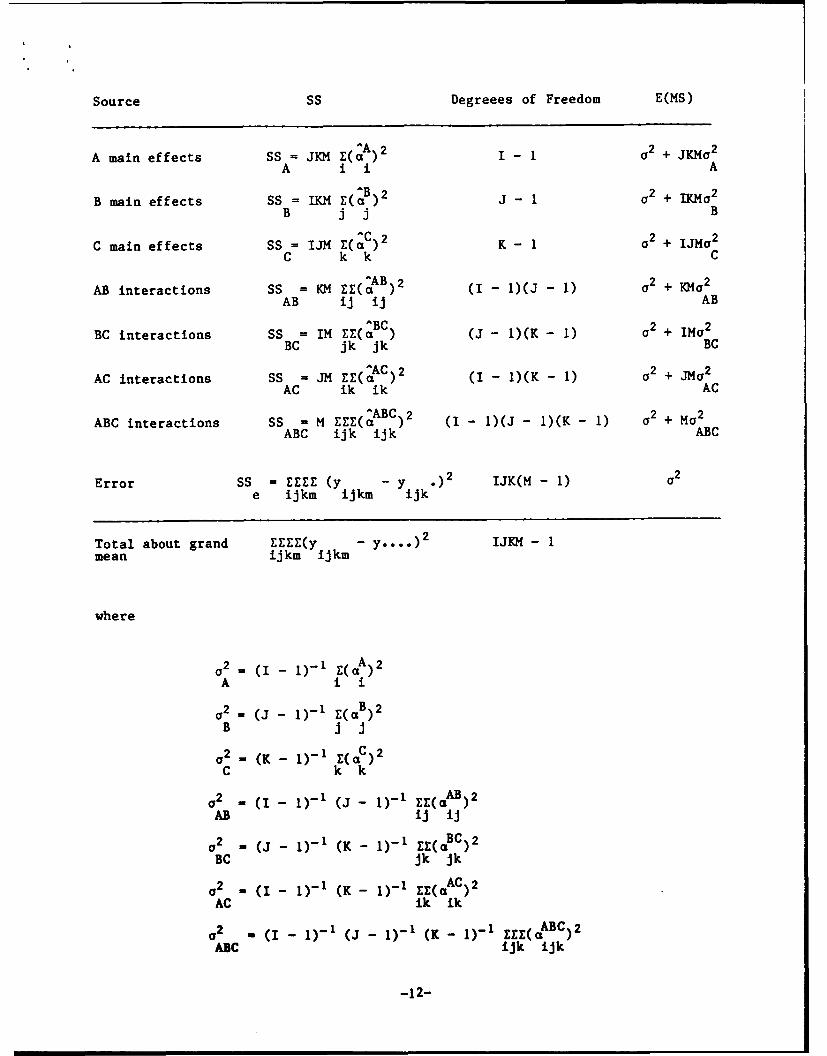
Source SS Degreees of Freedom E(MS)
A main effects SS = JKM (A2 I- 2 + JKMo2
A i i A
B main effects SSafi MZ(B)2 a2 + Ma2B jj B
main effects SS = IJM E(^C)2 02 + IJM-2C k k C
AB interactions SS = KM EE(^AB)2 (I - 1)(J - 1) a2 + K~o2
AB ij ij AB
BC interactions SS = IM EE(^BC) (J- 1)(K- 1) a2 + IMa 2
BC jk jk BC
^AC)2 (- )K-1a 2 + ~ 2
AC interactions SS = JM EE(aC) (I - AK - I) + JMAC ik ik AC
ABC interactions SS = M EE(A (I- 1)(J - 1)(K- 1) a2 + Ma2
ABC ijk ijk ABC
Error SS = EEE (y y .)2 IJK(M- 1) 1 2
e ijkm ijkm ijk
Total about grand EZEE(y - .0)2 IJKM - Imean ijkm ijkm
where
a2 = (I - 1)-I r(A)2
A i i
o2 = (J- 1)-1 1(aB)2B i J
2_ (K - )-1 E(QC)2C kk
2 _ (I - 1)-1 (J- 1_ 1 E(gaAB) 2
AB lj ij
02 - (J - I)-' (K - 1)-1 EZ( BC)2BC jk jk
a2 - (I- 1)- 1 (K - 1)- 1 EE( AC)2AC Ak ik
02 = (I - I)-' (J - I)-1 (K - 1)-1 ZEE(aABC)2
ABC ijk ijk
-12-
In each cell of the experimental design, one observation is taken, i.e., m-1 in
Equation (1).
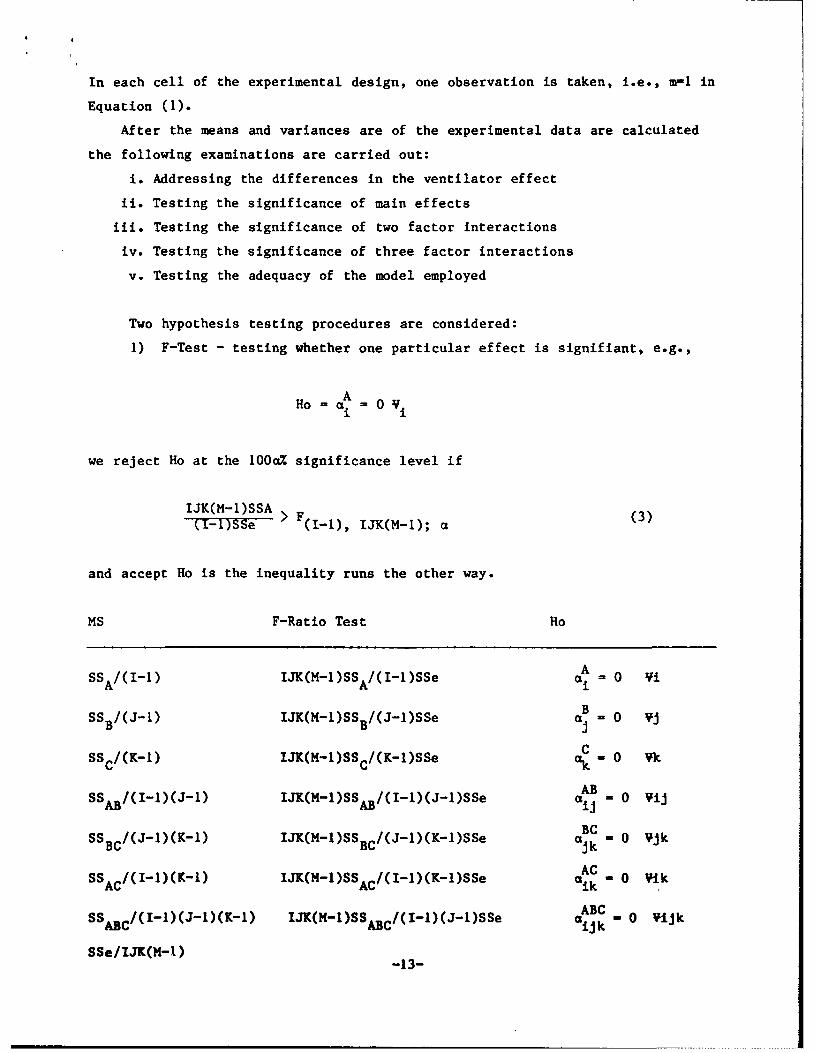
After the means and variances are of the experimental data are calculated
the following examinations are carried out:
i. Addressing the differences in the ventilator effect
ii. Testing the significance of main effects
iii. Testing the significance of two factor interactions
iv. Testing the significance of three factor interactions
v. Testing the adequacy of the model employed
Two hypothesis testing procedures are considered:
1) F-Test - testing whether one particular effect is signifiant, e.g.,
AHo a = 0 Vi
we reject Ho at the 100a% significance level if
IJK(M-1)SSA > F (3)(I-ISSe (-I), IJK(M-1); a
and accept Ho is the inequality runs the other way.
MS F-Ratio Test Ho
SSA/(I1-) IJK(M-1)SSA/(I-1)SSe A = 0 ViB
SSB/(J-) IJK(M-)SS B /(J-1)SSe a . 0 Vj
CSSc/(K-1) IJK(M-1)SSc/(K-1)SSe ak . 0 Vk
ABSSAB/(I-)(J-1) IJK(M-1)SSAB/(I-l)(J-I)SSe aij -0 VijBC
SS /(J-1)(K-1) IJK(M-l)SSBC/(J-l)(K-l)SSe ajk B 0 Vjk
SSc/(II)(K_1) IJK(M-1)SS /(I-1)(K-1)SSe ACAC AC aik - 0 VIk
SS /(I-I)(J-1)(K-l) IJK(M-1)SS"/(I-1)(J-I)SSe ABC .ABC ABC (~ *ijk-o ij
SSe/IJK(M-1) -13-

2) T-Test - testing whether the dfference between two treatments is
significant, e.g.,
A AHo = al = a2
We have a confidence interval with 100a% significance level as
^A _ A 1 1(50 - CI) ± tV Pa,/2 S + (5)
We accept Ho if the calculated value is within this interval and reject Ho
otherwise. (Note that a2(1/n, + 1/n 2 ) is the variance of a1 - a2, and S2 is
the unbiased estimate of a2, v is the degrees of freedom associated with S2
nl1 , n2 are the observation numbers of al and a 2 , respectively.)
The STATGRAPHICS statistical package was used to obtain the statistical
analysis presented herein. It should be noted that two factor and three factor
analysis can only be obtained with a balanced design, i.e. the same number of
cells in each experiment. During the experimental program of the eleven animal
experiments conducted, ten were used in the analysis as per the original
protocol, since one animal (number 5) died early in the experiment. Of these
ten, eight had nine entries per experiment, three ventilators by three
sequences. However, in experiment #2 four sequences were conducted and in
experiment #3 only two sequences were completed. Hence for the balanced
analysis nine experiments were employed (using the first three sequences of
experiment #2, while for the unbalanced design the full ten experiments were
considered.
In Tables 6 through 8 the analysis of variance and significance tests are
presented for the a/A ratio and flow through the broncopleural fistula. Table
9 summarizes these results. The graphical data are presented in Figures .
For the sake of brevity, selected balanced design results are shown. It should
be noted that there was no discernible difference between the balanced and
unbalanced design results.
From the statistical analysis of the a/A ratio it can be concluded that
(i) Three main effects: animal, ventilator and sequence, are significant
effects in determining the a/A ratio of the treatment. Other terms
in Eq. (1) appear not to be significant.
-14-

(ii) The residual analysis indicates that 90% of the a/A ratio variation
of the treatment can be interpreted by the chosen mdoel. The
residual effect does not reject the adequacy of the employed model.
(iii) For different ventilators, the resulting a/A ratio is significantly
different, as shown in Fig. 2. The test of significance is
performed and the results are displayed in Table 7c. It indicates
that UHFJV provides the highest a/A ratio among the three different
modes of ventilation. This conclusion is based upon the unanimous
agreement under 95% confidence interval, 99% confidence interval,
Tukey test and Scheffe test.
4c. Discussion of Results
The data obtained in this experiment demonstrated a significant benefit in
oxygen loading, as evidenced by an improved a/A ratio during ultra-high
frequency jet ventilation, as compared to either conventional jet ventilation
or conventional ventilation. In Figs. 2, 3 and 4 the mean a/A ratios at the
95% confidence level are plotted as functions of ventilator, sequence and
animal (experiment #), respectively. With regard to ventilator dependence
(cf. Fig. 2), it is readily evident that ultra-high frequency jet ventilation
is superior to other modes of ventilation. This is borne out in the
significance levels that are given in Table 7c and are summarized in Table 9.
It is noteworthy that even at 99% confidence level, the a/A ratio obtained for
the ultra-high frequency jet ventilator still demonstrates superiority over the
other forms of ventilation (cf. Fig. 5).
There was a marked decrease in the gas flow through the bronchopleural
fistula in ultra-high frequency jet ventilation as compared to the other two
modes of ventilation. Figure 6 demonstrates this result convincingly, where
the flow through the bronchopleural fistula is plotted as a function of mode of
ventilation for the 95% confidence level. This result is further confirmed in
Tables 8c and 9 in which the significance levels for differences in ventilators
are presented. In addition, the flows through the bronchopleural fistula as a
function of ventilator, sequence and animal are presented in Figs. 6, 7 and 8.
Hemodynamics did not show any significant difference in any of the modes
of ventilation. Although the PCO 2 was somewhat lower in the conventional jet
ventilation than in either of the other modes, this did not reach any clinical
significance, although it did result in a statistically significant
-15-
difference. These results are shown in Figs. 9 and 10 in which 02 delivery and
02 content as functions of ventilation mode for 95% confidence level are
presented.
In studying the acoustic and fluid dynamics of the lung system it is
helpful to employ electrical analogies. Thus, flow and pressure become current
and voltage, respectively, and viscous resistance, compliance and mass can be
related to electrical resistance, capacitance and inductance, respectively.
Using this analogy we can gain insight into the mechanisms controlling the
ventilation in the animals and assist in the explanation of the observed
results.
One can view the airways as a resistance, first in series, then in
parallel, ending in a finite capacitance (cf. Fig. 1). One would then
anticipate that under conditions of conventional ventilation the infinite
capacitance afforded by a bronchopleural fistula (BPF) would result in uneven
distribution of gas, favoring ventilation down the pathway of infinite
capacitance. Typical jet ventilation frequency, i.e., 1-3 Hz., employs smaller
tidal volumes. This effectively reduces the percent of the total capacitance
used for gas exchange in the lungs, allowing more favorable competition with
the infinite capacitance of the BPF.
The APT 1010, used in this experiment, uses augmented diffusion as well as
convection as its means of ventilation. Gas exchange therefore relies upon
creation of concentration gradients to some extent, as well as convective and
Taylor dispersion-type mechanisms. The low tidal volumes, relative stable lung
volumes and high frequencies would therefore negate the effect of the infinite
capacitance afforded through the bronchopleural fistula. This would then result
in a redistribution of gas throughout the lung unit in a more unified manner,
decreasing the overall ventilation of the bronchopleural fistula and improving
ventilation in a previously hypoventilated area. The results of this study
suggest that this is the case. There has been a clear difference in the a/A
ratios, suggesting better matching of ventilation and perfusion throughout the
lung zones as compared to conventional ventilation and conventional jet
ventilation. There has also been a marked diminution in the flow through the
bronchopleural fistula during ultra-high frequency jet ventilation, as compared
to the other two modes.
-16-

The experimental design allowed us to single cut the ventilators as the
causative agent for these discrepancies. The randomization of mode of
ventilation in each animal negated the possibility that time would be a factor
or that changing from conventional to ultra-high frequency jet ventilation or
any of the other possible permutations might result in improvement in gas
exchange, irrespective of the physiological changes that occured in the lung.
Furthermore, when one looks at 02 loading, i.e., a/A ratio, as a function of
flow through the bronchopleural fistula, one does not see a discernible
relationship. This suggests that the a/A ratio, which in this model is mainly
dependent on ventilation perfusion matching, is independent of flow through the
bronchopleural fistula. This would necessarily be the case if gas exchange was
diffusion-dominated rather than dependent upon bulk gas flow. Relative to the
total pulmonary capacitance there is no significant difference between the
volumes delivered in these two ventilatory modes, yet the a/A ratio and BPF
flow were significantly better in the UHFJV group. In this regard, the
gradient for gas exchange is actually slightly greater in the intact bronchial
alveolar units (PAO 2 - PVO 2 ) than in the bronchopleural fistula units (PAO 2 -
PAMB 0 2). The reduction in bronchopleural fistula flow at the high
frequencies is probably not relying soley on gases moving down a concentration
gradient. In fact, resistance times capacitance (RC) constants are more likely
responsible for the more even distribution of gas exchange achieved with
UHFJV. The tidal volumes employed in UHFJV are about 60% of those achieved in
HFJV. This, of course, would not be the case using large tidal volumes at
conventional respiratory frequencies.
In analyzing the data we have taken into account the time from the start
of the experimentation after surgery was completed, as well as the relationship
of the preceding type of ventilation on gas exchange, we have found that there
was no significant relationship between switching from one type of ventilation
to another with respect to gas exchange, since the time factor was equalized
for all three modes by the randomization of the experiment.
-17-

5. RESONANT FREQUENCY OF THE LUNG SYSTEM
5a. Background
The current methodology employed to determine the physiological changes to
the lung while a patient is being sustained on a jet ventilator relies either
upon an examination of chest X-rays and/or the determination of the compliance
of the lung. The former gives a qualitative measure while the latter requires
that the patient be removed temporarily from the jet ventilator. Relying
solely on arterial blood gas analysis may not be sufficient to detect
therapeutic changes to the lung but may only indicate how well the patient is
being ventilated. Hence, a method that could give a quantitative measure of
changes to the lung while being ventilated, namely changes in lung mechanics,
would be a valuable tool.
For the ultra-high frequency mode of ventilation, determination of lung
mechanics including the resonant frequency of the lung system would offer
additional benefits. Since the frequency of the pulsed gas stream supplied to
the patient is a controlling factor for this mode of ventilation, choosing the
appropriate or an 'optimum' frequency would be advantageous. Experience with
patients suffering from ARDS in the FDA approved trials at Hartford Hospital
being ventilated on the in-hospital version of the APT 1010 has indicated that
as a group they can be successfully ventilated at 5 Hz. However, one patient
did show marked improvement at a single frequency, which in her case was 5.9
Hz. Although no conclusions can be drawn from this isolated case it is
reasonable to expect that there is an optimum frequency which is different for
each patient and may be a function of the disease. Further, since the
ventilation frequency employed on human subjects is near the resonant frequency
of the lung system, the 'optimum' frequency may be related to the resonant
frequency.
A robust method for determining lung mechanics is based on forced
excitation techniques which was popularized by DuBois (Ref. 2). In this
procedure, random or sinusoidal pressure oscillations are induced at the mouth
of the subject. By measuring the amplitude and phase angles between the
pressure waves and the induced flow the impedance of the lung system can be
determined. Each of the two methods, employing either a single sinusoidal
frequency or a distribution of random frequencies, offer their own specific
advantages. However both techniques require that care be taken in setting up-18-

the apparatus and in interpreting the data. Reference 6 gives a more recent
review of the two procedures.
These methods can be readily understood by considering the electrical
analogy of the lung system (cf. Fig. 1). In an electrical system consisting of
resistors, capacitors and inductors for a given voltage input there is a
corresponding current output. The impedance which is the ratio of the two is
composed of resistive and reactive components. The impedance will vary as a
function of the impressed frequency of the input voltage signal. At resonance,
when the voltage and current are in phase, the reactive component vanishes and
the impedance is totaly resistive. This electrical analog carries directly
over to the acoustic properties of the lung system.
The single frequency technique generates a clean signal which does not
require sophisticated spectral techniques to analyze. Impedance and phase
angle can be determined, but only at that given frequency. Since in order to
obtain a reasonable description of the mechanics of the lung the impedance over
the frequency range < 50 Hz is required, this procedure is time consuming,
necessitating many individual applications. This method, however, could be
used to obtain the resonant frequency by displaying the flow signal versus the
pressure signal on an oscilliscope thereby generating a Lisajous figure. At
resonance, when the two signals are in phase the figure reverts to a straight
line.
An alternate procedure is to use random white noise which has the entire
required spectrum (distributed with equal energy) so that the impedance of the
lung system as a function of frequency can be obtained in a single procedure.
This method, which was successfully employed by Michaelson et al. (cf. Ref. 5),
requires that the data be spectrally analysed employing Fast Fourier Transform
techniques (FFT). Further, the signal does contain the ensemble of frequencies
which may induce noise and must therefore be carefully controlled. Since all
information is retained in this process, an inspection of the phase angle
between the flow and pressure signals as well as the amplitudes of the pressure
and flow signals can be used to determine the resonant frequency.
In view of the ease with which the impedance can be determined in a single
run it was chosen as the preferred method and its applicability for use with
the ultra-high frequency jet ventilator was investigated. The goal during the
Phase I effort was to determine the feasibility of the procedure.
-19-
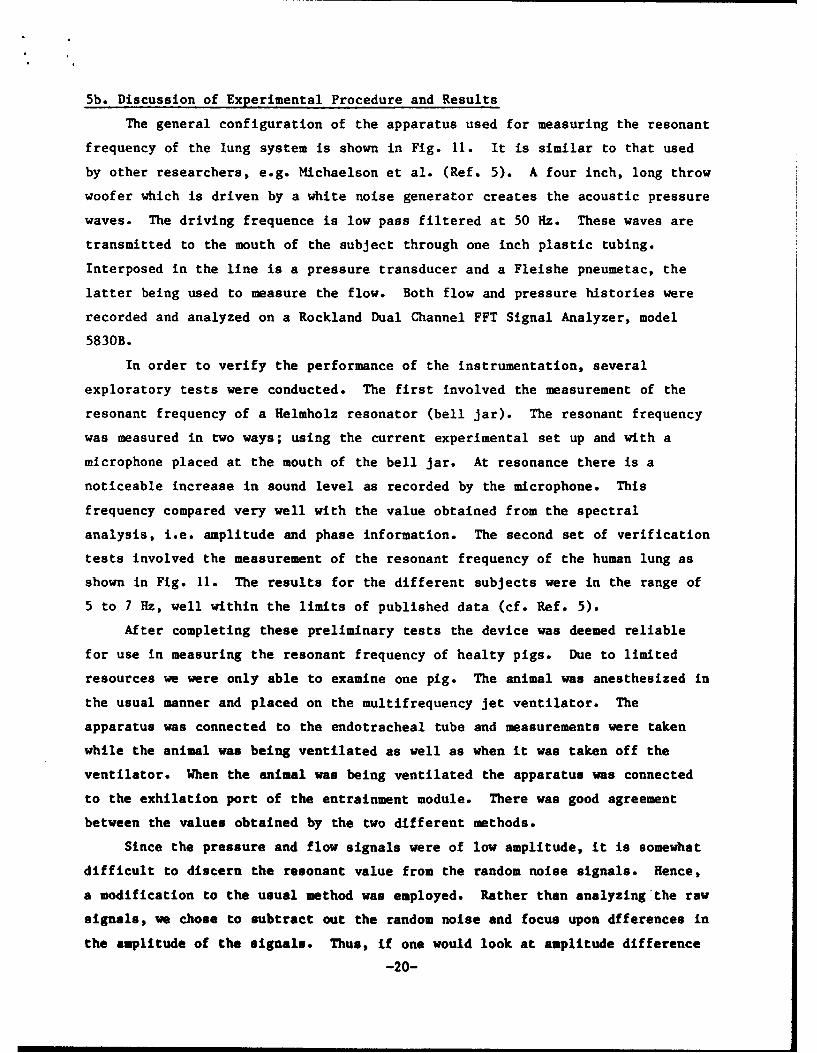
5b. Discussion of Experimental Procedure and Results
The general configuration of the apparatus used for measuring the resonant
frequency of the lung system is shown in Fig. 11. It is similar to that used
by other researchers, e.g. Michaelson et al. (Ref. 5). A four inch, long throw
woofer which is driven by a white noise generator creates the acoustic pressure
waves. The driving frequence is low pass filtered at 50 Hz. These waves are
transmitted to the mouth of the subject through one inch plastic tubing.
Interposed in the line is a pressure transducer and a Fleishe pneumetac, the
latter being used to measure the flow. Both flow and pressure histories were
recorded and analyzed on a Rockland Dual Channel FFT Signal Analyzer, model
5830B.
In order to verify the performance of the instrumentation, several
exploratory tests were conducted. The first involved the measurement of the
resonant frequency of a Helmholz resonator (bell jar). The resonant frequency
was measured in two ways; using the current experimental set up and with a
microphone placed at the mouth of the bell jar. At resonance there is a
noticeable increase in sound level as recorded by the microphone. This
frequency compared very well with the value obtained from the spectral
analysis, i.e. amplitude and phase information. The second set of verification
tests involved the measurement of the resonant frequency of the human lung as
shown in Fig. 11. The results for the different subjects were in the range of
5 to 7 Hz, well within the limits of published data (cf. Ref. 5).
After completing these preliminary tests the device was deemed reliable
for use in measuring the resonant frequency of healty pigs. Due to limited
resources we were only able to examine one pig. The animal was anesthesized in
the usual manner and placed on the multifrequency jet ventilator. The
apparatus was connected to the endotracheal tube and measurements were taken
while the animal was being ventilated as well as when it was taken off the
ventilator. When the animal was being ventilated the apparatus was connected
to the exhilation port of the entrainment module. There was good agreement
between the values obtained by the two different methods.
Since the pressure and flow signals were of low amplitude, it is somewhat
difficult to discern the resonant value from the random noise signals. Hence,
a modification to the usual method was employed. Rather than analyzing the raw
signals, we chose to subtract out the random noise and focus upon dfferences in
the amplitude of the signals. Thus, if one would look at amplitude difference
-20-

as a function of frequency one would observe a zero or near zero value
everywhere except at the resonant frequency. In order to effect this procedure
an ensemble average of values was used, namely sixteen samples.
Open loop random (white) noise was sampled and averaged sixteen times as
was sixteen samples of recorded data taken with the apparatus connected to the
animal but disconnected from the ventilator. Recorded data was used since the
response time of the Fast Fourier Transform (FFT) analyzer was too long to
allow for sixteen samples of actual data to be analyzed in real time. The
difference between the open loop (base line) data was compared to the flow and
pressure data resulting in the graph showing a resonant frequency of 3.7 Hz
(cf. Fig. 12). The peak at 1.9 Hz is probably a system effect (see below).
The resonant frequency at 3.7 Hz is further verified by viewing the phase angle
between the flow and pressure (cf. Fig. 13) which for this case is precisely 0
degrees.
An additional experiment was performed by binding the chest of the pig.
This causes the thorax to be stiffer and hence the resonant frequency should
increase. The results of this experiment are shown in figure 14. In this case
the resonant frequency has risen to 5.7 Hz, confirming our conjecture. Note
that the peak observed in Fig. 12 remained at 1.9 Hz and did not shift further
indicating that it is a system effect rather than an actual acoustical lung
system resonance.
The procedure and apparatus employed has been shown to be a viable
technique for measuring the resonant frequency of the lung system. As noted
previously, the purpose of these experiments was to demonstrate feasibility.
This objective has been met. Regretfully, in view of the limited resources,
extensive tests could not be performed. However, the actual apparatus,
although suitable for use in an experimental setting, may not be totally
satisfactory for use at the bedside for sick or injured patients. Hence,
alternate methods have been briefly investigated that are based upon forced
excitation methods. There are two techniques which show promise. The first is
the use of the endotracheal pressure signal which is obtained on the
in-hospital version of the APT 1010 jet ventilator. By inspecting the
waveform, preliminary tests indicate that compliance and resistance can be
determined without disconnecting the patient from the ventilator. Another
complementary procedure would use the microprocessor in the ventilator, which
generates the valve driver signals, to generate the white noise and drive the
-21-

solenoid valve. This would eliminate the speaker and could make the apparatus
an integral part of the ventilator. These two methods show promise, and could
be pursued if deemed desirable in a follow-on effort.
6. CONCLUSIONS AND RECOMMENDATIONS
In view of the body of experimental results and the statistical analyses
conducted, we can conclude that ultra-high frequency jet ventilation has
significant advantages when ventilating lungs in which a large bronchopleural
fistula has formed. The advantages consist of improved ventilation perfusion
matching, as evidenced by improved A-a gradients and a/A ratios, as well as
decreased flow through the bronchopleural fistula. Ultra-high frequency jet
ventilation was also accomplished without any untoward effects with respect to
hemodynamic variables or oxygen delivery to the periphery.
The results, which are extremely promising, lead us to believe that our
ultra-high frequency jet ventilator could be beneficial in the ventilation of
battlefield wounded with penetrating chest injuries of the type investigated.
In order to reach this goal, additional research efforts are required. These
would include further studies on pigs and would culminate in FDA approved human
trials. Efforts would also be directed in the engineering design area in order
to assure that the ventilator would be capable of performing in potentially
inhospitable environments. These endeavors could be the focus of a follow-on
study under Phase II.
7. ACKNOWLEDGEMENTS
The authors wish to acknowledge Dr. Alexander Chan for his assistance in
performing the statistical analysis, Mr. Sean Cobane for his help in
constructing the apparatus for measuring the resonant frequency and
Dr. Dean Mesologitas and Ms. Karen Bellar for their assistance in the
performance of the animal tests. The many valuable discussions with Ms.
Victoria Solberg, the Contracting Officer's Representative, are also greatly
appreciated.
-22-
REFERENCES
1. Bohn, D.J., Miyasaka, K., Marchak, E.B., Thompson, W.K., Froese, A.B. andBryan, A.C.: Ventilation by High-Frequency Oscillation. J. Appl.Physiol.: Respirat. Environ. Exercise Physiol., Vol. 48, 710-716.
2. Dubois, A.B., Brody, A.W., Lewis, D.H., Burgess, B.F. Jr.: OscillationMechanics of the Lungs and Chest of Man, J. Appl. Physiol. 8, 587-594,1956.
3. Fredberg, J.J.: Augmented Diffusion in the Airways Can Support PulmonaryGas Exchange. J. Appl. Physiol.: Respirat. Environ. Exercise Physiol.,Vol. 49 (2), pp. 232-238, 1980.
4. Joshi, C.H., Kamm, R.D., Drazen, J.M. and Slutsky, A.S.: An ExperimentalStudy of Gas Exchange in Laminar Oscillatory Flow. J. Fluid Mech., Vol.133, p. 245, 1983.
5. Michaelson, E.D., Grassman, E.D. and Peters, W.R., Pulmonary Mechanics bySpectral Analysis of Forced Random Noise, J. Clin. Invest. 56, 1210-1230,1975.
6. Pimmel, R., Fulton, J. M., Characterizing Respiratory Mechanics withForced Excitation Techniques, Annals of Biomedical Engineering, Vol. 9.,pp. 475-488, 1981.
7. Slutsky, A., Drazen, J.M., Ingram, R.H., Kamm, R.D., Shapiro, A.H.,Fredberg, J.J., Loring, S.H. and Lehr, J.: Effective PulmonaryVentilation with Small-Volume Oscillations at High Frequency. Science,Vol. 209, pp. 609-611, 1980.
8. Smith, R.: Contaminant Dispersion in Oscillatory Flows, J. Fluid Mech.,Vol. 114, pp. 379-398, 1982.
9. Taylor, G.I.: Dispersion of Soluble Matter in Solvent Flowing SlowlyThrough a Tube. Proc. R. Soc. London Ser. A, Vol. 219, pp. 186-203, 1953.
10. Taylor, G.I.: The Dispersion of Matter in Turbulent Flow Through a Pipe,Proc. R. Soc. London Ser. A, Vol. 223, pp. 446-468, 1954.
11. Watson, E.J.: Diffusion in Oscillatory Pipe Flow, J. Fluid Mech., Vol.133, pp. 233-244, 1983.
-23-

0 LL
LUILUL
S-JLU >
CC M LU 0
F- 0>-L Mo >- LU 0.0
cc 00w> iCa.e C0 %ft + 0
0: -LJ z64 m m
C0C. IL C1 0 0~CIA 0 Nd
Co z-Co 0. C.
LU m. zL ILw-J 0! w 04
CoZ 0 LL
CO Col co 0LU CLU zm 0 CD l
Wl to %a. (D 0~LU CoLU 004
Z0 C)CL c 0 0 Z
W~ Co) a LL < I-IU). 0 0 Q L
0.0 0 0l Z o Z0n- of 25 o P d
U. w O 0)jm u -
0 0 0 0 0 0 0
-24-

'I.Li I
M. W3 -P~(4~ . ' m w -- V a'cy 0- PI 1) p W 0.- U . C, in <=, (a -0 -O C 62
u-.
*W cz, ('-(JU ~ 00M C -3'4 -0 0 U, 3 C W C, an1) , C,<C Ia l :C!C l :CýC l %ý! W -I!
L4 -:1 rS 1.) P0 C ! a-- C! - ý rl 0*! C'C,0 -C, --I! C, p0- 1C 1-- a-! 'C -I,:
If I
a - C -W r- -V con U,--0 a- O - U, C. 0-D- g> "- -00-0 ", am a
ai a- co 0- CD co- 0. o- 0- oC,(' Co CC 0- C 0- 0-- U0, a- - r-- ,U .0 U0,o-
C%~. E
* C .313 cm a-- r-O W, <-0 C, a -U, 1t3 " -40 W P; ", (' 0- x.( L U 0 P12. ., a. 1.3 - 0-1 1.W - 3 " (' w. 0-. 4 W -0 C4 CIA~ U
L.3 a
C- Li2dWG l* 0 -. :; W40 4 lI-4 >.
I' 1.3 Co. PCa- o I- -W -W . C, C,.C. -0 1. =. -W " C, 0- (.4 Cj 1. o -0 U, 3 12-,C' 0-0ca4~ C- WD -WC4 d I 1CLu a 91~,1 .13.
Li ~ I
rn ! a ý0 :W!0 tI!Itp !C = !CilýC l !1!C
~~~~C aC- 1.3 ". (' 1. . . . w 13 13 13 3 C. . . . . . . . ' .(4 1 43 C. 4CL I
a ,C 0 U -.! 0! 1% 0: a-: c! C! UI! r C, U %, lo 'OW -1! W! C, .O ! 0: <.1. F-' ,U
w-) W- ('4 U W ' , 0.0 'CC'V -r 2.00-0-C -3 (' D co-. 1.CV ,U -cc 1
-0 C% C3 CO31.31.CD.31-3W Nr-,CW4NC-4 P- ('WC-D....
=NSL. a 0ý '- UC2,m -0 C, .0,, C ('5 r- 3 C, a-.C , (.4-.- t C t- 0. g -W C,"o, Is a! 1.3 m. T.-0. (T1. ('4 le n'-. m' ('4 n .IE . ( a t '4( 12.2
5~ C4
S ~ ~ ~ ~ ~ ~ 0. W'd 0- w -C -- -- -- - , , , C(' OW . U(4 ,0- - - - -
(' . -- - C C 0 ,W'C - U W OU, -M do3- U, am3 U, -. W U, -f 0 0-WC
CL)~~~~~~~~ -25-'S (4WW' 'I '~1.
cc. IS I
1- . WW ' I4z, 4= CD C> 4= - 4=- C_ 42 <p Cb 4= CI C. 1=3 C> CD a a a a a
co co W-2 co r - a= a) crd - a- f- 0v. 0.- -W a- -O co u's an - r -- a
~LJi
a~
Lb J I
U.ý IC CtC .<a. !C= tC c : ! '
C-3. I
II0
I xw-. CP wa - a W91 . . o0 -U20 C, 0 -U340f
-C-' 01 : . . . 0 :c:G ý :0 :0 ý 0 1 :0 :0
a a- . m a n Co a- ao- 4 - -c -o . - r- -W a M a- a - U-)C a-0 ana -3a 0- - aP. a- CD- l- ao- a-0 -a- a. a- a- a- 13 a- a, a- C -a-4 a- - ao co 10 0
r - a- a- r- a- a- a- a-a t-a-a -- r a- a-- " 0a- c-~ "- . 1-o 0I'- - Ca a- .a- .a- ý a-a -a -a -a -a- a- a-- a- a- a- a- a- a-P aF- a- a- 0. a-
ý a-0 a- a- a- a-a -m l -W a-W a- - a-4 a" - ay- a- u's a- aP- a- an a- C4 C4m SC
a l an an wl an an u-, 4w. U1 w nan. o W2~ a-~ al a- an anA an- a-a
-C2 a -a -a -a -a -a -a -a -a - r- a- a- a- a- a- a.- a- a- a- a- a-
~~C a* a-a - 0a -, a- a- n - a, a- a-a an M, a., a- an, a )a c- - C,4- ~ '" aI n W! aný W'! "It I'l a-, pi M"! n- - ~ na n-- -a na na
F.= - a- a- a- a- a- a-, a- a- a.- a- a- a- a- a- a- a - a- a- a- a- a- a- a- a- a- a- a- a- .
a -I Ia- t c- n 12- ~ Oa - - . a)-)-a t T = a -ýa4 a)a-- a-aaW 0. a 2 a-, C3. ~-~ -a~a - -~- an an C4 C-4 "- an, c -c n ~ -a
a a a-a-a- - - a -a - - a- - a- - a- - a- a- a- a-ac -a -a-a -a -
a 0 2"p1 z nT1 2t 2 4 24 21a -1
-aa an a- - - - an 4- 4a - -aia . - * ' I- w - - -C4
* ~ ~ ~ ~ ~ ~ ~ ~ ~ ~ . 140 ar . . -- . .... .. . . - - .. ... . .
4z ao 4 0.*a- m w aý -- -0 o -o ad W 44 C-4 C a---------------C-4 ' 4 a-, - -a-M4D. g am --------------------- ---------- ----------
a . ~- a a~ -a- 4 a a ai a. -26- a a naa -a~ -a a
ýo 4 cp a-W;z - 0 0 Cp (' W -0 (4: w " 1- -0 "1 .0Cl. C,4.4. A .0 m 40 0 -W 4 o o
9; a. P 0. .0 "= Pm -o :! t' -W .0
a. ~-P1 1 9 0.0 @ o - a- = ('4W ('4 4 10, Cm W 1W =- 1 -4' -0 C44'~ .¶1 V1- o - -0- - - .0 .0s 40 -c = r, 4w. cp. w 9
-W -0 4z,('P ' = P1 "= cp. P 'wI0 -"= -p a ' m 1 R0 " r- a1 = "I46. P1 T= 0* Vs- .0 go-~ Co 4=p t4 0. 40, cl 9 = 0. -W VIP0- p 9 . W)-* 1r W= 1 - W -- (4 -14' - 1P 1 - (4 -
U. j I ý 40a 0 ,
ci .: 0 . 4 =(4 I 0 ~ 4 0 C4 =0 4' 9 4=0 =
m0 cc. -W P1 W) -0 -W -W u' r 0. 4 m1 mL. 6, 4'ý Il CZ! C! 0: LI 9=ý .= 0:P 'W I9 1(4 =P 14 '9 4'ý 9=! P1: 9
a p 420 - - -W w - = WV 0 .b- 2 W. 3w
-2 a
a. II CoS .0 b0M 9 -. 4 .-7 4' 2 w= 4 W o.(4 = ' 42. -W w' P- r *- 4'W7I. , SP19 .P r: VI. CI 4': Ct C = -ý 9= W! 4' W! V!9 .4 =4'9 '9
CO a 14 (4 :E t- CZ C;- (!2
(.4.r
~~~CD w an 4' w' .0' w' q I- 4'~= wI ti4 - 9 4 - -W .0 9= 9
a. . 9m'- 9 40. ) V3 P1 u' P1= 4' 1 n 0. .I . W3 ('4 L-3 V, WI g. 4'(7
(.3 S.& I9 .0 9= -WI 4* -IWI .0 C .. 4' P' 9= Go C4 U-3 c' P 0 '
-C I 0.P1 P1 9 C44 -~ i=~4 n Ul C4 9= .0 .0 WI 4w .0W ',cc C I 4 = - 14 a- -W (' 0 ('4 P1 -0 .0P P1 4' C4 C4 4'c9=Wa-
C-LIS 4' 94 9= ('4 -4' 4'(4 0 Co- 9= Ln W0 *. 4' P. %=P 4 '44 4' P1 - 40
4' C-4 W2 -0 4' &0 .0 - 1 ( C44 am0 P1 P1D P1 .0 o.(' 4-r P1 .= C -4' .0 o. g
('4 Sg" C C4
12 12 a 1 c
4' 6 ~4' 40 - V 0 MI 4 S W1 P1 CMP '-4 =P '9 9 .- IW '. '9
I IT t= 42 9= nI4 'W ' CZ L2 t=0 ' (4.4 4E (v 4' 9=! 4' 4!! It I '
Iw 0 .. wIZl0 4.. 0. 1.0 0.1 9= 1'= = = = ='= ='=0 el 41 a, 4.10 u=-0.0 10 0 a wlS
0* 000 r , 1 - . l- a d W.Z 'm .0 No -0 WI =P WI W- P1 ,(bP 9=.00. .9=
4' .VI4CC 'WI09 0.a WI 1.4'44' CP1'P-27-. 1

m 91 qg~j . %a w 4 0Qba% q. % <)0 r- C%. U-) mC,7 CD7 Ul)CD'C CD LflmOl o U $CM r~- vo C 4- Ci() M a
1 -4 -6 -4. .4j -4 14 -4 -4" -4 .4 C 4 -4.
I I v J0 V W)r 0 )C3M L >C 4< )r v -O M 4 D 4 4C Y 1 3c)k )- ' D--a
%0. W) 00 ý'U)I JC-0 n MI DV''0 0c)C )V 4C)t OI OC ' . N 4 4a . .
t,- ": . :" I4 C ;" :;; ;t:zL:r , r ;z4 ';v :" :. : . : ; " :r
I I
4.. l . C-)c- I-) C'-j l' C-> f-> f. C' '0 kC.ý IU) C..? C I.J r. - CU- C-L U C-I ) 0i (J 4-J C3 C.) 0 0 0-ý C '-11-,-C-C- - DC-C-CD C - -
a%* 00000000CDt-0%0%00000000 0D 000 Va %U 0 -9 ) 01 CDODC 0 o 00000000 0%a %6 ha ýa ba ba taC*41
I NO V) -4 .V404-.40C%.4M.D.%4t-.4 C- M M M -4.4 4. .44 0 0 M V DM 0 DM M M r 0W. -.4.n4M4.4-.0.4.4 V.V. C-..M.W
I. C !1 !C ýCV I ý*" ý*r ý1 t W ýC iW!'ý1 ý1 .' U ý W ýC)V ! l !1,W ,%CL C t- r- C- r- -C C- - V r- t--L'-V- - t-Cý - C r- [- - C C- t- g r- V- - V r-V- - V- D- - r cl tz cl -tzC I .4C3cv)4Cg() 1
S. InU)C4% D M< -% DC 4C3% , ' V D k % V 4vIlL nO Mr V C3WIfl -I 4- 0- 0- 0- 0"- M-
-4- 4- I4 4 '- 4
-q I .)C. C.) C.0. C* .V .0 . C.- C .)J7 .) C.) C0.) C.) t.) 17) 0. CO .t- ) 0 .(D ) " C.) V- ) 0 . C.) U) W. M _* " -M W 0%n a t- -40 < - 'V
q.I 0 )- C- C-) m OD W 0W r q aC- C.). 00 C4C CD~ CQvUD.40.0maO mc - n-VvCi DCD 0 0 0 -4 -4 -4'
I-I 0"000W n"W t f >0L >b)04 e )1 0C D0CDD0 0 00
CoW o1 -r 0VW D% 4 '- M -C)9 0UI4C'CV2CD 0C'-.%-.40, CD'CSI- 3CD0% -4 D% W)0'C D 0 '*~~- C9 .40
W) 9- 9-4 8 Cn a- - 0a V b : CN C'A-4 C- 8 4 C"-4 ) % M C CVCV)91--4 C) 0C- % 0 -7 M C W)0 IW " VI 7 --
Iv V) % VC) % DV*W . a% AV a% D W mC)C)C)C V f mc .%I - co.4..4..at.4 .o4.4.4." cm.4.4a.C4 .4.4.4".d. 4. C-.4O.44at C*,J 0 .4- C .4.4-.t4.4.4.4.4. o .4 a%1 w 4. P- I o '. c m
ca C.I 4 0aW 9 -< % >% DW-80C M% ý% O V -- 608W O*b ýt )V -C 4v0 tC~j-4 t t C C 9ý M -0 % 4 g c) 4 01 c coOD10 t ý % O CýC~ (nat c atattl-CDg- % cl %
M -. Vo 09 c C -4(a o CI -" CI W)V- 1. % m ý wCý 44 a r 0%% C~ 0 cmCh a C) *-q. cl %Dt- ) -I%ao ). aa " %W ýW 7 4"% V l W ) a0G ng Dr nC39% 4 04C DC)( 'Vr- 0V % rV )w% %o oc -% oq om oq 7% -wa nc DW aW 04 M-1< m%
-* %a -P OD. InV %.40 a. 0- 4O-C)C)00 r ý4 l aW Dt 0r )t ) W(%( a-
t"'? nCV r q. C D C' C-W mOW nC2C7't r V r r v- CD-l~l4 C D *C .4.). C 0e' m- um 4- " qcamC v c e rt mC-4
C!Q V !1 l ý 1 !< 9I!W !W ! 19V !91!W !r !W ý0 1 ýW ýW4 CV W)'S .4 .4.4 ".nM 4b a 0Va IC- C ý ý- %% 0" - )Ca- )-6vt )4)r Octý DC
0m o%1 DD9 F )V% 0O )- .W aC) V O nC) l wU DC %- Dr .v- D% 4 "cC"~ ~ ~ ~ M emQ~lt .43 M ftc mC e44 -0 CPV C*mC) -0 )V. IV 00Vm
-0 v " 4. ,ar-40 at .0 CNI cD -o-W)%V- w cpo 4 m~ 0.v )-.0 9- co Ml%0- qn O ..0 )% -0 %0 -4CV VW
o f 0 - -0-4 4 - -4 4 - C% CQcm m cmC-Aca m C C% CV)m ci C) c) C) C"C" n C IVle
~-28

M %D 0 g -M ' - fl NJ M 0 t- -- 00 --D - 0 CD 0 - on C.) 0 4- 0 Go .0C-I 0 No 0l 0o 00 a% q n N4 'D Cy 0. C% I
.IW) i N .0 C N40CD aW) W)'aco co < 0 %Dor-.O4rIna rn)-0 -W MN 0 W 4..C'<a'%tr 0 ) 4 n W )0% C ' CC'C
C% -0 -4 -4 4. .M .4 -4 .4 -4 . 4 -4 -4.4 .
42I
(M C- CM. C.4 -4 O4 -444 44 .4.M-444.V 4 M - .44 cm M 4 .mCV 4 .14 .4) .4 N~ .4.4.4 C%3 .r 4 C ..4 M 4 cm 4 N C.4.4M
pi I
%D -D %n In N -')40 M - 0r M~ C- " 0% 0 00 U-C '- (Y% I 0% OD OD (D N 'ý C- - kD Nr In) C%3 C CV 0C 0
0% C' -C 0 M at In .4C 0I n 00 r- M- C'-0 W W' W- c C- M ~ W - a' M- M- W C- C'- -V W04 -, C- in0 D n0 M0 ~0 0 0 00% 0% ,*M4.4" .tc4 c m4.4.Ma'4O.M4.4.4% .b ' '.4 47%44 4. . .44. .. 7%. 0 w w.44.4.44.4.4..4.4.
-4 N '-4 C% C') -4 N4 -0 4 N 9 C' -C 4 N. C'14 N 4 C') -4 N 4 C 4 N4 C'-4 Ns C'- 4 N C)4 ' 4 N C' 4 N 4C)C)4 . '
~1
C I C.) 0. . . C.) 0. C.) .) C.- C.) C.) .) C- t%- C.) M 0. Xn CO V- COC C Mz Na MI %C - -i n Z w
W, I )W 00UMI mc I DC 00 0 040000W00) > -0000C-000c0int-00 )00CI-000000[ 00 C -00cm00W)0000- 0 g-0SW)W %
I Y C 4 0 oau. ryv )i- Lo0 W C c coco % ow atw) oat p ooin, ~ ~ D ' o .%44-c ý03oV s'D <> 0
0;0 ;0 zm ;W ;0 C z4 ;4 C ao . y.ZZ W 4W ;60 ;l ,w* 0 C-C- .4-M-%aC-C-MCvaCa-e V cn M --- 'CC--C-4 V aC- C 0C a c-C-C-) nCV)Mk ) aC -0>C4-4C)% -C4CC M
I V M C%.DC D- mC3( % MCVMC)M)3..C) W 4 v- W r )W )- Dc 4Mc*ý% - C N 0a W 0 N ~ " 0 0N0 W % W - -NývC%" W ntWV V, %3 )IO - . M nCM-VoC% 0" N.C4 - a D 0IflM-* %
..a .Výa - ) %x ( n- n6...r-.4 at.%a.4 r-.4 OW40.0 W).V 0 4%V r- 9- CV) D.b") W) %. In -4 0 C- C GO 4.4.OM 4rev) ,a co 0C)c )I' - o " -v * V - oC))A -% aa 4 4P 4W)k ýMC l -- 4
S.4 V 4. C, .4 .4 4 4. . . .M.40M C 4W ) 0 4.M ( 1 )% ým1 V)k 4M M C tO f
%D 00t N. CIO 4 CD N- CV -In N VI WONC) o% t- C*- C) aobv r-4 C') om at t 00. r- . C')_ '0; C')zczc 0.4 C4 In C4o% P. C') V ) a ) W) C-7 W) %D0 W) 0D 0 t ka 40 X' (- t'0 - at 40 91 00 %a C) ' 0 MC6( - C-0' am -4 -44 Iý n C at %0W a' N .0
If . .4. .0 0 v in In 0v ) 0) 00 in 00 In If)0 An ka40 w 0 0.0 In 0000CýCýC In CIn In In 0ý In 000 ID 0D CD CD 00 Inw ,
I NN~n~n -N~nN~nnOI-0In -C-ON~ 1-29- C Q 0I -'NCO On C- CNn

IC'- MD LO 0 '0 W D M 9' - a% (MO 0 .4. LO -4- in 0 C'- M' 0 E C- U-) U-) U-) 0 0' C"- n) C- M' 0 M' 0D -D C"- 4- M % D M D 0m 9- .0 am "-. n...am m< 4 -W 9- .4 r m uy oC)r D 7c vr .4 .0.4O.4IV.n4.4 CVDC
-- 4
Zo I .4. r-- Zo in) at w4 c a%. m v) c- Nl C') c') co mr) 0r 'q. 0 C"- '0 U-) %D 0 0 0 '4. a'- C') % at 0a% a% Cm. CV q. W. Cl) .4C') in In (M cC- CI 4 W ; c ;C:W Z r : 0 ;C : C ,I. DO 3 0 v C3- -c -% V -r %V C 4 v -O T )g D V,--C - - ,ý Dt -t
-4 -..4 4 -4 .4 -4.-4-4 -4-4.-4 -4.-4-4.-4-4.-4.-4.-4 -. 4 - 4 .- 4 -4 -4 -4 -4 -6 J44...
W I
o ta I U 0 D47% wm )U - - D w 0w0.M.-4-0 4 -0-6-0 a 0. a'.CMW'-.0-r-ID D1
I C- C-a %D- t' '- - W0 V4 W' CD- C'- g- 0% r' I- C-M C-f C-4 n C'%3. 4,D C- 0 -0 0 (1- C'- CO- OD CO- O- OD C"- at" aI D kD %D- C" C- CD- t- U)-q"1 .. 4 cncn(Y.q4.4.4%acoatq a -. %4- % 4.4.4a.4 D - -- c4 o 64%.4.t4.atataa4a.q4a.m4.4 % a mw
a: : o0 a *:o:d!0 : : a c 006!c! 0 :060a0o:00a: ! 0 a o a:a:a:0: :0a a0o:00a:0! :0a acnI4
0 >< 0000000< I e..>4..4.4.4.4.4.4.4.4...4.4.4.0 .40 .40 .40 .40
cm 0 "4 0 m...4-- -m m 0-0< Dm(Nw m mC- Dwr 6W -m V -c O - -a-ý06I "V 7' 7C 7' t" t" tW !I t V?1 0U !W ýU ýC 7't1 ýW !
4 -4 -4 4 -4 4 - - 4 4" " -.- 4- 4 -4- % 4 - 4-4 .4 - .4 - 4-4- - 03- - VO - 4- 4
4U v t-0)coo %t tv 4c oc) a a. c - p - 0 I)- o CJO a
-. - VMW DM W 0CIn( 000MC) * % 4C)W Li() C- Q% a% 0%JD 0% i) 0 C3C Vc na
I C '-0 ý '2 - t g ) O"M " O O ID)C-M0 -0 I DDIn M C- U'3 r- U'DC) bI )nn00L
I' C' 4C.0IA0 C3('. D " .0 c"' % 'Q ')N. 0 4. C 0 '.0 C9) 0' ID go) 0' C '0 ID 0" 04 -0 C 0 0' '<> 04 0' C. U) Q C- Cos '0W) WD CM -% ' DM% 4 L-M% ý. % *' 0( )I r O0 % 4 - D0CCw..................................................V....................................... M.....................O...............................9-. CO -C'C-"- %aW o'44MV( rC ' -C 0C)t DC DC-ý 1 .0 Ma ac v0C DL 20W %0%
,VI V SCa0% a V vC .4 4 4 4. .4. .4 4 4. . . . . . '.O.4. n. .4..4 .e4 4.. .W ))%0M c') CO C 4% C.) M -.4 4.4.
I6 0
00I 0m coa ,e% C Iat 9- 00 0 LIDC0 tm %D 0.4'OC ') %a %a Np 0 '0 C')'W) a "4U).4U)o.04NO.c-4'00 0 naq
S..4
-30-

. 1 4 -4 -4. 4 .4 -4 .4 . 4..
.4. 00 6 zC, C. ('I <; Z ;,; ,;; ":4 ; ; ;.1 t q.( ~ %3a 0 0 toU)- % DLcGoOi -COC aO % 4-4 6 4 0 4 4 4-C -4-4-4-4- - - - c 1 4 -. 4 - - - - -
.4 .4 - 44' W . W -0 - . ~ ' W 0
PA I
U* I
:> :
CI( .)(()41 ci ri tj c JZ x m x x= =
I % <> V 0 9- 0 a M W .NM -%0 0 MM(nk - - L- %Dt-%D )M w oo-a oW ~ - ~ 0 0-mmcmc %a nc %i ( mc %c -wc
4c C %!0: ý 0:a: : 0 0:Oý 0 0!loý0: : (ýCý : 0 Oý0! 0 0:0: ! 0g.4
*I tý C') Mc - -MW Ma ( 0M MM
I ('.4 -4 -44(M.4.4-4 -0.-4-4.-.444-4.-.4-f.-.4-4 -
9- C-- -( 0 W 4 00 0 O%4CDWW'OD %DN1OW4 Dt D. ) %0 -W0 %O %(,! t *j ý0 !, !c:- ý90 : e ýc , !m !a ý( !< ! a
-act0c -% -e oa n4%c ýc oc oc ta %0a -c nwi
m qDwMWn0 -- -Vatwaovo*-a omc n- W 4 0 0 r - - oc0ma%.aor-t-aa a mchwa4(mZW7m- aC - am- C0C -0 W 0 0%Cm% '% 9 % mm0 m mw n ww 0%-4 e..4 4 4. 4 -)4CM4M MM M " 4 .4 -64v .CO) M CV).4..
0 0 )9 00L )& )0V 00W 7o iaN )0I IIA. I lt nC ng -0 " " C r 0 L nC - t - t )L
o0 W! V) W! 0r, W! 0 00Q! 0 0 0 a!0C! i ,l0 a:0Ic0 -4 " 0 M M to w m 0%l m 0 a%" r lw aV m m% -% ac n )C ai aC
I4 M M " M (' W ' ¶ 0 4 ' . 03 0 () ) M " ~ 4 * M M In UIn " M N
O.P O O O ~ a oO ooo o o o o- 0CýCM W7 in M0000000000000- > - 4 %<>00000)000v0 00 0 -L nL aw - ýma
I (D3 0- 9- co 3. OD 1 W 'I 4% 0% w) "' Ch C V) (43 Q' %a M0 0' VV "4 M -V 0. .4 M) M 9I N ka - in%0 '4%
*4M. ) )V tW -04W I 0 4- MM n nD 0 O ( .4-4 C4 ) q C N O
* 4qp - -0 0 ' % w - a 4 n - 4%Dr 00wm0 0W)E-0.40(3M 4 '.4 MMa. "0 el
06 m m mW) m v mm m m m
1.4 .4 m am""".4 %am * U) m 4 m m " 4. 4 -4 -1 C% C3CV)
%3 9 0- W O' 0 .4 M4 M' " %D t0~- W (ft 0 .4 M' M' -- V) %D0t (4. C 0' 0.4C (w3C) V V) W0 (s C Ch 0 -o-W~ v. on W) W) W) in in W) in U, ) %04 %a %a 000444 %a% a% a% aC --. rý - C- C- C- I. C-. C- w

Tests for Randomness
Datae ord
Median a 2 based on 90 observations.Number of runs above and below median a 49Expected number - 41Large sample test statistic Z - 1.79141Two-tailed probabilitg of equaling or exceeding Z - 0.0732279
Number of runs up and down a 60Expected number - 53Large sample test statistic Z a 1.74344Two-tailed probabilitg of equaling or exceeding Z - 0.0812572
NOTE: 10 adjacent values ignored.
Table 5. Test for Randomness.
-32-

Table of means for a/A Ratio
Stnd. trror Stnd. Error 95 Percent Confidence
Level Count Average (internal) (pooled s) for mean
amIS1 9 .5456999 .1166663 .0420686 .4599899 .6314109
2 9 .2342474 .0418159 .0420686 .1485364 .3199583
4 9 .1370274 .0238598 .0420686 .0513165 .2227394
6 9 .3722323 .0268131 .0420686 .2865214 .4579433
7 9 .2569363 .0761057 .0420686 .1712254 .3426473
8 9 .6653114 .0492771 .0420686 .5796005 .7510224
9 9 .2934169 .0636403 .0420686 .2077059 .3791278
10 9 .4914407 .0668974 .0420686 .4057297 .5771516
1t 9 .4881894 .0193615 .0420686 .4024785 .5739004
ventlsCV 27 .2769844 .0422934 .0242883 .2274992 .3264696
CJV 27 .3962989 .0379749 .0242883 .3468136 .4457841
UHFJV 27 .4882173 .0488772 .0242883 .4387321 .5377026
s$qn1 27 .4838056 .0506327 .0242883 .4343203 .5332908
2 27 .3616704 .0412701 .0242883 .3121852 .4111557
3 27 .3160246 .0404590 .0242883 .2665394 .3655098
amis by ventis1 CV 3 .4529807 .2283629 .0728649 .3045250 .6014364
I CJv 3 .2691593 .0112936 .0728649 .1207036 .4176150
I UHFJ 3 .9149597 .0185239 .0728649 .7665040 1.0634154
2 CV 3 .0982411 .0261028 .0728649 -. 0502146 .2466968
2 CJV 3 .2945680 .0792585 .0728649 .1461123 .4430237
2 UHFJ 3 .3099330 .0093388 .0728649 .1614773 .4583887
4 CV 3 .1279953 .0578177 .0728649 -. 0204604 .2764510
4 CJv 3 .1112081 .0494674 .0728649 -. 0372476 .2596638
4 UHFJ 3 .1718790 .0077547 .0728649 .0234233 .3203347
6 CV 3 .3293640 .0608798 .0728649 .1809083 .4778197
6 CJV 3 .3918520 .03t2123 .0728649 .2433963 .5403077
6 UHFJ 3 .3954810 .0506476 .0728649 .2470253 .5439367
7 CV 3 .0754127 .0071906 .0728649 -. 0730430 .2238684
7 CJV 3 .2710540 .0829342 .0728649 .1225983 .4195097
7 UHFJ 3 .4243423 .1788511 .0728649 .2758866 .5727980
8 CV 3 .5795197 .0844571 .0728649 .4310640 .7279754
8 CJV 3 .7262350 .0655544 .0728649 .5777793 .8746907
8 UHFJ 3 .6901797 .1089184 .0728649 .5407240 .8386354
9 CV 3 .0977669 .0214706 .0728649 -. 0506888 .2462226
9 CJV 3 .4530240 .1090268 .0728649 .3045683 .6014797
9 UHFJ 3 .3294597 .0610495 .0728649 .1910040 .4779154
10 CV 3 .3013463 .0525907 .0728649 .1528906 .4498020
10 CJV 3 .5416763 .0159849 .0728649 .3932206 .690132010 UHTJ 3 .6312993 .1468739 .0728649 .4928436 .7797550
1t CV 3 .4302330 .0296448 .0728649 .2917773 .5786887
11 CJV 3 .5079130 .0315238 .0728649 .3594573 .6563687
1t UHFJ 3 .5264223 .0045828 .0728649 .3779666 .6748780
Total 81 .3871669 .0140229 .0140229 .3585966 .4157372
Table 6a. Analysis of Variance Table for a/A Ratio.Three Factor Balanced Design.
-33-
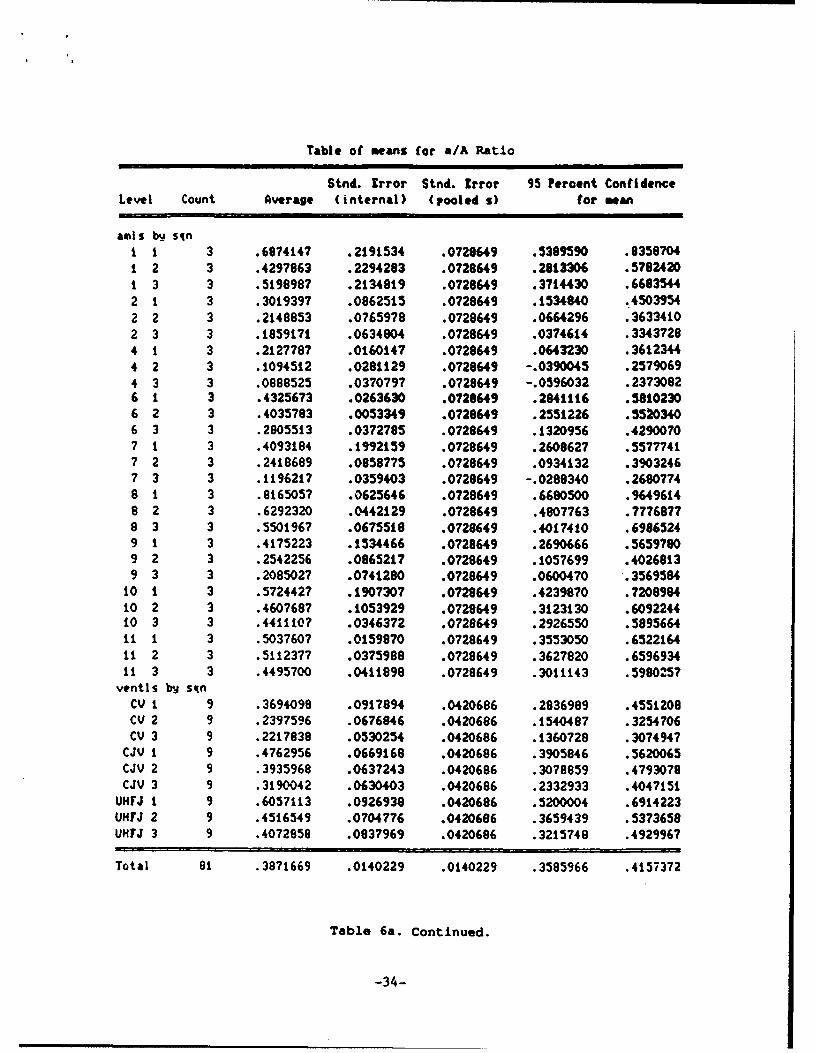
Table of means for a/A Ratio
Stnd. Error Stnd. Error 95 Percent ConfidenceLevel Count Average (internal) (pooled s) for mean
amls bu- sint 1 3 .6874147 .2191534 .0720649 .5389590 .03587041 2 3 .4297863 .2294283 .0728649 .2813306 .5782420t 3 3 .5198987 .2134819 .0728649 .3714430 .66835442 1 3 .3019397 .0862515 .0728649 .1534040 .45039542 2 3 .2148853 .0765978 .0728649 .0664296 .36334102 3 3 .1859171 .0634804 .0728649 .0374614 .33437284 1 3 .2127787 .0160147 .0728649 .0643230 .36123444 2 3 .1094512 .0281129 .0728649 -. 0390045 .25790694 3 3 .0888525 .0370797 .0728649 -. 0596032 .23730826 1 3 .4325673 .0263630 .0728649 .2841116 .58102306 2 3 .4035783 .0053349 .0728649 .2551226 .55203406 3 3 .2805513 .0372785 .0728649 .1320956 .42900707 1 3 .4093184 .1992159 .0728649 .2608627 .55777417 2 3 .2418689 .0958775 .0728649 .0934132 .39032467 3 3 .1196217 .0359403 .0728649 -. 0288340 .26807748 1 3 .8165057 .0625646 .0728649 .6680500 .96496148 2 3 .6292320 .0442129 .0728649 .4807763 .77768778 3 3 .5501967 .0675518 .0728649 .4017410 .69865249 1 3 .4175223 .1534466 .0728649 .2690666 .5659?809 2 3 .2542256 .0865217 .0728649 .1057699 .40268139 3 3 .2085027 .0741280 .0728649 .0600470 .3569584
10 1 3 .572442? .1907307 .0728649 .4239870 .720898410 2 3 .4607687 .1053929 .0728649 .3123130 .609224410 3 3 .441110? .0346372 .0728649 .2926550 .589566411 1 3 .5037607 .0159970 .0728649 .3553050 .652216411 2 3 .5112377 .0375988 .0728649 .3627820 .659693411 3 3 .4495700 .0411898 .0728649 .3011143 .5980257
ventls by sqnCV 1 9 .3694098 .0917894 .0420686 .2836989 .4551208CV 2 9 .2397596 .0676846 .0420686 .1540487 .3254706CV 3 9 .2217838 .0530254 .0420686 .1360728 .3074947
CJV 1 9 .4762956 .0669168 .0420686 .3905846 .5620065CJV 2 9 .3935968 .0637243 .0420686 .3078859 .4793078CJV 3 9 .3190042 .0630403 .0420686 .2332933 .4047151
UHFJ 1 9 .6057113 .0926938 .0420686 .5200004 .6914223UHFJ 2 9 .4516549 .0704776 .0420686 .3659439 .5373658UHFJ 3 9 .4072858 .0837969 .0420686 .3215748 .4929967
Total 81 .3 8 71669 .0140229 .0140229 .3585966 .4157372
Table 6a. Continued.
-34-
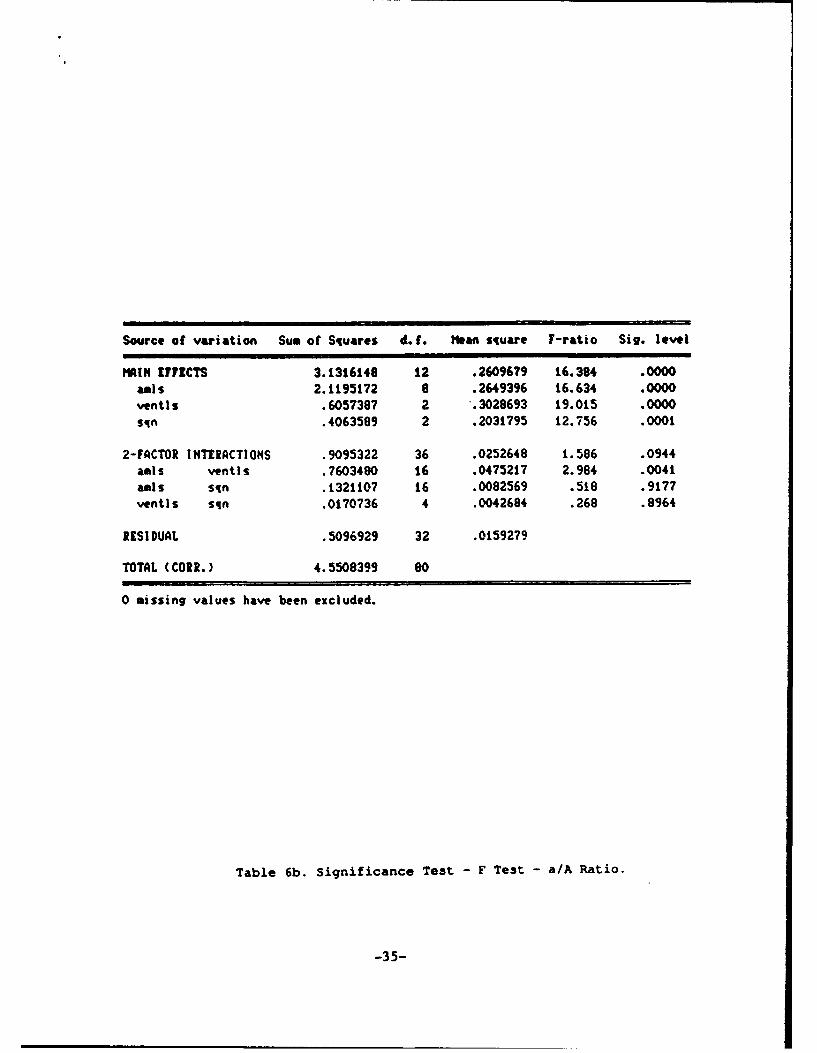
Source of variation Sum of Squares d. f. Mean square F-ratio Sig. level
MAIN EFFECTS 3.1316148 12 .26096?9 16.384 .0000amls 2.1195172 8 .2649396 16.634 .0000ventis .6057387 2 .3028693 19.015 .0000
sqn .4063589 2 .2031795 12.756 .0001
2-FACTOR INTERACTIONS .9095322 36 .0252648 1.586 .0944amls ventls .7603480 16 .0475217 2.984 .0041amls sin .1321107 16 .0082569 .518 .9177ventis sqn .0170736 4 .0042684 .268 .8964
RESIDUAL .5096929 32 .0159279
TOTAL (CORR.) 4.5508399 80
0 missing values have been excluded.
Table 6b. Significance Test - F Test - a/A Ratio.
-35-

Table of means for a/A Ratio
Stnd. Error Stnd. greor 95 Percent Confidence
Level Count Average (internal) (pooled s) for mean
axis1 9 .5457000 .1166664 .0490742 .4495153 .6418846
2 12 .213052? .0339995 .0416335: .1297544 .2963510
3 6 .1915050 .0972340 .058878? .0737034 .3093066
4 9 .1370275 .0238598 .0490742 .0408429 .2332121
6 9 .3722324 .0268131 .0490742 .2760478 .4684170
7 9 .2569364 .0761057 .0490742 .1607518 .353t211
8 9 .6653115 .0492770 .0490742 .5691269 .7614961
9 9 .2934169 .0636403 .0490742 .1972323 .3896015
10 9 .4914407 .0668975 .0460742 .3952560 .5876253
It 9 .4881894 .0193615 .0490742 .3920047 .5943740
ventlsCV 30 .2559143 .0397739 .0263313 .2032318 .3085967
CJV 30 .3704274 .0371874 .0263313 .3177449 .4231099
UH7JV 30 .4722569 .0470061 .0263313 .4195744 .5249393
amls bw ventlsI CV 3 .4529807 .2283630 .0832670 .2863841 .6195774
I CJV 3 .2691594 .0112934 .0032670 .1025628 .4357561
I UHTJ 3 .9149598 .0185237 .0832670 .7493631 1.0815564
2 CV 4 .0906745 .0199482 .0721114 -. 0536024 .2349514
2 CJV 4 .2643058 .0636925 .0721114 .1200289 .4085928
2 UHFJ 4 .2841778 .0265883 .0721114 .1399008 .4284547
3 CV 2 .0654371 .0193508 .1019809 -. 1386013 .2694755
3 CJV 2 .1196172 .0637227 .1019009 -. 0844212 .3236556
3 UHFJ 2 .3894607 .2777305 .1019909 .1854223 .5934991
4 CV 3 .1279954 .0578178 .0832670 -. 0386012 .2945921
4 CJV 3 .1112080 .0494673 .0832670 -. 0553887 .2778046
4 UHTJ 3 .1718791 .0077544 .0932670 .0052825 .3394758
6 CV 3 .3293640 .0600801 .0832670 .1627674 .4959607
6 CJV 3 .3918519 .0312120 .0932670 .2252553 .5584486
6 UHFJ 3 .3954813 .0506475 .0832670 .2288846 .5620779
7 CV 3 .0754127 .0071906 .0832670 -. 0911840 .2420093
7 CJV 3 .2710541 .0829344 .0832670 .1044575 .4376508
7 UHFJ 3 .4243425 .0788509 .0832670 .2577458 .5909391
8 CV 3 .5795198 .0844570 .0832670 .4129231 .7461164
8 CJV 3 .7262348 .0655544 .0832670 .5596382 .8928315
9 UHFJ 3 .6901800 .1099184 .0832670 .5235833 .8567766
9 CV 3 .0977670 .0214707 .0932670 -. 0688296 .2643637
9 CJV 3 .4530240 .1090268 .0832670 .2864274 .6196207
9 UHFJ 3 .3294597 .0610498 .0832670 .1628630 .4960563
10 CV 3 .3013461 .0525908 .0832670 .1347494 .4679427
10 CJV 3 .5416763 .0159848 .0832670 .3750797 .7082730
10 UWIJ 3 .6312996 .1468741 .0832670 .4647029 .7978962
11 CV 3 .4302328 .0296448 .0832670 .2636362 .5968295
1t CJV 3 .5079129 .0315238 .0832670 .3403163 .6745096
11 UHFJ 3 .5264223 .0045828 .0832670 .3598257 .6930190
Total 90 .3661995 .0152024 .0152024 .3357833 .3966158
Table 7a. Analysis of Variance Table for a/A Ratio.
Three Factor Balanced Design.
-36-

Analysis of Variance for aaurnew
Source of variation Sum of Squares d. f. Mean square 7-ratio Siv. level
MAIN EFFICTS 3.1658474 It .2878043 13.837 .0000amls 2.4629803 9 .2736646 13.157 .0000ventls .7028661 2 .3514330 16.896 .0000
2-FACTOR INTERACTIONS .7907706 18 .0439317 2.112 .0162amls ventIs .7907706 18 .0439317 2.112 .0162
RESIDUAL 1.2480114 60 .0208002
TOTAL (CORI.) 5.2046294 89
0 missing values have been excluded.
Table 7b. Significance Test - F Test a/A Ratio.
-37-

Two-Sample Analysis Results
CV UHFJV Pooled
Sample Statistics: Number of Obs. 30 30 60Average 0.255914 0.472257 0.364086Variance 0.0474589 0.0662873 0.0568731Std. Deviation 0.217851 0.257463 0.238481Median 0.178977 0.42485 0.310624
Conf. Interval For Diff. in Means: 99 Percent(Equal Vars.) Sample I - Sample 2 -0.380363 -0.052322 58 D.?.(Unequal Vars.) Sample I - Sample 2 -0.380516 -0.0521696 56.5 D.F.
Conf. Interval for Ratio of Variances: 95 PercentSample 1 ÷ Sample 2 0.340768 1.50424 29 29 D.F.
Hypothesis Test for 140: Diff = 0 Computed t statistic - -3.51345vs Alt: HE Sig. Level = 8.64609E-4
at Alpha = 0.01 so reject HO.
CJV UHFJV PooledSample Statistics: Number of Obs. 30 30 60
Average 0.370427 0.472257 0.421342Variance 0.041487 0.0662873 0.0538872Std. Deviation 0.203684 0.257463 0.232136Median 0.353796 0.42485 0.386262
Conf. Interval For Diff. in Means: 90 Percent(Equal Vars.) Sample 1 - Sample 2 -0.20204 -1.6188E-3 58 D.F.(Unequal Vars.) Sample i - Sample 2 -0.202126 -1.53256E-3 55.1 D.F.
Conf. Interval for Ratio of Variances: 95 PercentSample 1 a Sample 2 0.297888 1.31495 29 29 D.F.
Hypothesis Test for HO: Diff = 0 Computed t statistic = -1.69893vs Alt: HE Sig. Level c 0.0946903
at Alpha - 0.1 so reject NO.
CV CJV PooledSample Statistics: Number of Obs. 30 30 60
Average 0.255914 0.370427 0.313171Variance 0.0474589 0.041497 0.044473Std. Deviation 0.217851 0.203684 0.210886Median 0.178977 0.353796 0.279111
Con(. Interval For Diff. in Means: 95 Percent(Equal 'ars.) Sample I - Sample 2 -0.223533 -5.493741-3 58 D.F.(Unequal 'ars.) Sample I - Sample 2 -0.223543 -5.48327E-3 57.7 D.F.
Conf. Interval for Ratio of Variances: 95 PercentSample I z Sample 2 0.544473 2.40344 29 29 D.F.
Hypothesis Test for HO: Dift - 0 Computed t statistic a -2.10307vs Alt: HE Sig. Level x 0.0398091
at Alpha a 0.05 so reject 140.
Table 7c. Significance Test - T Test - a/A Ratio.
1 -38-

Table of means for BPF
Stnd. Irror Stnd. Error 95 Percent Confidence
Level Count Average (internal) (pooled S) (or mean
amls1 9 3029.333 840.1590 307.74585 2401.535 3657.132
2 9 2353.556 611.7464 307.74585 1725.757 2981.354
4 9 2306.000 423.9774 307.74585 1678.201 2933.799
6 9 1468.444 293.9405 307.74585 840.646 2096.243
7 9 5995.111 840.6977 307.74585 5367.312 6622.910
8 9 2783.778 846.1962 307.74585 2155.979 3411.576
9 9 7044.556 1483.1340 307.74585 6416.757 7672.354
t0 9 2549.778 574.8494 307.74585 1921.979 3177.576
it 9 3416.222 279.6631 307.74585 2788.424 4044.021ventis
CV 27 5828.852 604.3654 177.67715 5466.392 6191.312
CJV 27 2774.037 361.7821 177.67715 2411.577 3136.497
UHFJV 27 0712.704 231.6688 177.67715 1350.244 2075.163
sqn
1 27 3356.481 542.3t35 177.67715 2994.022 3718.941
2 27 3373.185 544.8269 177.67715 3010.725 3735.645
3 27 3585.926 555.7968 177.67715 3223.466 3948.386
amils by ventlsi CV 3 5693.000 1324.7313 533.03145 4605.621 6780.379
i CJV 3 2831.667 299.6922 533.03145 1744.288 3919.046
I UHFJ 3 563.333 134.1794 533.03145 -524.046 1650.712
2 CV 3 4722.000 367.4783 533.03145 3634.621 5809.379
2 CJV 3 1504.000 175.3207 533.03145 416.621 2591.379
2 UHFJ 3 834.667 76.6645 533.03145 -252.712 1922.046
4 CV 3 3922.000 294.9328 533.03145 2834.621 5009.379
4 CJV 3 1604.000 128.8462 533.03145 516.621 2691.379
4 UHFJ 3 t392.000 289.2525 533.03145 304.621 2479.379
6 CV 3 2490.667 297.3518 533.03145 1403.288 3578.046
6 CJV 3 1198.667 118.2446 533.03145 111.288 2286.046
6 UHFJ 3 716.000 304.0839 533.03145 -371.379 1803.379
7 CV 3 7814.333 1528.1935 533.03145 6726.954 8901.712
7 CJV 3 6939.667 467.2659 533.03145 5852.288 8027.046
7 UHFJ 3 3231.333 86.2947 533.03145 2143.954 4318.712
8 CV 3 5785.667 1218.6312 533.03145 4698.288 6873.046
8 CJV 3 1564.000 421.5286 533.03145 476.621 2651.379
8 UHFJ 3 1001.667 303.7600 533.03145 -85.712 2089.046
9 CV 3 12903.333 155.2443 533.03145 11815.954 13990.712
9 CJV 3 4536.333 297.1365 533.03145 3448.954 5623.712
9 UHFJ 3 3694.000 602.0872 533.03145 2606.621 4781.379
t0 CV 3 4790.333 271.6305 533.03145 3702.954 5877.712
10 CJV 3 1534.333 305.3754 533.03145 446.954 2621.712
10 UHFJ 3 1324.667 149.4259 533.03145 237.288 2412.046
11 CV 3 4338.333 306.0405 533.03145 3250.954 5425.712
11 CJV 3 3253.667 82.5355 533.03145 2166.288 4341.046
1! UHFJ 3 2656.667 333.5353 533.03145 1569.288 3744,046
Total 81 3438.531 102.5820 102.58195 3229.265 3647.797
Table ea. Analysis of Variance Table - Flow Through Bronchopleural
Fistula - Three Factor Balanced Design.
-39-

Table of means for BPF
Stnd. Error Stnd. Error 95 Percent ConfidenceLevel Count Average (internal) (pooled s) for mean
amis bq sqnI 1 3 2281.000 994.9675 533.03145 1193.621 3368.3791 2 3 3258.000 1649.8948 533.03145 2170.621 4345.3791 3 3 3549.000 2077.7683 533.03145 2461.621 4636.3792 i 3 2257.667 1213.5161 533.03145 1170.288 3345.0462 2 3 2625.667 1391.6449 533.03145 1538.288 3713.0462 3 3 2177.333 M012.1068 533.03145 1069.954 3264.7124 1 3 2037.000 728.0730 533.03145 949.621 3124.3794 2 3 2319.333 828.3883 533.03145 1231.954 3406.7124 3 3 2561.667 933.7088 533.03145 1474.288 3649.0466 1 3 1919.667 577.2008 533.03145 832.288 3007.0466 2 3 1215.333 455.4047 533.03145 127.954 2302.7126 3 3 1270.333 585.4919 532.03145 182.954 2357.7127 3 6896.667 2081.7988 533.0331:5 5809.288 7984.0467 2 3 4920.667 855.3098 533.03i45 3833.288 6008.0467 3 3 6168.000 1554.7566 533.03145 5080.621 7255.3798 1 3 2382.667 908.!897 533.03145 1295.288 3470.0468 2 3 3238.667 2429.6649 532.03i45 2M51.288 4326.0468 3 3 2730.000 1295.8175 533.03145 1642.621 3617.3799 1 3 6410.667 3119.5772 533.03145 5323.288 7498.0469 2 3 7113.333 2947.5448 533.03i45 6025.954 8200.7129 3 3 7609.667 2759.2587 533.03145 6522.288 8697.046
10 1 3 2454.667 1039.9174 533.03145 1367.288 3542.04610 2 3 2621.667 1369.6399 533.03i45 1534.288 3709.04610 3 3 2573.000 1000.3519 533.03145 1485.621 3660.379ii 1 3 3568.333 440.4242 533.03145 2480.954 4655.7121i 2 3 3046.000 Z22.0003 533.03i45 1958.621 4133.3791, 3 3 3634.333 606.7378 533.03145 2546.954 4721.712
ventls by sqnCV 1 9 5591.889 1160.4807 307.74525 4964.090 6219.688CV 2 9 5914.000 1046.6809 307.74585 5286.201 6541.799CV 3 1 5980.667 1052.7103 307.74535 5352.868 6608.465
CJV 1 223.:: 3.376 307. 745 20.:2 :49.910
-CV 2 C5256 6 :S936 IC-. 71 cc 1-225."7 57l..5CJV --2 2230..444 733.-I39 30 .74,53 2262.646 a.2
UHFJ ' 1609.444 377.0608 307.745C7 9EI.646 2237.243UHFJ 2 1642.000 385.0691 307.74533 10...4. -2269.799U~47J 3 9 3667 47;. e430 2 C -.7 -1 5 4M 1,'6 54.465
Total 81 3438.531 102.5820 102.58195 3229.265 3647.797
Table Ba. Continued.
-400-
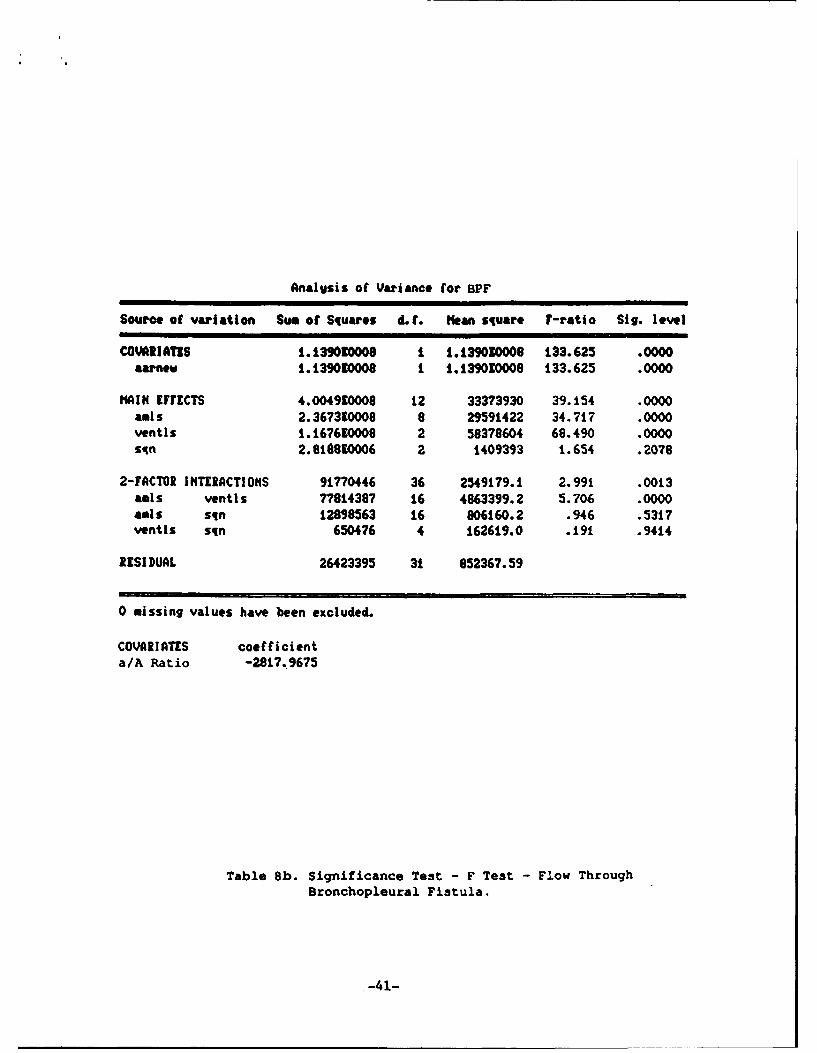
Analgsis of Variance for BPF
Source of variation Sum of Squares d. f. Mean square F-ratio Sig. level
COVAhI!AT1S 1.139010008 I 1.139030008 133.625 .0000aarnew 1.139030008 1 1.139010008 133.625 .0000
MAIN EFFECTS 4.004910008 12 33373930 39.154 .0000amls 2.367390008 8 29591422 34.717 .0000ventls 1.167610009 2 58378604 68.490 .0000sqn 2.81t810006 2 1409393 1.654 .2078
2-FACTOR INTERACTIONS 91770446 36 2549179.1, 2.991 .0013amls ventls 77814387 16 4863399.2 5.706 .0000amls sqn 12898563 16 906160.2 .946 .5317ventIs sqn 650476 4 162619.0 .191 .9414
RESIDUAL 26423395 31 852367.59
0 missing values have been excluded.
COVARIATES coefficienta/A Ratio -2817.9675
Table 8b. Significance Test - F Test - Flow ThroughBronchopleural Fistula.
S-41-
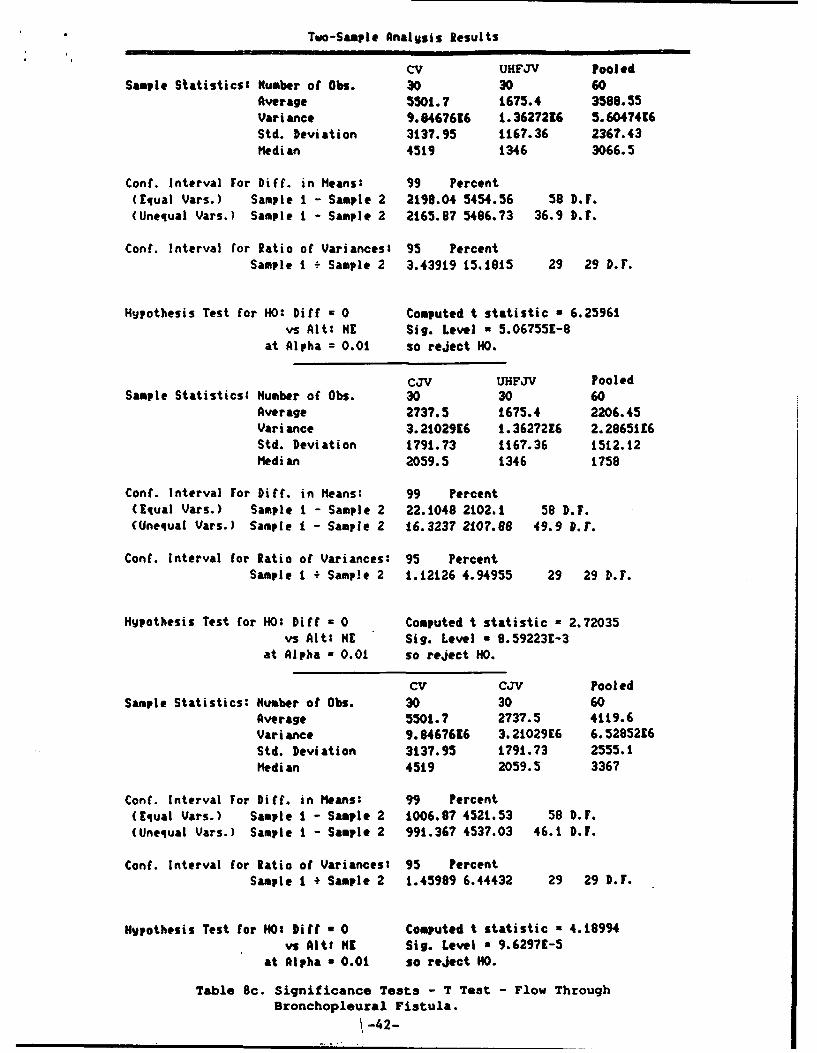
Two-Sample Analysis Results
CV UHFJV PooledSample Statistics' Number of Obs. 30 30 60
Average 5501.7 1675.4 3588.55Variance 9.8467616 1.3627216 5.6047416Std. Deviation 3137.95 1167.36 2367.43Median 4519 1346 3066.5
Conf. Interval For Diff. in Means: 99 Percent(Equal Vars.) Sample I - Sample 2 2198.04 5454.56 58 D.F.(Unequal Vars.) Sample i - Sample 2 2165.97 5486.73 36.9 D.F.
Cont. Interval for Ratio of Variances: 95 PercentSample I - Sample 2 3.43919 15.1815 29 29 D.F.
Hypothesis Test for HO: Diff - 0 Computed t statistic a 6.25961vs Alt: HE Sig. Level - 5.067551-8
at Alpha = 0.01 so reject HO.
CJv UHFJV PooledSample Statistics: Number of Obs. 30 30 60
Average 2737.5 1675.4 2206.45Variance 3.2102916 1.3627216 2.2865116Std. Deviation 1791.73 1167.36 1512.12Median 2059.5 1346 1758
Conf. Interval For Diff. in Means: 99 Percent(Equal Vars.) Sample I - Sample 2 22.1048 2102.1 58 D.F.(Unequal Vars.) Sample i - Sample 2 16.3237 2107.88 49.9 D.r.
Conf. Interval for Ratio of Variances: 95 PercentSample I ÷ Sample 2 1.12126 4.94955 29 29 D.F.
Hypothesis Test for HO: Diff = 0 Computed t statistic a 2.72035vs Alt: HE Sig. Level - 8.592231-3
at Alpha a 0.01 so reject HO.
CV CJV PooledSample Statistics: Number of 0bs. 30 30 60
Average 5501.7 2737.5 4119.6Variance 9.8467616 3.21029E6 6.5285216Std. Deviation 3137.95 1791.73 2555.1Median 45t9 2059.5 3367
Cont. Interval For Diff. in Means: 99 Percent(Equal Vars.) Sample I - Sample 2 1006.87 4521.53 58 D.F.(Unequal Vars.) Sample I - Sample 2 991.367 4537.03 46.1 D.F.
Con(. Interval for Ratio of Variances: 95 PercentSample I + Sample 2 1.45989 6.44432 29 29 D.F.
Hypothesis Test tar HO: bitt a 0 Computed t statistic a 4.18994vs AltM HE Sig. Level a 9.6297E-5
at Alpha n 0.01 so reject HO.
Table 8c. Significance Tests - T Test - Flow ThroughBronchopleural Fistula.
! -42-

Cl)
LUz
LLJ-
LLI-
0D 0 CD 0 o 0
z U 0 IL
F~0z>LLJ a) x 0
0. -r -U. 0 cis o~
WU I. > LL m L > LL
w
Co 0z LC.)
-43-

APPENDIX I
Following the development of our high frequency jet ventilator, laboratory
tests were conducted to determine the ventilator's capabilities. The ventilator
was tested on rigid systems and systems whose compliance was similar to that of
the lung. Ventilation was also done in a system consisting of high
resistance/low compliance chamber in parallel with high compliance/low
resistance chamber. This scenario is represenative of the most difficult
patients to ventilate in an ICU setting. The studies demonstrated that the
ventilator was capable of delivering tidal volumes and flows equal to or
surpassing existing jet ventilators. The ventilator adds on extended frequency
both on the high and low side increasing its flexibility over standard jet
ventilators. Two hundred fifty (250) to five hundred (500) ml of C02 per
minute were pumped into the jars or the elastic lung models. At all
frequencies our ventilator was able to achieve adequate ventilation as
demonstrated by equilibrium PCO 2 < 5%.
Following this, the first of three groups of animal testing was begun. The
pig was chosen as our test animal because its lungs are less compliant than
those of a human and there is less collateal ventilation between alveoli,
creating a situation similar to a diseased human lung. Five 40-pound pigs were
anesthestisized using nembutal. Arterial and venous lines were placed. The
pigs were monitored electrocardiographically. Ventilation was accomplished with
FI0 2 of .21. The frequency of the jet ventilator was set at either 10 or 20
Hz. Inspiratory time ratio was 30% and the driving pressure (20-50 PSI) was
set to achieve adequate ventilation.
Four pigs were ventilated for 48 hours, one for 30 hours. Animals were
monitored at frequent intervals with respect to arterial blood gases, blood
pressure, and hemodynamic side effects. At the end of the test period, the
animals were sacrificed and autopsies of the lung were performed to determine
the presence of untoward effects from the jet ventilation. The studies
demonstrated no evidence of barotrauma was present at the end of 48 hours of
ventilation. Arterial blood pressures and hemodynamic status were stable
throughout. Arterial blood gases demonstrated that the alveolar-arterial
gradient was significantly smaller on our ventilator than on conventional
ventilation. These data suggested that our ventilation may have eliminated a
significant degree of ventilation perfusion mismatching. In one pig a mild
-44-

tracheitis developed at the end of the endotracheal tube. This was at least in
part due to lack of humidification of the gases used during this particular
experiment. These animals were compared to a previous study performed at
Hartford Hospital with conventional ventilators. The pigs ventilated
conventionally demonstrated significant evidence of barotrauma. Our conclusion
from the study is that our ventilator can ventilate animals for a prolonged
period of time and maintain adequate arterial oxygen tensions and that
atelectasis and other forms of trauma to the lung are not common with this mode
of ventilation. In fact, when compared to previous studies done on
conventional ventilators, there appeared to be less trauma to the animal during
this form of ventilation.
The next experiment was performed on five 40-pound pigs. The pigs were
anesthesized with nembutol. Arterial and venous lines were introduced. A piano
wire was inserted bronchoscopically into either the right or left main stem
bronchus and was allowed to pass through the lung parenchyma and out through
the chest wall. Over this piano wire a catheter with a known diameter tip was
then passed through the chest wall and was bronchoscopically observed to
occlude an airway of similar size to the measured diameter of the tip of the
catheter. These catheters, usually 3 or 4, were then connected to pressure
transducers and airway pressure measurements were made during various maneuvers
on the high frequency jet ventilator. The animals were ventilated for varying
times from I Hz to 30 Hz, and pressure measurements were taken from the
endotracheal tube as well as from the peripheral catheters which were inserted
according to the protocol. ABGs were monitored on all frequencies. All animals
developed broncho-pleural fistulae due to the passing of the piano wire through
the chest wall. Chest tubes were inserted to compensate. In spite of the fact
that these animals had bilateral broncho-pleural fistulae, adequate ventilation
was maintained in all experimental animals at all frequencies. Airway pressure
measuremnts were obtained and allowed us to observe the effects of increasing
frequency and change in inspiratory time with respect to airway pressure and
arterial blood gas analysis.
Another sequence of experiments included a protocol in which 80-pound pigs
were given intravenous oleic acid to induce an ARDS-like syndrome. A
comparison was made between conventional ventilation and our ventilator-with
respect to hemodynamic variables, oxygenation, and degree of decompensation for
a given lung injury. Twenty animals were studied. The data showed that the
-45-

mean cardiac output was higher using ultra-high frequency jet ventilation as
compared to conventional ventilation with a significance level of 0z-.01. The
a/A ratio was better in the ultra-high frequency ventilation group and QS/QT
(the left to right shunt) was lower, but in the small group of animals we were
unable to reach statistical significance in the variables.
-46-

(MOUTH) Z, M
--------------- -------------------- I-
I IS--
LARGEAND
UPPERAIRWAYS
Z ZRSI II II I
I I* I
LUNGS Zpp* I
I I
I I T I*,I
S~Cw ,
I -----
-= ATMOSPHERE Z=IMPEDANCE
IN THE EVENT OF ABRONCHOPLEURAL FISTULA
THE LUNG IS OPEN TOTHE ATMOSPHERE AND
THE CAPACITANCEBECOMES VERY LARGE.
Fig. 1. Electrical Analog of Lung System.
-47-

SPercent Confidmn•Intevals for Facto, ?Iws
0.62
CV - Conventional Ventilator
CJV -Conventional Jet Ventilator (2.0 Hz)
UHFJV - Ultra High Frequency Jet Ventilator (7.5 Hz)0.52 . ............... -................................... ................
0
a 0.42 . .................................. ................. ................ .
0.32 . ............. - -:'- ................. :.................. ................
0.22
CV CJV UHIFJVVENTILATOR
I
Fig. 2. a/A Ratio for Different Ventilatora.
-48-

95 Peroent CentidenaeIntervals tar ractor hwis
0.56
0.51 . ....................................................................
0.46 . .. . . ..... ............................... ...... ...............
0
0.36 . ....................................
0.31 . ................................ 4• "• ................. "................
0.261 4-_ __ _
1 2 3SEQUENCE
Fig. 3. a/A Ratio for Different Sequences.
-49-

95 percent ConfidlaceIntervals (or Factor Ilws
0.8
0.
Cr~~ ~ 0. .... I....... . . ........... A I...oT
0.2 ............ {...... ...........
0 I I1 2 3 4 6 7 8 9 10 tt
ANIMAL
Fig. 4. a/A Ratio for Different Animals.
-50-

99 Percent COnfidenceIntervals for Factor Means
0.61
CV - Conventional Ventikltor
CJV -Conventional Jet Ventilator (2.0 Hz)UHFJV-Ultra High Frequency Jet Ventilator (7.5Hz)
0 .51 . . . . . . . . . . . . . . . . . . . . . . . . . . . . . .
0
40.31 . .................................................... ...............
0.2
0.21 . . .. . .. . .. . .. . .. . .. . .. .. . .. . .. . .. . .. . .. .
CV CJV UHFJVVENTILATOR
Fig. 5. a/A Ratio for Different Ventilators.
-51-
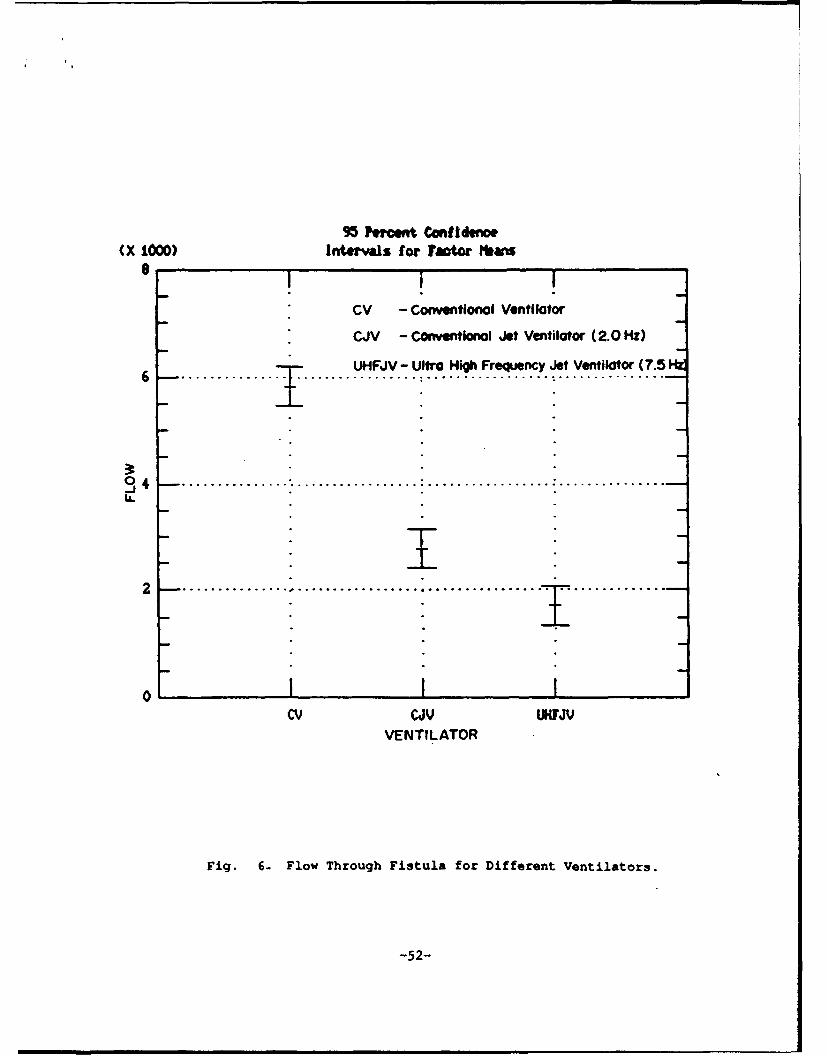
95 PNwcet Confidence(X 1000) Intervals for Factor ?abs
8 I • I|
CV - Conventional Ventilator
CJV - ConventIonal Jet Ventilator (2.0 Hz)
6...............UHFJV - Ultra High Frequency Jet Ventilator (7.51W6 ... . . . . . ............... . . ................ . ...............
j0 4 . .. .................... ............ ......... ....... . ............. •.. I
U.
2 _ . ........................................ .....- ......._ii2 1
0Cv CJV UHFJV
VENTILATOR
Fig. 6- Flow Through Fistula for Different Ventilators.
-52-
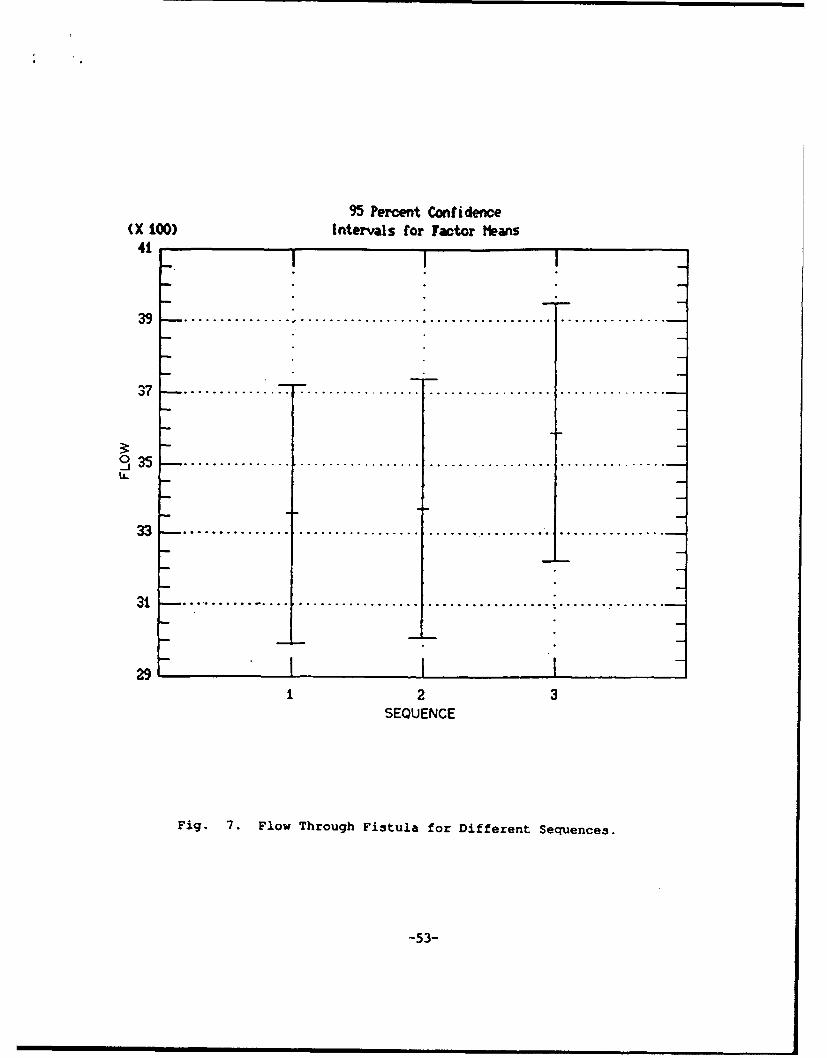
95 Percent Confidence(X LOO) Intervals for factor Means
41 •
39 ...... ° °. ... .. . . .. . . . .. . . .. . . . ............... •
37 .. . . .. . .. .. . . . . .. . .. . . . . . . . .. . .. . .. .
3:335.-................ ................. ..................................
I.L
S• J ''* ''' ''' "i .o .... ....... o3 ............... ................ .. .............. ...... ,...... .2 3
SEQUENCE
Fig. 7. Flow Through Fistula for Different Sequence3.
-53-
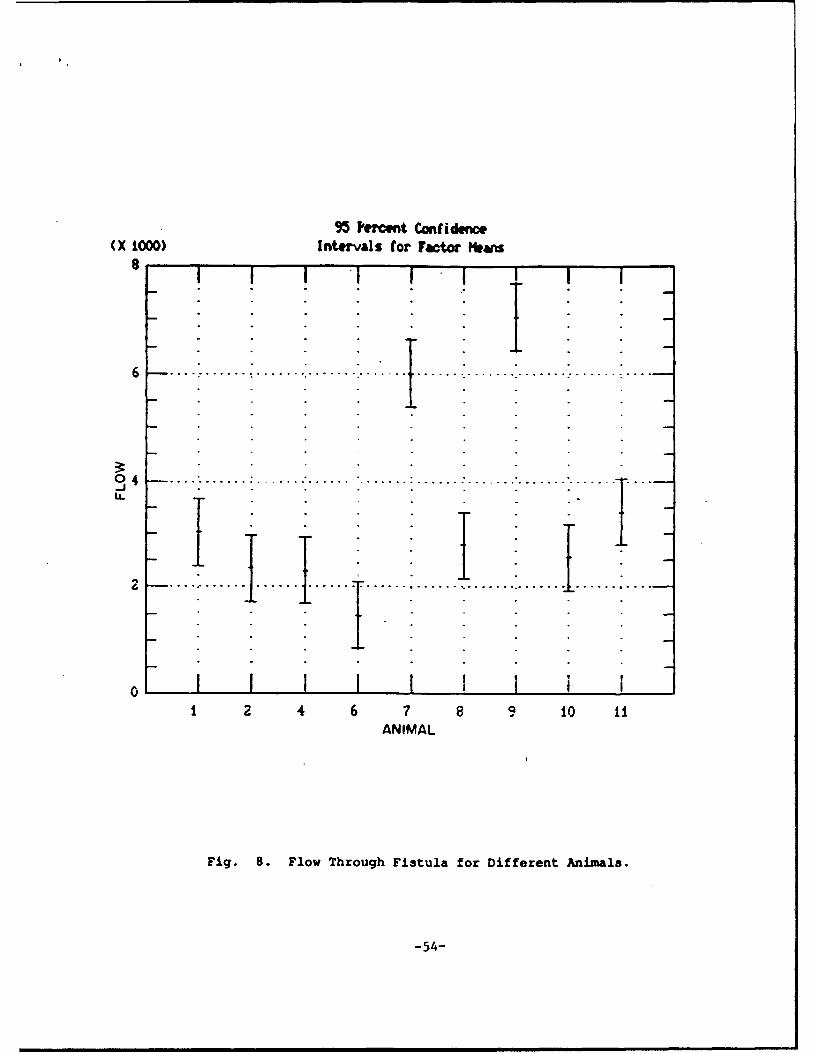
95 Percent Conidence(X 1000) Intervals for Factor Hmans
04
6..I I II; I
0 I 1 Ii 2 4 6 7 8 9 10 II
ANIMAL
Fig. 8. Flow Through Fistula for Different Animals.
-54-

95 tConfidencIntetsls ftr fator HHems
17. . .. ............. ............ .... ... .. .
17.
0
S.I.
0 .o5 . ...............- "..................; ................. •................
15.
C v v UIFJVVENTILATOR
Fig. 9- 02 Delivery for Different Ventilators.
-55-

95 Percent Cnfide¢mIntervls for Fact• b amIs
too
1T0 . ............................... . .................................
":i i60 . ................................ . ................ . ...............
1501OO0 . . ...... o...... .................. o o o.... ............ ....... ......... i
14 , I IIcv cJv UHFJV
VENTILATOR
Fig. 10. 02 Content for Different Ventilators.
4-56-
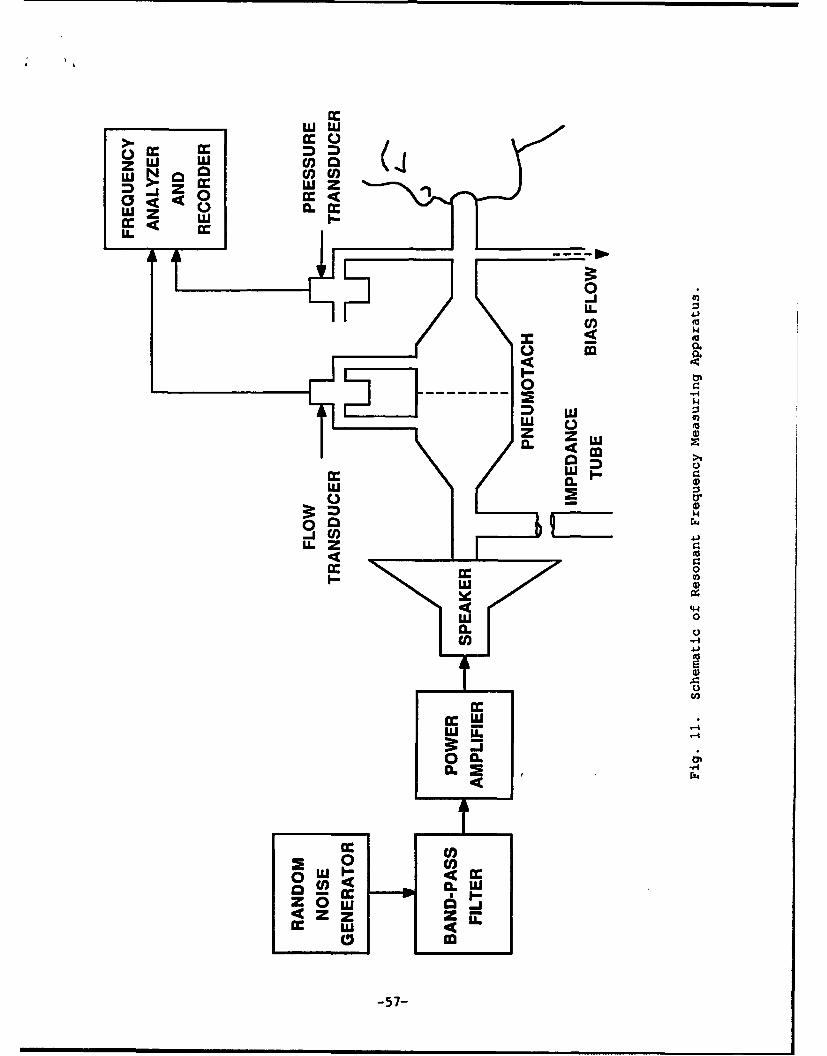
111W
cr. c
ZI W a.
LL..
t 0
a. ZCL -
U)U
oa.14 ~'44
CL
Z~w
0 U)
C, 0
-57-
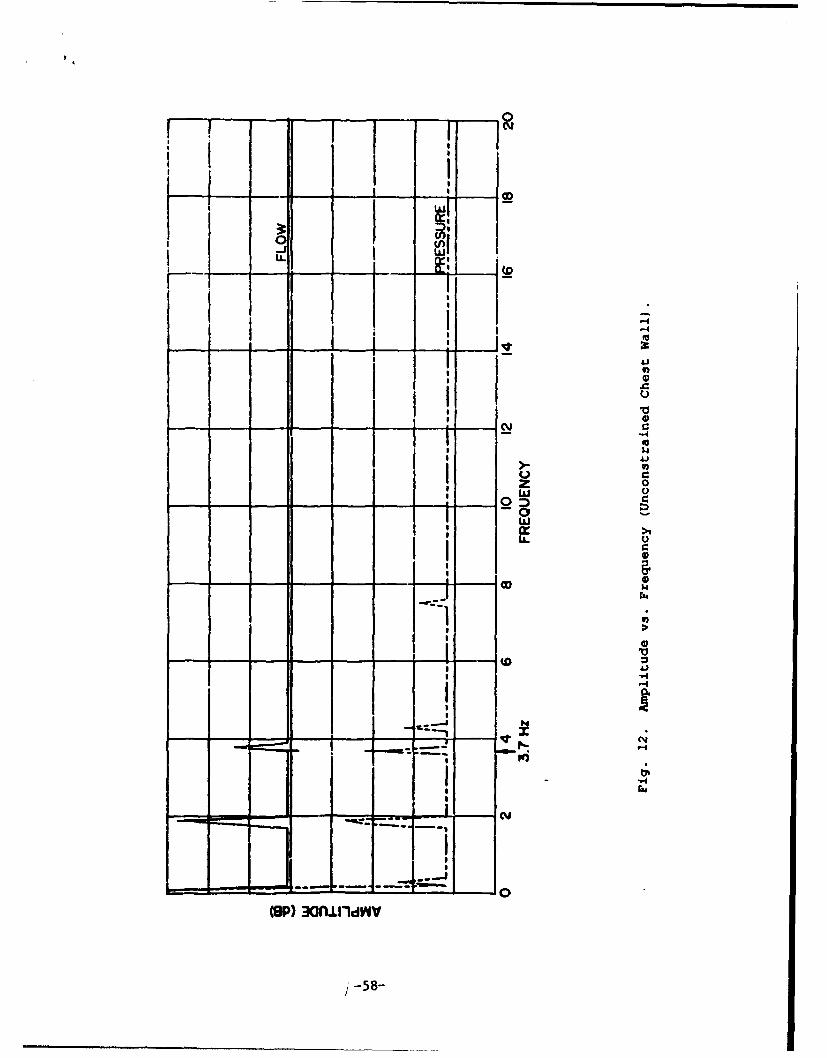
LI w
C)0
CYU
IOP 3G U)d
-58-

.......
. . ......
;Z34
.2m 0
-59-

0U.
C-4
40
C'.4
0
V
'.4
_600