ad-a267 711 if ii~ii (iii ~i ~jjapril !ii j ris dt … · 1.2 objectives the scientific objective...
TRANSCRIPT

AD-A267 711
If (III !II J ~II ii~II ~I ~JJApril 16. 1993
RIS DTPARTICIPATION IN: "-Ft FLE C,
THE UL G1 0" 1 -3 9MADONA
EXPERIMENTS: L(Meteorology and Diffusion Over Non-uniform Areas)
UK PORTON DOWN
7-25 SEP. 1992.
1. & 2. Interim Data and Analysis Report on:
HIGH-RESOLUTION IN-PLUME CONCENTRATION FLUCTUATIONS
MEASUREMENTS USING LIDAR REMOTE SENSING TECHNIQUE
by
Principal Investigator:Torben Mikkelsen, Ph.D
Associate Investigators:Hans E. Jergensen , Soren Thykier-Nielsen, Soren W. Lund and
Josep Moreno Santabarbara
Department of Meteorology and Wind EnergyRiso National Laboratory, DK-4000 Roskilde, Denmark
Sponsor:U.S. Army, Environmental Sciences Branch, "R/D 6858-EN-09"
Contract No. DAJA45-92-M-0344'
, .-.-.. " U 93-17901A. . . . . ...

DISCLAIMER NOTICE
THIS DOCUMENT IS BEST
QUALITY AVAILABLE. THE COPY
FURNISHED TO DTIC CONTAINED
A SIGNIFICANT NUMBER OF
PAGES WHICH DO NOT
REPRODUCE LEGIBLY.

Contents
1 Introduction
1.1 Summary1.2 Objectives1.3 Background1.4 Reporting1. 5 Acknowledgements
2 Technical describtion
2.1 Mean and turbulence meassureinents from twomicro-meteorological masts.
3 Lidar measurements of surface released smoke plumes
4 Modelling with LINCOM/RIMPUFF
RA .q

1 Introduction
1.1 Summary
The Department of Meteorology and Wind Energy at the RisoNational Laboratory in Denmark participated and supported:
The MADONA:
jp~eteoLoloqicl And Diffusion Over Non-uniform Area)
Trials
Conducted at
Porton Down, Salisbury
CBDE-UK; Sep. 7 - 25 1992.
Riso contributcd with the following activities:
1) Continuous smoke dissemination from ground level sources.
2) High-resolution protile-measurements of instantaneousplume dispersion and concentration fluctuations by use ofa mini-LIDAR system. (Remote sensing)
3) Micro-meteorological measurements of wind and temperaturequantities from two 7 meter tall met-towers equipped with20 Hz sonic anemometers for characterization of the meanand turbulent state of the boundary layer.
4) Mean wind and diffusion mL.elling using our real-timediagnostic models LINCOM/RIMPUFF.

1.2 Objectives
The scientific objective for our participation in MADONA was toinvestigate fundamental questions regarding the statisticalproperties of the instantaneous concentration fluctuations insmoke plumes and puffs. The joint-venture Porton Down ex-periments, with international participation and supportfacilitated this objective. Modelling objectives includedinvestigation and experimental evaluation of flow and diffusionmodelling based on our LINCOM/RIMPUFF real-time codes.
With our high-resolution mini-lidar system, sequential measure-ments (1/3 Hz) were obtained of the instantaneous cross windconcentration profiles at fixed down wind distances from thesource. The source consisted of ground level continuous smokereleases and elevated smoke puff releases.
The cross wind concentration profiles were measured with aneffective spatial resolution of 1.5 meter.
From the conducted puff and plume diffusion experiments, we haveby post-processing and data reduction obtained important con-centration fluctuation statistics including:
Mean- and variance profiles, intermittency profiles,probability distribution functions, dispersion parameters(including instantaneous puff width). In addition we dis-tinguish statistics obtained in a fixed frame (absolutediffusion), and center-of-mass frame (relative diffusion).
Derived statistics (to be performed) include:
Dispersion coefficients, and their dependence on samplingtime (from instantaneous to length of experiments, typi-cally 1-hour.)
Two-particle distance-neighbor functions yielding infor-mation about the instantaneous spatial correlation func-tion of in-plume fluctuations.
Extreme statistics of exeedance of certain referencelevels, and the (ensemble mean) duration of such exeedan-ces.
Our Lidar based concentration fluctuation measurements weresupported by our micro-meteorological observations from twotower mounted sonic anemometers, in addition to the joint meanwind and turbulence data gathered simultaneously by the partici-pating groups at Porton Down.

1.3 Background:
Within the CEC Radiation Protection Research Programme forNuclear Safety, Riso is commissioned to conduct reference smokeplume dispersion experiments, where we based on the mini-LIDARfacility are studying concentartion fluctuations for dispersionmodel evaluation and model uncertainty assessments. Also, we areconducting full scale refeLence and training experimental datafor the CEC supported real-time decision support system RODOS,where atmospheric dispersion is a key element.
The layout and experimental set-up for the Porton Down MADONAexperiments, including the many other participants` provided anunique opportunity to combine and jointly perform alreadyscheduled uncertainty and evaluation experiments with thegeneral objectives for MADONA.
Our entire scientific outcome from the smoke diffusion trial areconsequently offered for inclusion in the MADONA data base,including the basic scientific analysis as described above.All raw and statistical analyzed data from our LIDAR and micrometeorological measurements are shared. The latter includes 10-min mean and turbulent scaling parameters such as variances,energies, shear stress and heat flux (Monin-Obukhov length).
1.4 Reporting:
This is a first interim data report describing the experimentalsetups, time periods and atmospheric conditions for the MADONAtrials.
A final report, including the statistical analysis and inter-pretation of results will be available end of august 1993.
1.5 Acknowledgements:
Riso obtained additional financial support for expensesassociated with moving our experimental facilities and personnelto Porton Down,UK.
Our participation in the MADONA trials were hereafter madepossible by support from the CEC Radiation Protection ResearchProgramme, DGXII, under contract No. B17-0017-C, and by a grantfrom the US Army Research Branch, London, under contractNo.DAJA45-92-M-0344. Mr. Ron Cionco at the U.S. Army AtmosphericScience Laboratory, White Sands, MN., USA and Mr. Jerry Comatiat the US Army Research Branch, London, are gracefully ack-nowledged.

2 Technical describtion
2.1 Mean and turbulence measurements from two micro-meteoro-logical masts:
Two 7 meter high meteorology mast were erected and instrumentedat the Porton Down site near the Westerly source point, see Fig.1I.1. (Porton Down landscape seen from South-West.)
The met-towers were each equipped with Kaijo Denki DAT 300 sonicanemometers in order to obtain both mean-profile and turbulencescaling parameters for the MADONA dispersion trials.
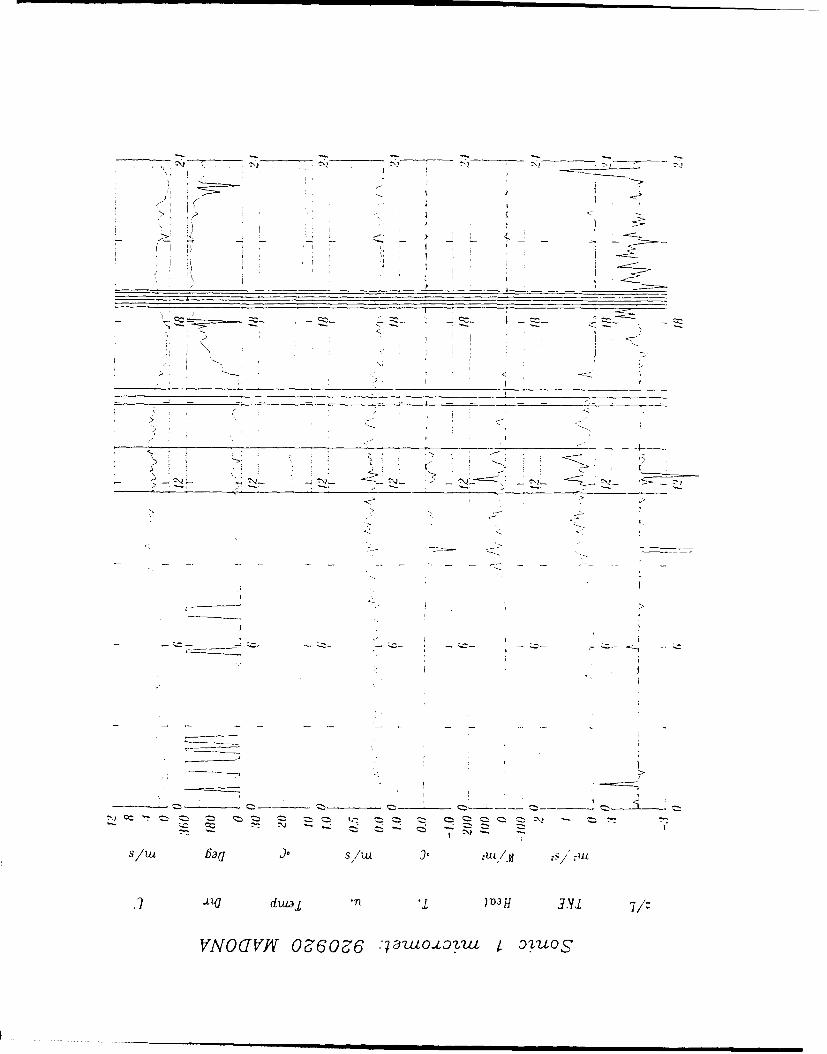
Appendix 11.1: Contains directly measured mean and turbulencequantities, including:1) Mean Wind speed,2)Direction,3) Turbulent Kinetic Energy, 4)Stress, 5) Sensible Heatflux, 6) Monin-ObukhovStability parameters and 7) Temperature statis-tics.
Appendix 11.2 Comparison between 5 and 10 min averaged statis-tics for day: 23/9 192; sonic 1 and sonic 2.
The measurements were obtained from two acoustic three-dimen-sional sonic-anemometer/thermometers (Kaijo Denki type DAT-300),located at 7 meter level above the floor.
Running continuously during the entire experimental campaign,they provided us with real-time, on-line surface layer tur-bulence statistics of the most important scaling parameters fordispersion. By use of our PC-based on-line data acquisitionsystem and asqcciated computers, we measured and calculated (inreal-time) the entire co-variance matrix of the fluctuating qu-antities u',v',w' and TI (by the correlation-method), and fromhere, the velocity and temperature intensities, the shear-stressand the sensible heat flux was deduced at 10-min intervals inreal time. With the additional information of the inversion hei-ght from rawin-sonde balloons (not provided by Riso), the sonicanemometer data enables us to calculate the very importantscaling parameter for convective conditions: W..
Our sonic-based on-line "turbulence monitoring-system" providesthe experimenters and the project-manager with real-timemeasurements of the atmospheric stability and turbulence stateat Porton Down, concurrently with each diffusion test andprovided also direct measurements of the variances and fluxesrequested for the subsequent model evaluation study.
The Riso Sonic-DAS-system was put in continuous operationthroughout the whole experimental period.Our directly measured,10-min averaged quantities included:<u'u'>, <u'v'>, <u'w'>,<u'T'>, <v'v'>, <v'w'>, <v'T'>, <w'w'>,<w'T?>, <T'T'>, inaddition to the mean wind speed and mean temperature.
The accuracy of the sonic anemometer/thermometer type DAT 300is, according to the manufacturer (Kaijo Denki Co.): +/- 1% onmeasured velocity and temperature signals, the resolution is 0.5cm/s and 0.025 K, respectively. It measures all signals 20 timespcr second and has a 10 Hz low-pass output filter. For mea-',irements taken 7 meter above the ground, this instrument will

provide very adequate resolution of the turbulent signals, bothwith respect to spatial and temporal resolution: The on-linedata acquisition system (DACSYS) point-samples the four signalsU,V,W and T at a rate of 10 Hz, and subsequently calculates theco-variance matrix after each 10-min period based on thecorresponding 6000 readings of each signal.
The directly measured time series (consisting of four times 6000measurements each per 10-min period) are also stored forsubseauent spectral analysis.
Data-, both mean and of the turbulence quantities, have alreadybeen processed, stored and backed-up as 10-min average quanti-ties. Additional to visual inspection of raw time series, moreobjective quality assurance in accordance with Hojstrup, 1993will be performed on central data periods.
2.2 High-resolution Time-series and Spectral Analysis:
Additional spectral analysis can at request be performed on 10-min average meteorological quantities. For each of the scheduleddiffusion tests, the following is available on request:
I. Time series plots of high-resolution (10 Hz) wind and tem-perature signals from the sonic anemometer.
2. Time series of short-time averaged (1-min running mean)quantities of wind speed, direction, turbulence level,shear stress and heat flux.
3. Spectral analysis of the three wind (u',v',w') and tempe-rature (T') signals.
This information is of importance in a subsequent modelling eva-luation. in particular for:
Gaining insight into the fine scale temporal evaluation ofthe boundary flow and turbulence in the valley during eachdiffusion test.
II gaining insight into which turbulent scales are of impor-tance and most energetic, and consequently responsible forthe exchange and diffusion processes, and
IiI Providing detailed turbulence measurements at the scurcepoint for use in the subsequently planned model simulationof the experiments.
We provide on request, for each of the successfully performeddiffusien tests:
re i. 10-Hz digitized raw data of U,V,W and T on PC-dis-kette.
re ii. Time series plots of sonic data and of thecorrespond- ding 1-min running mean turbulencequantities.
re iii. Plots of the three velocity spectra and the tempera-ture spectrum f1uin 0.001 to 5 Hý'

3 LIDAR-measurements of surface-released smoke plumes:
The Riso National Laboratory operates a mini-LIDAR system fordetermination of instantaneous concentration profiles insidedispersing aerosol-plumes.
The system yields high spatial and temporal resolution measure-ments of in-plume concentration fluctuations, from whichimportant and basic scientific plume dispersion characteristicscan be inferred.
For the MADONA trials, we provided a powerful and sturdy ar-tificial smoke generator, which produced ground-level releasesof smoke plumes or elongated puffs.
The smoke consisted of non-toxic white plume of sub-micronaerosols. The aerosols were conglomerated SiO 2 and NH iOH thatis detectable by our 1.064 A lidar system. In this way,measurements of the cross-wind near-ground concentrationprofiles were obtained at various distances downwind.
During evenings and nights with stable atmospheric conditions,the lidar system can pick up the smoke plume concentrations outto several kilometers from the source point.
At Porton Down, the mini-LIDAR system measured instantaneous"snapshots" every 3. or 5. second of the aerosol back-scattercross-section.
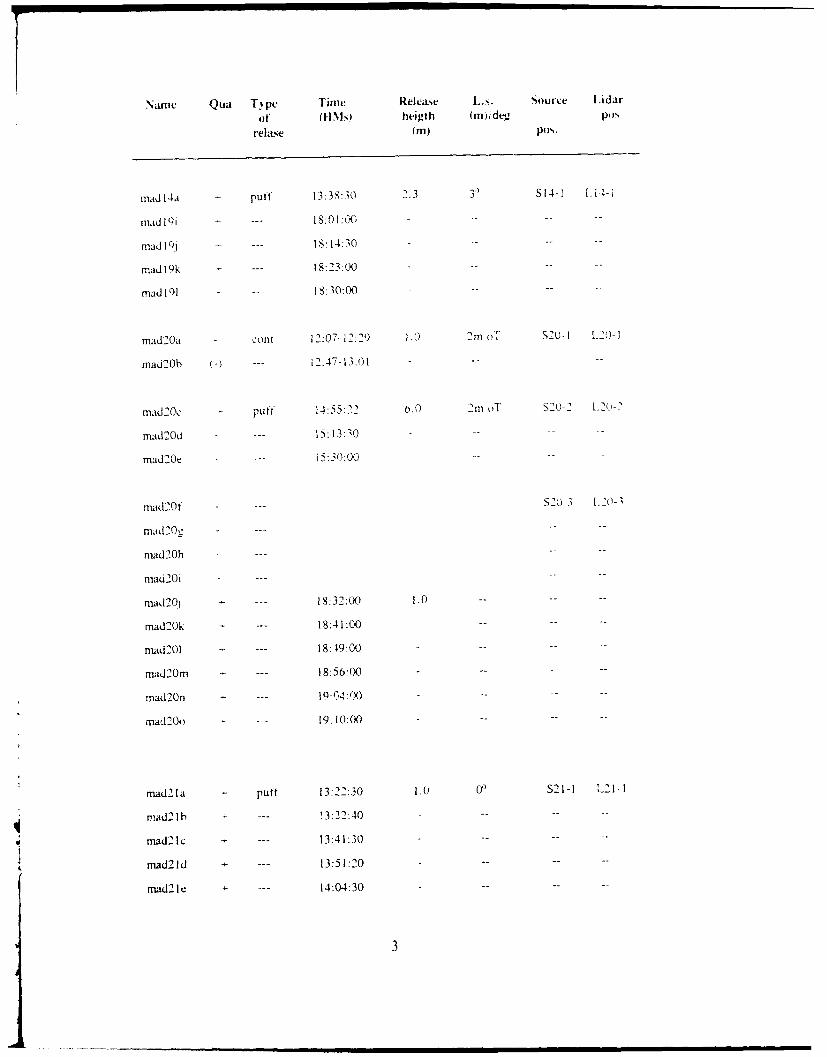
Table III.1: Contains information of lidar positions andmeasurement periods obtained at the MADONAtrials.
Includes also drawings of source and lidarpositions for the total of 23 experiments.
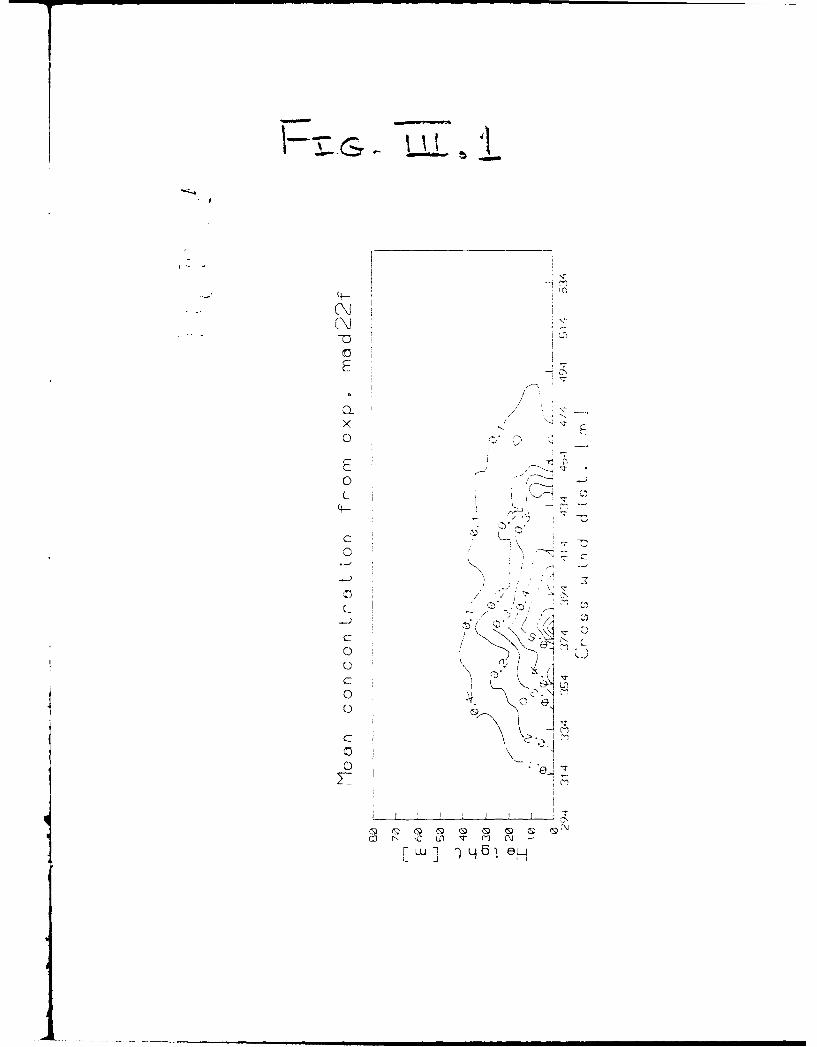
Fig. II.1: LiutR scw..•2 mean cocýentradions from MADONAexperiment No. 22f (I hour 22 min continuousrelease).
Fig. III.2a-c: From Madona exu. No. 15h: Lidar measured mean,variance, fluctuation intenzity and intermitten-cy crosswind profiles in fixed frame (meanoerincluded).
Fig. III.3a-d: From Madona exp. No. 15h: Lidar measured mean,variance, fluctuation intensity and intermitten-cy crosswind profiles in moving frame (meanderremoved).

The measurements related to the number of aerosols in the smallmeasurement volume, which is a "ciqar-shaped" cylinder of ap-prox. 1 meter in diameter and approx. 1.5 meter long.
Extensive data-processing of the raw lidar-signals is inprogress in order to produce accurate and quality-assured cross-wind aerosol concentration profiles. In return, we obtain fromeach experiment, not only the mean concentration profile, butalso a measure of the natural fluctuation and inherent uncer-tainty associated with dispersion. This is of importance forsubsequent model evaluation studies.
During madona, we obtained both stable, neutral and unstableexperiments based on both plume and puff releases. The rc!aserate of the aerosol generator was kept constant during in-dividual experiments.
Our contribution to the MADONA data base contains, for eachexperiment:
1) Time series of cross-wind profiles2) Plots of mean cross-wind concentration.3) Plots of fluctuating (rnms)4) Plots of in-plume intermittency5) Measurements of the entire measured concentration pdf
(probability density distribution) from which, for instan-ce, different exceedance statistics and high-level expo-sure events can be inferred.
The posterior data processing, reduction and analysis of ourLidar-activity is rather involved, and will require between 6anc 12 month of data preparation and analysis following theexperiments to finalize.

_ Modelliing
4.1 Mean-flow mcdelli"-i iirections:
In connection with our on-going activities with the CEC-RODOSactivities for real-time on-line decision support, we ad-ditionally setup our modelling system LINCOM/RIMPUFF at theMIADONA si*'"
For mean-flow wind field calculations at the Porton Downexperimental area , we have setup our fast PC-version of LINCOMto calculate winds over the experiment site at various heightsand for different synoptic wind directions. LINCOM is a non-hyd-rostatic spectral, neutral wind code, cf. Santabarbara (1993).
LINCOM is setup to run based on the measured tower winds and assuch, it is suitable as driver for dispersion studies overcomplex terrain. Alternatively, the model can run on a singlewind speed and direction as input, if the dominating winds aredriven by synoptic forces.
Our studies include comparison of measured tower winds withmodel results based on single inputs, the MADONA study withseveral wind observations are unique for this model/dataintercomparison.
At present this flow model is under development in order toincorporate the effect of thermally driven forcing such asnight-time drainage flows and day-time up-valley breezes. Sincethis model is a central as a "driver" for our puff-dispersionmodel RIMPUFF in complex terrain, it is worthwhile to test itsapplicability for the Porton Down terrain in question,- andpossibly even use the obtained results from these experimentsin oraer to evaluate our efforts regarding improving the modelto include the effects of thermal forcing.

4.2 Combined Mean-wind and Dispersion Models for Real-timePlume Dispersion Assessment over undulating Terrain:
Our dispersion modelling work is centered about a LagrangianMesoscale Puff-diffusion model (RIMPUFF), which over the yearshas obtained acknowledgement and use internationally, forinstance in the UFOMOD and the COSYME consequence assessmentsystems available in public domain by the CEC. For dispersioncalculations over complex terrain, the PC-based RIMPUFF modelis presently twinned with the non-hydrostatic mean flow modelLINCOM, which is based on the Navier-Stokes equations formotion, including mass, momentum and heat conservation. Thecombination of the flow and diffusion model results in anextremely fast computer code, which advantageously can be testedand evaluated in real time with experimental data from thepresent diffusion experiments.A modelling effort based on selected MADONA diffusion trials isconsequently in progress.
Appendix IV: Contains the first preliminary model results ofwind and diffusion calculations from the MADONAtrials: Sep 17,release time 11:10 - 16:10.
Fig. IV.l: Shows LINCOM output of hourly consecutive windfield calculations based on tower data inputs.
Fig. 17.2: Shows detailed stream line plot of one of thesewind fields, including tower wind data???
Fig. IV.3: Shows instantaneous plume positions at tenminute intervals and also total integratedconcentration (dose).
Fig. IV.4: Porton Down terrain vertical magnified x 20seen fLom south-west
Fig. 1V.5: Example of tower data representation for Lincominputs.
Fig. IV.6: Example of Lincom grid wind field (10 metersheight) 300 meter horizontal resolution
Fig. 1V.7: As Fig. IV.6, 100 m horizontal resolution.
Fig. IV.8: Example of stream line wind field from neutralLINCOM (10 meters height) at Porton Down ter-rain.

-Jz
/I /if
-00k

z I::)
j St U ;tt S/ Zv
- ~~ _
J7

Cc Cc
-2 I2 -:
7
7I
Z: -' -
______ _____ S/U ___ __ __ __ __ __ _l _
va dua -n aHII 7/=
FNGV Pt0 IO4ý"2 ýO

co - C
7Z2
awdu -n IIIa I -
HL ___ __ __ _ __ _ _ __ _Z__ _
____ ___ ___ g t6___ __ _M_ ____________t __ _ __ _ _ __ _ _ _ _ __ _ _ _ _ __ _ _ _ _ __ _ _ _ _ _ S_ _ _

~ 'z, tz ZCN.) l= ,N? ý ý C
CI -.
____6 dut -n Ii-I I -
-N (V g16a' WWI''6 a 0 4,j! Lu 2

-Z2
7 7
FNUV 9t00 I7wJ'~uI0t

tlý~' cc -ý cz) z_ C__Z k__C_ _ý:
Cý C-
s /7, 63a /la S/ zu
().LJdutaaj *f L . 7/Z
VNO(JVH 916OE6 .48a0.tOý'Out E 07.uOS

_____ ______ ______ -
- -
* �2.
-C---
-- C- *
�-. _ ' - -', ___ _ -*---*- _ _
-C-
* I ____ ____
-� -;��
S ia 6aG s tu �.s �u.t
duia�L
VNOUVJV Z160J6 :]aUOd�QZ2-LI� I -�S�

CIO,
VNOU7VP 8t6O?6`6 .7awOJ.tZLLw t I

C-'Q,- CC"C
.17 dua -n- a ,l7 -
VN (V 8100 1'at-DLw -,0,

dua *1 *-8 331* 7/
-N9V 6160Z' :putot-tu t Dt *-

( 7
ZF
.- dua - a 3
-) I
VNOUVNT 6t6O06 *4aUO.Lt-btU O' 0 SO
cc Z.
fla ios/
I) ~ d 3I -npII I7 -
-N (V Nu60' -'3 O~~z t - -U

t" N~ ~
-s I I u
N-dw Da 3
VN(V Oa67 *'at-~ULZ t

- ½__-C
-i ZI:
JY
[ *O11J 311101

N N N N N N
I I
- - � -� �
� -�/ c-" 1
* �--�----�-______ ________ � * _____________ _________ �-.----.-- ____ I - _______
2 S
��'1 i I' 1_____________ ____________ ___________ _______________ K :..i...L........
* I I
_______________ *� j) _____________________
____________ 4
( -I j- N N - _ -. �_ x N- I -- V
- -. - - V * ** *K
S
N
N
N * I
I I
-- -. I * II T� � -�
I *,'
I I
I.
I I
-* -� N N-
6. � J� s /btL Jo �.UL/� -�/ *tU
) I�{7 cLwai jIX�II
VNOEJTVN I?6O2�6 :�32UOUflhJJ. � QZUO�'

i j
Cc CC CC- 1
I H
J. j2
dw._ -n .1__ ____ 3 - ('i - -Z
______N au60 ' .-Izo ov I j2 ___

VI
Na c- '.~ NNNn
6a s K- 0 W R u
7,g dw
VNO(TVN ~~~ aZ6cI 'aOL'u IO

cz--
tl. -n 7- 11 33
VN09VNEa'60E

I q
-17, du ID 3. I
VNG'NEaO -7a~Kt .LO

Ic --
d7 pall 7/z
VNOEIVJV P,76O36 :73UOU9QL S

-ua I Da 11 IN7/
4 V09N P'66ý :jwoo-t -7u

_ - - - --- - -.-_-
-- -
* -<
- - - - .... mm mmm- -- m -: m C C

- N- - C.. .,
- -
-- . N N O = ".
CoC o --
-Hl d I I I

Name Qua Type Time Relea•e L.s. Source Lidarof (JIMs) heigth (m)/de. pos
relase (m) pos.
madl4a puff 13"38:30 2.3 3) S14-1 L14-1
mad 14b --- 13:52:00 .. ..
mad 14, - --- 14:00:15 ....
madl4d .--- 14:08:"? .. ..
m a d l 4 e . . . 1 4 : 1 8 : 1 5 .-..
mad 14f --- 14:28:30 - 00 ..
mad 14 L - puff 14:54:? 2.3 - S14-2
mad 14h c- cont 15:29-16:11 1.0 S14-3 L14-3
madl4i ---- 16:14-16:33 ....
mad 141 ---- 16:35-16:43 .. ..
madi4k- ---- 16:47-17:43 --
madl5a - puff 13:29:00 2.9 S15-1 L15-1
madl5b - 13:38:50 .. ..
madl5c - --- 13:45:17 ....
madl5d --- 13:53:00 .. ..
mad15e .--- 14:01:30 ....
madl5f .. --- 14:09:00 .. ..
mad 1g . .. --- 14:15:30 ....
madl5h 4- cont 15:00-15:14 1.0 ....
madl5i + ---- 15:16-15:43 -.. .
madl5ij 4 ---- 15:46-16:10 .. ..
mradl5k --- --. 16:13-16:30 ....
mad151 + ---- 16:33-16:39 .. ..
madl5m + puff 17:19:00 2.9 .. ..
madl5n -- --- 17:48:10 -.. .

Name Qua Type Time Relea•e L.s. Source Lidar
or (HMs) heigth (m)/deg posrekla.e (in) pos.
madl4a - puff 13:38:30 2.3 30 S14-1 L14-1
mad 16a - puff 14:04:00 1.0 -8m oT. S16-1 L16-1
madlbb - --- 14:34:45 -.... .
madl6c --- 14:51:20 -.... .
madl6d .--- 15:02:10 -.... .
mad 16e --- 16:00:00 -
mad16f . . 16:15:30 -.... .
mauid 16 .--- 16:26:00 -... ..
madl6h --- 16:39:15 -.....
madlbi 61 16:52:15 -.... .
mad161 --- 17:04:30 -.... .
madl6k --- 17:18:00 -.... .
madl61 --- 17:30:00 .... ..
madl6m --- 17:48:45 .... ..
madl6n . ... 18:12:50 .... ..
madl6o --- 18:42:32 -.... .
madI8a - cont 17:56-18:37 1.0 1-20 S18-1 LIS-1
madl9a puff 13:15:00 6.0 24)3 S19-1 L19-1A
madlgb -1- --- ?13:25:00 - --
madl9c . --- 13:36:00 .... ..
madl9d --- 13:47:23 -.. .
mad l9e + cont 15:09-15:52 1.0 3) S19-1 L19-1
madl9f puff 16:10:40 6.0 .... L19-2
madlQg . ... 16:26:35 -.... .
madl9h - .- _ 17:49:30 5m oT S1Q-3 L19-2
Nane Qua Type Time Release L... Source Lidar
oft (ti-Is.) heigth (in) ideg pos
reLUse (M) pos.
madJ14a - putt 13:3S:30 2.3 3') SI4-1 1.14-1
m adld i . .. 18:0 1:0 .. -..
madl I Q. S: 14:30 ... .
madl9k . ... 18:_23.:00 ..
m adlgl . ... 18:30:-00 -..
madO0a cont 12.07- 1229 1.0 2m ol' S20- I L20- I
"rnad20b --- '12:47-13.01 -...
mad20c puff 14:5522 6.0 2m oT S20-2 L 2U-2
mad20d --- 15:13:30 -...
mad20e --- 15:30:00 ..
mad20 --- S20-3 [.20•-3
madt'O --- -- 3 L
mad20h 0 L
niad20h
mad2i -
mad2!O . -.- 18:32:00 1.0 .... .
mad20k -. .. 18:41:00 -...
mad01 - --- 18:9:0: 00. .
mad20m .--- 18:56:(X) ... .
mad20n .- --- 19 400 ()4 . .
mad20o . --- 19:10.00 :.. .
mad2Ia puff 13:22:30 1.0 0S $21-1 [2I-I
mad2,_Ih --- !3:32:40 -.... .
w mad2lc --- 13:41:30 .......
mad2ld I .. 13:51:20 ... .
mad21e I. 14:04:30 ... .
i I~iIIII3

Nanie Qua Type Time Release L.s. Source Lidaro r (H.Nls) heigth (m)Y'deg po%
relase (m) pos.
madl4a - puff 13:38:30 2.3 3o S14-1 L14-1
mad2If --) cont 14:42-14:59 1.0 0' S21-2 L21 I2
mad2 I L cont 15:19-15:43 .... L21-3
mad2Ih (-) --- 15:45-16:17 ... .
mad21i (-) --- 16:18-16:40 ... .
m ad2' .i --- (-) -...
mad IlK - cont 17:31-18:11) 1-A S21-4 121-4
mnad,.a - putt 13:41: 25, 2.3 -S22-I L22-I
mad2b --- 13:52:13 ..
mad22c .--- 14:07:45 ... .
madd . ... 14:1 35 ....
mad__ --- 14:29:00 ..
mad-"- - 14:51 !6:13 1.0 ,<an l"l- --
madb3h -j putf 12:38:30 2".3 m oT S23-1 123-1
rnad .23c ) 12:46:30 -.. .
mad_3d --- 12:54:00 ... .
mad2d.c 13:08:30 ..
mnad233 cont 13:32-14:46 1.0 scan S-;- - --
mad23,__ --- 15:00-17:31 -.....
mad23h - puff 17:36:30 2.3 2m eT S23-1 --
mad231 .--- 17:47:30 ... .
14
j
L

4zK ~ '
- G4C-
Boc b Dow Eas
-`2 3
G4G

~ 7 K~~-.--G42 '
lower.~
G-1-
G44Z- /p
"OP"7- - - - - - - - -
- --- ------

.717
o werr,, No.-2
- F
BoscombeDown East '
/ 2.
77 astc~n 24

ApicsIV
G44 13
G43G43A
ower r-
G 47
Tower N o.2-
G41
2_ý2 --7
G-" -ý-Zzz
, . ....... -0 ý'opi 5i'l
23
G4E G45
oscombe;Down East
I Z!Z
OP14
G39
Z
G50... A
61
G3 OP6 *Q n
Ix
4
mill, Z
Lis
m i"lS t 0;: n22
-- ýtop sun'-..ý
'. a m -2 ir'7 .
taSt flig-1,
zZ
GSI
6'A
n2ston CcW'

7, -~ c
G 44.
.. . . .... . .
G41~TB-J~~
7 x',
G4 ,P :)I
23I
a'4
50 co bo iown Est-ik>..'
-0 ý - .P-'.
ck - -.0L ~ fcl..
7--
~~~~~~ts Big tn ~ r~..- ,
C,,z/
Blssrastc / o-'n-

G42, ..
.. .. . . .. . . .
r~r,-
G48I
Z~OP15i
-M .2 - ---- 23c.zI
G\\.ý'Softbe~w East.
SMI.
31tf 1

G43A 7
611
/G In ,.n,
Z2u I-
a

A P 10 S
-4'. E. F.-
N -7
G41~j
.... .... -7 .... ....

G 4-
/ ),~ , ,
A~S MI1,.7~ ~'G43A;
? -, ~..........w n

Y I
G43A
Toe o.2er \
* Oaa.. . 0,
G4 .... *0 p 51" .....
>(G4S onEs ,
Boscombe[)w a
P14/ OP14j/
(3- I':. o;:
S -" ' '2 C Z
120
-- ýtop Bun
Sm ~ ~ Bih L
B1 St k.I
4,;, ... Easton Down.

2~
wer ~ Hil
TARGET
K .------ ---- ----
.- ' ~BoscombeDown East "m/
- P14/57-
0~
,rt 37. P)tLQ * . -- 
z\,
C. C...Cane d, \T
'7'
..h 47F-
36 . .*
7. .-so Dow

Tower No.-'-,,r
_________________...... 'HARD' -I~
. . . . . . . .. .
77,
BocmeDw East -,"csonDw' ' --
- P14

Lf
* - ,4;,2K'
To r N- <2.
Boscombe.ion Dos

------ --
ow'4\ 1
'Afi7;we N
----------
Bascombeto Doncas
12-

------------ z 5
7..7
Icco~ . I Is ,' - .
S~ rr 0 But- oZ AREAfv
fl
S ,'-2r,-

38.,, I ..... ,'&Tower N.-
OP 5 ,
23-
Op 1
-~ ~ ~ - -- V A E
/ -.t
.77
-, o -n

1 0.
owerHil
v j- T=
BoscombeT wow Ees r N
'1o'
/ V /P123'~ "i
3. -LL- 7
"riv ,D-'
aonDown

*5 w
fl-., - ZA E
- - .i "o,~ra
23%~ ,.
-scomb.;--s E-'
I"p
IIZ
.- .. . . .. .
-iton Down.
-
LW
H:H-aC
//
xC)
>0 ½> >.
o
cyCC)
/ *1
�2; (� �
� ½�
C0
-,o / �C
oU
o ;:��
IC
C)zi
Id
_____________________ j
N '0 Lfl � Cl (V
FW] �y5�eu.j

//
CF
y,
j
QDL
*
K
N� �C\j
ii I I'...c'�.' [I,
2 2 2 2 2
2 N 2
r S'�Q Un 0q��rn) DUOD u�ew

-0)
,- u2 u
I--
Q Q(S'V Uf CJ~LS

1��
U
'I-i
-- Co o
2-il-
I I,
- 7'.
¾/1 �
-- 7
I
2-
LI) LI) LI)
LI) CN LO
A' sue� u� o Ofl

I-S
AD U~ ~9 JO' U T

/
C -�
VV�I7�;.
(-V
/1I $ �-4 -�;
4
7>�I -.-- �-
*
* - - -
- L-
*&
I-
Q £ 2 � 2
2 T �- -� 2-; �\ 2N
Ufl �UOQ u�ew'I

V--2
', --
09 _
__ I-
If_
I *

II i! ! i • Ham t !
S. . . . . .
-'0 "
C 4
- ,- -- -
II
_ emi I iIli iIII I I i-

-_-
tF J •-
* ,A*•rJ- :
*
.- 4
*I
/4C ) •1LUJ(qU

IL
TA <~--
C 4 4 a
'1 7 A--
;J1 :J/,
r N v,

1'ortonSeptember 17, 190-2
Release Time: 11. 10 - 16: 10
10 minute series of puffs
'7- (
I7,ý
1.0 3641.,171N

__0
171-

zCo o rn
o ooo 0 '1;o 0 0 < �o o 0 0 <o & o � z C;
22 - r� r-\'-'N vs
N'�N
C> �, 'N'�N '-'- ��/1
CD -' < C>o
CD -
-Th N-, N-,
- -� �'Th\ �- N-,
(1; -
C (N *1
* CN N -�
-� -
�'N
-N N-, N,,,
- N N N -
CD 0 ox' / NN *- �\ 5-,,
-,- ,�,,2 -- S
-NA -_________ ________
'--V> ;7� ri
(,N
9 N "-5-'
A- N
5 'N,
Jji) 7 '\jN r / //
I I
NI' � � /
q N // ." /
( \,/7y "'N,
N
'-�Th
IC>
N ____________ ______ /$\ "lA
* �7K3&LZL C'�&37+Z�

p. �2
� H0 0 �
0 �
I *
�- U -�
* * - --4 0 �- 0 *- __
- C.-
- �- -� � -'
-' �-*j * * 7..- -.
- - 0 _
Z - -q -'-- 0 -� 0 - �-.rr 7
7- 0 - � - -
- -d -4 - -
0 -� -�-� � -
- - 0 - -� - - -� -
- '-, .- L�
- - 7.'- - -, �- ,-' .- �'-,
- :-� - '-� - -, -
''Y " '�-� �7-t�'7�"'-' T/ N *4� N _
>i'�. ½><{ K>- .'- >1cci--�J r'> -
K % i �--,h%.' �.z
- �NQjr? Kj � 7icjJ -<f �21b> � \
J7 *1>'r<'s�7) - �Yr-' f1� \ I
i'�< '4--MUQIV" 1\ / 4\ 'N�
(1� (�N\b:j7 /
// JL� 2), :1-1 *'P'.'- (t \NJ���7Z------K' -� -
i�t -
ffik '1 � �
f\/� f t� �T>7 ,, lvi
�J � 1/ /;� / 1� /
f� �/�jI
2I�TOVI 0099[1 optv.g�i

I L 0-
"'-N 0 17FAI
""IN t
I I) Op 1 OM -9 T - M

U'
LiL �
z0 -rj-0 o o Z0 0 0 r� -
0
'I * - 0 _
- ,2 2
-. 0*��*; 2
- - *.2 *- * -- 2 -
- - - -- - - - - -
- - - _ - -
)
2