ad-fl12i of fracture mechanics concepts … · ad-fl12i 900 development of fracture mechanics...
TRANSCRIPT

AD-fl12i 900 DEVELOPMENT OF FRACTURE MECHANICS CONCEPTS APPLICABLE i/iTO AIRCRAFT STRUCTURES(U) GEORGE WASHINGTON UNIVWASHINGTON DC SCHOOL OF ENGINEERING RN. H LIEBOWITZ
UNCLASSIFIED 85 NOV 81 N888i9-79-C-0491 F/G 1/3 N
-mh0 00 00 Im II ismhhhmhhhhhhhsmhhhhhhhhhhhA-ED
1..
3UM-
MICROCOPY RESOLUTION TEST 0HARTMAuM. gufgAu OF STAWaM-gw3 A

M.~~, --7i t. ~ ~ p w .* .. ..
:0 DEVE3LOPMENT OF FRACTURE MECH ANIC
CONCEPTS APPLICABLE TO AIRCRAFT
STRUCTURES
STUDENTS FACULTY STUDY RESEARCH DEVELOPMENT FUTURE CAREER CREATIVITY CC
,,..NOLOGY FRONTIF IGNENGINEERING AP N
~ ~.GEORGE WASHINI
-~ APPROVED FOR PUBLIC RELEASE... DISTRIBUTION UNLIMITED
82 1 28 P 26 FSCHOOL OF ENGINEERING W~I
AND) APPLIED) SCIENCE

DEVELOPMENT OF FRACTURE MECHANICS
CONCEPTS APPLICABLE TO AIRCRAFT
STRUCTURES
Si6
IAI"C
NAVAIR Contract No. N00019-79-C-0491
Principal Investigator: H. LiebowitzCA_.
Final Scientific Report
School of Engineering and Applied Science
The George Washington University
Washington, D.C. 20052
UOPROT'D FOR pUrnC REi'A-"OsmsUTION UNummaE
,4
---9.. . . .- ... ,...-.

V. PART A - 4W r
PREDICTION OF CONSTANT AMPLITUDE FATIGUE LIVES OF
PRECRACKED SPECIMENS FROIM ACCELERATED FATIGUE DATA
ABSTRACT
/he feasibility of using an accelerated fatigue test
" program to predict constant amplitude fatigue lives of
* precracked specimens was examined. An analytical basis for
the fracture mechanics approach was developed. by modifying
some earlier work that had been applied to unnotched specimens.
A load program involving a linearly increasing load with the-,
cycle number was used for the accelerated tests$,The pre-
dicted curves from the accelerated test data were found to
provide a good fit for the constant amplitude results in
2024-T3 and 7075-T6 aluminum alloys. These results indicate
that the accelerated test data can be effectively employed to
predict constant amplitude fatigue lives, while also providing rC
a considerable reduction in testing time.--- .Ace~dien rr
D* TMA 0
bl . ..ti mcod I
Mt" Speclal
,g. - ,- .-. .- %' . .- . '-. '- *" "" "" " • ° -" " "" :. - "" " """ -- "-" "" "' " "" " - "' "" "' "" " " " -" " " "

NOMENCLATURE
B Constant in the equation of A f-Nd curve
C - Constant in the equation of AI-N curve
D - Coefficient in accelerated fatigue model
m Exponent in the equation of A1-N curve
n -Number of cycles of constant AK amplitude
N - Number of cycles to failure in constant AK:Iamplitude tests
Nd - Number of cycles causing structural damage in
accelerated test
NO - Number of cycles that do not cause structural damage
in accelerated test
Nf - Number of cycles to failure in accelerated test
p,r - Exponents in accelerated fatigue model
Al - Stress intensity range in constant amplitude test
Alf - Stress intensity range at fracture in accelerated test
AKTH - Threshold value of AK
Ar - Rate of increase of stress intensity range in an
accelerated test
.1 , ' ' = , " ' - ' u ' ' m , ~ m ° ' ' ' ' '

INTRODUCTION
host service failures in machines and structural com-
ponents are due to fatigue. Hence, considerable attention
has been given to fatigue properties of materials. Most
of the earlier experiments were performed on smooth specimens
without cracks or other stress raisers. However, with the
acceptance of fracture mechanics principles, a lot of studies
have been made on precracked specimens with the emphasis of
most tests placed on measurements of fatigue crack growth
rates. Fatigue tests of both types are time-consuming and
expensive, especially when the stress amplitude is low.
An attempt to reduce fatigue testing time was made by
Prot [1] using an accelerated fatigue test method. He used
this method to determine the endurance limit in completely
reversed cycling of smooth specimens. A cyclic load, with
the magnitude increasing linearly with cycle number, was used
for the accelerated test. It was assumed that curves relating
the fracture stress to the number of cycles to failure in
constant amplitude tests and accelerated tests were hyperbolas,
assymptotic to the endurance limit. This method was modified
later by assuming that the curves were higher order hyper-
bolas [2,3]. Recently Basavaraju and Lim (4] improved this
method by developing an analytical basis for predicting the
entire constant amplitude S-N curve from accelerated test
*results. They obtained reasonably good agreement between the

predicted values and experimental results in completely
reversed fatigue cycling of smooth specimens.
The accelerated test models assume that the cumulative
damage (Miner's) rule is valid in all the stages of fatigue
damage from crack initiation to final fracture. However, the
damage accumulation processes in these stages are different,
which could produce differences between the analytical
predictions and experimental results. The number of cycles
expended in crack initiation is very large, especially when
the stress amplitude is low. In materials containing pre-
existing cracks, the time for crack initiation is eliminated.
Hence, the accelerated tests can be expected to yield better
*results with precracked specimens.
Another factor causing deviation from Miner's rule is
the crack growth retardation or arrest when a high stress
amplitude is followed by lower stress amplitudes. In
accelerated testing the stress amplitude is increased in
successive cycles, and hence, the difficulties associated
with crack retardation or arrest are not encountered.
The purpose of this investigation was to examine the
applicability of accelerated test methods to predict constant
load amplitude lives of precracked specimens. This develop-
ment is based on the stress intensity which is appropriate
to precracked specimens rather thaR that based on stress.
The analytical results are compared with experimental values
obtained from testing 7075-T6 and 2024-T3 aluminum alloys.
- - - .,.. .- ,- .. • .. ,- ..- .. -. , .-. .-. .. *..:.,.'.-,' ,, -... , *....- ,' -. . ,'o, ', " : ' ., ._:-' - - -j -,-. - ' -., w - -. .i . .. ".-

3
ANALYTICAL BACKGROUND
The analytical approach used in this investigation is
a modification of a recent paper by Basavaraju and Lim [4]
which was based on the fatigue tests on unnotched specimens.
In precracked specimens, although gross stress is proportional
to the load, the stress distribution in the net cross sec-
tional area changes continuously. A more accurate picture
of the state of stress at the crack tip is given by the stress
intensity factor, K. Hence, in this investigation the rela-
tions are developed in terms of the stress intensity factor.
In constant load amplitude cycling the crack length changes
continuously, but, in many practical situations, only the
initial crack length is known. In these situations, the
stress intensity values are calculated from the initial crack
length and the applied load. The stress intensity factor
based on the initial crack length is represented by T.
In the accelerated tests the load amplitude (and stress
intensity change, A) increases linearly with the cycle
number. Load cycling below a level known as the threshold
value (AKTH) is assumed to cause no structural damage. The
test results permit the establishment of relations between
A and N, the number of cycles to failure in a constant
amplitude test, and AKr and Nd, the number of cycles causing
damage in the accelerated tests. The AIf.-Nd curve in the
.;. j .x. .q , i,:.. .. .-. .. . . . .. . .. .... . . . . . .. . . . . .
4
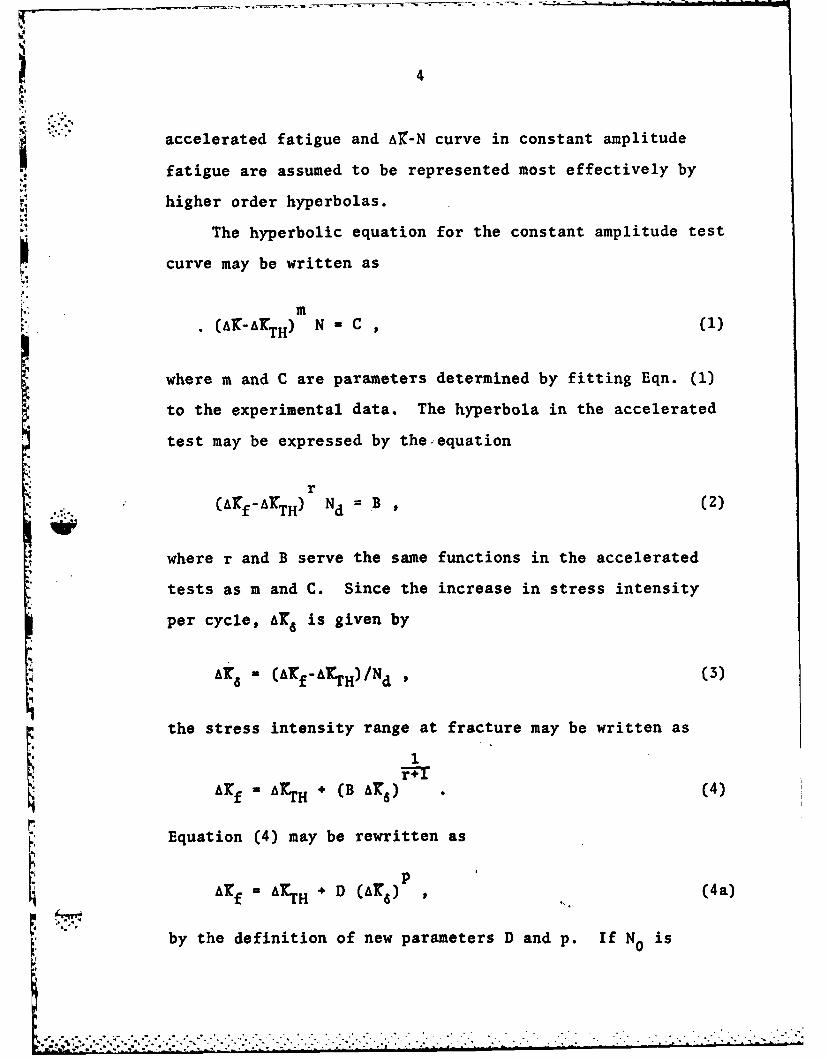
accelerated fatigue and AIC-N curve in constant amplitude
fatigue are assumed to be represented most effectively by
higher order hyperbolas.
The hyperbolic equation for the constant amplitude test
curve may be written as
m. (AT-ArTH) N-C , (1
where m and C are parameters determined by fitting Eqn. (1)
to the experimental data. The hyperbola in the accelerated
test may be expressed by the.oequation
r(Arf-AICTH) Nd = B , (2)
where r and B serve the same functions in the accelerated
tests as m and C. Since the increase in stress intensity
per cycle, AT, is given by
A - (Arf- rTH)/Nd , (3)
the stress intensity range at fracture may be written as
1
Af- A., H + (B AT6 ) (4)
Equation (4) may be rewritten as
pAr£fATH + D (AK6 ) ' (4a)
by the definition of new parameters D and p. If N is
I , . - ,- ' , . . . . . . .. ... . . .

5
the number of cycles below aKTH , the number of cycles causing
fatigue damage, Nd is given by
Nd = Nf-N0 = (AIrf-AKTH)/Ar 6 . (5)
The first cycle causing fatigue damage has stress in-
tensity range AKTH + I'AIC,. the second cycle has stress
intensity range AKTH + 2"AK6 , the jth cycle has AKTH + j'AKS
and so on with the stress intensity range becoming AKTH + Nd'AK8
for the last cycle. At each stress intensity level the fatigue
life is given by Eqn. 1, but .only one cycle is spent at each
level. Hence, Miner's cumulative damage rule can be applied
in the form
::~ ~ 1 +12 , .... 1 j+ .... lN1 , (6)
where N. - 0 CKTH- m
Since A!. - AKTH+j AK6 ,
N -N j - Ca~;(j'A!8 ) '
and Eqn. (6) can be rewritten as
[i1+ 2m + 3m + .. jm + Nd.m 1 (6a)
* ...: - ....._ .. .. -: . . ... . . :...

6
Basavaraju and Lim [4] have shown that Eqn. (6a) can be
approximated by the form
(AIC)m Ndm+l (
From any two accelerated test results, Eqn. (7) can be solved
for'm with the help of Eqn. (3) to obtain [4]
m -- p (8)p
The constant C is given by
1 N m) 1 (D)m+l_ pDl/Por m (9)
If Nd and MC 6 are treated as continuous variables, Eqn. (8)
can be obtained by differentiation of Eqn. (7) and sub-
stituting for Nd from Eqn. (3). Thus, from a knowledge of
the constants, ArTH, D and p in the accelerated test curve,
the constants for the constant amplitude curve AKTH, m and
C can be determined and, hence, the complete curve can be
obtained.
* - o

7V
* EXPERIMENTAL PROCEDURE
The experimental work for this research project was
performed on two aluminum alloys, 2024-T3 and 7075-T6, using
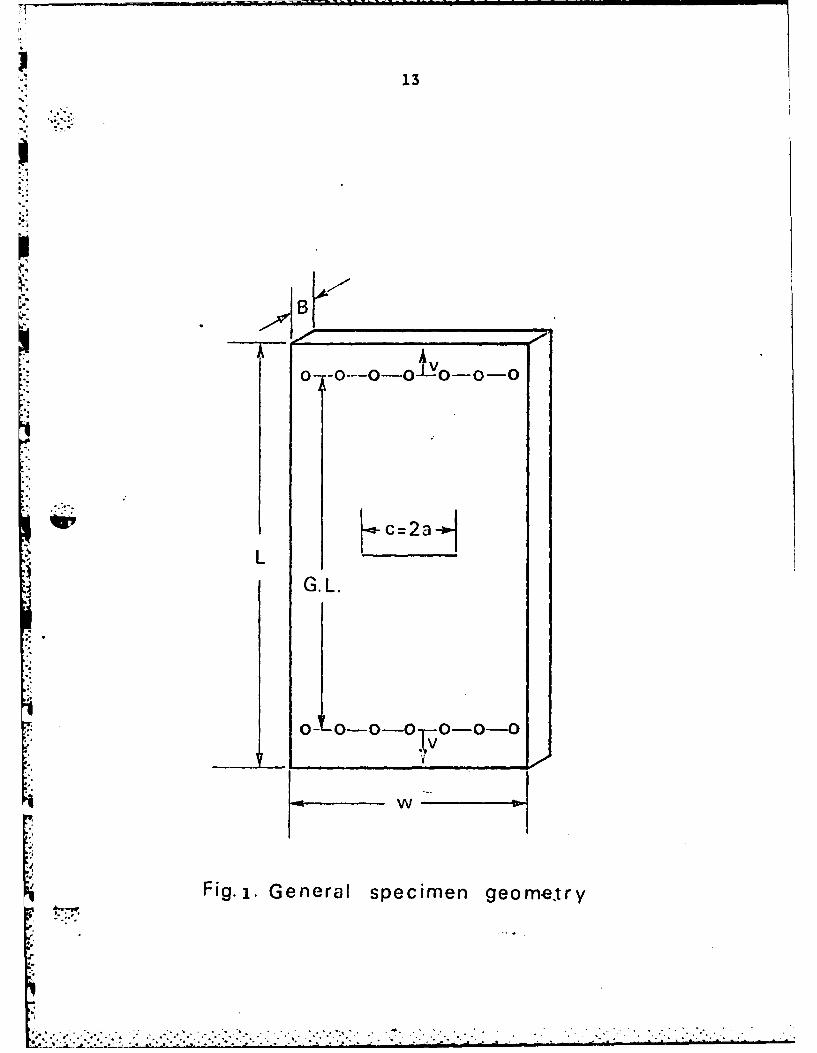
center-cracked sheet specimens shown in Fig. 1. Specimens
with gauge length 27 in., width 12 in. and thickness 0.063 in.
were tested in the L-T orientation. The crack length-to-
width ratios (2a/w) for accelerated tests were 0.33 and 0.5
for 2024-T3 and 0.25 for 7075-T6. Constant amplitude lives
were determined for various 2a/w ratios. The tests were
performed on servohydraulic testing system. No antibuckling
guides were used and the stress intensity ratio (R) was zero
for all the tests.
The stress intensity increments for the accelerated
tests were based on the fracture toughness (Kc). Hence, the
fracture toughness values were first determined for these
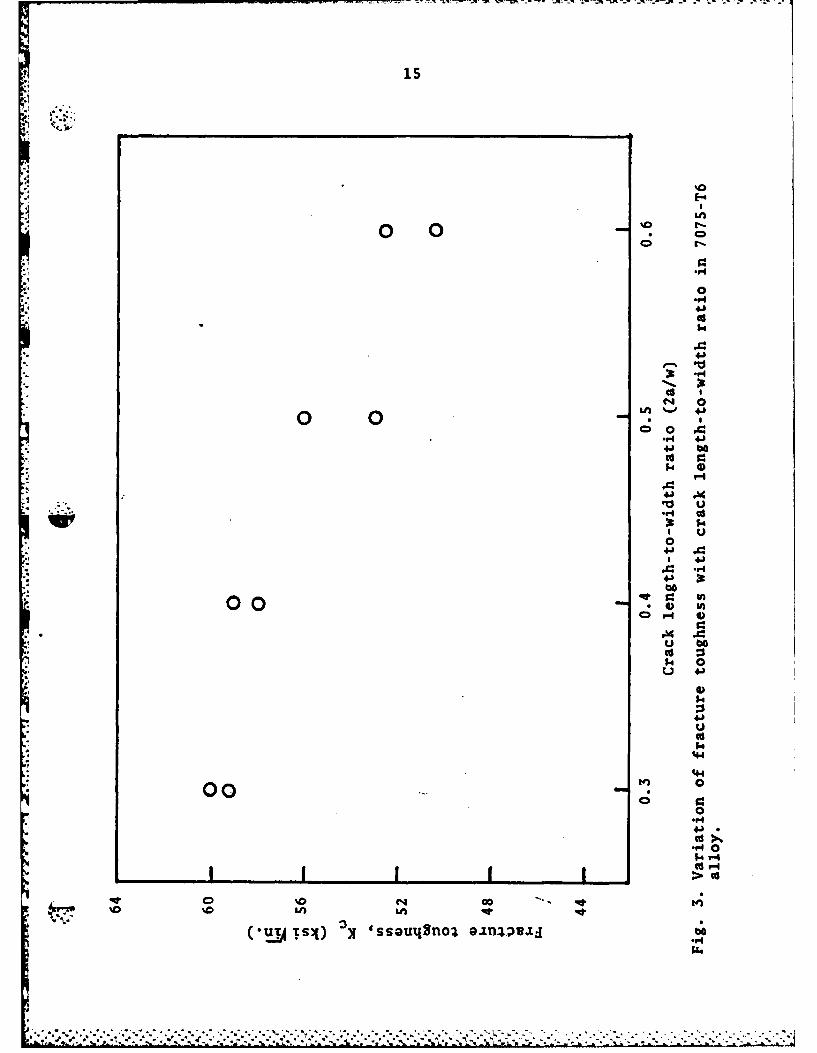
materials as a function of the crack length. It was found
that the K values decreased with increasing crack length for
both 2024-T3 (Fig. 2) and 7075-T6 (Fig. 3). The stress in-
tensity increment for each accelerated test was chosen as a
percentage of the K value corresponding to the given crack
length.
";...
, ,. .,:;...- ., .. ".... , .. . .. .. .- .. .. . . . . . . .......

'1
8
* 'RESULTS AND DISCUSSION
With the selection of the relatively brittle 7075-T6 and
the more ductile 2024-T3 structural aluminum alloys for the
experiments, it was possible to study the applicability of
the accelerated test program to predict the constant ampli-
tude lives of materials having considerable differences in
ductility. Only one crack length-to-width ratio was studied
for 7075-T6 while different ratios were examined for 2024-T3.
The values of the stress intensity factor range at
fracture (AKf) as a function of the number of cycles to
failure (Nf) in the accelerated tests of 7075-T6 specimens
*':. with 2a/w = 0.25 are plotted in Fig. 4. A best-fit curve
for these data in the form of Eqn. (4a) was obtained using
the least squares method. For this curve values of the con-
stants are: D = 114, p = 0.0606 and AI(TH = - 50 ksii-n.
The predicted constant amplitude curve from these values has
constants m = 15.502 and C = 5.306 x 10². The predicted
curve and the experimental data are shown in Fig. 5. The
agreement between the two is good, which verifies the validity
of the accelerated test approach for a relatively brittle
alloy.
The accelerated test data and the best-fit hyperbola for
the 2024-T3 alloy with 2a/w = 0.5 are given in Fig. 6. The
constants for this curve are: D - 94.0, p = 0.0645 and

9
AKTH = - 34.6 ksi/Ti-. The predicted constant amplitude
curve has constants: m - 14.504 and C = 2.516 x 1029. The
predicted curve and the experimental data show excellent
agreement, as indicated in Fig. 7. For the tests on 2024-T3
with 2a/w = 0.33, the best-fit curve has constants:
D = 114.5, p = 0.057 and AYTI = - 50 ksi/i'n., as shown in
Fig. 8, and for the corresponding constant amplitude curve,
m = 16.544 and C = 7.504 x 10 Here also the predicted
curve and experimental data exhibit very good agreement, as
seen in Fig. 9.
Constant amplitude tests were performed on 2024-T3
specimens of crack length-to-width ratio 0.4 and 0.6 as well.
- .- The constant amplitude test data for the four 2a/w values
and the two constant amplitude curves predicted from the
accelerated tests are plotted in Fig. 10. Although the
values of the constants are somewhat different for the two
curves, the actual results are in close agreement with each
other. The difference in the position of the curves is thought
to be due to the larger distance the crack must grow prior to
fracture in the specimens having the smaller 2a/w values. The
data points for 2a/w of 0.33 and 0.4 almost overlap, and those
for 2a/w of 0.5 are very clQse to the prior two sets of data.
The points for 2a/w of 0.6 are shifted to the left indicating
that the remaining life for a given AK is less than predicted
by the other results. This shows that accelerated tests
using a single crack length-to-width ratio (2a/w) can be used
S . - -. V------- . . -. . -. .

10
to predict constant load amplitude lives for different crack
lengths, provided that the crack length remains small
relative to the width of the specimen. Cracks having 2a/w
higher than 0.5 are not of real practical importance because
such a large portion of their useful lives would normally
have already been expended.
The AKTH obtained for both alloys have negative values.
Such negative values for threshold stress intensity range are
not realistic. Hence, these values should be considered
only as constants for the curve and can be attributed to the
shape of the AT-N curves, which are similar to the load (or
stress) versus number of cycles curves for precracked specimens.
In an earlier study, McEvily and Johnston [5] observed that in
both 2024-T3 and 7075-T6 alloys the curves changed sharply
from a high negative slope to a horizonal slope as they
approached the threshold value. In the experiments conducted
for the present program, the number of cycles to failure in
constant amplitude test (N) did not exceed 106 cycles, with the
greatest number of cycles to failure in accelerated test being
approximately 105 cycles. Hence, the range of tests employed
in this program did not provide data pertinent to the threshold
values. However, in the ranges examined, the accelerated test
results have been able to predict constant amplitude lives suc-
cessfully, where the number of cycles and testing time were an
order of magnitude lower than that required for constant ampli-
tude tests.

%11
CONCLUSIONSI
A progressively increasing fatigue load program has been
applied to predict the fatigue lives of precracked specimens
in constant load amplitude cycling. The results show that
this accelerated test program can predict the constant ampli-
tude.lives with good accuracy. Application of this approach
will permit considerable reductions in the time and expense
associated with the fatigue testing of materials containing
flaws and other stress concentrations. Additional work is
needed to determine the limits of applicability of the method,
as well as its usefulness for other types of materials.
-. .

12
REFERENCES
1. E.M. Prot, "Fatigue Testing Under Progressive Loading, A
New Technique for Testing Materials," Revue de Metallurgie,
1948, 45, pp. 481-489.
2. H. T. Corten, T. Dimoff and T. S. Dolan, "An Appraisal of
the Prot Method of Fatigue Testing," Proc. ASTM, 1954, 54,
1pp. 875-902.
3. J. M. Diez and R. V. Salkin, "Appraisal of the Locati and
Prot Methods for Determining Fatigue Limits," J. Materials,
1972, 7 (1), pp. 32-37.r 4. C. Basavaraju and C. K. Lim, "An Analytical Approach to
Determine Conventional S-N Curves from Accelerated-fatigue
Data," Experimental Mechanics, 1977, pp. 375-380.
5. A. J. McEvily and T. L. Johnston, "The Role of Cross-Slip
in Brittle Fracture and Fatigue," Proc. Internat. Conf.
on Fracture, Sendai, Japan, 1965, pp. 515-546.
4
1 13
Hc=2aH- L
G. L.
Fig.l. General specimen geometry

14
44,
'-H
Cs0r41
0.. 4
4J b
k 4)'
* 40
14,'-4
9 u b*s4 C0
14
o
0
I 4.'
'4
*0 114
essouqnol an4.'tU-YT 31)
-I Sb
-99
000 U . 40
oo
C4 0
0 %- 4 J
4j b
4J 000 u
$4
4J ,
k0U 4
44
44
00 V0 U)0D a-
54 4 0
$4 r
4

16
41
44
0
Inop V-4 )
u
u
440
.4
z
4) 1
-014 u
41L
.4-4
u w
r-4
)0 '44
"40
4* .4 41
* *"0
V'4US.
-r .g o.
CD CD CLn littn CS
S VI '0

FI17
4-4
.41
9-4
0 z .0u 4J
444
.4
0 S00 v -I
.4
0
-r 4.-)
U) Sn
0 d 0
C4 .9. r-
4ONYU~~af X,.40I S*dL

.4 18
'4
44
0in 4J
0
'4J
r4.
0 c
U) 0
0 cn. *.I
CD >
+j L)
4-4'
o o4)U C4'
41
4)4-1 O
0>
P . r4.o J C4
cc CD
LA~ le tn m r
40

19
4J
4J4
.1-1
4-I
tn
0u
'44
00"4J
u- 4)
U '4-)
* 4)
4-' .4-)
o Z CA
0
4
4440 e4-.
S0
co Q~>
C*4~*t e44-4T
14W
(iTSA) ~v'HtNVU KIISNa.LNI SSHULS **

20
r-4
0
f-Iu
u
LH-0
4J.
U)
.$4.
'4.4 '-4-4
4 J 4J a4
w 4-)J
H U
'4-4.
.r4 U
H utCD C a) 0
v m eq r-
UT ~ ~ ~ ~ ~ ~ ~ ~ ~ ~ ~ -A 4 UcUVqI HNHA 'HN ~U.

21
~41
4J
4M4
0
44)
U)
0- 41
4C
4) V-1.4~ ) *V4
Cd
0*
z U)
eq r-4 r-4
T 01XVf9~ IISNII U

22
~It4)'.0
Cd04@OtLn %D
0 E
CU (
-- LHfl
004
o CU
Cd 1-' .4Z C
U2I 4)~
0 Ud41
oJ U) +j
001-$4 u ,a
4-) > 4-1 W
1-4 0 >UH > -
0 0U
w0 1u 4-)0
u r-jr
ad )
rj r*44
4J 0a4 r.4
4J
Ln~~i CD.iCD-4r-
C14 C14 r-4 I(~,4~s) ) 'aDN"~ LISm~1I Ssad[1s.

PART B 4A- , .. . .r.. -,
"EFFECTSOF THICKNESS AND MICROSTRUCTURE ON NONLINEAR
TOUGHNESS PARAMETERS ON CORONA-5.
' /
ABSTRACT
'- The variation of several linear and nonlinear fracture
toughness parameters with thickness was studied in CORONA-5
titanium alloy having two different microstructures. The
toughness values generally increased with decreasing specimen
thickness when the critical point was taken as the maximum
load. When the critical point was the onset of subcritical
crack growth, the toughness values were essentially independent
of thickness. This indicates that either the linear toughness,
GIo' the non-linear energy toughness, Glo, or the >-integral
toughness, J 1, may be used as a fracture criterion at thick-
ness levels much lower than that required by ASTM Standard
E399, if the onset of subcritical crack growth is taken as
the critical point.
'---The microstructure containing fine needles of alpha
particles was found to have higher toughness than that con-
taining globular alpha particles. This may be due to the
difference in the shape of the particles or in the size of
the particles.
........

INTRODUCTION
The titanium alloy, CORONA-5, is a recently developed
a-0 alloy which can be heat treated to yield high fracture
toughness at moderate strength levels. To obtain a linear
fracture toughness value in accordance with the ASTM specifi-
Kt cation, E399, the thickness of this alloy must be very large,
which makes the testing difficult or impractical. Furthermore,
for many applications the thickness of the structural mem-
bers may be lower than those required by ASTM E399, and the
linear fracture toughness criterion is not capable of deter-
mining the suitability of the material. Several nonlinear
fracture toughness criteria have been developed to account
for the plasticity in high strength, high toughness materials
[1-3]. The usefulness of these criteria for any material will
be indicated by their dependence on the geometrical changes
in test specimens. The results of a study on the geometry
dependence of various non-linear toughness parameters in
different alloys have been published (4]. Since CORONA-5 is
a potential candidate for structural applications, knowledge
of its fracture characteristics in the small thickness range
is very important.
In this report the results of an investigation of the
thickness dependency of linear as well as nonlinear toughness
parameters in CORONA-5 are presented. The nonlinear toughness
2
parameters investigated include the nonlinear energy, GI'
J-integral JI and crack opening displacement, G6 , fracture
toughness values. *These values were compared with linear
toughness values, UI" The specimens were heat treated to
produce two different microstructures. The effect of the
change in microstructure on toughness values was also examined.
* - '-" .*I .- - - - - . " • "--" .: .-* - . - - . - '

3
'1
EXPERIMENTAL PROCEDURE
The material employed for this investigation was received
in two batches. The plates received in the first batch were
in the low-beta processed condition (Forged at 18000 F (9800 C)
to 6 in. slab thickness; rolled at 1750OF (95SC) to 3 in.
finish thickness]. The first set of specimens was prepared
from these plates and was given the following additional heat
treatment: 1S25°F/4 hr/air cool + 1300°F/6 hr/air cool (Heat
Treatment 1). The processing details of the second batch of
plates were not available. Hence, the specimens prepared
from these plates were annealed for 1 hr at 1725F (9435C) to
transform the material completely to the beta phase and re-
move all the phase changes induced by earlier processing. It
was then subjected to the following additional treatment:
1525°F/4 hr/air cool + 1300°F/6 hr/air cool (Heat Treatment 2).
Although the final stages of treatment were the same for both
heat treatments, the low-beta processing in Heat Treatment
(HT) 1 and beta anneal in HT2 induced great differences in
the microstructures.
The thickness dependence of the linear toughness, 'ic,
the nonlinear energy toughness, Gic , the J-integral toughness,
3ic and the COD toughness, G c, were determined by testing
compact tension specimens with W - 3 in. in the T-L orienta-
tion. The specimens and the tests conformed with the ASTM
E399 requirements, except for some specimens which had smaller
. .. . . . . . . . . . . .. -- T LT L
4
thicknesses. A batch of specimens varying in thickness from
0.5 in. to 1.5 in. was prepared for each heat treatment.
These thicknesses included those above and below the ASTIM
requirement for plane strain fracture toughness testing,
B > 2.5 (Kic/ays)2 . The tests were conducted on an MTS
servohydraulic system operated in load control.
The specimens with thicknesses lower than the minimum
thickness required for plane strain fracture showed signifi-
cant subcritical crack growth, as evidenced by sudden changes
in the slopes of the load-displacement curves. Most of the
nonlinearity of the curves occurred after the onset of sub-
critical crack growth. Two critical points were identified
for these specimens: (a) the onset of subcritical crack
growth, and (b) the initiation of unstable fracture, which
coincided with the inaximum load. From an engineering point of
view the onset of unstable fracture is more important. How-
ever, the analytical bases for most of the nonlinear methods
are appropriate only at the onset of subcritical crack growth.
Hence, the toughness values were. determined from the load-
displacement curves at point (a) and at point (b).
The microstructures of the specimens after Heat Treatments
(HT) 1 and 2 were studied by optical microscopy. The fracture
characteristics were analyzed using a Cambridge Stereoscan
scanning electron microscope.
. ... . . . . .. . *

iS
RESULTS AND DISCUSSION
The variation of different fracture toughness parameters
as a function of specimen thickness, determined at points (a)
P+ and (b) for HT1, are shown in Fig. 1 and 2, respectively. When
!* the onset of subcritical crack growth was taken as the critical
* point (Fig. 1), io, G0 and Io were essentially constant at
all thicknesses, and the toughness values were close to one
another in all tests. When the maximum load was taken as the
critical point (Fig. 2) all toughness parameters increased
with decreasing specimens thickness. G6 and J varied in aIc ~Ic
similar fashion, GIc being slightly higher than J in allcases. The linear toughness values, gic were lower than GIC
and JIc. At both critical points G8 had higher values than
the other three parameters and varied more irregularly with
thickness. This is probably due to the inaccuracy associated
with the determination of the crack opening displacement from
a fracture toughness test of compact tension specimens. Where
the ASTM minimum thickness criterion was satisfied, the dif-
ferences between the fracture toughness values at the onset
of subcritical crack growth and at the maximum load were
negligible and were close to the ASTM standard toughness, Gic*
This was anticipated since the extent of subcritical crack
growth was negligible when the plane strain fracture criterion
was satisfied.
A h. • ,'- ~ ~ --

6
o The average value of the fracture toughness, GIC obtained
in these tests was 332 in lb/in. 2 corresponding toKIc 77.5 ksi in. This value agrees very well with the
toughness value for this heat treatment (Kic = 76.3 ksilii-.)
reported by Rockwell International Corporation [5].
The specimens that were given HT2 showed higher toughness,
but the variation in toughness values with thickness was
similar to those having HT1. At the onset of subcritical
crack growth all toughness values were essentially constant
(Fig. 3). At peak load, the nonlinear toughness values increased
, with decreasing thickness, although the linear toughness, UIc re-
mained more or less constant (Fig. 4). The corresponding G,
values were not determined because of the erratic variation
of this parameter observed in earlier test results.
The toughness values of CORONA-S in the two heat treated
conditions are characteristic of their microstructures. After
" HTl the elongated beta grain structure produced by the low-
beta processing was retained as can be seen in Fig. Sa. The
alpha particles were globular in shape, as seen in Fig. 5b.
During HT2 the specimens were first annealed above the beta
transus, which resulted in completely recrystallized,
equiaxed beta grain formation-(Fig. 6a). Subsequent aging
resulted in formation of long needles of alpha (Fig. 6b).
There was precipitation of the alpha phase along the prior
beta grain boundaries for both heat treatments. However, in
7
Iffl the alpha phase was large and discontinuous (Fig. 5b),
whereas, in HTZ the a phase was relatively thin but almost
continuous (Fig. 6b).
Figs. 7 and 8 show the fracture surfaces of the speci-
mens that were subjected to HT1 and HT2, respectively. The
HT1 specimens failed transgranularly (Fig. 7a) and the frac-
ture surface contained equiaxed dimples (Fig. 7b), as can be
expected from the ductile beta matrix and globular alpha
phase. The HT2 specimens failed along prior beta grain
boundaries (Fig. 8a). The fracture in this condition also was
ductile and occurred predominantly along the interface between
the beta and grain-boundary alpha phase. A typical fracture
surface from these specimens is seen in Fig. 8b. The high
strength of the matrix, strengthened by fine needles of alpha,
and the formation of the continuous alpha phase along the
grain boundaries seem to have forced the crack to propagate
along the grain boundaries. Other investigators also have
found that continuous phase precipitation along grain
boundaries decreases the toughness of the alloy [5]. The
higher toughness of microstructures similar to HT2 in compari-
son with HTl has been attributed to the difference in shape
of the alpha particles by Chesnutt et al. [6]. Whether the
high toughness of HT2 is due to the needle shape or due to
the fine size of the alpha phase has not been proven.

8
.1 .:
CONCLUSIONS
The applicability of several nonlinear fracture criteria
for CORONA-S specimens in thicknesses lower than that required
by ASTM Standard E399 was examined by studying their variation
with specimen thickness. Two microstructures were studied.
The-results show that:
1. When peak load is taken as the critical point, the
toughness values increase with decreasing thickness
below that required.for plane strain fracture.
2. When the critical point is selected to be the onset
of stable crack growth, the toughness values are
independent of thickness.
3. The toughness values determined at peak load are
generally much higher than that at the onset of
stable crack growth. For example, the 1 in. thick
specimen with HT1 has a nonlinear energy toughness
2value of 971 in. lb/in. at peak load and 481 in. lb/in.2
at the onset of stable crack growth.
4. The microstructure containing fine needles of alpha
was found to yield higher toughness than those con-
taining globular alpha.
4 -
9
REFERENCES
1. J. Eftis, D. L. Jones and H. Liebowitz, Engng. Fract.
Mech, Vol. 7, p. 491, 1975.
2. A. A. Wells, Proc. Conf. Crack Propagation, Cranfield,
England, p. 210, 1962.
3. *J. A. Begley and J. R. Landes, Fracture Toughness, ASTM
STP 514, Am. Soc. Test. Mat'ls., 1972.
4. P. K. Poulose, D. L. Jones and H. Liebowitz, A Comparison
of the Geometry Dependen~e of Several Nonlinear Fracture
Toughness Parameters, to be Published in Engng. Fract.
Mech.
5. G. R. Keller, J. C. Chesnutt, F. H. Froes and C. A.
Rhodes, Naval Air Systems Command Report NA-78-917,
December 1978.
6. J. C. Chesnutt et al., Fracture, 1977, Vol. 2, p. 195.
-:
.. ,,

* 102FRACTURE TOUGHNESS (J/rn 2
0 0 0 0 4
7 0 IU 00 -
0000 F.44
4-) u
UG 0 0 cAu
41
Cll
C)G
000 U) U) 41C/3 t-4 ) S-i
z 41 cU
Uc 0E- 4 Cd Or
C14 -D u 4
0 000 4- 5H
C; 4 4-0
004
41
r-4h
-I * 4
(iur/ T-U0 Sr~i~l4 -0 0

2FRACTURE TOUGHNESS (MJ/m
I- m 4-4
0 00
100
rw0
414
'r-4
4'4)
coc
e44 z-
Cd13
4- 4.)
-r
0'4J
co F-
CCU4c It*4.
iulq-T o~Ngo. 0 0i~
2,~

122FRACTURE TOUGHNESS (MJ/m)
0 0 0E- 00
0l 1 - -0
bo
00 0 .
4J U~44 CU
'n v-I
4-
H- *w44u0
+j@
S14J
P4 0
A,
0 0
4-'m '44 CU
04)1
9 4)
0 * ~ rv4.1
01
oD 00 0Go 0l0w
zz

13
2* FRACTURE TOUGHNESS (MJ/m)
CD In CD ICD"
0%
4-4
CoU
r-4 S2)
4)
0-. 0
to-
94 U
0! 0
o3 0 41
z ~p4
0D CUD2CD CD CD.
00 0o
uT/q-uT)SSUNMOI llfl~00
z'

14
1-
(a)
I *. (b)
Fig. S. Heat treatment 1 (a) Elongatedgrain structure XSO(b) Globular a in 8 matrix XSOO.
(a)
(b)
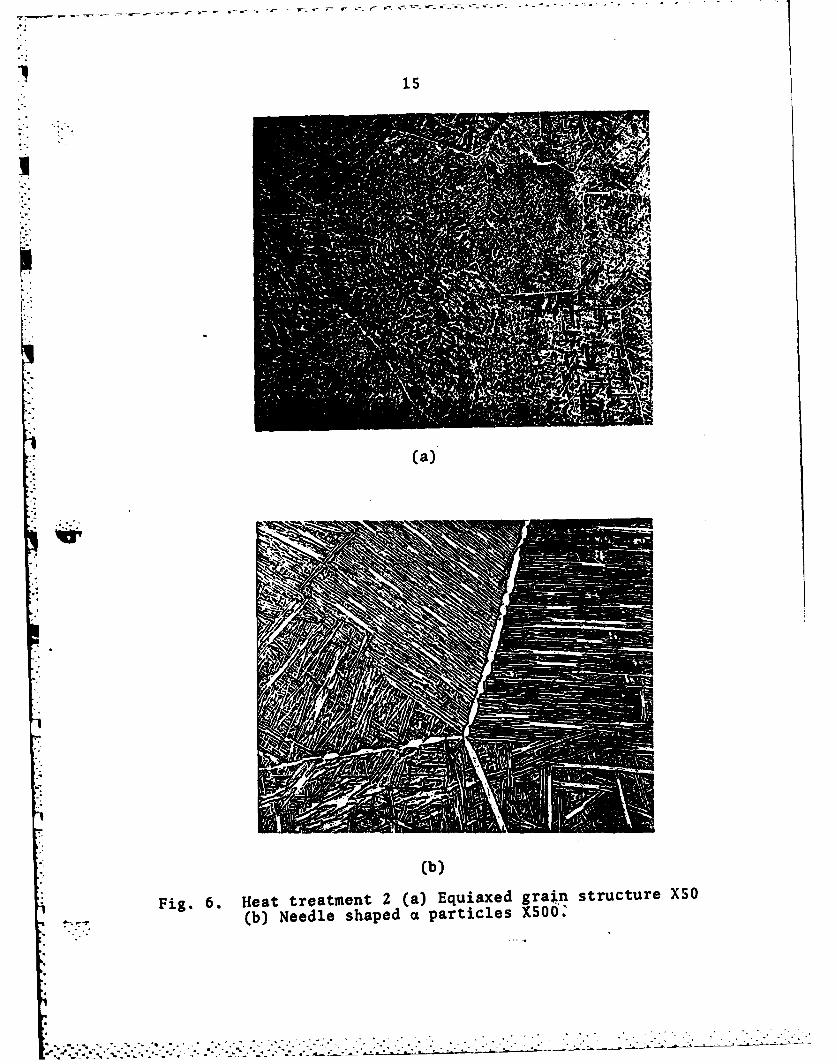
Fig. 6. Heat treatment 2 (a) Equiaxed grain structure X50(b) Needle shaped a particles XSOO:

16
, i%;A
.Wt. 11
,
(a)
! , !
(b)
* Fig. 7. Heat treatment 1 (a) Transgranular fracture surface\ X68-:* (b) Equjaxed dimples at fracture su#f ace X1350.
• . . o o . . . . .. . . .. . . .. . . . .
. . "- ." ".' " - " . ; " . "-" " . .- - . . -' '. - ,-.- - . '- , '" -,-i'" - ' i-:,do '- '" ."

17
0 4
~-.4
(a)
I~Iv
4'
Fig. 8. Heat treatment 2 (a) Intergranular fracture surface X65
(b) Facets indicating fracture alohg the a- nefc
X1300. ~~ -0itefc

FILMED
1 83
D IC