ad-hoc on demand distance vector (aodv) performance ... · ad-hoc on demand distance vector (aodv)...
TRANSCRIPT
Ad-hoc On Demand Distance Vector (AODV) Performance
Enhancement with Active Route Time-Out parameter
WADHAH AL-MANDHARI
1, KOICHI GYODA
2, NOBUO NAKAJIMA
1
1 Department of Human Communications
The University of Electro-Communications
1-5-1 Chofugaoka, Chofu-shi, Tokyo 182-8585
JAPAN
[email protected], [email protected] 2 Department of Communication Engineering,
Shibaura Institute of Technology
3-7-5 Toyosu, Koutou-ku, Tokyo 135-8548
JAPAN
Abstract: - The routing protocols play an important role in the performance of the Ad-hoc mobile networks.
The Ad-hoc On-Demand Distance Vector Routing Protocol (AODV) is a reactive routing protocol for mobile
networks. The route discovery process in AODV is initiated only prior to link establishment for data
communication. This research focuses on the effect of the Route states hold time parameter on the performance
of the Ad-hoc mobile network which is indicated by the Packet Delivery Rate (PDR). Our aim is to identify the
effect of varying Route states hold time parameters for Ad-hoc On Demand Distance Vector (AODV) and
measure the degree at which the number of stations and their movement speeds affects the PDR. These factors
are presented, discussed and simulated using OPNET simulation software.
Key-Words: - Aodv, Opnet, Olsr, Rreq, Rrep, Active route timeout (ART), Packet delivery rate (PDR)
1 Introduction There are two categories of wireless networks.
Wireless infrastructure networks are the first type;
and consist of fixed and wired gateways.
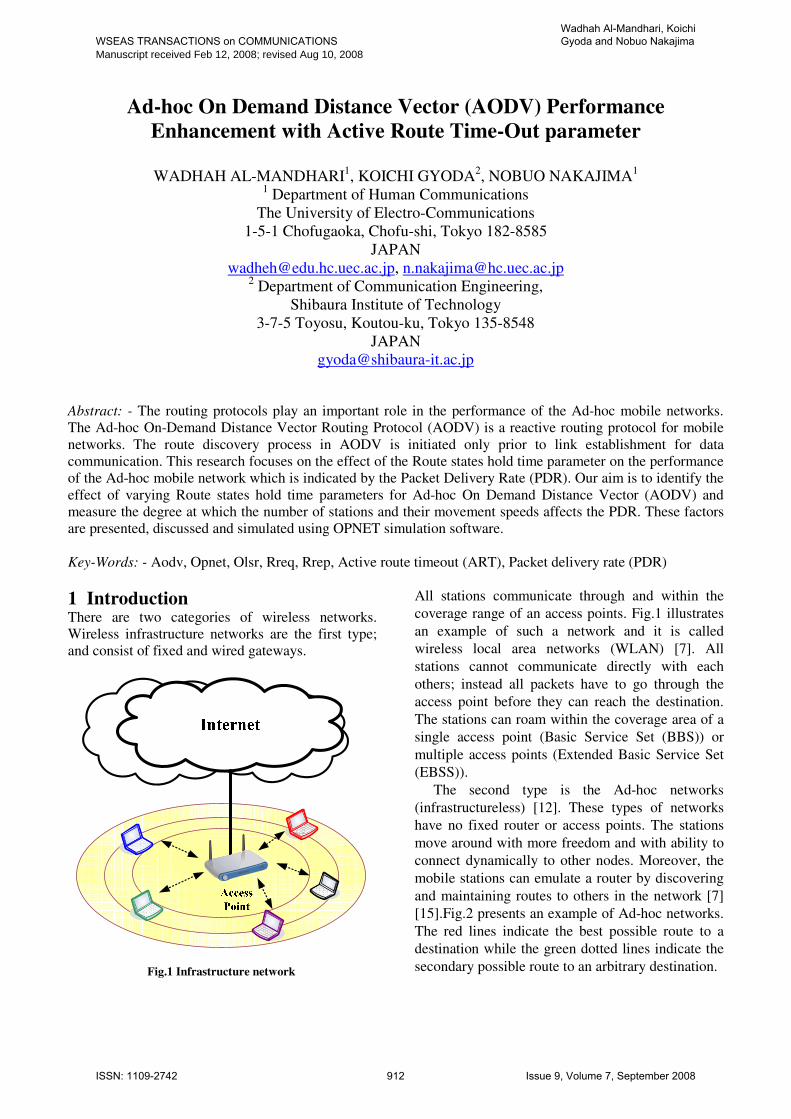
Fig.1 Infrastructure network
All stations communicate through and within the
coverage range of an access points. Fig.1 illustrates
an example of such a network and it is called
wireless local area networks (WLAN) [7]. All
stations cannot communicate directly with each
others; instead all packets have to go through the
access point before they can reach the destination.
The stations can roam within the coverage area of a
single access point (Basic Service Set (BBS)) or
multiple access points (Extended Basic Service Set
(EBSS)).
The second type is the Ad-hoc networks
(infrastructureless) [12]. These types of networks
have no fixed router or access points. The stations
move around with more freedom and with ability to
connect dynamically to other nodes. Moreover, the
mobile stations can emulate a router by discovering
and maintaining routes to others in the network [7]
[15].Fig.2 presents an example of Ad-hoc networks.
The red lines indicate the best possible route to a
destination while the green dotted lines indicate the
secondary possible route to an arbitrary destination.
WSEAS TRANSACTIONS on COMMUNICATIONSManuscript received Feb 12, 2008; revised Aug 10, 2008
Wadhah Al-Mandhari, Koichi Gyoda and Nobuo Nakajima
ISSN: 1109-2742 912 Issue 9, Volume 7, September 2008
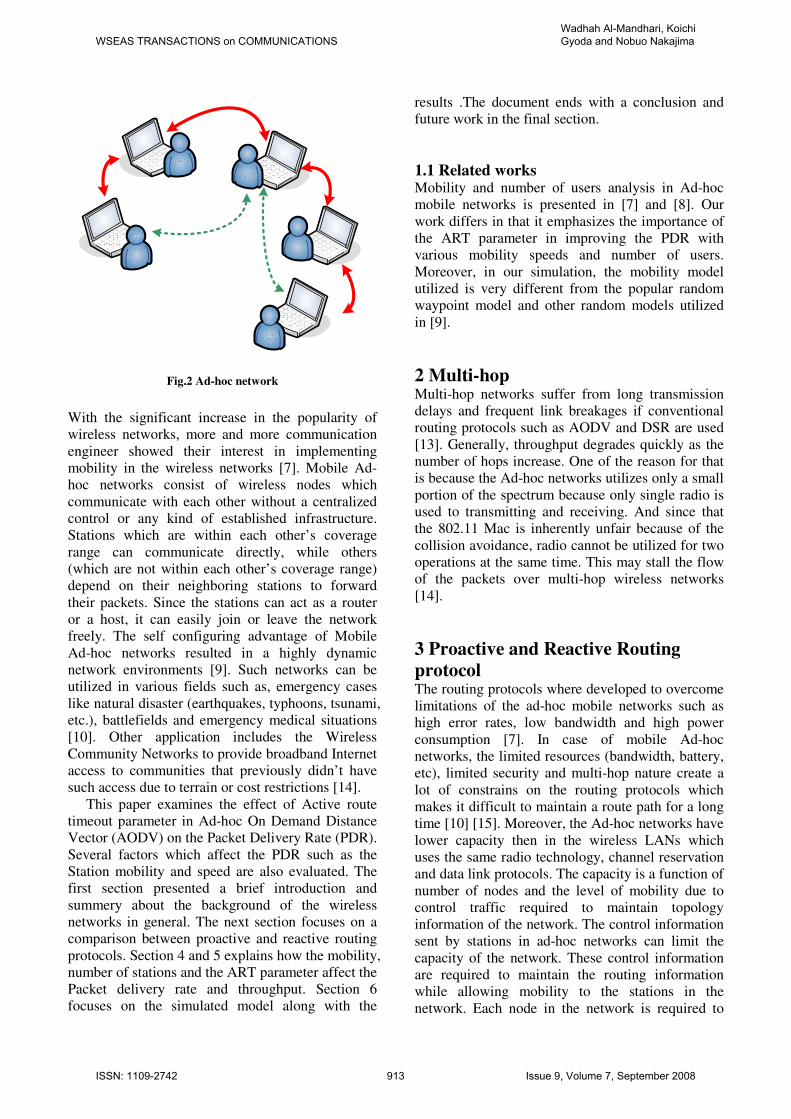
Fig.2 Ad-hoc network
With the significant increase in the popularity of
wireless networks, more and more communication
engineer showed their interest in implementing
mobility in the wireless networks [7]. Mobile Ad-
hoc networks consist of wireless nodes which
communicate with each other without a centralized
control or any kind of established infrastructure.
Stations which are within each other’s coverage
range can communicate directly, while others
(which are not within each other’s coverage range)
depend on their neighboring stations to forward
their packets. Since the stations can act as a router
or a host, it can easily join or leave the network
freely. The self configuring advantage of Mobile
Ad-hoc networks resulted in a highly dynamic
network environments [9]. Such networks can be
utilized in various fields such as, emergency cases
like natural disaster (earthquakes, typhoons, tsunami,
etc.), battlefields and emergency medical situations
[10]. Other application includes the Wireless
Community Networks to provide broadband Internet
access to communities that previously didn’t have
such access due to terrain or cost restrictions [14].
This paper examines the effect of Active route
timeout parameter in Ad-hoc On Demand Distance
Vector (AODV) on the Packet Delivery Rate (PDR).
Several factors which affect the PDR such as the
Station mobility and speed are also evaluated. The
first section presented a brief introduction and
summery about the background of the wireless
networks in general. The next section focuses on a
comparison between proactive and reactive routing
protocols. Section 4 and 5 explains how the mobility,
number of stations and the ART parameter affect the
Packet delivery rate and throughput. Section 6
focuses on the simulated model along with the
results .The document ends with a conclusion and
future work in the final section.
1.1 Related works Mobility and number of users analysis in Ad-hoc
mobile networks is presented in [7] and [8]. Our
work differs in that it emphasizes the importance of
the ART parameter in improving the PDR with
various mobility speeds and number of users.
Moreover, in our simulation, the mobility model
utilized is very different from the popular random
waypoint model and other random models utilized
in [9].
2 Multi-hop Multi-hop networks suffer from long transmission
delays and frequent link breakages if conventional
routing protocols such as AODV and DSR are used
[13]. Generally, throughput degrades quickly as the
number of hops increase. One of the reason for that
is because the Ad-hoc networks utilizes only a small
portion of the spectrum because only single radio is
used to transmitting and receiving. And since that
the 802.11 Mac is inherently unfair because of the
collision avoidance, radio cannot be utilized for two
operations at the same time. This may stall the flow
of the packets over multi-hop wireless networks
[14].
3 Proactive and Reactive Routing
protocol The routing protocols where developed to overcome
limitations of the ad-hoc mobile networks such as
high error rates, low bandwidth and high power
consumption [7]. In case of mobile Ad-hoc
networks, the limited resources (bandwidth, battery,
etc), limited security and multi-hop nature create a
lot of constrains on the routing protocols which
makes it difficult to maintain a route path for a long
time [10] [15]. Moreover, the Ad-hoc networks have
lower capacity then in the wireless LANs which
uses the same radio technology, channel reservation
and data link protocols. The capacity is a function of
number of nodes and the level of mobility due to
control traffic required to maintain topology
information of the network. The control information
sent by stations in ad-hoc networks can limit the
capacity of the network. These control information
are required to maintain the routing information
while allowing mobility to the stations in the
network. Each node in the network is required to
WSEAS TRANSACTIONS on COMMUNICATIONSWadhah Al-Mandhari, Koichi Gyoda and Nobuo Nakajima
ISSN: 1109-2742 913 Issue 9, Volume 7, September 2008
locate a route to the destination and announce this
routing information to the neighboring stations. One of the challenges in large networks is the
congestion due to the large amount of control
massages which consume a major part of the
available bandwidth [11]. Routing protocols can be
categorized as reactive or proactive protocols.
Proactive routing protocol such as OLSR maintains
reliable routing information in the network by
updating the topological information of the network
continually. This is done through announcing
(broadcasting) any changes in the route information
to other nodes. This information is stored in the
routing tables within the mobile nodes. On the other
hand, the reactive routing protocol differs in that it
defines the most suitable route from source to
destination only when required. In this case, the
route discovery is initiated when need by the source
node. Once the route is established, it will be
maintain by the route maintenance procedure until
the route in no longer desired or the destination is no
longer accusable from all routes[7][11].
3.1 AODV and OLSR Table 1 compares between the two routing protocols
AODV and OLSR. The two routing protocols are
characterized with many parameters which define
how the protocol will perform in different situation.
Table 1 comparison between AODV and OLSR
Features AODV OLSR
Protocol type Reactive Proactive
Route discovery Distance –victor
routing
Link-state
routing
algorithm
Reliability low high
Complexity low high
Scalability High low
Latency High low
Network size limit Up to 1000 station
Can handle
more then
1000
Band width
required Low High
Mobility High low
We focused on the parameters which affect the
route discovery and route states hold times. For
example in AODV, we concentrate on the effect of
Active route timeout (ART) which is a static
parameter that defines how long the route state is
kept in the routing table after the last transmission
of packet on this route. In the case of OLSR, the
route state hold time is characterized by Hello
Interval and Neighbor Hold Time parameter [4].
3.2 Route discovery in AODV All active nodes in AODV broadcast Hello
messages to detect links to any neighboring nodes.
These Hello messages are also used to detect link
break that occur when the node fails to receive any
hello messages from a specific neighbor.
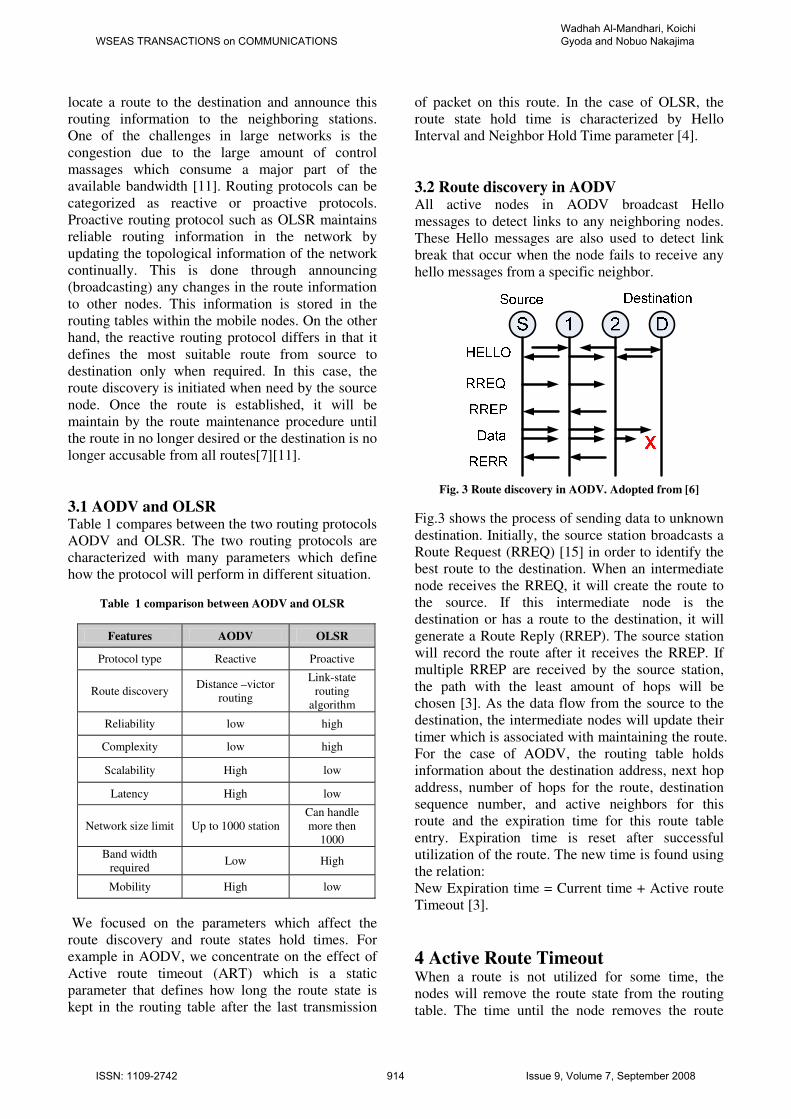
Fig. 3 Route discovery in AODV. Adopted from [6]
Fig.3 shows the process of sending data to unknown
destination. Initially, the source station broadcasts a
Route Request (RREQ) [15] in order to identify the
best route to the destination. When an intermediate
node receives the RREQ, it will create the route to
the source. If this intermediate node is the
destination or has a route to the destination, it will
generate a Route Reply (RREP). The source station
will record the route after it receives the RREP. If
multiple RREP are received by the source station,
the path with the least amount of hops will be
chosen [3]. As the data flow from the source to the
destination, the intermediate nodes will update their
timer which is associated with maintaining the route.
For the case of AODV, the routing table holds
information about the destination address, next hop
address, number of hops for the route, destination
sequence number, and active neighbors for this
route and the expiration time for this route table
entry. Expiration time is reset after successful
utilization of the route. The new time is found using
the relation:
New Expiration time = Current time + Active route
Timeout [3].
4 Active Route Timeout When a route is not utilized for some time, the
nodes will remove the route state from the routing
table. The time until the node removes the route
WSEAS TRANSACTIONS on COMMUNICATIONSWadhah Al-Mandhari, Koichi Gyoda and Nobuo Nakajima
ISSN: 1109-2742 914 Issue 9, Volume 7, September 2008
states is called Active Route Timeout (ART). ART
is the time at which the route is considered invalid.
4.1 Mobility and ART value The mobility model is specified by speed, direction
and the pauses or stops in the movement. Mobility is
an important performance affecting factor in
wireless networks. It significantly impacts the
packet delivery rate and the packet delay.
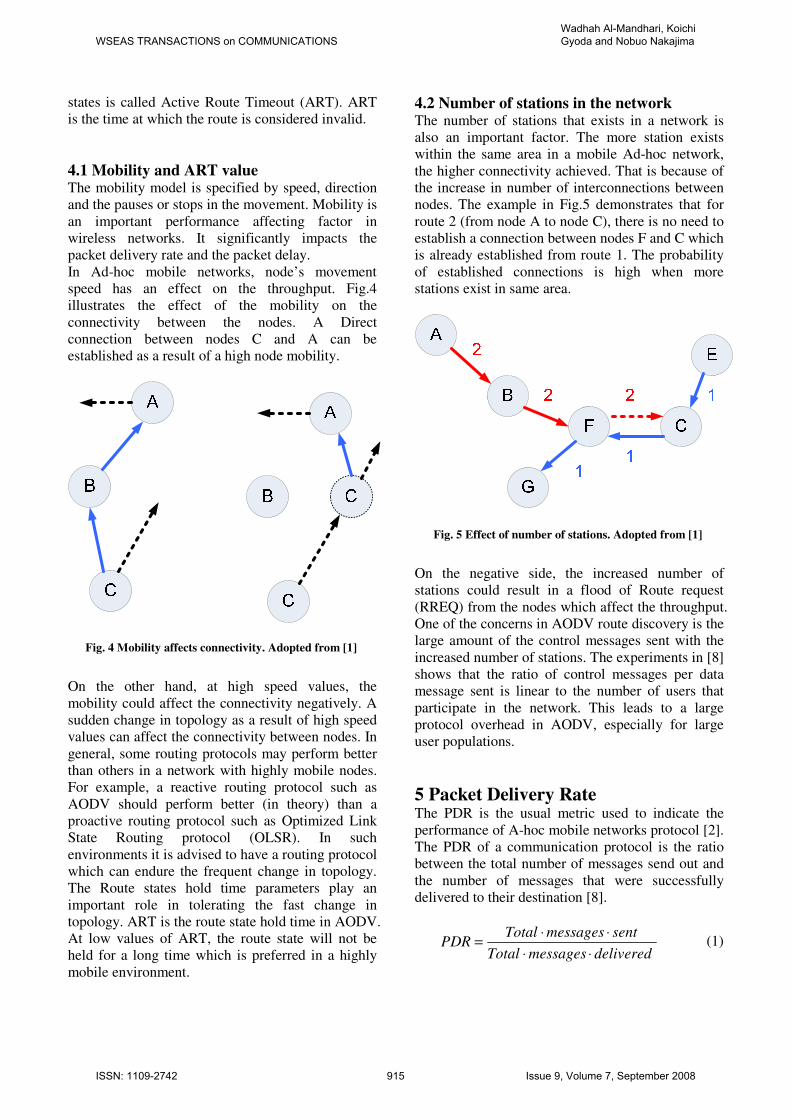
In Ad-hoc mobile networks, node’s movement
speed has an effect on the throughput. Fig.4
illustrates the effect of the mobility on the
connectivity between the nodes. A Direct
connection between nodes C and A can be
established as a result of a high node mobility.
Fig. 4 Mobility affects connectivity. Adopted from [1]
On the other hand, at high speed values, the
mobility could affect the connectivity negatively. A
sudden change in topology as a result of high speed
values can affect the connectivity between nodes. In
general, some routing protocols may perform better
than others in a network with highly mobile nodes.
For example, a reactive routing protocol such as
AODV should perform better (in theory) than a
proactive routing protocol such as Optimized Link
State Routing protocol (OLSR). In such
environments it is advised to have a routing protocol
which can endure the frequent change in topology.
The Route states hold time parameters play an
important role in tolerating the fast change in
topology. ART is the route state hold time in AODV.
At low values of ART, the route state will not be
held for a long time which is preferred in a highly
mobile environment.
4.2 Number of stations in the network The number of stations that exists in a network is
also an important factor. The more station exists
within the same area in a mobile Ad-hoc network,
the higher connectivity achieved. That is because of
the increase in number of interconnections between
nodes. The example in Fig.5 demonstrates that for
route 2 (from node A to node C), there is no need to
establish a connection between nodes F and C which
is already established from route 1. The probability
of established connections is high when more
stations exist in same area.
Fig. 5 Effect of number of stations. Adopted from [1]
On the negative side, the increased number of
stations could result in a flood of Route request
(RREQ) from the nodes which affect the throughput.
One of the concerns in AODV route discovery is the
large amount of the control messages sent with the
increased number of stations. The experiments in [8]
shows that the ratio of control messages per data
message sent is linear to the number of users that
participate in the network. This leads to a large
protocol overhead in AODV, especially for large
user populations.
5 Packet Delivery Rate The PDR is the usual metric used to indicate the
performance of A-hoc mobile networks protocol [2].
The PDR of a communication protocol is the ratio
between the total number of messages send out and
the number of messages that were successfully
delivered to their destination [8].
deliveredmessagesTotal
sentmessagesTotalPDR
⋅⋅
⋅⋅= (1)
WSEAS TRANSACTIONS on COMMUNICATIONSWadhah Al-Mandhari, Koichi Gyoda and Nobuo Nakajima
ISSN: 1109-2742 915 Issue 9, Volume 7, September 2008
The highest value of PDR is 1; which indicates a
good performance since all the sent messages are
successfully delivered.
6 Simulation Two ad-hoc network arrangements were simulated
in this work. The first setup was adopted to evaluate
the effect of ART value, station’s speed and number
of stations in a mobile ad-hoc network. Packet
Delivery Rate (PDR) was used as a metric for
evaluation. The second arrangement evaluates the
effect of number of hops on PDR and on the end-to-
end delay in a wireless multi-hop Ad-hoc network.
The main difference from the first arrangement is
that the stations are not mobile; that is because of
the difficulty to estimate the number-of hops effect
in a mobile network. The results from these
simulations are important for proposing solution to
the throughput degradation problem in Ad-hoc
mobile networks.
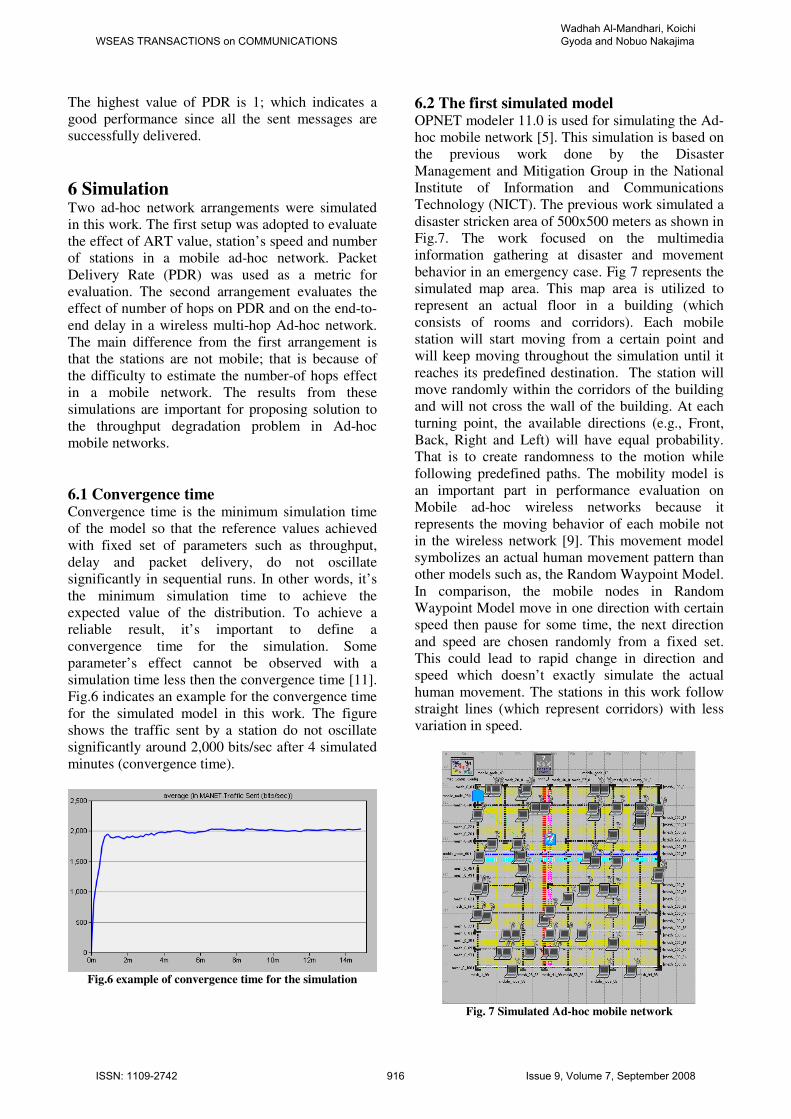
6.1 Convergence time Convergence time is the minimum simulation time
of the model so that the reference values achieved
with fixed set of parameters such as throughput,
delay and packet delivery, do not oscillate
significantly in sequential runs. In other words, it’s
the minimum simulation time to achieve the
expected value of the distribution. To achieve a
reliable result, it’s important to define a
convergence time for the simulation. Some
parameter’s effect cannot be observed with a
simulation time less then the convergence time [11].
Fig.6 indicates an example for the convergence time
for the simulated model in this work. The figure
shows the traffic sent by a station do not oscillate
significantly around 2,000 bits/sec after 4 simulated
minutes (convergence time).
Fig.6 example of convergence time for the simulation
6.2 The first simulated model OPNET modeler 11.0 is used for simulating the Ad-
hoc mobile network [5]. This simulation is based on
the previous work done by the Disaster
Management and Mitigation Group in the National
Institute of Information and Communications
Technology (NICT). The previous work simulated a
disaster stricken area of 500x500 meters as shown in
Fig.7. The work focused on the multimedia
information gathering at disaster and movement
behavior in an emergency case. Fig 7 represents the
simulated map area. This map area is utilized to
represent an actual floor in a building (which
consists of rooms and corridors). Each mobile
station will start moving from a certain point and
will keep moving throughout the simulation until it
reaches its predefined destination. The station will
move randomly within the corridors of the building
and will not cross the wall of the building. At each
turning point, the available directions (e.g., Front,
Back, Right and Left) will have equal probability.
That is to create randomness to the motion while
following predefined paths. The mobility model is
an important part in performance evaluation on
Mobile ad-hoc wireless networks because it
represents the moving behavior of each mobile not
in the wireless network [9]. This movement model
symbolizes an actual human movement pattern than
other models such as, the Random Waypoint Model.
In comparison, the mobile nodes in Random
Waypoint Model move in one direction with certain
speed then pause for some time, the next direction
and speed are chosen randomly from a fixed set.
This could lead to rapid change in direction and
speed which doesn’t exactly simulate the actual
human movement. The stations in this work follow
straight lines (which represent corridors) with less
variation in speed.
Fig. 7 Simulated Ad-hoc mobile network
WSEAS TRANSACTIONS on COMMUNICATIONSWadhah Al-Mandhari, Koichi Gyoda and Nobuo Nakajima
ISSN: 1109-2742 916 Issue 9, Volume 7, September 2008
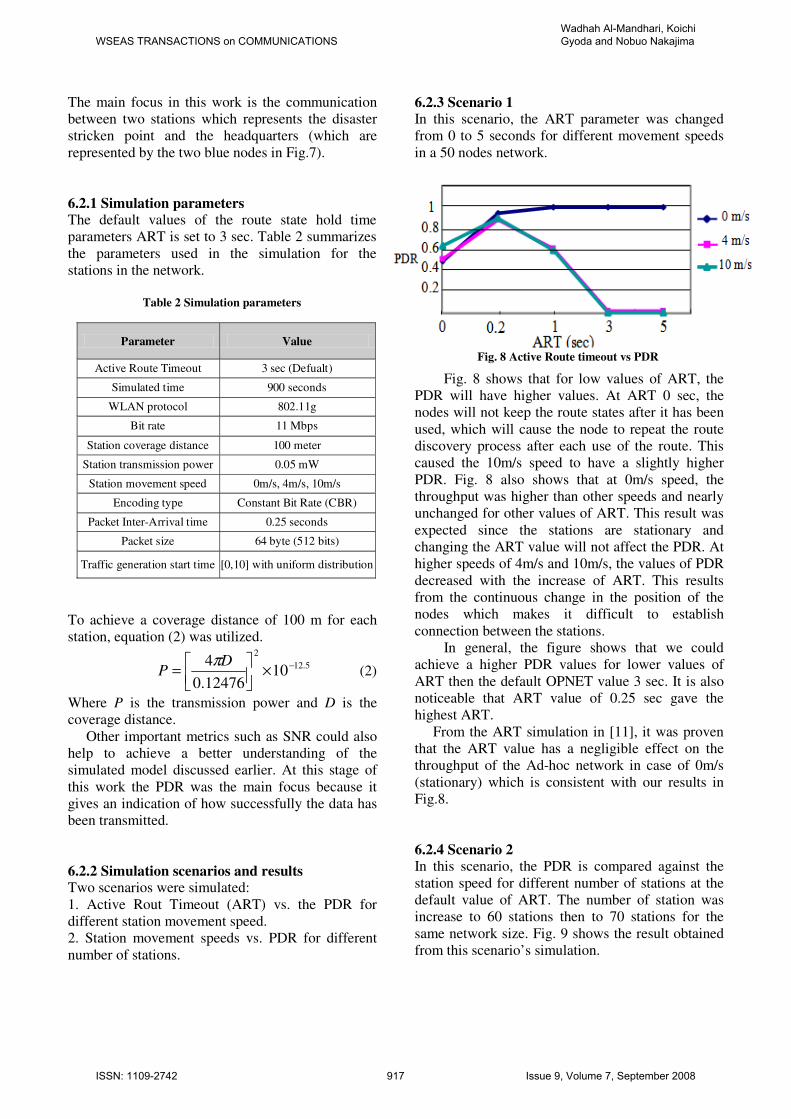
The main focus in this work is the communication
between two stations which represents the disaster
stricken point and the headquarters (which are
represented by the two blue nodes in Fig.7).
6.2.1 Simulation parameters The default values of the route state hold time
parameters ART is set to 3 sec. Table 2 summarizes
the parameters used in the simulation for the
stations in the network.
Table 2 Simulation parameters
Parameter Value
Active Route Timeout 3 sec (Defualt)
Simulated time 900 seconds
WLAN protocol 802.11g
Bit rate 11 Mbps
Station coverage distance 100 meter
Station transmission power 0.05 mW
Station movement speed 0m/s, 4m/s, 10m/s
Encoding type Constant Bit Rate (CBR)
Packet Inter-Arrival time 0.25 seconds
Packet size 64 byte (512 bits)
Traffic generation start time [0,10] with uniform distribution
To achieve a coverage distance of 100 m for each
station, equation (2) was utilized.
5.12
2
1012476.0
4−
×
=
DP
π (2)
Where P is the transmission power and D is the
coverage distance.
Other important metrics such as SNR could also
help to achieve a better understanding of the
simulated model discussed earlier. At this stage of
this work the PDR was the main focus because it
gives an indication of how successfully the data has
been transmitted.
6.2.2 Simulation scenarios and results Two scenarios were simulated:
1. Active Rout Timeout (ART) vs. the PDR for
different station movement speed.
2. Station movement speeds vs. PDR for different
number of stations.
6.2.3 Scenario 1 In this scenario, the ART parameter was changed
from 0 to 5 seconds for different movement speeds
in a 50 nodes network.
Fig. 8 Active Route timeout vs PDR
Fig. 8 shows that for low values of ART, the
PDR will have higher values. At ART 0 sec, the
nodes will not keep the route states after it has been
used, which will cause the node to repeat the route
discovery process after each use of the route. This
caused the 10m/s speed to have a slightly higher
PDR. Fig. 8 also shows that at 0m/s speed, the
throughput was higher than other speeds and nearly
unchanged for other values of ART. This result was
expected since the stations are stationary and
changing the ART value will not affect the PDR. At
higher speeds of 4m/s and 10m/s, the values of PDR
decreased with the increase of ART. This results
from the continuous change in the position of the
nodes which makes it difficult to establish
connection between the stations.
In general, the figure shows that we could
achieve a higher PDR values for lower values of
ART then the default OPNET value 3 sec. It is also
noticeable that ART value of 0.25 sec gave the
highest ART.
From the ART simulation in [11], it was proven
that the ART value has a negligible effect on the
throughput of the Ad-hoc network in case of 0m/s
(stationary) which is consistent with our results in
Fig.8.
6.2.4 Scenario 2 In this scenario, the PDR is compared against the
station speed for different number of stations at the
default value of ART. The number of station was
increase to 60 stations then to 70 stations for the
same network size. Fig. 9 shows the result obtained
from this scenario’s simulation.
WSEAS TRANSACTIONS on COMMUNICATIONSWadhah Al-Mandhari, Koichi Gyoda and Nobuo Nakajima
ISSN: 1109-2742 917 Issue 9, Volume 7, September 2008
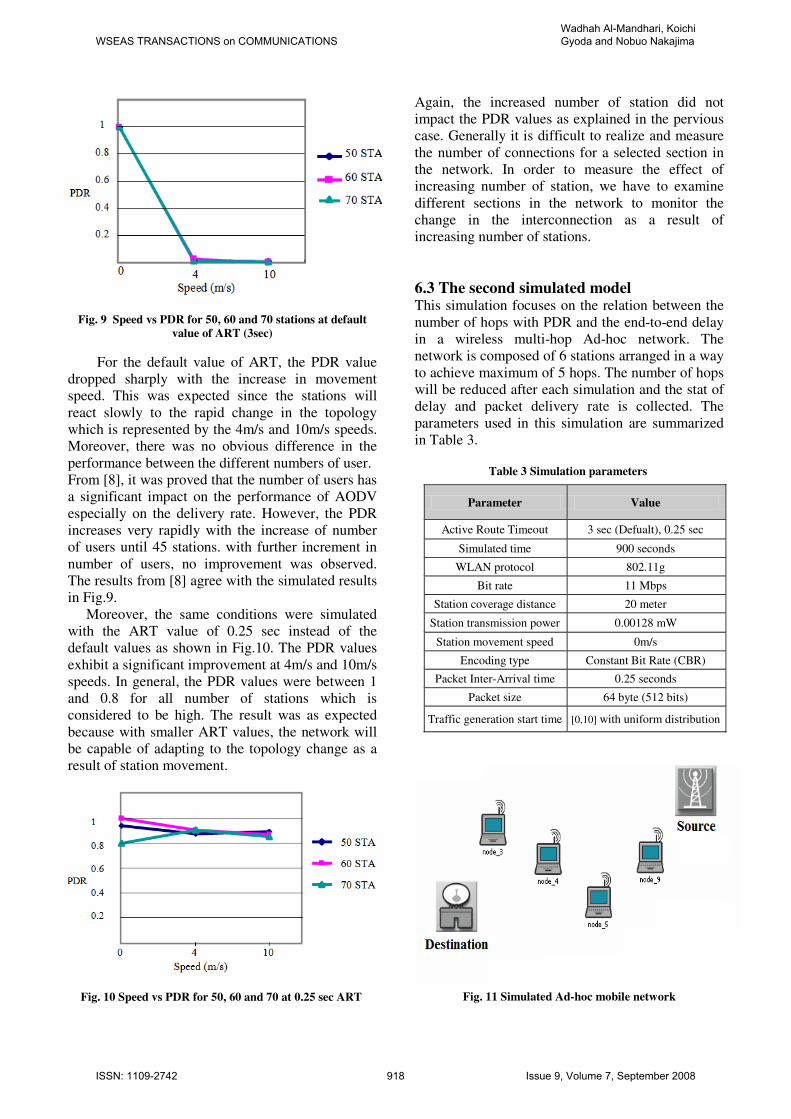
Fig. 9 Speed vs PDR for 50, 60 and 70 stations at default
value of ART (3sec)
For the default value of ART, the PDR value
dropped sharply with the increase in movement
speed. This was expected since the stations will
react slowly to the rapid change in the topology
which is represented by the 4m/s and 10m/s speeds.
Moreover, there was no obvious difference in the
performance between the different numbers of user.
From [8], it was proved that the number of users has
a significant impact on the performance of AODV
especially on the delivery rate. However, the PDR
increases very rapidly with the increase of number
of users until 45 stations. with further increment in
number of users, no improvement was observed.
The results from [8] agree with the simulated results
in Fig.9.
Moreover, the same conditions were simulated
with the ART value of 0.25 sec instead of the
default values as shown in Fig.10. The PDR values
exhibit a significant improvement at 4m/s and 10m/s
speeds. In general, the PDR values were between 1
and 0.8 for all number of stations which is
considered to be high. The result was as expected
because with smaller ART values, the network will
be capable of adapting to the topology change as a
result of station movement.
Fig. 10 Speed vs PDR for 50, 60 and 70 at 0.25 sec ART
Again, the increased number of station did not
impact the PDR values as explained in the pervious
case. Generally it is difficult to realize and measure
the number of connections for a selected section in
the network. In order to measure the effect of
increasing number of station, we have to examine
different sections in the network to monitor the
change in the interconnection as a result of
increasing number of stations.
6.3 The second simulated model This simulation focuses on the relation between the
number of hops with PDR and the end-to-end delay
in a wireless multi-hop Ad-hoc network. The
network is composed of 6 stations arranged in a way
to achieve maximum of 5 hops. The number of hops
will be reduced after each simulation and the stat of
delay and packet delivery rate is collected. The
parameters used in this simulation are summarized
in Table 3.
Table 3 Simulation parameters
Parameter Value
Active Route Timeout 3 sec (Defualt), 0.25 sec
Simulated time 900 seconds
WLAN protocol 802.11g
Bit rate 11 Mbps
Station coverage distance 20 meter
Station transmission power 0.00128 mW
Station movement speed 0m/s
Encoding type Constant Bit Rate (CBR)
Packet Inter-Arrival time 0.25 seconds
Packet size 64 byte (512 bits)
Traffic generation start time [0,10] with uniform distribution
Fig. 11 Simulated Ad-hoc mobile network
WSEAS TRANSACTIONS on COMMUNICATIONSWadhah Al-Mandhari, Koichi Gyoda and Nobuo Nakajima
ISSN: 1109-2742 918 Issue 9, Volume 7, September 2008
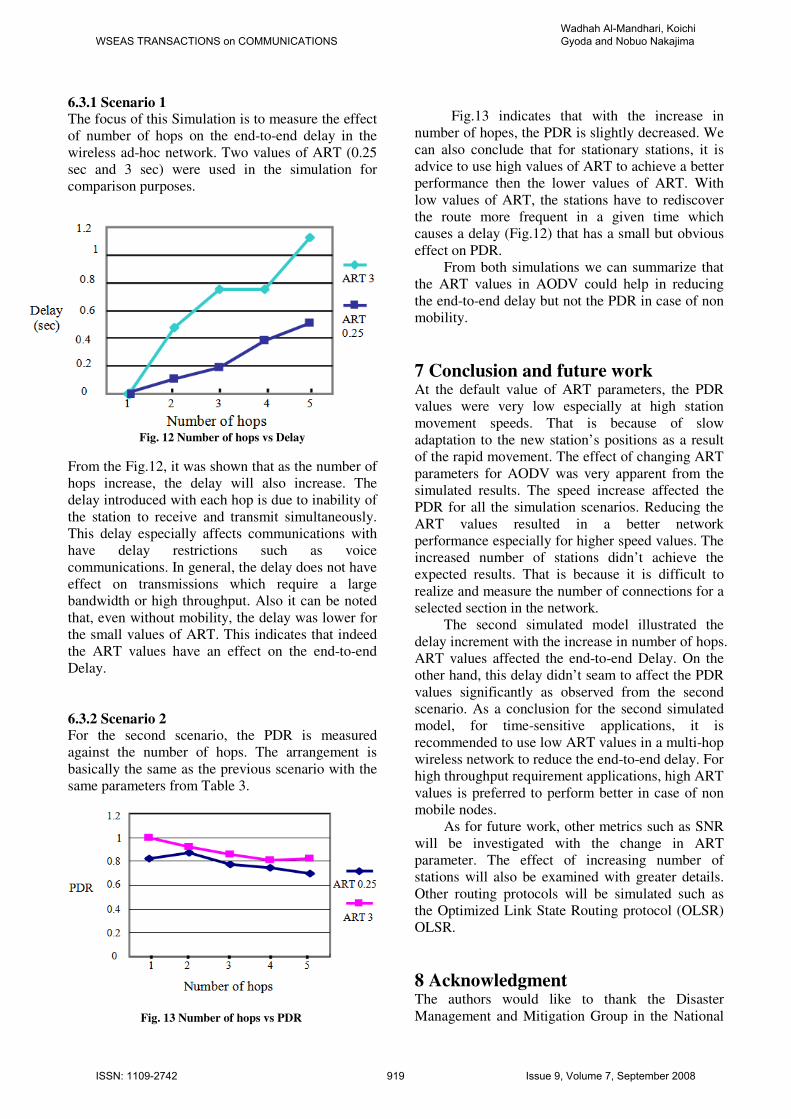
6.3.1 Scenario 1 The focus of this Simulation is to measure the effect
of number of hops on the end-to-end delay in the
wireless ad-hoc network. Two values of ART (0.25
sec and 3 sec) were used in the simulation for
comparison purposes.
Fig. 12 Number of hops vs Delay
From the Fig.12, it was shown that as the number of
hops increase, the delay will also increase. The
delay introduced with each hop is due to inability of
the station to receive and transmit simultaneously.
This delay especially affects communications with
have delay restrictions such as voice
communications. In general, the delay does not have
effect on transmissions which require a large
bandwidth or high throughput. Also it can be noted
that, even without mobility, the delay was lower for
the small values of ART. This indicates that indeed
the ART values have an effect on the end-to-end
Delay.
6.3.2 Scenario 2 For the second scenario, the PDR is measured
against the number of hops. The arrangement is
basically the same as the previous scenario with the
same parameters from Table 3.
Fig. 13 Number of hops vs PDR
Fig.13 indicates that with the increase in
number of hopes, the PDR is slightly decreased. We
can also conclude that for stationary stations, it is
advice to use high values of ART to achieve a better
performance then the lower values of ART. With
low values of ART, the stations have to rediscover
the route more frequent in a given time which
causes a delay (Fig.12) that has a small but obvious
effect on PDR.
From both simulations we can summarize that
the ART values in AODV could help in reducing
the end-to-end delay but not the PDR in case of non
mobility.
7 Conclusion and future work At the default value of ART parameters, the PDR
values were very low especially at high station
movement speeds. That is because of slow
adaptation to the new station’s positions as a result
of the rapid movement. The effect of changing ART
parameters for AODV was very apparent from the
simulated results. The speed increase affected the
PDR for all the simulation scenarios. Reducing the
ART values resulted in a better network
performance especially for higher speed values. The
increased number of stations didn’t achieve the
expected results. That is because it is difficult to
realize and measure the number of connections for a
selected section in the network.
The second simulated model illustrated the
delay increment with the increase in number of hops.
ART values affected the end-to-end Delay. On the
other hand, this delay didn’t seam to affect the PDR
values significantly as observed from the second
scenario. As a conclusion for the second simulated
model, for time-sensitive applications, it is
recommended to use low ART values in a multi-hop
wireless network to reduce the end-to-end delay. For
high throughput requirement applications, high ART
values is preferred to perform better in case of non
mobile nodes.
As for future work, other metrics such as SNR
will be investigated with the change in ART
parameter. The effect of increasing number of
stations will also be examined with greater details.
Other routing protocols will be simulated such as
the Optimized Link State Routing protocol (OLSR)
OLSR.
8 Acknowledgment The authors would like to thank the Disaster
Management and Mitigation Group in the National
WSEAS TRANSACTIONS on COMMUNICATIONSWadhah Al-Mandhari, Koichi Gyoda and Nobuo Nakajima
ISSN: 1109-2742 919 Issue 9, Volume 7, September 2008
Institute of Information and Communications
Technology (NICT) for allocating resources for
realizing this project.
References:
[1] Yu Chen, Wenbo Wang, The Measurement
and Auto-Configuration of Ad-hoc, in
Proceeding the 14th IEEE 2003 International
Symposium on Personal, indoor and Mobile
Radio Communication, Vol.2 ,Sept 2003,
pp.1649- 1653.
[2] Claude Richard, Charles E.Perkins, Cedric
Westphal, Defining an Optimal Active Route
Timeout for the AODV Routing Protocol,
Second Annual IEEE Communications Society
Conference on Sensor and Ad-Hoc
Communications and Networks, IEEE SECON
2005, California, USA, Sep. 26-29, 2005.
[3] C. Perkins, E. Belding-Royer, S. Das, Ad-hoc
On-Demand Distance Vector (AODV) Routing,
Internet experimental RFC 3561, July 2003,
pp.7-24.
[4] Georgy Sklyarenko, AODV Routing Protocol,
Seminar Technische Informatik, Institut fur
Informatik,. Freie Universitat Berlin, July 2006.
[5] OPNET Technologies, Inc. OPNET modeler
11.0,
http://www.opnet.com/solutions/network_rd/m
odeler.html.
[6] Ian D. Chakeres, Elizabeth M. Belding-Royer,
AODV Routing Protocol Implementation
Design, in Proceeding of 24th International
Conference on Distributed Computing Systems
Workshops, March 2004, pp.698- 703.
[7] Al-Khwildi A N, Chaudhry S R, Casey Y K
and Al-Raweshidy H S, Mobility Factor in
WLAN-Ad hoc On-Demand Routing Protocols,
9th International Multitopic Conference, IEEE
INMIC 2005, December 2005, pp.1-6.
[8] Chatzigiannakis I, Kaltsa E and Nikoletseas S,
On the effect of user mobility and density on
the performance of ad-hoc mobile networks,
Proceeding of 12th IEEE International
Conference on Networks 2004 (ICON 2004),
16-19 Nov. 2004, pp. 336 - 341 vol.1.
[9] S Gowrishankar, T G Basavaraju and Subir
Kumar Sarkar, Effect of Random Mobility
Models Pattern in Mobile Ad hoc Networks,
IJCSNS International Journal of Computer
Science and Network Security, VOL.7 No.6,
June 2007, pp. 160-164.
[10] GunWoo Park and SangHoon Lee, A Routing
Protocol for Extend Network Lifetime through
the Residual Battery and Link Stability in
MANET, in Proceeding of the APPLIED
COMPUTING CONFERENCE (ACC '08),
Istanbul, Turkey, May 27-30, 2008, pp. 199-
204.
[11] TAPIO FRANTTI and MIRJAMI TARAMAA,
Fundamental Features of Ad Hoc Networks’
Simulations, Proceedings of the 5th WSEAS Int.
Conf. on DATA NETWORKS,
COMMUNICATIONS & COMPUTERS,
Bucharest, Romania, October 16-17, 2006, pp.
137-145.
[12] TZAY-FARN SHIH1, CHAO-CHENG SHIH
and CHIN-LING CHEN, Distributed Multicast
routing protocol for Mobile Ad Hoc Networks,
Proceeding of the 6th WSEAS International
Conference on APPLIED
ELECTROMAGNETICS, WIRELESS and
OPTICAL COMMUNICATIONS
(ELECTROSCIENCE '08), Trondheim, Norway,
July 2-4, 2008, pp. 88-91.
[13] Hong Man, Yang Li and Xinhua Zhuang,
Video Transport over Multi Hop Directional
Wireless Networks, Proceeding of the IEEE
International Conference on Multimedia and
Expo 2006(ICME 2006), July 2006, pp. 1525-
1528.
[14] Richard Draves, Jitendra Padhye and Brian Zill,
Routing in Multi-Radio, Multi-Hop Wireless
Mesh Networks, Proceedings of the 10th
annual international conference on Mobile
computing and networking, September 26 -
October 1, 2004, pp. 114-128.
[15] MONIS AKHLAQ, M NOMAN JAFRI,
MUZAMMIL A KHAN and BABER ASLAM,
Data Security Key Establishment in AODV,
Proceedings of the 6th WSEAS Int. Conf. on
Electronics, Hardware, Wireless and Optical
Communications, Corfu Island, Greece,
February 16-19, 2007, pp. 181-186.
WADHAH AL-MANDHARI received M.Sc. and
B.Sc. degree form Sultan Qaboos University in
Sultanate of Oman, in 2001 and 2006 respectively.
Since October 2006, he joined the Ph.D. program in
the University of Electro-Communications, Tokyo.
He is currently in his second year of the Ph.D.
program. His research interest includes the Wireless
Local Area Networks especially the Quality of
Service in wireless Mesh networks and Ad-hoc
wireless networks.
KOICHI GYODA was born in Nagano Prefecture
Japan on March 2, 1963. He received his B.E., M.E.,
and D.Eng. degrees in electrical and electronic
engineering from Sophia University in 1986, 1988,
and 1992. In 1991, he joined Communication
WSEAS TRANSACTIONS on COMMUNICATIONSWadhah Al-Mandhari, Koichi Gyoda and Nobuo Nakajima
ISSN: 1109-2742 920 Issue 9, Volume 7, September 2008
Research Laboratories (CRL), Ministry of Posts and
Telecommunications. From 1997 to 2001, he was
with ATR Adaptive Communications Research
Laboratories, where he was engaged in research on
wireless ad-hoc networks. From 2001 to 2008, he
had been a senior researcher in CRL and National
Institute of Information and Communications
Technology (NICT) (From 2004, CRL had
reestablished as the NICT). Since 2008, He has been
an associate professor in Shibaura Institute of
Technology, where he is engaged in research on
wireless communication networks.
NOBUO NAKAJIMA received the B.S., M.S. and
Ph.D degrees in electrical engineering from Tohoku
University, Sendai, Japan, in 1970, 1972 and 1982,
respectively. In 1972 he joined the Electrical
Communication Laboratory, NTT. From 1972 to
1979, he was engaged in the research on millimeter-
wave circuits. From 1980 to 1985, he was working
under the development of microwave and mobile
radio antennas. After 1985, he was engaged in the
system design of the digital cellular communication
system. In 1992, he moved to NTT DoCoMo and in
1998, he became a senior vice president. During in
NTT DoCoMo, he was engaged in the development
of future mobile communication systems such as
IMT-2000 and 4th generation system. In 2000, he
moved to University of Electro-Communications
and now he is a professor of the department of
human communications and a director of Advanced
Wireless Communication Research Center (AWCC).
He is a member of IEICE Japan and IEEE vehicular
society.
WSEAS TRANSACTIONS on COMMUNICATIONSWadhah Al-Mandhari, Koichi Gyoda and Nobuo Nakajima
ISSN: 1109-2742 921 Issue 9, Volume 7, September 2008