ad-pd'*g10 o vi sib mayo i rc s i rado if …ad-pd'*g10 o vi sib 17yc mayo o 0...
TRANSCRIPT

AD-pD'*g10 O VI SIB 17YC MAYO 0 O MCMRUOSOUND/WI IAMSI fI A N IA RC IIC A (U INA VAIP S I RADO A IF SCHOOL MON R
A ( i"i RS MAR 8F41111K.1100 66F/G41 N
mhEE~hhhohhEEEmhhomhmmnsoon

11-

I"
NAVAL POSTGRADUATE SCHOOLMonterey, California
ITI
KLECm E
THESIS A I
t THE VISILMT CLIVATOLOCTOF NM3DO SOUW~I'VLLZAI nmED,
ANTARCTCA
by
Cheryl G. Souders
Imrch 1966
flThasis After . J. FImsrd
Approcs for pi*llc release; distwlbutlam msllted.

"COTV L PAO O M TTa PAGE eo t mmo
The isiiliy Cimaoloy o Mcurd SondlMaster's Thesis;Williams Field, Antarctica Mrh18
6. P900"O ne @. fteOUI 014"sen
6. COUNhACT ON GRIOT *UMfEWa-j
Naval Postgraduate SchoolMonterey. California 93943
Lg WTOL0 mrnu*.Ga a e MANG ft* eAeeeemI IS. ORPORi OATSNaval Postgraduate School March 1984Monterey, California 93943 is. mown OF P1313
Approved for public release; distribution unlimited b
fligh opetions in. th narctic ~ arie
t visibility, Antarctica, climatology, weather In the Antarctic,
*of United States baeand the a of we on the Antarctic
AuppIlee destined for usee by the United States Antarctic ateeeb ftogramSciernists. The Villtame field e*iwey and the adjacent ice ramsey areIppremIMtely 4.5 al southeast of Usihido. Weather obeerat ione are t
V" Wet W6 014.6m

.. umfMIV C,"MPICAtoo" OP "'wS PAamtnoft m ea
Uat both .IcMurdo and the operational airfield. The visibility climatology,August through March, for XcNurdo (1956-1983) and Williams Field skiway/runway(1968-1983) was prepared using four operational visibility categories, aswell as the seven important weather parameters which reduce visibility, namelyblowing snow, light snow, moderate to heavy snow, the three types of fog andice crystals. A vind speed/direction climatology was also prepared because
of its relation to both blowing snow and fog.
I(
I I I c I II I IIAvU w!/ir
I st SV,
ofL
Approved for public release; distribution unlimited.
The Visibility Climatolog[ of Uclardo Soand/Uillians Field,
by
Cheo 1 G. Souders
Captain, a ted ates A4 ForceB.As goC joilJ 10i6
B.S.@ Ulivecsity a o9 6 taho 1977
Subhit t ed inr rp t i fulfiie2n t oj therequiremnts for the degree of
1STE OF SCZECE 11 RZTEOROLOGY
from the
NAVAL POSTGRADUATN SCHOOLBatch 1984
Author:___________
Approved by:_./
, //
Second R"
Chairmm. Departacat of meteorology
Dean oL Scien'e and lagiaseoig
3

ABSTRACT
Accurate forecasting of visibility at McMurdo/Williams
Field, Antarctica is essential for the air operations in-
volving the resupply of United States bases and the conduct
of research on the Antarctic continent. McMurdo, located at
770 51' S 1660 40' 3, receives all supplies destined for use
by the United States Antarctic Research Program scientists.
The Williams Field skiway and the adjacent ice runway are
approximately 4.5 mi southeast of McMurdo. Weather observa-
tions are taken at both McMurdo and the operational air-
field. The visibility climatology, August through March,
for McMurdo (1956-1983) and Williams Field skiway/ice runway
(1968-1983) was prepared using four operational visibility
categories, as well as the seven important weather param-
eters which reduce visibility, namely, blowing snow, light
snow, moderate to heavy snow, the three types of fog and ice
crystals. A wind speed/direction climatology was also pre-
pared because of its relation to both blowing snow and fog.
44

TABLE OF CONTENTS
I. INTRODUCTION AND OBJECTIVECS - ---------- 14
A. IMPORTANCE Or MCMURDO/WILLIAMS FIELD - - - - 14
B. LOCATION AND TOPOGRAPHY VICINITY Or MCMURDO, - 16
C. ANTARCTIC WEATHER- -------------- 17
D. OBJECTIVES ------------------ 19
II. DATA------------------------20
A. ACQUISITION- ------------------- 20
B. PROBLEMS ------------------- 21
III. CLIMATOLOGY OF MC6URDO,----------------22
A. VISIBILITY BY TINEZ PERIOD- ----------- 22
B. VISIBILITY BY WEATHER PARAMETER -- ------ 25
C. VISIBILITY BY COMBINED WEATHER PARAMETERS - 29
D. WIND STATISTICS- --------------- 33
E. COMPARISON TO PREVIOUS MCHURtDO STUDIES - - -37
IV. CLIMATOLOGY OF WILLIAMS FIELD- ----------- 40
A. VISIBILITY BY TIME PERIOD- ----------- 40
B. VISIBILITY BY WEATHER PARAMETER -- ------ 43
C. VISIBILITY BY COMBINED WEATHER PARAMETERS - 46
D. WIND STATISTICS- --------------- 48
V. CONCLUSIONS AND UZC=CNDAIOXS -- - -- - - - - 53
A-* COMCWUSIONS ---------------- - - - - - a 53
5 *REOSIZDAI 33 - - - - a- -- -- ---- 55
-- *7 -- P .-. - M

TABLES ------------------------ 57-81
FIGURES - ----------------------- 82-146
LIST OF REFERENCES ------------------- 147
INITIAL DISTRIBUTION LIST- --------------- 149

'I
LIST OF TABLES
I. Percentage Occurrence of Restricted VisibilityCategories at McMurdo- - ----------- 57
11. Percentage Occurrence of Weather Parametersduring Blowing Snow observations -------- 57
III. Percentage occurrence of Weather Parametersfor Fog observations -------------- 57
IV. Wind Statistics for All Visibilities atMcMurdo, Antarctica --------------- 58
V. Wind Statistics when Visibility is less thanOne Mi at McMurdo, Antarctica ---------- 59
VI. Wind Statistics when Visibility is greaterthan One but less than Three Mi at McMurdo,Antarctica ------------------- 60
VII. Wind Statistics when Visibility is greaterthan Three but less than Five Mi -------- 61
VIII. Wind Statistics when Blowing Snow occurs atMcMurdo, Antarctica --------------- 62
IX.. Wind Statistics when Blowing Snow and SnowOccurs at McMurdo, Antarctica ---------- 63
X. Wind Statistics when Fog occurs atMcMurdo, Antarctica --------------- 64
XI. Wind Statistics when Blowing Snow and FogOccurs at McMurdo, Antarctica ---------- 65
XII. Wind Statistics when Light Falling SnowOccurs at McMurdo, Antarctica ---------- 66
XIII. Wind Statistics when Moderate to Heavy SnowOccurs at McMurdo, Antarctica ---------- 67
XIV. Wind Statistics when Ice Crystals Occur atMcIurdo, Antarctica --------------- 68
XV. Monthly Percentage Occurrence of Snow and Fog - - 69
XVI. Monthly Maximum Averaged and InstantaneousWind Speeds by Direcion and Month ------- 69
7

XVII. Monthly Restricted Visibility by Category inNautical Miles ----------------- 70
XVIII. Percentage Occurrence of RestrictedVisibility Categories at Williams Field ----- 70
XIX. Wind Statistics for All Visibilities atWilliams Field, Antarctica ----------- 71
XX. Wind Statistics when Visibility is lessthan One Mi at Williams Field, Antarctica - - - - 72
XXI. Wind Statistics when Visibility is greaterthan One but less than Three Mi atWilliams Field, Antarctica ----------- 73
XXII. Wind Statistics when Visibility is greaterthan Three but less than Five Mi atWilliams Field, Antarctica ----------- 74
XXIII. Wind Statistics when Blowing Snow Occurs atWilliams Field, Antarctica ----------- 75
XXIV. Wind Statistics when Blowing Snow and SnowOccur at Williams Field, Antarctica ------- 76
XXV. Wind Statistics when Fog Occurs atWilliams Field, Antarctica -------- -- - 77
XXV. Wind Statistics when Blowing Snow and VogOccur at Williams Field, Antarctica ------- 78
XXVII. Wind Statistics when Light Falling SnowOccurs at Williams Field, Antarctica ------ 79
XXVIII. Wind Statistics when Moderate to Heavy SnowOccurs at Williams Field, Antarctica ------- 80
XXIX. Wind Statistics when Ice Crystals Occur atWilliams Field, Antarctica ---- ---- --- -- 81
Z ,

LIST OF FIGUREU
1. Antarctica - 82
2. McIurdo Local Area --------------- -83
3. Williams Field Complex ------------- 84
4. Monthly Climatology of Restricted Visibilityat Mcurdo, Antarctica ------------- 85
5. Diurnal Climatology of Restricted Visibilityby Category for August at McMurdo, Antarctica - 86
6. Diurnal Climatology of Restricted Visibilityby Category for September at McMurdo, Antarctica- 87
7. Diurnal Climatology of Restricted Visibilityby Category for October at McMurdo, Antarctica - 88
8. Diurnal Climatology of Restricted Visibilityby Category for November at McMurdo, Antarctica - 89
9. Diurnal Climatology of Restricted Visibilityby Category for December at Mc€urdo, Antarctica - 90
10. Diurnal Climatology of Restricted Visibilityby Category for January at McMurdo, Antarctica - 91
11. Diurnal Climatology of Restricted Visibilityby Category for February at Mckurdo, Antarctica - 92
12. Diurnal Climatology of Restricted Visibilityby Category for March at McMurdo, Antarctica - - 93
13. Monthly Climatology of Weather Types atNcaurdo, Antarctica --------------- 94
14. Diurnal Climatology of Weather Types forAugust at Mucrdo, Antarctica - - -------- 95
15. Diurnal Climatology of Weather Types forSeptember at Mcurdo, Antarctica - ------- 96
16. Diurnal Climatology of Weather Types forOctober at NcM do. Antarctica - - - - --- 97
17. Diurnal lmatology of Weather Types fornovsber at ardo, Antarctica - - - - - - - 98
. ...! .......... 
18. Diurnal Climatology of Weather Types forDecember at McMurdo, Antarctica - 99
19. Diurnal Climatology of Weather Types forJanuary at McMurdo, Antarctica --------- 100
20. Diurnal Climatology of Weather Types forFebruary at McMurdo, Antarctica -I-------- 101
21. Diurnal Climatology of Weather Types forMarch at McMurdo, Antarctica ---------- 102
22. Monthly Climatology of Blowing Snow atMcMurdo, Antarctica -------------- 103
23. Monthly Climatology of Blowing Snow andSnow at McMurdo, Antarctica ----------- 104
24. Monthly Climatology of Fog atMcMurdo, Antarctica --------------- 105
25. Monthly Climatology of Blowing Snow andFog at McMurdo, Antarctica - - --------- 106
.26. Monthly Climatology of Light Snow atMcMurdo, Antarctica -------------- 107
27. Monthly Climatology of Moderate to HeavySnow at McMurdo, Antarctica ------------ 108
28. Monthly Climatology of Ice Crystals atMcMurdo, Antarctica ---------------- 109
29. McMurdo Wind Rose -- - ------------- 110
30. Monthly Climatology of Restricted Visibilityat Williams Field, Antarctica ---------- 111
31. Diurnal Climatology of Restricted Visibilityby Category for August at Williams Field,Antarctica ------------------- 112
32. Diurnal Climatology of Restricted Visibilityby Category for September at Williams Field,Antarctica - - ----------------- 113
33. Diurnal Climatology of Restricted Visibilityby Category for October at Williams Field,Antarctica ------------------- 114
10

34. Diurnal Climatology of Restricted Visibilityby Category for November at Williams Field,Antarctica ------------------- 115
35. Diurnal Climatology of Restricted Visibilityby Category for December at Williams Field,Antarctica ------------------- 116
36. Diurnal Climatology of Restricted Visibilityby Category for January at Williams Field,Antarctica ------------------- 117
37. Diurnal Climatology of Restricted Visibilityby Category for February at Williams Field,Antarctica ------------------- 118
38. Diurnal Climatology of Restricted Visibilityby Category for March at Williams Field,Antarctica ------------------- 119
39. Monthly Climatology of Weather Types atWilliams, Antarctica -------------- 120
40. Diurnal Climatology of Weather Types forAugust at Williams Field, Antarctica ------ 121
41. Diurnal Climatology of Weather Types forSeptember at Williams Field, Antarctica ----- 122
42. Diurnal Climatology of Weather Types forOctober &t Williams Field, Antarctica ------ 123
43. Diurnal Climatology of Weather Types forNovember at Williams Field, Antarctica ----- 124
44. Diurnal Climatology of Weather Types forDecember at Williams Field, Antarctica ----- 125
45. Diurnal Climatology of Weather Types forJanuary at Williams Field, Antarctica ------ 126
46. Diurnal Climatology of Weather Types forFebruary at Williams Field, Antarctica ----- 127
47. Diurnal Climatology of Weather Types forMarch at Williams Field, Antarctica ------- 128
L 48. Monthly Climatology of Slowing Snow atWilliams Field, Antarctica ----------- 129
11

* .. * ~1~4 KA4
49. Monthly Climatology of Blowing Snow andSnow at Williams Field, Antarctica- --------130
5O. Monthly Climatology of Fog atWilliams Field, Antarctica- ----------- 131
51. Monthly Climatology of Blowing Snow andFog at Williams Field, Antarctica -- ------- 132
52. Monthly Climatology of Light Snow atWilliams Field. Antarctica- ----------- 133
53. Monthly Climatology of Moderate to HeavySnow at Williams Field, Antarctica- ------- 134
54. Monthly Climatology of ice Crystals atWilliams Field. Antarctica- --------- -- 135
55. Legend for Wind 1Mses -- --------- ---- 136
56. Wind Roses for Cat 1 Visibility in Januaryat Mcfturdo/Williams'Field. Antarctica -- ----- 137
57. Wind Mse@ for Cat 1 and Cat 2 Visibility inAugust at Mckurdo, Antarctica -- --------- 138
58. Wind noses for Cat 2 Visibility in Januaryat Mc~urdo/Williamus Field, Antarctica -- ----- 139
59. Wind Mae* for Cat 3 Visibility for Januaryat Mckurdo/Williams Field. Antarctica - -- ---- 140
60. Wind Wee* for Cat 3 Visibility for Augustat McMurdo, Antarctica- --------- ---- 141
61. Wind noses for Blowing Snow for Januaryat McMurdo/Williams Field. Antarctica -- ----- 142
62. Wind noses for Blowing Snow and Snow forJanuary at Mo~urdo/Williams Field. Antarctica -- 143
63. Wind Roses for Fog for January atMNfurdo/Williams Field, Antarctica- --------144
64. Wind Roses for Fog, and Blowing Snow and Fogfor March at McMurdo, Antarctica- -------- 145
65. Wind Roses for Blowing Snow. and Blowing Snowamd rog for August at Mc~urdo# Antarctica - - - - 146
12

i
ACKNOWLEDGEMENTS
The author wishes to express her sincere appreciation to
Dr. R. J. Renard, Department of Meteorology, for his assist-
ance, interest and guidance during this study. Dr. Renard's
effort was supported in part by the Naval Support Force,
Antarctica. Also, Dr. C. H. Wash, Department of Meteorology
is sincerely thanked for his critical review of the study.
In addition, the author thanks Mr. W. J. Thompson, without
whose guidance the computer work would not have been
completed on time.
Appreciation is due to: Mr. M. McDermet, Department of
Meteorology, for drafting the wind roses: the personnel of
the Meteorology Division, Naval Support Force, Antarctica,
Port Hueneme, CA, for providing information on the official
observations at McMurdo and Williams Field; and the Naval
Oceanography Command Detachment, Asheville, NC, especially
Mr. a. Wallace, for furnishing information on the McMurdo
and Williams Field data used in the study.
13
4'.3
I. INTRODUCTION AND OBJECTIVES
A. IMPORTANCE OF MCMURDO/WILLIAMS FIELD
Accurate forecasting of visibility at McMurdo/Williams
Field, Antarctica is essential for the air operations in-
volving the resupply of United States bases and conduct of
research on the Continent. Direct and indirect transporta-
tion costs (wainly air) account for about half the total
annual cost of carrying out the United States Antarctic
Research program, managed and funded by the National Science
Foundation.
Mcfurdo station is located at 770 51' 1660 40' E (Fig.
1), on the southern end of Hut Point Peninsula on Ross Is-
land (Fig. 2). McMurdo, the Continent's largest station,
was constructed in 1955 as a staging base for all inland
research projects. Today, all supplies destined for use by
United States scientists on the Continent (except Palmer on
the Antarctic Peninsula) are received at NcMurdo and redis-
tributed to inland stations and remote field camps (United
States Naval Support Force Antarctica, 1982).
Bach year, by early October, the United States Navy be-
gins resupplying the United States bases on the Antarctic
continent. ships are used for bulk cargo: however, the
initial resupply must be completed by air, since the pack
14
MOVER

ice generally precludes ship operations until late in the
operating season.
The United States is one of only three countries that
routinely employ long-range aircraft for passenger and pri-
ority cargo transport to Antarctica. There are only two
airfields suitable for wheeled aircraft, one of which is
near Mc3urdo (Central Intelligence Agency, 1978). United
States Air Force and Navy aircraft carry cargo and personnel
from Christchurch, New Zealand (the main staging base out-
side of the Continent) over a 2,100 nautical mile route to
Mclurdo. The supplies and personnel are then transferred to
Kavy ski-equipped aircraft for flights to inland bases
(Biter, 1965).
McMurdo Sound lies between Ross Island and Victoria
Land. The southern portion of McMurdo Sound is covered with
landfast ice ten months of the year and is the site of the
skiway complex named Williams Field (National Science Foun-
dation, 1983). Williams Field is located approximately four
and one-half miles to the southeast of Ncurdo and because
of Observation Hill cannot be soon from NNurdo. The air-
field facilities actually consist of two landing areas, one
permanently located on the Ross Ice Shelf (Williams Field
Skiway) and the second, used during the cold months, on the
annual sea ice (ice runway). See Fig. 3. (Central
Intelligence Agency, 1978). The runway, constructed on
15

sea ice, is used between October and December for the United
States C-141 Starlifter and LC-130 Hercules aircraft which
fly men and women, engaged in American and New Zealand sci-
entific programs, to the ice. While the surface of the
annual ice runway is still firm, LC-130 Hercules aircraft
from the Royal New Zealand Air Porce also fly to Williams
Field. By late summer, the ice runway begins to deteriorate
and ski-equipped aircraft, operating off prepared snow ski-
ways, must be utilized. C-141's cannot use the snow runway
because they are not ski-equipped (United States Naval Sup-
port Force Antarctica, 1982). Transportation to the in-
terior stations is provided by both aircraft and surface
vehicles.
Traditionally, New Zealand has been the Jumping off
point for U.S. expeditions to the Antarctic. The U.S. Navy
maintains a small year round facility at Christchurch's
International Airport. From there, personnel and supplies
are readied for the long flight south to Williams Field.
B. LOCATION AND TOPOGRAPMY VICINITY OF MCMURDO
Ncaurdo is located approximately 730 n mi from the South
Pole. The main city is located on the southwest extremity
of out Point Peninsula, which extends southward from Ross
Island for 10 mi (Fig. 3). ut Point (59 ft high) is about
0.4 mi to the west of the station. From But Point. the land
rises fairly steeply to Nrbour Rill (523 ft high) due north
16
- '""tli H

of the station. Approximately one mile to the east of the
station, Crater Hill rises to a height of 987 ft, and about
0.6 mi to the southeast lies Observation Hill, 747 ft high.
Between these two hills, there is a pronounced gap or pass
to the east-southeast of the station (Narcer, 1961).
Ross Island is located about 40 mi off the Victoria Land
coast on the extreme western boundary of the Ross Sea and
along the edge of the Ross Ice Shelf. The area to the south-
east of McMurdo is a flat (Ross) ice shelf extending south
for several hundred miles, broken only by White and Black
Islands. To the west, across McMurdo Sound, and through the
north to northeast, lies the Ross Sea. Although covered by
annual sea ice most of the year, the Ross Sea becomes large-
ly open water in middle and late summer. Therefore, McMurdo
is affected by moisture laden marine air for part of the
year (Salle. and Snell, 1970).
C. ANTARCTIC WEATHER
Antarctica is the world's largest and driest desert.
Precipitation, mostly in some form of ice or snow, occurs
frequently over much of Antarctica, but is light. Average
accumulations of snow on the continent are less than two
inches per year: however, along the coast the marine influ-
ence causes higher temperatures and greater amounts of snow-
fall. Once snow falls, it is blown about the surface until
17
the flakes are compressed and gradually turned to ice
(United States Support Force Antarctica, 1982).
The Antarctic climate is distinguished by extremely low
temperatures and a permanent ice sheet. A large part of the
surface of the continent, 551, lies at an elevation of more
than 2000 m and about 250 at more than 3000 m above sea
level. Of the total area of the continent, about 14,000,000
km2 , less than 31, are estimated to be free of a permanent
ice sheet. Most of the meteorological data for Antarctica
have been obtained since the beginning of the International
Geophysical Year (IGY) in 1957 (Orvig, 1970).
Another unique feature of Antarctica is the strength of
the wind. Katabatic winds often exceed hurricane force near
the edge of the continent. As air on the polar plateau
cools, it begins to flow seaward, due in part to gravita-
tional pull. In areas where the continent is relatively
formless, the airflow is unimpeded. Once it reaches the
outer edge of the continent, the already swift wind races
down the Jagged mountain ranges to the sea. These winds
lift large amounts of snow and are associated with low
visibilities.
In addition to falling snow and blowing snow, ice fog
and water fog act to deteriorate the visibility, although
this is not a serious problem at NMOArdo/VillLms Field.
2.85
D. OBJECTIVES
The objectives of this study ares (1) to update the
visibility climatology for McMurdo, Antarctica, stratifying
the statistics by weather type and wind, (2) to develop a
visibility climatology for Williams Field, Antarctica, and
(3) to intercompare the McMurdo and Williams Field visibili-
ty climatologies and relate results to previous studies for
McMurdo.
1k

11. DATA
A. ACQUISITION
Mchurdo data, August through March, were obtained on
magnetic tape from the National Climatic Data Center (NCDC),
Asheville, North Carolina. These data cover the period from
1 March 1956 to 31 January 1983 and consist of hourly air-
ways surface observations on tape.
The Williams Field data1 were derived from hard copy
forms archived by the NCDC, the Naval Postgraduate School,
Monterey, California, and the Naval Support Force Antarc-
tica, Port Hueneme, California. This data set, representing
the total known amount of archived Williams Field data, also
covers the period from August through March, but only for
the years 1968-1983. There are data from parts or all of
only 54 months in this period of 124 months. Data for the
months of August, September, February and March are extreme-
ly limited. Therefore, greater emphasis was placed on the
McMurdo data archive, since it is the longer and more com-
plete record, and it is transmitted via the meteorological
data network. The four months of austral fall/early winter
For the purpose of this thesis, the Williams Field datarefers to data observed from either the skiway or the annualice runway.
20
4
. .~ -. J' i

a, -
(April through July) were not considered since Antarctic
flights are not scheduled during this period.
B. PROBLEMS
There was an initial problem associated with both
McMurdo and Williams Field data sets. The McMurdo data
initially forwarded from HCDC were available in three formst
(1) synoptic surface observations on magnetic tape (2) syn-
optic surface observations on hard copy forms and (3) air-
ways surface observations on magnetic tape: however, all
data were eventually made available in airways surface ob-
servation code. The advantage of airways over synoptic code
is that the former allows reporting more than one current
weather parameter, while the latter is limited to one such
parameter. The Williams Field data, in addition to being
all hard copy, also suffered from a change in format of the
temperature and pressure during the period under considera-
tion. After transcribing the data to the computer, the
weather parameters had to be changed from alphabetic to
numeric representations for processing. Also, in some
cases it was necessary to change local standard time to
Greenwich Mean Time. McNurdo local standard time is Green-
wich Mean Time plus 12 hours.
21
ala

III. CLI MATOLOGY OF M4CMRDO
Climatology is usually defined as being the description
of average atmospheric conditions using a 30-year period for
the average value of various elements (Orvig, 1970). This
study includes 26 2/3 years of Mc~urdo data. Previous
studies of McNurdo climatology by Mercer (1961), Thompson
(1972), and Sinclair (1982), cover the period 1957-1960,
1956-1961 and 1956-1972, respectively. Section III z ad-
dresses comparisons of this research to the previous stud-
ies. The McMurdo, and Williams Field (Section IV), clima-
tologies are compared in the Conclusion Section (V).
A. VISIBILITY BY TIME PERIOD
Visibility was divided into four categories, based on
flight filing restrictions: Cat 1, less than one mi - air-
field closed, therefore no departures from Christchurch, New
Zealandy Cat 2, one mi to less than three mi - aircraft can-
not land without navigational aides (e.g., GCA, TACAK)r Cat
3, three mi to less than five mi - all aircraft can land ex-
cept for the C-141's during initial uainbody 2 fly-in and
Cat 4, five mi or greater - no restrictions (Table I).
2
2First fly-in with personnel and cargo, usually in
October.
22
~*** *~.. 'i r VV~~i

Fig. 4 shows the categorized restricted visibility by the
month for August to March (49,100 observations). Low visi-
bility problems are maximized in the austral winter and
early spring period (August-October) and again in the late
summer/early fall (March); Cat I dominates these months. In
the late spring/early summer months of December and January
Cat 2 dominates, while Cat 2 equals Cat 1 in November and
February. Cat 3 is less than both Cat 1 and Cat 2 for all
months.
To determine any diurnal patterns in the visibility at
NcMurdo, the percentage occurrence of the visibility catego-
ries was determined for the three-hourly observations. There
doesn't appear to be a consistent pattern through all the
months.
In August (Fig 5), the most likely visibility restric-
tion category is 1, followed by 2 and then 3. The differ-
ence in the probability of occurrence of Cat 1 and Cat 2 at
0900 GMT and of Cat 2 and Cat 3 at 1500 GMT is negligible.
Again in September (Fig. 6), a restriction to visibility
would most likely produce Cat 1, followed by 2 and then 3.
However, in September, there is a significant increase in
the percent of Cat I compared to Cat 2 or 3. At 2100 GMT,
the difference between Cat I and 2 is smaller than between
Cat 2 and 3. There is not any general increasing or
decreasing trend through the hours.
23
...... , ,i

October (Fig. 7) is a transitional month; however, the
overall trend in the most likely category of occurrence con-
tinues. Unlike August and September, in October the hourly
average of the differences between Cats 1 and 2 and Cats 2
and 3 is approximately the same (Table I).
In November (Fig. 8) visibility less than one mile oc-
curs more than Cats 2 or 3 during the afternoon and evening
hours (0000 to 0900 GMT), while Cat 2 is more prevalent from
1500 to 2100 GMT. However, at 1200 GMT Cat 1 is only slight-
ly higher than Cat 2. There is a significant reduction in
the frequency of restricted visibility from October.
For December (Fig. 9), the pattern is basically reversed
with Cat 2 occurring more than Cat 1 or 3 in the afternoon
and evening hours (0000 to 1200 GMT), while the lowest visi-
bility category dominates only from 1500 to 1800 GMT. Also
at 1800 GMT, the occurrence of Cat 2 equals that of Cat 3
and six hours later the occurrence of Cat 1 equals that of
Cat 3.
In January (Fig. 10), the distribution is more uneven
than either November or December, with visibility less than
one mile dominating only at midnight (1200 GMT) and Cat 2
dominating most of the rest of the day. The occurrence of
Cat 3 edges higher than Cat 1 only one hour (0000 GMT), with
the two categories being approximately equal for the remain-
der of the time between 2100 and 0600 OUT.
24
-. *..,

The trend in February (Fig. 11) is definitely system-
atically related to the time of day. The nighttime and early
morning hours (1200 to 2100 GMT) are dominated by Cat 2,
while Cat 1 dominates during the day (0000 to 0900 GMT). The
occurrence of Cat 3 is slightly greater than Cat 1 at 1500
GMT and higher than Cat 2 at 0300 GMT.
In March (Fig. 12). the visibility restrictions are not
as great as in the austral winter (August and September);
however, they are significantly higher than late spring and
summer (November through February). The occurrence of Cat 2
in greater than both Cat I and 3 during three of the eight
time periods, an interesting difference from the austral
winter/early spring months. Also, the occurrence of Cat 3
increases during the early morning hours (1200 to 1800 GMT)
and then drops until early afternoon (1800 to 0300 GMT).
B. VISIBILITY BY WEATHER PARAMETER
Air operations at McMurdo are restricted at times by low
visibility due to blowing snow, falling snow, or fog, occur-
ring alone or in any combination. Blowing and falling snow
must be ranked before fog in order of importance due to
7their frequent occurrence. It should be noted that the snow
category in this thesis includes all falling frozen precipi-
tation, i.e. snow, snow pellets and grains, sleet, and snow
showers.
25_

The percentage occurrence of each of seven weather pa-
rameters (light snow, moderate or heavy snow, blowing snow,
fog, ice fog, ground fog and ice crystals) was determined
first by the month (Fig. 13) and then by the hour for each
month (Figs. 14-21). Although many consider Antarctica to
have only two months of sumwer (December and January), the
McMurdo data indicate little difference in the percentage of
occurrence of the various weather parameters in the three
months, November through January. Thompson (1972) shows a
marked deterioration in visibility outside the period of
November through February. In all months, fog (all types)
occurs significantly less than falling snow. The same is
true for blowing snow relative to fog, except in the months
of December and January. During the austral mid/late w;nter
and early spring months of August through October, and the
late sumer month of March, the percentage of blowing snow
and falling snow is approximately the same. In August and
September, blowing snow occurs more often than light snow.
For the remaining months, observations with falling snow ex-
ceed considerably those with blowing snow. Ice fog doami-
nates the other types of fog in August. The occurrence of
ice and water fog is approximately equal in September, while
water fog dominates significantly in January and March.
In August (Fig. 14), blowing snow occurs more than fall-
ing snow at most hours. Ice fog exceeds water fog and
3,

iv :viv_
ground fog during all hours. From early night through early
morning (0600 to 2100 GMT), ice crystals occur more often
than moderate and heavy snow. In September (Fig. 15), blow-
ing snow also occurs more than falling snow at most hours.
A more random pattern of fog occurs in September than in
August - ice fog exceeds water fog at two time periods,
equals water fog at two time periods and is dominated by
water fog during four time periods. Ice crystals occur more
often than moderate and heavy snow at all hours but 0600 and
0900 GMT.
October (Fig. 16) is a transitional month with three
time periods when light snow exceeds blowing snow and five
periods with the situation reversed. Unexpectedly, the
greatest percentage difference between the two (light snow
and blowing snow) occurs at 1200 GMT (2.3%) and the least
difference occurs only three hours later. Ice fog dominates
water fog only at 0000 GMT. The occurrence of ice crystals
exceeds 1% only at 2100 GMT.
November (Fig. 17) is the beginning of the austral sum-
mer, according to weather occurrences. The drop in blowing
snow from October is very noticeable (at least 500 for all
time periods except 1600 MT). Ice fog is the dominant type
of fog reported in November.
In December (Fig. 16) , light snow is predominant, much
as it is in November. The amount of blowing snow drops from
27
- ' 'A f f

an average of 4.60 in November to an average of 1.9% in De-
camber. Reversing November's trend, ice fog is nonexistent
in December. In addition, fog occurs mostly in the morning
hours (1200 to 2100 GMT) with water fog predominating.
Midsumer is considered the period of maximum occurrence
of nocturnal snow (Sallee and Snell, 1970): however, this is
discernible only in January. More fog occurs in January
(Figs. 13 and 19) than in December and it is primarily water
fog. There is an increasing trend in the occurrence of fog
in the late night/early morning hours of January (1200 to
1800 GMT) with a maxium of 2.79 at 1800 GMT.
precipitation in the form of snow, sleet, or snow pel-
lets occurs throughout the year with a maximum amount occur-
ring in February (Sallee and Snell, 1970). During February
(Figs. 13 and 20), light snow occurs 17.81 of the time (2.8%
more than in any other month); the average for all months is
12.7%.
March (Figs. 13 and 21) begins the transition into win-
ter. Imediately noticeable is the strong increase in blow-
ing snow from February. Also interesting is the sudden
increase in the occurrence of fog. March has a greater oc-
currence of fog than any other month and it occurs primarily
as water fog.
2.

C- VISIBILITY BY COMBINED WEATHER PARAHETURB
It must be noted that two or more weather parameters af-
fecting visibility may coexist. Therefore, the percentage
occurrences are not mutually exclusive. For example, in the
month of January. light snow occurs during 68% of the blow-
ing snow observations; the figure is 18% for the occurrence
of moderate or heavy snow during blowing snow (Table II).
Thus, although the visibility is significantly reduced to
less than one mile in 37% of the blowing snow observations,
it is not possible to assign the predominant cause. Simpson
(1919) describes this clearly in his excellent discussion of
blizzard conditions around McMurdo during the British
Antarctic Expedition of 1910-1913.
Frequently, fog occurs in conjunction with falling snow
at Mchurdo. Both parameters can occur for several hour*,
producing a rapid reduction in visibility to values below
airport minimums. The snow is believed to initially produce
saturation of the layer of air below the surface inversion.
As the inversion weakens or disappears, the fog dissipates
due to vertical mixing (Sallee and Snell, 1970). For five
of the eight months studied, light snow occurs simultane-
ously with at least 201 of the fog occurrences (Table I1).
In February, the figure is 621 of the time. Usually fog is
not expected with blowing snow since the strong winds pro-
duce considerable vertical mixing. For all months but March,
29
- ui ,'' .. I

the percentage occurrence of blowing snow with fog is less
than 17%, and averages 12%. The maximum of 331 occurs in
March (which has the greatest occurrence of fog).
Once the forecaster has determined which weather param-
eter (or parameters) to forecast, it is necessary to deter-
mine the associated visibility. To facilitate this proce-
dure, a visibility climatology has been compiled which gives
the restricted visibilities associated with seven weather
parameters. As mentioned before, in some cases it is nearly
impossible to tell if only one weather parameter is occur-
ring (for example, is there just blowing snow or is snow
falling also). Therefore, the seven categories selected for
this portion of the climatology were blowing snow, blowing
Snow and failing snow, blowing snow and fog , light snow,
moderate to heavy snow, fog and ice crystals.
Blowing snow (Fig. 22) shows the greatest annual vari-
ation in the percentage occurrence in comparison with the
seven parameters discussed here. The number of observations
of blowing snow clearly shows a peak in the August through
October time frame, then a dip to a minimum in January, and
finally rising toward another. peak in March. The largest
percentage occurrence of restricted visibility during blow-ing snow is Cat I for all months. The smallest percent oc-
* ' currence is Cat 3. For the months of August through October,
Cat 1 exceeds Cat 2 by a two to one margin. in all other
30

months Cat 1 and 2 are within 8 of each other, except Feb-
ruary, where it is 16%. ore Cat 1 occurs in February than
in March, which is unexpected since there is nearly three
times more blowing show observations in March than in Febru-
ary. The restricted visibility category resulting from blow-
ing snow relates primarily to the wind speed; however, the
wetness of snow, the time since the last snowfall and the
topography are also important.
Although there are less observations of blowing snow and
snow (Fig. 23) than snow (approximately one-half), the same
trend holds - namely the most observations are in the
austral winter/early spring (August-October) and again in
March, with a minimum of occurrences in January. Cat 1 ex-
ceeds Cat 2 and 3 in all months, but by a larger margin (ap-
proximately three to one; nearly five to one in September).
For blowing snow and snow, Cat 1 is more nearly equal to
Cat 2 during the period from November to January than for
blowing snow. Cat 1 occurs more in March than in February
by a small amount.
For fog (Fig. 24), the general pattern of more occur-
rences in the austral winter/early spring and again in the
early fall holds. However, the lowest occurrences are in
November and February with a smail secondary peak in Janu-
ary. Cat 2 predominate, with Cat 2 equal to Cat I in Novem-
ber. A significant exception occurs in December* where
31
AI

.. &
Cat 1 exceed* Cat 2 by nearly a three to one margin. Also
in October, Cat 3 edges higher than Cat 1 or 2.
For blowing snow and fog (Fig. 25), Cat 1 dominates for
August through November with Cat I equal to Cat 3 in Decem-
ber. In January there are no occurrences, in February only
Cat 2 occurs, and in March Cat 2 dominates. Blowing snow
and fog occur seldom together, ranging from a percentage
occurrence of zero in January (lowest occurrence of blowing
snow) to a high of 83 in March (greatest occurrence of fog).
While blowing snow shows an annual cycle (902 observa-
tions in August and 81 observations in January), light snow
(Fig. 26) varies from month to month with much weaker ampli-
tud*es (maximum in February of 914 observations and minimum
in November with 659 observations). Cat 1 dominates from
August to October, while Cat 2 dominates from November
through March. In December and January, Cat 3 exceeds
Cat 1.
As expected, the number of moderate to heavy snow ob-
servations (Fig. 27) is far less than the number for light
snow. The variation in occurrence through the year is quite
small (71 in March to 38 in November and January). The
smallest occurrence of Cat 1 is 970, not unexpected since
moderate to heavy snow literally requires Cat 1 visibilitv
(the Cat 2 and Cat 3 observations are probably errors).
32

Cat 2 occurs in August and September, and again in January
and February, with Cat 3 occurring only in February.
According to Huffman and Ohtake (1971), the diameter of
ice crystals decreases with decreasing temperature and the
smaller the size of the particles, the greater the visibili-
ty restriction. However, this does not appear to hold at
McMurdo, although the sample size is very small (267 obser-
vations) (Fig. 28). For example, the maximum occurrence of
ice crystals is in August, but the greatest restriction to
visibility occurs in November (Fig. 24). All three cate-
gories occur the same number of times in November, and in
December, Cats 1 and 2"occur equally, without any Cat 3. In
October, there was not any Cat 3 and in January only Cat 3
occurs .
D. WIND STATISTICS
The wind direction and speed are included in this study
because of their importance to the visibility, especially in
relation to blowing snow and fog.
The wind statistics for all visibility categories (Table
IV) show an easterly wind about 30% to 501 of the time. The
most likely wind speed is 11 to 20 kt, except 1 to 10 kt in
November, December and January. The strongest winds occur
during the austral winter/early spring and are predominately
from the south. The maximm ten-minute average of Go kt oc-
curs in September. In the summer months, the maximum wind
33
i i in i it it I. ,q, . . ll -. _ .X, .. i ,ill i iia 7

averages about 40 kt. In most months th. least likely wind
directions are those from the south to west. The number of
observations range from a low of 5546 in March to a high of
6696 in January.
When visibilities less than one mi occur (Table V), the
most likely wind speed in 11 to 20 kt for four of the months
and 21 to 30 kt for three of the months. The strong winter
winds show a preference for a southerly to southwesterly
direction. In six of the eight months, the maximm wind
occurs with Cat 1 visibilities. The predominant wind direc-
tion is nov southeasterly or easterly. The least likely
wind direction is in the range southwest to north. January
has the smallest number of observatidne (106) and September
has the highest (545).
When visibilities of one to loe than three .i (Table
VI) occur, the most likely wind speed is 11 to 20 kt from
the east. Therie is a higher percentage of calm days in all
months,* except Noveber and December, than for Cat I. There
is a larger variation in the wind direction for the stronger
winds (from the north to northeast and the south to south-
east) with Cat 2 than Cat I. both the overall maximum wind
speed and the maximus associated with the predominant drc
tion is lower than for Cat 1 for August through Deceber.
Again, for visibilities of three but loe than f ive m1
(ftble ViZ). 11 to 20 kt Is the most likely wind speed for
34

all months, except January, and the predominant wind direc-
tion is easterly. The stronger winds vary from north through
southeast, but are weaker than the winds associated with the
two lower visibility categories.
The most likely wind speed during blowing snow (Table
VIII) is 11-20 kt. The maximum wind speeds occur in the
winter with the directions variable. The predominant wind
direction is easterly with southerly winds in December and
southeasterly winds in November.
Lower maximum winds occur with blowing snow and snow
(Table IX) than with just blowing snow and the direction of
the maximum wind speed is more southerly. The maximum wind
speeds are about the same an for blowing snow alone. The
predominant wind is easterly to southeasterly, and has
higher wind speeds associated in the winter and lower wind
speeds in the summer, than during blowing snow alone. There
are no observations with winds from the southwest to north
from December through March.
There are fewer calm winds in the winter for fog (Table
X) than for ice crystals, but there are more calm winds in
the suser. The most likely wind speed is 1-10 kt for four
of the eight months. The predominant wind is easterly. The
maximum winds are easterly in the sumner and southeasterly
in the winter. The maximum wind speeds are higher than
those for ice crystals but loss than those for snow.
35 4
X.*,T W

For blowing snow and fog (Table XI), the maximum wind is
usually from the east through south, while the predominant
direction is northeasterly to southerly.
For light snow (Table XII), the most likely wind speed
is 11 to 20 kt in the winter months; however, there are a
large number of calm winds. The maximum wind speed and
direction is about the same as for blowing snow. There is a
minimum in the occurrence of light snow with winds from the
southwest to north. The predominant wind direction is
easterly.
The maximum wind speed for moderate to heavy snow (Table
XIII) is less for all months than for light snow. The maxi-
mum winds are from the southwest to southeast and the pre-
dominant winds shift to a more southeasterly direction. For
three of the eight months, there are no observations for
wind directions from the southwest to northwest.
Ice crystals (Table XIV) occur with predominantly calm
winds in the winter/spring season (ranging from 37.5% in
November to 74.1% in October), but during the rest of the
year calm winds do not occur. there are no observations for
wind directions from the south to southwest in the winter.
The predominant wind direction is easterly, except in
October. Doth the maximum and predominant wind speeds are
lower than for other weather categories.
36

Selected wind roses for McMurdo, for various weather
conditions and months, are shown in Figs. 55 to 65.
E. COMPARISON TO PREVIOUS MCMURDO STUDIES
Sinclair's (1982) study of weather in the Rose Island
area covers the period from 1956 to 1972. A comparison of
the frequency of snow and fog reported by this study and
that presented by Sinclair shoews reasonable agreement for
snow. The difference in the percentage occurrence of all
snow is significant only in January, with 25% less for the
shorter record of Sinclair. In all other months, but Novem-
ber, Sinclair's data have more percentage occurrence of
snow. However, there are significant differences in the
percentage occurrence of fog in the months of October
through December. For these months, the shorter record has
25% to 54% more occurrences of fog (Table XV). This may
imply that in the last decade there has been a significant
decrease in the amount of fog at McMurdo. However, Sinclair
rounded all percentage occurrence figures to the next
highest number.
Thompson's (1972) climatology uses six-hourly observa-
tions and covers the period from October 1957 to March 1960.
A comparison with the data presented by Thompson (1972)
shows a trend similar to the comparison with Sinclair
(1982). The Thompson and Sinclair studies have the same
values for fog in all months, except August, where
37

Thompson's data shows a drop (410 less fog than this study).
Thompson's percentage occurrence of falling snow is smaller
for five of the months, especially from January through
March (240 to 32%) (Table XV). Thompson also rounded his
percentage occurrence figures up to the next highest number.
Mercer (1961) presents, in tabular and graphical form,
the existing climatological data for McMurdo Sound which was
derived (with few exceptions) from the three-hourly surface
observations recorded during the period March 1956 through
December 1960. Table XVI presents the pertinent wind data
compared with this study.
Although Mercer's data are of instantaneous wind speeds
-rather than averaged winds, it is interesting to note that
in most cases the wind direction- is very close. The primary
exception is in November, when the maximum instantaneous
wind is from the south while the maximum ten-minute averaged
wind occurs from several directions. Sinclair (1982) also
indicates that the strongest winds are from the south and
more common during the winter. In Table XVI, the strongest
winds (both averaged and instantaneous) occur in the austral
winter/early spring (August through October). Fig. 29 is a
wind rose for McMurdo (data:14arch 1956-December 1972)
4(Sinclair, 1982), showing the strong preference for a wind
from the southeast to northeast. This study gives basically
- the same results with a slightly higher preference for
33

easterly and southeasterly winds. A comparison of the
percentage of calm days is within 2%. Although the surface
wind at McMurdo is usually easterly, the winds aloft (300 m
to 3000 m) are predominantly southerly off the Antarctic
plateau. The surface wind direction appears to be due to
the local topographic influences of a 300 m ridge to the
south of McMurdo (Sinclair, 1982).
Compared to Mercer, the data from this study (Tables I
and XVII) have a greater percentage of visibilities Cat 3 or
less in only three months: August, November and February
(Table XVII). It is to be noted that Mercer's data are in
nautical miles, which gives the following statute mile
values for the various categories: (1) Mercer's Cat 1 is
less than 1.15 mi, (2) Mercer's Cat 2 is greater than 1.15
to 3.45 mi, and (3) Mercer's Cat 3 is greater than 3.45 to
5.75 mi.
39

IV. CLIMATOLOGY OF WILLIAMS FIELD
A. VISIBILITY BY TIME PERIOD
The previously defined categories are used for the Wil-
liams Field visibility climatology. Fig. A.30 shows the
categorized restricted visibility by the month for August
through March (9314 observations). Low visibility problems
are maximized in September and October; however, Cat 1 domi-
nates all months except March and December. Cat 3 exceeds
Cat 2 in August, and in March Cat 3 dominates with both Cat
2 and Cat 3 exceeding Cat 1 by a seven to one margin. The
largest percentage of visibilities less than five mi occur
in March and the smallest percentage in December. Unex-
pectedly, February and November have less restricted visi-
bility occurrences and less Cat 1 than January.
To determine any diurnal patterns in the visibility at
Williams Field, the percentage occurrence of the visibility
categories was determined for the three-hourly observation
(for parts of March and August only six-hourly observations
were taken). There does not appear to be a consistent pat-
tern through all the months.
In August (Fig. 31), there is not a prevailing category
(partially due to only 225 observations). Cat 1 dominates
only two time periods (0300 to 0600 GMT) and Cat 3 dominates
at 1500 GMT. At 1200 GMT, there were not any observations.
40
4 ~. |

k
For the remaining four time periods, at least two categories
occur equally.
In September (Fig. 32), visibilities of less than five
mi do not occur in the early morning hours (1200 to 1800
GMT). In the late morning hours (2100 to 0000 GMT), all
categories are equal. During the late evening hours (0600
to 0900 GMT), Cat 1 dominates. At 0300 GMT, only Cat 2
occurs. There are only 94 observations for September.
In October (Fig. 33), low visibilities occur at all
hours, with Cat I dominating, except at 0000 GMT, where Cat
I equals Cat 3. More Cat 1 occurs during the late night and
morning hours (0900 to 2100 GMT) than in the afternoon (0000
to 0600 GMT). Cat 3 occurs less than the other two catego-
ries most of the time: the exceptions are at 1200 and 1800
GT'(Cat 3 equals Cat 2).
Again in November (Fig. 34), Cat I dominates all hours
except 2100 GMT, when Cat I equals Cat 2. The occurrences
of Cat 1 peak at noon (0000 GMT) and then decrease through
the evening hours, until midnight, and then rise to a sec-
ondary (smaller) peak in the early morning hours (1800 GMT).
Cat 3 exceeds Cat 2 only at 1200 G4T and equals Cat 2 at
0300 and 1500 GMT.
In December (Fig. 35), Cat 1 and Cat 2 are equally
dominantl Cat 1 dominates in the evening and night hours
(0900 to 1800 GMT), and Cat 2 dominates during the late
41AN4

morning and afternoon (2100 to 0600 GMT). When Cat 1 domi-
nates, Cat 2 exceeds Cat 3, except at 1800 GMT, where they
are equal. When Cat 2 dominates, Cat 1 exceeds Cat 3 for
two time periods, equals Cat 3 for one time period, and is
exceeded by Cat 3 for one time period.
For January (Fig. 36), Cat 1 dominates all hours except
noon (0000 GMT). The number of occurrences of Cat 1 rise
from a low in the early afternoon (0300 GMT) to a peak in
the early morning (1800 GMT), and then declines slightly by
2100 GMT. Cat 2 exceeds Cat 3 for all hours, except 0300
GWT. For the one hour Cat 2 dominates (0000 WET), Cat 1 ex-
ceeds Cat 3. Cat 3 shows a generally increasing trend from
midnight to early morning (1800 GMT), then there is a gener-
al decrease through the day until the minimum at midnight is
reached again (except at noon, 0000 GMT).
In February (Fig. 37). Cat 1 dominates in the morning
and early afternoon hours (1800 to 0300 GMT). Cat 1 equals
Cat 2 at 0600 GMT and at 0900 GMT Cat 2 dominates (Cat 1
equals Cat 3). Cat 2 does not occur at noon.
In March (Fig. 38), the predominant categories are much
higher than in the other months; this is due in part to the
limited mount of data (49 observations). At two time
periods, no visibilities lees than five mi occur. For four
time periods only one category occurs.
42

)41
B. VISIBILITY BY WZATHER PARAMZTER
Air operations at Williams Field are restricted by the
same types of weather parameters as at McMurdo, but not
necessarily in the same frequency of occurrence. Again,
snow includes all falling frozen precipitation.
The percentage occurrence of each of the seven weather
parameters was determined first by the month (Fig. 39) and
then by the hour (Figs. 40-47). Table XVIII shows the
limited number of observations available in August, Septem-
ber, and March; therefore, any conclusions for these months
must be carefully considered. The Williams Field data vali-
date the traditionally held view of a two-month summer
(December and January) with two transitional months (Novem-
ber and February). Blowing snow dominates the winter months
of August through October, while in November the percentage
occurrence of blowing snow equals that of light snow, and
light snow dominates in December through March (the highest
percentage of light snow occurs in March). Moderate to
heavy snow appears to have a maximum percentage occurrence
in September (94 observations), although it occurs more
often in the suner months than in the other two winter
months (August and October). Ice crystals occur in three
months with the maximum percentage in March (over 40) and
less than It in August and November. The percentage occur-
rence of ice fog is greater than either water fog or ground
43
7- .

fog from August through November. For fog and ice fog, the
percentage occurrence is approximately equal in December and
fog occurs twice as much as ice fog in January and
February. 3 Only water fog occurs in March.
In August (Fig. 40), blowing snow dominates, except at
0000 GMT (blowing snow equals light snow) and at 1800 GMT
(light snow dominates). The highest percentage of occurrence
of blowing snow is at 1500 GMT (20%). Noderate to heavy
snow is reported only at 0900 and 1800 to 2100 GMT. At 1800
GNT, moderate to heavy snow and light snow occur equally.
Fog occurs only in the afternoon and evening hours, with ice
fog predominating, except at 0300 GMT, when ice fog equals
water fog (only time water fog occurs). No ice crystals oc-
cur in August. There are only 225 observations in August.
In September (Fig. 41), blowing snow predominates. Any
other conclusion is not valid due to the limited amount of
observations for the month (94 observations).
In October (Fig. 42), blowing snow dominates all hours,
with light snow second. Noderate to heavy snow ocours at
0900 GMT and in the middle to late morning (1000 to 0000
GNT). Ice fog dominates the other tw types of Log, *scept
at 1200 MIT. when water fog has a two to one 1ed. Zoo fog
-,.. - occurs more tMa moderate to heavy saw at all hours.
3 Ses oments asn min sltent obervat iLne. fe e.tum V.Conclusions a4 Ascamesmdt i .
44

In November (Fig. 43), blowing snow dominates five of
the time periods and light snow dominates the other three
(1800 to 2100 and 0900 GMT). Moderate to heavy snow is not
reported at 1800 GMT. Ice fog occurs more than the other
types of fog at all hours. Ground fog occurs only in the
morning (1500 to 1800 GMT), and from 0900 to 1200 GMT only
ice fog occurs.
In December (Fig. 44), light snow becomes the dominant
weather parameter, exceeding all others by 500 or more (ex-
cept at 1200 GNT). There is a slight increase in the occur-
rence of moderate to heavy snow from November. Ice crystals
occur only at 1500 GMT. Ice fog exceeds the other types of
fog in the afternoon and evening hours (0000 to 0900 GMT),
while water fog dominates in the morning hours (1200 to 2100
GMT). Ground fog occurs only at 0600 GMT.
In January (Fig. 45), light snow and blowing snow oc-
cur with the same general relationship as in December. Mod-
erate to heavy snow occurs more than blowing snow for three
time periods. Ice crystals occur at all but two of the time
periods. There is a significant increase in the amount of
water fog compared to December, which dominates, the other
types of fog. Ice fog occurs at all hours with about the
same frequency as in December. There is an increase in the
occurrence of ground fog from the previous month (occurs at
six of the eight time periods).
45
jp .

. .... ....
In February (Fig. 46), light snow still dominates and
there is an increase in the frequency of occurrence over
January. For the general trend, the maximum light snow
occurs in the late night to early morning hours; however,
the largest peak is at 2100 GNT. Blowing snow is the second
most frequently occurring weather parameter and exceeds mod-
erate to heavy snow at all hours. Moderate to heavy snow
is not reported at 2100 GMT. The amount of fog drops sig-
nificantly from January (approximately one-third less), and
is not reported at 0000 or 1500 GMT. Water fog dominates
the three types of fog at 0600 and 1200 GMT. Ice fog occurs
in the morning hours (1800 to 2100 GNT), and again at 0600
GMT. At 0300 GMT, only ground fog occurs (the only time
during the day).
In March (Fig. 47), there are only 49 observations, so
any trends distributed over eight time periods are suspect.
C. VISIBILITY BY COMBINED WEATHER PARAMETERS
As mentioned before, weather parameters often occur
simultaneously, making it impossible to determine which one
is most responsible in reducing the visibility. A visibility
climatology was developed for Williams Field using the samecombined weather parameters as for McMurdo.
The maximm number of occurrences of blowing snow (Fig.
48) are in October and November (138 occurrences) with the
minimum in September (13 occurrences). For all months in
46

which blowing snow occurs, Cat I dominates (about twice as
many occurrences as the next highest occurring category),
with the exception of December (lowest monthly percentage of
Cat 1). In August and February, Cat 3 is the second highest
occurring category, while Cat 2 is the second highest in all
other months.
Cat 1 dominates all months for blowing snow and snow
(Pig. 49), except September when Cat 1 equals Cat 2; how-
ever# there are only two occurrences. In October, November,
January and February, Cat 1 occurs at least 600 of the time.
Also, in August, Cat 1 occurs 100% of the time, but again,
there are only two occurrences. Cat 2 exceeds Cat 3 in all
the rest of the months, except November, where Cat 2 equals
Cat 3. There are no occurrences of blowing snow with fall-
ing snow in March.
Fog (Fig. 50) occurs all months, but no single category
dominates. In December through February, Cat 1 dominates,
followed by Cat 2 and then Cat 3. In March and September,
only Cat 2 and 3 occur and in March Cat 3 dominates, while
in September, Cat 2 dominates. In October and November, Cat
2 dominates. The five observations in August are not enough
to make conclusions.
Slowing snow and fog (Fig. 51) occur in only five months
with Cat 2 dominating in August and November, and Cat 2
dominating in January (only category occurring). This
47
&7 11

distribution results from the number of occurrences (only
one in August. December and January).
For light snow (Fig. 52), Cat 2 predominates, with Cat 2
equaling Cat 3 in August, and Cat 1 dominating in October.
There are no occurrences of Cat 1 in March. However, there
are less than ten occurrences of light snow in August, Sep-
tember and March respectively, with the maximum occurrences
in January (172).
With moderate and heavy snow (Fig. 53), Cat 1 dominates
all months except February, where Cat I equals Cat 2 and
August, where Cat 2 exceeds Cat 1. Cat 3 occurs only from
November to January. Again, there are 14as than ten occur-
rences in August (3), September (7) and March (1), while the
maximum occurs in January (53).
Ice crystals (Fig. 54) occur in only three months with
25 occurrences. This is not a sufficient amount to analyze.
D. WIND STATISTICS
The wind statistics were compiled for Williams Field by
visibility categories and by combined weather parameters.
For all visibilities combined (Table XDX), the most
likely wind speed is 1 to 10 kt in all months. The maximum
average wind speed of 59 kt occurs in November. The wind
directions associated with the maximm speeds vary, while
the predominant wind is generally from the northeast through
east. The maximum wind speed from the predominant direction
48
is less than the maximum wind speed for most months. Winds
occur from all directions but the least likely directions
are southwesterly to northwesterly; however, in March the
least likely direction is northeasterly. The minimum number
of observations occurs in March (49) and the maximum number
occurs in January (2430).
When the visibility is less than one mi (Table 2X), the
most likely wind speed is 11 to 20 kt in the winter and 1 to
10 kt in the summer. The maximum wind speed occurs with
visibilities less than one mile, except December, February
and March. The maximum winds are from the southwest to
southeast, while the predominant winds are from the south to
southeast (more southerly than the combined visibility fig-
ures). The wind speed associated with the predominant
direction in the winter is higher than for the combined
visibilities, and approximately equal in the smmer. There
is one observation in March and 127 in January.
Ior Cat 2 visibilities (Table XXI), the most likely wind
speed is 1 to 10 kt for all months. The maximum wind speed
is significantly less in the winter (August to October) and
slightly lower in the summer than Cat 1; the same pattern
occurs for the predominant winds. The maximum wind direc-
tion is variable, with the predominant winds varying mostly
from southerly to easterly. There are five observations in
March and 76 in January.
42

For Cat 3 (Table XXII), the most likely wind speed in
also 1 to 10 kt, but the maximum speeds are approximately
one-half the maximum speeds for the combined visibilities.
The directions of the maximum speed are variable. The pre-
dominant wind direction is northeasterly to easterly. The
least likely wind directions include northerly and north-
westerly winds.
The calm wind association with blowing snow in Table
XXIII in considered an error. The most likely wind speed is
11 to 20 kt, except in September. The maximum winds at
Williams Field generally occur with blowing snow. The
directions of the maximum winds are southwesterly to south-
easterly with west being the least likely wind direction.
For blowing snow and falling snow (Table XXIV), the most
likely wind speed in I to 10 kt in August and September (two
occurrences each) and 11 to 20 kt the rest of the months.
The maximum winds are mostly from the south, while the pre-
dominant winds are slightly more easterly. The maximum wind
speeds are generally lower than when blowing snow occurs
alone.
When fog occurs (Table XXV), the most likely wind speed
is les than 10 kt. The strongest wind directions are var-
abler the predominant winds are generally from the north-
east to east. The maximum wind speeds are one-half or less
so
"d ~ ' dei m"ee~m~uelm eI
compared to the maximum wind speed for the combined visi-
bilities category. Fog occurs in all months.
Blowing snow and fog (Table XXVI) occurs in only five of
the eight months and only once in August, December and Janu-
ary with a high of five in November.
For light snow (Table XXVII), the most likely wind speed
is 1 to 10 kt. The maximum wind speed is 45 kt in November
and the wind directions associated with the maximum speed
are generally southeasterly to southwesterly. The predomi-
nant wind directions are easterly except in March, and the
speed is approximately the same as the maximum (in the win-
ter). There are only five observations in September and 172
in January.
During moderate to heavy snowfall (Table XXVIII), the
most likely wind speed is 1 to 10 kt. The maximum wind is
59 kt in November (higher than for light snow) with monthly
maxima from the southeast to southwest. For most months the
maximum speeds and the maximum speeds associated with the
predominant direction are the same. The number of observa-
tions range from a low of one in March to a high of 52 in
November.
Ice crystals (Table X=IX) occur in only four of the
months with a total of 25 observations. January is the only
month with a significant number of occurrences (16). In
January the maximum winds are mostly from the east and the
51
I,77 7

predominant winds are from northeast to southeast. The most
likely wind speed is 1 to 10 kt.
Selected wind roses for Williams Field, for various
weather conditions and months, are shown in Figs. 55, 56,
58, 59, 61, 62 and 63.
52

V. CONCLUSIONS AND RECOMIENDATIONS
A. CONCLUSIONS
The percentage occurrence of restricted visibility (i.e.
5 5 mi) at McMurdo shows a definite four-month minimum inj the spring/summer season November to February. During the
winter months Cat 1 dominates: during November and February
Cat 1 equals Cat 2: and in December and January Cat 2 domi-
nates. Snow and blowing snow (the main visibility restric-
tants) are at a minimum from November to February.
The visibility climatology for Williams Field validates
the traditional view of a two-month summer (December and
January) in the Antarctic, with November and February being
transitional months. Cat 1 dominates all months, except
December and March, when Cat I equals Cat 2. Blowing snow
and snow have a minimum in December and January.
For the weather parameters, the trends are similar at
both stations. Blowing snow at McMurdo shows a strong peak
in August and a minimum in January, while at Williams Field,
the strong peak is in October to November and the minimum is
in March. Williams Field experiences less blowing snow in
the summer than McIurdo. For blowing snow and snow occur-
ring simultaneously, Cat 1 predominates at both locations.
*The trend of Cat 1 dominating in the winter, and Cat 2
dominating in the suor for blowing snow and fog, also
53

"o,
holds at both locations. Light snow is less of a visibility
deterrent at Williams Field, with Cat 2 dominating all
months; at McMurdo, Cat 1 dominates in the winter months.
Also, McMurdo experiences twice as much light snow in the
summer as Williams Field. Although moderate to heavy snow
occurs at both Williams Field and McMurdo, it occurs from
three to seven times more often at Williams Field. More ice
crystals occur at Williams Field in March, but the distribu-
tion for the rest of the year is the same as at McMurdo. The
general trend of water fog dominating in the summer occurs
at both locations; however, there is a dramatic increase in
the amount of ice fog that occurs at Williams Field over
that experienced at McMurdo.
In general, at McMurdo, the stronger wineAs are from the
south with the predominant winds from the east. At Williams
Field, there is more variation in the direction of the
stronger winds (southeasterly to south-southwesterly), and
the predominant winds are more southeasterly. The wind
speeds at Williams Field are usually higher than at McMurdo.
If the only observations available to the forecaster are
from MNcMurdo, they can be considered to indicate the general
trend occurring at Williams Field. Bowever, the forecaster
* -must give careful consideration to the type of weather
* iparameter to be forecast and the season of the year before
making a forecast for Williams Field. A comparison of the
54

e4,
winds at Williams Field and those at McMurdo is difficult
except for the months of October through January because of
the extremely small number of observations in the other
months. Also, certain weather parameters do not occur
enough in any month for a comparison.
No attempt was made to correct inconsistent observa-
tions. For example, the large number of ice fog observa-
tions in November at McMurdo, and through the sumer months
at Williams Fieldis suspect, considering temperature.
And, westerly wind directions associated with maximum wind
speeds at Williams Field (Tables XXV, XXVI, XXVII) are
considered highly unlikely. There are other less obvious
inconsistencies.
a. RECOMMEVDATIONS
1. The Antarctic ice pack experiences a great annual
variation. It grows from an average minimum 2.6 million km2
in March to about 18.8 million km 2 in September (a greater
than seven-fold increase). In addition, 851 of the ice pack
melts each year (Central Intelligence Agency, 1978). Since
the large variation of sea ice affects the amount of mois-
ture which reaches the McHLrdo/Willims Field area, research
should be done to determine the importance of this seasonal
process.
2. The data available from the remote automatic weather
stations in the vicinity of Ncurdo, Antarctica should be
55

compared to that at McMurdo/Williams Field in relation to
the occurrence of low visibility and weather type associated
with low visibility.
3. The visibility climatology should be completed for
the remaining four months not considered here.
4. Inconsistent reported data at Ncaurdo and Williams
Field should be corrected, as appropriate.
56

TABLE I
Percentage Occurrence of Restricted Visibility Categoriesat McMurdo
AUG S E, OCT NUT DEC JAN FED 3AA
Cat 2.9 ~Q .E iCa 1 ,~~3 .2s i.fl ".ft1."lota 1711 4.1i 6:1 6: i.
TABLE 1IrcealanOccr1 lface of Meather Ph t seters
dag ag Snow Observations
AlG SZE OCT NOT DEC JAN FEB AMLT SION 42 35 35 42 48 68 57 36HODERATZ TOHEAVY SNOW 14 3 7 6 13 18 11 IPoo 3 4
TABLE III
Ptercentage Ocieace of teat ho Parameters.aoa ao s Obsevat.o
AUG S EP OCT NC? DEC JAN F3 SAR8LSV 11 11 11 6 0 33jLT S 2 17 34 13 30 62OD TO"0? SN 1 0 0 0 2 0 0 0
57

lz N. C, N W. t. "4 cV* 4
AC . f * * .4h 4 w 4 U) ta 6
W * .. a * * * q . I in
zvO97w. a
Nu~os 0141 0 44 .4 0
w 4 103
I..N 0*4N - w~O4 02 loo m. 0
0 .W # oW - . 0I..0 . qrUwo 04 fn'
4c 40 rz 4W. ;
-00
loop0 *I v ( V ~ vi
two4 M4 '40-LIL
A' so 3 x x6IL2o 0 0
.4MM 4

6I 2
M4. cc W* 0 0
INC w0Q q )- mw0
. CA 4 f" a
CI' 4. . w I 4Z U7 N C 3 dt
U in.6 0~.i' O 0W 2IU' mm.* 4.4 .. 4 * W 1
4v In CA N (A
94I t20 CAw n 4 t o
4w~O Inn 04L U sV
'I j . CM W o4A foW gnU .in 4vb' -" d 2 617
infIn N CA in t
o 0.iin4C PIn~ a f ca r! z .0
4C M M. ** b2 i0 ~ 4 I N-4w 94 V4 to2 4
a 16
40 a N
ala 16 O6 00II StA .04 a .Z
.uc *C UU C 16 ~
I
ol I aa Ol

v~~~iq or N-0 rl% wN NCm * &.1 .010 II uj CD Lo
41r In
pqMh~ #M Nr m~ K )220rz ~~in -60 r A
C4I"s 44 1
41 qI~ ci0L i- 0 In 2l zc ~ -440 I Wn 0i
41 44
W ... 4p EJ M ."Ia. c Q a 0. I uim In 3 -
4wr
"4. . ... -- 0 14 qWN . W. I O
0.4 *0 ~ ~ 49 I
a z rd In Mn N N 3 ti
ILW q I 4nC r pn 4 4w e
4C4 0,O W N f"uJ (I 41I
t. 2 :(A 4L *1
IL c c iW b. tCm 3
*Ot I. & tC a L IN -so m 0c 61l
IMP 4040 I
PS 14 Co ~ alGooC p" to a c X0 aCa. 1C 'i0 % 1& oU ~ a woW 'I, A. 4c 9c 4 H
CC *S S 'i

o -4 fn W .--. A" W.
inO.M 14~ In ts U I.
.64 U In
do 04o % (P NO 0 In 41P 0 'na0W ***. 4O I A . W Z)AA 0
'I V 2 .W
A
K - oC 4 % 4 0
4
*0 U4 vY . . . 0 MW M C InCA -4 0 q4.~ *i. wo0'4~2
S.es- ~ ~ C-Aq Ail' 0 1' in l
.,4 IL .. IV 0- MO. a'U doC S4 o m q0 JA 24W n 0 d)4 In 2 A
4 .w 0 o M fn ) w Z
-40
U...V CA ~ 40) rwin I
S~~1 40'44U) '
0 4 a 6 a to
4. -. P(9 W4 ) 6 tN Cf 1 00 11
43 0 0 .0 3 I
fe 1 4 3 t -A$&

w V
4 o to MW. I 1
41a. ..C .41%,n N IV 0 01 zx 9-W *.. t o WU *n M W l 0 t1 i
q.P4I-4 co 0 2 x tolVI C M Z0
0 o a m 0 ,' o. N Cp. N ZW tI r
.. " ) W 0 P4 .... ("I 4MW * W 2
a 'M I w - C11 IN 2%VIM 4 V
i toi. - n 2 toVIM on W W
(A
V~4 ~ O CA n *0( O N W4 aW 22 InNu .. *. 4 4t - 4 4 o 2 1 .0
0-4 in14 O0 I
04C rIn co t 4IlQ IV 02 I to .
*0 l0 C z oN V. 4 4 3
II
a a M'04 a a 4c
4A (a 04U N-
".4
Ah P, 4 A q I OW as CD M. 4.4' 0 4 0V I 3i 0
3 0 IA.c'
ON. IMP' be 4
%C ~ $.- 04 LA' L~ 4
04@ *.6IW Z 1 4 X FA00 -.JfO M 0 44 on0 6'2a . a S
.4 . 1 4M X~I lo 1 0to 6CA 4 t N x P.N
62

200,69, Co .(1k W o C 0 2 a~
.. . 0 In u . M W. W
we 0CdN 4r rn (A fnIA *10 fn In
go CAM (A
ON ~ o .q, 0~ w0 a4 N0 20No *a 4 az .4 . . . . N~ fn ul Mw to- I CA
N3 t%0 4 wo in 2 W
Ii'.
p4 0 0N4 N Ia@ m 0 in 0 C4 en z*.. .N MW. (a* in w ~c:"J l 4 3 I
, 41 4 M- IV w W
0. *4U~' %cogo4 2
Q ~ 80 f"r No 4 V-6 a 4 to Mjto ,. O 0 . 0
Ei 4o. M-. ,C, o o 1 0
1 , 9,0 I
Lz: 1,o.... W , . PR, ..
•~i IL a c+N )II IO,CA 0 0 V
c 60 j4 IL16k
ft C 6S W
it14 of S 05. L
xb a 0
43

Z In QWI CA w4 V'MIM -4N Nr (" CC a
2 " 2 %W,,. . .~ .0 ow".W N *4
N .4 Ii4 U7qr W A
45 0U4[ CA 4 N w * Z CA
o a.... .-,. cawr's •'w~ I Ca
a CA4In
zgO .4-O N 0' 4. -r 4 ft
La ,w CO'0 NC
4,,
p.m .4) "- a04 N 3 CAW 41
qr IOM N4 w 04 Cc4 4 w
I~0 tol UI CA.. Uj I ul.j .
0 .. ' .4 0[, C4C0 ('4W. 2 4
45 CAON N COW43
C4 CA
. . . .. .. .... N 0 0P .V 0..0 - . 2".N 04 P1
.4 '4NI7P a'0. CAO' U7 2(4A.
-0 40 . .Q G z c INIL -V . f. 1: .0 4
(n in 66 ONIf -D
45(Ad 40 0 o 0 i
O's4 10 cc 4
I4b 11. op I -Ia fns 10 1 sd
W" ~ ~ b I. IC ut6 xc xo
I*~ goa * 0 *i 03(
~@~ .. ~i CAI) 0 8 ..4-

InvI2 .4ii .4
". • •
(A
oo
aooooo @w 0 w ° ta o" W W
V e 0 0. 0
o Q 0
-oo~ ..4 , . ,
0 c
's0 0 In, e N i O 0 0 es 0
a - W a
w4 l* ;*
0I M, N (0) - N - IqOpoq 4. (N 51.'
In 0 a"4 '
410rl,'l. 1 a= -P a a(A 0Ct1.4 0 II ll (f C a' 0 . A
Ma to a0i 0i (A 3 A1
;4 -9 0+- IRA& *I ILI v
0 a. wl hi ""o
x I.
*9 '

IL4 If
N ul N f" 0 CP. N 0 aW 4 * ~0 .qrU)- W
in 1',
z v4camC4 -- 0 .1. 0 CL; M 0N
4w4 Inen-0ujq
xV~~ 64 0V" ~0 Pua *U3 - 9A in
96 tr In 0 -40i 4 zb 0
C4 I IN in ~ f wX~*VD~ '*1 08Ir
*6
40 a 10 c (

00 0 Inl qr inJ a60 0 In 4w In 4w ZI . - . . Ci fn . - W -(
4W- I -' ,i 0 4 -,, vWa C-4.I04~ 4wNrI C
Iz 4rrn e r -6e
; ; - M CAUC ')
0M~ N 0hW 0 -
.. r,,. . " M M- ( - • W. - r 1
Z0 0C.W4o Cl, , Ui ,o.M : O
o - -r - - . i .
q4jr M -40 L " M1.41
c% qW. 2W-4
E- A
09 Q6- I0 f 4 I= 3C w M 2q9 -Cc. • . 1 . V "
4cmu
3 ~4 0
A . lz Lo ;0. ... :, 4,adi i
_.0 1"-. .. P9
*-: to
Ga CC fa >
-- I W u p~u 1:.G : lf 0-
0-I CI .1C.g an W."0 d 0
-C-.. c~g XZ Z M ZO I
67
Ar3
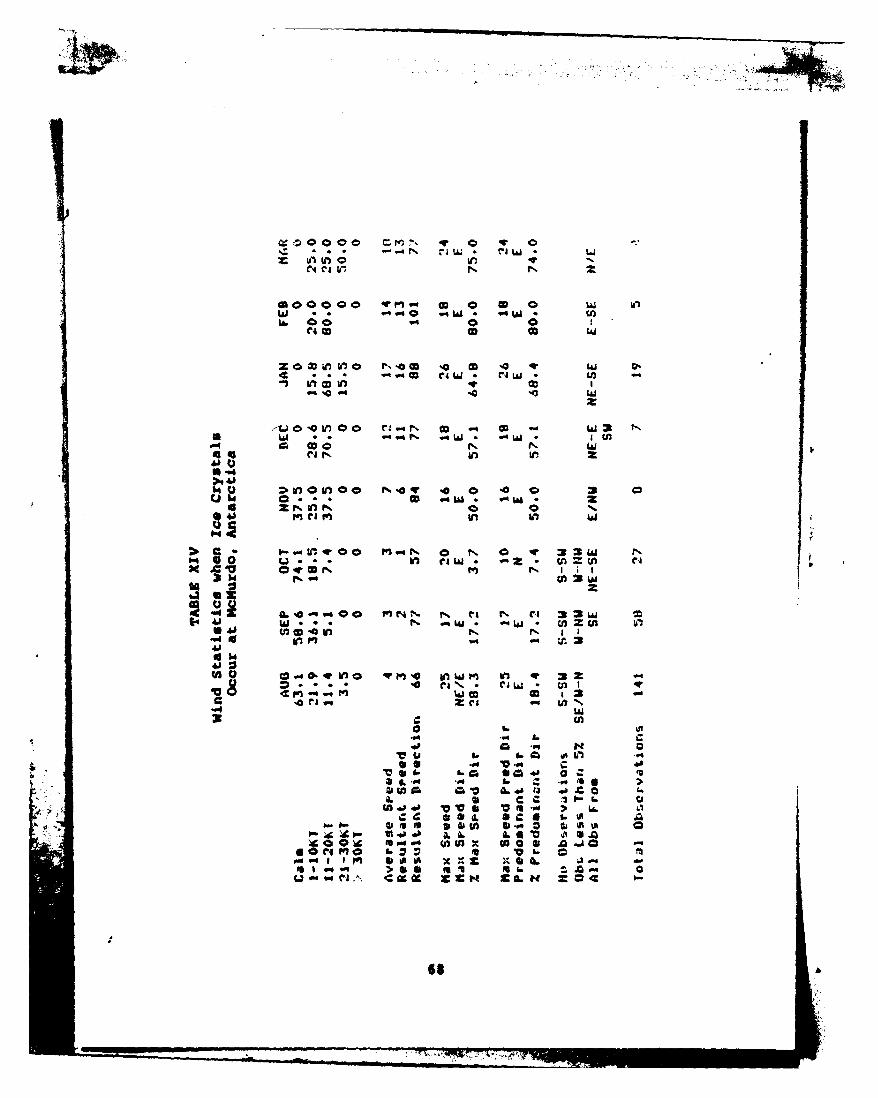
-4 ~ N 2 i
W *4 W* . 0 W * - *WLA. 000 0 1
z 0 a if)to -0s w c .4 4w-4 0'4S W INW r *j .f U)
,-!U 0 4hI00 r., 4 N Cc W4 C.Wfa ia * * N Wu1 caw I44 N N i L
ti . I- LM V00 In N a N 0 or 3 2 w0. so hi kn W es -Z- (n WX 10 ov0N m N I I1
aO Px ~ N~
I41 WS40 4 mV N N% e . V4aw
W C
.4 C"- J&I5I
f4 a 1 2nri -%
16 a
a9 I .a- as U) WNv 0 ;V
0- ~ ~ I ON6.t 6 0 %i 0
el fn. * t. .7V tI I in A x
r 1. C *.. cc. C '14 -
VWIV*a-u7 *-777

loathly Paccetag* Occurrence of Snow and rag
sicac AUG SEP CT: N0T DEC JANM E SAlSnow 11 13 13 19 17
Snow 0 11318 15Tog3aDifj I~; Snow,1 4.8 i6.7 0.3 -241.a 2.:7 6.9
Dif79 T.4 4.4 30.4 25.0 53.8 11.1 230 -14.9
lnow 15 5 111 1 14 129o 1 4i
7.6 11 A
nout &~EzuAvr4ad Inata ouulatlldaxgum lyrectLon an 6loat
AUGe ago SE OCT N0T DEC JAN VED SADRS *d 74 80 72 67 46 7 56 52
51ecio 55 £2 SS SE S STh S Std
'9

doathly lesuited VisibiLitY by Category ia lautical Nles
Los SEP OCT NOV DZC JAI FE3 EI
a 8' "4 12:1',t 1: J::11 :1 1.3 5 .6cat .51 3. 27 3.1 6Cat .3 1.
TABLE XVIIIPercentage Occurrence of Restricted Visibility Categories
at Williams Field
AUG SP OCT SOV DC jai EB I EAlCat I 4.9. 11 6.4% 2.7f ; .&
. , 01; 13: . .,,:7 1
0 Obs 225 34 1213 2301 2356 2430 941 49
70
/k4

0 LV CD4 c
~1 .~oCO 0 in 0 z 04.. • I ta3* " 43 • Z' !
0C 0 z,oCM 4r 4.
Ld * * O *o.I eag. 0 / 4.,-I.00 * 0 %-0O
ZWr%0O40 r%4 0 i1 4. 0 '0 2 0
[ .. .. 0 i U. * tqw. Z : i'
C C
0.)
SIi.... 0 4.0* tjJ - 0 U_
C P4 to w t'n-
:1. "0"0I1 "O .4 0 (a
0N46
C 00 24 00 3St • I0 .* f a
4.2
I n I
pq (C4 I n4 Co. 4.
as .. 0 a ,0 r 22 .
%4~~ " C4Ni C lr
3L mww 3
op
A. 16 alL ' -94 *a .
v. v *. to
**.~~~ UIA*@* 0
kS* '4 s.- o.L0 t4a in~l 0
71

IV.0 a c.0 m m M .120 rl a 2
2 0 C l (n t0 0 0
wo 4 06 N 9 C
V". MO~ 4e * (C'IMC44 4* 4
iIO l- C..
In. ul r
64A
S. inM 0,I &. 0 0, C. CA~
Zw4At 94 NA V) InW* n(.eC4 9.4 N.
AS "4** CC9E; r:I W IJI %
C 4C Mi N e(C .1 0 I l WW
'I 0 . .I C4 .4t ' .0 kn w I hi )U4NOW we I I
PO1J99 ri 4w
0i wfa44 Co .*0l P4 0394 0 I
VA5 *vo. C4V0. 61)fl a% 1
44 0S 0. 0z~
4441 0
.@(. I. ce V ~
94 c CC *b ,I l
g4a 'am o 6.010 ae 0
NO0 M -a 62 6s AX 0 * & A a "o
1 10 *ae x x x*. *6 I
(j Vl.\ 4Uc ZZc c ~ . 2 4 XI 04 -
72

910 4-z 0
I) I 0 I " •
V~~0 f", 0 0 W4 2n (A
U N
inD C1 ~ f4 M InV i . 03 V.'
0P- V,,+ , -1 Nto- v
N I n A
w C 4
r41s- M1r 4r w'* P4W Inn I" to t
4 on U7
".44
34 4.94 $. in. & 0P , I2n C' w Ci0 M.. row U7
++:~ i -co U7- ,,,; ,o03 * 0 00 - owo inI
.. , .<,ov * v,o ccq w , 41, on
.4
4 00
co** OK w w
4c
00
4h + ; I I I I I I I I
.. S. 16 Oa 0 a c 4S& -q .- t. C -M 11a >
c to A - 0.44 a' a.C
-~'~'- U*' &* O2g o OR.~ v~i V0 11 .e -*
is 61 0~** 40 a b 0.
UCUA . 2 is t-~ @ .
73

Oro4DOe-0 4 I 1 0 30 4020 W 324m..0 '4W - 2 F caJ
moo** w (10 0 N0 2
b; ~ ~ 04 0, 40t I
'4 0 *%WOV4 4 w 4 0
*q zNonIo O * V f
41 c.. 4 0 el. 4W 2 x
.C41
UWOU 00 *4 0' Ow 0.30- @W a~ 0 - I"C4tdiV .4 2zMI- o i
K f" 46 0 S 04W toW~ 2 I r m 4O.* - 0 4 0~. (4 W. M
a 4 N4vCo%'O 0
~444 U . * . 0 '4 @ z oI za
"4, 0 04 caNI n1A 41
* 000000 VI) inU in7 2
(J to ad* a a* 2C I= 0I * l wif0~P a. 2 lz-(
41 Nt
EU 06
416 '4'4 c
'a d o c 'c Oe
*1 0 V C s S L
i-16 b- SU * S *
1 0 04 3p is X IsO ~ .
W N4CA 4 9 221 z. a 4
74

ciin
CMwN 4r ; wg
............... l
m w
w n in M f -I % . 4
(J P0~rP , C C4 0 mc n 0 0 U) -
4 wo4
61 * - 97 Cc : U c'aw 3
04 0
0 "4 ~ 0 .0 4 CO ' v4 Co.
0 0q a bi 1 2"4C "., r40 7g
14
Aj Aj 0z 0W 4w0 co00 P)7@ de V.'l
16 c
OP .BflM m4 a .
4.1.
C~dM4. c C0 021 OW b" 4CS4 0 a
0 0 6I
A ~ ~ C X- MA 0'
75 N

-P W*
m a, c~o r..eo In r 0 1) W3
I& mM U U) aw
41 w . 4 U74 ,C - U) w4 %
eC'4 w4l N. in MW ) rW 2z oWn -- a, 04
cooNM qUr' -4 mJ W *
ton" M t . (4b
* ~ ~ ~ 0 b;oUe0 M 04 V) U,1* 34 W7 in
i 0 O 04 0 wM
"4aI c0000 w M OWO coWe aa
lu 6 0 IQ
on
I S '4 la 0P o
we C X X80b5 501 0 C
'4 I S U
76 1 545 41Z 0

~00 0o co4 020 W3 39
N 4 4 In 2
in% 4O w.~ W N in P
P-49 U)~
39
~~0 0 a &o 9 N i
C3 ~ 0 NC4 (a* ejt i
p4
Aj 4), CD C 0 IfP VM 0 n' In ZIN
IL 0.... 0 in 0' (w* t- w.
0 9w ma0 1
4.000 "1O@ '%1 2
41 01
*.. UN N Lo 4 op.0 c
0 0 "'C0 C4 C
-16 0P) so0 5 0 SCx0I
1 2's as I-
-s. NA( 5.4 al CIL 0

r~L.I
4aC
P4 IL
V-4 w
"4 4 0 4
Aj 4 09 0 0CA0 0 0
*t of 0-4 a)d -Dv 04 -4 0 1
2000: op 0 4 V a uo W t
la P'0- 340 40 L M 0 A*) N0 -43a. a AJO
a~~~~~ 0 4M0133 aVt
P4 6 11 f 60 0 0 0 M0 L AP04 0o 3000 44 aU aA0-14 A4 4ca g c " cI c
79
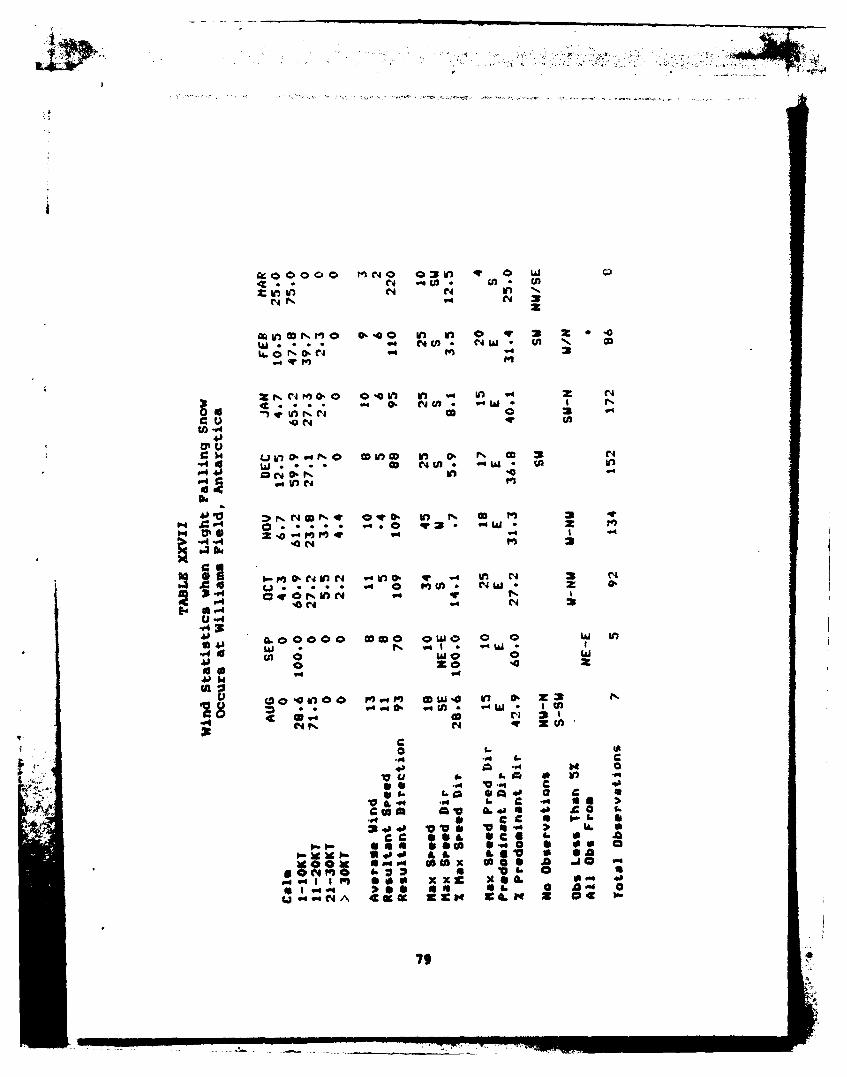
~ ?C4O C3U q 0 wN N) .
N earn0 0) U) C) .0 in Z' In V-1c.. . NV) CAW wo U. rl
0aO%.' -1 -i InNNoW
ION 4r U)
4)
ULiO 4N O w Uco b 0- N cc 3NW .. 0 .4WU) - -W
*0 r4t-
4110N N0 CDNV 40 in N CO m
"4 -A2 14 0 i
0 N V)) (
a C4 04N
a* Aj* w N WN - N* 3l
4)o I.0 O0 W O OwO 0 Ii U
(A 0
13 C ; ;. I to
o I-
v V A61 0 V.04 * o c .
(a in.V06 40 £0 16C C a J-
vC isA ' O 3. U .c~ c et,, S 0 f- 0
oea* -f 44 a ,~ 0 .0 00-9W iopO It, 0 0.
N4CI P" ~ lbN 4 . 36 0 4
7,

im OQ MMS' M30 wMN3 ) 0
L& V0r V 0 0
M 0cV oC t)b)m b 0 ) 0 C4m - ... " M I ( qU .
-1 CA4W .4.I4 0 in LO)
>t). 44 U2(
Aj LIA IV rn U)
41 V) C
t.0~V M QkI' 034 in In Inow 0 .4 CA CA
Nin N 0 0L i 40 4
"4 w#t4 ON ~S4CI N 5 ~000C
P4. 4w*
14 w* * . 4 I 14 n - n . AMU)'. Z. 0'' i CD4 to CA N
N CA W a
416A. 0 ) - l N
pq to - '-* ul
-c *a..
inu 4 a .0V U-b4 16 C .0 a >V@~ *'4 aAW CfO C l 160
4a V ~ 0 6
ON.~ tno se6 2 x x7 a- V 6I14. Ib K6 so 0P x 06 A 0
UP.CNA A. E'El4 09H c NC CI I-

cc (**, in
In'~0
w
X 0o0 CO N Lo m l q ' w en -WW
I PI~p ttnIJ
U .O0 0 00 0 'qr ri 4WIJ q" 0 qW * 0. wJ * - J * I
A 0 0
SU0 0 0
Im 8. :p4*4* - -C4
.41
t-4 t00000 t"*2*r 0 M2 OWl% ZC Um 0
W4 Q 1* W I 2
S 0 0 0 t. %. 10 3 wI
UJ-
IV $4 .,. "0 .,
" QII.. I- Ill4 . 0 !1
06wC
4.00 0. ',
414 - S. -
i .60 to
IllI +* 1. 5. It *I 411 0 C1 "
.C 4 A3 AV I d
01c c 0U 0so 6 IA to
t,.j~ ~ to. 4., l *. ,[ [ I J ,,t : . I 04-k9 90 1* * 0 IL . IL 6 a A t 0 .0
a~s4~ 0 f. P" (a cn
ON CIn 16 Z2 VN
8].

Ju
~~41
82

ja 11r8E 77'S-ROSS SEA
cam Brd
D)RY McMurdo, SoundO LYMPUS-;F -Cp
.L VAD~tA ROSIC N~4h 4 SGARO WC #"
VALLEYS ~~ C~ tn
I ~ $'- Mc Murd =ott Base0 Ran iogce
'4. 78*
.7 WHITE0' Th~~f1ISL AND
LEGEND WBLACK ISANDb [:Mos~y k.-Fme
LJMOtIyteO-Cavred
Vtfgszs 2. Naftudo Local Area
83.
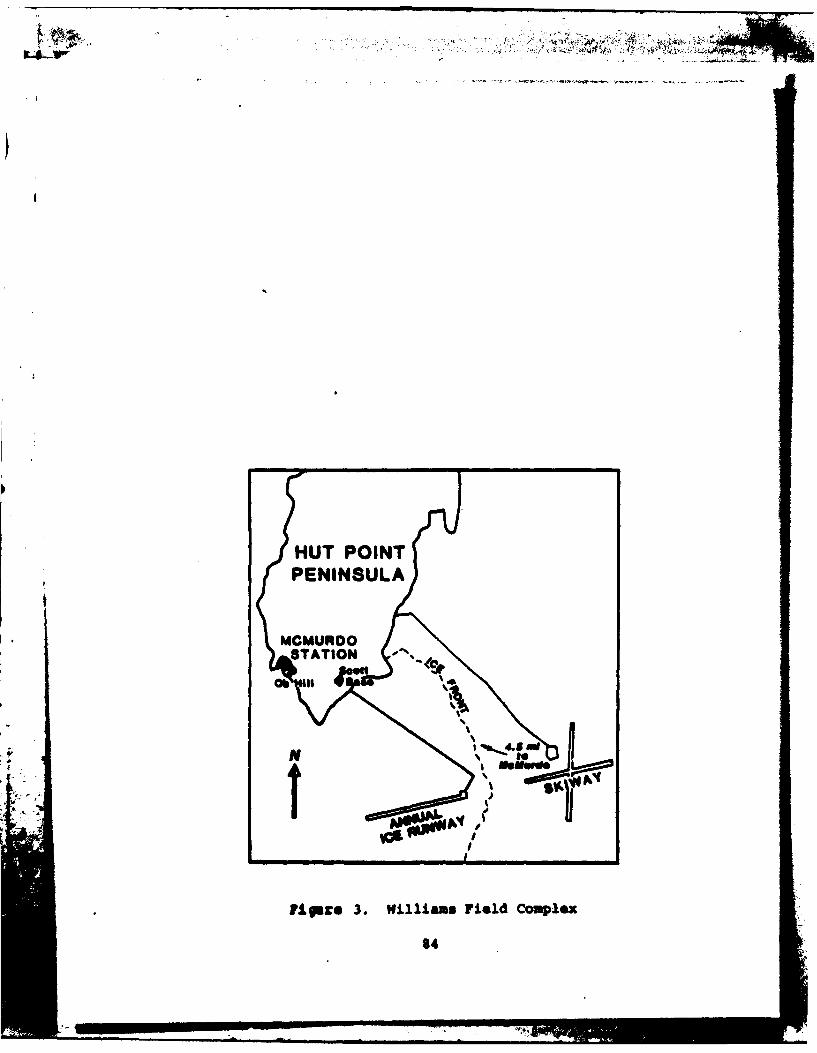
HUT POINTPENINSULA
MCMURDO
STATIO
llgze3. Williams Field Complex
84

MOMURDO RESTRICTED VISIBILITY
LEWNOCM VIS 4 1 "101 vis 1 3 MIiEM vis 3 5 I
NAwNV A
IOTFifeve . mont
almepato~l f0sratdViilt00 act&04kasI
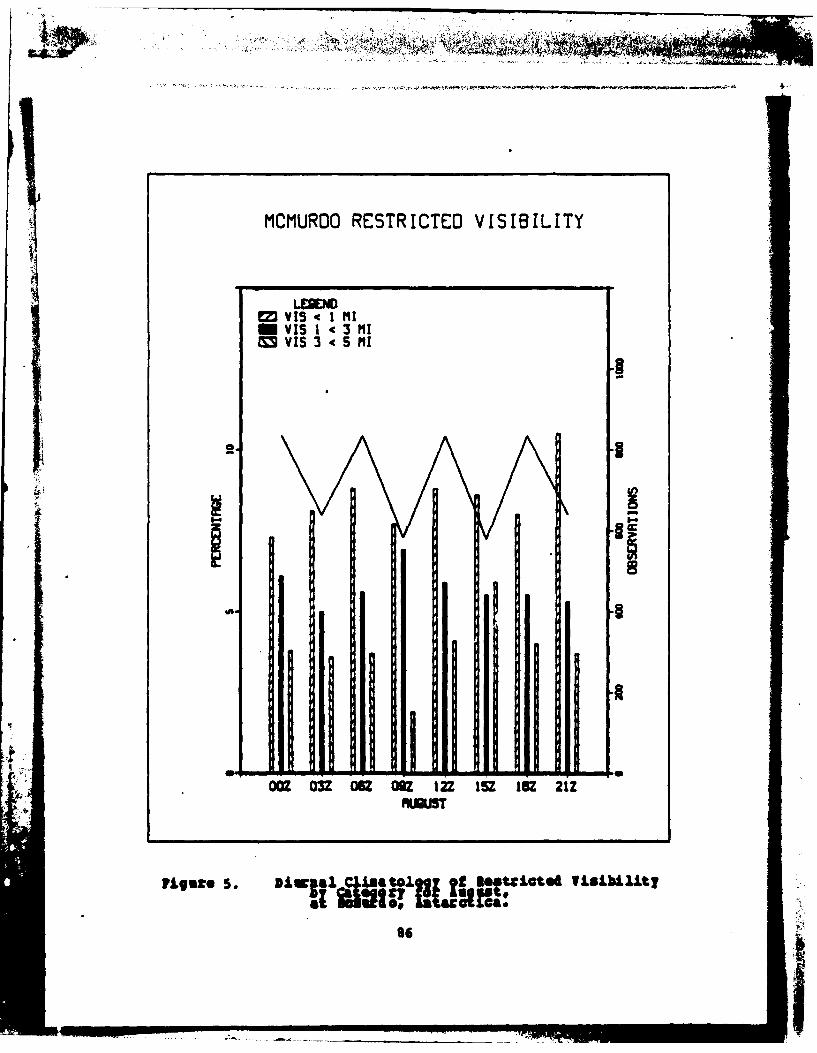
MCMUROO RESTRICTED VISIBILITY
M vts 1 IMS VIS 3 4 S MlI
om O OR 2Z 1Z IG 21
MAW
86

MCMUROO RESTRICTED VISIBILITY
ED US 4 1 Mlim VIS 1 43 MIG3 VIS 3 < S I
m ou u I In lz 21
6. Dna4CiaaaPo etitdVsblt
I8

MCMURDO RESTRICTED VISIBILITY
ED VIS 4 1 ilM VIS 1 43 MICM VIS 3 -c5 MIl
aa

A! I
MCMURDO RESTRICTED VISIBILITY
IM VIS < I Il1
53 VIS 3 4 5 II
all 1IL11 .
03Z GZ OZ 1Z 1Z IO 21
S. Dagaal. CL" o beatictd U I~"toy11.U, It=
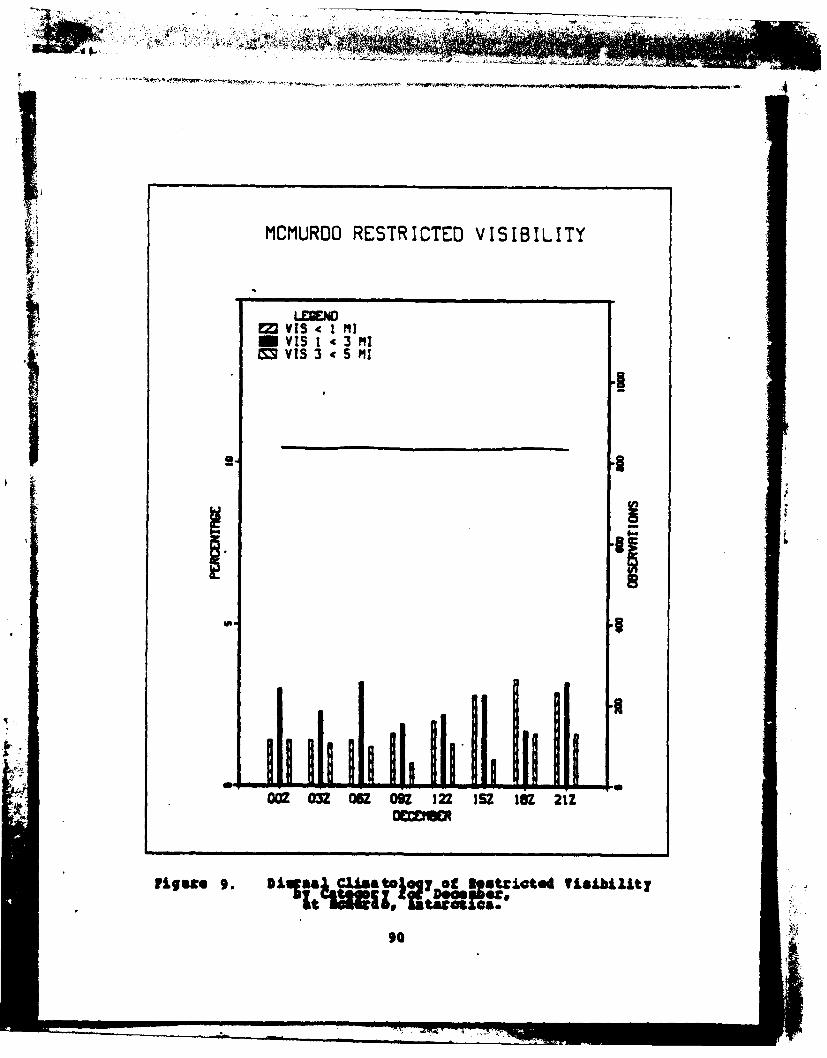
MCMUROO RESTRICTED VISIBILITY
EM VIS < I MIiW VIS 1 4 3 M11
a4 0
002 0 OR M6 9 122 152 IM2 21Z
Vrigaze 9.* 3 iiI CIA&&t ofj7..atticte4 nTibi lit y
It U90

* MCtUROO RESTRICTED VISIBILITY
=IS1~ 4 MIto VIj 3 4 5 M
OR OU12Z SZ IZ 21
Vu
Iftlat 10. law ofRestrcted iltI ~ aael' alum91U
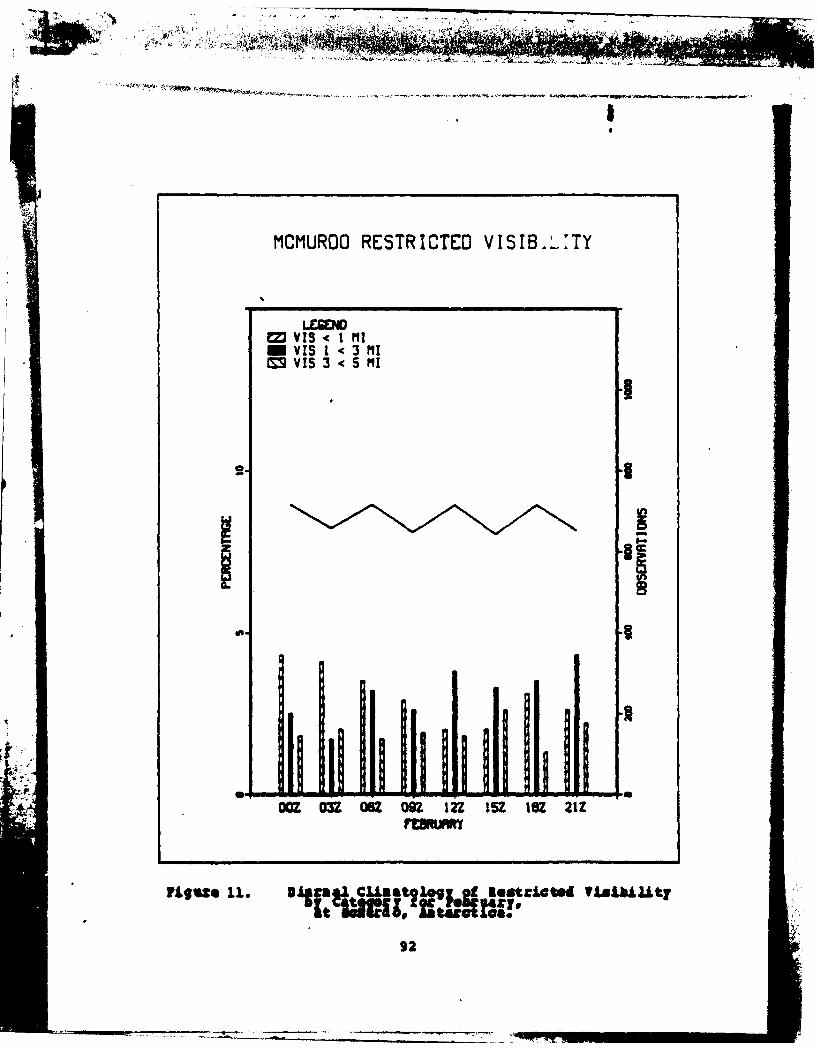
M1CMUROO RESTRICTEO VIsIB.L:.TY
W VIS < I"IMVIS 1 4 3 MI
MS VIS 3 < 5 MI
OR 12 ISZ 8Z 21
reaRLI
11. ICSI cisaIL0199 Reulaed Ia~lIt~o ls, 201,0aff
92

- 47
MCMUROO RESTRICTED VISIBILITY
L~CcOM VIS <I MIm VIS I < 3 MICM VIS 3 <5 111
PI
OM0ZOa0Z12 5 i 1
Figure 12. L ~ 15 182ato f1 Retitdvsblt
*i~sga ofC Alol a leatit4Isbl
93

MCMUROO NEATHER TYPES
LE:GE:NDeZ LIGHT SNOW= MOOERITE TO HEAVY SNOWS BLOWING SNOW= LIGHT ICE CRYSTALSZ IOOERRTE TO iHEAVY' ICE CRYSTALS
RUG SEP OCT NOV DEC JAN FEB fMAR
LEGENDIM FOG= ICE FOG J
R S OCT NOV DEC JAN EB M
MONTH
igite 13. atoltW la IjtjoJogyof leather Typesa I~ f o at aE&za*
94

I'
MCMUROO WEATHER TYPE5
C LIGHT SNOWm MOCI'AT TO HEAVY SNOW
R. = BLOWING SNOWQ LIGHT ICE CRYSTILSM) MODERATE TO HEAVY ICE CRYSTALS
' .'
II -'i
OOZ 03Z 06Z 09Z 12Z lSZ 18Z 21Z
Tz OG1 ICEG .
M. A-, OJN6 Or.
aI ft Il li.' Alt ni. ,I n ,. _l , _n ,I
OOZ 032 06Z 092 12Z INZ lBZ 21Z
IfiPuce 14. Diwsnal Ck~ltoJLoU of foathoa Typ1es Fee blowNat so w ov l acct tc
95

AA )~4$ 19 Il VSI l T C MATOOYO MCMUNDO WUND/WillAMSI10AN ANC CA(U NAVAI NOTGADWAI SC10) M( I FR
A N ' MAR R4
mhhhhhhhhhhhhli 41

1.0 U-wE~J *
INIis

MCMURDO NEATHER TYPES
LLGCSNO2Z L IGHT SNOW
M MOOCRATT TO MC1AVY SNOWt BLOWING SNOWLIGHT IM CRYSTLS"
Z) MODERATC TO HCRVv. ICE CRYSTALS
a ~, I,.[! !HQ
C, 0. ziprx
0 ing -
OOZ 03Z O6Z 09Z 12Z ISZ I8Z 21Z
M I CE FOGM GROUND rOG
OOZ 03Z O6Z 0OZ 12Z 1SZ 18Z 21Z
VWI1
Fiet 15 D iura iciii

1*
MCMURDO NEATHER TYPES
iL I II
2 LIGHT SNOWM ODERTE TO HEAVY SNOWBLOWING SNOW .
Q LIGHT ICE CRYSTALS _Z) MODERATE TO HEAVY CE CRYSTAL$
HU
OOZ CjZ 06Z 09Z 12Z 15Z 18Z 21Z
LEGEND=3 raG
ICE rOG;o J GR UN0 FOG
lip
g i :1 , ft11-no l ,
OZ 03Z 05Z 09Z 12Z 15Z 18Z 21ZOCTOBER
97

MCMURDO WEATHER TYPES
M LIGHT SNOWLM MOCRIRT. TO HEAVY SNOWEM BLOWING SNOWQ LIGHT ICE CRYSTRLSE MODERATE TO HEAVY ICE CRYSTALS
II
CLC
!oz 03Z OGZ O9Z 12Z 15Z 18Z 21Z
M ICE rG/M GRLt4OrOG
A - - -
ONZ 03 a6? 092 12Z 15Z 182 21!
Klee*e 17. *A flpec.1g~~t. tn. 1 bmbqc
to

MCMUROO WEATHER TYPES
LCGENOLIGHT SNOW
m MODERATE TO MERVY SNOWQ BLOWING SNOW= LIGHT ICE CRYSTALSM MODERATE TO HEAVY ICE CRYSTALS
lw allOOZ 03Z 06Z 09Z 12Z ISZ 18Z 21Z
a _ --
M rOGM !CC rQQ
SGROUND rOG
9-
002 03Z 06Z 09Z 12Z 15Z Ila 212
l~quz 13. Tys Fee 9Ism ae
99

MOMURDO WEATHER TYPES5
eZLaGMT SNOWIM wJORATETO MEAVY SNOWd
= LIGHT ICE CRYSTALSZ) POORTC TO HEAVY ICE CRYSTALS
COZ 03 OZ 9Z 12Z I5Z 18Z 21Z
M roGM :.CE raGM GROUNO OG
W I-
100

d~i Nj- A-
MCMUROO WEATHER TYPES
M LIGHT SNOW LGNMmMODERA"TE TO HEAVY vNowQ LOWrING SNOW= LIGHT ICE CRYSTALSMMODERATE TO HEAVY ICE CRYSTRLS
00Z 03Z 06Z 09Z 12Z 15Z 18Z 21Z
~roe
M G ROUN3 FOG
002 032 0ON 09 122 152 IOZ 212
?Aue20. firiu w yps~br20 ese tbftaty

MCMUROO WEATHER TYPES
L I GHT SNOWm ,OOERTE TO H EVY SNOW
8LOWING SNOW.LIGHT ICE CRYSTALS
GEIIOOERRTE TO HEAVY ICE CRYSTA9LS
OOZ, 03Z O6Z O9Z 12Z ISZ 18Z 21Z
LEGENDCM rOGM ICE FOG1C GROUND rO
l i p Ia1 n !ifi I - I n 1Wfas: 21. .I ,gjt.L,._j5_tj,!.. tp.s loz bzeh
m1B2

LESCNDEMVIS < I M1
Imvi 1I 3 MIMVIS 3 <5 M11
a MN
filar* 22. loathly CLUtat.1gy eg SL.,taq 3m.. at lofm4..
103

MCMUROO BLOWING SNOW SNOW
LEGEND=3 VIS < I MI
~VIS 3 <S MI
23. Se's ad Sao
S104
-I77 -77

MCtIUROO FOG
EDVIS < I Mlm vis 1 3 MI
SVIS 3 S MI
AMSPOTNO I MM
KVS24 lnkyC~meoy j oga ooeo
luis

MCMURDO BLOW ING SNOW FOG
M..END M
mI <l (3 MM VIS 35 MI
VS
wU,
IP:Lgn las 0 zR p~lttol~jl a afadf~
* ofca
-l ' -.... ....

MCMUROO LIGHT SNOW
CL
"t 6 et0 lmelg fUh aea IIm~2naetla
10

MCMUROO MODLERATE TO HEAVY SNOW
LEGENDEM VIS I1 MIM vis < 3 M-MVIS 3 <5Ml
I a
AM g E OCIO M Nr AFlq*ZQ 27. soutbaj ~~~IMt I f eeaeto!ayfo
w of &ct~I.
-4

EM VIS < I MImVIS I1 3 MI
CZ V's :u : <C CRSTL M
Sm mv m
flgsce 28. loothl Clumatelogy og zoo Crystals at *okge~of
109

1
t 1o 70
Figure 29. McMurdo Wind Rose (data base, March 1956-December 1972) (Sinclair, 1982).
110
- .1-1 - -4 ;;

WILLIAMS FIELD
RESTRICTED VISIBILITY
LEGENDZ vIs '1 !
m VIS 3 4 3 MIm vis
SEP
IF~w 3.orllcsioo"4 **eatd iL~& Ac Iifi
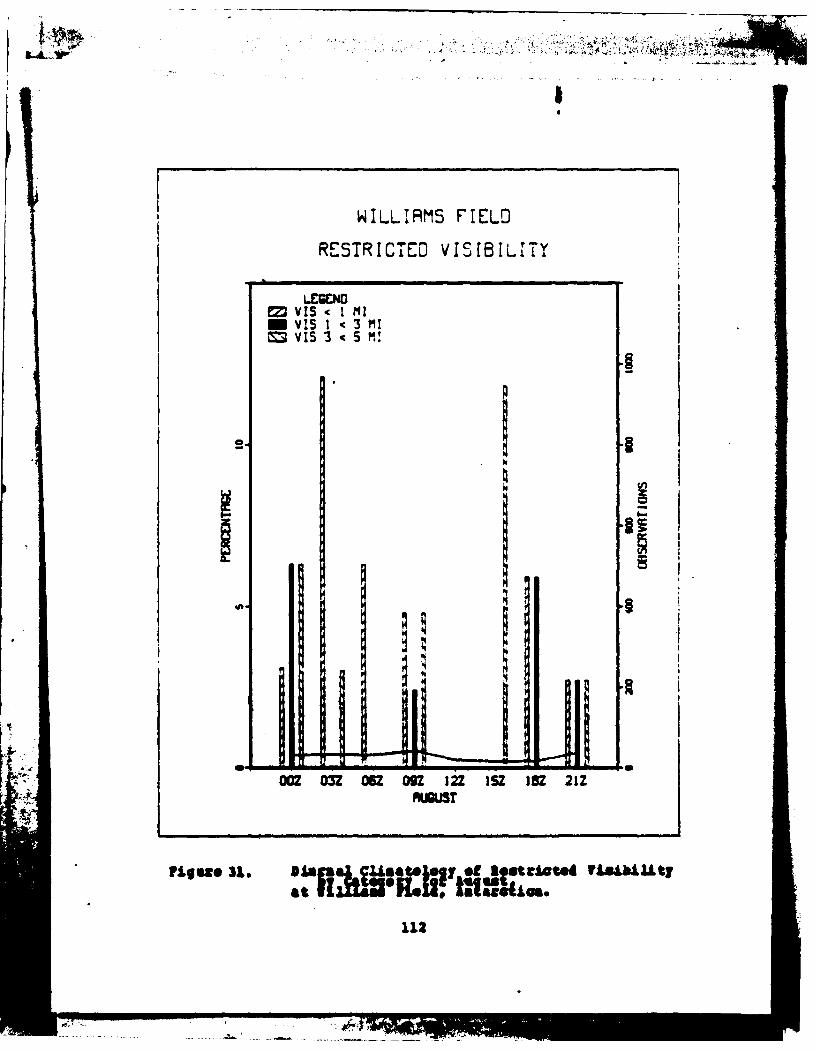
WILLI4AMS FIELD
RESTRICTED VISIBILLTT
LEENOEM VIS c I Im vis 1 3 MIM VIS 3 5 M!
at,

F WILLIAMS FIELD
RESTRICTED VISIBILITY
LEGEND
m vIS I<3 MIcm vIS :3 < 5 MI
14 14.-17 20
0203Z 06R 09? 122 l5Z 182 21Z
V~ug32. 9tslCLLat.1sewlotrett"t. Ylibityat6.
113

WJILLIAMS FIELD
RESTRICTED VISIBI!TTY
LCGENDEM VIS <I Ml
M VIS 1 4 3 MISVIS 3 <S MI
aca
U,4

alli
WILLIAMS FIELD
RESTRICTED VISIBILITY
LEGENImVIS cI MIm VIS I 3 "1l
m VIS 3 5 MI
dl .
Li-

WILLIAMS FIELD
RESTRICTED VISIBILITY
LEGENOIm VIS < I MIm VIS 1 3 P11C VIS 3 < 5 MI
I
I .I
O 03 6Z OU 12Z 1S IOZ 21Z
3-1t
116

WILLIAMS FIELD
RESTRICTED VISIBILITY
Lcw.NEm VIS < 1 m'lm VlS I< 3 Pt!
SVIS 3 <5 M I
now*g 36.* * 1 RWn &&";mtI!'V se lefts" Uallit
117

W1LLIRMS FIELD
*RESTRICTED VISIBILITY
LEV-NOM VIS 4 1 mlI
M VIS I1 3 MIMVS3 4 5 M
OR OZ O OU 2Z 3Z I 21
1346M 37.

NILLIRMS FIELD
RESTRICTED VISIBILITY
LEGEND
m VIS I1 3 MIM VIS 3 < 5 M1
29 25 R 33 2550O
liti

L A. V
WILLI AMS FIELDWEATHER TYPES
LEGENOLIGHT SNOWSIR MOOCRqTE TO HCVY SNOW
I 3 BLOWING SNOW,- ICE CRYSTALS
|,,
AUG SCP OCT NOV OEC JAN FCS MR
22 ro 20
SGROMM FOG
AJMB SEP OCT NOV oCc , 4 Pm mim
m. o

WILLIAMS FIELDWEATHER TYPES
LEGENDLIGHT SNOw
m MODER"TE TO ,'ERVY SNOWCM BLOWING SNOW
ICE CRYS7MLS
tn..
S_. -aoe.
OOZ 03Z 06. 09Z 12Z ISZ 18Z 21Z
ICE FOG
M GROUND2 r0G
W2 03 OR U0GU12 15Z I0Z 21Z
","
ooqsze 0. TI z t flez roz e 1 An t
121
I USI

WILLIAMS FIELDWEATHER TYPES
LEGEND23 L IGHT SNOW= MOOERMT TO HERVYSNOWCS BLOWING SNOWCO [CE CRYSTALS
29
OOZ 03Z 062 09Z 12Z 15 Z18 21Z
LEGEND
M GROUND FOG
0026Z 062 092 122 152 182I 212
Figure 41.* Diurnal Climatology of Weather Types ForSeptember at Willi amx Field, Antarctica.
122

L A Vw
WILLIAMS FIELDWEATHER TYPES
LEGENDM LIGHT SNOW= MODERATE TO HERVY SNOW ,C BLOW I NG SNOW.-1ICE CRYST.RLS
" p
O0Z 03Z 06Z 09Z 12Z ISZ I cZ 21Z
SrOGm ICE FOGW GROUJND PO
OOZ 03Z 06Z 09Z 12Z 15Z 18Z 21ZOCTOBER
ftgnre 42. Dizag" C]es e .e eata er ? e z October
at willm. l"rl4 Types'e
123

WILLIAMS FIELDWEATHER TYPES
LEGENDLIGHT SNOW
a m ~MODERATE TO HEAVY SNOW .BLOWING SNOW
. ICE CRYSTALS
S IBI!'
00Z 03Z 06Z 09Z 12Z l5Z 18Z 21Z
L.EGENDM. FOG
:oE POG .SGRONO OG
Douz 03Z 06Z 09Z 12Z 15Z 18 2Z
l ifgke 4 3. 3*I?'Z IdIfps 2 P C kIember
124---- --

WILLIAM5 7:LDWEATHER hE
LEGENDM LIGHT SNOWSm MOOERATC TO HEA~VY S"o
S LOWING SNOWICEC RYSTALS
1 ENOOZ 03Z 06Z 09Z :2 Z I S7" 1Z 21Z
LEGENDCZ raGM ICE raGm GROUND FOG
00Z 03Z 062 09Z 12Z ISZ 162 21Z
125

WILLIAMIS FIELDWEATHER TYPES
LEGENDCM LI GHT SNOW= iMOERRTC TO HEAVY NOW
CO BLOWING SNOWC-- ICC CRYSTALS
OOZ 03Z OBZ 09Z 12Z 15Z 182 2Z
LEGEND__ _ __ __ __
t!l2i ?yeaWe aau
136

WILL11MS FIELD
WEATHER TYPES
LEGENOM LIGHT 5NOWM MODE0CTC TO HEAVY SNOWM BLOWING SNOW" ICE CRYSTAL5
00Z 03Z 06Z OSZ 12Z 15Z IZ 21Z
LEGENO:c r oG
M3 GROUND rOG
a II00Z 03Z 06Z 09Z 12Z 15Z 16Z 21Z
327
.... L ,.9*

WILLIAMS FIELDWEATHER TYPES
LCGENO 7 IED LIGHT SNOWW MOOCtRATt TO HCAV! SNOWM BLOWING SNOW1 ICE CRYSTRLS
29
IIII
OOZ 03Z 06Z 09Z 12Z !SZ 18Z 21ZL.£CNO
micCE ro 33 5 = GROUNO OG
22 12 14 25 25
ft#Wo47. t W er U24*
128

WILLIAMS FIELD
BLOWING SNOW
LEGENDvi G41 < I tilV:5 I <3 M1Ivis 35 M,
Li f
119we 48. *.anbJ7 cZ~isel of mvL59 SIMu at
William VIO age@
Las

WILL119MS FIELO
BLOWING SNOW + SNOW
LEGENOw visIs m
MVIS I g 3 M1!SVIS 3 <5 MI
Ln
4. Imt lC o s ow a b gatWlimi iiP-tcho
7N~

WILLIAMS FIELD
FOG
LE ENDm VIS t ! II
V IS I < 3 II!a VIS 3 < 5 MI
nf~n~ O. onbll CliHtology of Fog at wLi31ams FIL*Ld Antarctica,
131
",' - L -H! !.

WILLIAMS FIELD
BLOWING SNOW + FOG
LCEWNOI= VIS-.Im
VI 3 N5M
X11-- . 7 OC NO "ANFS
ftfs:. 51. am giea ism W Sao* Alogti
132

WILLIAMS FIELO
LIGHT SNOW
LEGENOEm VIS 4 11
mVIS ! < 3 MIVIS 3 < MI
fIguge 52. * o~i afmeV at
133

lilt~u.*
WILLIAMS FIELD
MODERATE TO HEAVY SNOW
LEGENDEm VIS c I MIlm VIS I <3 ml
S3 VIS 3 4 S P11
IFs- cr.
RA SP OTNVOCJNFB
ftyae 5. lrilife" "UHIg aga
134

WILLIAMS FIELD
ICE CRYSTALS
LEGEND
S IS 5 1MI
I am
SEP NV DE JU
IPqu 54 f-clril-l ci: " o '
atr "t a*
135

LEGEND
STATIO T URE
w %E
-1-5mp"
XX MAfx speed (nips), ItI3b1
Figure 55. Legend for Wind Roses.

MCMURDO 106 WILLIAMS FIELD 127
13
137

MCMURDO 545 MCMURDO 335.
SEP ~15AU 1
14 22 21
30 2cat 1 cat 2
riqure 57. Mind ftss for Cat 1 Visibility in Septemberand Cat 2 Visibility in August at MoIfazdo ,Antarctica
138

MCMUROO 159 WILLIAMS FIELD 78
110
15 12
V4~6IS. l~#~t~j ~j~bj~f~12
UGa
nut:.13

MCMURDO 88 WILLIAMS FIELD 41
1321
121
140

MCMURDO 223
AUG 12
15
11 fee W wt
141

7- ..N
MCMURDO 82 WILLIAMS FIELD so
20 16
142
...............

I
.1
MCMURDO 69 WILLIAMS FIELD 44
JAN JAN 14
16
s4
15 18
lge 62. ,1 9 3 it! 3Wtf, a ,flpJ4 .US,,,
143

MCMURDO 128 WILLIAMS FIELD 154
JAN JAN
100
i 10
F,.,. 63.., 1lg'.J lLt.
144..... 4.
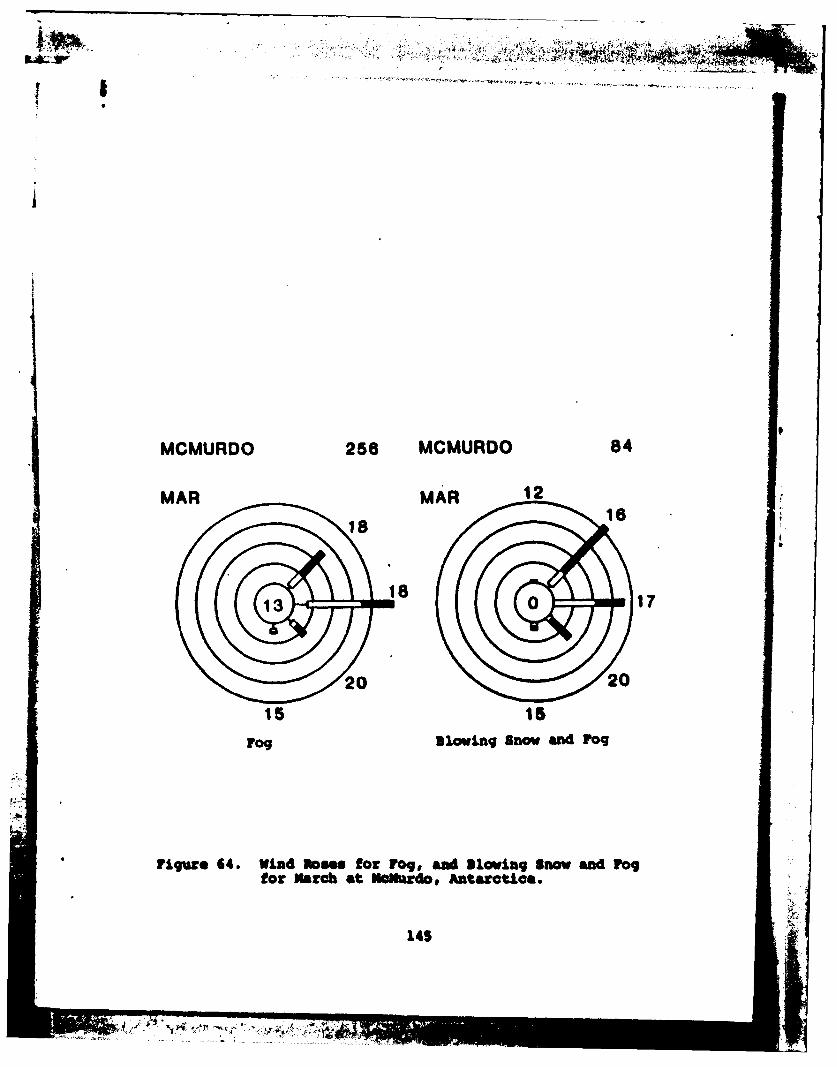
MCMURDO 256 MCMURDO 84
15 Is
r09 slowing Snom and Fog
* Figure 64. Mind ~M for Fog, and S lowing Snow and Fogfor March at Haftrdov Antarctica.
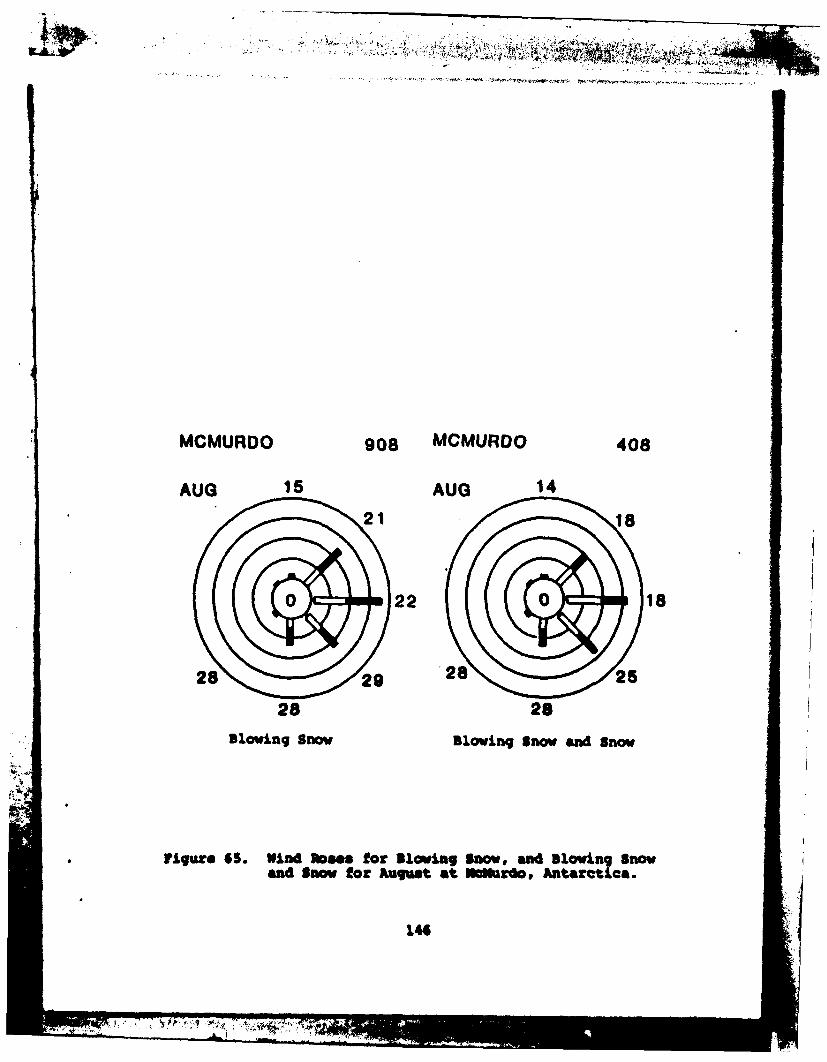
. .&..
MCMURDO 908 MCMURDO 408
2211
28 2
Blowing snow Blowing snow and Snow
Figure 65. wind bNss for 3slowing snow, and slowing snowand Snow for August at NeSkrdo . Antarctica.

, ... X 2.
LIST OF RZFRERNCRS
Biter, C. J., 196S: A study of some hydrometers that affectvisibility at Mclurdo Sound, Antarctica, NWRF TechnicalPaper No. 14-65, Navy Weather Research Facility, Nor-folk. Virginia, 28 pp.
Central Intelligence Agency, 1978: Polar Region* Atlas,Superintendent of Docuents, U.S. S overiment PrintingOffice, Washington, DC# 20402, 66 pp., Stock lmber 041-015-00094-2.
Huffman, P. J. and T. Ohtake, 1971t Formation and growth ofice fog particles at Fairbanks, Alaska, Journal ofGeophysical Research, 76, No. 3, January, pp. 65765.
Mercer, J. M., 1961: Climatology of McMurdo Sound, U.S.Navy Weather Research Facility, Building R-48, U.S.Naval Air Station, Norfolk, Virginia, Dec 1961I, O 16-1261-052, pp. 67.
National Science Foundation, 1983t Williams Field: the
history of an icy aerodrome, Antarctic Journal of theUnited States, 18, No. 2, June 1,uJ, pp. 1-7.
Orvig, S., 1970: World Survey of Climatology, 14, Climatesof the Polar Reglons, Elsevier Prbliahing "MmiPany, 5Manderbilt Ave., new York, New ork, 10017, 370 pp.
Sallee, R. W. and A. W. Snell, 1970t Antarctic ForecastersHandbook, Antarctic Support Activities, DetachmentCHARLIE, Fleet Post Office, New York, New York, 0*501.
Simpson, 0. C., 1919: M, 1: Discussion, SritishAntarctic Tpedition9, Thacker, pink and Co.,Calcutta, 326 pp.
Sinclair, M. K., 1"2f Weather obervatme in the fosIsland Area, Antarctica Ow Sealana eteor1o5locaiService, Technical Note no. 2S3, P.O. 3.2 722, Welling-ton, New Zealand, 36 pp.
Thompson, D. C., 1972: Adverse weather conditions for fly-ing operations at MNurdo Bound and Cape Nllett, Ant-arotica, Technical note 214, New Zeland NoteorologicalService, P.O. box 722, Wellington, Mw Zealanid, 9 pp.
147
.4. *'4
'. ~ ON

United States Naval Support Force Antarctica (NSFA), 1982:United States Antarctic Program Welcome Aboard Manual,Public Affairs Office, KSFA, Fleet Post Office, SanFrancisco, California, 96601, 74 pp.
145

INITIAL DISTRIBUTION LIST
No. Copies
I. Defense Technical Information Center 2Cameron StationAlexandria, Virginia 22314
2. Library, Code 0142 2Naval Postgraduate SchoolMonterey, California 93943
3. Chairman, Code 63Rd 6Department of MeteorologyNaval Postgraduate SchoolMonterey, California 93943
4. Chairman, Code 63Mr 1Department of OceanographyNaval Postgraduate SchoolMonterey, California 93943
5. Professor Carlyle Wash, Code 63Wx 1Department of MeteorologyNaval Postgraduate SchoolMonterey, California 93943
6. Captain Cheryl G. Souders USAF 2PSC Box 1905APO, Sew York 09127
7. Naval Support Force Antarctica 2Code 33FPO, San Francisco 96601
B. Mr. Sen Fogle 1Polar Programs ManagerNational Science FoundationWashington, DC 205S50
9. Director Naval Oceanography Division 1Naval Observatory34th and Massachusetts Avenue NWWashington, DC 20390
10. Mr. William 3. Thompson, Code 63Th 1Department of MeteorologyNaval Postgraduate schoolMonterey, California 93943
149
1 1 'I

1.1. CommanderINaval Oceanography CommandNSTL StationSay St Lo'is, Mississippi 39522
12. Comanding OfficerIFleet Nuerical Oceanography CenterMonterey, California 93943
13. Comanding off icerINaval Environmental PredictionResearch FacilityMonterey, California 93943
1.4. Chairmuan,* Oceanography DepartmentIU.S. Naval AcademyAnnapolis, Maryland 21402
15. Chief of Naval Research1800 N. Quincy StreetArlington, Virginia 22217
16. Commander (AXR-370)INsval Air Systems ComandWashington, DC 20360
L7. Program Manager (CIRF)IAir Force Institute of TechnologyWright-Patterson AIM-Ohio 45433
118. Cmander1Air Weather ServiceScott Air Force Sao*, Illinois 62225
19. Coanding Officer 2Air Force Global Weather CentralOffutt Air Pbrce Base, Nebraska 66113
20. Mr. Mark X. Sinclair, Code, 63SiDepartment of MeteorologyNaval lostgrduaate schoolMonterey, California 93943
345
