adaptation and evaluation of the neighborhood environment
TRANSCRIPT

Washington University School of MedicineDigital Commons@Becker
Open Access Publications
2016
Adaptation and evaluation of the neighborhoodenvironment walkability scale in India (NEWS-India)Deepti AdlakhaQueens University-Belfast
J. Aaron HippNorth Carolina State University
Ross C. BrownsonWashington University School of Medicine in St. Louis
Follow this and additional works at: https://digitalcommons.wustl.edu/open_access_pubs
This Open Access Publication is brought to you for free and open access by Digital Commons@Becker. It has been accepted for inclusion in OpenAccess Publications by an authorized administrator of Digital Commons@Becker. For more information, please contact [email protected].
Recommended CitationAdlakha, Deepti; Hipp, J. Aaron; and Brownson, Ross C., ,"Adaptation and evaluation of the neighborhood environment walkabilityscale in India (NEWS-India)." International Journal of Environmental Research and Public Health.13,4. 401. (2016).https://digitalcommons.wustl.edu/open_access_pubs/4982
International Journal of
Environmental Research
and Public Health
Article
Adaptation and Evaluation ofthe Neighborhood Environment Walkability Scalein India (NEWS-India)Deepti Adlakha 1,*, J. Aaron Hipp 2 and Ross C. Brownson 3
1 Center for Public Health, School of Medicine, Dentistry and Biomedical Sciences, Queens University-Belfast,Belfast BT7 1NN, UK
2 Department of Parks, Recreation, and Tourism Management and Center for Geospatial Analytics,College of Natural Resources, North Carolina State University, Raleigh, NC 27695, USA; [email protected]
3 Prevention Research Center, Brown School, Division of Public Health Sciences and Siteman Cancer Center,School of Medicine, Washington University in St. Louis, St. Louis, MO 63130, USA; [email protected]
* Correspondence: [email protected]; Tel.: +44-2890-976-431
Academic Editors: Harry Timmermans, Astrid Kemperman and Pauline van den BergReceived: 11 February 2016; Accepted: 25 March 2016; Published: 2 April 2016
Abstract: Physical inactivity is the fourth leading risk factor for global mortality, with most ofthese deaths occurring in low and middle-income countries (LMICs) like India. Research fromdeveloped countries has consistently demonstrated associations between built environment featuresand physical activity levels of populations. The development of culturally sensitive and reliablemeasures of the built environment is a necessary first step for accurate analysis of environmentalcorrelates of physical activity in LMICs. This study systematically adapted the NeighborhoodEnvironment Walkability Scale (NEWS) for India and evaluated aspects of test-retest reliability of theadapted version among Indian adults. Cultural adaptation of the NEWS was conducted by Indianand international experts. Semi-structured interviews were conducted with local residents and keyinformants in the city of Chennai, India. At baseline, participants (N = 370; female = 47.2%) fromChennai completed the adapted NEWS-India surveys on perceived residential density, land usemix-diversity, land use mix-access, street connectivity, infrastructure and safety for walking andcycling, aesthetics, traffic safety, and safety from crime. NEWS-India was administered for a secondtime to consenting participants (N = 62; female = 53.2%) with a gap of 2–3 weeks between successiveadministrations. Qualitative findings demonstrated that built environment barriers and constraintsto active commuting and physical activity behaviors intersected with social ecological systems.The adapted NEWS subscales had moderate to high test-retest reliability (ICC range 0.48–0.99).The NEWS-India demonstrated acceptable measurement properties among Indian adults and maybe a useful tool for evaluation of built environment attributes in India. Further adaptation andevaluation in rural and suburban settings in India is essential to create a version that could be usedthroughout India.
Keywords: India; walkability; built environment; physical activity; measurement
1. Introduction
Non-communicable diseases (NCDs) like obesity, diabetes, and cardiovascular disease constitutea significant portion of the growing health burden across the world, of which the greatest increasesare expected in low- and middle-income countries (LMICs) [1–6]. India, a LMIC with a populationof 1.2 billion people and soon to be the world’s most populous country, is experiencing a NCDepidemic [7–9]. India has the largest diabetic population in the world, with 33 million in 2015,projected to reach 130 million by 2030 [10–16]. Cardiovascular disease is the leading cause of death in
Int. J. Environ. Res. Public Health 2016, 13, 401; doi:10.3390/ijerph13040401 www.mdpi.com/journal/ijerph

Int. J. Environ. Res. Public Health 2016, 13, 401 2 of 24
India, and its contribution to mortality is rising; deaths due to cardiovascular disease are projected toincrease from 2.7 million in 2004 to 4.0 million in 2030 [9,17–19]. Morbid obesity (body mass index(BMI) > 30 kg/m2) currently affects 5% of Indians (approximately 61 million people) [20].
Physical inactivity is a leading risk factor for development of NCDs [21–25]. Calls to reduce globalepidemics of NCDs by the United Nations and the World Health Organization have recommendedincreasing physical activity (PA) as a key strategy [13,17,26,27]. In 2011, the United Nations High-levelMeeting on Non-Communicable Diseases identified increasing PA as one of five priority interventionareas to reduce the impact of NCDs, noting modification of the built environment (BE) to support PAas a key focus area [28]. In this context, research linking the BE with PA has increased rapidly in recentyears [29–32] and is now an international priority [33–35].
Mounting research evidence suggests that the BE can facilitate or constrain PA [36–48]. However,studies examining PA and BE associations thus far have been primarily limited to Australasia, Europe,North America, and South America [49–51]. Findings from these studies may not generalize to otherparts of the world, particularly in LMICs like India that are collectively home to 80% of the world’spopulation and are at higher risk for developing NCDs [21,25,52].
The BE in many LMICs is distinct in terms of development patterns and different from thosein the developed countries. Rapid, unplanned, and unsustainable urban development are makingLMICs key focal points for emerging environmental and health hazards. These hazards include theinter-related problems of urban poverty, road traffic fatalities, and air pollution [53]. In addition,increased urbanization, greater dependence on automobiles, along with diminishing open spacefor walking and leisure in cities is associated with sedentary lifestyles or increased time spentsitting [54–57]. These lifestyle modifications have led to marked shifts in energy imbalance thatare spawning the rise of NCDs [46,58–60]. This sum of influences that the surroundings, opportunities,or prevailing conditions of life have on promoting obesity in individuals or populations has beentermed obesogenic [61–64], and has not yet been fully understood in the context of LMICs.
Due to BE differences, questions remain about the applicability of surveys constructed indeveloped countries to the local contexts in LMICs. BE correlates of PA that have been documentedin developed countries have yet to be studied among LMICs like India. To address this issue, therehave been recent calls for investigators to collaborate on a regional basis to adapt BE measures that aretailored to the LMIC contexts [33,65]. The development and testing of reliable and culturally sensitivemeasures of BE attributes is a necessary first step for accurate analysis of environmental correlates ofPA in low-and-middle-income countries.
The methodology used in this study is based on the recommendations of the InternationalPhysical activity and the Environment Network (IPEN; www.ipenproject.org), an organization thathas established common methods and measures for worldwide research on PA and BE’s. The surveyinstrument was adapted from the Neighborhood Environment Walkability Scale (NEWS) that hasbeen used widely by IPEN [66–70]. The NEWS is a self-reported survey instrument to assess BEcharacteristics relevant for PA. Subscales of NEWS assess perceived residential density, land usemix, street connectivity, walking/biking infrastructure, and traffic and crime safety. This scale wasdeveloped in the United States (U.S.) in 2002, and has been successfully implemented in LMIC countriesin Asia (China [71], Japan [72]), Africa (Nigeria [65,73]) and South America (Brazil [74]) in recent years.
This study is the first of its kind to conduct a cultural adaptation and evaluation of a BEsurvey—NEWS—in India. The present study was conducted in an understudied region in Asia and hasthe potential to add to the international literature on the relevance and impact of healthy environments.
2. Methods
2.1. Study Setting and Sampling Procedures
This study recruited a diverse sample of participants from the metropolitan area (164.48 sq. miles)of the city of Chennai, India. Chennai is the capital city of the state of Tamil Nadu, a major commercial
Int. J. Environ. Res. Public Health 2016, 13, 401 3 of 24
and industrial hub in southern India [75,76]. Chennai is the fourth most populous city (8.9 millionresidents) in India. Local residents (N = 14) and key informants (N = 7) were recruited using a purposivesampling technique across the Chennai metropolitan area. Purposive sampling has been more effectivein the instrument development and adaptation stage and recommended by researchers who haveconducted similar studies of this nature in LMIC contexts [65,68,77]. The principal investigatoridentified a small pool of local residents from formerly established relationships with neighborhoodassociations, resident welfare associations, and local contacts. These residents, through their socialnetworks, suggested other residents who were interested in participating in the study. In order toensure selection of a diverse sample, effort was made to recruit residents from different neighborhoodsacross the city.
Inclusion and exclusion criteria for local residents and key informants were based on IPENprotocol for NEWS adaptation and studies conducted in Nigeria [65], Brazil [78], and China [71].Eligibility criteria for local residents included: (i) current residents of Chennai metropolitan area;(ii) residents of the Chennai metropolitan area for at least 6 months; (iii) 18–65 years of age; (iv) beingable and willing to answer questions in English or Tamil, which is the official language in the studyregion; (v) not having any disability that prevented independent walking; and (vi) no visible signs ofcognitive impairment.
Key informants for this study were chosen on the basis of their interest and related work in localcity planning, transportation engineering, walkability, PA, and obesity or diabetes-related research.A multidisciplinary group of seven key informants including but not limited to local city planners,transportation engineers, park and recreation professionals, geographers, and public health scientistswere developed from the PI’s established contacts. Eligibility criteria for local experts included:(i) current residents of Chennai metropolitan area; (ii) 18–65 years of age; (iii) ability to speak English orTamil; (iv) interest in BE and public health issues. Exclusion criteria for participants were: (i) presenceof a medical condition that interfered with the ability to walk; (ii) unsuitable appearance (drunkenness,drug addiction, illegal possession of weapons). Local residents and key informants were excludedfrom the interviewing sample if they were less than 18 years of age and/or did not consent to beinginterviewed or audio-recorded.
2.2. Data Collection and NEWS Adaptation
Semi-structured interviews were conducted with local residents and key informants betweenAugust 2013 and January 2014. A list of potential residents and key informants was developed usingthe above-stated eligibility criteria. From this list, participants were contacted either in-person, viatelephone or email and asked about their interest and eligibility to participate. All participants thatwere contacted consented to being interviewed. A convenient time, date, and location for the interviewwas set for the consenting participants. Research information sheets and interview questions wereemailed to participants two days prior to the scheduled interview. Each interview lasted 30–40 minand was audio-recorded. All study procedures were approved by Washington University’s HumanResearch Protection Office (IRB ID #201410052) and followed Institutional Review Board Guidelines.
Residents were asked questions on the perception of their neighborhood BE as well as attitudes,beliefs, and intentions for PA. Key informants were asked to provide input on the original NEWSquestionnaire and to think about environmental factors that are important for both cities and villagesin India. Key informants were also instructed to help identify items on the NEWS that are not relevantto local environments in India and to suggest culturally appropriate and equivalent items in the Indiancontext. The goal of this adaptation process was to retain as many original concepts and items aspossible, but to express them in ways that are appropriate for the local culture and environment. Mostimportantly, key informants were asked to suggest inputs on environmental factors that are importantfor PA in India that are missing on the original NEWS. Key informants were asked to consider bothphysical BE and social environment. Factors in the social environment included presence of violence,crime, gang activity, and indicators of social disorder such as graffiti, trash, and people begging.

Int. J. Environ. Res. Public Health 2016, 13, 401 4 of 24
This qualitative research phase of the study employed a grounded theory approach to supportthe sample size [79]. Grounded theory uses theoretical saturation of data as a guideline to determinethe number of participants required for a detailed analysis [80]. Saturation has been defined as datasatisfaction achieved when a researcher reaches a point where no new information is obtained fromthe collection of further data [80,81]. In this study, a situation of theoretical saturation was attainedwhere no new categories or properties emerged from the gathering of further data. There are nofixed sizes or standard tests that can determine the required data for reaching saturation. However,based on previous key informant research, 10–15 interviews were expected to provide adequatein-depth information and saturation on emergent themes and issues [82,83]. Data from interviewswere analyzed and a summary report of findings was sent to all participants post analysis.
Emerging themes from the interviews (Table 1) were discussed with an international panel of IPENexperts including developers of the original NEWS-Adult (Sallis, Cain, Geremia and Conway at theUniversity of California, San Diego, and Reis at Pontifícia Universidade Católica do Paraná, Curitiba,Brazil). These international experts ensured that the underlying concepts assessed by the NEWSquestionnaire were not compromised during the adaptation process. Feedback from this panel wasused to inform the adaptation of the NEWS-India. The final consensus version of NEWS-India includedall items of the original instrument with their original wording or slightly modified form [69,70], with24 additional items describing features of the environment relevant to India. The adapted NEWS-Indiaconsists of 91 items that assessed the following perceived environmental characteristics: (a) residentialdensity (seven items); (b) land use mix-diversity (43 items); (c) land use mix-access (seven items);(d) street connectivity (five items); (e) infrastructure and safety for walking and bicycling (13 items);(f) aesthetics (six items); (g) traffic safety (six items); and (h) safety from crime (four items).
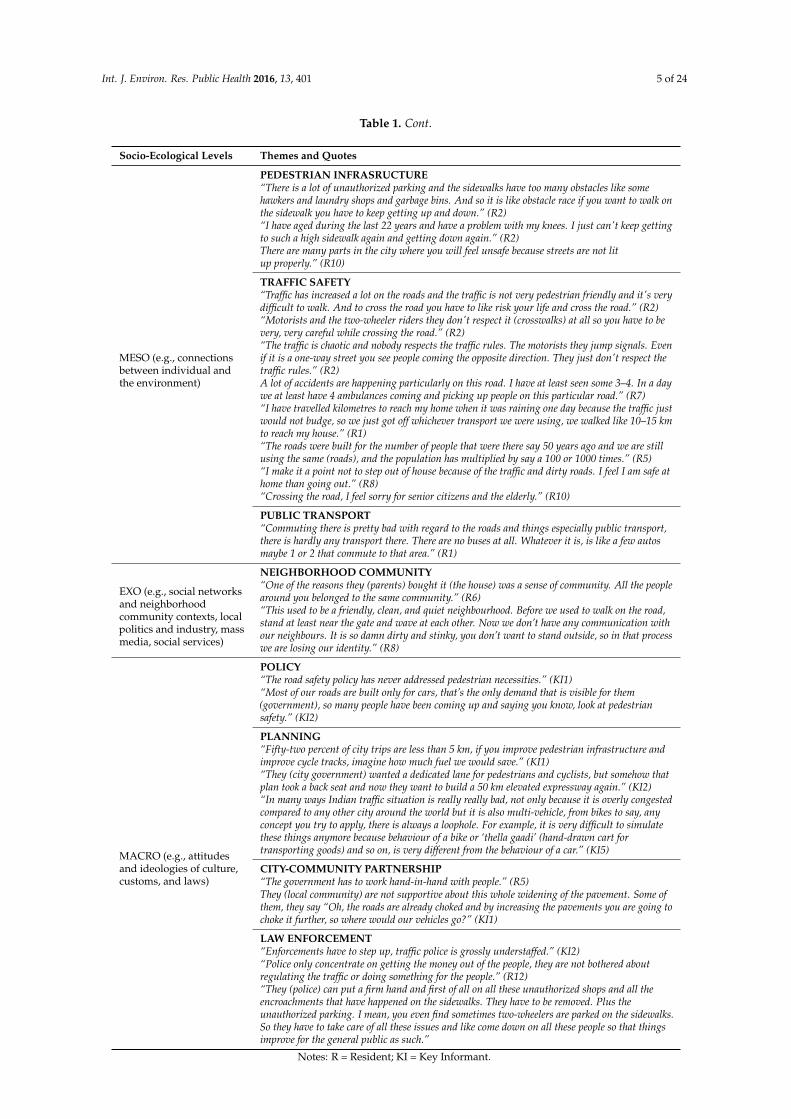
Table 1. Themes and sample quotes (N = 21) across the socio-ecological framework related to the builtenvironment and physical activity in Chennai, India, that informed the adaptation of NEWS-India.
Socio-Ecological Levels Themes and Quotes
MICRO (e.g., individual,family, peers)
INDIVIDUAL AND FAMILY FACTORS“There’s no space to walk on the sidewalks where you can walk carefully so that puts me off and Idon't walk at all.” (R2)“It’s just not safe to walk outside, and it has become so bad that my mom said I want a treadmill athome and we bought a treadmill and my mom is walking on that.” (R5)“We did consider the children's school was nearby and my husband's office was nearby so that wasa reason why we considered this (residential neighborhood).” (R2)“My parents are extremely spiritual people and there are lots of temples around, so they chose thishouse. And my dad he is diabetic, so walking is compulsory for him. So the beach is close by andthat is why he liked this place.”
MESO (e.g., connectionsbetween individual andthe environment)
NEIGHBORHOOD ENVIRONMENT“It is basically a concrete jungle.” (R1)“It (neighbourhood) used to be like a walk in a park, literally. In my neighbourhood before, therewere open stretches of land, couple of residential houses, and no apartments. Now, there is hardlylike any plot that is available for people to buy.” (R5)“Every household has at least one car and two bikes (motorized), and there is no place to place topark. There are many flats in Chennai that don’t have garages or parking facilities, so people endup parking on the roads. Those parked cars on either side make the roads even narrower to makethings worse” (R5)“Green cover has come down by 50% since we moved in.” (R3)“Because of commercial activity, all the old houses are being pulled down and big complexes arecoming up and all the trees are being cut down so all the shade is gone. As it is the weather is veryhot and humid so it is not really favorable to walk in the hot sun in the afternoon.” (R2)“When it rains, we don’t have a proper sewage system, so the drainage and the sewage all comesout, the dirty water comes out on the roads and people have to travel. Because there are nosidewalks they end up traveling you know, through the muddy and dirty water.” (R5)
Int. J. Environ. Res. Public Health 2016, 13, 401 5 of 24
Table 1. Cont.
Socio-Ecological Levels Themes and Quotes
MESO (e.g., connectionsbetween individual andthe environment)
PEDESTRIAN INFRASRUCTURE“There is a lot of unauthorized parking and the sidewalks have too many obstacles like somehawkers and laundry shops and garbage bins. And so it is like obstacle race if you want to walk onthe sidewalk you have to keep getting up and down.” (R2)“I have aged during the last 22 years and have a problem with my knees. I just can't keep gettingto such a high sidewalk again and getting down again.” (R2)There are many parts in the city where you will feel unsafe because streets are not litup properly.” (R10)
TRAFFIC SAFETY“Traffic has increased a lot on the roads and the traffic is not very pedestrian friendly and it's verydifficult to walk. And to cross the road you have to like risk your life and cross the road.” (R2)“Motorists and the two-wheeler riders they don't respect it (crosswalks) at all so you have to bevery, very careful while crossing the road.” (R2)“The traffic is chaotic and nobody respects the traffic rules. The motorists they jump signals. Evenif it is a one-way street you see people coming the opposite direction. They just don't respect thetraffic rules.” (R2)A lot of accidents are happening particularly on this road. I have at least seen some 3–4. In a daywe at least have 4 ambulances coming and picking up people on this particular road.” (R7)“I have travelled kilometres to reach my home when it was raining one day because the traffic justwould not budge, so we just got off whichever transport we were using, we walked like 10–15 kmto reach my house.” (R1)“The roads were built for the number of people that were there say 50 years ago and we are stillusing the same (roads), and the population has multiplied by say a 100 or 1000 times.” (R5)“I make it a point not to step out of house because of the traffic and dirty roads. I feel I am safe athome than going out.” (R8)“Crossing the road, I feel sorry for senior citizens and the elderly.” (R10)
PUBLIC TRANSPORT“Commuting there is pretty bad with regard to the roads and things especially public transport,there is hardly any transport there. There are no buses at all. Whatever it is, is like a few autosmaybe 1 or 2 that commute to that area.” (R1)
EXO (e.g., social networksand neighborhoodcommunity contexts, localpolitics and industry, massmedia, social services)
NEIGHBORHOOD COMMUNITY“One of the reasons they (parents) bought it (the house) was a sense of community. All the peoplearound you belonged to the same community.” (R6)“This used to be a friendly, clean, and quiet neighbourhood. Before we used to walk on the road,stand at least near the gate and wave at each other. Now we don’t have any communication withour neighbours. It is so damn dirty and stinky, you don’t want to stand outside, so in that processwe are losing our identity.” (R8)
MACRO (e.g., attitudesand ideologies of culture,customs, and laws)
POLICY“The road safety policy has never addressed pedestrian necessities.” (KI1)“Most of our roads are built only for cars, that’s the only demand that is visible for them(government), so many people have been coming up and saying you know, look at pedestriansafety.” (KI2)
PLANNING“Fifty-two percent of city trips are less than 5 km, if you improve pedestrian infrastructure andimprove cycle tracks, imagine how much fuel we would save.” (KI1)“They (city government) wanted a dedicated lane for pedestrians and cyclists, but somehow thatplan took a back seat and now they want to build a 50 km elevated expressway again.” (KI2)“In many ways Indian traffic situation is really really bad, not only because it is overly congestedcompared to any other city around the world but it is also multi-vehicle, from bikes to say, anyconcept you try to apply, there is always a loophole. For example, it is very difficult to simulatethese things anymore because behaviour of a bike or ‘thella gaadi’ (hand-drawn cart fortransporting goods) and so on, is very different from the behaviour of a car.” (KI5)
CITY-COMMUNITY PARTNERSHIP“The government has to work hand-in-hand with people.” (R5)They (local community) are not supportive about this whole widening of the pavement. Some ofthem, they say “Oh, the roads are already choked and by increasing the pavements you are going tochoke it further, so where would our vehicles go?” (KI1)
LAW ENFORCEMENT“Enforcements have to step up, traffic police is grossly understaffed.” (KI2)“Police only concentrate on getting the money out of the people, they are not bothered aboutregulating the traffic or doing something for the people.” (R12)“They (police) can put a firm hand and first of all on all these unauthorized shops and all theencroachments that have happened on the sidewalks. They have to be removed. Plus theunauthorized parking. I mean, you even find sometimes two-wheelers are parked on the sidewalks.So they have to take care of all these issues and like come down on all these people so that thingsimprove for the general public as such.”
Notes: R = Resident; KI = Key Informant.
Int. J. Environ. Res. Public Health 2016, 13, 401 6 of 24
The adapted NEWS-India developed in this step was translated into Tamil, the official languageof the state of Tamil Nadu and predominantly spoken in the study region. A knowledgeable bilingualperson conducted the translation using terms and concepts that were understood by people residingin Chennai. These translations were reviewed by a group of bilingual people that are similar tothe intended users, i.e., residents of Chennai from a wide range of education levels and incomegroups. The group ensured that the Tamil translation of NEWS was acceptable to monolingualpeople. Two bilingual persons who were not familiar with the project and representative of eventualstudy participants (e.g., low socio-economic status) translated the new Tamil version of NEWS-Indiaback into English (back translation). The back-translation was not required to produce the exactoriginal wording. A group of bilingual people reviewed the back-translation and decided on the finaltranslated version of NEWS-India. This process ensured that the meanings of the two versions werecomparable. To assess the comparability of item wording, response options, and number of items, thestudy investigator provided back translations of surveys to two independent raters who were expertsin the area (James F. Sallis, University of California, San Diego, CA, USA; Rodrigo Reis, PontifíciaUniversidade Católica do Paraná, Curitiba, Brazil).
2.3. Pilot Testing and Cognitive Response Testing
NEWS-India was interviewer administered to 10 consenting adults for cognitive response testing.Cognitive response testing or cognitive interviewing is routinely used to refine questionnaires toenhance the quality of data collected [84,85]. To encourage critical feedback of the NEWS-India,participants were informed that the questionnaire was originally developed in the U.S. to assessattributes of the neighborhood BE that are important for PA in developed countries. Participantswere interviewed separately and/or in a focus group, for their understanding of the words in thequestionnaire, clarity of each item, and their suggestions for improvement. Participants were asked toverbalize their process of: (i) question comprehension (clarity of words, terms); (ii) information retrieval(response recall time); and (iii) decision making (aspects considered when choosing the response).Participants were also asked if any questions made them feel uncomfortable and if any relevantitem in the local context was not included in the questionnaire. All participants were encouraged toverbalize their thought process while providing responses to the items. Results from this pilot testwere discussed with the international expert panel and subsequently used to modify NEWS-India.
2.4. Survey Administration and Psychometric Testing
Between December 2014 and May 2015, NEWS-India was interviewer administered to consentingparticipants (N = 370). This phase of the study adopted a stratified two-stage cluster samplingstrategy. Study participants were selected from neighborhoods chosen to maximize the variancein neighborhood walkability and socio-economic status (SES). This type of stratification bySES was used to enhance the representativeness of the sample because low-SES populationstend to be underrepresented in studies of this nature [67,86]. The goal of this phase of thestudy was to select participants from wards stratified into four quadrants that represent thefollowing criteria: high-walkable/high-SES, high-walkable/low-SES, low-walkable/high-SES, andlow-walkable/low-SES. To stratify neighborhoods by SES, IPEN studies have used median householdincome obtained from appropriate government ministries, departments or agencies [65,68]. Due tothe lack of ward-level GIS and household income data for the city of Chennai, Walk Score was usedto classify wards based on walkability and cost of rental units per square foot to define ward-levelSES. Walk Score is a large-scale, public access walkability index that assigns a numerical walkabilityscore to any address using a patented system [87]. A score above 90 (maximum 100) is a “WalkersParadise” whereas below 24 is “Car Dependent”. Scores are calculated based on proximity to nearbyamenities such as parks, groceries, schools, and public transit. Points are awarded based on thewalking distance to amenities using distance decay calculations [87,88]. For example, amenities withina 5 min walk (0.25 miles) are given maximum points and more distant amenities receive minimum

Int. J. Environ. Res. Public Health 2016, 13, 401 7 of 24
points, with no points given after a 30 min walk [89]. Walk Score also uses population density androad metrics such as block length and intersection density are used to measures pedestrian friendlinessof a neighborhood [87,89].
Neighborhoods (wards) were divided into ten equal groups (deciles) based on their walkabilityand SES levels. Participants were recruited from identified neighborhoods using a purposive samplingtechnique and eligibility criteria discussed in Section 2.1. NEWS-India was administered for a secondtime to consenting participants (N = 62) with a gap of 2–3 weeks between successive administrations.Participants were contacted either in-person, via telephone or email, with up to 6 contact attempts toassess study interest and eligibility.
3. Data Analysis
3.1. Qualitative Analysis
Inductive and thematic analysis was conducted across the interview transcripts, using aframework approach to classify data according to key themes and emergent categories [90]. Dataanalysis included creation of nodes for certain themes and topics called coding. A node is like acontainer for qualitative data (themes, concepts) and presents a way to tag data in order to find andanalyze trends or patterns [91]. A node hierarchy was created as a way of organizing nodes into mainthemes (parent nodes) and sub-themes (child nodes). Two research members read each transcriptand identified coding themes and nodes. Themes were recorded and shared with the research teamto develop a consistent coding scheme to be used within NVivo 10 (QSR International, Burlington,MA, USA) [92–94]. One team member present at the interview and one not present then coded eachtranscript using the developed coding scheme.
There were five broad categories of original interest, as structured in the semi-structuredinterview questions: neighborhood environment characteristics including pedestrian infrastructure,patterns of commuting, constraints to walking/bicycling and other types of PA, desired changesin infrastructure for the benefit of physical, psychological, and social well-being, and role ofcity-community partnerships in neighborhood planning and maintenance. As the nodes for codingthe data were identified, several distinct patterns were recognized. Constant comparison was usedto further investigate these patterns across social ecological systems in a matrix form similar to thatused by Zayas et al. [94]. Socio-ecological systems refer to people’s interactions with their physical andsociocultural surroundings [36,95]. Ecological models of health behavior predict the most effectiveinterventions should work on multiple levels to change psychological, social, policy, and physicalenvironmental factors [36,96]. Numerous authors [97–101] and authoritative groups have identifiedenvironmental and policy interventions as the most promising strategies for creating population-wideimprovements in eating, physical activity, and obesity, including the World Health Organization [13],Institute of Medicine [102,103], International Obesity Task Force [104] and Centers for Disease Controland Prevention [105,106]. However, environmental and policy factors are the least-studied category ofphysical activity correlates [107,108].
3.2. Assessment of Reliability
The reliability of the items of the adapted NEWS-India was assessed in two ways: theagreement of scores using the calculation of the kappa statistic for each item and one-way modelsingle-measure intraclass correlation coefficients (ICC). Portney and Watkins suggest that when the unitof measurement is on a categorical scale, reliability can be assessed using a measure of agreement [109].A simple index of agreement is the proportion of occasions that raters agree on scores, although thismeasure is limited as it does not take into account the level of agreement that could have occurredby chance. The kappa statistic overcomes this limitation by providing a chance-corrected measureof agreement.

Int. J. Environ. Res. Public Health 2016, 13, 401 8 of 24
To evaluate the test-retest reliability of the adapted NEWS-India, one-way model single-measureintraclass correlation coefficients (ICC) were calculated to test individual items. To test NEWS scalescores computed from multiple items, the single-measure ICC was also computed. ICC representsthe proportion of total variance in a set of values that is attributable to between-subjects variability,with the remaining proportion attributable to error. ICC estimates >0.75 were considered as goodreliability scores, between 0.50 and 0.75 as moderate reliability and <0.50 as poor reliability [110].Statistical tests were conducted using the Statistical Package for the Social Sciences (SPSS) version 22(IBM Corporation, Armonk, NY, USA) [111].
4. Results
In the process of performing the inductive analysis, it became salient that BE barriers andconstraints to active commuting and PA behaviors were not only perceived by individuals, butconstraints also intersected with socio-ecological systems. Though some specific constraints wereunique to the individual and to the specific neighborhoods, there were mostly shared constraints. Intotal, themes addressed in the interviews were organized into the social ecological categories: micro,meso, exo, and macro-level factors [83,112]. Micro-level factors included perceived constraints atthe individual level (e.g., overcrowding, lack of maintenance and cleanliness). Meso-level factorsinfluenced PA behaviors in interpersonal specific user groups (e.g., women, older adults) acrossbehavioral settings (e.g., poor pedestrian infrastructure and public transport access, lack of safetyfrom traffic). Exo-level factors equally constrained PA participation by all members of the community(e.g., crime, gender-based violence, loss of sense of community) and macro factors were society-levelconstraints (e.g., disordered city planning, absence of road safety policies and law enforcement).Examples of socio-ecological factors at these levels are presented in Table 1.
4.1. Micro
Several perceived individual-level factors were identified. Residents cited proximity towork/school and access to diverse destinations as reasons for neighborhood selection. Micro-levelconstraints were identified as limiting individuals from being physically active and were a commonnarrative acknowledged in several interviews with residents. For example, lack of maintenance ofneighborhood parks and playgrounds constrained the use of these spaces for PA among multipleparticipants. Individuals spoke of specific barriers and instances of constraints to PA due to lapses inmaintenance and cleanliness in their neighborhoods. Overcrowding, disorderly traffic, and lack ofsidewalks were identified as barriers to PA. For example, in reference to sidewalks with gaps and indisrepair, residents (R) said;
R8: “Pavements are dirty, it is not at all good for walking.”R10: “For the pedestrians there is no space in the city. There are no proper pavements in most parts of thecity. If there are pavements also, the bikes (motorized) will travel on the pavements. There is no respect forpedestrians in the city.”R10: “I do walk, but it’s not a very good experience. The pavements will be dug up and you won’t haveany place to walk on them. It’s such a narrow road and you have buses coming. I don’t mind buses but it’scrazy the way they drive, so I am really scared to walk.”
4.2. Meso
Perceived constraints to PA specific to user groups and between behavioral settings were identified.Residents reported rapid development and construction of apartment complexes and increasedcommercial activity in residential areas, resulting in loss of green cover. Scarcity of road space andinsufficient parking spots to accommodate increases in motor vehicle ownership across householdswere discussed. Lack of pedestrian infrastructure to support walking was highlighted. Several

Int. J. Environ. Res. Public Health 2016, 13, 401 9 of 24
residents expressed concerns about threats to safety from traffic, particularly for women and olderadults in their families. One resident said:
R3: “There is practically no sidewalk in any part of the city. People are seen walking on roads. Except forthe time I go to the park in the morning, I have to walk on roads. Walking in the park is much safer in thesense you know where you are walking. Wherever there are sidewalks, they are not worth walking on. Andthe government has not given importance to sidewalks and cycling. Women and elderly find it difficult.”
R12: “They (city government) have dug up the road and the pedestrians, they can’t walk. And my dad,his eye sight is very bad, so he is not allowed to go outside after dark because he cannot cross the road.Most of the accidents occur with cyclists and pedestrians. They are very prone to accidents because there isno security.”
Residents discussed the desire to engage in everyday PA, but attributed the inability to do so dueto non-existent sidewalks, high volumes of unregulated vehicular traffic, and poor enforcement oftraffic rules. A few long-term residents recalled walking for errands (e.g., to the grocery store, library,etc.) and engaging in outdoor recreation or leisure PA in local parks and playgrounds in previousyears, but reported being increasingly inactive or sedentary for leisure at present (watching TV, playingvideo games, sleeping, doing household chores, sitting at a desk, etc.). Reasons for this were cited asovercrowding and lack of existing opportunities or places for outdoor leisure-time PA. Residents said:
R2: “Earlier I would go out and walk, I mean, at least three to four times a week to run small errands, to goto the library, to go shopping, but that is not possible at all because the road is very bad due to the metro(metro rail construction) going on. The main road is one-way (one-way traffic) and the traffic volume is toomuch. It’s very difficult to cross the road.
R1: “I used to bicycle to the beach every weekend. But nowadays, because the traffic is so dangerous, Ihave stopped using my bicycle. I spend my weekends watching TV and playing games on the computer.Sometimes I play volleyball with my friends on the beach.”
Older adults reported going to neighborhood parks the most. However, despite living in streetsadjacent to a park, they reported being unable to walk to the park due to increased road traffic volumes.They most commonly drove to the park and then engaged in PA within the park boundaries.
R2: “If you want to have a nice walk, there is a park but getting to the park is a 20-min walk and then youhave to brave all the traffic and go to the park. So if the conditions were better I would not mind walking tothe park and then having a walk in the park.”
4.3. Exo
Study participants mentioned a strong sense of community and presence of religious institutionsas key reasons for neighborhood selection. One of the participants stated that the primary reason forbuying their house was because their neighborhood had a high concentration of people from the ethnicgroup/Indian state they belonged to:
R6: “One of the reasons they (parents) bought it (their house) may be like a sense of community because, youknow, there are lot of demographics living in Chennai, and they were Malayalees and they had come fromKerala (southern Indian state). So it sort of grew up like a little “Mallu” (colloquial term for Malayalee-atype of ethnic group in India) colony. All the people around you were sort of neighbours, were Malayalees.Because of that a temple came up. The temple was originally a Kerala temple.”
Another participant mentioned that easy access to temples around their home was a key factorfor choosing to live in their neighbourhood:
R9: “My parents are extremely spiritual people and there are lots of temples around, so they like to go there.”

Int. J. Environ. Res. Public Health 2016, 13, 401 10 of 24
Several Participants also identified distinct community-level constraints that were consistentacross different areas of Chennai where they lived. For example, one of the participants mentioned alack of any face-to-face contact and feeling disconnected from the neighbors on the street. This hasresulted in a loss in the sense of community:
R2: “This used to be a friendly, clean, and quiet neighbourhood. Before we used to walk on the road, standat least near the gate and wave at each other. Now we don’t have any communication with our neighbours.”
Participants discussed safety concerns and gender-based violence against women and girls intheir neighborhoods, streets, and public spaces. Some female participants mentioned having inferioraccess to public transport, feeling unsafe when walking alone after dark, being subject to pointedstares, inappropriate comments, and sexual harassment. One of the participants narrated incidents ofwomen being subject to inappropriate comments while walking on the streets:
R14: “You can’t say crime but there are people standing, passing lewd comments.”
The prevalence of these forms of gender-based violence in the exo-level system has resulted inmaking the public space a restricted area for women and girls, eliminating freedom and the humanright to participate in the cultural and social life of the community. Research on women using publicspaces in Indian cities has found correlations with environmental design features and attitudes ofsociety [113,114]. Many women in India are concerned about using public spaces alone due to fear ofcrime. A study in Chennai found that women using public spaces like parks confined their activitiesto just walking, and they only used spaces that they trust [114]. The study also showed that visitorsto the beach included couples, families, groups of friends, and single men, but very rarely singlewomen [114]. Studies have found that the design of the BE can make spaces inviting for women anddiscourage situations where women get harassed. For example, a public space that is busy, surroundedby shops and stores with movement of people, open on all sides with good lighting makes women feelsafer [113,115].
4.4. Macro
At the macro or societal level, participants discussed attitudes and ideologies of thegovernment and community organizations. Residents mentioned that roads were designed to beautomobile-dependent, neglecting pedestrians and bicyclists. Key informants were critical of thegovernment policies on transport and pedestrian infrastructure. A common theme across all keyinformants was government policies were one-sided by favoring the automobile over pedestrians andbicyclists, resulting in high pedestrian fatalities. Key informants said:
KI1: “Till the government doesn’t prioritize that pedestrian infrastructure is important and think laterally,road safety will be completely neglected in our city.”
KI5: “It (road safety) is a very practical difficult issue to go around because the traffic on the road in myopinion in India is a million times worse than any other city in the world. In many ways Indian trafficsituation is really, really bad, not only because it is overly congested compared to any other city aroundthe world but it is also multi-vehicle, from bikes to say, any concept you try to apply, there is always aloophole. For example, it is very difficult to simulate these things anymore because behaviour of a bike or
“thela gaadi” (hand-drawn cart for transporting goods) and so on, is very different from the behaviour of acar. Bikes squeeze in, about 50%–60% of Chennai traffic are bikes, so the way they behave, is completelydifferent from your typical discussion on traffic in say, America, or any other country in the West.”
Participants criticized the haphazard and uncoordinated nature of work across governmentdepartments. Residents spoke about a lack of political will among political leaders and no visionwhen it comes to planning for the future. Several residents of the city believed that decisions takenby local municipal leaders without giving much thought to future prospects were responsible for thehaphazard growth in the city. Discussing this lack of foresight, a resident said:
Int. J. Environ. Res. Public Health 2016, 13, 401 11 of 24
R5: “Building a city is no joke. It is not like “Lego” that you just, you know, put in a few pieces and “Ohthe city is there”. You need proper foresight.”
Several participants discussed the need for greater collaboration among city departmentsand improved partnerships between the city and neighborhood associations for improvement andmaintenance of infrastructure, roads, and pedestrian facilities.
KI5: “All the things we just mentioned requires multiple departments and multiple coordination andmultiple capacity.”
R2: “If the government, the corporation, if they do things at that (community) level I'm sure theneighborhood will also join hands and see to it that their streets are encroachment free and they'll see toit that they're kept neat and clean. There are neighborhoods where they do have competitions and like thepeople on their own beautify their sidewalks and they give out prizes for all these things. So these are all thethings people can do at the community level. Once they find that things are kept neat and clean, I’m surethey will do their part of it.”
4.5. Test-Retest Reliability
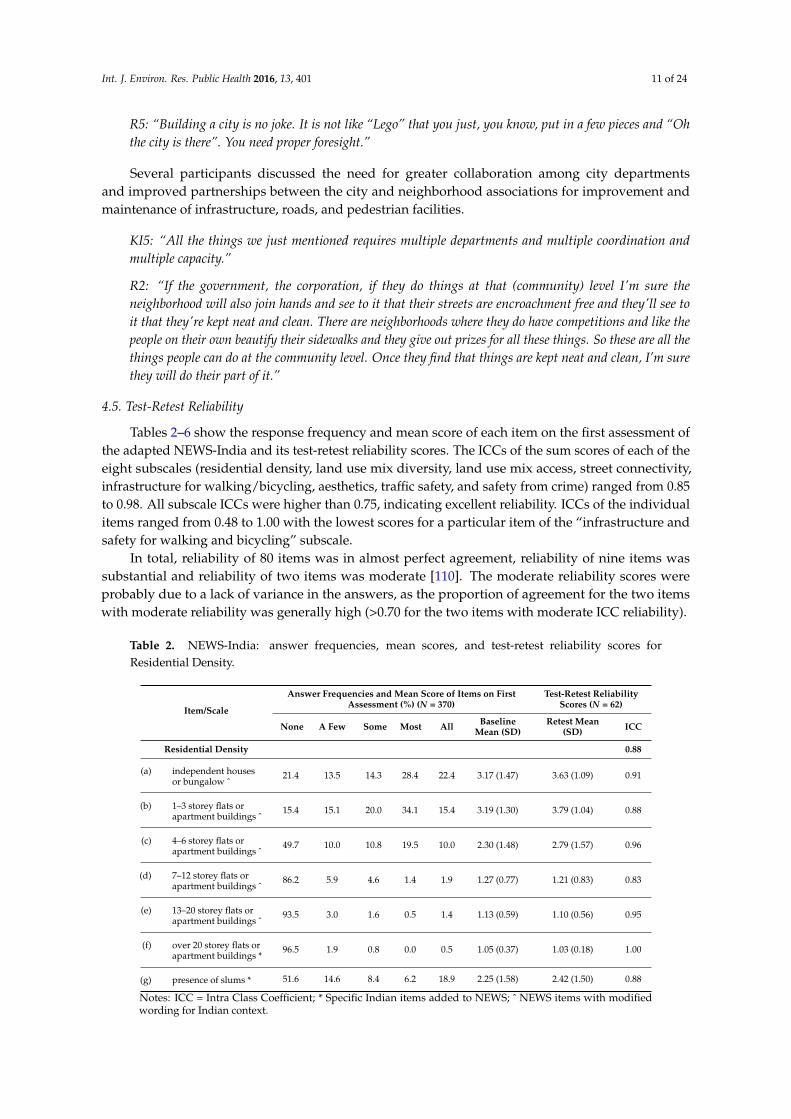
Tables 2–6 show the response frequency and mean score of each item on the first assessment ofthe adapted NEWS-India and its test-retest reliability scores. The ICCs of the sum scores of each of theeight subscales (residential density, land use mix diversity, land use mix access, street connectivity,infrastructure for walking/bicycling, aesthetics, traffic safety, and safety from crime) ranged from 0.85to 0.98. All subscale ICCs were higher than 0.75, indicating excellent reliability. ICCs of the individualitems ranged from 0.48 to 1.00 with the lowest scores for a particular item of the “infrastructure andsafety for walking and bicycling” subscale.
In total, reliability of 80 items was in almost perfect agreement, reliability of nine items wassubstantial and reliability of two items was moderate [110]. The moderate reliability scores wereprobably due to a lack of variance in the answers, as the proportion of agreement for the two itemswith moderate reliability was generally high (>0.70 for the two items with moderate ICC reliability).
Table 2. NEWS-India: answer frequencies, mean scores, and test-retest reliability scores forResidential Density.
Item/Scale
Answer Frequencies and Mean Score of Items on FirstAssessment (%) (N = 370)
Test-Retest ReliabilityScores (N = 62)
None A Few Some Most All BaselineMean (SD)
Retest Mean(SD) ICC
Residential Density 0.88
(a) independent housesor bungalow ˆ
21.4 13.5 14.3 28.4 22.4 3.17 (1.47) 3.63 (1.09) 0.91
(b) 1–3 storey flats orapartment buildings ˆ
15.4 15.1 20.0 34.1 15.4 3.19 (1.30) 3.79 (1.04) 0.88
(c) 4–6 storey flats orapartment buildings ˆ
49.7 10.0 10.8 19.5 10.0 2.30 (1.48) 2.79 (1.57) 0.96
(d) 7–12 storey flats orapartment buildings ˆ
86.2 5.9 4.6 1.4 1.9 1.27 (0.77) 1.21 (0.83) 0.83
(e) 13–20 storey flats orapartment buildings ˆ
93.5 3.0 1.6 0.5 1.4 1.13 (0.59) 1.10 (0.56) 0.95
(f) over 20 storey flats orapartment buildings *
96.5 1.9 0.8 0.0 0.5 1.05 (0.37) 1.03 (0.18) 1.00
(g) presence of slums * 51.6 14.6 8.4 6.2 18.9 2.25 (1.58) 2.42 (1.50) 0.88
Notes: ICC = Intra Class Coefficient; * Specific Indian items added to NEWS; ˆ NEWS items with modifiedwording for Indian context.

Int. J. Environ. Res. Public Health 2016, 13, 401 12 of 24
Table 3. NEWS-India: answer frequencies, mean scores, and test-retest reliability scores for Land UseMix-Diversity.
Item/Scale Answer Frequencies and Mean Score of Items on FirstAssessment (%) (N = 370)
Test-Retest ReliabilityScores (N = 62)
1–5min
6–10min
11–20min
21–30min
ě31min
BaselineMean (SD)
RetestMean (SD) ICC
Distance to facilities(Land Use Mix-Diversity) 0.96
(a) Provision store ˆ 3.5 4.6 11.4 25.9 54.6 4.24 (1.05) 4.53 (0.65) 0.78
(b) Supermarket 24.3 7.6 10.8 28.4 28.9 3.30 (1.55) 3.82 (1.34) 0.97
(c) Government ration shop * 27.6 11.9 15.7 25.7 19.2 2.97 (1.50) 1.97 (1.31) 0.93
(d) Milk booth * 21.1 3.5 10.3 26.5 38.6 3.58 (1.54) 4.26 (1.06) 0.95
(e) Fruit or vegetable market 21.6 7.6 10.8 29.2 30.8 3.40 (1.52) 4.02 (1.24) 0.95
(f) Meat or fish market * 19.2 12.2 22.2 29.7 16.8 3.13 (1.36) 3.35 (1.32) 0.95
(g) Street food vendors/food stalls * 20.0 9.5 14.1 34.9 21.6 3.29 (1.43) 3.56 (1.29) 0.95
(h) Food canteen * 50.3 15.7 14.6 13.8 5.7 2.09 (1.31) 1.89 (1.15) 0.97
(i) Fast-food restaurant 27.0 13.2 11.1 36.8 11.9 2.93 (1.43) 3.27 (1.39) 0.99
(j) Coffee shop ˆ 15.1 4.9 11.4 46.8 21.9 3.55 (1.30) 3.52 (1.25) 0.90
(k) Non-fast food restaurant 33.8 16.2 14.6 25.7 9.7 2.61 (1.42) 2.52 (1.43) 0.92
(l) Street vendors * 40.5 15.1 16.8 20.5 7.0 2.38 (1.37) 2.39 (1.25) 0.93
(m) Shops and stores ˆ 28.6 17.0 20.8 24.3 9.2 2.68 (1.35) 2.52 (1.35) 0.94
(n) Hardware or building material store ˆ 25.7 14.3 20.8 32.7 6.5 2.80 (1.31) 1.84 (1.28) 0.86
(o) Telephone booth * 24.3 3.0 6.8 39.5 26.5 3.41 (1.52) 3.81 (1.16) 0.77
(p) Printing/Xerox shop * 14.9 7.8 9.2 41.6 26.5 3.57 (1.35) 3.94 (0.96) 0.81
(q) Dry cleaner/ironing ˆ 17.6 5.4 8.4 38.1 30.5 3.59 (1.42) 4.05 (1.02) 0.89
(r) Tailor, cobbler * 19.7 14.1 15.1 33.2 17.8 3.15 (1.40) 3.15 (1.46) 0.90
(s) Post office 41.1 11.4 17.0 25.1 5.4 2.42 (1.38) 2.56 (1.36) 0.95
(t) Library 53.8 12.4 16.8 15.7 1.4 1.98 (1.21) 2.31 (1.26) 0.91
(u) School 20.8 10.0 21.1 39.7 8.4 3.05 (1.29) 3.32 (1.16) 0.84
(v) College or university ˆ 62.2 19.2 10.3 6.2 2.2 1.67 (1.03) 1.84 (1.09) 0.97
(w) Book store 39.7 14.6 17.6 25.9 2.2 2.36 (1.30) 2.60 (1.29) 0.92
(x) Bank or cooperative bank ˆ 28.9 9.5 11.4 45.1 5.1 2.88 (1.38) 3.45 (1.04) 0.93
(y) Shopping mall * 65.9 14.1 10.8 6.5 2.7 1.66 (1.08) 1.66 (1.07) 0.99
(z) Movie theater or multiplex * 69.2 14.9 8.4 5.1 2.4 1.57 (1.01) 1.52 (0.92) 0.97
(aa) Video/music CD storeˆ 56.2 16.5 15.7 9.2 2.4 1.85 (1.13) 1.73 (1.09) 0.95
(bb) Pharmacy or medicine shop ˆ 11.9 10.5 13.2 54.1 10.3 3.40 (1.17) 3.77 (0.88) 0.81
(cc) Salon ˆ 23.2 13.2 12.4 42.2 8.9 3.00 (1.36) 3.19 (1.19) 0.79
(dd) Your job or school 61.4 8.9 7.0 19.7 3.0 1.94 (1.32) 2.21 (1.45) 0.93
(ee) Bus stop or railway station 20.3 6.5 13.0 45.4 14.9 3.28 (1.36) 3.76 (1.10) 0.88
(ff) Taxi or auto rickshaw stand * 14.1 7.3 12.7 49.7 16.2 3.47 (1.25) 3.79 (1.07) 0.90
(gg) Mechanic or repair shop * 16.8 14.9 24.3 34.3 9.7 3.05 (1.25) 3.32 (1.05) 0.85
(hh) Park or green space ˆ 42.7 7.0 14.6 27.0 8.6 2.52 (1.47) 2.66 (1.49) 0.99
(ii) Playground * 42.4 7.6 14.1 28.9 7.0 2.51 (1.45) 2.94 (1.45) 0.96
(jj) Open field/school field * 39.2 10.5 17.6 26.5 6.2 2.50 (1.39) 2.92 (1.37) 0.94
(kk) Club or recreation center ˆ 48.9 4.9 12.4 29.7 4.1 2.35 (1.43) 2.95 (1.31) 0.95
(ll) Gym or fitness facility 35.4 8.9 15.9 33.2 6.5 2.66 (1.41) 3.24 (1.22) 0.98
(mm) Private clinic/hospital * 23.8 16.8 16.8 37.6 5.1 2.84 (1.30) 3.31 (1.08) 0.97
(nn) Government hospital * 42.2 15.1 13.2 28.1 1.4 2.31 (1.31) 2.61 (1.21) .94
(oo) Tap, well/common water source * 68.9 8.4 4.1 12.2 6.5 1.79 (1.33) 1.71 (1.31) 0.90
(pp) Place of worship * 14.6 12.2 18.6 45.9 8.6 3.22 (1.21) 3.50 (0.92) 0.91
(qq) Beach * 81.9 10.0 1.9 3.0 3.2 1.36 (0.92) 1.42 (0.97) 0.96
Notes: ICC = Intra Class Coefficient; * Specific Indian items added to NEWS; ˆ NEWS items with modifiedwording for Indian context.

Int. J. Environ. Res. Public Health 2016, 13, 401 13 of 24
Table 4. NEWS-India: answer frequencies, mean scores, and test-retest reliability scores for Land UseMix-Access, Street Connectivity, and Infrastructure and Safety for Walking/Bicycling.
Item/Scale Answer Frequencies and Mean Score of Items on FirstAssessment (%) (N = 370)
Test-Retest ReliabilityScores (N = 62)
StronglyDisagree
SomewhatDisagree
SomewhatAgree
StronglyAgree
BaselineMean (SD)
RetestMean (SD) ICC
Land Use Mix-Access 0.98
(a) possible to do shopping atlocal stores
13.2 11.1 28.1 47.6 3.10 (1.05) 3.39 (0.88) 0.95
(b) shops within easy walkingdistance
11.4 5.7 27.6 55.4 3.27 (0.99) 3.40 (0.84) 0.97
(c) many places in walkingdistance of home
15.9 10.5 25.9 47.6 3.05 (1.10) 3.10 (1.13) 0.99
(d) easy to walk to transit stop 13.5 6.8 31.6 48.1 3.14 (1.04) 3.29 (0.89) 0.91
Street Connectivity 0.85
(a) distance between roadjunctions is short
18.1 10.3 38.1 33.5 2.87 (1.07) 3.45 (0.72) 0.83
(b) many four-way roadjunctions
13.8 8.6 40.3 37.3 3.01 (1.01) 3.45 (0.74) 0.79
(c) many alternative routes 10.8 7.3 50.0 31.9 3.03 (0.91) 3.11 (0.73) 0.89
Infrastructure and Safety forWalking/Bicycling 0.97
(a) footpaths/pavements onmost streets ˆ
43.8 10.3 19.2 26.8 2.29 (1.27) 2.48 (1.36) 1.00
(b) footpaths/pavementswell-maintained ˆ
58.8 10.8 17.3 13.0 1.85 (1.12) 1.48 (0.95) 0.95
(c) bicycle or pedestrianpathways are easy to get to
75.9 10.8 10.0 3.2 1.41 (0.80) 1.19 (0.54) 1.00
(d) footpaths separated fromroad by parked cars,motorcycles, orauto-rickshaws ˆ
56.2 9.7 25.1 8.9 1.87 (1.08) 2.08 (1.06) 0.70
(e) footpaths separated bygrass/dirt strip
74.6 12.4 7.6 5.4 1.44 (0.85) 1.13 (0.38) 1.00
(f) safe to ride a bicycle 64.6 8.6 17.8 8.9 1.71 (1.05) 1.42 (0.82) 0.93
(g) streets well-lit at night 17.6 6.8 28.1 47.6 3.06 (1.12) 3.21 (1.04) 0.96
(h) walkers and bicyclistseasily seen by peoplein homes
16.2 9.5 54.1 20.3 2.78 (0.95) 2.97 (0.72) 0.88
(i) zebra crossings present ˆ 66.2 7.0 17.0 9.7 1.70 (1.07) 1.39 (0.86) 0.98
(j) zebra crossingspromote safety ˆ
64.9 7.3 17.8 10.0 1.73 (1.08) 1.37 (0.87) 0.93
(k) footpaths not obstructed * 60.3 11.6 13.5 14.6 1.82 (1.14) 1.48 (1.02) 0.99
(l) facilities to bicycle (lanes,etc.) available *
80.0 8.4 8.4 3.2 1.35 (0.77) 1.11 (0.45) 0.48
Notes: ICC = Intra Class Coefficient; * Specific Indian items added to NEW; ˆ NEWS items with modifiedwording for Indian context.
Int. J. Environ. Res. Public Health 2016, 13, 401 14 of 24
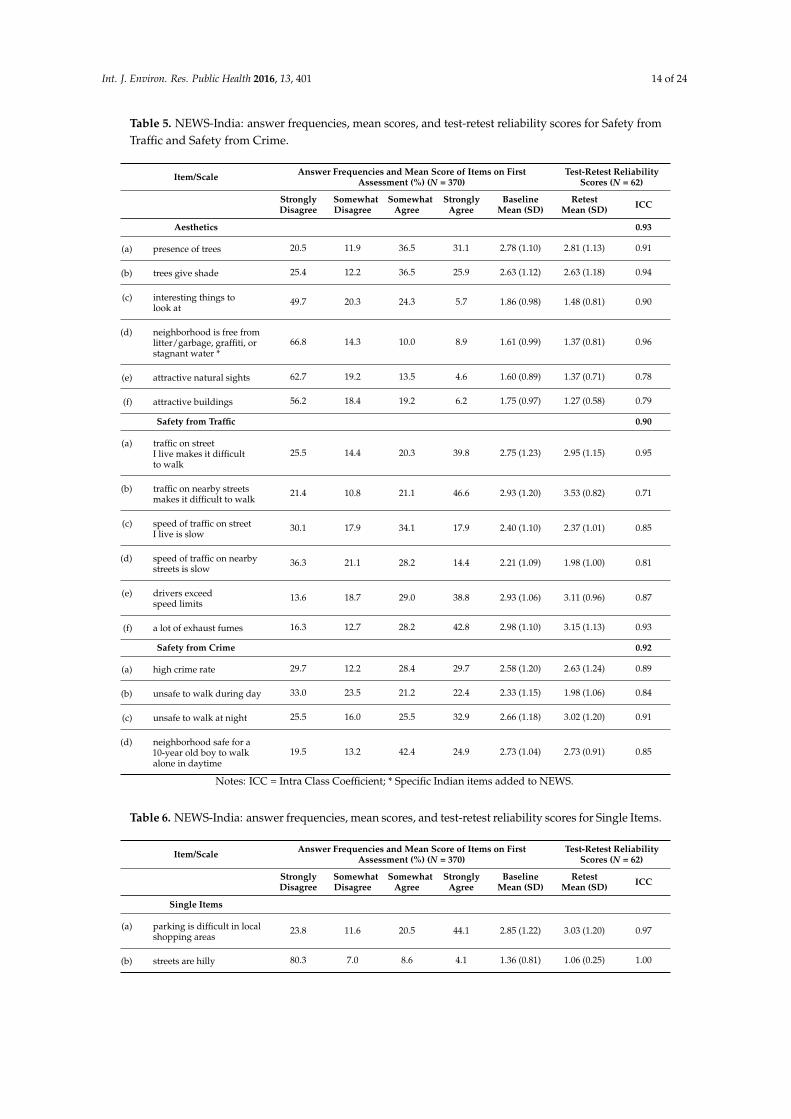
Table 5. NEWS-India: answer frequencies, mean scores, and test-retest reliability scores for Safety fromTraffic and Safety from Crime.
Item/Scale Answer Frequencies and Mean Score of Items on FirstAssessment (%) (N = 370)
Test-Retest ReliabilityScores (N = 62)
StronglyDisagree
SomewhatDisagree
SomewhatAgree
StronglyAgree
BaselineMean (SD)
RetestMean (SD) ICC
Aesthetics 0.93
(a) presence of trees 20.5 11.9 36.5 31.1 2.78 (1.10) 2.81 (1.13) 0.91
(b) trees give shade 25.4 12.2 36.5 25.9 2.63 (1.12) 2.63 (1.18) 0.94
(c) interesting things tolook at
49.7 20.3 24.3 5.7 1.86 (0.98) 1.48 (0.81) 0.90
(d) neighborhood is free fromlitter/garbage, graffiti, orstagnant water *
66.8 14.3 10.0 8.9 1.61 (0.99) 1.37 (0.81) 0.96
(e) attractive natural sights 62.7 19.2 13.5 4.6 1.60 (0.89) 1.37 (0.71) 0.78
(f) attractive buildings 56.2 18.4 19.2 6.2 1.75 (0.97) 1.27 (0.58) 0.79
Safety from Traffic 0.90
(a) traffic on streetI live makes it difficultto walk
25.5 14.4 20.3 39.8 2.75 (1.23) 2.95 (1.15) 0.95
(b) traffic on nearby streetsmakes it difficult to walk
21.4 10.8 21.1 46.6 2.93 (1.20) 3.53 (0.82) 0.71
(c) speed of traffic on streetI live is slow
30.1 17.9 34.1 17.9 2.40 (1.10) 2.37 (1.01) 0.85
(d) speed of traffic on nearbystreets is slow
36.3 21.1 28.2 14.4 2.21 (1.09) 1.98 (1.00) 0.81
(e) drivers exceedspeed limits
13.6 18.7 29.0 38.8 2.93 (1.06) 3.11 (0.96) 0.87
(f) a lot of exhaust fumes 16.3 12.7 28.2 42.8 2.98 (1.10) 3.15 (1.13) 0.93
Safety from Crime 0.92
(a) high crime rate 29.7 12.2 28.4 29.7 2.58 (1.20) 2.63 (1.24) 0.89
(b) unsafe to walk during day 33.0 23.5 21.2 22.4 2.33 (1.15) 1.98 (1.06) 0.84
(c) unsafe to walk at night 25.5 16.0 25.5 32.9 2.66 (1.18) 3.02 (1.20) 0.91
(d) neighborhood safe for a10-year old boy to walkalone in daytime
19.5 13.2 42.4 24.9 2.73 (1.04) 2.73 (0.91) 0.85
Notes: ICC = Intra Class Coefficient; * Specific Indian items added to NEWS.
Table 6. NEWS-India: answer frequencies, mean scores, and test-retest reliability scores for Single Items.
Item/Scale Answer Frequencies and Mean Score of Items on FirstAssessment (%) (N = 370)
Test-Retest ReliabilityScores (N = 62)
StronglyDisagree
SomewhatDisagree
SomewhatAgree
StronglyAgree
BaselineMean (SD)
RetestMean (SD) ICC
Single Items
(a) parking is difficult in localshopping areas
23.8 11.6 20.5 44.1 2.85 (1.22) 3.03 (1.20) 0.97
(b) streets are hilly 80.3 7.0 8.6 4.1 1.36 (0.81) 1.06 (0.25) 1.00
Int. J. Environ. Res. Public Health 2016, 13, 401 15 of 24
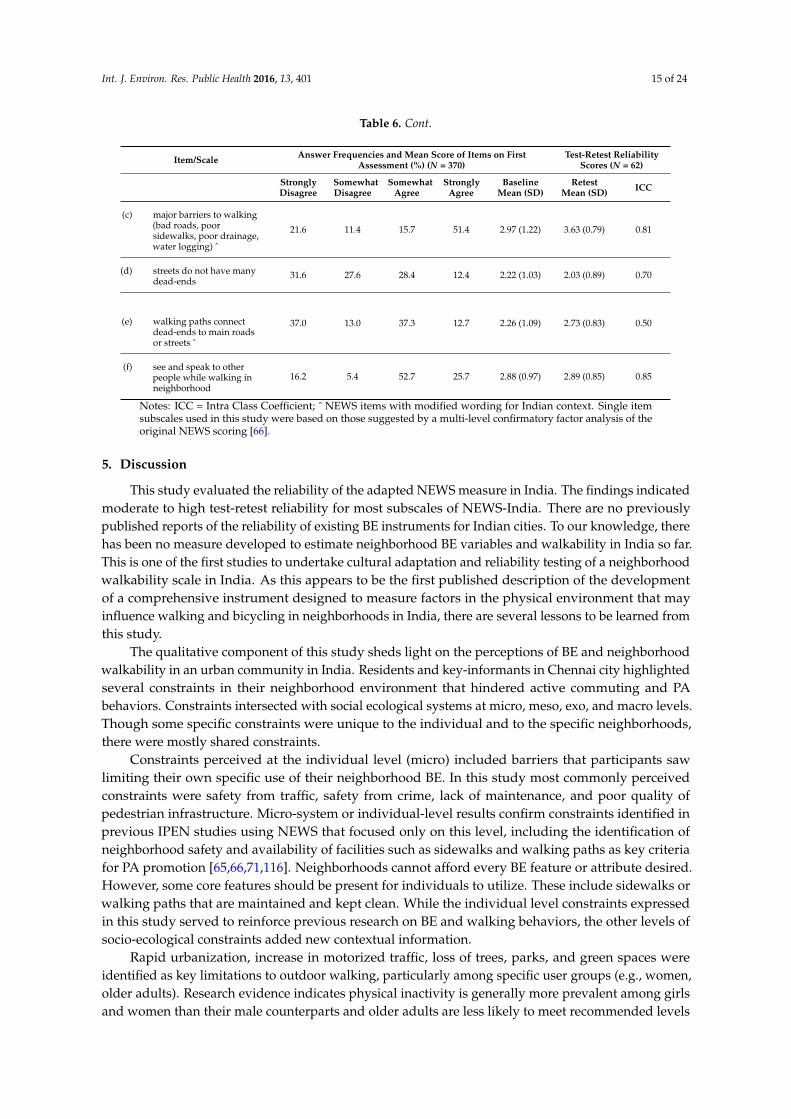
Table 6. Cont.
Item/Scale Answer Frequencies and Mean Score of Items on FirstAssessment (%) (N = 370)
Test-Retest ReliabilityScores (N = 62)
StronglyDisagree
SomewhatDisagree
SomewhatAgree
StronglyAgree
BaselineMean (SD)
RetestMean (SD) ICC
(c) major barriers to walking(bad roads, poorsidewalks, poor drainage,water logging) ˆ
21.6 11.4 15.7 51.4 2.97 (1.22) 3.63 (0.79) 0.81
(d) streets do not have manydead-ends
31.6 27.6 28.4 12.4 2.22 (1.03) 2.03 (0.89) 0.70
(e) walking paths connectdead-ends to main roadsor streets ˆ
37.0 13.0 37.3 12.7 2.26 (1.09) 2.73 (0.83) 0.50
(f) see and speak to otherpeople while walking inneighborhood
16.2 5.4 52.7 25.7 2.88 (0.97) 2.89 (0.85) 0.85
Notes: ICC = Intra Class Coefficient; ˆ NEWS items with modified wording for Indian context. Single itemsubscales used in this study were based on those suggested by a multi-level confirmatory factor analysis of theoriginal NEWS scoring [66].
5. Discussion
This study evaluated the reliability of the adapted NEWS measure in India. The findings indicatedmoderate to high test-retest reliability for most subscales of NEWS-India. There are no previouslypublished reports of the reliability of existing BE instruments for Indian cities. To our knowledge, therehas been no measure developed to estimate neighborhood BE variables and walkability in India so far.This is one of the first studies to undertake cultural adaptation and reliability testing of a neighborhoodwalkability scale in India. As this appears to be the first published description of the developmentof a comprehensive instrument designed to measure factors in the physical environment that mayinfluence walking and bicycling in neighborhoods in India, there are several lessons to be learned fromthis study.
The qualitative component of this study sheds light on the perceptions of BE and neighborhoodwalkability in an urban community in India. Residents and key-informants in Chennai city highlightedseveral constraints in their neighborhood environment that hindered active commuting and PAbehaviors. Constraints intersected with social ecological systems at micro, meso, exo, and macro levels.Though some specific constraints were unique to the individual and to the specific neighborhoods,there were mostly shared constraints.
Constraints perceived at the individual level (micro) included barriers that participants sawlimiting their own specific use of their neighborhood BE. In this study most commonly perceivedconstraints were safety from traffic, safety from crime, lack of maintenance, and poor quality ofpedestrian infrastructure. Micro-system or individual-level results confirm constraints identified inprevious IPEN studies using NEWS that focused only on this level, including the identification ofneighborhood safety and availability of facilities such as sidewalks and walking paths as key criteriafor PA promotion [65,66,71,116]. Neighborhoods cannot afford every BE feature or attribute desired.However, some core features should be present for individuals to utilize. These include sidewalks orwalking paths that are maintained and kept clean. While the individual level constraints expressedin this study served to reinforce previous research on BE and walking behaviors, the other levels ofsocio-ecological constraints added new contextual information.
Rapid urbanization, increase in motorized traffic, loss of trees, parks, and green spaces wereidentified as key limitations to outdoor walking, particularly among specific user groups (e.g., women,older adults). Research evidence indicates physical inactivity is generally more prevalent among girlsand women than their male counterparts and older adults are less likely to meet recommended levels

Int. J. Environ. Res. Public Health 2016, 13, 401 16 of 24
of PA [32,34,117–121]. Studies have also shown that women and older adults more frequently reportunsuitable environments as barriers to PA [119,121,122]. The perceived barriers faced by women arelikely to differ from those faced by other groups, such as by men [123]. Aging populations with mobilitydisabilities are likely more vulnerable to environmental constraints such as problems with narrowsidewalks, lack of curb ramps or street crossings, poor lighting, puddles, and poor drainage [31].This is consistent with findings from this study where women and older adults cited poor pedestrianinfrastructure as a deterrent to walking outdoors. Older adults were the most frequent users ofneighborhood parks in this study, which has also been observed in studies from LMICs [121,124,125].Older adults reported being unable to walk to the park due to lack of sidewalks and crosswalks.Studies have shown that public parks have an important role to play in facilitating PA [41,126]. Theyprovide places for individuals to walk or jog, and many have specific facilities for sports, exercise,and other vigorous activities [127]. In order to access these parks, pedestrian infrastructure linkingresidential streets to neighborhood parks and green spaces can play a key role in promoting safewalking routes for women and aging neighborhood residents [41].
In the exo-level system, factors such as feelings of social exclusion and lack of social connectednessindicated underlying disparities. The level of social cohesion is a key cultural component ofneighbourhoods that has the potential to reinforce existing health inequalities through shaping ofBE amenities such as differentiated access to greenspace between subgroups of the local population.Several studies have shown a positive relationship between local greenspace availability, health ofresidents, and social cohesion [128,129]. Neighborhoods play a role in supporting healthy behavior viasocial and physical BE features. Seaman and Jones (2010) demonstrated that the idea of walkabilityincludes perceptions of social cohesion at a community level and the level of felt integration andinclusion by individuals in their communities. Individual's feelings of integration and inclusion canpotentially mitigate the effects of experiential barriers in the neighbourhood BE, such as evidence ofanti-social behaviour and gender-based violence as mentioned by participants in this study. Improvingaccess to parks, green spaces for all in urban communities involves more than providing high qualityresources such as sidewalks, crosswalks, lighting, etc. Physical availability interacts with communitycontexts already established and a holistic understanding of BE barriers and facilitators to PA isrequired. Overall, findings from qualitative interviews underscored the importance of improving theneighborhood walkability in Chennai to promote PA engagement and active lifestyles.
The test-retest reliability scores of the items in NEWS-India (ICC = 0.48 to 0.99) were generallyhigh with almost perfect strength of agreement, indicating that the items are generally reliable. Thevalues reported for the NEWS subscales in the present Indian study are comparable to those reportedfor the original version in the USA (ICC = 0.58 to 0.80) [70], the Australian version (ICC = 0.62 to0.88) [130], the Chinese translation of the abbreviated version (ICC = 0.57 to 0.99) [116], and the Africanversion (ICC = 0.59 to 0.91) [65].
While the overall strength of agreement across items was high, some items assessing subjectivequalities of the BE such as general levels of attractiveness (e.g., attractive natural sights, attractivebuildings) and difficulty for PA (e.g., traffic makes it difficult to walk) had lower ICC’s in the substantialagreement range. This could be due to participants experiencing difficulty in subjectively assessingthe items measuring attractiveness and difficulty for PA. Since these items were based entirely onsubjective overall impressions, it could be expected that the scores for them would vary based on theparticipant’s previous experiences of walking and cycling. It is possible that these NEWS items thatpertain to aesthetics and pleasantness of the environments are ubiquitously unstable, regardless ofdevelopmental pattern and differences across sampled neighborhoods. Perhaps there are ambiguitiesin what contributes to an attractive or pleasant environment, as well as their qualities, which contributeto lower reliability of these items.
Only two items—presence of bicycling facilities and walking paths connecting dead-endstreets—had low ICCs (0.48, 0.50) indicating moderate agreement. These may be because theseitems were assessing rare BE features that did not exist in the study area. Reliability studies from

Int. J. Environ. Res. Public Health 2016, 13, 401 17 of 24
LMICs such as Hong Kong [71,131], Brazil [74], and Nigeria [65] have also demonstrated moderateagreement of ICCs for the same items assessing pedestrian and bicycling infrastructure since they arenot common features of neighborhoods in those countries. Although the uncommon items may beomitted when using the adapted NEWS in India, it is recommended to retain these items as part ofthe Indian version because items like bicycling facilities can become indicators of progress that wouldbe difficult to measure in future if these items were deleted. Retaining these items is also essentialfor comparing these attributes across countries. The little variability observed in the responses tothese items from this sample likely accounted for the low reliability for the items. Nevertheless, themajority of the items on the Indian version of NEWS, including newly developed items, demonstratedmoderate to almost perfect agreement in reliability coefficients, comparable to those found in otherstudies [70,73,116,130,132].
While these results indicate that the items in the NEWS-India instrument are generally reliable,this study has some limitations. First, conducting the study among residents of four neighborhoodtypes from only one city in India may restrict environmental variability. Restricted variability couldunderestimate the strengths of BE-PA associations in environmental studies [35,133]. There waslimited variation among the neighborhood quadrants assessed and the number of participants thatwere assessed for test-retest reliability. Second, the modest sample size and the non-probability natureof the sample may reduce generalizability of findings. While 62 observations were collected to assesstest-retest reliability, participants belonged to four neighborhood quadrants pre-stratified based onincome and walkability. This points to the need for care in extrapolating the reliability results beyondthe study area and the need for reliability studies to be repeated when an audit instrument is used inother urban environments. A larger number of neighborhood quadrants would have allowed moreprecise estimation of reliability. Therefore, the test-retest reliability of the NEWS-India instrumentshould be investigated further across India.
A notable strength of this study was the recruitment of participants from four distinctneighborhood types, enhancing heterogeneity in socio-demographics, BE characteristics, andneighborhood walkability [134]. Another strength was the systematic adaptation of the NEWS,retaining most of the original items to allow for international comparison while tailoring the measureto reflect India-specific conditions. NEWS-India was developed through regional and internationalcollaborations similar to those used for the NEWS questionnaire that was tailored to other LMICs suchas Hong Kong [116], China [71], Brazil [74], Africa [65], and it was based on empirical evidence andtest-retest reliability analysis with existing NEWS measures [65,70,74,77]. The present study supportsthe feasibility of using NEWS-India for assessing BE correlates of PA in India and can provide leadsand guidance to researchers and practitioners in other Asian LMICs when evaluating the BE forhealth behaviors.
Overall, results indicate that NEWS-India was generally a reliable and practical instrument forcollecting data and that participants found it easy to use. Findings such as these have internationalimplications for utility and robustness of NEWS measures. This is important for identifying promisingBE variables that could be policy targets or improving PA and controlling obesity worldwide. Useof adapted versions of the NEWS may be particularly important for research in LMICs that do nothave geographic information systems databases or advanced technologies (e.g., global positioningsystems or GPS, accelerometer data) that would allow objective measures of BE attributes and PA.While this instrument provides a method of collecting environmental data, it remains important toexplore BE attributes that are key correlates of PA and whether these relationships are consistent acrossdemographic groups, settings, and locations across India.
A major goal of IPEN is to represent the worldwide variation in BE, and conducting this studyin an understudied LMIC like India adds to the international literature on the relevance of BE forpromoting PA. The present study was the first to report on the psychometric properties of the NEWS inIndia, and suggests the need to create a version of NEWS that can be used within different populationsand settings across India.

Int. J. Environ. Res. Public Health 2016, 13, 401 18 of 24
6. Conclusions
This study showed that NEWS-India has acceptable evidence of reliability. The development ofculturally applicable NEWS measures for India is a necessary first step for supporting evidence-basedinterventions against the epidemics of inactivity-related NCDs. This study is first-generation researchin India and has the potential to guide understanding of BE correlates of PA. Further adaptation,evaluation, and application of NEWS-India in other Indian states could lead to evidence-basedrecommendations for creating communities that are designed to make people more comfortablebeing physically active in India. Subscales of NEWS-India are related to constructs used in urbanplanning and transportation, findings based on these subscales can inform policies and interventionsthat may improve walkability and PA friendliness of a neighborhood. This is particularly importantfor physical activity and health promotion in India because chronic disease rates are rising in theregion [7,9,135]. Understanding neighborhood BE correlates of PA is a priority that could lead to betterstrategies to prevent further declines in PA and promote PA among those physically inactive.
Acknowledgments: Deepti Adlakha was funded by the International Field Dissertation Research Award at theBrown School, Washington University in St. Louis. The authors would like to thank James F. Sallis, Rodrigo S. Reis,and members of the IPEN Coordinating Center at University of California, San Diego, for their assistance withstudy protocols and adaptation of NEWS-India. The authors wish to acknowledge the following research assistants’support in translation and data collection: Priyadarshini Chidambaram, Avinash Ramu, S. Gayathri, R. Dhivya,Gomathi Srinivasan, V. Sridevi, and K. Shanthi.
Author Contributions: Deepti Adlakha conceived and designed the study; Deepti Adlakha created studyprotocols; J. Aaron Hipp and Ross C. Brownson reviewed study methods and protocols; Deepti Adlakhaconducted the study and supervised research assistants in the field for data collection; Deepti Adlakhaconducted statistical data analysis; J. Aaron Hipp and Ross C. Brownson supervised statistical analysis statistical;Deepti Adlakha, J. Aaron Hipp, Ross C. Brownson interpreted the results; Deepti Adlakha wrote the manuscript;J. Aaron Hipp and Ross C. Brownson reviewed and edited the manuscript.
Conflicts of Interest: The authors declare no conflict of interest. The funding sponsors had no role in the designof the study, in the collection, analyses, or interpretation of data, in the writing of the manuscript, and in thedecision to publish the results. The content is solely the responsibility of the authors and does not necessarilyrepresent the official views of Washington University in St. Louis.
References
1. Ebrahim, S.; Pearce, N.; Smeeth, L.; Casas, J.P.; Jaffar, S.; Piot, P. Tackling non-communicable diseases inlow- and middle-income countries: Is the evidence from high-income countries all we need? PLoS Med.2013, 10, e1001377. [CrossRef] [PubMed]
2. Islam, S.M.S.; Purnat, T.D.; Phuong, N.T.A.; Mwingira, U.; Schacht, K.; Fröschl, G. Non-communicablediseases (NCDs) in developing countries: A symposium report. Glob. Health 2014, 10. [CrossRef] [PubMed]
3. Terzic, A.; Waldman, S. Chronic diseases: The emerging pandemic. Clin. Transl. Sci. 2011, 4, 225–226.[CrossRef] [PubMed]
4. Mathers, C.D.; Loncar, D. Projections of global mortality and burden of disease from 2002 to 2030. PLoS Med.2006, 3, e442. [CrossRef] [PubMed]
5. Beaglehole, R.; Yach, D. Globalisation and the prevention and control of non-communicable disease:The neglected chronic diseases of adults. Lancet 2003, 362, 903–908. [CrossRef]
6. Upadhyay, R.P. An overview of the burden of non-communicable diseases in India. Iran. J. Public Health2012, 41, 1–8. [PubMed]
7. Bloom, D.E.; Cafiero-Fonseca, E.T.; Candeias, V.; Adashi, E.; Bloom, L.; Gurfein, L.; Jané-Llopis, E.; Lubet, A.;Mitgang, E.; Carroll O’Brien, J.; et al. Economics of Non-Communicable Diseases in India: The Costs and Returnson Investment of Interventions to Promote Healthy Living and Prevent, Treat, and Manage NCDs; World EconomicForum; Harvard School of Public Health: Geneva, Switzerland, 2014.
8. Joshi, R.; Cardona, M.; Iyengar, S.; Sukumar, A.; Raju, C.R.; Raju, K.R.; Raju, K.; Reddy, K.S.; Lopez, A.;Neal, B. Chronic diseases now a leading cause of death in rural India—Mortality data from the AndhraPradesh rural health initiative. Int. J. Epidemiol. 2006, 35, 1522–1529. [CrossRef] [PubMed]
9. Patel, V.; Chatterji, S.; Chisholm, D.; Ebrahim, S.; Gopalakrishna, G.; Mathers, C.; Mohan, V.; Prabhakaran, D.;Ravindran, R.D.; Reddy, K.S. Chronic diseases and injuries in india. Lancet 2011, 377, 413–428. [CrossRef]
Int. J. Environ. Res. Public Health 2016, 13, 401 19 of 24
10. International Diabetes Federation. Diabetes; International Working Group on the Diabetic Foot: Brussels,Belgium, 2009; p. 5.
11. Kumar, A.; Goel, M.K.; Jain, R.B.; Khanna, P.; Chaudhary, V. India towards diabetes control: Key issues.Australas. Med. J. 2013, 6, 524–531. [CrossRef] [PubMed]
12. Joshi, S.R.; Parikh, R.M. India—Diabetes capital of the world: Now heading towards hypertension. J. Assoc.Phys. India 2007, 55, 323–324.
13. World Health Organization. Global Status Report on Noncommunicable Diseases 2010; World HealthOrganization: Geneva, Switzerland, 2011; pp. 1–161.
14. Jonas, J.B.; Panda-Jonas, S.; Nangia, V.; Joshi, P.P.; Matin, A. Diabetes mellitus in rural india. Epidemiology2010, 21, 754–755. [CrossRef] [PubMed]
15. Mohan, V.; Pradeepa, R. Mortality in diabetes mellitus: Revisiting the data from a developing region of theworld. Postgrad. Med. J. 2009, 85, 225–226. [CrossRef] [PubMed]
16. Pradeepa, R.; Mohan, V. The changing scenario of the diabetes epidemic: Implications for india. Indian J.Med. Res. 2002, 116, 121–132. [PubMed]
17. World Health Organization. Global Burden of Disease Study 2010 (GBD 2010); WHO: Geneva, Switzerland,2012.
18. Pearson, T.A. Cardiovascular disease in developing countries: Myths, realities, and opportunities.Cardiovasc. Drugs Ther. 1999, 13, 95–104. [CrossRef] [PubMed]
19. Pearson, T.A. Cardiovascular diseases as a growing health problem in developing countries: The role ofnutrition in the epidemiologic transition. Public Health Rev. 1996, 24, 131–146. [PubMed]
20. Woodcock, J.; Banister, D.; Edwards, P.; Prentice, A.M.; Roberts, I. Energy and transport. Lancet 2007, 370,1078–1088. [CrossRef]
21. Hallal, P.C.; Andersen, L.B.; Bull, F.C.; Guthold, R.; Haskell, W.; Ekelund, U. Global physical activity levels:Surveillance progress, pitfalls, and prospects. Lancet 2012, 380, 247–257. [CrossRef]
22. Adlakha, D.; Hipp, A.J.; Marx, C.; Yang, L.; Tabak, R.; Dodson, E.A.; Brownson, R.C. Home and workplacebuilt environment supports for physical activity. Am. J. Prev. Med. 2014, 48, 104–107. [CrossRef] [PubMed]
23. Guthold, R.; Ono, T.; Strong, K.L.; Chatterji, S.; Morabia, A. Worldwide variability in physical inactivity a51-country survey. Am. J. Prev. Med. 2008, 34, 486–494. [CrossRef] [PubMed]
24. Jones, A.C.; Geneau, R. Assessing research activity on priority interventions for non-communicable diseaseprevention in low- and middle-income countries: A bibliometric analysis. Glob. Health Act. 2012, 5.[CrossRef] [PubMed]
25. Milton, K.; Macniven, R.; Bauman, A. Review of the epidemiological evidence for physical activity andhealth from low- and middle-income countries. Glob. Public Health 2014, 9, 369–381. [CrossRef] [PubMed]
26. World Health Organization. Obesity: Preventing and Managing the Global Epidemic. Who Technical Report Series894 2000; World Health Organization: Geneva, Switzerland, 2000.
27. United Nations Organization. The Millennium Development Goals Report; United Nations Organization:Geneva, Switzerland, 2011.
28. Beaglehole, R.; Bonita, R.; Horton, R.; Adams, C.; Alleyne, G.; Asaria, P.; Baugh, V.; Bekedam, H.; Billo, N.;Casswell, S.; et al. Priority actions for the non-communicable disease crisis. Lancet 2011, 377, 1438–1447.[CrossRef]
29. Heath, G.W.; Brownson, R.C.; Kruger, J.; Miles, R.; Powell, K.E.; Ramsey, L.T. Task force on communitypreventive services. The effectiveness of urban design and land use and transport policies and practices toincrease physical activity: A systematic review. J. Phys. Act. Health 2006, 3, S55–S76.
30. Saelens, B.E.; Handy, S. Built environment correlates of walking: A review. Med. Sci. Sports Exerc. 2008, 40,S550–S566. [CrossRef] [PubMed]
31. Rosenberg, D.E.; Huang, D.L.; Simonovich, S.D.; Belza, B. Outdoor built environment barriers and facilitatorsto activity among midlife and older adults with mobility disabilities. Gerontologist 2013, 53, 268–279.[CrossRef] [PubMed]
32. Hagströmer, M.; Oja, P.; Sjöström, M. Physical activity and inactivity in an adult population assessed byaccelerometry. Med. Sci. Sports Exerc. 2007, 39, 1502–1508. [CrossRef] [PubMed]
33. Sallis, J. Environmental and policy research on physical activity is going global. Res. Exerc. Epidemiol. 2011,13, 111–117.

Int. J. Environ. Res. Public Health 2016, 13, 401 20 of 24
34. Azevedo, M.R.; Araújo, C.L.P.; Reichert, F.F.; Siqueira, F.V.; da Silva, M.C.; Hallal, P.C. Gender differences inleisure-time physical activity. Int. J. Public Health 2007, 52, 8–15. [CrossRef] [PubMed]
35. Sallis, J.F.; Bowles, H.R.; Bauman, A.; Ainsworth, B.E.; Bull, F.C.; Craig, C.L.; Sjostrom, M.;De Bourdeaudhuij, I.; Lefevre, J.; Matsudo, V.; et al. Neighborhood environments and physical activityamong adults in 11 countries. Am. J. Prev. Med. 2009, 36, 484–490. [CrossRef] [PubMed]
36. Sallis, J.F.; Owen, N.; Fisher, E.B. Ecological models of health behavior. In Health Behavior and HealthEducation: Theory, Research and Practice; Fourth, E.D., Glanz, K., Rimer, B.K., Viswanath, K., Eds.; Jossey-Bass:San Francisco, CA, USA, 2008; pp. 464–485.
37. Saelens, B.E.; Sallis, J.F.; Frank, L.D. Environmental correlates of walking and cycling: Findings from thetransportation, urban design and planning literatures. Ann. Behav. Med. 2003, 25, 80–91. [CrossRef][PubMed]
38. Papas, M.A.; Alberg, A.J.; Ewing, R.; Helzlsouer, K.J.; Gary, T.L.; Klassen, A.C. The built environment andobesity. Epidemiol. Rev. 2007, 29, 129–143. [CrossRef] [PubMed]
39. Sallis, J.F.; Glanz, K. The role of built environments in physical activity, eating, and obesity in childhood.Future Child 2006, 16, 89–108. [CrossRef] [PubMed]
40. Hipp, J.A.; Adlakha, D.; Eyler, A.A.; Chang, B.; Pless, R. Emerging technologies: Webcams andcrowd-sourcing to identify active transportation. Am. J. Prev. Med. 2013, 44, 96–97. [CrossRef] [PubMed]
41. Adlakha, D.; Budd, E.L.; Gernes, R.; Sequeira, S.; Hipp, J.A. Use of emerging technologies to assess differencesin outdoor physical activity in St. Louis, Missouri. Front. Public Health 2014, 2. [CrossRef] [PubMed]
42. Brownson, R.C.; Hoehner, C.M.; Day, K.; Forsyth, A.; Sallis, J.F. Measuring the built environment for physicalactivity: State of the science. Am. J. Prev. Med. 2009, 36, S99–S123. [CrossRef] [PubMed]
43. Brownson, R.C.; Haire-Joshu, D.; Luke, D.A. Shaping the context of health: A review of environmental andpolicy approaches in the prevention of chronic diseases. Ann. Rev. Public Health 2006, 27, 341–370. [CrossRef][PubMed]
44. Committee on Physical Activity, Health; Transportation and Land Use. Does the Built Environment InfluencePhysical Activity? Examining the Evidence; Transportation Research Board, Institute of Medicine: Washington,DC, USA, 2005.
45. Kerr, J.; Emond, J.A.; Badland, H.; Reis, R.; Sarmiento, O.; Carlson, J.; Sallis, J.F.; Cerin, E.; Cain, K.; Conway, T.;et al. Perceived neighborhood environmental attributes associated with walking and cycling for transportamong adult residents of 17 cities in 12 countries: The IPEN study. Environ. Health Perspect. 2015. [CrossRef][PubMed]
46. Frank, L.D.; Engelke, P.O.; Schmid, T.L. Health and Community Design: The Impact of the Built Environment onPhysical Activity; Island Press: Washington, DC, USA, 2003.
47. Frank, L.D. Land use and transportation interaction: Implications on public health and quality of life. J. Plan.Educ. Res. 2000, 20, 6–22. [CrossRef]
48. Adams, M.A.; Ryan, S.; Kerr, J.; Sallis, J.F.; Patrick, K.; Frank, L.; Norman, G.L. Validation of the NeighborhoodEnvironment Walkability Scale (NEWS) Items using geographic information systems. J. Phys. Act. Health2009, 6, S113–S123.
49. Bassett, D.R., Jr.; Pucher, J.; Buehler, R.; Thompson, D.L.; Crouter, S.E. Walking, cycling, and obesity rates inEurope, north America, and Australia. J. Phys. Act. Health 2008, 5, 795–814. [PubMed]
50. Bauman, A.E.; Reis, R.S.; Sallis, J.F.; Wells, J.C.; Loos, R.J.F.; Martin, B.W. Correlates of physical activity: Whyare some people physically active and others not? Lancet 2013, 380, 258–271. [CrossRef]
51. Becerra, J.M.; Reis, R.S.; Frank, L.D.; Ramirez-Marrero, F.A.; Welle, B.; Arriaga Cordero, E.; MendezPaz, F.; Crespo, C.; Dujon, V.; Jacoby, E.; et al. Transport and health: A look at three latin americancities. Cad. Saúde Públ. 2013, 29, 654–666. [CrossRef]
52. Prentice, A.M. The emerging epidemic of obesity in developing countries. Int. J. Epidemiol. 2006, 35, 93–99.[CrossRef] [PubMed]
53. McMichael, A.J. The urban environment and health in a world of increasing globalization: Issues fordeveloping countries. Bull. World Health Organ. 2000, 78, 1117–1126. [PubMed]
54. Olabarria, M.; Pérez, K.; Santamariña-Rubio, E.; Novoa, A.M. Daily mobility patterns of an urban populationand their relationship to overweight and obesity. Transp. Policy 2014, 32, 165–171. [CrossRef]
55. Swaminathan, S.; Selvam, S.; Thomas, T.; Kurpad, A.V.; Vaz, M. Longitudinal trends in physical activitypatterns in selected urban South Indian school children. Indian J. Med. Res. 2011, 134, 174–180. [PubMed]

Int. J. Environ. Res. Public Health 2016, 13, 401 21 of 24
56. Swaminathan, S.; Thomas, T.; Yusuf, S.; Vaz, M. Clustering of diet, physical activity and overweight inparents and offspring in South India. Eur. J. Clin. Nutr. 2013, 67, 128–134. [CrossRef] [PubMed]
57. Swaminathan, S.; Vaz, M. Childhood physical activity, sports and exercise and noncommunicable disease:A special focus on India. Indian J. Pediatr. 2013, 80, 63–70. [CrossRef] [PubMed]
58. Cutts, B.B.; Darby, K.J.; Boone, C.G.; Brewis, A. City structure, obesity, and environmental justice: Anintegrated analysis of physical and social barriers to walkable streets and park access. Soc. Sci. Med. 2009, 69,1314–1322. [CrossRef] [PubMed]
59. Jackson, R.J. The impact of the built environment on health: An emerging field. Am. J. Public Health 2003, 93,1382–1384. [CrossRef] [PubMed]
60. Lopez, R. Urban sprawl and risk for being overweight or obese. Am. J. Public Health 2004, 94, 1574–1579.[CrossRef] [PubMed]
61. Gasevic, D.; Vukmirovich, I.; Yusuf, S.; Teo, K.; Chow, C.; Dagenais, G.; Lear, S.A. A direct assessment of“obesogenic” built environments: Challenges and recommendations. J. Environ. Public Health 2011, 2011.[CrossRef] [PubMed]
62. Kirk, S.F.; Penney, T.L.; McHugh, T.L. Characterizing the obesogenic environment: The state of the evidencewith directions for future research. Obes. Rev. 2010, 11, 109–117. [CrossRef] [PubMed]
63. Swinburn, B.; Egger, G.; Raza, F. Dissecting obesogenic environments: The development and application ofa framework for identifying and prioritizing environmental interventions for obesity. Prev. Med. 1999, 29,563–570. [CrossRef] [PubMed]
64. Wall, M.M.; Larson, N.I.; Forsyth, A.; Van Riper, D.C.; Graham, D.J.; Story, M.T.; Neumark-Sztainer, D.Patterns of obesogenic neighborhood features and adolescent weight: A comparison of statistical approaches.Am. J. Prev. Med. 2012, 42, e65–e75. [CrossRef] [PubMed]
65. Oyeyemi, A.L.; Sallis, J.F.; Deforche, B.; Oyeyemi, A.Y.; De Bourdeaudhuij, I.; Van Dyck, D. Evaluation of theneighborhood environment walkability scale in Nigeria. Int. J. Health Geogr. 2013, 12. [CrossRef] [PubMed]
66. Cerin, E.; Saelens, B.E.; Sallis, J.F.; Frank, L.D. Neighborhood environment walkability scale: Validity anddevelopment of a short form. Med. Sci. Sports Exerc. 2006, 38, 1682–1691. [CrossRef] [PubMed]
67. Cerin, E.; Conway, T.L.; Saelens, B.E.; Frank, L.D.; Sallis, J.F. Cross-validation of the factorial structure of theneighborhood environment walkability scale (news) and its abbreviated form (news-a). Int. J. Behav. Nutr.Phys. Act. 2009, 6, 32. [CrossRef] [PubMed]
68. Cerin, E.; Conway, T.L.; Cain, K.L.; Kerr, J.; De Bourdeaudhuij, I.; Owen, N.; Reis, R.S.; Sarmiento, O.L.;Hinckson, E.A.; Salvo, D.; et al. Sharing good news across the world: Developing comparable scores across 12countries for the neighborhood environment walkability scale (news). BMC Public Health 2013, 13. [CrossRef][PubMed]
69. Saelens, B.E.; Sallis, J.F. Neighborhood Environment Walkability Scale (NEWS). Available online:http://sallis.ucsd.edu/measure_news.html (accessed on 1 April 2016).
70. Saelens, B.E.; Sallis, J.F.; Black, J.B.; Chen, D. Neighborhood-based differences in physical activity:An environment scale evaluation. Am. J. Public Health 2003, 93, 1552–1558. [CrossRef]
71. Cerin, E.; Sit, C.; Cheung, M.; Ho, S.; Lee, L.; Chan, W. Reliable and valid news for Chinese seniors: Measuringperceived neighborhood attributes related to walking. Int. J. Behav. Nutr. Phys. Act. 2010, 7, 84. [CrossRef][PubMed]
72. Inoue, S.; Ohya, Y.; Odagiri, Y.; Takamiya, T.; Ishii, K.; Kitabayashi, M.; Suijo, K.; Sallis, J.F.; Shimomitsu, T.Association between perceived neighborhood environment and walking among adults in 4 cities in Japan.J. Epidemiol. 2010, 20, 277–286. [CrossRef] [PubMed]
73. Oyeyemi, A.L.; Adegoke, B.O.; Oyeyemi, A.Y.; Fatudimu, B.M. Test-retest reliability of ipaqenvironmental-module in an african population. Int. J. Behav. Nutr. Phys. Act. 2008, 5. [CrossRef][PubMed]
74. De Matos Malavasi, L.; De Fátima da Silva Duarte, M.; Both, J.; Reis, R.S. Neighborhood walkability scale(news—Brazil): Back translation and reliability. Braz. J. Kinanthropom. Human Perform. 2007, 9, 339–350.
75. Venkat.acalapati, A.I.; Aravindan, R. Chennai Not Madras: Perspectives on the City; Marg Publications andNational Centre for the Performing Arts: Mumbai, India, 2006.
76. Hancock, M.E. The Politics of Heritage from Madras to Chennai; Indiana University Press: Bloomington,Indiana, 2008.
Int. J. Environ. Res. Public Health 2016, 13, 401 22 of 24
77. Sallis, J.F.; Kerr, J.; Carlson, J.A.; Norman, G.J.; Saelens, B.E.; Durant, N.; Ainsworth, B.E. Evaluating a briefself-report measure of neighborhood environments for physical activity research and surveillance: Physicalactivity neighborhood environment scale (panes). J. Phys. Act. Health 2010, 7, 533–540. [PubMed]
78. Parra, D.C.; Hoehner, C.M.; Hallal, P.C.; Ribeiro, I.C.; Reis, R.S.; Brownson, R.C.; Pratt, M.; Simoes, E.J.Perceived environmental correlates of physical activity for leisure and transportation in Curitiba, Brazil.Prev. Med. 2011, 52, 234–238. [CrossRef] [PubMed]
79. Strauss, A.; Corbin, J.M. Basics of Qualitative Research: Techniques and Procedures for Developing Grounded Theory;SAGE Publications: Thousand Oaks, CA, USA, 1998.
80. Glaser, B.G.; Strauss, A.L. The Discovery of Grounded Theory: Strategies for Qualitative Research; AldineTransaction: Piscataway, NJ, USA, 2009.
81. Luborsky, M.R.; Rubinstein, R.L. Sampling in qualitative research: Rationale, issues, and methods. Res. Aging1995, 17, 89–113. [CrossRef] [PubMed]
82. Clark, M.I.; Berry, T.R.; Spence, J.C.; Nykiforuk, C.; Carlson, M.; Blanchard, C. Key stakeholder perspectiveson the development of walkable neighbourhoods. Health Place 2010, 16, 43–50. [CrossRef] [PubMed]
83. Hipp, J.A.; Adlakha, D.; Chockalingam, R. Social ecological constraints to park use in communities withproximate park access. LARNet Cyber J. Appl. Leis. Recreat. 2013, 16, 23–26.
84. Willis, G.B. Cognitive Interviewing: A Tool for Improving Questionnaire Design, 1st ed.; SAGE Publications, Inc.:Thousand Oaks, CA, USA, 2004.
85. Collins, D. Pretesting survey instruments: An overview of cognitive methods. Qual. Life Res. 2003, 12,229–238. [CrossRef] [PubMed]
86. Turrell, G. Income non-reporting: Implications for health inequalities research. J. Epidemiol. CommunityHealth 2000, 54, 207–214. [CrossRef] [PubMed]
87. Kocher, J.; Lerner, M. Walk Score; Walk Score: Seattle, WA, USA, 2007.88. Tregoning, H. Getting to Walkability—Using Walk Score as Planning Metric and Goal. Available online:
http://www.slideshare.net/mrlerner/getting-to-walkability (accessed on 29 March 2016).89. Walk Score. Walk Score Methodology White Paper. Available online: http://www2.WalkScore.com/
pdf/WalkScoreMethodology.pdf (accessed on 29 March 2016).90. Ritchie, J.; Lewis, J. Qualitative Research Practice: A Guide for Social Science Students and Researchers; SAGE
Publications: Thousand Oaks, CA, USA, 2003.91. Di Gregorio, S.D.J. Qualitative Research Design for Software Users; Open University Press, McGraw-Hill
International: New York, NY, USA, 2008.92. QSR. Nvivo 10.0.638.0.; QSR International Pty Ltd.: Burlington, MA, USA, 2014.93. Ayres, L.; Kavanaugh, K.; Knafl, K.A. Within-case and across-case approaches to qualitative data analysis.
Qual. Health Res. 2003, 13, 871–883. [CrossRef] [PubMed]94. Zayas, L.H.; Gulbas, L.E.; Fedoravicius, N.; Cabassa, L.J. Patterns of distress, precipitating events, and
reflections on suicide attempts by young Latinas. Soc. Sci. Med. 2010, 70, 1773–1779. [CrossRef] [PubMed]95. Stokols, D. Establishing and maintaining healthy environments. Toward a social ecology of health promotion.
Am. Psychol. 1992, 47, 6–22. [CrossRef] [PubMed]96. Sallis, J.F.; Cervero, R.B.; Ascher, W.; Henderson, K.A.; Kraft, M.K.; Kerr, J. An ecological approach to creating
active living communities. Annu. Rev. Public Health 2006, 27, 297–322. [CrossRef] [PubMed]97. Booth, S.L.; Sallis, J.F.; Ritenbaugh, C.; Hill, J.O.; Birch, L.L.; Frank, L.D.; Glanz, K.; Himmelgreen, D.A.;
Mudd, M.; Popkin, B.M.; et al. Environmental and societal factors affect food choice and physical activity:Rationale, influences, and leverage points. Nutr. Rev. 2001, 59, S21–S39; S57–S65. [CrossRef] [PubMed]
98. Egger, G.; Swinburn, B. An “ecological” approach to the obesity pandemic. BMJ 1997, 315, 477–480.[CrossRef] [PubMed]
99. Lavizzo-Mourey, R.; McGinnis, J.M. Making the case for active living communities. Am. J. Public Health 2003,93, 1386–1388. [CrossRef] [PubMed]
100. Stokols, D.; Grzywacz, J.G.; McMahan, S.; Phillips, K. Increasing the health promotive capacity of humanenvironments. Am. J. Health Promot 2003, 18, 4–13. [CrossRef] [PubMed]
101. Hill, J.O.; Peters, J.C. Environmental contributions to the obesity epidemic. Science 1998, 280, 1371–1374.[CrossRef] [PubMed]
102. Koplan, J.P.; Liverman, C.T.; Kraak, V.I. Preventing Childhood Obesity: Health in the Balance; National AcademiesPress: Washington, DC, USA, 2005.
Int. J. Environ. Res. Public Health 2016, 13, 401 23 of 24
103. Institute of Medicine. Health and Behavior: The Interplay of Biological, Behavioral, and Societal Influences; NationalAcademies Press (U.S.): Washington, DC, USA, 2001.
104. Kumanyika, S.; Jeffery, R.W.; Morabia, A.; Ritenbaugh, C.; Antipatis, V.J. Obesity prevention: The case foraction. Int. J. Obes. Relat. Metab. Disord. 2002, 26, 425–436. [CrossRef] [PubMed]
105. CDC. Guide to Community Preventive Services; Epidemiology Program Office, Centers for Disease Control andPrevention: Atlanta, GA, USA, 2011.
106. CDC. More People Walk to Better Health; Centers for Disease Control and Prevention: Atlanta, GA, USA, 2012.107. Sallis, J.F.; Owen, N. Physical Activity and Behavioral Medicine; Sage: Thousand Oaks, CA, USA, 1999.108. Trost, S.G.; Owen, N.; Bauman, A.E.; Sallis, J.F.; Brown, W. Correlates of adults’ participation in physical
activity: Review and update. Med. Sci. Sports Exerc. 2002, 34, 1996–2001. [CrossRef] [PubMed]109. Portney, L.G.; Watkins, M.P. Foundations of Clinical Research: Applications to Practice; Mcgraw-Hill/appleton &
Lange: New York, NY, USA, 1993.110. Landis, J.R.; Koch, G.G. The measurement of observer agreement for categorical data. Biometrics 1977, 33,
159–174. [CrossRef] [PubMed]111. IBM Corp. IBM SPSS Statistics for Windows, Version 22.0.; IBM Corp.: Armonk, NY, USA, 2012.112. Bronfenbrenner, U. Toward an experimental ecology of human development. Am. Psychol. 1977, 32, 513–531.
[CrossRef]113. Phadke, S.; Khan, S.; Ranade, S. Why Loiter?: Women and Risk on Mumbai Streets; Penguin Books: London,
UK, 2011.114. Mitra-Sarkar, S.; Partheeban, P. Abandon All Hope, Ye Who Enter Here: Understanding the Problem of
“Eve Teasing” in Chennai, India. In Proceedings of the 4th International Conference on Women’s Issues inTransportation, Irvine, CA, USA, 27–30 October 2009; pp. 74–84.
115. Herbel, S.; Gaines, D. Women’s issues in transportation: Summary of the 4th International Conference.In Transportation Research Board: Women's Issues in Transportation; Transportation Research Board: Irvine,CA, USA, 2009.
116. Cerin, E.; Macfarlane, D.J.; Ko, H.-H.; Chan, K.-C.A. Measuring perceived neighbourhood walkability inHong Kong. Cities 2007, 24, 209–217. [CrossRef]
117. Bird, S.; Kurowski, W.; Feldman, S.; Browning, C.; Lau, R.; Radermacher, H.; Thomas, S.; Sims, J. Theinfluence of the built environment and other factors on the physical activity of older women from differentethnic communities. J. Women Aging 2009, 21, 33–47. [CrossRef] [PubMed]
118. Chopra, S.M.; Misra, A.; Gulati, S.; Gupta, R. Overweight, obesity and related non-communicable diseases inAsian Indian girls and women. Eur. J. Clin. Nutr. 2013, 67, 688–696. [CrossRef] [PubMed]
119. Garrard, J.; Rose, G.; Lo, S.K. Promoting transportation cycling for women: The role of bicycle infrastructure.Prev. Med. 2008, 46, 55–59. [CrossRef] [PubMed]
120. Arango, C.; Paez, D.; Reis, R.S.; Brownson, R.C.; Parra, D.C. Association between the perceived environmentand physical activity among adults in Latin America: A systematic review. Int. J. Behav. Nut. Phys. Act. 2013,10, 122. [CrossRef] [PubMed]
121. Parra, D.C.; Gomez, L.F.; Fleischer, N.L.; David Pinzon, J. Built environment characteristics and perceivedactive park use among older adults: Results from a multilevel study in Bogota. Health Place 2010, 16,1174–1181. [CrossRef] [PubMed]
122. Cohen, S.S.; Matthews, C.E.; Signorello, L.B.; Schlundt, D.G.; Blot, W.J.; Buchowski, M.S. Sedentary andphysically active behavior patterns among low-income African-American and white adults living in theSoutheastern United States. PLoS ONE 2013, 8, e59975. [CrossRef] [PubMed]
123. Andajani-Sutjahjo, S.; Ball, K.; Warren, N.; Inglis, V.; Crawford, D. Perceived personal, social andenvironmental barriers to weight maintenance among young women: A community survey. Int. J. Behav.Nutr. Phys. Act. 2004, 1, 15. [CrossRef] [PubMed]
124. Parra, D.C.; McKenzie, T.L.; Ribeiro, I.C.; Ferreira Hino, A.A.; Dreisinger, M.; Coniglio, K.; Munk, M.;Brownson, R.C.; Pratt, M.; Hoehner, C.M.; et al. Assessing physical activity in public parks in Brazil usingsystematic observation. Am. J. Public Health 2010, 100, 1420–1426. [CrossRef] [PubMed]
125. Rech, C.R.; Reis, R.S.; Hino, A.A.; Hallal, P.C. Personal, social and environmental correlates of physicalactivity in adults from Curitiba, Brazil. Prev. Med. 2014, 58, 53–57. [CrossRef] [PubMed]

Int. J. Environ. Res. Public Health 2016, 13, 401 24 of 24
126. Cohen, D.A.; Marsh, T.; Williamson, S.; Derose, K.P.; Martinez, H.; Setodji, C.; McKenzie, T.L. Parks andphysical activity: Why are some parks used more than others? Prev. Med. 2010, 50, S9–S12. [CrossRef][PubMed]
127. Cohen, D.A.; McKenzie, T.L.; Sehgal, A.; Willamson, S.; Golinelli, D.; Lurie, N. Contribution of public parksto physical activity. Am. J. Public Health 2007, 97, 509–514. [CrossRef] [PubMed]
128. Arayaa, R.; Dunstanb, F.; Playleb, R.; Thomasc, H.; Palmerb, S.; Lewisa, G. Perceptions of social capital andthe built environment and mental health. Soc. Sci. Med. 2006, 62, 3072–3083. [CrossRef] [PubMed]
129. Seaman, P.; Jones, R.; Ellaway, A. It’s not just about the park, it’s about integration too: Why people chooseto use or not use urban greenspaces. Int. J. Behav. Nutr. Phys. Act. 2010, 7, 78. [CrossRef] [PubMed]
130. Leslie, E.; Saelens, B.; Frank, L.; Owen, N.; Bauman, A.; Coffee, N.; Hugo, G. Residents’ perceptions ofwalkability attributes in objectively different neighbourhood: A pilot study. Health Place 2005, 11, 227–236.[CrossRef] [PubMed]
131. Cerin, E.; Sit, C.H.; Huang, Y.J.; Barnett, A.; Macfarlane, D.J.; Wong, S.S. Repeatability of self-report measuresof physical activity, sedentary and travel behaviour in Hong Kong adolescents for the iHealt(h) andIpen—Adolescent studies. BMC Pediatr. 2014, 14. [CrossRef] [PubMed]
132. De Bourdeaudhuij, I.; Sallis, J.F.; Saelens, B.E. Environmental correlates of physical activity in a sample ofbelgian adults. Am. J. Health Promot. 2003, 18, 83–92. [CrossRef] [PubMed]
133. Van Dyck, D.; Cerin, E.; Conway, T.L.; Bourdeaudhuij, I.D.; Owen, N.; Kerr, J.; Cardon, G.; Frank, L.D.;Saelens, B.E.; Sallis, J.F. Perceived neighborhood environmental attributes associated with adults’transport-related walking and cycling: Findings from the USA, Australia and Belgium. Int. J. Behav.Nutr. Phys. Act. 2012, 70, 1–14. [CrossRef] [PubMed]
134. Giles-Corti, B.; Timperio, A.; Bull, F.; Pikora, T. Understanding physical activity environmental correlates:Increased specificity for ecological models. Exerc. Sport Sci. Rev. 2005, 33, 175–181. [CrossRef] [PubMed]
135. Ranasinghe, C.; Ranasinghe, P.; Jayawardena, R.; Misra, A. Physical activity patterns among South-Asianadults: A systematic review. Int. J. Behav. Nutr. Phys. Act. 2013, 10, 116. [CrossRef] [PubMed]
© 2016 by the authors; licensee MDPI, Basel, Switzerland. This article is an open accessarticle distributed under the terms and conditions of the Creative Commons by Attribution(CC-BY) license (http://creativecommons.org/licenses/by/4.0/).