adaptation of stagnicola palustris to rapid climate change
TRANSCRIPT

INSTITUTIONEN FÖR GEOVETENSKAPER
Examensarbete i Hållbar Utveckling 41
Adaptation of Stagnicola palustris to RapidClimate Change in the Baltic Sea
Tarikul Islam


Adaptation of
Climate Change in the Baltic Sea
Md. Tarikul Islam
Degree project E in Sustainable DExamensarbete E i hållbar utveckling Biology Education Centre and Department of Population Biology and Conservation Biology, Uppsala University Supervisor: Dr. Anssi Laurila
i
Adaptation of Stagnicola palustris to Rapid
Climate Change in the Baltic Sea
Sustainable Development (30ECTS), Master of Science (2yeare E i hållbar utveckling 30 hp till masterexamen, 2011
on Centre and Department of Population Biology and Conservation Biology,
to Rapid
Climate Change in the Baltic Sea
(2years), 2011
on Centre and Department of Population Biology and Conservation Biology,

ii

iii
Summary
Rapid climate change is one of the most pressing environmental issues in the world, with Scandinavia and
the Arctic among those projected to be most strongly affected. Faced with a changing environment,
organisms may respond in three ways – by adaptation, migration or extinction. Adaptation can occur
through phenotypic plasticity or microevolution, and while phenotypic responses to climate change are
well described, examples showing microevolution are rare. To be able to predict the effects of climate
change, an assessment of a species’ evolutionary potential to increased temperature is necessary.
I studied whether snail populations subjected to a 30 year warming experiment have been able to adapt to
the new climate regimen. Two populations of Stagnicola palustris originating from areas affected by
cooling water discharge from the nuclear power plant in Forsmark, Sweden (with increased water
temperatures by 4-10 °C) and two control populations from unaffected areas were used in this
experiment. Laboratory reared F3 offspring were raised for 28 weeks in a common garden setup at four
different temperature treatments (12-24 °C) and shell length, snail mass and higher survival were
measured.
Both warm-origin populations appeared able to have adapted to the increased temperatures, though by
different means. Snail growth showed evidence of co-gradient variation (after 6 and 18 weeks) and local
adaptation (after 28 weeks) in one of the warm-origin populations. The other warm-origin population, on
the other hand, appeared to have acquired adaptation by increasing its survival to the higher temperatures
compared to the other three populations.
My results suggest that organisms can adapt rapidly to a warmer environment. However, the effects of
improved growth and survival on population fitness and persistence remain unclear and need to be studied
further.

iv
Contents
1.1 Introduction……………………………………………………………………………………………..1
2. Materials and method…………………………………………………………………………………...4
2.1 Study area…………………………………………………………………………………………...4
2.2 Study species………………………………………………………………………………………..4
2.3 Experimental design………………………………………………………………………………..5
2.4 Data collection……………………………………………………………………………………...6
2.5 Data Analysis……………………………………………………………………………………….6
2.5.1 Growth……………………………………………………………………………………………6
2.5.2 Survival…………………………………………………………………………………………...7
3. Results…………………………………………………………………………………………………...7
3.1 Shell length…………………………………………………………………………………………7
3.2 Body mass………………………………………………………………………………………......9
3.3 Survival……………………………………………………………………………………………12
4. Discussion……………………………………………………………………………………………...13
Acknowledgement………………………………………………………………………………………...16
References…………………………………………………………………………………………………16
1
1. Introduction
Climate change is one of the most pressing environmental issues in the world. At present, changes in the
climate are already well described and range from rising global average air and ocean temperatures, to
melting glaciers and rising global sea levels (IPCC 2007). The observed increase of global average
surface temperature was 0.13 °C per decade between 1956 and 2005 or 0.74 °C over 100 years between
1906 and 2005 (IPCC 2007). Climate models predict an increase of up to 4 °C (relative to 1980-99)
globally by the end of this century (IPCC 2007). As the northern high latitudes are most affected, a
warming by up to 8 °C is projected for the Arctic and by up to 5°C for Scandinavia (IPCC 2007) over the
same period. It is also predicted that an average temperature rise of 1.5 to 2.5 °C will put 20% to 30% of
species at an increased risk of extinction and the structure and function of some ecosystems will likely be
damaged (IPCC 2007). Besides climate change, other anthropogenic activities, such as urbanization and
warm water pollution, have increased local temperature in many aquatic and terrestrial habitats (Grimm et
al, 2008). These changes in temperature can play a significant role for distribution and abundance of
species depending on whether a species is a thermal specialists or generalists, and whether it has the
capacity to adapt to changed temperature regimes.
Faced with a changing environment, species may respond in three ways – adaptation, migration or
extinction (Holt 1990). Species can adapt to a changing environment by phenotypic plasticity or
microevolution. Examples for phenotypic plasticity to warming come from many and diverse species:
toads and frogs spawn earlier in the year (Beebee 1995), earlier breeding in birds (Both and Visser 2009,
Charmantier et al. 2008), and earlier bud burst and reproduction in plants (Menzel and Fabian 1999).
Examples of true microevolution are much rarer partly because rapid changes in the climate are recent
and the data are only now beginning to accumulate; examples include changing photoperiodicity in
mosquitoes and squirrels breeding earlier (Bradshow and Holzapfel 2006, 2008). Most of the documented
cases have been in response to indirect effects of climate change – changes in day length (photoperiod),
season length (Berthold et al. 1992, Bradshaw and Holzapfel 2001, 2008), sea level, precipitation and
nutrients imbalance - but few studies have looked at direct effects of increasing temperature (Angilletta
2009). Temperature also plays an ecologically significant role affecting an organism’s physiology,
reproduction and other traits. While most responses observed until now have occurred at the phenotypic
level, phenotypic plasticity alone is not expected to be able to cope with predicted changes. Consequently,
knowledge on the capacity of organisms to genetically adapt to climate change is urgently needed.
2
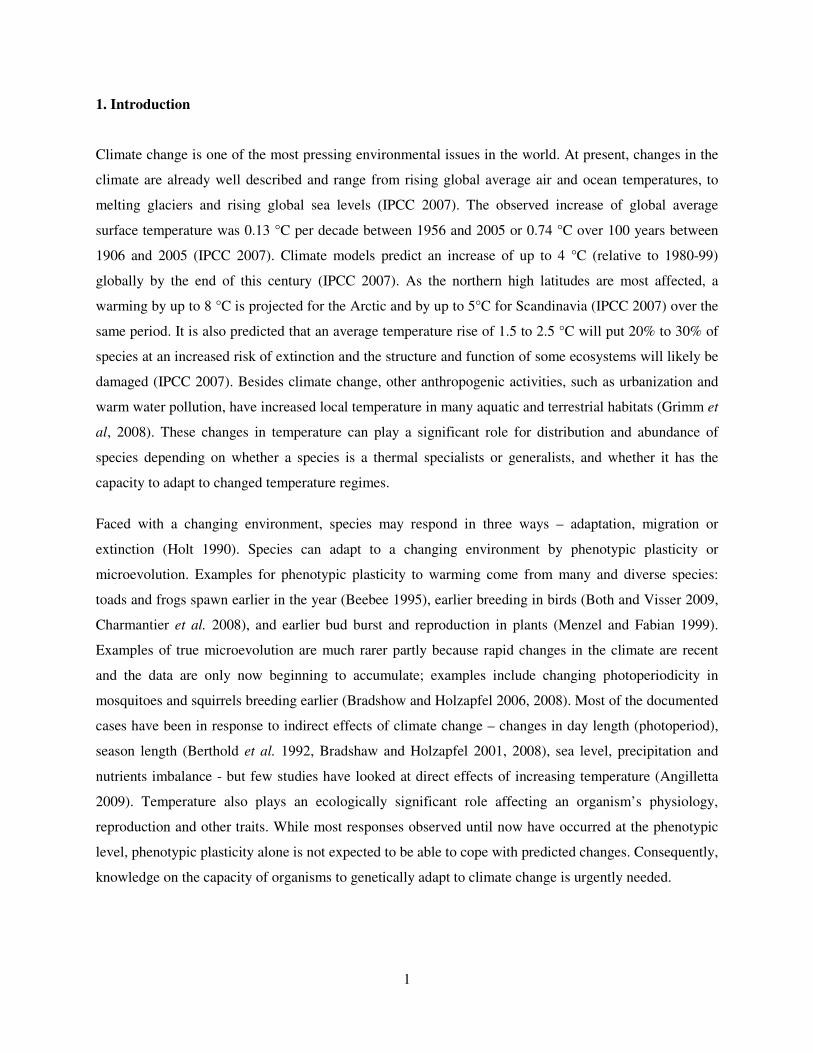
A number of models have investigated the evolution of thermal sensitivity in fitness traits of an organism
(reviewed by Angilletta 2009). For example, Lynch and Gabriel (1987) and Gilchrist (1995) modeled
performance of an organism with a trait that affects fitness (growth, survival, locomotion, development
and reproduction). The main differences between these models are how relationship between phenotype
and fitness are described - Lynch and Gabriel (1987) considered only survival, whereas also fecundity is
included by Gilchrist’s (1995) model – and how thermal heterogeneity was included in the models.
Nevertheless, both models predict thermal specialization with organisms having the highest performance
in the temperature they meet most often. This will lead to high –and low temperature specialists (Fig. 1a).
Fig. 1 Potential patterns of thermal performance curves when comparing populations from two origins. a) evidence of hot-cold specialist b) weak evidence for generalist-specialist trade-off c) countergradient variation and d) cogradient variation (from Angilletta 2009).
While thermal specialists have a narrow performance breadth and are favored in more specific
temperatures, another pattern of adaptation is thermal generalists, which have a wider and flattened
performance curve over a range of temperatures. Lynch and Gabriel (1987) and Gilchrist (1995) predict
this outcome when populations live in variable environments. Besides the specialist-generalist situation, a
tradeoff between thermal specialization and generalization can occur (Angilletta 2009). Fig. 1b shows
such a situation where a cold-source environment favors generalization while a hot-source environment

3
favors specialization. Additionally, empirical studies have demonstrated two patterns of thermal
performance, countergradient variation and cogradient variation, which were not predicted by the early
models (Figs. 1c and 1d, Conover and Schultz, 1995, Conover et al. 2009). Countergradient variation
occurs when organisms from the cold environment outperform organisms from the warm environment in
all temperatures. In this case genetic effects are acting against phenotypic effects along the temperature
gradient leading to apparent lack of variation under natural conditions (hidden genetic variation), hence
the name countergradient variation (Conover and Schulz 1995). The opposite pattern, where warm-origin
organisms perform better than cold-origin organisms in all temperatures, is known as cogradient variation
and leads to increased variation along a natural environmental gradient (Conover and Schultz 1995,
Conover et al. 2009).
Like local adaptation, cogradient and countergradient variation have importance for the decision making
in resource management and conservation. When little genetic information is on hand, phenotypic
performance can be used as a basis for management decisions for example in transplants of species and
populations (Conover and Schultz 1995). However, the impression of genetic performance deduced from
the phenotypic performance can be misleading. For example two subspecies of the large-mouth bass
(Micropterus salmoides) were transplanted in an experiment in North America. Motivated by the quick
growth and large size of the southern population in the south, southern population was expected to
perform similarly to the northern population when introduced in the north (Conover and Schultz, 1995).
In a common garden experiment it was however found that northern population grew faster, indicating
countergradient variation. Unfortunately, true northern population became less common due to the
introduction of slow-growing southern population.
In this study, I studied whether populations of the aquatic snail Stagnicola palustris have been able to
adapt to a changed temperature regime during a 30 year period, mirroring some of the IPCC’s worst-case
scenarios for the end of this century. As biodiversity can play a significant role in keeping the ecosystem
resilient under environmental change (Chapin et al. 2000, Hooper et al. 2005), knowledge on the species’
capacity to adapt to changing environment is essential for management of biodiversity. Identification of
species’ capacity to adapt could also help building national and international frameworks related with
threats and benefits of climate change (Thomas et al. 2010). In order to investigate such capacity, I
focused on Biotest Basin, Forsmark, Central Sweden where effects of anthropogenic increase in
temperature can be studied. The Biotest Basin is an artificial enclosure where the warm water used to cool
the nuclear reactors in Forsmark power plant is directed.

4
Ideally, genetic adaptation in an organism originating from different locations is tested in reciprocal
transplant experiments, where animals from different origins are moved between the habitats (Kawecki
and Ebert 2004). However, such experiments are not always logistically possible, and an alternative
experimental design is to rear the populations in a common environment for several generations - the
common garden experiment (e.g., Kawecki and Ebert 2004). I used the common garden approach, and
investigated four laboratory populations of S. palustris, originating from two populations affected by
cooling water discharge and two from unaffected areas around Biotest Basin. F3 offspring from ten
families per population were raised in four temperature treatments (12, 16, 20 and 24 °C) for 28 weeks
and their growth and survival were measured. My main question was whether S. palustris populations
adapted to the warm water discharge into the Biotest basin. I hypothesized that I will find 1) a temperature
effect, where growth (shell length or mass) is higher in 20 and 24 °C than in 12 and 16 °C, and 2) an
origin × temperature interaction where snail growth (shell length or mass) is higher at 20 and 24 °C in
warm-origin snails than in cold-origin snails, but lower at 12 and16 °C in warm-origin snails than in cold-
origin snails. 3) I expected to find a similar pattern in survival: survivorship is higher at 20 and 24 °C in
warm-origin populations than in cold-origin populations and higher at 12 and 16 °C in cold-origin
populations than in warm-origin populations. These results would conform to the thermal specialist
hypothesis (Fig. 1a, Lynch and Gabriel 1987, Gilchrist 1995, Angilletta 2009).
2. Materials and Methods
2.1 Study area
The Biotest Basin (60°25’ N and 18°10’ E, Forskmark nuclear power plant), is an artificial enclosure
built to study the environmental impacts of cooling water discharged from nuclear power plants into the
Baltic Sea. It is created by a series of natural islands joined together with boulder rocks and has an area of
ca. 1 km² and an average depth of 2.5m (Svensson et al., 1992, Sandström et al., 1997). The water
temperature inside the enclosure is 8-10 °C above the surrounding sea. During summer, temperature can
reach close to 30 °C (Fig. 2.b. Luksiene et al., 1999; Fiskeriverket, 2010).
2.2 Study species
S. palustris belongs to the Lymnaeidae. As are other members in Lymnaeidae, S. palustris is
hermaphroditic and has a wide distribution in Europe in shallow and well-aerated freshwater habitat with
rich vegetation. It is also common in the shores of the northern Baltic Sea (Carlsson 2006), including the
Biotest Basin. S. palustris is also an intermediate host of Diplostomum spp. trematodes which complete
their life cycle in fish as primary host. In this sense, S. palustris has an important ecological role in the
Biotest basin (Vattenfall 2009).

2.3 Experimental design
Four S. palustris populations, two from inside the Biotest Basin (BT1 and BT2) and two from areas
unaffected by cooling water discharge (OUT and ANG),
laboratory at the EBC, Uppsala University
design, immature F2 snails were paired, and egg batches were collected from one of the
Hatchlings (F3, from 14 days after hatching) were then raised in
°C, 20 °C and 24 °C) in the laboratory
From each population, two individuals from each of ten
case of BT2) were raised per treatment
a maximum of six individuals per family per treatment
with some missing for BT2). Temperature treatments were mai
°C) and water baths (20° and 24°C
(diameter=65mm × height=70mm). Throughout the experiment
with a salinity of 4.1-4.5 ‰ (Instant Ocean synthetic marine salt) was used.
changed once a week. Snails were fed
boiled spinach, Spirulina powder (www.lindroos.net)
Fig. 2 a. Maps showing Biotest Basin: Aof cooling water; B- outflow and origin of palustris (1- ANG; 2-OUT; 3- BT1; 4
5
populations, two from inside the Biotest Basin (BT1 and BT2) and two from areas
unaffected by cooling water discharge (OUT and ANG), were raised under common conditions
at the EBC, Uppsala University to control for effects of the environment. To obtain a family
mature F2 snails were paired, and egg batches were collected from one of the
Hatchlings (F3, from 14 days after hatching) were then raised in four temperature treatments (12
in the laboratory.
two individuals from each of ten families (2-3 individuals of seven
per treatment to estimate growth (total n = 317). However, to measure survival,
duals per family per treatment per population were considered (total
Temperature treatments were maintained in climate chambers (12
°C) and water baths (20° and 24°C), and snails were kept individually in small transparent plast
). Throughout the experiment, reconstituted soft water
(Instant Ocean synthetic marine salt) was used. The water in the cups was
. Snails were fed ad libitum with a standardized mixture of cho
www.lindroos.net) and fish flakes (www.sera.de).
Fig. 2 a. Maps showing Biotest Basin: A- inflow outflow and origin of S.
BT1; 4- BT2).
Fig. 2. b. Temperature distribution (January 1995 to December 1995) at Biotest Basin and the intake area i.e. the Baltic Sea outside of the Basin (Sandström et al., 1997).
populations, two from inside the Biotest Basin (BT1 and BT2) and two from areas
under common conditions in the
ment. To obtain a family
mature F2 snails were paired, and egg batches were collected from one of the individuals.
four temperature treatments (12 °C, 16
seven families in the
However, to measure survival,
were considered (total n = 797,
ntained in climate chambers (12 and 16
ransparent plastic cups
, reconstituted soft water (APHA, 1985)
water in the cups was
mixture of chopped and lightly
Fig. 2. b. Temperature distribution (January t Biotest Basin and
the intake area i.e. the Baltic Sea outside of the ., 1997).
2.4 Data Collection
To measure shell length, each snail was measured at 14 day intervals by
EOS400D Digital camera) against a background of millimeter paper.
images using ImageJ (http://rsbweb.nih.gov/ij
Additionally, once the snails had reached a length o
digital balance (A&D, Japan) to the nearest 0.1 mg
checked twice a week.
2.5 Data Analysis
2.5.1 Growth
In order to qualitatively examine the influence of thermal treatment
length and mass), I plotted snail appeared to be
throughout the study period. Shell length was analyzed
for analyses of mass only weeks 8, 16 and 28 could be included (before that the snails were too small to
be measured). I used a Generalized
treatment as fixed factors, and shell length or mass as dependent variables. I used
distribution and inverse link function since the data were unbalanced and non
× temperature interaction indicates genetic variation among the populations
Missing cells due to the mortality prevented me using repeated measures ANOVA for the growth
analyses. The significance was determined using the
degrees of freedom. The statistical assumptions including dispersion, residual plot and lack
checked before the analyses (Quinn and Keough 2002, Logan, 2010
package (The R Project for Statistical Computing, http://www.r
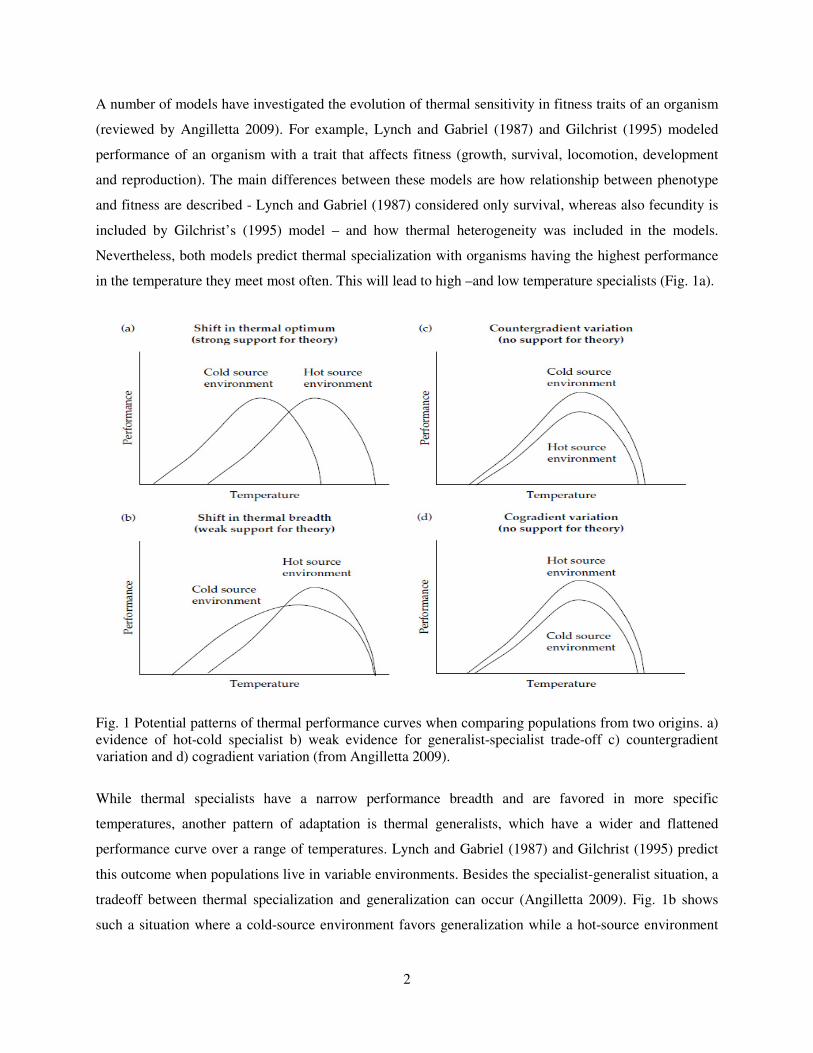
Fig. 3 Snail shell length was measured from the tip to the base of the shell by taking picture against a background of millimeter paper.
6
To measure shell length, each snail was measured at 14 day intervals by taking a photograph
EOS400D Digital camera) against a background of millimeter paper. Shell length was measured from the
http://rsbweb.nih.gov/ij) from the tip of the shell to the base of the shell
the snails had reached a length of 5 mm, they were blotted dry and
to the nearest 0.1 mg in conjunction to photographing
examine the influence of thermal treatments and origin on the growth
appeared to be growing until 28 weeks. Snails seemed to be growing
length was analyzed at 0, 6, 16 and 28 weeks of the experiment
of mass only weeks 8, 16 and 28 could be included (before that the snails were too small to
a Generalized Linear models for analysis with population origin and temperature
factors, and shell length or mass as dependent variables. I used
distribution and inverse link function since the data were unbalanced and non-normal. A significant origin
e interaction indicates genetic variation among the populations in the thermal reaction norm.
Missing cells due to the mortality prevented me using repeated measures ANOVA for the growth
determined using the Chi-test value estimated from deviance (
degrees of freedom. The statistical assumptions including dispersion, residual plot and lack
Quinn and Keough 2002, Logan, 2010). I used R 2.13.0 statistical software
roject for Statistical Computing, http://www.r-project.org).
Snail shell length was measured from the tip to the base of the shell by taking picture against a
taking a photograph (CANON
Shell length was measured from the
rom the tip of the shell to the base of the shell (Fig. 3).
ry and weighed with a
in conjunction to photographing. Survival was
and origin on the growth (shell
nails seemed to be growing
the experiment, while
of mass only weeks 8, 16 and 28 could be included (before that the snails were too small to
with population origin and temperature
factors, and shell length or mass as dependent variables. I used a Gamma error
A significant origin
in the thermal reaction norm.
Missing cells due to the mortality prevented me using repeated measures ANOVA for the growth
timated from deviance (G²) and
degrees of freedom. The statistical assumptions including dispersion, residual plot and lack of fit, were
R 2.13.0 statistical software
Snail shell length was measured from the tip to the base of the shell by taking picture against a

7
2.5.2 Survival
Survival was analyzed by logistic regression. The response variable was binary (alive-1, dead-0), thus I
used a generalized linear model with binomial distribution (Quinn and Keough, 2002) and two
explanatory fixed factors (Temperature and Origin). For significance testing, I again used the Chi-test
value measured from deviance (G²) and degrees of freedom. Assumptions like dispersion and lack of fit
were checked before the analysis (Logan, 2010; Quinn and Keough 2002). R 2.13.0 statistical software
package was used for data analysis. Reaction norms and survival were also plotted.
3. Results
3. 1. Shell length: Mean shell length (Fig. 4) increased during the study period in all temperatures and
populations (Fig. 4). At 12 °C, mean snail length was similar for all populations. At 16 °C, warm-origin
population BT2 started performed poorly from week 12 onwards. At 20 °C, warm-origin population BT1
performed better than the other populations. At 24 °C, all populations had similar shell length at 28
weeks; however, between weeks four and 20, there were differences among the populations with
populations BT1 and OUT performing better than the other populations. Except in the 12 °C treatment,
populations started responding differently after 4-12 weeks into the experiment, and growth leveled off at
the end of the study period (Fig. 4).
Fig.4 Shell length of S. palustris, raised at 12, 16, 20 and 24 °C from four different populations (two from cold and two from warm origin populations during the study periods). The error bars were removed for better clarification. Observe the different scaling on y-axes.

8
At the start of the experiment, populations differed significantly in shell length only in terms of
population origin (Table 1). Mean shell length was smaller in one of the warm-origin populations (BT2)
than in the populations BT1 and OUT (Fig. 5, Week 0). After six weeks, both temperature and origin had
a significant effect on shell length, while the temperature × population interaction remained
nonsignificant (Table 1). Highest shell length was found at 20 °C and lowest at 12 °C, and shells were
shorter at 24 °C than at 20 °C (Fig. 5, Week 6). The population effect was due to BT2 population was
growing slower than the other three populations (Fig. 5, Week 6). The temperature effects were similar at
16 weeks of age (Fig 5 Week 16, Table 1). Compared to all the other populations, BT1 snails had very
long shells at 20 and 24°C bringing about the significant population and almost significant temperature ×
population interaction (Fig 5 Week 16, Table 1). BT2 had very low performance at 16 °C (Fig. 5 Week
16). At 28 weeks, the population differences in shell length had diminished; however, the temperature
effect was still highly significant (Fig. 5 Week 28, Table 1). As indicated by the almost significant
temperature × population, both cold origin populations had longer shell than warm origin at 16 °C,
whereas at 20 °C, BT1 had the highest performance. At 12 and 24 °C, shell length was very similar in
every population (Fig. 5, Week 28).
Fig. 5 Mean shell length (± SE) and thermal reaction norms of snails after 0, 6 16 and 28 weeks into the experiment. Snails were raised in four temperature conditions with four different populations. Black color represents warm origin and ash color represents cold origin snail. Observe the different scaling of the y-axes.
9
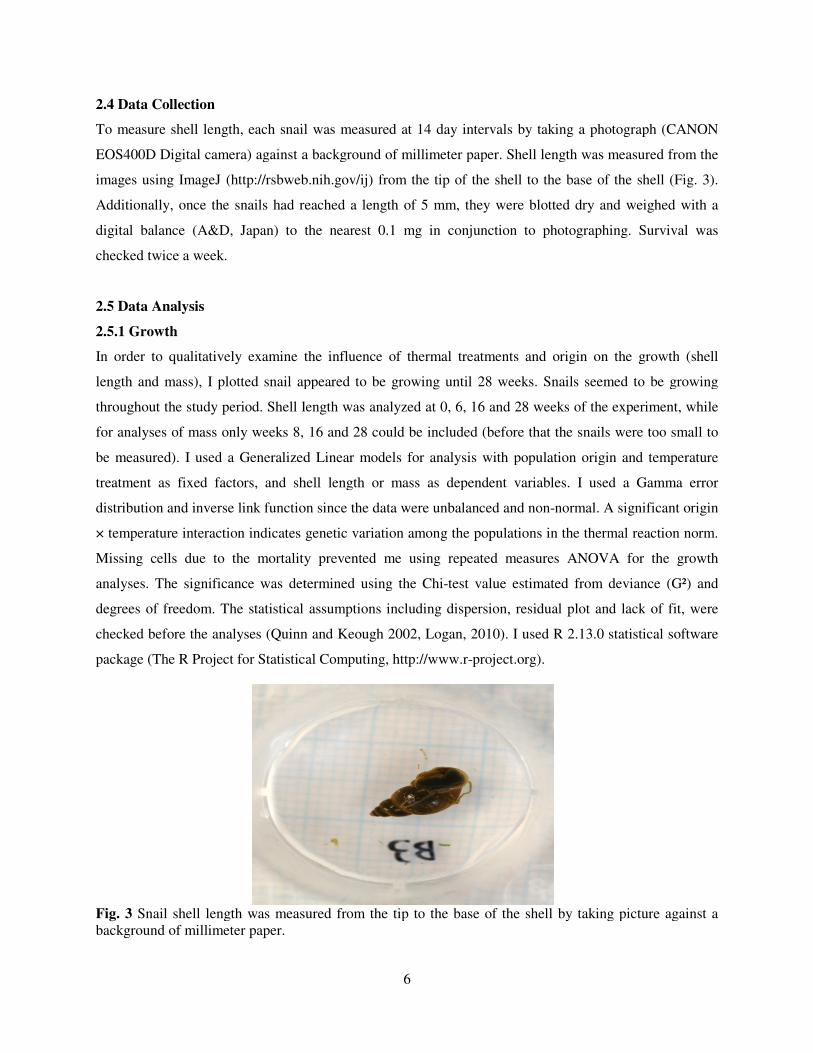
Table.1 Generalized Linear Model ANOVA. Analysis of shell length in S. palustris after 0, 6, 16 and 28 weeks at four temperature treatments (12, 16, 20 and 24°C) from four origins (ANG, OUT, BT1 and BT2).
3.2. Body mass
At 12 °C, there was little variation at population level (Fig 6). At 16 °C, BT2 performed generally worse
than the rest of the populations, and the final body mass was larger in the two cold-origin populations
(Fig. 6). BT1 gained more weight than the cold origin populations at 20 °C, and BT2 had similar mass as
the cold origin populations (Fig. 6). At 24 °C, the populations gained the body mass differently with OUT
and BT1 gaining weight more rapidly, however, there were little differences among the populations at the
end of the experiment (Fig. 6). Snails from different origins started to respond differently at 6-8 weeks of
age in the three higher temperatures.
Source of Variation d.f. G² P(<|Chi|)
Week 0
Temperature
Origin
Temperature × Origin Week 6
Temperature
Origin
Temperature × Origin Week 16
Temperature
Origin
Temperature × Origin Week 28
Temperature
Origin
Temperature × Origin
3 3 9 3 3 9 3 3 9 3 3 9
0.023575 0.312482 0.218886 22.9357 1.9305 1.0677 3.3486 0.6548 0.7096 0.92548 0.15496 0.43765
0.801 0.004 0.412 <0.001 <0.001 0.283 <0.001 0.002 0.074 <0.001 0.133 0.071

10
Fig. 6 Mean mass of S. palustris, at 12, 16, 20 and 24°C from four origins during the study period. The error bars are removed for better clarification. Observe the different scaling of the y-axes.
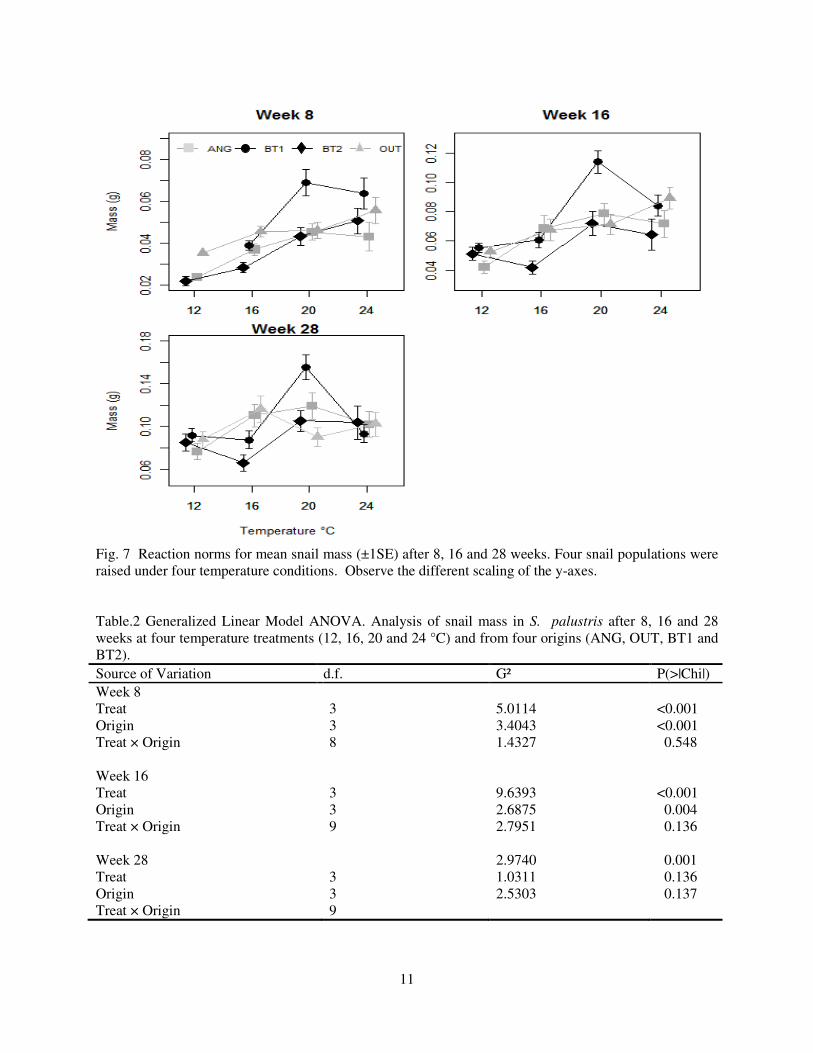
Data for BT1 were not included at 8 weeks, since the individuals did not gain more than 5mm of length
and could not be weighed reliably. Body mass was higher in 20 and 24 °C than in the 12 °C treatment
(Fig. 7, Table 2). At 12 °C, mean mass was higher for OUT compared to ANG and BT2. However, BT1
had higher mass at 20 and 24 °C than the other populations leading to the significant origin effect (Fig. 7,
Table 2). At week 16, BT1 and OUT snails were larger than BT2 snails (Fig. 7, Table 2). Although there
was some heterogeneity in the origin responses, the temperature × origin interaction was not significant
(Fig. 7, Table 2). At 28 weeks, only temperature had a significant effect on mass with snails at 20 and 24
°C being larger than those at 12 °C (Fig. 7, Table 2).
11
Fig. 7 Reaction norms for mean snail mass (±1SE) after 8, 16 and 28 weeks. Four snail populations were raised under four temperature conditions. Observe the different scaling of the y-axes. Table.2 Generalized Linear Model ANOVA. Analysis of snail mass in S. palustris after 8, 16 and 28 weeks at four temperature treatments (12, 16, 20 and 24 °C) and from four origins (ANG, OUT, BT1 and BT2). Source of Variation d.f. G² P(>|Chi|) Week 8
Treat Origin
Treat × Origin Week 16
Treat Origin
Treat × Origin Week 28
Treat Origin
Treat × Origin
3 3 8 3 3 9 3 3 9
5.0114 3.4043 1.4327 9.6393 2.6875 2.7951 2.9740 1.0311 2.5303
<0.001 <0.001 0.548 <0.001 0.004 0.136 0.001 0.136 0.137
12
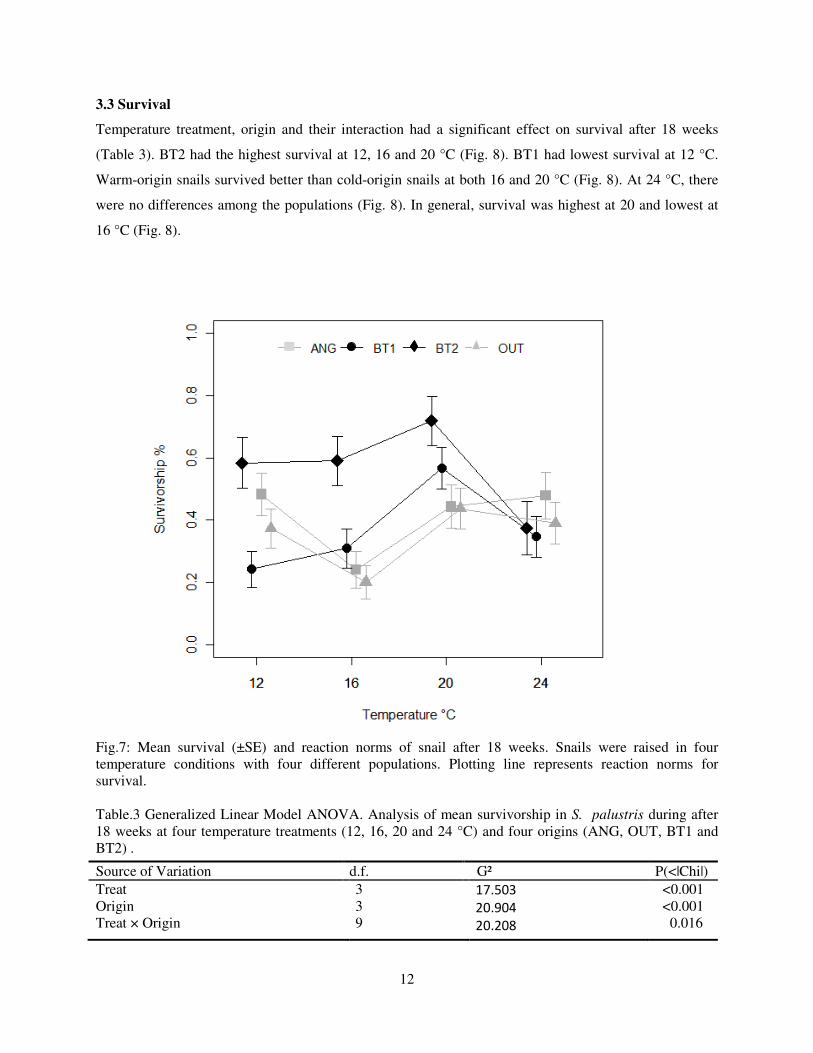
3.3 Survival
Temperature treatment, origin and their interaction had a significant effect on survival after 18 weeks
(Table 3). BT2 had the highest survival at 12, 16 and 20 °C (Fig. 8). BT1 had lowest survival at 12 °C.
Warm-origin snails survived better than cold-origin snails at both 16 and 20 °C (Fig. 8). At 24 °C, there
were no differences among the populations (Fig. 8). In general, survival was highest at 20 and lowest at
16 °C (Fig. 8).
Fig.7: Mean survival (±SE) and reaction norms of snail after 18 weeks. Snails were raised in four temperature conditions with four different populations. Plotting line represents reaction norms for survival. Table.3 Generalized Linear Model ANOVA. Analysis of mean survivorship in S. palustris during after 18 weeks at four temperature treatments (12, 16, 20 and 24 °C) and four origins (ANG, OUT, BT1 and BT2) .
Source of Variation d.f. G² P(<|Chi|) Treat Origin
Treat × Origin
3 3 9
17.503
20.904 20.208
<0.001 <0.001 0.016

13
4. Discussion:
I found that patterns both shell length and body mass increase varied among the populations and the
temperature treatments. In the beginning of the experiment, the shell length differed only among the
populations, but differed by both temperature and origin at weeks 6, 16 and 28. In general, both body
length and mass increased with increasing temperature up to 20 °C. The reaction norms for shell and body
mass were steepest for BT1 and lowest for BT2. Survival was differed among the populations and
temperatures with a significant interaction at week 18. In reaction norms for survival, BT1 showed
highest performance and BT2 lowest.
At the beginning of the experiment (when the snails were placed in the temperature treatments), snail
origin had a significant effect on shell length with snails from the warm origin (BT2) being significantly
smaller than those from the other three. Since snails had been raised in the same environment for three
generations, the size differences in the beginning are likely to be of genetic origin. This may be mediated
by egg size as it is common that larger eggs produce larger hatchlings (Mousseau and Fox 1998).
Variation in egg size can be adaptive among populations as selection can act on offspring (Mousseau and
Fox 1998, Angilletta 2009). Marshall and Keough (2008) argued that larger hatchlings from the bigger
eggs could have fitness advantage such as faster development and rapid development, survival, predation
defense and foraging from better energetic reserves. Theory suggests that offspring size in warmer
environment is smaller due to temperature-size relation strength status among genotypes (e.g. Atkinson et
al. 2003). For example, in the facultative planktotroph Clypeaster rosaceuson offspring from larger eggs
size selection had higher fitness in the next generation (Levintan 2000).
My first hypothesis was that growth would be highest at 24 °C, and lowest at 12 °C. Temperature had a
significant effect on growth, with shell length increasing with increasing temperature until 20 °C, but
shell length decreasing from 20 to 24 °C suggesting that these conditions were stressful for growth. As
temperatures up to 24 °C (and over) are frequent in the Biotest Basin during summer, this situation also
occurs in nature. Nevertheless, it may also possible that relatively larger snails had higher mortality at 24
°C. This can be the case if relatively larger snails have larger reproductive effort, which may increase
mortality under stressful conditions (Yampolsky and Scheiner 1996; in many fish species- Heath and
Blow 1998 reviewed in Mousseau and Fox 1998), or because of the higher oxygen demand in the larger
snails (Woods 1999). Kozlowski et. al (2004) modeled optimal resource allocation, and found that with a
higher mortality at increased temperatures, energy should be allocated from growth to reproduction. The
slower growth in cold temperatures can be explained by lower metabolic rates (Brockington and Clarke
2001).

14
As there were no strong temperature × origin interactions on shell length, my results do not support
thermal specialization. For the shell length, I may argue that there was evidence for cogradient variation.
The reaction norms for shell length show that BT1 had highest growth at 20 °C, but growth in BT1 was
similar to the cold origin populations at both 12 and 16 °C until week 16. Angilletta (2009) suggested that
a warmer population performing similarly in a cold environment is evidence for cogradient variation.
After 28 weeks though, BT1had shorter shells at 16 °C but longer at 20 °C suggesting local adaptation.
Although BT2 did not show similar growth to BT1, in general the reaction norm was close to those of the
cold origin populations except that shell length was smaller at 16 °C (after weeks 16 and 28), i.e. BT2
performed worse than the cold populations at cold temperatures, without being able to outperform them at
a warmer temperatures. Such a situation could suggest gene flow from the outside populations to BT2,
which can restrict local adaptation (Slatkin, 1987).
Like shell length, snail mass was influenced by both temperature and origin after 8 and 16 weeks, but
only by temperature after 28 weeks. Snail mass increased with increasing temperature until 20 °C.
Temperature × origin was nonsignificant at 8 and 16 weeks indicating that snail mass did not vary
differently in different temperatures suggesting that there was no local adaptation. As for shell length,
BT1 outperformed all other populations at 20C, and grew similarly to the cold populations at 12 and 16
°C until 16 weeks. This would follow expectations of cogradient variation (Angilletta 2009). Similar
results, demonstrating cogradient variation have been found in only a small number of other studies
(reviewed in Conover et al. 2009). Again similar to shell length, after 28 weeks there was evidence for
local adaptation (since weak interaction was detected in this stage): at 16 °C both cold populations
outperformed both warm populations, while at 20 °C the reverse was true for one of the warm populations
(BT1). Local adaptation has been shown in many species (marine species reviewed by e.g., Reznick and
Ghalambor 2001, Leimu and Fischer 2008, Sanford and Kelly 2011).
Large differences were found in snail survival between cold and warm origin populations. The difference
in survival was significant in terms of temperature, origin and their interaction. Since survival was
different in terms origin and temperature interaction, the results could suggest a local adaptation process
where cold-origin populations survive better at colder temperature and warm-origin populations at
warmer temperature (Angilletta 2009). However, cold origin populations had lower survival than warm
origin populations at both 16 °C and 20 °C. Although colder origin could be expected to survive better
under lower temperatures, some studies have reported results similar to mine (e.g., Merilä et al. 2000).
Additionally, survival rate did not follow the same pattern as growth in the two cold origin populations:

15
survival decreased from 12 to 16 °C while growth increased. Among the populations, BT2 had the highest
survival across temperatures from 12 – 20 °C. This can imply evidence for cogradient variation since BT2
from a warm origin and performed also better than the cold origin populations. Interestingly, BT2 had
lowest mass and shell length and completed its life cycle slowly compared to the other. This result may
suggest a tradeoff between rapid growth and survival in populations adapted to high temperatures
(Angilletta et al. 2004a).
I found that two populations subjected to increased temperatures for a 30 year period appeared to have
been able to rapidly adapt to the new conditions, but they did so by different means. One of the warm
populations (BT2) grew slower but outperformed all other populations when it came to survival. The
other warm population (BT1) showed evidence for cogradient variation and local adaptation in growth.
These results suggest a trade-off between growth and survival at high temperatures, which makes it
impossible to optimize both traits. But, Evidence for such trait-specific survivorship is still poor although
there are some recent examples (Angilletta, 2009). High temperatures may induce physiological
constraints to absorb limiting resources which may stimulate as small body size, early maturity or low
survival (Angilletta 2009). Furthermore, patterns of thermal adaptation depended on the age of
individuals. Until 16 and 18 weeks into the experiment, cogradient variation was found in growth and
survival, respectively. After 28 weeks, there was evidence for local adaptation in growth. Instead of
growth, it could also be possible that snails invest on reproduction under suboptimal conditions. Further
studies are needed to determine if this is the case.
An organism’s ability and strategies to adapt to changing temperatures depend on the biology of the
species. This study could be improved by including data on fecundity, offspring fitness and population
growth, as well as by putting the results in the context of species interactions in nature such as
competition, predation and parasitism. To be able to predict the effects of climate change and possibly
prevent species extinctions that may result in the loss of biodiversity and ecosystem functions,
assessments of species’ evolutionary potential to increased temperature are needed. Thus this small
aquatic invertebrate has helped in disclosing the effects of climate change and its impact on species.
16
Acknowledgements
I would like to thank my supervisor Dr. Anssi Laurila for valuable support and teaching me the ways of science. I would like to thank also to his PhD student Friederike Schulz for mentoring everything in the experiment, analysis and all valuable comments. I just want to say, “I don’t know how to repay your contribution”. Thanks to others in EBC, especially people from Population Biology and Conservation Biology Department.
References:
Angilletta Jr, M. J., Steury, T. D., and Sears, M. W., 2004a. Temperature, growth rate, and body size in ectotherms: fitting pieces of a life-history puzzle. Integrative and Comparative Biology 44:498–509. Angilletta Jr. M. J., 2009. Thermal adaptation. Oxford University Press, Oxford.
APHA, 1985. Standard methods for the examination of water and wastewater (16th Ed.). American Public Health Association.
Atkinson, D., Ciotti, B. J., and Montagnes, D. J. S., 2003. Protists decrease in size linearly with temperature: ca. 2.5% degrees C-1. Proceedings of the Royal Society B 270: 2605–2611. Beebee, T. J. C., 1995. Amphibian breeding and climate. Nature 374: 219-220.
Berthold, P., Helbig, A. J., Mohr, G., and Querner, U., 1992. Rapid Microevolution of migratory behavior in a wild bird species. Nature 360: 668-669.
Both, C., Margriet van Asch, Bijlsma, R. G., Burg, A. B., and Visser, M. E., 2009. Climate change and unequal phonological changes across 4 trophic levels: constraints or adaptations. Journal of Animal Ecology 78: 73–83.
Bradshaw, W. E., and Holzapfel, C. M., 2001. Genetic shift in photoperiodic response correlated with global warming. PNAS 98(25): 14509–14511.
Bradshaw, W. E., and Holzapfel, C. M., 2006. Evolutionary response to rapid climate change. Science, 312: 1477-1478.
Bradshaw, W. E., and Holzapfel, C. M., 2008. Genetic response to rapid climate change: It’s seasonal timing that matters. Molecular Ecology 17:157–166.

17
Brockington, S., and Clarke, A., 2001. The relative influence of temperature and food on the metabolism of a marine invertebrate. Journal of Experimental Marine Biology and Ecology 258(1): 87-99
Carlsson, R., 2006. Freshwater snail assemblages of semi-isolated brackish water bays on the Åland Islands, SW Finland. Boreal Environment Research 11: 371-382.
Chapin III, F. S., Zavaleta, E. S., Eviner, V. T., Naylor, R. L., Vitousek, P. M., Reynolds, H. L., Hooper, D. U., Lavorel, S., Sala, O. E., Hobbie, S. E., Mack, M. C., and Diaz, S., 2000. Consequences of changing biodiversity. Nature 405: 234-242 Charmantier, A., McCleery, R. H., Cole, L. R., Perrins, C., Kruuk, L. E. B., and Ben C. Sheldon, B., C., 2008. Adaptive phenotypic plasticity in response to climate change in a wild bird population. Science 320: 800.
Conover, O. D., and Present, T. M. C., 1990. Countergradient variation in growth rate: compensation for length of the growing among Atlantic silversides from different latitudes. Oecologia 83: 316-324.
Conover, O. D., and Schultz, T. E., 1995. Phenotypic similarity and the evolutionary significance of countergradient variation. Trends in Ecology and Evolution 10(6): 248-252.
Conover, O. D., Duffy, A. T., and Hice, A. L., 2009. The covariance between genetic and environmental influences across ecological gradients. Annals of the New York Academy of Science 1168: 100-129.
Fiskeriverket 2010. Biologisk recipientkontroll vid Forsmarks kärnkraftverk (Årsrapport för 2010). Sweden.
Gilchrist, G. W., 1995. Specialists and generalists in changing environments. I. Fitness landscapes of thermal sensitivity. American Naturalist 146:252–270. Grimm, N. B., Faeth, S. H., Golubiewski, N. E., Redman, C. L., Wu, J. G., Bai, X. M., and Briggs, J. M., 2008. Global change and the ecology of cities. Science 319:756–760.
Holt, R. D., 1990. The mocroevolutionary consequences of climate change. Trends in Ecology & Evolution 5: 311-315.
Hooper, D. U., Chapin, F. S., Ewel, J. J., Hector, A., Inchausti, P., Lavorel, S., 2005. Effects of biodiversity on ecosystem functioning: a consensus of current knowledge. Ecological Monographs 75: 3-35
Intergovernmental Panel on Climate Change 2007. Synthesis Report: Contribution of Working Groups I, II and III to the Fourth Assesment Report of the IPCC.
Kawecki, T., J., and Ebert, D., 2004. Conceptual issues in local adaptation. Ecology Letters 7: 1225–1241.

18
Kozłowski, J., Czarnołeski, M., and Danko, M., 2004. Can optimal resource allocation models explain why ectotherms grow larger in cold? Integrative and Comparative Biology 44:480–493.
Leimu, R., and Fischer, M., 2008. A meta-analysis of local adaptation in plants. PLoSOne 3: 1-8.
Levintan, D. R., 2000. Optimal egg size in marine invertebrates: theory and phylogenetic analysis of the critical relationship between egg size and development time in Echniods. American Naturalist 156:175-192. Logan, M., 2010. Biostatistical Design and Analysis Using R. John Willey, New York.
Luksiene, D., Sandström, O., Lounasheimo, L., and Andersson, J., 2000. The effects of thermal effluent exposure on the gametogenesis of female fish. Journal of Fish Biology 56: 37–50.
Lynch, M., andGabriel, W., 1987. Environmental tolerance. American Naturalist 129:283–303. Marshall, D., and Keough, M., J., 2008. The evolutionary ecology of offspring size in marine invertebrates. Advances in Marine Biology 53: 1-60.
Menzel, A., and Fabian, P., 1999. Growing season extended in Europe. Nature 397: 659.
Merila, J., Laurila, A., Laugen, A. T., Rasanen, K., and Pahkala, M., 2000. Plasticity in age and size at metamorphosis in Rana temporaria – comparison of high and low latitude populations. Ecography 23:457–465.
Mousseau, T. A., and Fox, C. W., 1998. Maternal Effects as adaptations. Oxford University Press. Oxford.
Quinn, G., and Keough, M., J., 2002. Experimental design and data analysis for biologists. Cambridge University Press. Cambridge.
Reznick, D. N., and Ghalambor, C. K., 2001. The population ecology of contemporary adaptation: What empirical studies reveal about the conditions that promote adaptive evolution. Genetica 112-113: 183-198
Sandström, O., Abrahamsson, I., Andersson, J., and Vetemaa, M., 1997. Temperature effects on spawning and egg development in Eurasian perch. Journal of Fish Biology 51: 1015–1024.
Sanford, E., and Kelly, M. W., 2011. Local adaptation in marine invertebrates. Annual Review of Marine Science 3: 509-535.
Slatkin, M., 1987. Gene flow and the geographic structure of natural populations. Science 236: 787-792.
Svensson, R., and Wigren- Svensson, M., 1992. Effects of cooling water discharge on the vegetation in the Forsmark Biotest Basin, Sweden. Aquatic Botany 42: 121-141.

19
Thomas, C. D., Hill, J. K., Anderson, B. J., Bailey, S., Beale, C. M., Bradbury, R. B., Bulman, C. R., Crick, H. Q. P., Eigenbrod, F., Griffiths, H. M., Kunin, W. E., Oliver, T. H., Walmsley, C. A., Watts, K., Worsfold, N. T., and Yardley, T. 2011. A framework for assessing threats and benefits to species responding to climate change. Methods in Ecology and Evolution 2: 125-142
Vattenfall 2009. Miljöeffekter av stora kylvattenutsläpp. Elforsk rapport nr 09:79.
Woods, H. A., 1999. Egg-mass size and cell size: effects of temperature on oxygen distribution. American Zoologist 39: 244–252. Yampolsky, L. Y., and Scheiner, S. M., 1996. Why larger offspring at lower temperatures? A demographic approach. American Naturalist 147:86–100.