adapting development improving services to the poor
TRANSCRIPT

Adapting development Improving services to the poor
Leni Wild David Booth Clare Cummings Marta Foresti Joseph Wales
RepoRt February 2015

This material has been funded by UK aid from the UK Government, however the views expressed do not necessarily re�ect the UK Government’s of�cial policies.
This material has been funded by UK aid from the UK Government, however the views expressed do not necessarily re�ect the UK Government’s of�cial policies.
Overseas Development Institute203 Blackfriars RoadLondon SE1 8NJ
Tel. +44 (0) 20 7922 0300 Fax. +44 (0) 20 7922 0399 E-mail: [email protected]
www.odi.org www.odi.org/facebook www.odi.org/twitter
Readers are encouraged to reproduce material from ODI Reports for their own publications, as long as they are not being sold commercially. As copyright holder, ODI requests due acknowledgement and a copy of the publication. For online use, we ask readers to link to the original resource on the ODI website. The views presented in this paper are those of the author(s) and do not necessarily represent the views of ODI.
© Overseas Development Institute 2015. This work is licensed under a Creative Commons Attribution-NonCommercial Licence (CC BY-NC 3.0).
ISSN: 2052-7209
Cover photo: Matunduzi School, Girls Education Support Initiative, Malawi. © Erik Törner.
Adapting development: Improving services to the poor 3
Contents
Acknowledgements 5
Abbreviations and acronyms 5
Executive summary 6
What’s at stake? 7
Institutions: why standard approaches often fail 7
Doing things differently 8
A fresh approach to the politics of aid 9
1 ‘More of the same’ will not be enough 10
2 What’s at stake: the implications of ‘more of the same’ 15
2.1 Projections of progress 15
2.2 More than just money 18
2.3 What else matters? 21
3 Institutions for better service delivery: why standard approaches often fail 22
3.1 Governance ideals and development goals 23
3.2 Capability traps and government signals 24
3.3 Changing the approach 25
4 Doing things differently 26
4.1 Politically informed, politically smart and problem-driven 27
4.2 Adaptive and entrepreneurial 33
4.3 Taking action that is locally led 37
5 A fresh approach to the politics of aid 39
5.1 Aiding development that is locally led and politically smart 40
5.2 A stronger orientation towards results 41
5.3 How aid works, not how much 43
5.4 An honest public dialogue 44
6 Conclusions 45
Statistical annex 47
Data sources 48
References 51
List of tables, figures and boxes
Tables
Table 1: Which countries in sub-Saharan Africa will have achieved 100% access to a health
professional at births by 2020? 18
Figures
Figure 1: Years by which all children will be completing primary school in selected countries, according
to current projections 15
Figure 2: Years by which selected countries will achieve 100% coverage of improved water sources, according
to current projections 16
Figure 3: Years by which selected countries will achieve 100% coverage of improved sanitation, according
to current projections 16
Figure 4: Widening schooling gap between richest and poorest 17
Figure 5: What will sub-Saharan Africa’s high-growth performers have achieved by 2030? 19
Figure 6: Growth leaders in sub-Saharan Africa – what does growth in per capita income mean for service provision? 20
Figure 7: ‘Good governance’ versus capacity to deliver 23
Boxes
Box 1: From the Millennium Declaration to the Sustainable Development Goals 11
Box 2: The ‘Doing Development Differently’ manifesto 13
Box 3: Examples of isomorphic mimicry 25
Box 4: Medicine stock outs, Malawi and Tanzania 28
Box 5: Adapting local governance solutions in Malawi 29
Box 6: Attempting a problem-driven iterative approach to public-sector reform in Mozambique 30
Box 7: Community scorecards in Malawi 31
Box 8: Key questions to identify service characteristics 32
Box 9: Prioritisation in education 32
Box 10: Aiding tax and land rights reform in the Philippines 35
4 ODI Report
Adapting development: Improving services to the poor 5
Box 11: State Accountability and Voice Initiative (SAVI) in Nigeria 56
Box 12: Examples of aid that is locally led and politically smart 41
Box 13: Funding mechanisms to enable, not distort, local entities 41
Box 14: Actionable metrics linked to multiple, time-specific theories of change 43
Abbreviations and acronymsDFID UK Department for International Development
DHS Demographic and Health Survey
LIC Low-income country
MDGs Millennium Development Goals
MIC Middle-income country
MICS Multiple Indicator Cluster Survey
ODI Overseas Development Institute
PFM Public financial management
PISA Programme for International Student Assessment
SACMEQ Southern Africa Consortium for Monitoring Educational Quality
SDGs Sustainable Development Goals
TIMSS Trends in International Mathematics and Science Study
UNESCO United Nations Educational, Scientific and Cultural Organization
UNESCO-UIS UNESCO Institute of Statistics
USAID United States Agency for International Development
WDI World Development Indicators
WHO World Health Organization
WHO-UNICEF World Health Organization/UNICEF Joint Monitoring Programme for Water Supply and Sanitation
WIDE World Inequality Database on Education
JMP
AcknowledgementsThis report draws on research and contributions from across the Overseas Development Institute (ODI) and was made possible as the result, in part, of an Accountable Grant from the UK Department for International Development (DFID). We are grateful to all those who contributed to and commented on the draft of this report, including Lisa Denney, Ishbel Matheson, Tam O’Neil, and Maria Quattri. We are particularly grateful to our peer reviewers, Kevin Watkins, and Sue Unsworth, for useful feedback and to Angela Hawke for her excellent editing. Responsibility for the content of the report rests with the authors.

Executive summary

Adapting development: Improving services to the poor 7
2015 will see renewed global commitments to sustainable human development. It is clear that there is much to be done, and that new challenges have emerged since the global agreement on the Millennium Development Goals (MDGs) back in 2000. But there is less clarity on what kind of effort is now needed to deliver lasting development, and there is a big danger that new international commitments will rely on ‘more of the same’. Current projections suggest that if we continue along our current path, it will be decades – if not longer – before the world’s most disadvantaged people have access to basic services of adequate quality.
Meeting this challenge demands a radical departure from the MDG approach: extra funding will not be enough, and broad calls for ‘good governance’ or ‘inclusive institutions’ will miss the point. This report argues that if we are to avoid reproducing the pattern of uneven progress that has characterised the MDG campaign, there must be more explicit recognition of the political conditions that sometimes enable, but so often obstruct, development progress. In this context, domestic reformers and their international partners must pursue innovative and politically smart ways to tackle the most intractable problems. The report is, therefore, aimed at governments, domestic reformers and at the external actors (donor agencies, NGOs and others) that can support them better to do development differently.
What’s at stake?There is no doubt that the MDG ‘progress report’ is mixed. Estimates of the time it will take different countries to achieve full access to quality services, based on recent trends, reveal the dangers of relying on more of the same.
• Only 10 of the 33 sub-Saharan African countries for which we have data will have all children completing primary school by 2020, on current projections. For almost 30% of them, this basic benchmark will not be met in rural areas for more than a generation.
• Only three countries in sub-Saharan Africa for which we have data are projected to achieve improved sanitation for all by 2030, with the vast majority of countries taking until 2100 or beyond. In Kenya, it will still take almost five generations to achieve complete sanitation coverage, or nearly 150 years.
• Even in sectors where access and quality is improving overall – such as access to improved drinking water sources – this is still far too slow in some countries; according to current projections, Burundi, Lesotho and Rwanda will only achieve full coverage by 2100.
In most countries in sub-Saharan Africa, the gap in access to quality services between the richest and the poorest is still very wide and projected to remain so. In Ghana, for example, there is a 76-year gap between when
the richest and the poorest are projected to have access to a skilled health professional during childbirth – well over two generations. There is a similar story for education: averaging across the region rich, urban boys will all be completing primary school 65 years before this target is achieved for all poor, rural girls (UNESCO, 2014).
Economic growth and additional spending will be important parts of the response to such challenges, but will not be enough. Analysis of the projections for countries with similar and relatively high rates of economic growth points to very diverse outcomes. Even where growth does lead to increased government revenue, this does not always translate into higher public spending on service sectors that are lagging behind, and there are continuing signs that higher spending on sectors does not guarantee better sector outcomes.
Some of this unevenness stems from the ways countries prioritise different sectors. Policy choices based on political priorities and motivations also explain varied outcomes when the levels of funding appear to be similar. Outcomes often depend on whether and how policies are implemented, through effects on people’s motivations and behaviour. Much of this is about institutions – the formal and informal ‘rules of the game’ that shape how politics works and how policies are delivered. But, while there is widespread recognition of the relevance of governance to improving service delivery, this is another area where it would be mistaken to rely on the approaches that seemed sufficient during the MDG period.
Institutions: why standard approaches often failAs well as adequate financing, effective and equitable service delivery does require supportive governance – where governance refers to how authority, decision making and accountability operate. Yet calls for far-reaching institutional reforms under the banner of ‘good governance’ often fail to capture the way in which governance operates in reality and how it affects development outcomes. They do not recognise relevant historical experience or the range of institutions that can support better performance.
Targets for institutional improvement proposed in relation to the new Sustainable Development Goals (SDGs) fail to connect with relevant evidence in three ways:
• their reliance on international models of ‘best practice’, rather than models that are feasible in difficult political contexts
• their assumption that ‘all good things go together’ when it comes to governance, peaceful societies and development
• their neglect of the possibility that governments adopt recommended policies or institutions in a formal way only, leaving real problems unresolved.
The SDG campaign should not fuel yet more cosmetic change: it needs to be grounded in realistic assumptions
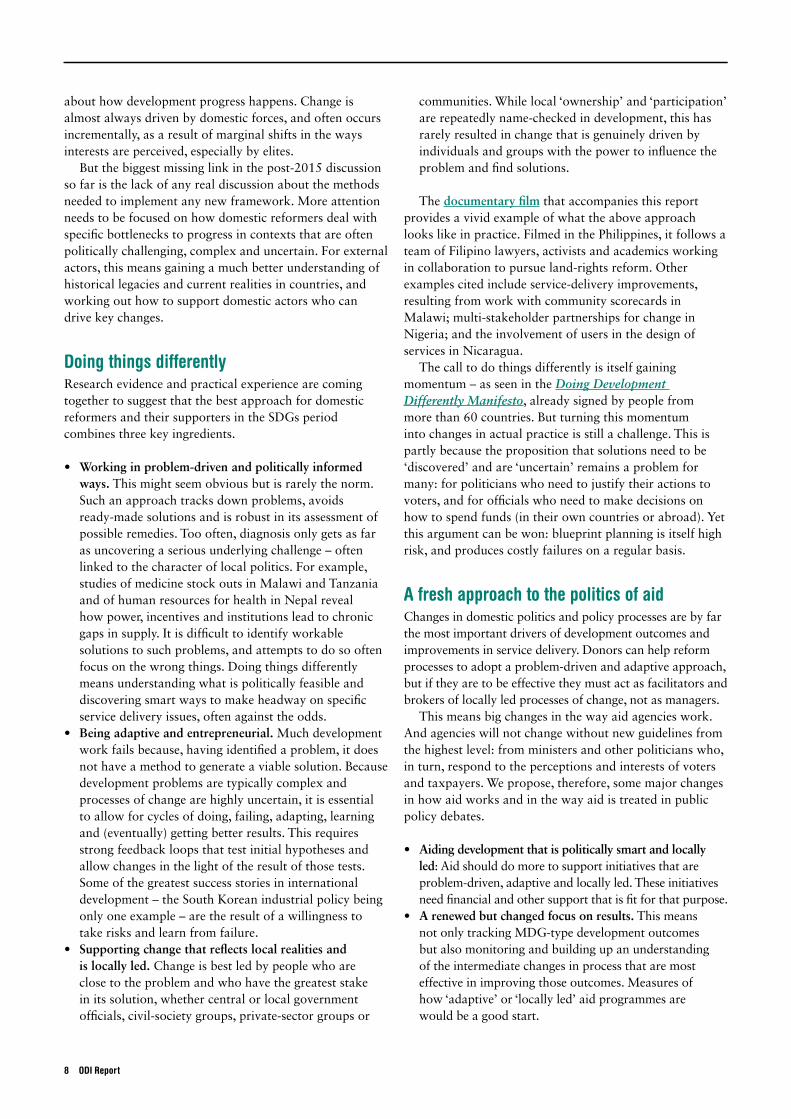
about how development progress happens. Change is almost always driven by domestic forces, and often occurs incrementally, as a result of marginal shifts in the ways interests are perceived, especially by elites.
But the biggest missing link in the post-2015 discussion so far is the lack of any real discussion about the methods needed to implement any new framework. More attention needs to be focused on how domestic reformers deal with specific bottlenecks to progress in contexts that are often politically challenging, complex and uncertain. For external actors, this means gaining a much better understanding of historical legacies and current realities in countries, and working out how to support domestic actors who can drive key changes.
Doing things differentlyResearch evidence and practical experience are coming together to suggest that the best approach for domestic reformers and their supporters in the SDGs period combines three key ingredients.
• Working in problem-driven and politically informed ways. This might seem obvious but is rarely the norm. Such an approach tracks down problems, avoids ready-made solutions and is robust in its assessment of possible remedies. Too often, diagnosis only gets as far as uncovering a serious underlying challenge – often linked to the character of local politics. For example, studies of medicine stock outs in Malawi and Tanzania and of human resources for health in Nepal reveal how power, incentives and institutions lead to chronic gaps in supply. It is difficult to identify workable solutions to such problems, and attempts to do so often focus on the wrong things. Doing things differently means understanding what is politically feasible and discovering smart ways to make headway on specific service delivery issues, often against the odds.
• Being adaptive and entrepreneurial. Much development work fails because, having identified a problem, it does not have a method to generate a viable solution. Because development problems are typically complex and processes of change are highly uncertain, it is essential to allow for cycles of doing, failing, adapting, learning and (eventually) getting better results. This requires strong feedback loops that test initial hypotheses and allow changes in the light of the result of those tests. Some of the greatest success stories in international development – the South Korean industrial policy being only one example – are the result of a willingness to take risks and learn from failure.
• Supporting change that reflects local realities and is locally led. Change is best led by people who are close to the problem and who have the greatest stake in its solution, whether central or local government officials, civil-society groups, private-sector groups or
communities. While local ‘ownership’ and ‘participation’ are repeatedly name-checked in development, this has rarely resulted in change that is genuinely driven by individuals and groups with the power to influence the problem and find solutions.
The documentary film that accompanies this report provides a vivid example of what the above approach looks like in practice. Filmed in the Philippines, it follows a team of Filipino lawyers, activists and academics working in collaboration to pursue land-rights reform. Other examples cited include service-delivery improvements, resulting from work with community scorecards in Malawi; multi-stakeholder partnerships for change in Nigeria; and the involvement of users in the design of services in Nicaragua.
The call to do things differently is itself gaining momentum – as seen in the Doing Development Differently Manifesto, already signed by people from more than 60 countries. But turning this momentum into changes in actual practice is still a challenge. This is partly because the proposition that solutions need to be ‘discovered’ and are ‘uncertain’ remains a problem for many: for politicians who need to justify their actions to voters, and for officials who need to make decisions on how to spend funds (in their own countries or abroad). Yet this argument can be won: blueprint planning is itself high risk, and produces costly failures on a regular basis.
A fresh approach to the politics of aidChanges in domestic politics and policy processes are by far the most important drivers of development outcomes and improvements in service delivery. Donors can help reform processes to adopt a problem-driven and adaptive approach, but if they are to be effective they must act as facilitators and brokers of locally led processes of change, not as managers.
This means big changes in the way aid agencies work. And agencies will not change without new guidelines from the highest level: from ministers and other politicians who, in turn, respond to the perceptions and interests of voters and taxpayers. We propose, therefore, some major changes in how aid works and in the way aid is treated in public policy debates.
• Aiding development that is politically smart and locally led: Aid should do more to support initiatives that are problem-driven, adaptive and locally led. These initiatives need financial and other support that is fit for that purpose.
• A renewed but changed focus on results. This means not only tracking MDG-type development outcomes but also monitoring and building up an understanding of the intermediate changes in process that are most effective in improving those outcomes. Measures of how ‘adaptive’ or ‘locally led’ aid programmes are would be a good start.
8 ODI Report
Adapting development: Improving services to the poor 9
• An explicit refocusing of the debate on how aid works, not the total volume spent. There are many areas where spending that benefits poor countries could be increased, but the current debate about targets for aid spending is too focused on the ability of the donor country to pay, rather than whether those funds are used effectively. Looking at how aid works is more important than how much to spend.
• A new and more honest dialogue about development and aid with the public. According to recent evidence, ordinary citizens in donor countries are often irritated by simple ‘heart strings’ appeals. Many would welcome a frank discussion on how development happens, why it is often difficult and how aid can best support development that is both genuine and lasting. Efforts to support such a debate should be scaled up.
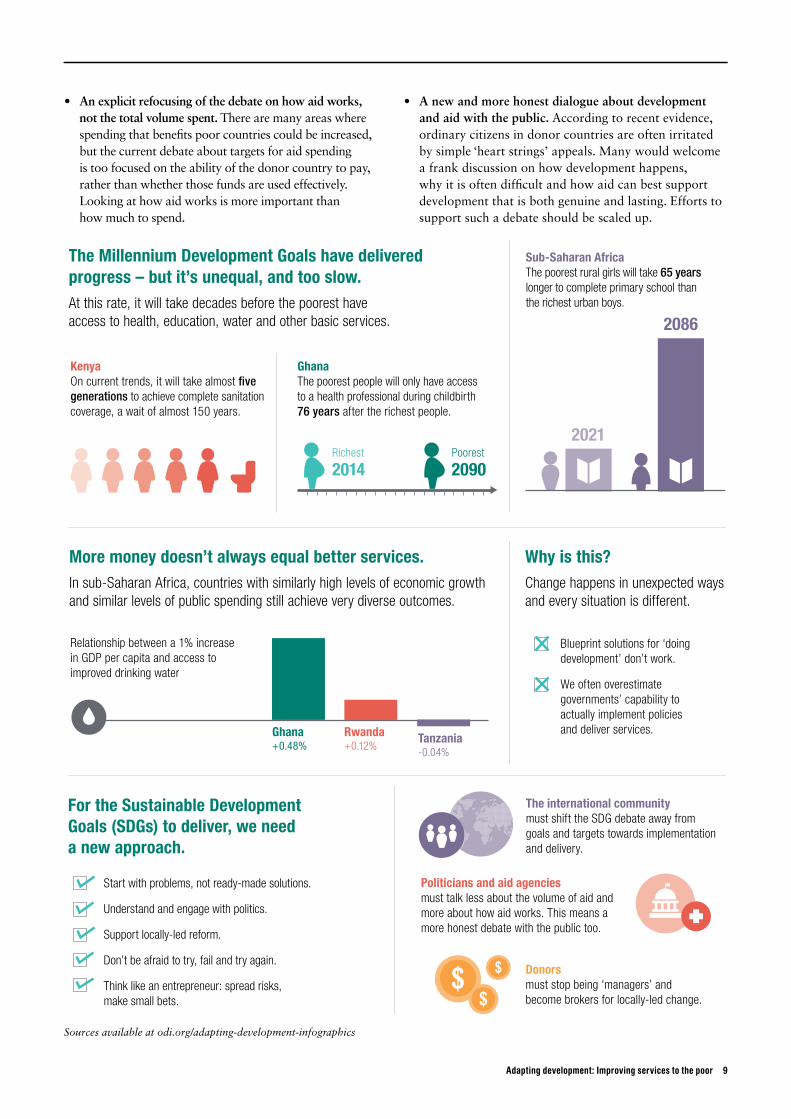
The Millennium Development Goals have delivered progress – but it’s unequal, and too slow. At this rate, it will take decades before the poorest have access to health, education, water and other basic services.
Sub-Saharan AfricaThe poorest rural girls will take 65 years longer to complete primary school than the richest urban boys.
More money doesn’t always equal better services. In sub-Saharan Africa, countries with similarly high levels of economic growth and similar levels of public spending still achieve very diverse outcomes.
KenyaOn current trends, it will take almost five generations to achieve complete sanitation coverage, a wait of almost 150 years.
GhanaThe poorest people will only have access to a health professional during childbirth 76 years after the richest people.
Richest
2014Poorest
2090
2021
2086
Why is this?Change happens in unexpected ways and every situation is different.
For the Sustainable Development Goals (SDGs) to deliver, we need a new approach.
Politicians and aid agencies must talk less about the volume of aid and more about how aid works. This means a more honest debate with the public too.
Donors must stop being ‘managers’ and become brokers for locally-led change.
The international community must shift the SDG debate away from goals and targets towards implementation and delivery.
Ghana +0.48%
Rwanda +0.12%
Tanzania -0.04%
Relationship between a 1% increase in GDP per capita and access to improved drinking water
Start with problems, not ready-made solutions.
Understand and engage with politics.
Support locally-led reform.
Don’t be afraid to try, fail and try again.
Think like an entrepreneur: spread risks, make small bets.
Blueprint solutions for ‘doing development’ don’t work.
We often overestimate governments’ capability to actually implement policies and deliver services.
Sources available at odi.org/adapting-development-infographics

1 ‘More of the same’ will not be enough
As UN member states gather in 2015 to agree a new set of international development goals, it is hard not to feel ambivalent. Over the 25 years covered by the Millennium Development Goals (MDGs), the impressive global achievements caused by fast progress in some large, mainly East Asian, countries and rapid gains in particular sectors in parts of sub-Saharan Africa contrast with highly uneven progress and gloomy prospects for increasing numbers of poor and marginalised people in many countries. The gaps between the better off and the worse off, among countries and within them, have grown almost everywhere. The implications are alarming for both the absolute numbers of people projected to be living with extreme deprivation for decades to come, and for slow rates of progress for some groups.
How many of the new international commitments, on such basic things as access to primary health or education or adequate sanitation are destined to remain unmet over the next 25 years? Will the experience of the Sustainable Development Goals (SDGs – Box 1) replicate the MDG experience, generating uneven and inequitable progress?
As always, past performance is not a reliable guide to the future. What is clear is that ‘more of the same’ will not be enough to close persistent gaps in outcomes between and within countries. As we show in this report, current approaches to development will leave many of the world’s most vulnerable people not just in poverty, but without access to the basic services they need to live their lives with dignity and hope.
This report aims, therefore, to influence national governments heading into negotiations on the SDG framework, as well as the operational agencies responsible for its implementation. It highlights what needs to change to realise the objective of better services for all and sets out some propositions on how improvements come about in different sectors. Part of what needs to change, we argue, is how international aid operates and how donor organisations (national governments, intergovernmental, non-governmental) approach development at present.
Recent discussions around the SDGs show some recognition that the world has changed in important ways since the MDGs were adopted in 2000, and that just doing ‘more of the same’ will not be enough. While the aggregate target of halving extreme poverty was met five years before the 2015 deadline, there is growing concern about widening inequalities among and within countries. These inequalities have the potential to slow the pace of poverty reduction and mean that, in the future, such gaps and disparities will not just be a problem for countries labelled as ‘low income’. Many more of the world’s poor people are projected to live in middle-income countries in the years to come (Sumner, 2012).
Where progress has been possible, it has also highlighted the full scale of the challenge ahead. In 2000, for example, world leaders signed up to promote universal primary education, prompting significant mobilisation around children’s enrolment in schools. In 2015, the debate is
much more about the quality of children’s learning – recognising that while school attendance has improved (though big gaps still remain in some countries), keeping children in school and improving their learning has proved more difficult (Pritchett, 2013; Nicolai et al., 2014).
Climate change, resilience and more inclusive and sustainable patterns of economic growth are also all far higher on the agenda than they were in 2000. The global challenge of climate change connects the actions of poor and rich countries, requiring all countries to find new and greener strategies to improve people’s lives. The good news is that there is widespread recognition of these challenges, even if practical proposals to meet them are lagging behind.
In other respects, however, there is too little recognition that a radical departure from the MDG approach is necessary. To begin with, the MDGs were linked to the idea of financing gaps, giving rise to the assumption that better development outcomes were possible if only additional aid money was raised and then channelled into the funding of priority services. Another belief has also gained ground as economic growth has accelerated in some of the world’s poorer developing regions: that economic growth and higher public spending alone will, by themselves, address the main problems. This is, however, a dangerous illusion. Adequate funding is – at best – one of several conditions that need to be met if SDG outcomes are to differ significantly from those of the MDGs.
Similarly, calls for far-reaching institutional reforms under the banner of ‘good governance’ do not address the real ‘missing links’ in development. To the extent that there is an international consensus on the conditions that
Adapting development: Improving services to the poor 11
Box 1: From the Millennium Declaration to the Sustainable Development Goals
In 2000, UN member states adopted the UN Millennium Declaration, committing to achieve a series of time-bound targets by 2015, which became known as the Millennium Development Goals. Eight goals were agreed, ranging from halving the 1990 rates of extreme poverty to providing universal primary education and stopping the spread of HIV and AIDs. All countries and leading development organisations signed up to these goals. In 2012, UN member states came together again at the UN Conference on Sustainable Development in Rio, Brazil, for what was called the ‘Rio+20 Conference’. One of the main outcomes was the agreement, by member states, to launch a process to develop a set of Sustainable Development Goals (SDGs). These would build on the MDGs and converge with what became known as the ‘post-2015’ development agenda (the debate on what would happen to the MDGs that had not been met by the 2015 deadline). The SDGs, their targets and the financing needed for their achievement, will be agreed in 2015.
need to be satisfied (other than adequate funding), this often relies on broad-brush advocacy for good governance. Large claims are made in influential places about ‘inclusive institutions’ are backed by the rule of law as preconditions for sustained growth and human development (Acemoglu and Robinson, 2012; Cameron, 2012). Yet these claims sit uneasily with the evidence. The development successes of countries like Indonesia and Malaysia since the 1960s, and China and Viet Nam since the 1980s, place large question marks over conventional assumptions about governance. For example, while India outperforms China on standard indicators for democratic accountability, the position is reversed on growth and poverty reduction.
A more realistic understanding of how developmental change happens is needed. This must start by recognising a basic lesson from history: that when they occur, development breakthroughs are domestically driven, cumulative, untidy and unpredictable. They depend on political forces that outsiders cannot easily influence, even if those outsiders strive to understand them. Both domestic reformers and their international partners should, therefore, consider spending less time on grand designs and more on tracking down specific problems and finding practical and politically smart ways to solve them.
This is the central conclusion to which the authors of this report have been led by three years of applied research into the political economy of basic public goods and service delivery.1 Building on the findings of the Africa Power and Politics Programme (2007-2012), our work has tested and refined key hypotheses in different operational contexts. It has involved close collaboration with donor agencies at global and country levels as well as a range of non-governmental organisations (NGOs) and other local actors working on the ground in Africa and Asia. This has generated fresh evidence from around the world on what works in practice to alleviate constraints on access to, and the quality of, basic public services. Based on this experience, our views have converged with those of many others (see Box 2) who, from a variety of starting points, have been exploring and advocating radically different ways of working on stubborn development problems. This report presents some of the evidence and explains some of the reasoning behind this convergence.
The basis for a more realistic approach to governance for development has been laid by the now numerous critiques of the post-Cold War ‘good governance’ discourse (Andrews, 2008; Noman et al., 2012; Sundaram and Chowdhury, 2012; Kelsall, 2013; Henley, 2015; Levy, 2014). These start by recognising that social, economic and political contexts tend to generate weak incentives for powerful actors to support the provision of public goods and collective problem solving. In reality, informal arrangements and practices undermine formal institutions
and agreements with donors. This does not mean that progress is impossible. It does, however, suggest a different set of hypotheses about the qualities of institutions and governance that matter for development, including the capacity to deliver, the ability to motivate performance and the ‘fit’ between formal and informal rules. Importantly, the critical differences do not revolve around old controversies about the relative virtues of authoritarianism and democracy (Kelsall, 2014). A more nuanced take is needed on the variety of institutional arrangements that can deliver developmental outcomes.
The international debate about the governance challenges of the SDGs has not yet taken on board the implications of such critiques and, as a result, the threat of more of the same is, again, a very real one. What is most signally missing from the debate is any real discussion about method – about how domestic reformers and international actors can work together effectively to achieve desirable changes in contexts that are both politically challenging and complex. This requires a better understanding of how historical legacies, structures, and institutions shape the incentives of powerful actors. Rather than advocating ‘best practice’ reforms that do not take these realities into account, external actors should focus instead on connecting with domestic actors who are already working to bring about reform and change.
In recent years, alongside research that questions particular remedies for bad governance, a broader assault has been made on the whole idea of promoting blanket solutions to development problems (Pritchett and Woolcock, 2008). This argues that it is just common sense to start with problems and then look for appropriate solutions that are workable in the specific context, including all of its political complexities. Yet development practice is notorious for being addicted to fashionable generic remedies – such as privatisation, budget support, payment by results – and trying to apply these to a wide range of problems.
For those leading this assault, diagnosis needs to come before prescription (Rodrik, 2010) and institutional development should aim not at ‘best practice’ but at a ‘good fit’ with country realities (Fritz et al., 2014). Good fit entails discovering ways of identifying and coordinating particular interests, particularly among elites, that can be harnessed to support some aspect of development. It implies being astute and tactical in the choice of objectives and allies, made on the basis of excellent local knowledge and strong networks. Given the complexity of most development challenges, initiatives should be designed in ways that are not only problem-driven but also iterative and adaptive – that include, in other words, a strong element of trial and error (Andrews, 2013; Andrews et al., 2013). Finding workable solutions to persistent
1 Much of this work has been funded by an Accountable Grant from the UK’s Department for International Development.
12 ODI Report
problems through trial and error is the single, universal and transferable lesson from development breakthroughs in history and across the world.
These are some of the themes encompassed by the ‘Doing Development Differently’ principles that were captured in November 2014 in a Manifesto issued by a small group of researchers, funders and practitioners – principles that have already attracted wide support from individuals and organisations across the globe (Box 2).
The growing support for such principles poses a radical challenge to current practices in many developing countries and within most international development agencies. Yet this challenge can no longer be ignored if we are to ensure that in 15 years, the international community is not having the same conversation as it is having today, after failing to achieve many of the targets agreed in 2015.
Adapting development: Improving services to the poor 13
Box 2: The ‘Doing Development Differently’ manifesto
At a workshop in late 2014, a small group of funders, practitioners and researchers came together to examine recent development successes and understand precisely how they had worked. Looking across a range of examples, six principles for ‘Doing Development Differently’ were identified. These were:
• focus on solving local problems that are debated, defined and refined by local people in an ongoing process • legitimise reform at all levels (political, managerial and social), building ownership and momentum throughout
the process • work through conveners who mobilise all those with a stake in progress (in both formal and informal coalitions
and teams) to tackle common problems and introduce relevant change • blend design and implementation through rapid cycles of planning, action, reflection and revision (drawing on local
knowledge, feedback and energy) to foster learning from both success and failure • manage risks by making ‘small bets’: pursuing activities with promise and dropping others • foster real results – real solutions to real problems that have real impact: they build trust, empower people and
promote sustainability.
These principles form the basis of a ‘Doing Development Differently’ manifesto, signed by more than 400 people, with signatories from 60 countries including Afghanistan, Cambodia, Cameroon, Central African Republic, Ecuador, Egypt, Colombia, Kenya, India, Indonesia, Malawi, Mexico, Nigeria, South Africa, Senegal, Tanzania and more.
To find out more, visit: www.doingdevelopmentdifferently.com
2 What’s at stake: the implications of ‘more of the same’
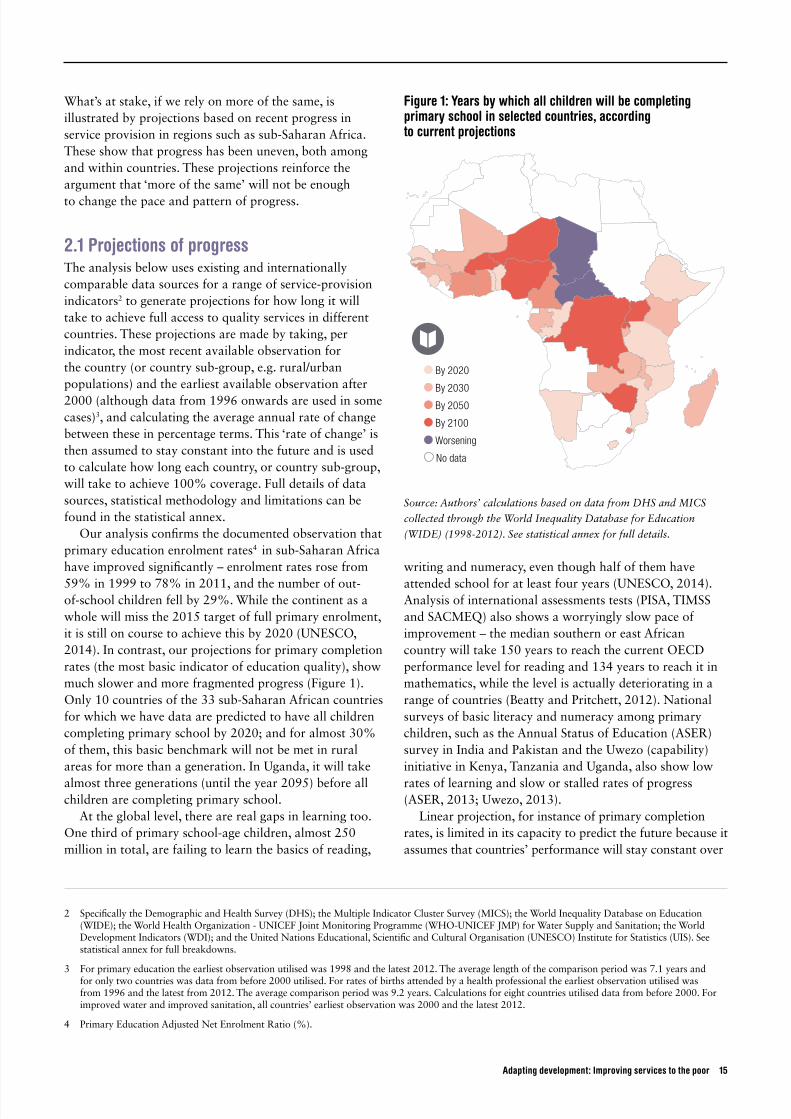
What’s at stake, if we rely on more of the same, is illustrated by projections based on recent progress in service provision in regions such as sub-Saharan Africa. These show that progress has been uneven, both among and within countries. These projections reinforce the argument that ‘more of the same’ will not be enough to change the pace and pattern of progress.
2.1 Projections of progressThe analysis below uses existing and internationally comparable data sources for a range of service-provision indicators2 to generate projections for how long it will take to achieve full access to quality services in different countries. These projections are made by taking, per indicator, the most recent available observation for the country (or country sub-group, e.g. rural/urban populations) and the earliest available observation after 2000 (although data from 1996 onwards are used in some cases)3, and calculating the average annual rate of change between these in percentage terms. This ‘rate of change’ is then assumed to stay constant into the future and is used to calculate how long each country, or country sub-group, will take to achieve 100% coverage. Full details of data sources, statistical methodology and limitations can be found in the statistical annex.
Our analysis confirms the documented observation that primary education enrolment rates4 in sub-Saharan Africa have improved significantly – enrolment rates rose from 59% in 1999 to 78% in 2011, and the number of out-of-school children fell by 29%. While the continent as a whole will miss the 2015 target of full primary enrolment, it is still on course to achieve this by 2020 (UNESCO, 2014). In contrast, our projections for primary completion rates (the most basic indicator of education quality), show much slower and more fragmented progress (Figure 1). Only 10 countries of the 33 sub-Saharan African countries for which we have data are predicted to have all children completing primary school by 2020; and for almost 30% of them, this basic benchmark will not be met in rural areas for more than a generation. In Uganda, it will take almost three generations (until the year 2095) before all children are completing primary school.
At the global level, there are real gaps in learning too. One third of primary school-age children, almost 250 million in total, are failing to learn the basics of reading,
writing and numeracy, even though half of them have attended school for at least four years (UNESCO, 2014). Analysis of international assessments tests (PISA, TIMSS and SACMEQ) also shows a worryingly slow pace of improvement – the median southern or east African country will take 150 years to reach the current OECD performance level for reading and 134 years to reach it in mathematics, while the level is actually deteriorating in a range of countries (Beatty and Pritchett, 2012). National surveys of basic literacy and numeracy among primary children, such as the Annual Status of Education (ASER) survey in India and Pakistan and the Uwezo (capability) initiative in Kenya, Tanzania and Uganda, also show low rates of learning and slow or stalled rates of progress (ASER, 2013; Uwezo, 2013).
Linear projection, for instance of primary completion rates, is limited in its capacity to predict the future because it assumes that countries’ performance will stay constant over
Adapting development: Improving services to the poor 15
2 Specifically the Demographic and Health Survey (DHS); the Multiple Indicator Cluster Survey (MICS); the World Inequality Database on Education (WIDE); the World Health Organization - UNICEF Joint Monitoring Programme (WHO-UNICEF JMP) for Water Supply and Sanitation; the World Development Indicators (WDI); and the United Nations Educational, Scientific and Cultural Organisation (UNESCO) Institute for Statistics (UIS). See statistical annex for full breakdowns.
3 For primary education the earliest observation utilised was 1998 and the latest 2012. The average length of the comparison period was 7.1 years and for only two countries was data from before 2000 utilised. For rates of births attended by a health professional the earliest observation utilised was from 1996 and the latest from 2012. The average comparison period was 9.2 years. Calculations for eight countries utilised data from before 2000. For improved water and improved sanitation, all countries’ earliest observation was 2000 and the latest 2012.
4 Primary Education Adjusted Net Enrolment Ratio (%).
Figure 1: Years by which all children will be completing primary school in selected countries, according to current projections
By 2020
By 2030
By 2050
By 2100
Worsening
No data
Source: Authors’ calculations based on data from DHS and MICS
collected through the World Inequality Database for Education
(WIDE) (1998-2012). See statistical annex for full details.
time, with no change in factors such as existing levels of capacity, policies and the strength of institutions (adjusting for these factors can change the picture fundamentally, as we go on to show). These results also assume that providing quality services requires the same effort regardless of the group of citizens concerned. In reality, of course, it may be much harder to provide such services for marginalised groups and those with multiple disadvantages. Nevertheless, the results demonstrate clearly that, although some progress has been made, there is an urgent need for significant and sustained improvements in rates of change. Without these, it will take far too long to generate the necessary improvements in human living standards.
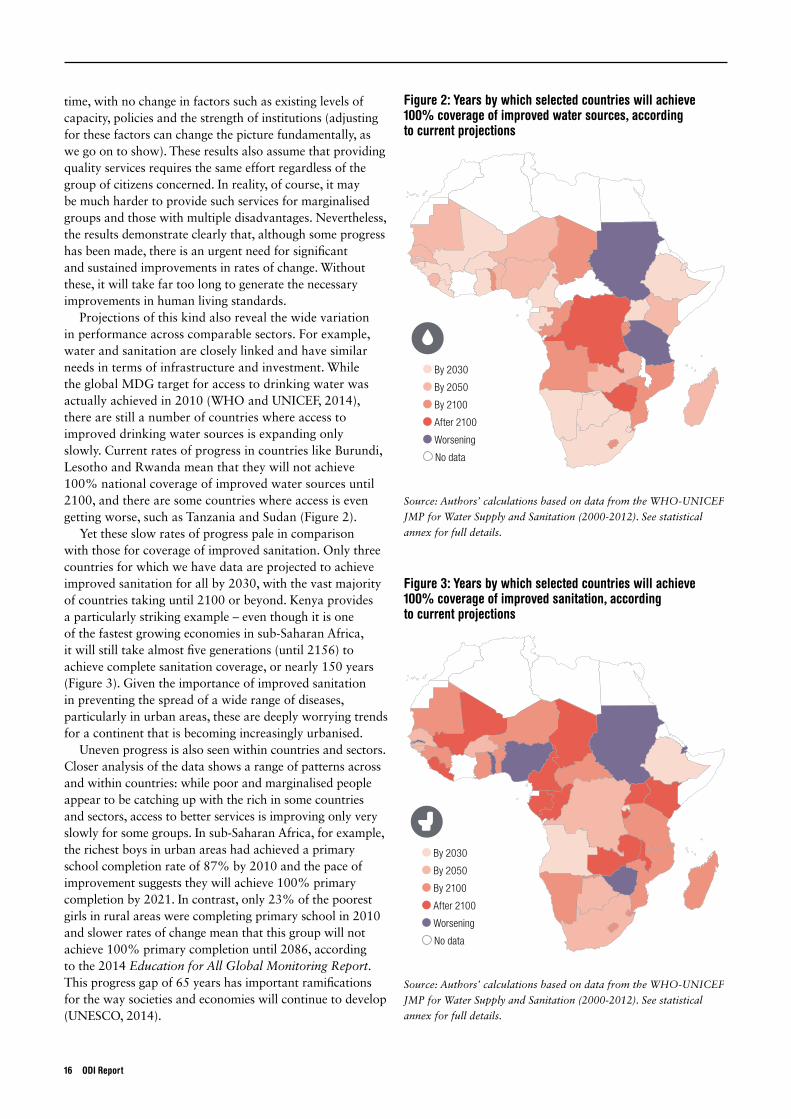
Projections of this kind also reveal the wide variation in performance across comparable sectors. For example, water and sanitation are closely linked and have similar needs in terms of infrastructure and investment. While the global MDG target for access to drinking water was actually achieved in 2010 (WHO and UNICEF, 2014), there are still a number of countries where access to improved drinking water sources is expanding only slowly. Current rates of progress in countries like Burundi, Lesotho and Rwanda mean that they will not achieve 100% national coverage of improved water sources until 2100, and there are some countries where access is even getting worse, such as Tanzania and Sudan (Figure 2).
Yet these slow rates of progress pale in comparison with those for coverage of improved sanitation. Only three countries for which we have data are projected to achieve improved sanitation for all by 2030, with the vast majority of countries taking until 2100 or beyond. Kenya provides a particularly striking example – even though it is one of the fastest growing economies in sub-Saharan Africa, it will still take almost five generations (until 2156) to achieve complete sanitation coverage, or nearly 150 years (Figure 3). Given the importance of improved sanitation in preventing the spread of a wide range of diseases, particularly in urban areas, these are deeply worrying trends for a continent that is becoming increasingly urbanised.
Uneven progress is also seen within countries and sectors. Closer analysis of the data shows a range of patterns across and within countries: while poor and marginalised people appear to be catching up with the rich in some countries and sectors, access to better services is improving only very slowly for some groups. In sub-Saharan Africa, for example, the richest boys in urban areas had achieved a primary school completion rate of 87% by 2010 and the pace of improvement suggests they will achieve 100% primary completion by 2021. In contrast, only 23% of the poorest girls in rural areas were completing primary school in 2010 and slower rates of change mean that this group will not achieve 100% primary completion until 2086, according to the 2014 Education for All Global Monitoring Report. This progress gap of 65 years has important ramifications for the way societies and economies will continue to develop (UNESCO, 2014).
16 ODI Report
Figure 2: Years by which selected countries will achieve 100% coverage of improved water sources, according to current projections
By 2030
By 2050
By 2100
After 2100
Worsening
No data
Source: Authors’ calculations based on data from the WHO-UNICEF
JMP for Water Supply and Sanitation (2000-2012). See statistical
annex for full details.
Figure 3: Years by which selected countries will achieve 100% coverage of improved sanitation, according to current projections
By 2030
By 2050
By 2100
After 2100
Worsening
No data
Source: Authors’ calculations based on data from the WHO-UNICEF
JMP for Water Supply and Sanitation (2000-2012). See statistical
annex for full details.
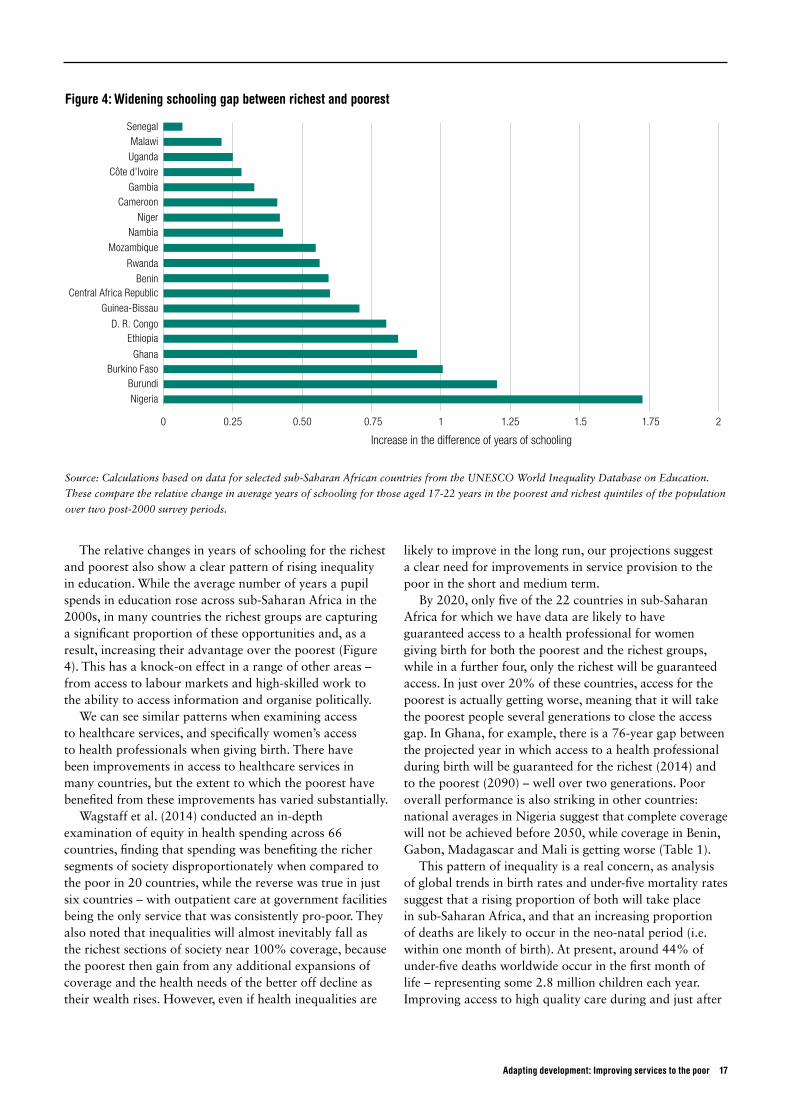
The relative changes in years of schooling for the richest and poorest also show a clear pattern of rising inequality in education. While the average number of years a pupil spends in education rose across sub-Saharan Africa in the 2000s, in many countries the richest groups are capturing a significant proportion of these opportunities and, as a result, increasing their advantage over the poorest (Figure 4). This has a knock-on effect in a range of other areas – from access to labour markets and high-skilled work to the ability to access information and organise politically.
We can see similar patterns when examining access to healthcare services, and specifically women’s access to health professionals when giving birth. There have been improvements in access to healthcare services in many countries, but the extent to which the poorest have benefited from these improvements has varied substantially.
Wagstaff et al. (2014) conducted an in-depth examination of equity in health spending across 66 countries, finding that spending was benefiting the richer segments of society disproportionately when compared to the poor in 20 countries, while the reverse was true in just six countries – with outpatient care at government facilities being the only service that was consistently pro-poor. They also noted that inequalities will almost inevitably fall as the richest sections of society near 100% coverage, because the poorest then gain from any additional expansions of coverage and the health needs of the better off decline as their wealth rises. However, even if health inequalities are
likely to improve in the long run, our projections suggest a clear need for improvements in service provision to the poor in the short and medium term.
By 2020, only five of the 22 countries in sub-Saharan Africa for which we have data are likely to have guaranteed access to a health professional for women giving birth for both the poorest and the richest groups, while in a further four, only the richest will be guaranteed access. In just over 20% of these countries, access for the poorest is actually getting worse, meaning that it will take the poorest people several generations to close the access gap. In Ghana, for example, there is a 76-year gap between the projected year in which access to a health professional during birth will be guaranteed for the richest (2014) and to the poorest (2090) – well over two generations. Poor overall performance is also striking in other countries: national averages in Nigeria suggest that complete coverage will not be achieved before 2050, while coverage in Benin, Gabon, Madagascar and Mali is getting worse (Table 1).
This pattern of inequality is a real concern, as analysis of global trends in birth rates and under-five mortality rates suggest that a rising proportion of both will take place in sub-Saharan Africa, and that an increasing proportion of deaths are likely to occur in the neo-natal period (i.e. within one month of birth). At present, around 44% of under-five deaths worldwide occur in the first month of life – representing some 2.8 million children each year. Improving access to high quality care during and just after
Adapting development: Improving services to the poor 17
Figure 4: Widening schooling gap between richest and poorest
0 0.50 1 1.5 20.25 0.75 1.25 1.75
SenegalMalawi
UgandaCôte d’Ivoire
GambiaCameroon
NigerNambia
Mozambique
Rwanda
BeninCentral Africa Republic
Guinea-Bissau
D. R. CongoEthiopia
GhanaBurkino Faso
Burundi
Nigeria
Increase in the difference of years of schooling
Source: Calculations based on data for selected sub-Saharan African countries from the UNESCO World Inequality Database on Education.
These compare the relative change in average years of schooling for those aged 17-22 years in the poorest and richest quintiles of the population
over two post-2000 survey periods.

birth is crucial to saving these lives. Therefore, increasing the rate of progress in sub-Saharan Africa, and particularly among the poorest, is a major priority (Liu et al., 2014).
2.2 More than just moneyWill more money, in the form of rising income per capita or greater or better-targeted public spending, solve this problem of lagging progress? Economic growth and spending on services are certainly important for building delivery systems, but they do not guarantee better results. Indeed, countries with comparable rates of GDP growth
or increases in spending on public services have often achieved very different rates of improvement in access to – and the quality of – basic services.
In 2010, the research wing of the McKinsey business consultancy company published Lions on the Move, an influential report on the remarkably fast and sustained economic growth achieved in much of Africa since the mid-1990s (McKinsey Global Institute, 2010). In the years since, ‘Africa rising’ has been, with good reason, the theme of countless business briefs and magazine articles. While there is growing awareness that high economic growth is not translating into better outcomes for all, there is still a temptation in much development thinking and practice to assume that sustaining rates of per-capita income growth is not only necessary but may even be enough to close the remaining gaps in the provision of services
While growth matters for development and is, in general, associated with improved performance in human development, it produces different outcomes for different groups – outcomes that are often shaped by the nature of that growth. Political and economic elites who benefit from increased growth may have few incentives to ensure that the proceeds are distributed evenly, and this contributes to the uneven progress within countries described above. We discuss these factors, and what has been learnt about how incentives, institutions and politics shape progress in services, in the following section.
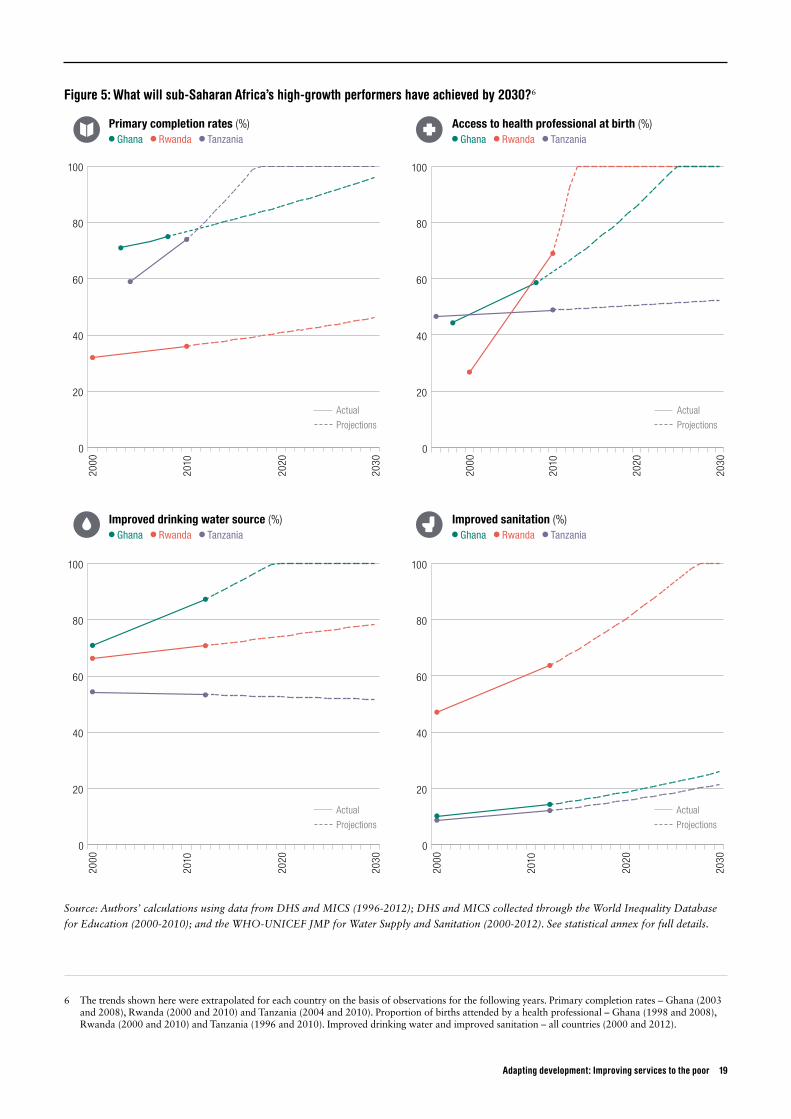
To illustrate the limits of economic growth, on its own, to generate improved performance, we consider the experience of three countries selected from the 10 strongest economies in sub-Saharan African in terms of average annual GDP per capita growth over 2000-2013 and 2008-2013: Ghana, Rwanda and Tanzania.5 Using once again the procedure of extrapolating trends in selected areas of public-service provision for these periods, we find a great diversity in the expected outcomes among both countries and services (Figure 5). For each of these countries, we estimate future performance using the method described above, from the latest observation to 2030.
Key findings include:
• Ghana had an average of 4.1% annual GDP per capita growth between 2000 and 2013 and, projecting from current trends, will have 100% coverage of access to a skilled health professional at birth by 2025 and 100% coverage of improved water sources coverage by 2020. Yet 100% completion of primary education will only be achieved a decade later and it will be many generations before there is 100% access to sanitation.
• Other countries with high per capita growth rates, such as Tanzania (3.8%) are on course to achieve 100%
5 Economic growth was examined over two periods to ensure countries selected were consistently high performing economies.
18 ODI Report
Table 1: Which countries in sub-Saharan Africa will have achieved 100% access to a health professional at births by 2020?
Poorest? Richest?
Benin Not achieved Coverage falling
Burkina Faso Achieved Achieved
Cameroon Coverage falling Achieved
Chad Coverage falling Not achieved
Côte d’Ivoire Not achieved Not achieved
Gabon Not achieved Coverage falling
Ghana Not achieved Achieved
Guinea Not achieved Not achieved
Kenya Not achieved Achieved
Lesotho Achieved Achieved
Madagascar Coverage falling Coverage falling
Malawi Achieved Achieved
Mali Coverage falling Coverage falling
Mozambique Not achieved Not achieved
Namibia Not achieved Not achieved
Niger Not achieved Not achieved
Nigeria Coverage falling Not achieved
Rwanda Achieved Achieved
Senegal Not achieved Achieved
Tanzania Not achieved Not achieved
Uganda Achieved Achieved
Zambia Not achieved Not achieved
Source: Authors’ calculations using data from DHS and MICS
(1996-2012). See statistical annex for full details.
Coverage falling Not achieved
Adapting development: Improving services to the poor 19
6 The trends shown here were extrapolated for each country on the basis of observations for the following years. Primary completion rates – Ghana (2003 and 2008), Rwanda (2000 and 2010) and Tanzania (2004 and 2010). Proportion of births attended by a health professional – Ghana (1998 and 2008), Rwanda (2000 and 2010) and Tanzania (1996 and 2010). Improved drinking water and improved sanitation – all countries (2000 and 2012).
Figure 5: What will sub-Saharan Africa’s high-growth performers have achieved by 2030?6
Primary completion rates (%) Ghana Rwanda Tanzania
Access to health professional at birth (%) Ghana Rwanda Tanzania
2030
2000
2020
2010
100
80
60
40
20
0
2000
2030
2010
2020
100
80
60
40
20
0
Improved drinking water source (%) Ghana Rwanda Tanzania
Improved sanitation (%) Ghana Rwanda Tanzania
100
80
60
40
20
0
2000
2030
2010
2020
100
80
60
40
20
0
2000
2030
2010
2020
Actual
Projections
Actual
Projections
Actual
Projections
Actual
Projections
Source: Authors’ calculations using data from DHS and MICS (1996-2012); DHS and MICS collected through the World Inequality Database
for Education (2000-2010); and the WHO-UNICEF JMP for Water Supply and Sanitation (2000-2012). See statistical annex for full details.
primary completion by 2030, but progress in other areas is far slower. For Tanzania, the expansion of access to a skilled health professional at birth remains worryingly slow: on present rates it will not achieve full coverage until around 2213 – almost 200 years from now.
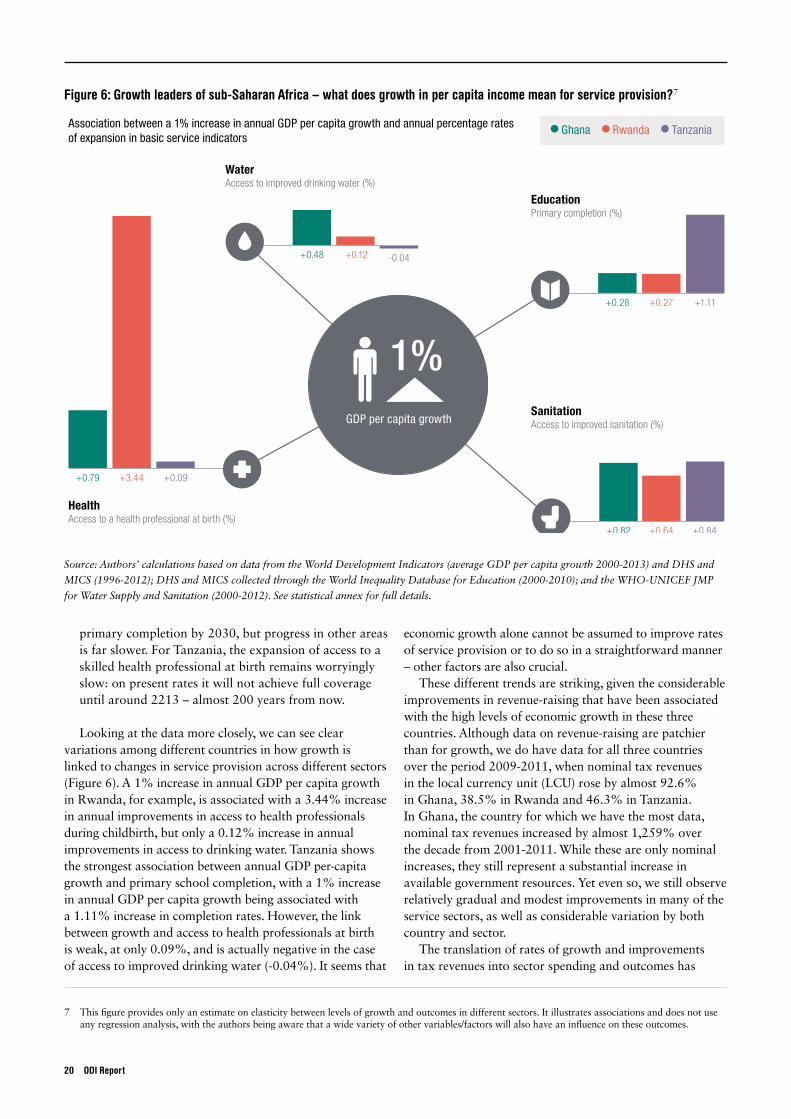
Looking at the data more closely, we can see clear variations among different countries in how growth is linked to changes in service provision across different sectors (Figure 6). A 1% increase in annual GDP per capita growth in Rwanda, for example, is associated with a 3.44% increase in annual improvements in access to health professionals during childbirth, but only a 0.12% increase in annual improvements in access to drinking water. Tanzania shows the strongest association between annual GDP per-capita growth and primary school completion, with a 1% increase in annual GDP per capita growth being associated with a 1.11% increase in completion rates. However, the link between growth and access to health professionals at birth is weak, at only 0.09%, and is actually negative in the case of access to improved drinking water (-0.04%). It seems that
economic growth alone cannot be assumed to improve rates of service provision or to do so in a straightforward manner – other factors are also crucial.
These different trends are striking, given the considerable improvements in revenue-raising that have been associated with the high levels of economic growth in these three countries. Although data on revenue-raising are patchier than for growth, we do have data for all three countries over the period 2009-2011, when nominal tax revenues in the local currency unit (LCU) rose by almost 92.6% in Ghana, 38.5% in Rwanda and 46.3% in Tanzania. In Ghana, the country for which we have the most data, nominal tax revenues increased by almost 1,259% over the decade from 2001-2011. While these are only nominal increases, they still represent a substantial increase in available government resources. Yet even so, we still observe relatively gradual and modest improvements in many of the service sectors, as well as considerable variation by both country and sector.
The translation of rates of growth and improvements in tax revenues into sector spending and outcomes has
7 This figure provides only an estimate on elasticity between levels of growth and outcomes in different sectors. It illustrates associations and does not use any regression analysis, with the authors being aware that a wide variety of other variables/factors will also have an influence on these outcomes.
20 ODI Report
Figure 6: Growth leaders of sub-Saharan Africa – what does growth in per capita income mean for service provision?7
WaterAccess to improved drinking water (%)
+0.48 +0.12 -0.04
SanitationAccess to improved sanitation (%)
+0.82 +0.64 +0.84
HealthAccess to a health professional at birth (%)
+0.79 +3.44 +0.09
+0.28 +0.27 +1.11
EducationPrimary completion (%)
1%GDP per capita growth
Association between a 1% increase in annual GDP per capita growth and annual percentage rates of expansion in basic service indicators
Ghana Rwanda Tanzania
Source: Authors’ calculations based on data from the World Development Indicators (average GDP per capita growth 2000-2013) and DHS and
MICS (1996-2012); DHS and MICS collected through the World Inequality Database for Education (2000-2010); and the WHO-UNICEF JMP
for Water Supply and Sanitation (2000-2012). See statistical annex for full details.
also been very uneven. Between 2000 and 2012, public health spending per capita (adjusted for purchasing power parity – PPP$) rose by 1,008.4% in Rwanda and 654.6% in Ghana – fitting well with the relatively rapid rate of progress observed. However health spending rose by 270.8% in Tanzania over the same period, and progress has been at a much slower rate. Data on education spending are less comprehensive, but show a similar variation – public spending per pupil (PPP$), rose by 54.9% in Rwanda, but by only 6.5% in Tanzania and 0.6% in Ghana – even though these two countries have made more impressive improvements in primary completion rates. The relationships among growth, tax revenue, sector spending and service provision outcomes are all, therefore, far from clear.
2.3 What else matters? The patterns shown here are based on a relatively short period of time in development terms (just 10-15 years), and important contextual factors are not constant. Clearly, it matters whether countries are landlocked or coastal, have been affected by conflict or not, and are large or small in terms of their spatial dimensions or population. Density and diversity of population, rates of urbanisation and the nature of a country’s economic and resource base may also explain some of the divergent results we have recorded.
The results do, however, confirm our basic proposition: that counting on fast economic growth and/or the injection of additional financing alone to revive sectors that are lagging behind would be a mistake. If we look at Tanzania, for example, and compare the findings from Figure 5 and Figure 6, we see the extent to which ‘more of the same’ will not be enough. Two of the sectors where Tanzania faces particularly long timelines for full coverage (access to improved water sources and the presence of health professionals at birth), are those where higher levels of economic growth and public spending (particularly for health) do not seem to translate into high enough improvements. In Rwanda, while growth seems to be associated with better outcomes in many sectors, this association is much weaker for education.
Some of the differences in performance are likely to relate to policy choices and overall resource constraints – no one country from the group above is outperforming every other country in every service sector. All countries must prioritise to some extent, although the precise trade-offs can be hard to judge from limited data. Ghana’s improvements in the proportion of births attended by a health professional are particularly striking compared to its slow progress on sanitation, perhaps because of a lower priority placed on the latter. Tanzania, meanwhile, performs impressively on primary education completion, reflecting in part a strong
political focus on this sector, when compared to Rwanda where the rates of improvement are much lower – perhaps a reflection of the country’s low starting base and the impact of the conflict of the 1990s.8
Whether and how policies are actually implemented may have an equally strong impact. Where there are strong patronage politics, combined with important ethnic cleavages (as in Kenya), or a history of single-party dominance (as in Tanzania), policymaking can focus on the provision of resources to particular populations, but without the top-down monitoring and performance motivations to ensure coverage for all. Countries with strong states, whose pursuit of national development is a source of legitimacy, may have greater discipline and more structures to define priorities and ensure that they are achieved – as seen in Rwanda’s strong performance on the proportion of births attended by health professionals.
A further body of research emphasises the role of institutions (the formal and informal ‘rules of the game’ that determine how political systems operate and policies get made) and the nature of underlying political settlements. A crucial issue here is why, when and how elites are motivated and able to pursue more equitable national development, including through collective action (Lewis, 2007; Khan, 2010; Slater, 2010; Booth and Cammack, 2013; Kelsall, 2013).
The nature of what needs to change also matters. Progress has been faster in those areas where change was relatively easy to roll out. Primary school enrolment, for instance, increased significantly (though important gaps still remain) but actually keeping children in school and ensuring they learn has proved more difficult, in part because it involves a more complex set of interventions.
Similarly, lagging progress on sanitation, compared to access to clean water, seems to persist because of the complexity of the response needed. Improving sanitation requires changing behaviour and social norms (including around open defecation). It also means institutional responses that can bring together multiple groups to take coordinated actions, including for financing and delivery purposes. Differences in performance therefore also reflect the complexity of what needs to change, and whether and how systems and institutions operate and are able to manage that complexity.
The debate on what explains over- or under-performance is ongoing. Much of the evidence analysed for this report reaffirms the importance of institutions for development outcomes, including for services. But common approaches to governance reforms, especially those promoted by development agencies, have not always focused on the right things. It is clear that greater efforts are needed to do things differently.
Adapting development: Improving services to the poor 21
8 Here the data may also conceal other issues – primary completion rates are not the same as learning outcomes, so it may be that Tanzania’s success in improving this measure reflects success in keeping children in school, rather than ensuring that they are learning well while they are there.
3 Institutions for better service delivery: why standard approaches often fail
While the MDGs deliberately avoided setting targets for institutional or governance improvements, the proposed SDGs do include commitments to build capable institutions. These are set out in the Open Working Group proposal for targets under Goal 16: ‘Peaceful and inclusive societies, rule of law and capable institutions’ (OWG, 2014). This is a useful recognition of the obvious importance of factors other than resource flows in making it possible to achieve Goals 1 to 15. However, the discussion around the Open Working Group so far seems to assume a single, basic template for institutional improvement that can address development challenges in all places at all times. This raises concerns that when it comes to governance and institutions, the SDGs are still promising ‘more of the same’.
There are at least three ways in which the proposed targets fail to connect with applicable evidence:
• their reliance on international models of ‘best practice’, rather than pathways of change that are feasible in difficult political contexts
• their assumption that ‘all good things go together’ when it comes to governance, peaceful societies and development
• their neglect of the possibility that governments adopt recommended policies or institutions in a formal way only, leaving real problems unresolved.
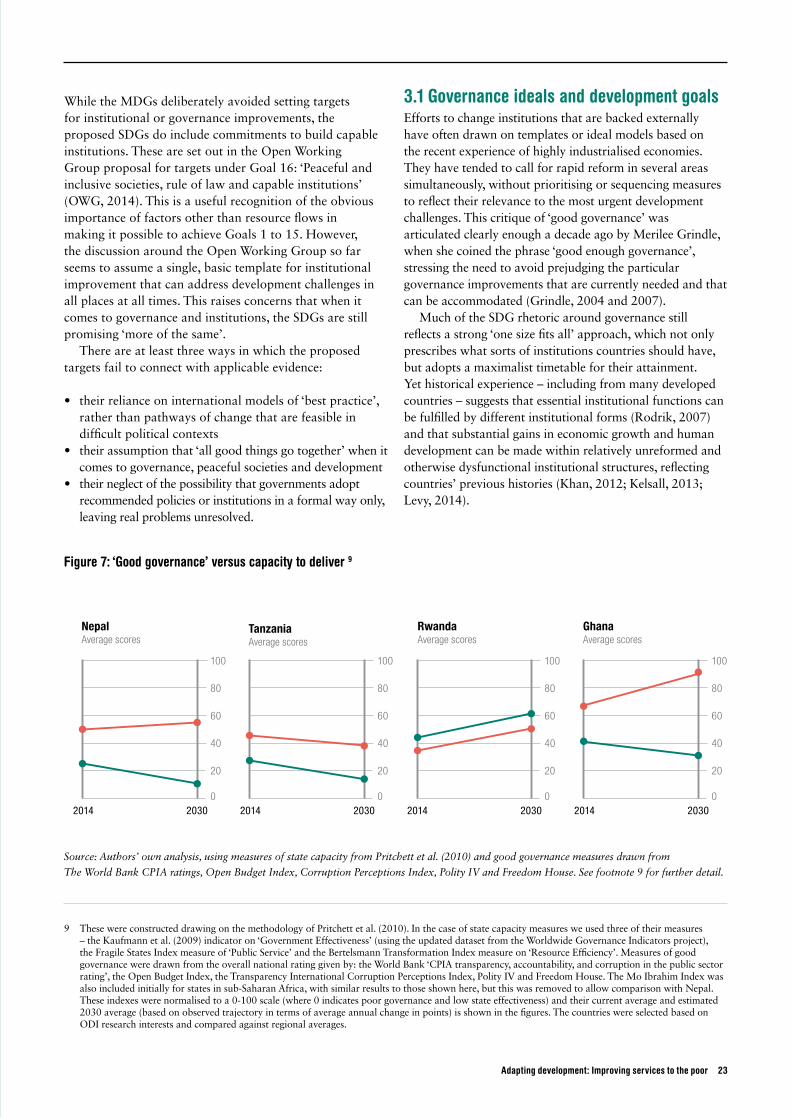
3.1 Governance ideals and development goalsEfforts to change institutions that are backed externally have often drawn on templates or ideal models based on the recent experience of highly industrialised economies. They have tended to call for rapid reform in several areas simultaneously, without prioritising or sequencing measures to reflect their relevance to the most urgent development challenges. This critique of ‘good governance’ was articulated clearly enough a decade ago by Merilee Grindle, when she coined the phrase ‘good enough governance’, stressing the need to avoid prejudging the particular governance improvements that are currently needed and that can be accommodated (Grindle, 2004 and 2007).
Much of the SDG rhetoric around governance still reflects a strong ‘one size fits all’ approach, which not only prescribes what sorts of institutions countries should have, but adopts a maximalist timetable for their attainment. Yet historical experience – including from many developed countries – suggests that essential institutional functions can be fulfilled by different institutional forms (Rodrik, 2007) and that substantial gains in economic growth and human development can be made within relatively unreformed and otherwise dysfunctional institutional structures, reflecting countries’ previous histories (Khan, 2012; Kelsall, 2013; Levy, 2014).
Adapting development: Improving services to the poor 23
9 These were constructed drawing on the methodology of Pritchett et al. (2010). In the case of state capacity measures we used three of their measures – the Kaufmann et al. (2009) indicator on ‘Government Effectiveness’ (using the updated dataset from the Worldwide Governance Indicators project), the Fragile States Index measure of ‘Public Service’ and the Bertelsmann Transformation Index measure on ‘Resource Efficiency’. Measures of good governance were drawn from the overall national rating given by: the World Bank ‘CPIA transparency, accountability, and corruption in the public sector rating’, the Open Budget Index, the Transparency International Corruption Perceptions Index, Polity IV and Freedom House. The Mo Ibrahim Index was also included initially for states in sub-Saharan Africa, with similar results to those shown here, but this was removed to allow comparison with Nepal. These indexes were normalised to a 0-100 scale (where 0 indicates poor governance and low state effectiveness) and their current average and estimated 2030 average (based on observed trajectory in terms of average annual change in points) is shown in the figures. The countries were selected based on ODI research interests and compared against regional averages.
Figure 7: ‘Good governance’ versus capacity to deliver 9
100
80
60
40
20
02014 2030
NepalAverage scores
100
80
60
40
20
02014 2030
TanzaniaAverage scores
100
80
60
40
20
02014 2030
RwandaAverage scores
100
80
60
40
20
02014 2030
GhanaAverage scores
State capacity indicators Good governance indicators
Source: Authors’ own analysis, using measures of state capacity from Pritchett et al. (2010) and good governance measures drawn from
The World Bank CPIA ratings, Open Budget Index, Corruption Perceptions Index, Polity IV and Freedom House. See footnote 9 for further detail.
This is illustrated by the lack of a clear correlation between internationally determined measures of ‘good governance’ and development outcomes in different sectors. Measures like the World Bank’s Worldwide Governance Indicators, for example, show a weak causal relationship with progress on MDGs: countries from Brazil to Indonesia, and from China to Viet Nam, have achieved significant improvements against the MDGs, yet vary considerably on how they score on different elements of the ‘good governance’ agenda (Rocha Menocal and Wild, 2014; Rocha Menocal, 2013).
Our concern in this report is with pathways to improving basic public goods and services. From this point of view, many efforts to reform institutional frameworks for service delivery seem to focus on the wrong things – typically on broad measures of transparency and accountability, rather than on the specific capacity to deliver services to people.
The data in Figure 7 illustrate what is often ‘missed’ by these standard measures for some countries in which we have conducted field research. Comparing the current levels and trajectories of measures of state capacity and indexes of ‘good governance’9 for some, we see two notable trends. First, countries are, in general, doing better in terms of measures of good governance than they are in terms of actual state capacity. With the exception of Rwanda, the average for good-governance measures in the group above is generally some 20 percentage points higher than the average for state-capacity measures, a pattern replicated when examining averages across sub-Saharan Africa. Second, when we look at the trajectories of these measures, there is no clear relation between the trends on good governance and state capacity. Indeed, in some countries they head in different directions.
Some of the divergence between these indicators is particularly striking. Both Tanzania and Ghana, for example, have a widening gap between capacity and good governance – a gap that is particularly striking for Ghana. While both countries have been seen as ‘donor darlings’, attracting international aid and attention because of their political stability, there are growing concerns over the extent to which concrete improvements for citizens are being achieved, reinforced by the data on slow progress in Section 2.
People’s expectations tell a similar story. The MY World survey highlights that globally, an ‘honest and responsive government’ is the fourth priority worldwide (preceded only by education, health and job opportunities). A closer look at perception data, however, highlights that what people really prioritise here is often the ability of governments to actually deliver things to them (Bergh et al., 2013).
Evidence of this sort has encouraged governance researchers and policy advisers to become far more
agnostic about what should count as institutional progress. It has led to a preference for ‘going with the grain’ of countries’ particular circumstances and endowments, and for paying closer attention to the role of informal rules and relationships in supporting or impeding particular sorts of change (Booth and Cammack, 2013). Recommendations include an ‘upside down’ approach to governance reform (Moore and Unsworth, 2010) – one that starts with what exists and seeks to improve it. This makes the lack of any such perspective in the SDG proposals even more worrying.
3.2 Capability traps and government signals As Grindle and others (e.g. Therkildsen, 2000) have emphasised, the standard donor approach to improving institutions for service delivery can do harm by causing reform ‘overload’. Recent and influential work on ‘capability traps’ has also highlighted how the high expectations that accompany development programmes can end up undermining the capacity of government systems (Pritchett et al., 2010).
A more general feature of institutional improvements that are driven externally, however, is that they are simply ineffective. They often lead to rapid and enthusiastic adoption of the outward form of the recommended arrangements, without significant changes in real behaviour. In aid-dependent countries, the universal tendency in institutional reform known as ‘isomorphic mimicry’ – where organisations emulate arrangements that are assumed to be superior but only in a cosmetic way – is intensified by the desire of policy-makers to ‘signal’ progressive intentions to donors. Under these circumstances, there are powerful incentives for developing countries to adopt organisational forms that have international approval without undertaking the deep-seated changes that are needed to make them work in practice (Pritchett et al., 2010). Box 3 gives some examples, drawing from analysis by Matt Andrews (2013) and Pritchett et al. (2010).
3.3 Changing the approachAs outlined in Section 1, the alternative approach that is needed must be based on realistic assumptions about how developmental progress happens – that is, often incrementally and with difficulty, as a result of marginal shifts in the way interests are perceived, especially by members of national elites. It must recognise that successful change is almost always domestic in nature, rather than externally induced. Finding ways around political obstacles and vested interests is far easier for
24 ODI Report
domestic reformers with political connections than for even exceptionally well informed and well connected external actors. It is easier, too, when the focus is on solving a specific problem of direct interest to citizens of the country.
This requires both domestic and external actors to focus on initiatives that are, as far as possible, problem-driven, not solution-driven. Moving from providing solutions to solving problems requires a radical break with a great deal of past practice in development. Rather than offering standard prescriptions based on assumptions about what development should look like, it means recognising that many typical development problems are too complex and politically too difficult for ready-made solutions. In general, the only transferrable lesson in development is that workable solutions have to be discovered, which implies
a central role for deliberate experimentation or trial and error.
This is not a new idea. The superiority of approaches based on learning and adaptation is one of the oldest themes in the literature on development policy (Hirschman, 1967; Brinkerhoff and Ingle, 1989; Hulme, 1989; Rondinelli, 1983; Therkildsen, 1988; Porter et al., 1991). The recent flood of additional argument and evidence from fields as diverse as business start-ups, military strategy and developmental reform has given new impetus to this thinking (Harford, 2011; Ries, 2011; Andrews, 2013; Ramalingam, 2013; Faustino and Booth, 2014). The challenge now is to show how this thinking can be applied in practice, the implications for how development actors work and for what kind of support is required. We discuss various aspects of this challenge in Section 4 and follow some of its implications for aid policy in Section 5.
Adapting development: Improving services to the poor 25
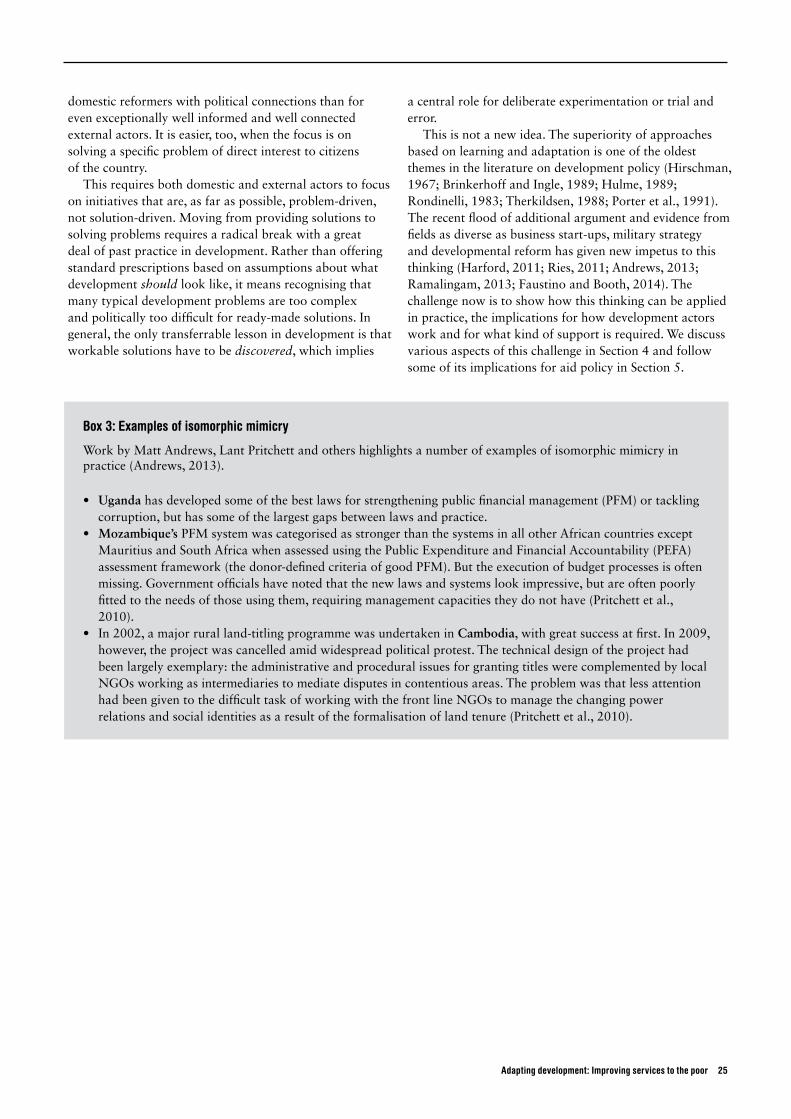
Box 3: Examples of isomorphic mimicry
Work by Matt Andrews, Lant Pritchett and others highlights a number of examples of isomorphic mimicry in practice (Andrews, 2013).
• Uganda has developed some of the best laws for strengthening public financial management (PFM) or tackling corruption, but has some of the largest gaps between laws and practice.
• Mozambique’s PFM system was categorised as stronger than the systems in all other African countries except Mauritius and South Africa when assessed using the Public Expenditure and Financial Accountability (PEFA) assessment framework (the donor-defined criteria of good PFM). But the execution of budget processes is often missing. Government officials have noted that the new laws and systems look impressive, but are often poorly fitted to the needs of those using them, requiring management capacities they do not have (Pritchett et al., 2010).
• In 2002, a major rural land-titling programme was undertaken in Cambodia, with great success at first. In 2009, however, the project was cancelled amid widespread political protest. The technical design of the project had been largely exemplary: the administrative and procedural issues for granting titles were complemented by local NGOs working as intermediaries to mediate disputes in contentious areas. The problem was that less attention had been given to the difficult task of working with the front line NGOs to manage the changing power relations and social identities as a result of the formalisation of land tenure (Pritchett et al., 2010).

4 Doing things differently
While there are growing calls to rethink the methods of development, translating these calls into changed practice remains a challenge, for two reasons. First, the proposition that solutions must be ‘discovered’ is a scary one for many – especially for officials who need to make decisions on how to spend limited resources, and for politicians who need to justify their actions to their voters (in their own country or abroad). The argument needs to be made more strongly and effectively: blueprint planning, or the search for certainty via bureaucratic means, is not a low-risk approach. It produces costly failures on a regular basis.
The second challenge is translating the principles of adaptive working into practical ways of doing things differently on the ground. Fitting solutions to problems, rather than problems to solutions, seems like common sense. Yet few practitioners in developing-country governments, NGOs or donor agencies have a clear concept of how in practice this might differ from the way they work at the moment. The body of evidence on ways to work adaptively on development problems is still modest and tentative, which confirms that these are not yet part of mainstream practice.
Clearly, lasting progress requires more robust efforts to embed such approaches. In this section, we aim to contribute to such efforts, with a particular focus on how they can be used to resolve the chronic constraints that confront basic public goods and services. We draw together some of what we have learnt about how to apply the principles of the Doing Development Differently manifesto (Box 2), exploring what it means to:
• work in a politically informed, politically smart and problem-driven way
• take an adaptive or entrepreneurial approach, and • take action that is locally led.
4.1 Politically informed, politically smart and problem-drivenApproaches that are politically informed, politically smart and problem-driven are not ‘magic bullets’. They do, however, offer a way forward in often challenging circumstances. It seems obvious that reform initiatives should be underpinned by good political information and that local reformers will have extensive knowledge of their context. External agencies like donors too are increasingly interested in forms of country and sector analysis (including political-economy analysis) to substitute for their lack of prior local knowledge.
The need to work in a way that is ‘problem driven’ also seems obvious. Of course, any development endeavour starts with the identification of a problem to be solved or an unmet need to be satisfied. Too often, however, a solution is proposed long before the problem has been diagnosed adequately. Alternatively, the diagnosis may
get to the bottom of a problem and uncover a profoundly difficult underlying constraint – often to do with the character of the local politics – but then gets stuck.
The result can be paralysis in the face of a constraint that is too ‘systemic’ – that is not susceptible to change in the short or medium term – or an intervention that fails to tackle this constraint because no one has any idea of how to get around it. Here, the initiative may be technically sound but is not politically smart. That is why political information needs to go hand in hand with problem-driven approaches. Understanding the political environment is necessary to grasp what might be politically feasible, while starting with the problem provides a way to explore and test such politically smart ideas in order to make headway on specific issues.
This is particularly important because pushing a solution without properly understanding the problem is no substitute for a technique that helps get to the root causes of a problem. This ‘problem driven’ technique has been applied in many fields, since Kaoru Ishikawa pioneered it as a quality control technique in Japanese manufacturing in the 1960s. Known as the ‘five whys’, the technique obliges the user to ask repeatedly for the cause behind each problem. The results of such a tough-minded diagnostic style have been recorded in the famous ‘fishbone diagrams’, with the initial problem statement as the head of the fish, and the various deeper problems as the ribs (Andrews, 2013; City Process Management, 2008).
Even where interventions fail to address underlying constraints, there may well be some awareness of deep underlying issues, either because the practitioner has a tacit understanding of the way things really work, or because particular analysis has been carried out (such as political economy analysis, service user testing and more). However, if the operational significance of such diagnostic insights is to be discovered, there must be an iterative testing of possible solutions. What is needed is a ‘back and forth’ alongside further probing to establish the nature of the problem and initial efforts to try out possible solutions.
The problems and politics of health Failure to address underlying constraints can be illustrated by common gaps in service delivery in the health sector, particularly a lack of access to qualified health workers or essential medicines.
Nepal, for example, is a country that has faced a severe shortage of qualified health workers in remote areas, partly because of the highly inequitable distribution of health workers, with staffing concentrated around the Kathmandu valley. In response to this problem, there has been a steady increase in the total numbers of health workers being trained. Yet they are still clustered around the Kathmandu valley (Harris et al., 2013). Clearly, this is about more than just the number of health workers trained.
Their continued concentration in particular areas, despite reform efforts, reflects the nature of the informal
Adapting development: Improving services to the poor 27
rules or institutions that developed in Nepal’s volatile post-conflict period, often marked by patronage relationships. Informal ties developed between different political parties and professional networks, such as health-worker unions. Over time, systems of allocating health workers became important rent-making opportunities for political parties. As a result, health workers with good political connections could subvert the system, and ensure they were transferred to postings in the Kathmandu valley in particular, creating a ‘market for transfers’. This may have been an understandable reaction to the difficult working conditions they faced in remote areas, and in a context where patronage was the norm, many opted to avoid remote postings if they could (Harris et al., 2013).
Politically informed analysis makes it clear that the drivers of human resources for health in Nepal are linked to systemic issues like political-party financing and the nature of party competition. Addressing these constraints directly would require significant improvements in the external monitoring and regulation of political-party financing, and there has been some progress on this, with major political parties beginning to submit financial statements for audit (Harris et al., 2013). However, given the blurred boundaries between party finances and those of party members, these changes may not be a big enough incentive to undermine the ‘market for transfers’ in health in the shorter term. What would a problem-driven approach look like?
One alternative would be to change the behaviour of those driving this ‘market’, by shifting their motivations. This would require significant coordination among political parties, so that they have a collective agreement
not to influence transfers for healthworkers. External actors could support forums for cross-party dialogue and coordination on this issue. These could be complemented by efforts to change the motivations for health workers – and to reduce the gaps between preferred posts in major urban areas and those in remote areas. This might mean improving some of the conditions in service, such as encouraging shorter remote postings, using scholarship schemes to support remote postings as part of training or forms of financial and non-salary benefits to encourage health workers to take up these postings. Other options might be to strengthen local hiring and placements, and to address the personal security of health workers in more remote areas. The aim would be to address some of the existing motivations in the system. External actors might well provide financial and technical support for these schemes (see Harris et al., 2013, for more details).
Linking a problem-driven approach to one that is politically smart, therefore, identifies both some of the constraints to progress and some of the bottlenecks that can be tackled. In this case, it highlights how shifts in political-party motivations and those of health workers themselves might be supported, and reveals ways to make tangible progress in the short term, as well as areas where more significant change is needed in the longer term.
Another common problem for health outcomes is a lack of access to essential medicines whenever they are needed. In countries like Malawi and Tanzania – both of which lag behind in the development outcomes highlighted by the data in Section 2 – chronic stock outs of essential medicines have been a recurring feature (Wild and Cammack, 2012; Wales et al., 2014).
28 ODI Report
Box 4: Medicine stock outs, Malawi and Tanzania Case study
Despite a formal policy commitment to free essential medicines in Malawi (as part of an Essential Health Package), a 2011 review by the Ministry of Health found that 75% of health facilities, on average, had experienced medicine stock outs in recent years (MoH, 2011). Shortages remain common in Tanzania too – in 2013, 41% of patients reported they could not access medicines they needed because of shortages at public health facilities (Twaweza, 2013). In both countries, people resort to private pharmacies and facilities to access medicines, or go without. Many reform efforts in these countries have focused on strengthening the body directly responsible for medicines (e.g. the Central Medical Store Trust in Malawi) and strengthening logistics, data availability and procurement systems (e.g. the Integrated Logistics System in the Ministry of Health in Tanzania). A number of donor partners have also supported parallel systems of medicine distribution in Malawi (Wild and Cammack, 2012).
A range of factors contribute to the problem of medicine stock outs. Medicines themselves are highly ‘lootable’ – they are often lucrative, mobile and particularly vulnerable to rent seeking and outright theft. Monitoring medicine stocks and supply can be another challenge. It can be difficult to standardise and plan for medicine availability as this must respond to changing disease burdens and trends, and will vary by region, season and so on, in ways that are both predictable and unpredictable.
Both Tanzania and Malawi have experienced ad hoc and stalled processes of decentralisation, contributing to a lack of policy coherence and oversight, including of medicines. The factors behind this have included tendencies towards re-centralisation in a one-party state with strong patronage-client features in Tanzania and messy processes of ‘competitive clientelism’ at multiple levels in Malawi (Wales et al., 2014; O’Neil et al., 2014). Bottom-up monitoring has been promoted as one response to stock outs in both countries, through the involvement of users in health committees for each facility. Yet community members rarely feel empowered to challenge those in authority within health centres or to follow up on any inconsistencies that have been identified (Wild and Cammack, 2012; Wales et al., 2014).

Adapting development: Improving services to the poor 29
There have been repeated attempts in both countries to reform access to, and provide increased financing for, essential medicines. However, these reforms have often addressed only some of the ‘superficial’ aspects, such as providing more resources for medicines or strengthening policies and procedures for procurement and distribution, rather than tackling the underlying ‘problems’ (Box 4). These include the way policy operates in frameworks that are decentralised on paper but not in practice, the (in)ability to supervise health workers and front line service providers, and the way service users demand their medicines. The inability to address these issues reflects some of the entrenched interests involved, the problems of signalling and ‘isomorphic mimicry’ mentioned earlier, and the lack of known or obvious prescriptions for what to do differently.
In Malawi, bottom-up monitoring did not take into account the challenges communities faced, given their lack of detailed technical knowledge and the social norms that stopped people speaking out against those seen to be their ‘superiors’. Nor did it account for the impacts of ad hoc processes of decentralisation, which resulted in an ‘institutional vacuum’ in which it was unclear who was responsible for overseeing medicines at different points in the chain.
What does a problem-driven approach look like? As in Nepal, the existing political system will only change slowly in Malawi. But there is more room for manoeuvre in terms of strengthening the coherence of policy frameworks and aspects of performance monitoring for medicines. This might mean greater rationalising of structures, processes and interactions between different parts of government to support clearer roles and responsibilities at different points of the delivery chain; and moving away from parallel systems of medicine supply – often aid funded – that deepen incoherence. New forms of bottom-up monitoring
are needed, such as the greater involvement of traditional leaders or professional bodies that will feel more empowered to speak out (Wild and Cammack, 2012). There are also options to build institutions that are more suited to prevailing conditions, to improve service delivery in the medium term and to influence political drivers in the longer term (see Box 5).
It seems clear that robust, ongoing diagnosis of the underlying problems opens up opportunities for more effective strategies. The examples above combine political-economy analysis with problem-driven approaches to generate new solutions. Further examples exist that show how such approaches can operate in practice, and more effectively than standard ways of working. In the case of Mozambique (Box 6), a deeper diagnosis of the problem went hand-in-hand with a search for solutions by a team of national policymakers, ‘coached’ or facilitated by both national and international experts (Andrews, 2014).
Sometimes, the diagnosis of the problem might be correct, but it may not be fed back into programme design and learning. Box 7 (overleaf) provides an example of change and tangible improvements for service delivery in Malawi – in contrast to the issue of medicine stock outs outlined in Box 4. In this example, a community scorecard programme, implemented by an NGO (with external funding) was able to solve some chronic service delivery problems at the local level and to improve perceptions and trust between service providers and citizens. It did so by investing in the finding and solving of problems on the ground – rather than coming in with pre-determined ideas. As a result, the programme helped to build much more productive working relationships among, for example, communities, local education and health officials, front line staff such as teachers and health workers and local leaders including traditional chiefs. Yet much of the process
Box 5: Adapting local governance solutions in Malawi Case study
O’Neil and Cammack et al (2014) assessed how local government works in Malawi and how decentralisation affects local-service delivery, in order to generate new policy options for both government and donors. They highlight a set of options that take political-economy drivers as the starting point and that adapt solutions to prevailing conditions and incentives. The options identified include:
• Consider asymmetric decentralisation. In the shorter term, the analysis finds that devolving some functions is much more likely to succeed in cities than in rural districts, as the former have better infrastructure, can generate more revenue and have more potential for performance monitoring (including by citizens). Asymmetric decentralisation would allow existing resources to be better targeted and it would, over time, build greater demand and pressures for decentralised service delivery, including in rural areas.
• Accept that in practice, most districts have the more limited deconcentration of services (rather than decentralised). Work to strengthen this more limited system, so that districts contribute to improved service delivery (rather than supporting decentralised processes that exist on paper only).
• Provide long-term support to the strengthening of political parties. This should focus on supporting a more functional and institutionalised party system, so that the nature of political organisation changes over time, rather than the more traditional approach to political-party strengthening (in the form of one-off training for individual parties, for instance).
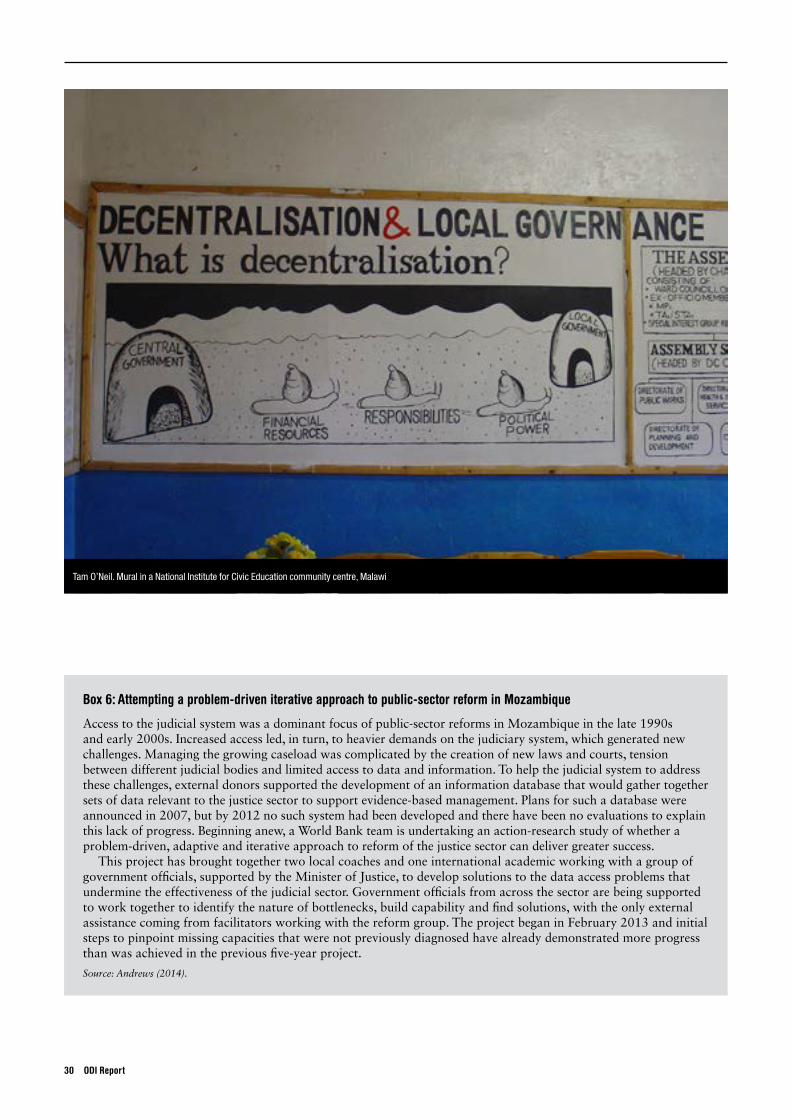
30 ODI Report
Box 6: Attempting a problem-driven iterative approach to public-sector reform in Mozambique
Access to the judicial system was a dominant focus of public-sector reforms in Mozambique in the late 1990s and early 2000s. Increased access led, in turn, to heavier demands on the judiciary system, which generated new challenges. Managing the growing caseload was complicated by the creation of new laws and courts, tension between different judicial bodies and limited access to data and information. To help the judicial system to address these challenges, external donors supported the development of an information database that would gather together sets of data relevant to the justice sector to support evidence-based management. Plans for such a database were announced in 2007, but by 2012 no such system had been developed and there have been no evaluations to explain this lack of progress. Beginning anew, a World Bank team is undertaking an action-research study of whether a problem-driven, adaptive and iterative approach to reform of the justice sector can deliver greater success.
This project has brought together two local coaches and one international academic working with a group of government officials, supported by the Minister of Justice, to develop solutions to the data access problems that undermine the effectiveness of the judicial sector. Government officials from across the sector are being supported to work together to identify the nature of bottlenecks, build capability and find solutions, with the only external assistance coming from facilitators working with the reform group. The project began in February 2013 and initial steps to pinpoint missing capacities that were not previously diagnosed have already demonstrated more progress than was achieved in the previous five-year project.
Source: Andrews (2014).
Tam O’Neil. Mural in a National Institute for Civic Education community centre, Malawi
Adapting development: Improving services to the poor 31
for this achievement was not captured formally in the programme design and monitoring, which focused on a ‘standard’ model of citizen empowerment and voice (Wild and Harris, 2012).
This seems to be a common story, and one that inhibits the build-up of the evidence base still further. Even where programmes already act in more problem-driven and politically savvy ways, this may not be documented in formal project reporting. We return to issues of measurement in Section 5.
Different sectors, different lessons, shared challenges One important aspect of the robust diagnostic effort that is needed is giving enough attention to the specific properties of the public good or service involved. While many problems are similar across sectors, others reflect their technical characteristics and the different motivations these entail for service users and providers.
The fact that services are configured in certain ways and that this can shape incentives and motivations is well recognised. It was, for example, set out in 2004 in the World Bank’s World Development Report, Making Services Work for Poor People (World Bank, 2004). Yet until recently, there has been no systematic
mapping of what these ‘service characteristics’ are or their implications.
The framework of ‘sector characteristics’ described in Box 8 was developed by the University of Birmingham with ODI. It seeks to address this gap, drawing on economics (linked to the nature of the public good and of the relevant ‘market failure’), and on organisational and management theory (the nature of the task and the demand for the service) (Mcloughlin with Batley, 2012; Batley and Harris, 2014). Box 8 lists a number of questions that may be asked about any service and can be used to map the likely incentives, motivations and options for its organisation and delivery.
Taking these characteristics into account supports efforts to better ‘diagnose’ the nature of the underlying problem for service delivery. The examples of medicine stock-outs in Malawi and Tanzania outlined in Box 4, for instance, highlight the extent to which some aspects of service delivery can be more ‘lootable’ (i.e. vulnerable to corruption of different kinds) than others.
The way these characteristics play out and what they mean for the identification of problems can be seen clearly in education. There are many factors that contribute to the growing learning crisis identified in Section 2, but one that
Box 7: Community scorecards in Malawi Case study
A programme of community scorecards has been running in Malawi for more than a decade, and has now been incorporated into local government Performance Assessment Frameworks. The programme has been implemented by a number of NGOs, including Plan Malawi, working in collaboration with others (Wild and Harris, 2012). The scorecards have focused on public services, identifying chronic gaps for rural and marginalised communities in particular. They provide a bottom-up process to identify the exact nature of these problems, including the lack of housing for teachers that has contributed to a lack of teachers in rural areas, the low percentage of women giving birth in hospitals and the lack of medicines in health clinics.
The community scorecard programme implemented by Plan presented itself as a mechanism to strengthen citizen demand and voice in relation to service-delivery officials. Its vision of change – on paper – linked citizen voice and empowerment to ensuring better accountability and better service-delivery outcomes. The programme has also had some real successes. At the local level, it has resulted in the better use of resources (allocated to areas that needed them most), and the construction of new infrastructure (including teacher housing) with inputs from communities as well as local authorities. It has also helped to address the behaviour of health workers and other public servants – highlighting specific examples of abuse of power or breakdowns of trust between providers and users that hampered service delivery (Wild and Harris, 2012).
Yet the factors that have contributed to programme effectiveness were not those set out in its original design or the vision of change that was envisaged. This is because the original design and vision did not reflect the realities of local incentives and power relationships in Malawi, including a history of ‘competitive clientelism’ at the centre that had contributed to an ‘institutional vacuum’ at district level and below (O’Neil and Cammack, 2014).
What emerged through implementation was the recognition that one core underlying problem was not the inability to get one group (i.e. service providers) to do something for another group (users), but rather the lack of action in pursuit of collective interests across all groups. This led to a growing focus on local problem solving and greater support for collective action – for example, facilitating groups to come together around teacher housing, so that communities could contribute bricks, local organisations could provide metal sheeting and district officials could support labour costs. The Plan Malawi team – led by a well-connected and politically savvy Malawian – had the capacity, skills and connectedness to broker these processes and work flexibly to bring different groups together. Yet this was rarely captured in formal programme documents and reporting, which remained constrained by their original design and assumptions (Wild and Harris, 2012).
32 ODI Report
Box 8: Key questions to identify service characteristics
• What is the nature of the good being produced? Can it be delivered by the market or does it require public intervention? Can users choose between providers? Is the service for private or collective benefit? Can beneficiaries be excluded and targeted?
• What are the market-failure characteristics? Why might market provision limit access to services? What is the rationale for public intervention? Does public provision counter or reproduce failures of inclusion? (Though known as market failures, the same failures may also be replicated in government provision.)
• What are the task-related characteristics? How does the way in which a service is produced and delivered affect relationships of control and accountability between policymakers, providers and users?
• What are the demand characteristics? How does the nature of the service provided affect the capacity and forms of user demand and provider control?
Source: Batley and Harris (2014).
Box 9: Prioritisation in education
Examples of visible prioritisation in education include the following:
• School construction. Ethiopia increased its primary school construction by 140% between 1996/97 and 2008/09 as part of the political prioritisation of education. This is one of a number of examples emerging from a broader review of the political economy of education in multiple countries, which found that school construction and the hiring of teachers were seen as areas of high political return, especially in contexts of significant patronage (Kingdon et al., 2014).
• Abolition of school fees. A number of African countries abolished school fees in the early 2000s, including Burundi, Ethiopia, Ghana, Mozambique and Tanzania – another very visible reform. Yet in practice, while it proved relatively easy to abolish school fees, the sustainable and long-term financing of education was much harder and received far less attention, especially while the focus was on maintaining the expansion in provision and manageable class sizes (Nicolai et al., 2014).
• Provision of text books and other teacher-learning materials. El Salvador, Guatemala and Nicaragua all pursued targeted policies for the provision of free textbooks to politically important but disadvantaged regions as part of prominent political campaigns (UNESCO, 2008, p. 42).
is rarely acknowledged is the extent to which the incentives for policymakers to ensure the provision of services are tied to perceptions of whether improvements in those services offer political ‘returns’ (Nicolai et al., 2014; Harris et al., 2014).
These political ‘returns’ relate to how easily politicians themselves can claim credit for a particular outcome and whether citizens who benefit from that outcome will link it to politicians’ performance (and reward them, by giving their support, as a result). This can translate into a strong focus on aspects of delivery that are highly
visible and tangible to politicians and users alike – from school construction to text-book distribution (Box 9). In education, it has reinforced an emphasis on enrolment and school construction rather than other, less visible, improvements to the quality of the education on offer. Making the longer term (and potentially politically costly) reforms needed to, for instance, improve teaching quality may be seen to offer far less of a political return than these visible investments in the short run.
Where these features of the education sector have been explicitly recognised, there have been efforts to adjust approaches, for instance to make learning itself more visible and politically important, as in India and parts of East Africa (through the Annual Status of Education Reports and Uwezo, respectively). These efforts have involved testing basic student competencies, with the full involvement of parents, communities, officials and others. This makes gaps in learning much more visible to parents and to local communities. Findings are then widely publicised to create broad awareness, generate public debate and to build momentum for change (ASER 2013; Uwezo, 2013). This helps to correct for the common bias towards visible, tangible improvements (such as building of classrooms) and build political pressure for improving teaching quality too.
The form and extent of sector characteristics will always depend on the wider context, but it is useful to recognise that there are also shared dynamics across sectors. In Tanzania, for example, efforts to address medicine stock-outs can learn from more effective reforms to textbook distribution (an equally mobile and sometimes valuable commodity) (Wales et al., 2014).
This can seem counter-intuitive. On the one hand, individual sectors appear to be ‘unique’ – water engineers will feel they have little in common with teachers and education practitioners; ministries of health will often be configured differently to those for education; donor

support to sanitation is structured very differently to that aimed at water supply. Yet different aspects of service delivery in these sectors can face shared challenges – problems of the mal-distribution of health workers can be similar to those of the mal-distribution of teachers; tendencies to prioritise visible investments in infrastructure are often the same in education (i.e. school building) as in water (boreholes, latrines); users can find it just as hard to question the performance of doctors as the performance of teachers, because of the professional knowledge needed to evaluate quality. Recognition of shared challenges opens the door to essential cross-sectoral learning.
4.2 Adaptive and entrepreneurialWhile using an approach that is problem driven helps to diagnose the nature of the problem, it also highlights the challenge of how to identify appropriate solutions. One lesson from efforts to support institutional reform is that some development change processes are highly uncertain. While the distribution of bed nets or vaccines, for example, may be ‘complicated’ in the sense that many things need to happen at the same time, these aspects are not in themselves ‘complex’. Where reform requires changing behaviour, shifting incentives or bringing together multiple, diverse and fragmented groups – in other words, where reform itself is uncertain, non-linear and involves forms of complex, adaptive systems – new approaches are needed (Ramalingam, 2013).
Adapting to failure
‘While we are rather willing to and even eager and relieved to agree with a historian’s finding that we stumbled into the more shameful events of history, such as war, we are correspondingly unwilling to concede – in fact we find it intolerable to imagine – that our more lofty achievements, such as economic, social or political progress, could have come about by stumbling rather than through careful planning, rational behavior and the successful response to a clearly perceived challenge.’
Albert Hirschman (1967)
In 1967 Albert Hirschman wrote of ‘The principle of the hiding hand’ according to which one way creativity emerges and solutions are ‘stumbled upon’ is through
having misjudged the nature of the task or the risks involved. Drawing on a set of paradoxes, he highlighted examples like the Karnaphuli Paper Mills in what was then East Pakistan. The mills were built to exploit the bamboo forests of the Chittagong Hill Tracts, but soon after their construction, the bamboo died unexpectedly (a phenomenon now known to occur around every 50 years). What mattered for Hirschman was the response to this crisis. In the face of potential losses of many millions of pounds, the mill owners found a way to bring in bamboo from other villages, creating a more diverse base of raw materials than would have previously been possible and setting up a new research programme that investigated new species. The response to initial poor planning, in reality, led to much greater creativity (Hirschman, 1967).
There have been many calls for learning and adaptation since the 1960s. In the late 1980s and early 1990s, there were calls for more ‘structured flexibility’ – highlighting examples from Asia and the Caribbean where this had resulted in better development outcomes (Brinkerhoff and Ingle, 1989). At the same time, there were questions on whether development projects and practitioners were learning the right lessons about how change happens. In 1989, Hulme looked at rural development in Papua New Guinea and the ongoing failures of development projects that did not learn from experience (Hulme, 1989). Similar concerns have been raised in relation to many development projects to this day (Eyben, 2009).
The World Bank’s 2015 World Development Report, Mind, Society and Behavior, puts these issues at centre stage, unusually for a report of this kind from such an organisation. The report gives an example of adaptation in practice, looking at the problem of diarrhoeal disease in Kenya. Efforts to find cost effective methods to tackle this problem, a major contributor to disease among children followed this course:
• Lack of access to clean water was diagnosed as the problem, leading to early efforts to improve the infrastructure of household water sources.
• This was found to have only moderate effects, as water could still be contaminated as it was carried or stored, leading to a redefinition of the problem as a lack of adequate water treatment at home, leading, in turn, to the provision of such as treatments.
• This was found to be unsustainable as households could not sustain the purchase and use of water treatment, leading to the design of free chlorine dispensers next to the water source. This proved to be a more cost-effective method for reducing the prevalence of diarrhoeal disease (World Bank, 2015).
Adapting development: Improving services to the poor 33
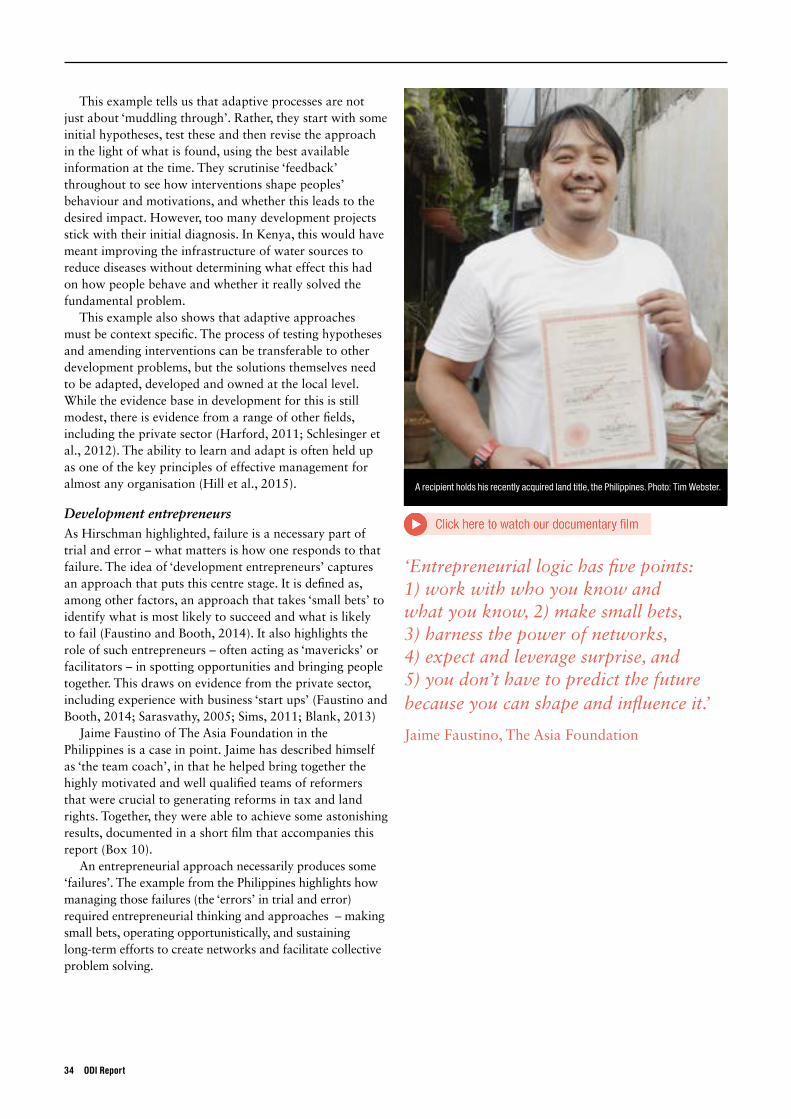
This example tells us that adaptive processes are not just about ‘muddling through’. Rather, they start with some initial hypotheses, test these and then revise the approach in the light of what is found, using the best available information at the time. They scrutinise ‘feedback’ throughout to see how interventions shape peoples’ behaviour and motivations, and whether this leads to the desired impact. However, too many development projects stick with their initial diagnosis. In Kenya, this would have meant improving the infrastructure of water sources to reduce diseases without determining what effect this had on how people behave and whether it really solved the fundamental problem.
This example also shows that adaptive approaches must be context specific. The process of testing hypotheses and amending interventions can be transferable to other development problems, but the solutions themselves need to be adapted, developed and owned at the local level. While the evidence base in development for this is still modest, there is evidence from a range of other fields, including the private sector (Harford, 2011; Schlesinger et al., 2012). The ability to learn and adapt is often held up as one of the key principles of effective management for almost any organisation (Hill et al., 2015).
Development entrepreneursAs Hirschman highlighted, failure is a necessary part of trial and error – what matters is how one responds to that failure. The idea of ‘development entrepreneurs’ captures an approach that puts this centre stage. It is defined as, among other factors, an approach that takes ‘small bets’ to identify what is most likely to succeed and what is likely to fail (Faustino and Booth, 2014). It also highlights the role of such entrepreneurs – often acting as ‘mavericks’ or facilitators – in spotting opportunities and bringing people together. This draws on evidence from the private sector, including experience with business ‘start ups’ (Faustino and Booth, 2014; Sarasvathy, 2005; Sims, 2011; Blank, 2013)
Jaime Faustino of The Asia Foundation in the Philippines is a case in point. Jaime has described himself as ‘the team coach’, in that he helped bring together the highly motivated and well qualified teams of reformers that were crucial to generating reforms in tax and land rights. Together, they were able to achieve some astonishing results, documented in a short film that accompanies this report (Box 10).
An entrepreneurial approach necessarily produces some ‘failures’. The example from the Philippines highlights how managing those failures (the ‘errors’ in trial and error) required entrepreneurial thinking and approaches – making small bets, operating opportunistically, and sustaining long-term efforts to create networks and facilitate collective problem solving.
‘Entrepreneurial logic has five points: 1) work with who you know and what you know, 2) make small bets, 3) harness the power of networks, 4) expect and leverage surprise, and 5) you don’t have to predict the future because you can shape and influence it.’
Jaime Faustino, The Asia Foundation
34 ODI Report
A recipient holds his recently acquired land title, the Philippines. Photo: Tim Webster.

Adapting development: Improving services to the poor 35
Box 10: Aiding tax and land rights reform in the Philippines Case study
In the Philippines, two significant reforms were achieved with support from The Asia Foundation and partners: the 2010 enactment of a law on Residential Free Patents (RFPs) which resulted in a 1,400% increase in residential land titling; and the congressional approval of a law restructuring excise tax on alcohol and tobacco, which ended a steady decline in the value of taxes on alcohol and tobacco. The former helped to resolve conflicts over land ownership and inheritance and helped to protect the poorest from losing their properties, while the latter generated over $1 billion, the bulk of which was earmarked for health expenditures for the poorest.
The Asia Foundation’s work in the Philippines was led by Jaime Faustino, a charismatic and well-connected staff member with strong links to local leaders and political players. He likens his role to that of a ‘coach’, supporting local leaders and teams to achieve their aims, rather than directing their activities. In both cases, the reforms were achieved by small teams of individuals who had worked on the issue for some time and who had high-level contacts in politics and commerce. These were managed by The Asia Foundation, which acted as an intermediary between front-line reform activists and the donor, USAID, which allowed them to work flexibly, rather than being tied to pre-defined timetables. Teams experimented with different ways of gaining support for (and formulating the objectives of) the reforms to avoid major opposition.
On property rights reform, Jaime Faustino and his team identified and helped steer a team of self-directed individuals with a shared commitment to public-policy reform. When differences of opinion emerged, the original team was split into two sub-teams (known informally as the Ateneo and the La Salle groups, reflecting their links with different universities in the Philippines). These explored distinct approaches to the common problem of incoherent land-titling systems. The La Salle group designed an approach to institutional reforms around titling. The Ateneo group focused on creating a digital database on land titles, which became mired in bureaucratic politics and was halted. Identifying ideas that are gaining traction, and ending support to ideas that are revealed to have less promise, is a key feature of the entrepreneurial approach.
While property rights reform required ‘back room’ negotiations with politicians, reforms to taxation on alcohol and cigarettes were broader and involved multi-media information campaigns and public mobilisation around public health issues, as well as highly tactical alliances. This required a small dedicated team from a few organisations that could overcome the coordination problems that can often beset large, broad-based teams. This team was able to link to broader health movements (such as the anti-smoking lobby) and make compromises with potential ‘spoilers’. For example, negotiations with the Nationalist People’s Coalition (NPC) party, led by the Chair of the San Miguel beer company, secured NPC’s support in return for limits on excise increases on beer. British American Tobacco (BAT) also became an informal ally, as previous legislation had allowed lower rates of tax to current producers, prejudicing market entrants. BAT, as a new entrant, supported new rates applied to all, even though these would be higher, for the sake of a level playing field. Interesting differences can be seen between these two examples: the property rights example meant working around entrenched interests, while public health reforms meant dividing and shaping dominant interests in new ways (Booth, 2014, p. 31).
This approach has been termed ‘development entrepreneurship’, because local reformers are recruited to lead processes of reform in a flexible, politically attuned way (Faustino and Booth, 2014).
Sources: Booth (2014), Faustino and Booth (2014).
2003
2004
2005
2006
2007
2008
2009
2010
2011
2012
2013
0 10,000 20,000 30,000 40,000 50,000 60,000
Yea
r
Residential land titles issued per year
Exci
se ta
x re
venu
e fro
m a
lcoh
ol a
nd to
bacc
o (b
illion
s of
200
0 pe
sos)
60,000
30
40
10
20
2000
2013
2012
2011
2010
2009
2008
2007
2006
2005
2004
2003
2002
2001
1999
1998
TobaccoAlcohol
Year
Exci
se ta
x re
venu
e fro
m a
lcoh
ol a
nd to
bacc
o (b
illion
s of
200
0 pe
sos)
Sources: Philippines Department of Environment and Natural Resources and Philippines Department of Finance.

Working in teams and coalitionsExternal facilitators have a role in stimulating development entrepreneurship, but their role is often to coach, not lead. Effective, multi-skilled teams are crucial for the discovery of overlapping interests among stakeholder groups and collective action, whether publicly or behind the scenes, in pursuit of a common objective. Such teamwork can, increasingly, draw on insights from the private sector and management theory (Faustino and Booth, 2014).
Working in coalitions and in entrepreneurial ways is also proving valid for efforts to support social accountability and civil-society activity. Jonathan Fox (2014), for example, finds that the social accountability interventions around the world that have been more effective are those that have built strategic alliances and coalitions with others. He distinguishes between the more limited demand-side initiatives, which often assume that information and citizen action on its own will lead to change and what he calls ‘strategic’ approaches, where
‘Generally on your team you need three types of people; the first one will have technical skills, the second will provide the political skills and networks, and thethird one, we refer to as the insider. The insider is the hardest one to find; these people come from either the sector or agency or the reform area that you’retrying to reform or change. They bring both some understanding of the businessmodel of why the sector works that way, and they also bring their own politicalnetwork of the people inside that sector.’
Jaime Faustino, The Asia Foundation.
36 ODI Report
Box 11: State Accountability and Voice Initiative (SAVI) in Nigeria Case study
SAVI (State Accountability and Voice Initiative) is a programme in Nigeria that was designed to work on the ‘demand side’ of governance, with funding from the UK Department for International Development (DFID). It has been able to achieve a number of reforms at the state level in Nigeria including improved budgeting and better access to health and education for marginalised groups. The role of SAVI is to help State Houses of Assembly, mass-media organisations and civil-society organisations (CSOs) take action on public-sector problems, mainly in health, education and state budgeting.
SAVI is not, however, a standard ‘demand-side’ donor programme and its approach is unusual in many ways. For example, SAVI does not award grants to CSOs to engage on advocacy issues that have been pre-selected by the donor. And rather than encouraging CSOs to take an adversarial approach, it focuses on addressing challenges through collective problem-solving, seeking constructive engagement and building partnerships.
SAVI itself also manages to keep a low profile, with Nigerian programme staff providing mentoring and support to stakeholders, including government staff, so that they can collaborate to resolve shared concerns. The SAVI team has in-depth experience and knowledge of Nigeria, including both local leaders and expatriates who have worked in Nigeria for more than two decades. They have often operated with limited visibility and branding, to facilitate and support local problem-solving rather than to provide external solutions.
An important feature of SAVI is that it was designed in steps. It was relatively ‘under-designed’ at inception, without a heavily pre-determined set of outputs and activities. With significant experience and expertise, the implementation team was able to convince DFID of the importance of a ‘learning by doing’ approach. This built heavily on lessons from the JEWEL (Jigawa Enhancement of Wetlands Livelihoods) project (2002-2008), which was seen as an important model for addressing conflict over the management of natural resources in northeast Nigeria. It too used an approach that did not include NGO grant funding and that adopted a ‘no branding’ policy.
Source: Booth and Chambers (2014).
Adapting development: Improving services to the poor 37
there is greater evidence of impact, and that aim to build collaboration and coordination between citizens, government actors and others (Fox, 2014).
The State Accountability and Voice Initiative (SAVI) programme in Nigeria (Box 11) provides an example of an accountability programme to build genuine partnerships of like-minded and committed actors at the state-level in a country shaped by patronage, informal relations and volatility. SAVI has had a number of successes, from a major breakthrough on disability policy and legislation in Lagos (with implementation funded by the state government), to a precedent for the control of corruption via community monitoring of state government in Jigawa. Part of SAVI’s effectiveness lies in its ability to harness both political understanding and ‘skills’ (in convening, facilitating and brokering between groups), although analysis finds it has not always reached its full potential as a result, in part, of initial design flaws (Booth and Chambers, 2014).
While SAVI is funded by DFID, the programme is managed at arm’s length and by those who understand the context. Designed originally as a ‘demand-side’ programme, it has taken a different approach in practice. Rather than providing grants to civil-society organisations on donor-defined issues, it has focused on building genuine multi-stakeholder partnerships in areas where it has been possible to get political traction, and that are seen as locally relevant (Booth and Chambers, 2014).
4.3 Taking action that is locally led Who are the actors that can carry out the search for solutions in adaptive ways? In almost all cases, it is the local actors who can make a difference. These are defined as those who are close to the problem, including its underlying causes, and who have a strong and enduring interest in its resolution. They could be central or local government officials, civil-society groups, private-sector groups or communities.
Local ownership and leadership are hardly new concepts in the development vocabulary and concepts such as participation have featured repeatedly in development work. However, this has rarely resulted in forms of genuine local leadership in many countries. This is, in part, because of the tick-box nature of the ‘aid effectiveness agenda’, with ‘ownership’ defined as the government signing up to a development plan (Booth, 2011) or ‘participation’ reduced to the holding of meetings and workshops. This can reinforce the forms of isomorphic mimicry already highlighted, and has rarely created space to develop genuine local leadership or to focus attention on the issues that matter most to people in any given country.
Booth and Unsworth highlight the importance of addressing locally salient problems that are relevant for
potential beneficiaries and also for individuals or groups that have the power to influence the problem. This is essential for identifying a problem that has the potential for developmental impact and local traction (Booth and Unsworth, 2014).
User-led developmentOne way to develop locally-led solutions that can improve service delivery is through ‘user-led’ development. This is based on the idea that service users themselves can provide valuable knowledge and creative solutions to the problems they are having with the services they use or would like to use (Keinz et al., 2012). This turns the notion of ‘participation’ on its head – rather than asking citizens to participate in policymaking, it requires policymakers to see things from the perspective of the citizen (or ‘user’). Indeed, there is good documentation on how public- and private-sector organisations around the world can increase their effectiveness by involving ‘users’ in programme design and efforts to improve the services or products on offer
(Chesbrough, 2003; von Hippel, 2005; Keinz et al., 2012).What does user-led development look like in practice,
and how does it relate to development programmes? One example is an initiative led by two Autonomous Regions in the Caribbean coast of Nicaragua and UNICEF (Villa and Hammer, 2013). Government officials recognized that the region’s diversity of indigenous and non-indigenous groups meant that policymaking needed to be based on a more detailed understanding of the population they were serving. Officials in those regions and UNICEF, in collaboration with the social-innovation companies Reboot and Policy Lab, immersed in participatory design research techniques for the development of two regional policies for children.
This meant immersing regional policymakers and UNICEF staff in the communities in which they worked, so that they could experience at first-hand what it was like to use public services in different areas. Activities included shadowing a young single mother, attending both a public and a private school, spending a night at a residence for pregnant women and buying medicine for a sick child. The personal experience of these services as users gave policymakers a new knowledge of the everyday barriers faced by their constituents when trying to access public services, and enabled the development of a new policy that better recognised the needs of mothers and children in the different communities.

User-led approaches are already becoming established in other sectors too – support to justice, for example, has increasingly sought to understand how users actually navigate justice systems, including the multiple avenues and types of justice system that people can access. Rather than focusing only on the formal justice system, a user-led approach reinforces the need to look at customary processes, forms of alternative dispute resolution (e.g. use of paralegals or the role of human-rights organisations), and international justice systems, all of which may be accessed by individuals and groups who want redress. Understanding how these delivery chains operate, and how users will move across and in and out of them provides important insights into the realities of what services users are – and are not – accessing (Denney and Domingo, 2013).
As these examples suggest, user-led development implies that giving public-sector officials and development practitioners an opportunity to experience what it is like to be the service user helps to create empathy and can dispel
pre-conceived ideas about what people want and how they will behave. Rather than policymakers simply assuming they know what the problem is, it is important to engage with the people who will use the service they are designing.
Locally-led development does not, however, concern only the end-users. Solving development problems often requires working with different levels of government as well as civil society, private-sector organisations, media bodies and others. The crucial factor is that these are all actors for whom engagement on a particular development problem has real significance. Again, calls for such ‘immersive’ practice are not new. But they are not the norm in much development policy and practice to date. They are, furthermore, rarely the norm for aid-funded programmes. What might it take to achieve change in how aid can support such locally led reform? The final section of this report sets out a view on what doing things differently means for aid policy and the politics of aid.
38 ODI Report

5 A fresh approach to the politics of aid

The lessons and examples set out in the previous section are primarily aimed at governments and other in-country actors. Recent research on the prospects for the emergence of developmental political regimes in sub-Saharan Africa (Booth, 2015) suggests the inclusion of a problem-solving and adaptive style of policymaking in the very definition of a developmental regime. Changes in domestic politics and policy processes are by far the most important drivers of development. Shifts in climate and trade patterns, competition for natural resources, and the regulation of financial, drug and armaments flows at the global level, are all more important than aid in setting the parameters for country governance (OECD, 2012). What’s more, official development assistance (ODA) is, increasingly, only one of several forms of development finance (Greenhill et al., 2013), and donors have less influence on country processes than they did in the past.
Nonetheless, we turn our attention to ODA in this final section. We are interested in what changes in the way aid is designed, delivered and discussed would boost the chances of the proposed innovations in policy design for service delivery being adopted and sustained. Donor leverage at country level may be limited, but it is not insignificant, and both within countries and at the global level, the discourse of the development ‘business’ still has an influence on the way governments and non-governmental interest groups and social movements view their options. So, the way in which this agenda-setting influence is exercised still matters.
The changes we see as necessary in the orientation of aid agencies will, of course, need backing from the highest level. Aid practice cannot be expected to change if key decision-makers lack a broadly supportive environment. In the case of an official bilateral agency, this requires guidelines that are endorsed, and actively advocated, by senior civil servants, ministers and other influential politicians. In turn, shifts are needed in the way aid is publicly debated and perceived by voters. This is why, in the remainder of this section, we concern ourselves with both aid policy and the politics of aid in donor countries.
We propose some major changes in the way aid programmes are treated in public-policy debates, at both technical and political levels:
• a greater investment in more politically smart and locally led initiatives
• a renewed but changed results orientation that tracks both MDG-type outcomes and intermediate changes in process (e.g. how locally led it is) that are crucial to improving those outcomes
To build a conducive environment for these recommendations, we also propose:
• an explicit refocusing of the debate on how aid works. • a new and more honest dialogue with the public on how
aid can best support genuine and lasting development.
5.1 Aiding development that is locally led and politically smart Aid could do more than it does at present to support initiatives, such as those outlined in Section 4, that are problem-driven, adaptive and locally led. Such initiatives need financial and other support that is fit for that purpose. Too often, aid funding can come with its own strings attached – prescribing what solutions should look like, and how they should be achieved. Many working in aid, it is often argued, still have ‘planner’ mindsets, determined by hard-wired notions of a ‘project’ with a set of prescribed activities (Eyben, 2009; Natsios 2010). Does it always have to work this way? Not necessarily. As we have seen, some examples of aid support already aim to be more flexible, more adaptive and to bring more learning to their approach. The recent Better Delivery agenda within DFID is attempting to mainstream some of this across the agency as a whole too.10
This represents a real break from the past. Genuine local ownership and leadership are, ultimately, questions of power and are far more radical than previous notions of participation. Local actors are empowered to determine their own solutions, and where external actors are involved, it may be predominantly as facilitators or in creating the right enabling environment, rather than as managers.
Booth and Unsworth (2014) reviewed seven cases of aid-supported programmes that were both ‘locally led’ and ‘politically smart’, from countries as diverse as the Democratic Republic of Congo, India, Myanmar, Nepal and the Philippines (a selection of which are described in Box 2). They find that what matters is establishing relationships in which aid money is not the primary motivator or a major influence on how development programmes are carried out.
Similar points have been made in a recent ‘Local First’ initiative started by Peace Direct. This looks at how aid approaches can prioritise the views and leadership of people and organisations in the countries affected over those of outsiders (Pinnington, 2014). Drawing on another set of case studies that show where such ‘local first’ approaches have produced real results, it finds that the nature of the funding mechanisms can be very important. Some of the key recommendations from this report are summarised in Box 13, and include providing core funding in ways which are flexible and responsive to the stage of an organisation’s development, as well as encouraging organisations to mobilise revenue locally too where they can.
10 See recent commentary from DFID staff leading this review here: http://oxfamblogs.org/fp2p/dfid-is-changing-its-approach-to-better-address-the-underlying-causes-of-poverty-and-conflict-can-it-work-guest-post-from-tom-wingfield-and-pete-vowles/.
40 ODI Report
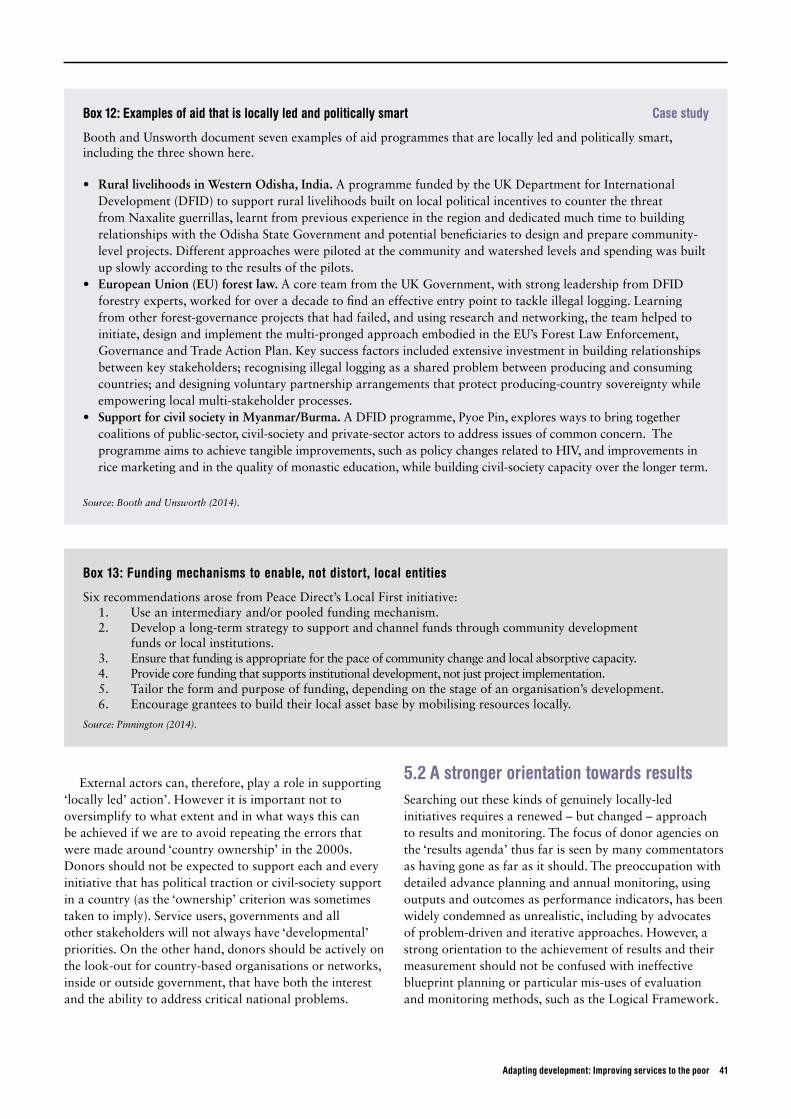
Adapting development: Improving services to the poor 41
External actors can, therefore, play a role in supporting ‘locally led’ action’. However it is important not to oversimplify to what extent and in what ways this can be achieved if we are to avoid repeating the errors that were made around ‘country ownership’ in the 2000s. Donors should not be expected to support each and every initiative that has political traction or civil-society support in a country (as the ‘ownership’ criterion was sometimes taken to imply). Service users, governments and all other stakeholders will not always have ‘developmental’ priorities. On the other hand, donors should be actively on the look-out for country-based organisations or networks, inside or outside government, that have both the interest and the ability to address critical national problems.
5.2 A stronger orientation towards resultsSearching out these kinds of genuinely locally-led initiatives requires a renewed – but changed – approach to results and monitoring. The focus of donor agencies on the ‘results agenda’ thus far is seen by many commentators as having gone as far as it should. The preoccupation with detailed advance planning and annual monitoring, using outputs and outcomes as performance indicators, has been widely condemned as unrealistic, including by advocates of problem-driven and iterative approaches. However, a strong orientation to the achievement of results and their measurement should not be confused with ineffective blueprint planning or particular mis-uses of evaluation and monitoring methods, such as the Logical Framework.
Box 12: Examples of aid that is locally led and politically smart Case study
Booth and Unsworth document seven examples of aid programmes that are locally led and politically smart, including the three shown here.
• Rural livelihoods in Western Odisha, India. A programme funded by the UK Department for International Development (DFID) to support rural livelihoods built on local political incentives to counter the threat from Naxalite guerrillas, learnt from previous experience in the region and dedicated much time to building relationships with the Odisha State Government and potential beneficiaries to design and prepare community-level projects. Different approaches were piloted at the community and watershed levels and spending was built up slowly according to the results of the pilots.
• European Union (EU) forest law. A core team from the UK Government, with strong leadership from DFID forestry experts, worked for over a decade to find an effective entry point to tackle illegal logging. Learning from other forest-governance projects that had failed, and using research and networking, the team helped to initiate, design and implement the multi-pronged approach embodied in the EU’s Forest Law Enforcement, Governance and Trade Action Plan. Key success factors included extensive investment in building relationships between key stakeholders; recognising illegal logging as a shared problem between producing and consuming countries; and designing voluntary partnership arrangements that protect producing-country sovereignty while empowering local multi-stakeholder processes.
• Support for civil society in Myanmar/Burma. A DFID programme, Pyoe Pin, explores ways to bring together coalitions of public-sector, civil-society and private-sector actors to address issues of common concern. The programme aims to achieve tangible improvements, such as policy changes related to HIV, and improvements in rice marketing and in the quality of monastic education, while building civil-society capacity over the longer term.
Source: Booth and Unsworth (2014).
Box 13: Funding mechanisms to enable, not distort, local entities
Six recommendations arose from Peace Direct’s Local First initiative:1. Use an intermediary and/or pooled funding mechanism.2. Develop a long-term strategy to support and channel funds through community development
funds or local institutions.3. Ensure that funding is appropriate for the pace of community change and local absorptive capacity.4. Provide core funding that supports institutional development, not just project implementation.5. Tailor the form and purpose of funding, depending on the stage of an organisation’s development.6. Encourage grantees to build their local asset base by mobilising resources locally.
Source: Pinnington (2014).
Doing things differently should actually be more oriented towards results in two respects. First, over reasonable periods of time (which will vary according to the objective), programmes should be able to make plausible claims of having made a contribution to positive development gains, or else they should not be supported. Second, much greater efforts should be made to build up and document experience on the intermediate change processes that make a demonstrable contribution to improved development outcomes. Once some robust metrics have been established, they should be used for close monitoring of efforts that are being directed in the right ways or that need to be redirected. The community of practice that has emerged around the Doing Development Differently manifesto has started some work on this and is committed to doing more (www.doingdevelopmentdifferently.com).
This initiative has been a long time coming and the reasons for the delay hark back to our discussions in Section 3. For about 25 years, the development assistance community has acted as if it already knew the kind of intermediate process changes that are important for outcomes. For example, mainstream governance indicators were meant to track key intermediate variables. As we have argued, however, such indicators have not been effective in mapping relevant process changes.
There is some promising work to shift the focus of governance indicators to measures of state capacity that capture performance in core functions, rather than the adoption of particular institutional forms. Examples include the ability of a state to register all children at birth or to reduce road-traffic deaths; both of these calls for a type of state capability that could be applied to a range of development challenges.11 However, there is also a broader need for a better approach to identifying and measuring practical steps that can be shown to lead to improved outcomes.
The evidence summarised in Section 4 suggests that there are sufficient reasons to do more to track processes that are genuinely locally led and problem-solving, and that involve a high degree of adaptation to context and learning. Process measures of this sort could include the following.
• Measures of the extent to which issues have local salience or relevance, and whether processes give priority to local leadership and capacity. This could be based on asking simple questions about the extent to which users and local networks and organisations are involved in issue selection, design and implementation, or through perception or survey data to track how this changes over time.
• Evidence of adaptation to context. This means taking into account sub-national variance, local (formal and informal) institutions, the strength of networks, power
relationships and more. This might include evidence of the use of the best knowledge available about the local political economy and its dynamics.
• Evidence of learning in action. This would measure the use of feedback loops, of evidence on past experience, and adaptation to changing conditions on the ground.
• Measures of innovation and entrepreneurial action. Sources of inspiration here may include recent attempts to monitor and measure innovation processes and impacts (Puttick et al., 2014). Another type of test could assess the extent to which initiatives rest on a series of ‘small bets’ – i.e. spread their risk across activities – and specify the ways in which they will test and measure the effectiveness of different approaches.
It is important, however, to avoid choosing intermediate progress indicators that rely solely on past experience of what works, even if this experience seems solid. One of the central ideas inspiring the movement for Doing Development Differently is that many of the most difficult problems encountered in development do not have known solutions – a key reason to favour the types of processes listed above. But creating the space for these processes is just a starting-point. We also need to find ways in which locally led, learning-oriented organisations can self-monitor and regulate their efforts to achieve their final objectives. The recent paper on development entrepreneurship by Faustino and Booth (2014) contains a discussion of how to define and use robust progress metrics, based on the literature on successful business start-ups (Box 14, overleaf).
All of this means working in ways that accumulate evidence on what works to generate development results. The suggestion here is that all donor-supported programmes should be oriented to improving development outcomes, including governance programmes that are often implemented in isolation from those outcomes, and all should be guided by a high level of agnosticism (or open mindedness) about the processes and actions that are most likely to lead to the desired results.
Creating more space for politically smart and locally led aid approaches can therefore be supported by better measurement. This would help to build up a more consistent evidence base than is possible at present, where there are a growing number of largely ad hoc case studies, undermining efforts to look comparatively. It would also ensure greater testing of the assumptions that more politically smart and locally led approaches would work better. While there is greater evidence (including from outside the development field) for this, more testing is needed, for instance to determine whether there are particular conditions under which such approaches work
11 In the context of our earlier discussion of SDG governance targets, this approach would suggest not using broad measures of accountability or transparency but setting objectives such as birth registration for all children by 2030; reductions in gaps between budget allocations and executions in different sectors; or reductions in disparities of access to services, by region, gender and ethnicity (Foresti and Wild et al., 2014).
42 ODI Report
Adapting development: Improving services to the poor 43
best or contexts and issues where they will not work, under any circumstances.
We have argued throughout that a big part of what is needed is greater learning and adaptation, including learning from failure. Yet it has been well-documented that for large donor organisations, their internal incentives can work against this (see for example Ostrom et al., 2001; Eyben, 2009; Natsios, 2010). Pressures to spend and disburse money are frequently cited as undermining the scope to learn and adapt in real time. Similarly, the ‘authorising environment’ is seen as weak, in that there may be little political or public tolerance for failure. We feel that these characteristics are not necessarily ‘fixed’. Hence, in 5.3 and 5.4, we look at what could change to create greater space for locally led aid approaches.
5.3 How aid works, not how muchClosing financial gaps did figure prominently in the original economic rationale for aid. Even today, there are development bottlenecks that can only be released with a timely injection of hard currency and there is a persuasive argument, in some circumstances, for ‘just giving money to the poor’ (Blattman and Niehaus, 2014). However, it has long been recognised that this is not the main story on aid, one reason being that aid injections do not normally increase the domestic resources available for supporting basic services.12
Given that development is driven domestically, the main aid story is about the net effects of the whole package that accompanies the country-to-country financial transfer, especially the political and negative impacts on political incentives. It is about how the aid relationship affects what country leaders and others do with the total envelope of resources available for development. What is going to make the difference to the attainability of the SDGs, therefore, is not only whether countries command adequate resources but also whether they use those resources to support problem-solving, learning-oriented approaches to development. Thus the key benchmark against which a donor country programme should be judged is not whether it reaches a given disbursement target but whether its programming supports such approaches, and is effective in getting results.
This has special relevance in the current UK context, having reaching the 0.7% ODA/GNI target in 2013. There are many areas in which additional spending of benefit to developing countries could easily be justified and should be supported, including a greatly increased output of global public goods, such as agricultural and medical technologies. However, the 0.7% target still reflects a view on what donor countries can afford to spend, rather than what the present generation of needy countries can productively absorb or how effective that spending is.
There is a great deal of anecdotal evidence that committing donor country programmes to spending a pre-established amount can undermine the quality of those programmes; this was a key finding of an evaluation of the Swedish development agency over a decade ago (Ostrom et al., 2001). It can ramp up motivations to spend, resulting in funds being committed to purposes that might not otherwise be considered important or wise. It is reasonable to assume that this can do harm in the recipient country, adding to the volume of poorly utilised local capacity as well as to the long-recognised negative effects of large aid volumes on institutions.13
12 As Foster and Killick (2006: 3) put it, ‘aid only enables an economy to invest and consume more by financing an increase in imports. If the aid is simply spent on domestically produced goods and services, it does nothing to increase their supply’.
13 For example, ‘moral hazard’ effects, where recipient-country policy-makers are discouraged from finding their own solutions to development problems (Gibson et al., 2005; Moss et al., 2008) and incentives to engage in isomorphic mimicry as discussed in Section 3.
Box 14: Actionable metrics linked to multiple, time-specific theories of change
To respond to uncertainty in new markets, successful business start-ups employ the logic of making ‘small bets’, and adjusting frequently, rather than risking everything on a fully formed idea. Applying this idea to development work means refreshing standard approaches to both planning and monitoring. For planning, applicable tools include a series of time-specific theories of change, where the assumptions about how the desired change is likely to happen are regularly revisited and revised in the light of experience. Monitoring, in this context, is challenging but very important. Until the final, ‘tangible’ objective is reached, practitioners must be hard-headed in identifying a few quantitative indicators based on the current theory of change that tell them whether enough progress is being made to justify persisting with this approach, rather than ‘pivoting’ and trying something else. The metrics need to be robust enough to serve this purpose. They must not be just ‘vanity metrics’ that make the project look good. This means they must be subject to rigorous internal and possibly external peer review and challenge.
Source: Faustino and Booth (2014: 17-19).
Supporting development differently at the level of country programmes may well, in some cases, mean spending less, spending more slowly and/or spending in a way that responds to the clear needs of the recipient country, rather than to donor-country priorities. Having better measurement of politically smart and locally led aid should enable a shift in focus from total amounts of aid spent to how that aid is used. It should reinforce a focus on aid as a facilitator or broker for locally led action, rather than a manager of it. This could be used as an opportunity to re-start or re-shape global debates and processes around aid effectiveness, which in the past often assumed an overly technocratic guise and have lost traction in recent years.
5.4 An honest public dialogueA common refrain from our work with donor practitioners is that the ‘authorising environment’ is perceived as being weak for doing things differently, because there is little political or public tolerance for failure or uncertainty. Recommendations in this section so far have aimed to address this, looking at how to measure such approaches and better demonstrate their utility. But there is also a need for changes in how we communicate, something that parts of the development community have been discussing for some time.
Already, a growing body of research in some of the main donor countries highlights the extent to which simplistic aid messages no longer cut it. Research funded by The Gates Foundation, as part of ‘The Narrative Project’, has been conducted in France, Germany, the UK and the US, using opinion polling, surveys and focus groups. The findings from across these countries are consistent in emphasising that too much of today’s communication on development focuses on an image of helpless human suffering that can be alleviated through more aid.14 A more nuanced narrative, which starts with the unprecedented progress that has been made over recent decades,
recognises some of the limits of aid, acknowledges failures, and highlights what else needs to change, would be more convincing.
Separate, deliberative research in the UK has found that the images used for communications and fundraising by NGOs and governments may have contributed to public scepticism too. This research finds that the repeated use of images that show people living in desperate need have created an impression that very little has changed in recent decades. The same research found that there is, in fact, a real appetite for greater understanding of development and for more complex stories about how change happens. Instead of simple reassurance that ‘aid works’, people want to understand how and why it works, where it doesn’t work, and how to address that failure (Glennie et al., 2012).
What would an improved dialogue look like? First and foremost, the rationale for providing aid should focus neither on the narrow self-interest of the donor country nor on a pious or paternalistic benevolence. Polling evidence shows there is a strong moral impulse behind support for aid, with surveys consistently picking up the view that it is the ‘right thing to do’ despite a healthy scepticism about the honesty and trustworthiness of country leaders (cited in Glennie et al., 2012). This is unreservedly a good thing, reflecting, in part, a concern about fairness and an appreciation of the realities of an inter-connected world. It provides a solid foundation for a frank and mature debate about how best to use aid. In contrast, the ‘heart-string’ appeals that emphasise the level of need and want around the world are unhelpful in this respect. Such appeals may be effective for fundraising (and are needed in very specific cases of immediate humanitarian response) but, in general, mass communications about development should be far more open about how development really happens, and what the typical obstacles are. The importance of facilitating countries to solve their own problems should be a central theme.
14 Unpublished research findings, presented at a UK workshop, July 2014. See The Gates Foundation (2014).
44 ODI Report

6 Conclusions
This report has drawn attention to the possibility that the international campaign around the SDGs will reproduce some key limitations of the MDG experience. There is a real danger that the world will continue to make highly uneven progress in meeting the basic needs of its people, with large inequalities in service provision among countries and within them, and growing absolute numbers of people experiencing extreme deprivation for decades to come.
We began by highlighting several ways in which the global discussion around the post-2015 agenda has recognised the need to adjust to a changed and changing global context. Climate change, for example, alters the idea that poorer countries only need to ‘catch up’ to richer ones, as in reality all countries need to change their practices. Many more of the world’s poor are living in middle-income countries. In several sectors, basic service targets need to be focused on quality as well as inclusion. However, we have argued, there are key areas where the SDG discussion is not inviting different commitments, but is still focused on more of the same.
A key danger is that discussions of what it will take to achieve the new goals will, once again, centre on financing gaps. During the pursuit of the MDGs, this focus reinforced the belief that inadequacies in provision could be dealt with easily enough if there was enough new funding on the table. Today, with higher rates of economic growth in many parts of the developing world, there is a new temptation to assume that growth, by itself, will take care of the problem.
There is also a growing recognition that it is the function as well as the form of institutions that matters for translating resources into results. But, on international platforms, there is a lack of realism about the type of change processes and the institutional adjustments that have been linked to development breakthroughs in recent times and in past history (including in Europe). This fuels illusions about how easy it is going to be, in a typical poor country, to tackle the gaps and inequities illustrated in Section 2. It fails to capture the important lessons that have been learned over the past 25 years about the ways in which domestic reformers and international agencies, working together, can make headway on things that matter, even in contexts that seem unpromising at first.
Certainly, the evidence base for doing things differently needs to become stronger, and more needs to be said and debated about the scope for taking these different approaches to scale. But there is no excuse for a continued reliance on more of the same methods when it comes to seeking and supporting development progress.
This report has therefore advocated an approach to the SDGs that is grounded in history and experience. That means starting with a realistic perspective on how development happens, including recognition that it is driven overwhelmingly by domestic forces, that it is difficult, that it is often slow, and that it is subject to many uncertainties. It calls for the international community – and developing country governments in particular – to help shift the post-2015 debate away from goals and targets and towards implementation and delivery.
Given the uncertain nature of development, it is also vital that both domestic reformers and their international allies find ways of working together that are problem-driven and adaptive. In addition, successful development action must not only be politically informed and realistic, but also politically smart.
This is needed because there is no simple blueprint for ‘doing development’. As is the case around the world, making progress is complex, every situation is different and things change all the time. To work effectively requires being able to seize unexpected opportunities, adjust to disappointments and discover ways around apparently insuperable barriers, often by trial and error. It means having the courage to fail, and to see failure as a crucial part of learning. It can be led by ‘entrepreneurs’ and often involves working strategically with and through coalitions.
We have shown, in this report, some of the promising starts that have already been made to do things differently, but what is needed now is a much more concerted effort to adopt this approach more widely. This does mean some significant changes for aid agencies. Intermediate change is already under way in some agencies, in the form of restructuring or a renewed emphasis on delivery and implementation.15 Yet for this to lead to truly transformational change means facing up to some uncomfortable realities.
It requires shifts in how aid organisations think about their role and in how they provide support, from acting as managers to becoming facilitators of locally led change. It requires new measures of progress, to avoid becoming another ‘tick box’ exercise and to ensure any changed approaches are themselves rigorously tested. It needs a new narrative too – talking less about aid volumes and more about how aid works and its (sometimes limited) role in development.
This report aims to contribute to such a debate, in the hope of pushing development policy and practice further and faster, to achieve good quality services for all.
15 See DFID’s recent Better Delivery review (DFID, 2014; Wingfield and Vowles, 2014) and a recent World Bank/GIZ Global Delivery Initiative (Algoso, 2014).
46 ODI Report

Statistical annex
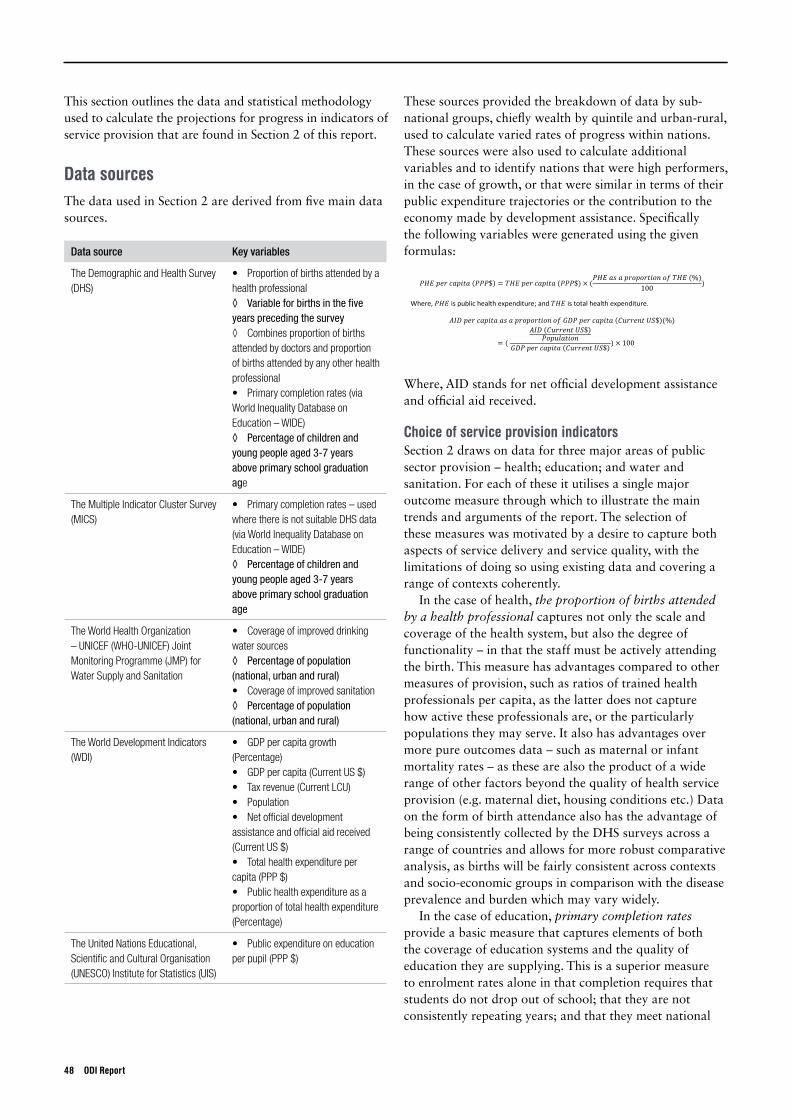
This section outlines the data and statistical methodology used to calculate the projections for progress in indicators of service provision that are found in Section 2 of this report.
These sources provided the breakdown of data by sub-national groups, chiefly wealth by quintile and urban-rural, used to calculate varied rates of progress within nations. These sources were also used to calculate additional variables and to identify nations that were high performers, in the case of growth, or that were similar in terms of their public expenditure trajectories or the contribution to the economy made by development assistance. Specifically the following variables were generated using the given formulas:
Where, AID stands for net official development assistance and official aid received.
Choice of service provision indicatorsSection 2 draws on data for three major areas of public sector provision – health; education; and water and sanitation. For each of these it utilises a single major outcome measure through which to illustrate the main trends and arguments of the report. The selection of these measures was motivated by a desire to capture both aspects of service delivery and service quality, with the limitations of doing so using existing data and covering a range of contexts coherently.
In the case of health, the proportion of births attended by a health professional captures not only the scale and coverage of the health system, but also the degree of functionality – in that the staff must be actively attending the birth. This measure has advantages compared to other measures of provision, such as ratios of trained health professionals per capita, as the latter does not capture how active these professionals are, or the particularly populations they may serve. It also has advantages over more pure outcomes data – such as maternal or infant mortality rates – as these are also the product of a wide range of other factors beyond the quality of health service provision (e.g. maternal diet, housing conditions etc.) Data on the form of birth attendance also has the advantage of being consistently collected by the DHS surveys across a range of countries and allows for more robust comparative analysis, as births will be fairly consistent across contexts and socio-economic groups in comparison with the disease prevalence and burden which may vary widely.
In the case of education, primary completion rates provide a basic measure that captures elements of both the coverage of education systems and the quality of education they are supplying. This is a superior measure to enrolment rates alone in that completion requires that students do not drop out of school; that they are not consistently repeating years; and that they meet national
𝑃𝑃𝑃𝑃𝑃𝑃𝑃𝑃𝑃𝑃𝑃𝑃 𝑝𝑝𝑝𝑝𝑝𝑝𝑝𝑝𝑝𝑝𝑝𝑝 𝑐𝑐𝑐𝑐𝑐𝑐𝑐𝑐𝑝𝑝𝑝𝑝𝑐𝑐𝑐𝑐𝑐𝑐𝑐𝑐𝑐𝑐𝑐𝑐 (𝑃𝑃𝑃𝑃𝑃𝑃𝑃𝑃𝑃𝑃𝑃𝑃$) = 𝑇𝑇𝑇𝑇𝑃𝑃𝑃𝑃𝑃𝑃𝑃𝑃 𝑝𝑝𝑝𝑝𝑝𝑝𝑝𝑝𝑝𝑝𝑝𝑝 𝑐𝑐𝑐𝑐𝑐𝑐𝑐𝑐𝑝𝑝𝑝𝑝𝑐𝑐𝑐𝑐𝑐𝑐𝑐𝑐𝑐𝑐𝑐𝑐 (𝑃𝑃𝑃𝑃𝑃𝑃𝑃𝑃𝑃𝑃𝑃𝑃$) × (𝑃𝑃𝑃𝑃𝑃𝑃𝑃𝑃𝑃𝑃𝑃𝑃 𝑐𝑐𝑐𝑐𝑎𝑎𝑎𝑎 𝑐𝑐𝑐𝑐 𝑝𝑝𝑝𝑝𝑝𝑝𝑝𝑝𝑝𝑝𝑝𝑝𝑝𝑝𝑝𝑝𝑝𝑝𝑝𝑝𝑝𝑝𝑝𝑝𝑐𝑐𝑐𝑐𝑐𝑐𝑐𝑐𝑝𝑝𝑝𝑝𝑝𝑝𝑝𝑝 𝑝𝑝𝑝𝑝𝑜𝑜𝑜𝑜 𝑇𝑇𝑇𝑇𝑃𝑃𝑃𝑃𝑃𝑃𝑃𝑃 (%)
100)
Where, 𝑃𝑃𝑃𝑃𝑃𝑃𝑃𝑃𝑃𝑃𝑃𝑃 is public health expenditure; and 𝑇𝑇𝑇𝑇𝑃𝑃𝑃𝑃𝑃𝑃𝑃𝑃 is total health expenditure.
𝐴𝐴𝐴𝐴𝐴𝐴𝐴𝐴𝐴𝐴𝐴𝐴 𝑝𝑝𝑝𝑝𝑝𝑝𝑝𝑝𝑝𝑝𝑝𝑝 𝑐𝑐𝑐𝑐𝑐𝑐𝑐𝑐𝑝𝑝𝑝𝑝𝑐𝑐𝑐𝑐𝑐𝑐𝑐𝑐𝑐𝑐𝑐𝑐 𝑐𝑐𝑐𝑐𝑎𝑎𝑎𝑎 𝑐𝑐𝑐𝑐 𝑝𝑝𝑝𝑝𝑝𝑝𝑝𝑝𝑝𝑝𝑝𝑝𝑝𝑝𝑝𝑝𝑝𝑝𝑝𝑝𝑝𝑝𝑝𝑝𝑐𝑐𝑐𝑐𝑐𝑐𝑐𝑐𝑝𝑝𝑝𝑝𝑝𝑝𝑝𝑝 𝑝𝑝𝑝𝑝𝑜𝑜𝑜𝑜 𝐺𝐺𝐺𝐺𝐴𝐴𝐴𝐴𝑃𝑃𝑃𝑃 𝑝𝑝𝑝𝑝𝑝𝑝𝑝𝑝𝑝𝑝𝑝𝑝 𝑐𝑐𝑐𝑐𝑐𝑐𝑐𝑐𝑝𝑝𝑝𝑝𝑐𝑐𝑐𝑐𝑐𝑐𝑐𝑐𝑐𝑐𝑐𝑐 (𝐶𝐶𝐶𝐶𝐶𝐶𝐶𝐶𝑝𝑝𝑝𝑝𝑝𝑝𝑝𝑝𝑝𝑝𝑝𝑝𝑝𝑝𝑝𝑝𝑐𝑐𝑐𝑐 𝑈𝑈𝑈𝑈𝑈𝑈𝑈𝑈$)(%)
= (
𝐴𝐴𝐴𝐴𝐴𝐴𝐴𝐴𝐴𝐴𝐴𝐴 (𝐶𝐶𝐶𝐶𝐶𝐶𝐶𝐶𝑝𝑝𝑝𝑝𝑝𝑝𝑝𝑝𝑝𝑝𝑝𝑝𝑝𝑝𝑝𝑝𝑐𝑐𝑐𝑐 𝑈𝑈𝑈𝑈𝑈𝑈𝑈𝑈$)𝑃𝑃𝑃𝑃𝑝𝑝𝑝𝑝𝑝𝑝𝑝𝑝𝐶𝐶𝐶𝐶𝑃𝑃𝑃𝑃𝑐𝑐𝑐𝑐𝑐𝑐𝑐𝑐𝑐𝑐𝑐𝑐𝑝𝑝𝑝𝑝𝑝𝑝𝑝𝑝
𝐺𝐺𝐺𝐺𝐴𝐴𝐴𝐴𝑃𝑃𝑃𝑃 𝑝𝑝𝑝𝑝𝑝𝑝𝑝𝑝𝑝𝑝𝑝𝑝 𝑐𝑐𝑐𝑐𝑐𝑐𝑐𝑐𝑝𝑝𝑝𝑝𝑐𝑐𝑐𝑐𝑐𝑐𝑐𝑐𝑐𝑐𝑐𝑐 (𝐶𝐶𝐶𝐶𝐶𝐶𝐶𝐶𝑝𝑝𝑝𝑝𝑝𝑝𝑝𝑝𝑝𝑝𝑝𝑝𝑝𝑝𝑝𝑝𝑐𝑐𝑐𝑐 𝑈𝑈𝑈𝑈𝑈𝑈𝑈𝑈$)) × 100
48 ODI Report
Data sourcesThe data used in Section 2 are derived from five main data sources.
Data source Key variables
The Demographic and Health Survey (DHS)
• Proportion of births attended by a health professional◊ Variable for births in the five years preceding the survey◊ Combines proportion of births attended by doctors and proportion of births attended by any other health professional • Primary completion rates (via World Inequality Database on Education – WIDE) ◊ Percentage of children and young people aged 3-7 years above primary school graduation age
The Multiple Indicator Cluster Survey (MICS)
• Primary completion rates – used where there is not suitable DHS data (via World Inequality Database on Education – WIDE) ◊ Percentage of children and young people aged 3-7 years above primary school graduation age
The World Health Organization – UNICEF (WHO-UNICEF) Joint Monitoring Programme (JMP) for Water Supply and Sanitation
• Coverage of improved drinking water sources ◊ Percentage of population (national, urban and rural) • Coverage of improved sanitation ◊ Percentage of population (national, urban and rural)
The World Development Indicators (WDI)
• GDP per capita growth (Percentage)• GDP per capita (Current US $)• Tax revenue (Current LCU)• Population• Net official development assistance and official aid received (Current US $)• Total health expenditure per capita (PPP $)• Public health expenditure as a proportion of total health expenditure (Percentage)
The United Nations Educational, Scientific and Cultural Organisation (UNESCO) Institute for Statistics (UIS)
• Public expenditure on education per pupil (PPP $)

Adapting development: Improving services to the poor 49
standards for completing primary learning – all of which are very basic measures of education quality. Direct measures of learning would undoubtedly be preferred for this form of analysis, but issues of data comparability and coverage have prevented us from utilising these here. In the case of national learning assessments, they vary considerably across countries in both form and content, making meaningful comparison difficult; and standard international tests that are consistently applied (e.g. PISA and TIMSS) have limited coverage in sub-Saharan Africa and developing countries more generally which limits their usefulness. We therefore chose primary completion rates as a compromise that would capture elements of quality and allow for comparative analysis.
In terms of water and sanitation, coverage of improved drinking water and improved sanitation are two of the most widely utilised and collected indicators of provision. The definitions of ‘improved’ in the case of both drinking water16 and sanitation17 are both broad enough to be applicable in a range of contexts, while being specific enough to ensure they are an accurate measure of the quality of these services. There are two main disadvantages to these measures. Firstly, they do not capture issues around quality related to the maintenance and upkeep of the systems; and so we must assume that the impact of these issues is roughly constant over countries and time. Secondly, for sanitation this measure may capture access to improved sanitation facilities, but not their actual usage as a range of factors may mean citizens do not use them even where they have access. It is possible therefore that these measures may overestimate true rates of access and utilisation. However, there is a lack of measures that can overcome these issues while retaining current levels of data coverage and so we must simply treat the figures derived from these measures with caution.
Calculation of projectionsProjections of the rate of change for specific service provision indicators were calculated for each country or country sub-group (i.e. rural/urban and highest/lowest income quintile) using two observations of the service provision indicator of interest – with one being the latest available observation and the second being the earliest available observation after 2000, with data from earlier being utilised where necessary.18 The nature of the data sources meant that the precise periods of observation
varied by country and source. The overall period examined for each service provision indicator was as follows:
• Coverage of improved drinking water source (2000-2012 for all countries)
• Coverage of improved sanitation (2000-2012 for all countries)
• Proportion of births attended by a health professional (1996-2012. Average length of comparison period – 9.2 years, with the majority of countries comparing two data points post 2000)
• Primary school completion rates (1998-2012. Average length of comparison period – 7.1 years, with the majority of countries comparing two data points post 2000)On the basis of the changes observed over this period an
annual rate of change in percentage terms was calculated for each country or country sub-group using the following formula:
Where Observation 2 represents the value of the
variable of interest in the last year for which data was available, and Observation 1 represents its value in the initial year considered.
This figure was then used to project future changes in the service provision indicator of interest, assuming that the annual rate of change in percentage terms will remain constant over time. While this is a strong assumption it is a reasonable one given the difficulty of calculating potential changes in the annual rate of change. These would likely be country-specific and hard to calculate with any degree of accuracy given existing data limitations. Thus despite the limitations of this methodology, it is the most viable available for this research, although the resulting projections must be treated with caution.
The estimated year in which the service provision indicator of interest will have reached full coverage (100%) on the basis of these assumptions was then calculated using the following formula:
𝑃𝑃𝑃𝑃𝑃𝑃𝑃𝑃𝑃𝑃𝑃𝑃𝑃𝑃𝑃𝑃𝑃𝑃 𝑦𝑦𝑃𝑃𝑦𝑦𝑃𝑃 𝑃𝑃𝑜𝑜 𝑦𝑦𝑃𝑃ℎ𝑖𝑖𝑃𝑃𝑖𝑖𝑖𝑖𝑖𝑖𝑖𝑖 𝑜𝑜𝑓𝑓𝑓𝑓𝑓𝑓 𝑃𝑃𝑃𝑃𝑖𝑖𝑃𝑃𝑃𝑃𝑦𝑦𝑖𝑖𝑃𝑃
= 𝐷𝐷𝑦𝑦𝑃𝑃𝑃𝑃 𝑃𝑃𝑜𝑜 𝑂𝑂𝑂𝑂𝑂𝑂𝑃𝑃𝑃𝑃𝑖𝑖𝑦𝑦𝑃𝑃𝑖𝑖𝑃𝑃𝑖𝑖2 + log( 100
𝑂𝑂𝑂𝑂𝑂𝑂𝑃𝑃𝑃𝑃𝑖𝑖𝑦𝑦𝑃𝑃𝑖𝑖𝑃𝑃𝑖𝑖2)log(1 + 𝐴𝐴𝑖𝑖𝑖𝑖𝑓𝑓𝑦𝑦𝑓𝑓 𝑃𝑃𝑦𝑦𝑃𝑃𝑃𝑃 𝑃𝑃𝑜𝑜 𝑃𝑃ℎ𝑦𝑦𝑖𝑖𝑖𝑖𝑃𝑃/100)
16 WHO-UNICEF JMP – ‘An “improved” drinking-water source is one that, by the nature of its construction and when properly used, adequately protects the source from outside contamination, particularly faecal matter.’ This definition includes: piped water into dwelling; piped water to yard/plot; public tap or standpipe; tubewell or borehole; protected dug well; protected spring; and rainwater.
17 WHO-UNICEF JMP – ‘An “improved” sanitation facility is one that hygienically separates human excreta from human contact.’ This definition includes: flush toilet; piped sewer system; septic tank; flush/pour flush to pit latrine; ventilated improved pit latrine; pit latrine with slab; composting toilet; and certain other special cases.
18 In terms of primary completion rates, two countries initial observations were pre-2000 – Kenya (1998) and Guinea (1999). In terms of the proportion of births attended by health professionals, eight countries initial observations were pre-2000 – Tanzania (1996), Zambia (1996), Chad (1997), Senegal (1997), Cote d’Ivoire (1998), Ghana, (1998), Burkina Faso (1999), and Guinea (1999). In terms of coverage of improved drinking water and improved sanitation, all countries initial observations were from 2000.
𝐴𝐴𝐴𝐴𝑛𝑛𝑛𝑛𝑛𝑛𝑛𝑛𝑛𝑛𝑛𝑛𝑛𝑛𝑛𝑛𝑛𝑛𝑛𝑛 𝑅𝑅𝑅𝑅𝑛𝑛𝑛𝑛𝑅𝑅𝑅𝑅𝑅𝑅𝑅𝑅 𝑜𝑜𝑜𝑜𝑜𝑜𝑜𝑜 𝐶𝐶𝐶𝐶ℎ𝑛𝑛𝑛𝑛𝑛𝑛𝑛𝑛𝑎𝑎𝑎𝑎𝑅𝑅𝑅𝑅 (%) =��𝑂𝑂𝑂𝑂𝑂𝑂𝑂𝑂𝑂𝑂𝑂𝑂𝑅𝑅𝑅𝑅𝑂𝑂𝑂𝑂𝑂𝑂𝑂𝑂𝑛𝑛𝑛𝑛𝑅𝑅𝑅𝑅𝑂𝑂𝑂𝑂𝑜𝑜𝑜𝑜𝑛𝑛𝑛𝑛2− 𝑂𝑂𝑂𝑂𝑂𝑂𝑂𝑂𝑂𝑂𝑂𝑂𝑅𝑅𝑅𝑅𝑂𝑂𝑂𝑂𝑂𝑂𝑂𝑂𝑛𝑛𝑛𝑛𝑅𝑅𝑅𝑅𝑂𝑂𝑂𝑂𝑜𝑜𝑜𝑜𝑛𝑛𝑛𝑛1
𝑂𝑂𝑂𝑂𝑂𝑂𝑂𝑂𝑂𝑂𝑂𝑂𝑅𝑅𝑅𝑅𝑂𝑂𝑂𝑂𝑂𝑂𝑂𝑂𝑛𝑛𝑛𝑛𝑅𝑅𝑅𝑅𝑂𝑂𝑂𝑂𝑜𝑜𝑜𝑜𝑛𝑛𝑛𝑛1 �× 100�(𝐷𝐷𝐷𝐷𝑛𝑛𝑛𝑛𝑅𝑅𝑅𝑅𝑅𝑅𝑅𝑅 𝑜𝑜𝑜𝑜𝑜𝑜𝑜𝑜 𝑂𝑂𝑂𝑂𝑂𝑂𝑂𝑂𝑂𝑂𝑂𝑂𝑅𝑅𝑅𝑅𝑂𝑂𝑂𝑂𝑂𝑂𝑂𝑂𝑛𝑛𝑛𝑛𝑅𝑅𝑅𝑅𝑂𝑂𝑂𝑂𝑜𝑜𝑜𝑜𝑛𝑛𝑛𝑛2− 𝐷𝐷𝐷𝐷𝑛𝑛𝑛𝑛𝑅𝑅𝑅𝑅𝑅𝑅𝑅𝑅 𝑜𝑜𝑜𝑜𝑜𝑜𝑜𝑜 𝑂𝑂𝑂𝑂𝑂𝑂𝑂𝑂𝑂𝑂𝑂𝑂𝑅𝑅𝑅𝑅𝑂𝑂𝑂𝑂𝑂𝑂𝑂𝑂𝑛𝑛𝑛𝑛𝑅𝑅𝑅𝑅𝑂𝑂𝑂𝑂𝑜𝑜𝑜𝑜𝑛𝑛𝑛𝑛1)
This methodology has clear limitations and is not intended to provide predictions about how these measures will evolve in the future.19 Rather it aims to make the broad point that at current rates of change progress will take a considerable period to achieve and vary widely across countries. The construction of the formula may result in overly optimistic time-frames for achieving results for two main reasons.
Firstly, it assumes that ensuring coverage is equally difficult for all citizens, when in reality there will be some low hanging fruit that are easy to improve access for and some citizens with multiple disadvantages that are very hard to ensure coverage for. The formula assumes going from 20% to 25% coverage involves the same effort as going from 95% to 100%, while in reality the latter will be much harder. In reality progress will therefore slow as countries come closer to achieving full coverage in service provision, with this slower later rate of change resulting in a longer timeframe for achieving full coverage than is projected here.
Secondly, the use of percentage changes can be critiqued for likely over-estimating the rate of change for countries
that begin from a low base. This is due to the rate of change being calculated as a percentage of the initial observation. Thus, if country A increases coverage from 25% to 26% over one year then it will have a rate of change of 4% per annum; while country B going from 75% to 76% over the same period will have a rate of change of just over 1.3% per annum. This will likely mean again that the estimates here are overly optimistic, and that there may be a particularly positive bias for countries that begin from low bases relative to those with higher bases.
It should also be born in mind that both of these issues will also apply to sub-national groups, and so the estimates here may be overly optimistic as to the rate at which the poor and rural groups will achieve service provision, and the rate at which they will catch up with the levels of service provision experienced by rich and urban groups.
The figures and timeframes shown in this report should therefore be treated with caution and it should be borne in mind that they are, in many ways, the best case scenario for improvements based on current conditions.
19 The results reached using this methodology were also found to be similar to those reached using the compound annual growth rate for the service provision indicator of interest.
50 ODI Report

References
Acemoglu, D. and Robinson, J.A. (2012) Why Nations Fail: The Origins of Power, Prosperity and Poverty. London: Profile Books.
Algoso, D. (2014) ‘Case studies as a tool for sector learning’, Find What Works. 16th December 2014. http://algoso.org/2014/12/16/case-studies-as-a-tool-for-sector-learning/
Andrews, M. (2014) ‘Can One Retell a Mozambican Reform Story Through Problem Driven Iterative Adaptation?’ CID Working Paper No. 278. Cambridge, MA: Harvard University
Andrews, M. (2013) The Limits of Institutional Reform in Development: Changing Rules for Realistic Solutions. Cambridge: Cambridge University Press.
Andrews, M. (2008) ‘The Good Governance Agenda: Beyond Indicators without Theory’. Oxford Development Studies 36(4): 379-407.
Andrews, M., Pritchett, L., Woolcock, M. (2013) ‘Escaping Capability Traps Through Problem Driven Iterative Adaptation (PDIA)’, World Development 51: 234-244.
ASER (2013) Annual Status of Education Report. New Delhi: ASER/Pratham.
Beatty, A. and Pritchett, L. (2012) ’From Schooling Goals to Learning Goals: How Fast Can Student Learning Improve?’ CGD Policy Paper 012. Washington DC: Center for Global Development.
Batley, R. and Harris, D. (2014) Analysing the politics of public services: a service characteristics approach. London: Overseas Development Institute.
Berendsen, B., Dietz, T., Nordholt, H. S., van der Veen, R. (eds) (2013) Asian Tigers, African Lions: Comparing the Development Performance of Southeast Asia and Africa. Leiden: Brill.
Bergh, G., Rocha Menocal, A., Rodriguez Takeuchi, L., (2013) What’s behind the demand for governance? An Assessment of people’s views. London: Overseas Development Institute.
Blank, S (2013) Why The Lean Start-Up Changes Everything, Harvard Business Review, May.
Blattman, C. and Niehaus, P. (2014) ‘Show Them the Money - Why Giving Cash Helps Alleviate Poverty’. Foreign Affairs, May/June issue.
Booth, D. (ed.) (2015) Developmental Regimes in Africa: Synthesis Report. London: Overseas Development Institute.
Booth, D. (2014) Aiding Institutional Reform in Developing Countries, Lessons from the Philippines on what works, what doesn’t and why. London: Overseas Development Institute and The Asia Foundation.
Booth, D. (2011) Aid effectiveness: bringing country ownership (and politics) back in, Working Paper 336, Africa Power and Politics Programme, London: Overseas Development Institute. Booth, D. and Cammack, D. (2013) Governance for Development in Africa: Solving Collective Action Problems. London: Zed Books.
Booth, D. and Chambers, V. (2014) ‘The SAVI Programme in Nigeria: Towards politically smart, locally led development’. ODI discussion paper. London: Overseas Development Institute.
Booth, D. and Unsworth, S. (2014) ‘Politically smart, locally led development’. ODI discussion paper London: Overseas Development Institute.
Brinkerhoff, D and Ingle, M. (1989) ‘Integrating blueprint and process: a structured flexibility approach to development management’. Public Administration and Development, Vol 9 pp 487-503.
Cameron, D. (2012) ‘Combating Poverty at its Roots: Economic Development Requires Aid, but also Sound Institutions’. Wall Street Journal Online Edition, 1 Nov 2012.
Chesbrough, H. (2003) Open Innovation: The New Imperative for Creating and Profiting from Technology. Boston, MA: Harvard Business School Press.
City Process Management (2008) ‘Cause and Effect Analysis Using the Ishikawa Fishbone and 5 Whys’. London: City Process Management. (http://www.cityprocessmanagement.com).
Denney, L. and Domingo, P. (2013) A problem-focused approach to violence against women: the political economy of justice and security programming. ODI Report. London: Overseas Development Institute.
DFID (2014) Smart Rules, Better Programme Delivery. London: UK Department for International Development. (https://www.gov.uk/government/publications/dfid-smart-rules-better-programme-delivery).
Eyben, R. (2009) ‘Donors’ Learning Difficulties: Results, Relationships and Responsibilities’. IDS Bulletin, Vol 36, Issue 3, pp. 98-107.
Faustino, J. and Booth, D. (2014) Development Entrepreneurship: How Donors And Leaders Can Foster Institutional Change. London: Overseas Development Institute.
Foresti, M., and Wild, L., with Rodriquez Takeuchi, L., Norton, A., (2014) Governance targets and indicators for post 2015 - An initial assessment. London: Overseas Development Institute.
Fox, J. (2014) Social accountability: What does the evidence really say? GPSA Working Paper No 1. Washington, D.C.: Global Partnership for Social Accountability (World Bank Group).
Fritz, V., Levy, B., Ort, R. (eds) (2014) Problem-Driven Political Economy Analysis: The World Bank’s Experience. Washington, DC: World Bank.
Foster, M. and Killick, T. (2006) What Would Doubling Aid do for Macroeconomic Management in Africa? ODI Working Paper 264. London: Overseas Development Institute.
Gibson, C.C., Andersson, K., Ostrom, E., Shivakumar, S. (2005) The Samaritan’s Dilemma: The Political Economy of Development Aid. Oxford: Oxford University Press.
52 ODI Report

Adapting development: Improving services to the poor 53
The Gates Foundation (2014) The Narrative Project. (http://www.interaction.org/blog/changing-public-conversation-about-global-development).
Glennie, A., Straw, W., Wild, L., (2012) Understanding public attitudes to aid and development. London: Overseas Development Institute and the Institute for Public Policy Research.
Grindle, M. (2007) ‘Good Enough Governance Revisited’. Development Policy Review 25(5): 553-574.
Grindle, M. (2004) ‘Good Enough Governance: Poverty Reduction and Reform in Developing Countries’. Governance: An International Journal of Policy, Administration, and Institutions 17(4): 525-548.
Greenhill, R., Prizzon, A., Rogerson, A., (2013) The age of choice: developing countries in the new aid landscape. London: Overseas Development Institute.
Harford, T. (2011) Adapt: Why Success Always Starts With Failure. London: Little Brown/Abacus.
Harris, D., Batley, R. and Wales, J. (2014) The technical is political. What does this mean in the health sector? London: Overseas Development Institute.
Harris, D., Wales, J., Jones, H., Rana, T. with Chitrakar, R. L. (2013) Human resources for health in Nepal: the politics of access in report areas. ODI Report. London: Overseas Development Institute.
Henley, D. (2015) Asia-Africa Development Divergence: A Question of Intent, London: Zed Books
Hill, L., Brandeau, G., Truelove, E., Lineback, K (2015) The Capabilities Your Organisation Needs to Sustain Innovation, Harvard Business Review, 14 January
Hirschman, A. (1967) ‘The Principle of the Hiding Hand’. National Affairs, Issue 6. (http://www.nationalaffairs.com/public_interest/detail/the-principle-of-the-hiding-hand)
Hulme, D. (1989) ‘Learning and not learning from experience in rural project planning’. Public Administration and Development, Vol 9, pp1-16.
Kaufmann, D., Kraay, A., Mastruzzi (2009) Governance Matters VIII: Aggregate and Individual Governance Indicators for 1996-2008. Policy Research Working Paper No. 4978, Washington, DC: The World Bank
Keinz, P., Hienerth, C. and Lettl, C. (2012) ‘Designing the Organization for User Innovation’. Journal of Organization Design, 1(3): 20-36.
Kelsall, T. (2014) Authoritarianism, Democracy and Development. State of the Art 3. Birmingham, UK: Developmental Leadership Program.
Kelsall, T. (2013) Business, Politics, and the State in Africa: Challenging the Orthodoxies on Growth and Transformation. London: Zed Books.
Khan, M. H. (2012) ‘Governance and Growth: History, Ideology, and Methods of Proof’ in A. Noman, K. Botchwey, H. Stein and J.E. Stiglitz (eds) Good Growth and Governance in Africa: Rethinking Development Strategies. Oxford: Oxford University Press, pp. 51-79.
Khan, M. H. (2010) ‘Political Settlements and the Governance of Growth-Enhancing Institutions’. London: Economics Department, School of Oriental and African Studies, University of London.
Kingdon, G. G., Little, A., Aslam, M., Rawal, S., Moe, T., Patrinos, H., Beteille, T., Banerji, R., Parton, B., Sharma, S. K. (2014) A rigorous review of the political economy of education systems in developing countries. Final Report. Education Rigorous Literature Review. London, UK: Department for International Development.
Levy, B. (2014) Working with the Grain: Integrating Governance and Growth in Development Strategies. Oxford: Oxford University Press.
Lewis, P.M. (2007) Growing Apart: Oil, Politics, and Economic Change in Indonesia and Nigeria. Ann Arbor, MI: University of Michigan Press.
Liu, L., Oza, S., Hogan, D., , Perin, J., Rudan, I., Lawn, J.E., Cousens, S., Mathers, C., Black, R.E. (2014) ‘Global, regional, and national causes of child mortality in 2000–13, with projections to inform post-2015 priorities: an updated systematic analysis’. The Lancet. (http://dx.doi.org/10.1016/S0140-6736(14)61698-6).
McKinsey Global Institute (2010) Lions on the Move: The Progress and Potential of African Economies. Washington, D.C.: McKinsey & Company.
Mcloughlin, C., with Batley, R. (2012) The Effects of Sector Characteristics on Accountability Relationships in Service Delivery. Working Paper 350. London: Overseas Development Institute.
Mintzberg, H (2009) Managing. San Fransisco, CA: Berrett Kohler.
MoH (2011) ‘Health Sector Strategic Plan 2011-2016’. Lilongwe: Ministry of Health, Government of Malawi.
Moore, M. and Unsworth, S. (2010) An Upside Down View of Governance. Brighton: Institute of Development Studies/Centre for the Future State.
Moss, T., Pettersson, G., van de Walle, N. (2008) ‘An Aid-Institutions Paradox? A Review essay on Aid Dependency and State Building in Sub-Saharan Africa’ in W. Easterly (ed.) Reinventing Foreign Aid. Cambridge, MA: MIT Press: 255-281.
Natsios, A (2010) The Clash of the Counter-bureaucracy and Development, Center for Global Development Essay, Washington D.C.: Center for Global Development
Nicolai, S., Wild, L., Wales, J., Hine, S. and Engel, J. (2014) ‘Unbalanced progress: what political dynamics mean for education access and quality’. Development Progress Working Paper No.5. London: Overseas Development Institute.
Noman, A., Botchwey, K., Stein, H. and Stiglitz, J. E. (eds) (2012) Good Growth and Governance in Africa: Rethinking Development Strategies. Oxford: Oxford University Press.
OECD (2012) International Drivers of Corruption: A Tool for Analysis. Paris: OECD.

O’Neil, T., and Cammack, D., with Kanyongolo, E., Walita, M., Mkandawire, T. M, Welham, B., Wild. L, (2014) Fragmented governance and local service delivery in Malawi. London: Overseas Development Institute.
Ostrom, E., Gibson, C., Shivakumar, S., Andersson, K. (2001) Aid, Incentives, and Sustainability - An Institutional Analysis of Development Cooperation. Main report. SIDA Studies in Evaluation 02/01. Stockholm: Swedish International Development Cooperation.
OWG (2014) Proposal of the Open Working Group on the Sustainable Development Goals. http://www.stakeholderforum.org/fileadmin/files/OWGSDGs.Outcome_Document.pdf
Pinnington, R. (2014) Local First in Practice; Unlocking the power to get things done. London: Peace Direct.
Porter, D., Allen, B. Thompson, G. (1991) Development in Practice: Paved with Good Intentions. London: Routledge.
Pritchett, L. (2013) The rebirth of education: Schooling ain’t learning. Washington, DC: Centre for Global Development.
Pritchett, L., Woolcock, M., Andrews, M. (2010) Capability Traps? The Mechanisms of Persistent Implementation Failure. Working Paper 234. Washington, D.C.: Center for Global Development.
Pritchett, L. and Woolcock, M. (2008) ‘Solutions When the Solution Is the Problem: Arraying the Disarray in Development’ in W. Easterly (ed.) Reinventing Foreign Aid. Cambridge, MA: MIT Press: pp. 147-177.
Puttick, R., Colligan, P., Baeck, P. (2014) i-teams: The teams and funds making innovation happen in governments around the world. London: Nesta/ Bloomberg Philanthropies.
Ramalingam, B. (2013) Aid on the Edge of Chaos: Rethinking International Cooperation in a Complex World. Oxford: Oxford University Press.
Ries, E. (2011) The Lean Startup: How Constant Innovation Creates Radically Successful Businesses. London: Portfolio Penguin.
Rocha Menocal, A. (2013) Governance and Growth: Institutions, yes, but which ones? Report prepared for the World Bank. London: Overseas Development Institute.
Rocha Menocal, A. and Wild, L. (2014) ‘The relationship between governance and progress’, in UNA-UK (eds.), Global development goals – Leaving no one behind. London: Witan Media Ltd. On behalf of the United Nations Association, UK.
Rodrik, D. (2010) ‘Diagnostics before Prescription’, Journal of Economic Perspectives 24(3): 33-44.
Rodrik, D. (2007) One Economics, Many Recipes: Globalization, Institutions, and Economic Growth. Princeton, NJ: Princeton University Press.
Rondinelli, D. A. (1983) Development Projects as Policy Experiments: An Adaptive Approach to Development Administration. London: Methuen.
Sarasvathy, S (2005) What Makes Entrepreneurs Entrepreneurial? Case and Teaching Paper Series, Charlottesville, VA: Darden School of Business, University of Virginia
Schlesinger, L., Kiefer, C., Brown, P. (2012) What To Do When You Don’t Know What To Do, Harvard Business Review, 21 March.
Sims, P (2011) Little Bets: How Breakthrough Ideas Emerge from Small Discoveries, New York: Free Press; London: Random House Business Books.
Slater, D. (2010) Ordering Power: Contentious Politics and Authoritarian Leviathans in Southeast Asia. Cambridge: Cambridge University Press.
Sundaram, J. K. and Chowdhury. A. (eds) (2012) Is Good Governance Good for Development? London: Bloomsbury Academic/United Nations.
Sumner, A. (2012) Where Do the World’s Poor Live? A New Update. IDS Working Paper, No. 393. Brighton: Institute of Development Studies.
Therkildsen, O. (2000) ‘Public Sector Reform in a Poor, Aid-Dependent Country, Tanzania’. Public Administration and Development 20: pp. 61-71.
Therkildsen, O. (1988) Watering White Elephants? Lessons from Donor Funded Planning and Implementation of Water Supplies in Tanzania. Uppsala: Scandinavian Institute of African Studies.
Twaweza (2013) ‘Stock out or in stock? Access to medicines in Tanzania’. Sauti za Wananchi, Brief No.5, September 2013. Dar es Salaam: Twaweza.
UNESCO (2014) Education for All Global Monitoring Report. Paris: United Nations Educational, Scientific and Cultural Organization.
UNESCO (2008) EFA Global Monitoring Report 2009: Overcoming Inequality: Why Governance Matters. Oxford University Press.
Uwezo (2013) Are Our Children Learning? Literacy and Numeracy Across East Africa. Nairobi: Uwezo East Africa at Twaweza.
van Donge, J. K., Henley, D., Lewis, P. (2012) ‘Tracking Development in Southeast Asia and sub-Saharan Africa: The Primacy of Policy’. Development Policy Review 30(S1): s5-s24.
Villa, R. and Hammer, S. (2013) A promise to every child: Developing a Regional Policy for Children in Nicaragua’s Northern Atlantic Autonomous Region. Managua, Nicaragua: UNICEF Nicaragua and Reboot.
Vlasblom, D. (2013) The Richer Harvest: Economic Development in Africa and Southeast Asia Compared. Leiden: African Studies Centre.
von Hippel, E. (2005) Democratizing Innovation. Cambridge, MA: MIT Press.
Wagstaff, A., Bilger, M., Buisman, L.R., Bredenkamp, C. (2014) Who benefits from Government Health Spending
54 ODI Report
Adapting development: Improving services to the poor 55
and Why? World Bank Policy Research Working Paper 7044. Washington D.C.: The World Bank.
Wales, J., Tobias, J., Malangalila, E., Swai, G., Wild, L. (2014a) Stock-outs of essential medicines in Tanzania: A political economy approach to analysing problems and identifying solutions. ODI Report. London: Overseas Development Institute.
Wild, L. and Cammack, D. (2012) The supply and distribution of essential medicines in Malawi. ODI Report. London: Overseas Development Institute.
Wild, L. and Harris, D. (2012) ‘More than just ‘demand’: Malawi’s public-service community scorecard’. ODI Project Briefing 69. London: Overseas Development Institute.
Wingfield, T. and Vowles, P. (2014) ‘DFID is changing its approach to better address the underlying causes of
poverty and conflict – can it work? Guest Post from two DFID reformers’, From Poverty to Power, Oxfam GB, 9th October 2014. (http://oxfamblogs.org/fp2p/dfid-is-changing-its-approach-to-better-address-the-underlying-causes-of-poverty-and-conflict-can-it-work-guest-post-from-tom-wingfield-and-pete-vowles/).
WHO and UNICEF (2014) Progress on Drinking Water and Sanitation – 2014 Update. Geneva: World Health Organization.
World Bank (2015) World Development Report 2015: Mind, Society, and Behavior. Washington, D. C.: World Bank.
World Bank (2004) World Development Report 2004, Making Services Work for Poor People. Washington, D.C.: World Bank.
ODI is the UK’s leading independent think tank on international development and humanitarian issues.
Readers are encouraged to reproduce material from ODI Reports for their own publications, as long as they are not being sold commercially. As copyright holder, ODI requests due acknowledgement and a copy of the publication. For online use, we ask readers to link to the original resource on the ODI website. The views presented in this paper are those of the author(s) and do not necessarily represent the views of ODI.
© Overseas Development Institute 2015. This work is licensed under a Creative Commons Attribution-Non Commercial Licence (CC BY-NC 3.0).
All ODI Reports are available from www.odi.org
Cover photo: Victor Villanueva: Legarda Street, Manila
Overseas Development Institute203 Blackfriars Road London SE1 8NJTel +44 (0)20 7922 0300 Fax +44 (0)20 7922 0399
odi.org