adaptive design in the real world: implications for ... design in the real world: implications for...
TRANSCRIPT

Adaptive Design in the Real World:Implications for Neuroscience Clinical
Studies
February 18, 2015
Introduction to AD in the Real World
• Pharmaceutical companies have a never-ending search to improve the speed, quality, efficiency, and generation of decision-making data in clinical research trials
• This search has led to the adoption of innovative research methodologies including adaptive design clinical trials
• The objectives of this session are to provide a concise scientific, operational and regulatory review of AD methodology, discuss when AD is appropriate for Neuroscience trials and present real world examples of AD trials in Neuroscience
Adaptive Design in the Real World
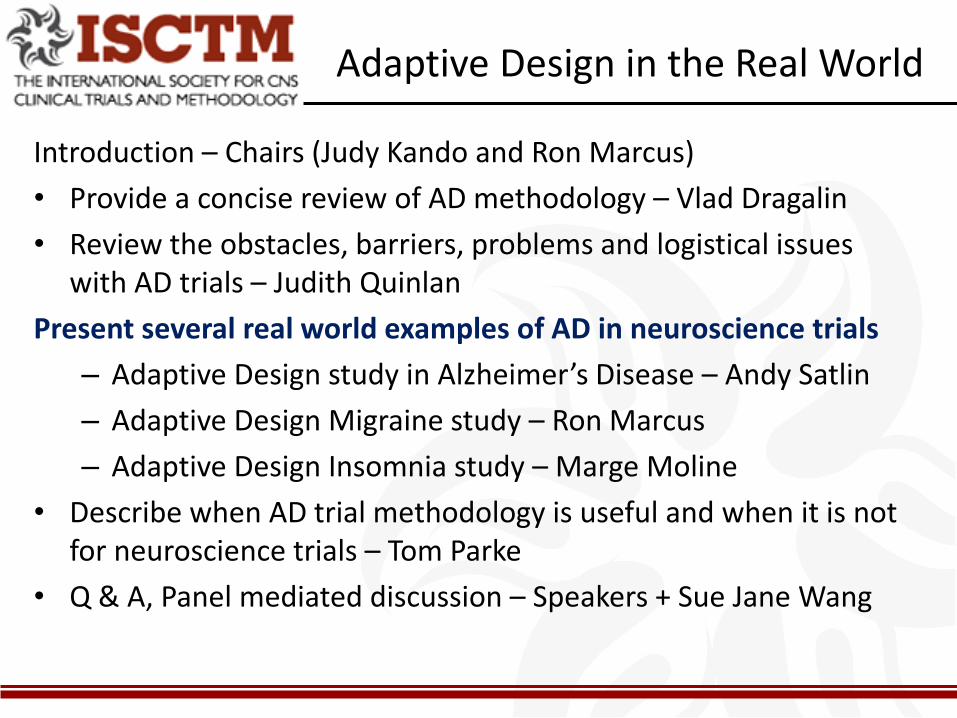
Introduction – Chairs (Judy Kando and Ron Marcus)
• Provide a concise review of AD methodology – Vlad Dragalin
• Review the obstacles, barriers, problems and logistical issues with AD trials – Judith Quinlan
Present several real world examples of AD in neuroscience trials
– Adaptive Design study in Alzheimer’s Disease – Andy Satlin
– Adaptive Design Migraine study – Ron Marcus
– Adaptive Design Insomnia study – Marge Moline
• Describe when AD trial methodology is useful and when it is not for neuroscience trials – Tom Parke
• Q & A, Panel mediated discussion – Speakers + Sue Jane Wang
AD Working Group
Co-Chairs:
• Ron Marcus, MD
• Judy Kando, Pharm.D., BCPP
Members:
• Richard Changzheng Pilar Lim
• Vlad Dragalin Tom Parke
• Dong-Jing Fu Russell Reeve
• Edward Kim Ibo Turkoz
• Ginger Haynes Theresa Yuraszek

Janssen Research & Development
Overview of Adaptive Design Methodology
Quantitative Sciences
Vlad Dragalin, PhD
VP Scientific Fellow, Head of ACT CoE
ISCTM 11th Annual Scientific Meeting | The Fairmont – Washington, DC | 17 – 19 February 2015
Janssen Research & Development
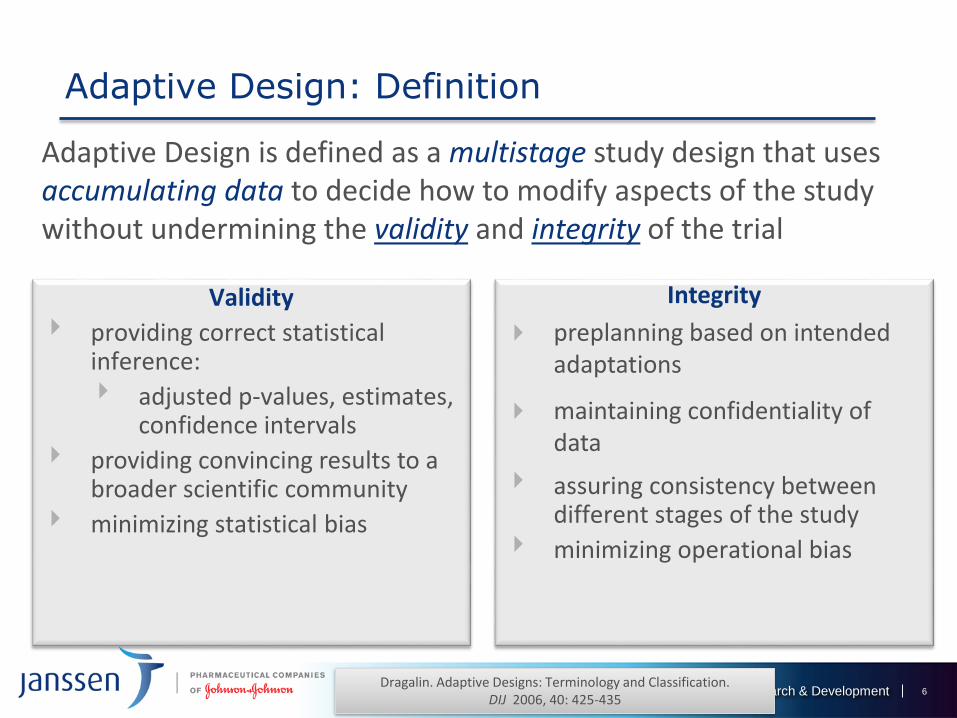
Adaptive Design: Definition
6
Adaptive Design is defined as a multistage study design that usesaccumulating data to decide how to modify aspects of the study without undermining the validity and integrity of the trial
Validity
providing correct statistical inference:
adjusted p-values, estimates, confidence intervals
providing convincing results to a broader scientific community
minimizing statistical bias
Integrity
preplanning based on intended adaptations
maintaining confidentiality of data
assuring consistency between different stages of the study
minimizing operational bias
Dragalin. Adaptive Designs: Terminology and Classification. DIJ 2006, 40: 425-435
Janssen Research & Development
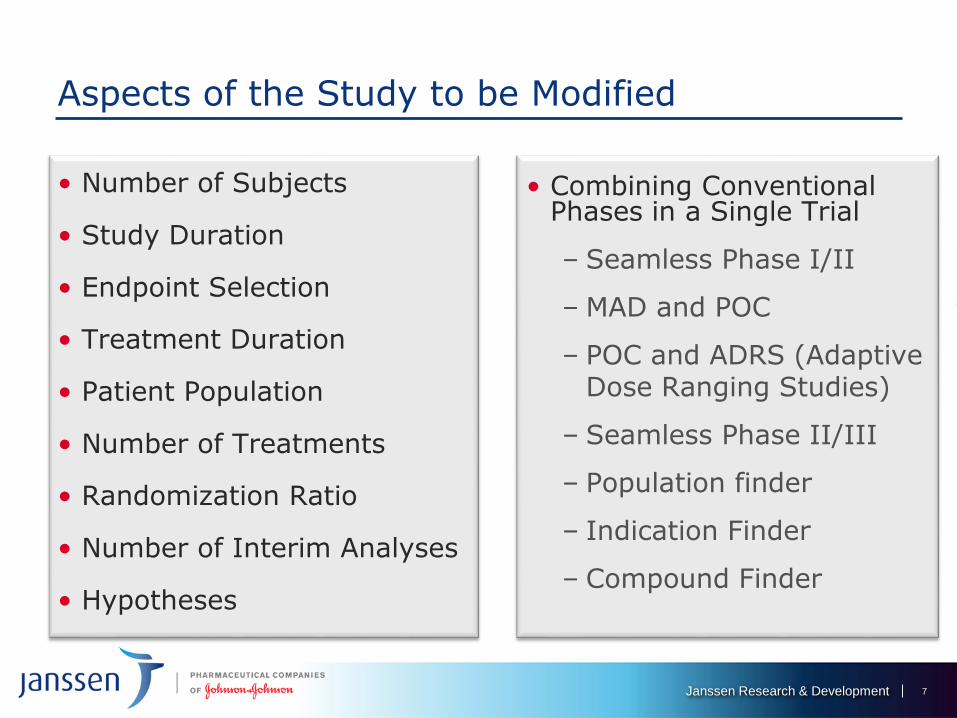
Aspects of the Study to be Modified
7
• Number of Subjects
• Study Duration
• Endpoint Selection
• Treatment Duration
• Patient Population
• Number of Treatments
• Randomization Ratio
• Number of Interim Analyses
• Hypotheses
• Combining Conventional Phases in a Single Trial
– Seamless Phase I/II
– MAD and POC
– POC and ADRS (Adaptive Dose Ranging Studies)
– Seamless Phase II/III
– Population finder
– Indication Finder
– Compound Finder
Janssen Research & Development 8
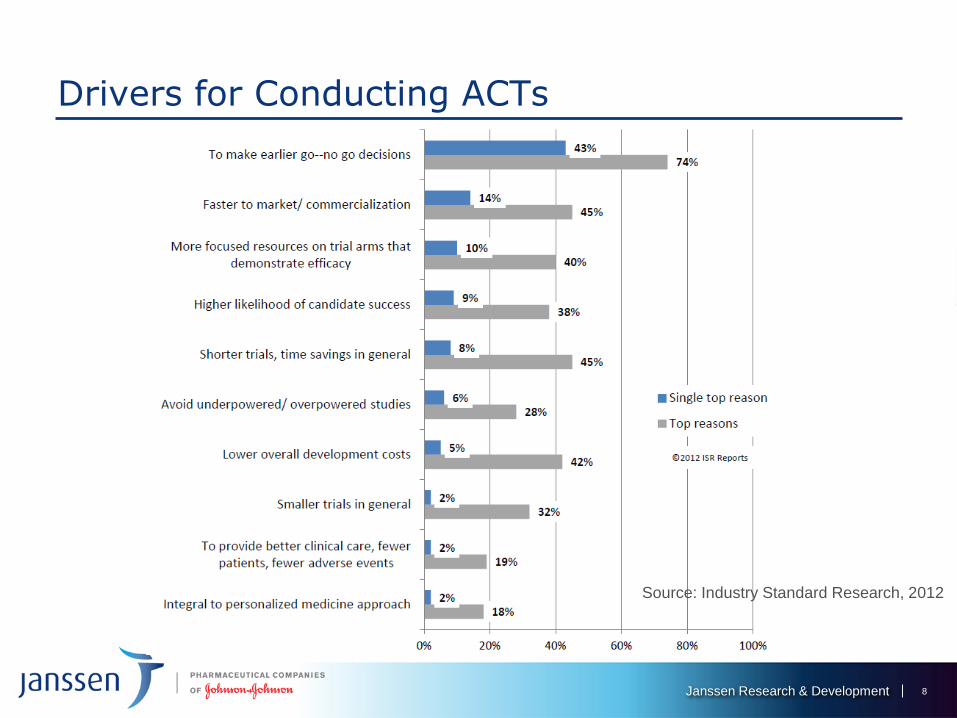
Drivers for Conducting ACTs
Source: Industry Standard Research, 2012
Janssen Research & Development
Benefits of Adaptive Design
9
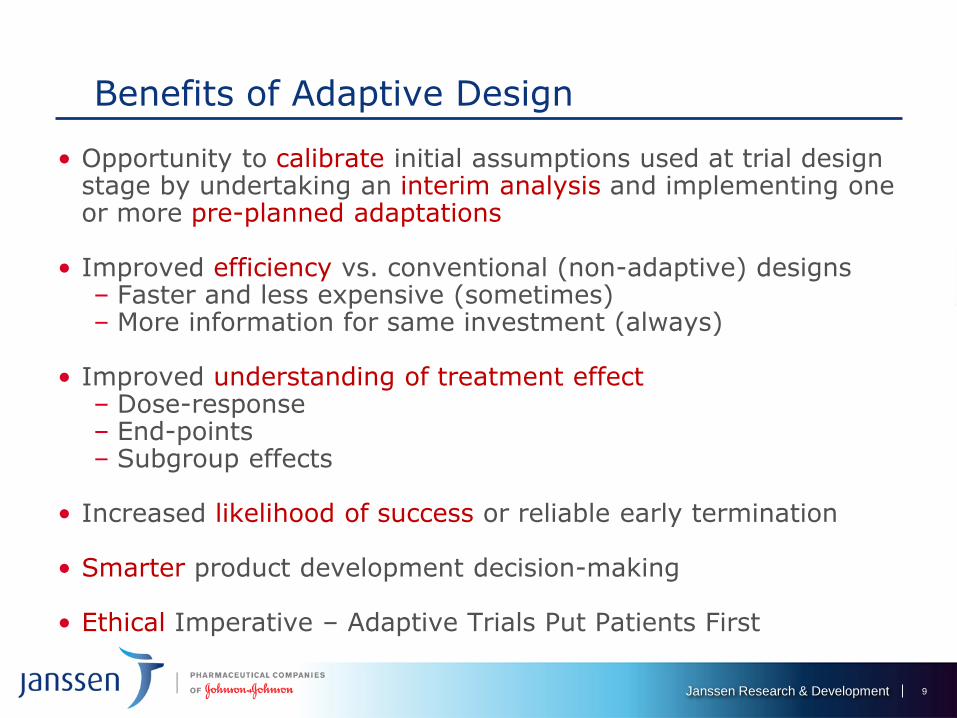
• Opportunity to calibrate initial assumptions used at trial design stage by undertaking an interim analysis and implementing one or more pre-planned adaptations
• Improved efficiency vs. conventional (non-adaptive) designs – Faster and less expensive (sometimes)– More information for same investment (always)
• Improved understanding of treatment effect– Dose-response– End-points– Subgroup effects
• Increased likelihood of success or reliable early termination
• Smarter product development decision-making
• Ethical Imperative – Adaptive Trials Put Patients First
Janssen Research & Development
Perceptions vs Reality
10
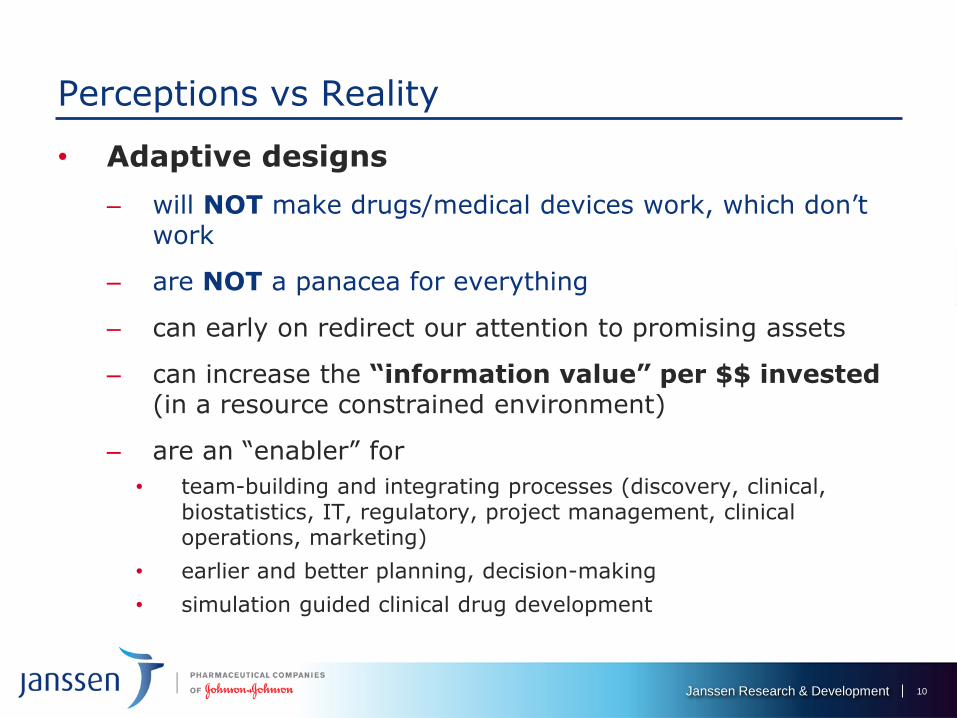
• Adaptive designs
– will NOT make drugs/medical devices work, which don’t work
– are NOT a panacea for everything
– can early on redirect our attention to promising assets
– can increase the “information value” per $$ invested (in a resource constrained environment)
– are an “enabler” for
• team-building and integrating processes (discovery, clinical, biostatistics, IT, regulatory, project management, clinical operations, marketing)
• earlier and better planning, decision-making
• simulation guided clinical drug development
Janssen Research & Development 11
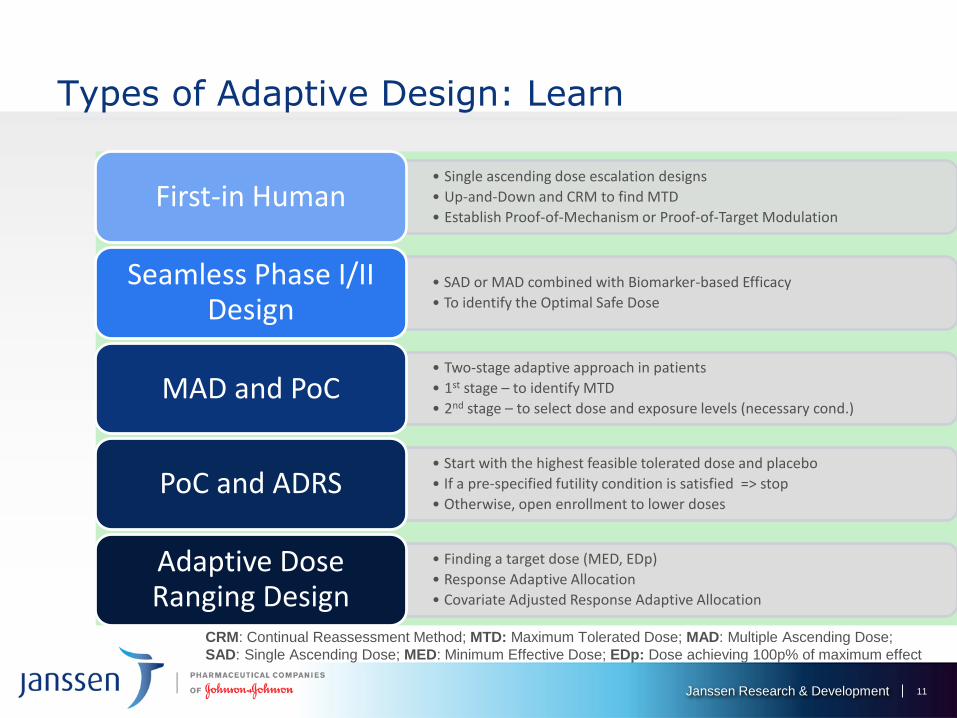
Types of Adaptive Design: Learn
• Single ascending dose escalation designs
• Up-and-Down and CRM to find MTD
• Establish Proof-of-Mechanism or Proof-of-Target ModulationFirst-in Human
• SAD or MAD combined with Biomarker-based Efficacy
• To identify the Optimal Safe Dose
Seamless Phase I/II Design
• Two-stage adaptive approach in patients
• 1st stage – to identify MTD
• 2nd stage – to select dose and exposure levels (necessary cond.)MAD and PoC
• Start with the highest feasible tolerated dose and placebo
• If a pre-specified futility condition is satisfied => stop
• Otherwise, open enrollment to lower dosesPoC and ADRS
• Finding a target dose (MED, EDp)
• Response Adaptive Allocation
• Covariate Adjusted Response Adaptive Allocation
Adaptive Dose Ranging Design
CRM: Continual Reassessment Method; MTD: Maximum Tolerated Dose; MAD: Multiple Ascending Dose;
SAD: Single Ascending Dose; MED: Minimum Effective Dose; EDp: Dose achieving 100p% of maximum effect
Janssen Research & Development 12
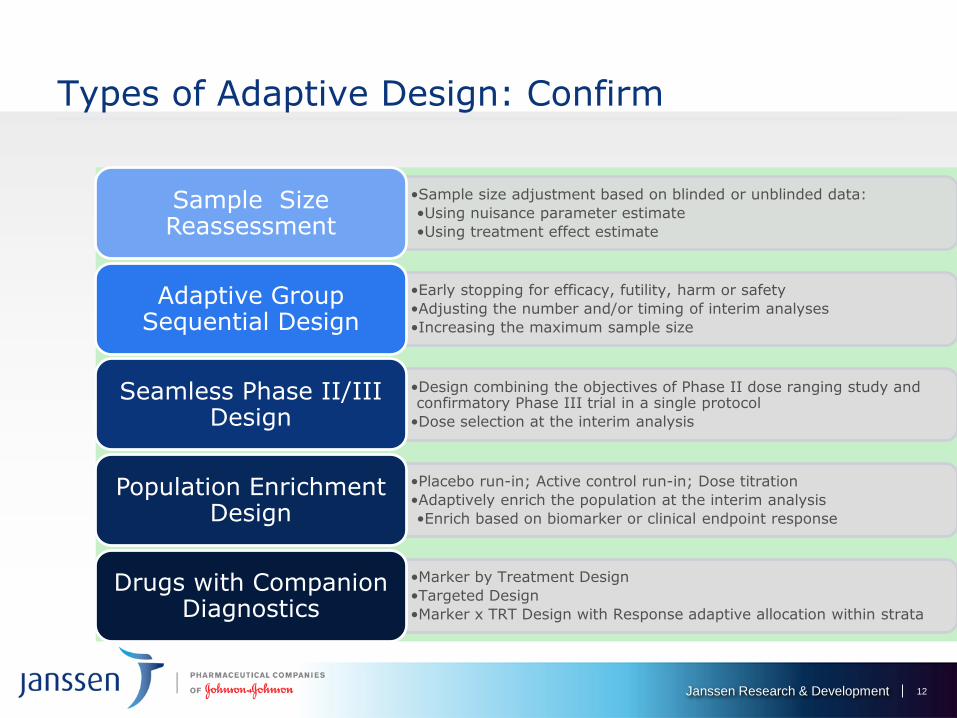
Types of Adaptive Design: Confirm
•Sample size adjustment based on blinded or unblinded data:
•Using nuisance parameter estimate
•Using treatment effect estimate
Sample Size Reassessment
•Early stopping for efficacy, futility, harm or safety
•Adjusting the number and/or timing of interim analyses
•Increasing the maximum sample size
Adaptive Group Sequential Design
•Design combining the objectives of Phase II dose ranging study and confirmatory Phase III trial in a single protocol
•Dose selection at the interim analysis
Seamless Phase II/III Design
•Placebo run-in; Active control run-in; Dose titration
•Adaptively enrich the population at the interim analysis
•Enrich based on biomarker or clinical endpoint response
Population Enrichment Design
•Marker by Treatment Design
•Targeted Design
•Marker x TRT Design with Response adaptive allocation within strata
Drugs with Companion Diagnostics
Janssen Research & Development 13
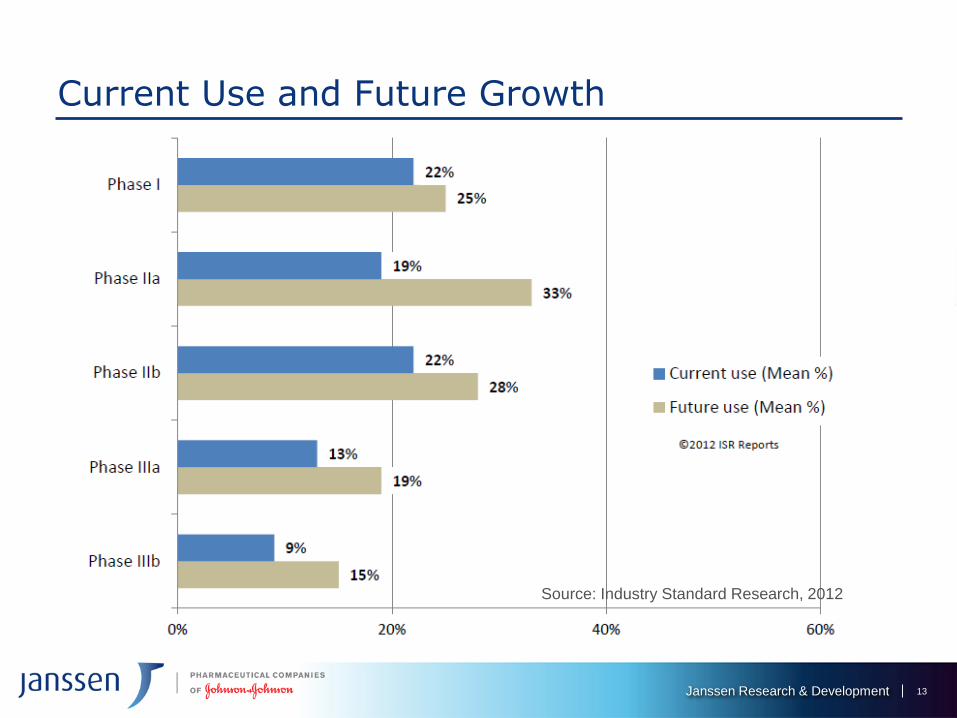
Current Use and Future Growth
Source: Industry Standard Research, 2012
Janssen Research & Development
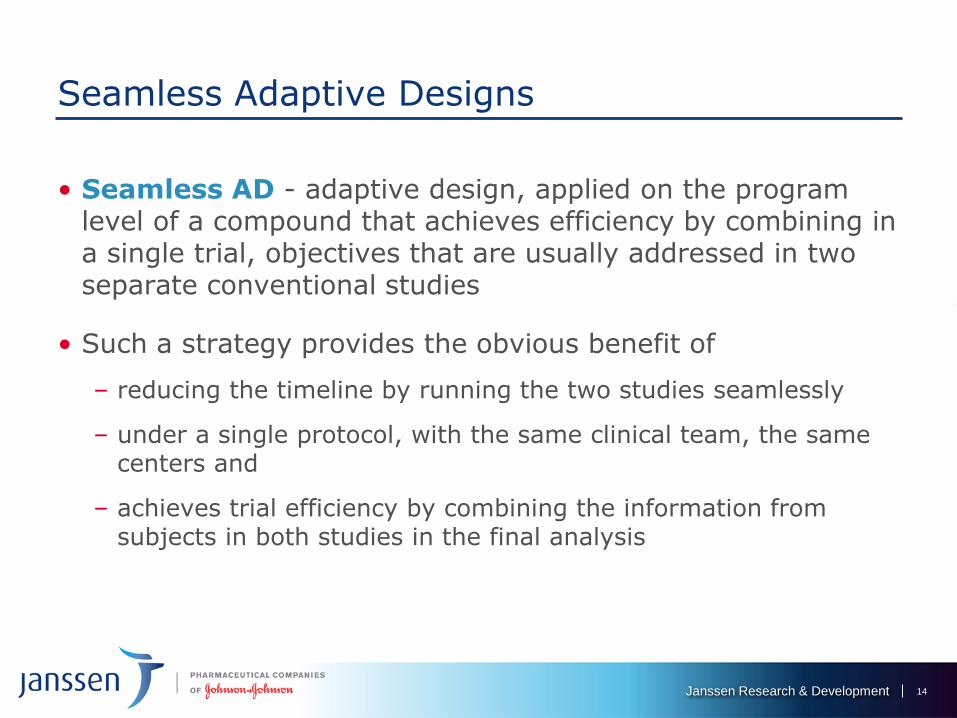
Seamless Adaptive Designs
14
• Seamless AD - adaptive design, applied on the program level of a compound that achieves efficiency by combining in a single trial, objectives that are usually addressed in two separate conventional studies
• Such a strategy provides the obvious benefit of
– reducing the timeline by running the two studies seamlessly
– under a single protocol, with the same clinical team, the same centers and
– achieves trial efficiency by combining the information from subjects in both studies in the final analysis
Janssen Research & Development 15
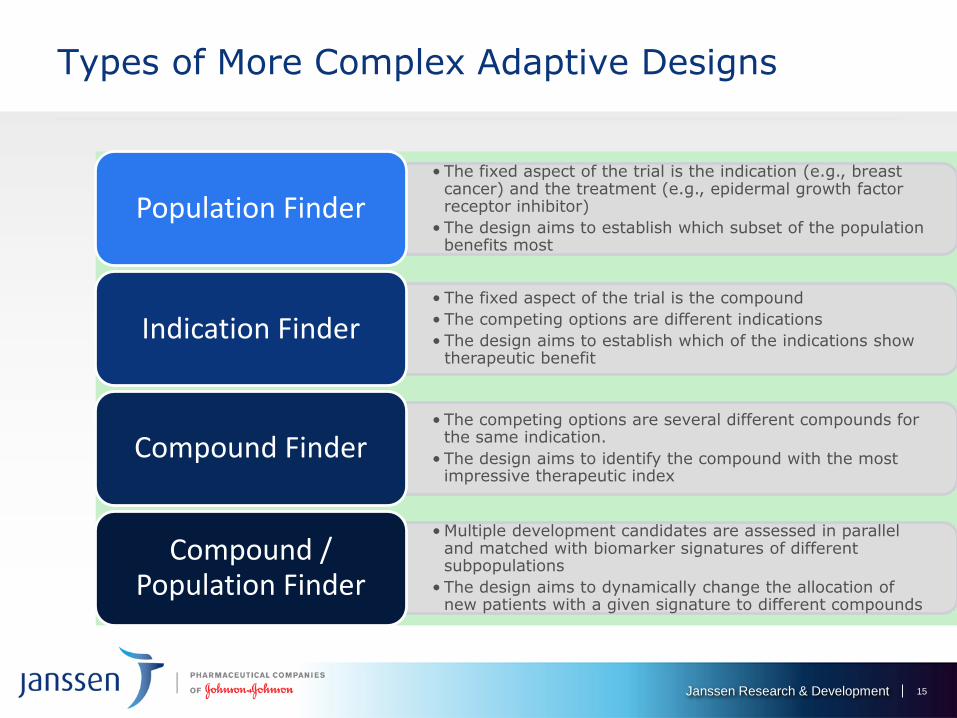
Types of More Complex Adaptive Designs
• The fixed aspect of the trial is the indication (e.g., breast cancer) and the treatment (e.g., epidermal growth factor receptor inhibitor)
• The design aims to establish which subset of the population benefits most
Population Finder
• The fixed aspect of the trial is the compound
• The competing options are different indications
• The design aims to establish which of the indications show therapeutic benefit
Indication Finder
• The competing options are several different compounds for the same indication.
• The design aims to identify the compound with the most impressive therapeutic index
Compound Finder
• Multiple development candidates are assessed in parallel and matched with biomarker signatures of different subpopulations
• The design aims to dynamically change the allocation of new patients with a given signature to different compounds
Compound / Population Finder
Janssen Research & Development
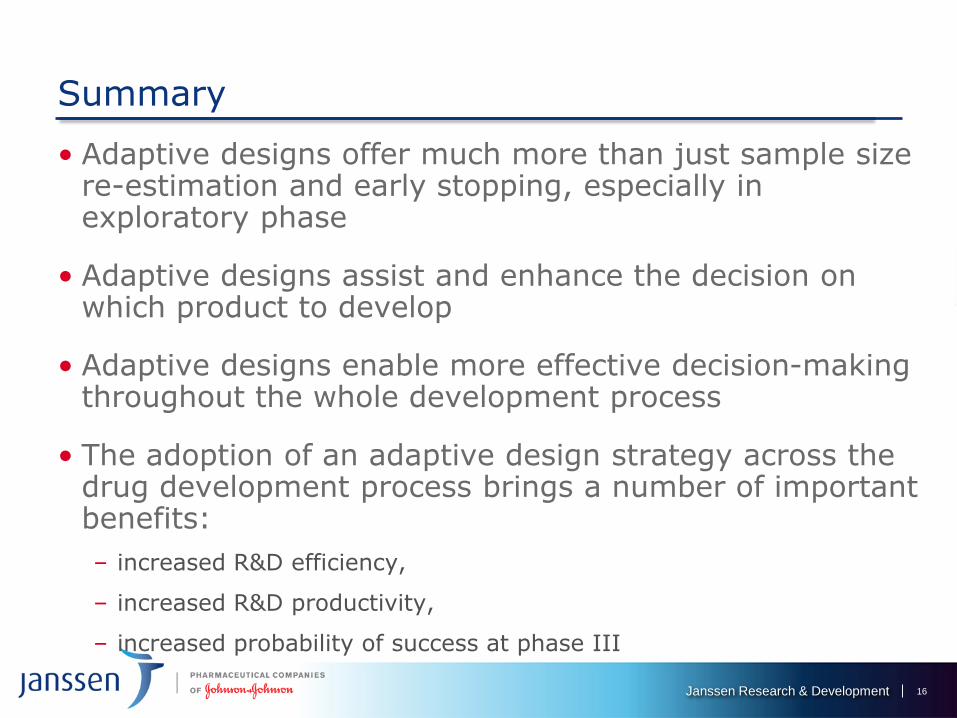
Summary
16
• Adaptive designs offer much more than just sample size re-estimation and early stopping, especially in exploratory phase
• Adaptive designs assist and enhance the decision on which product to develop
• Adaptive designs enable more effective decision-making throughout the whole development process
• The adoption of an adaptive design strategy across the drug development process brings a number of important benefits:
– increased R&D efficiency,
– increased R&D productivity,
– increased probability of success at phase III
Review of obstacles, barriers, problems and logistical issues with
adaptive design studies
Judith Quinlan
VP Innovations Center
ICON plc
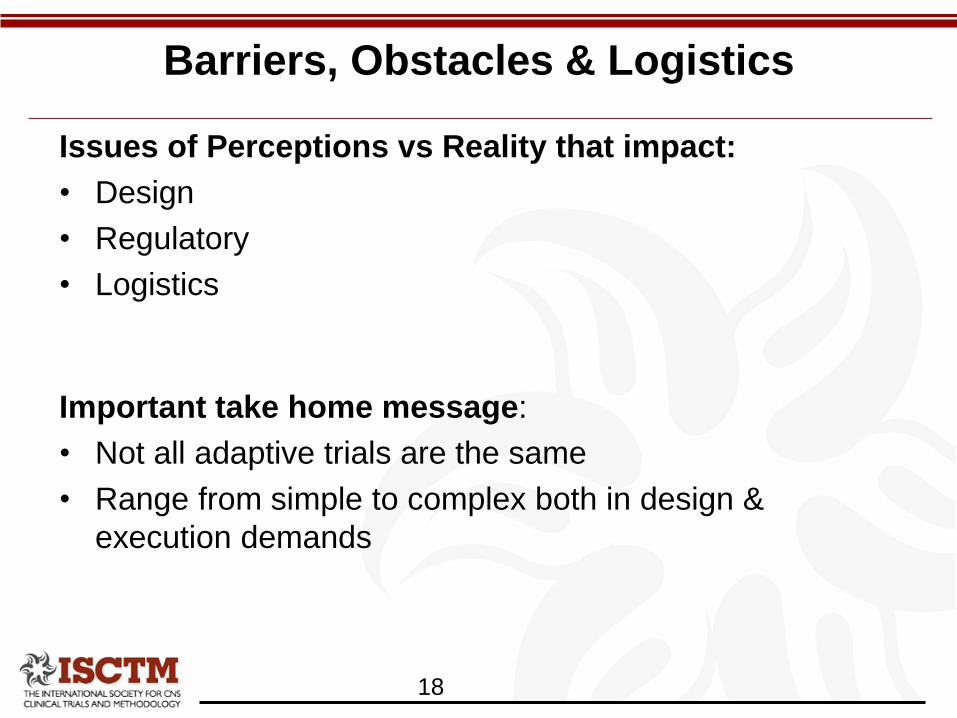
Barriers, Obstacles & Logistics
Issues of Perceptions vs Reality that impact:
• Design
• Regulatory
• Logistics
Important take home message:
• Not all adaptive trials are the same
• Range from simple to complex both in design &
execution demands
18

Design
• Knowledge, Experience & Expectations
– Limited hubs of design expertise within:
• companies
• external provider organizations
• Regulatory agencies
– Not yet mainstream: a skill not broadly available at
the project statistician level
– Team / knowledge heterogeneity & silos
• Statisticians , Clinicians., Operations,.
Management
• Potential for too many cooks in the kitchen
19
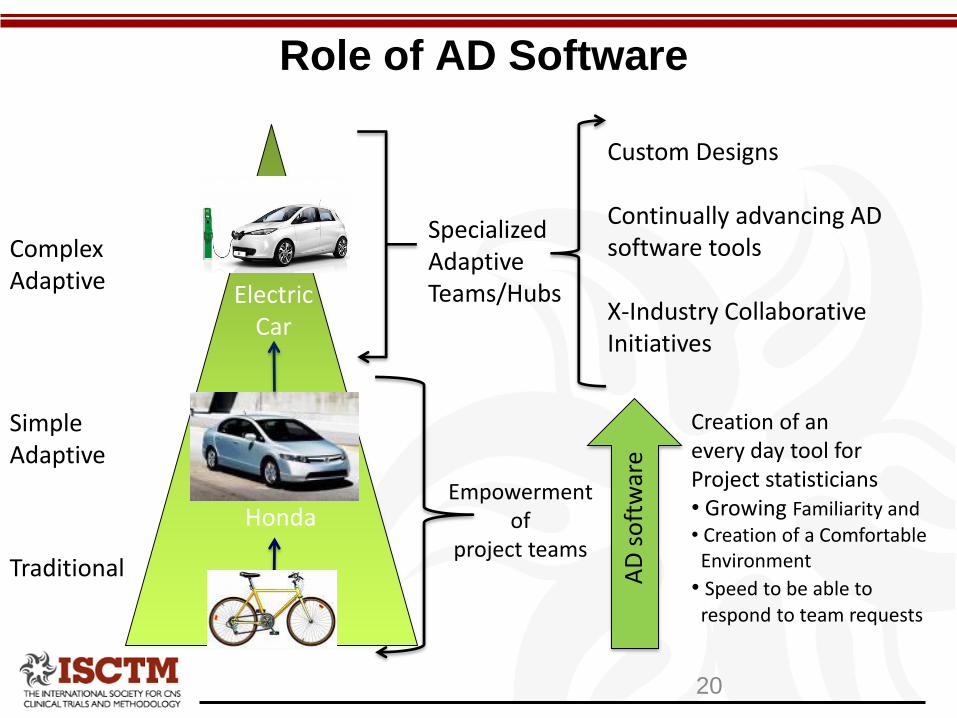
Role of AD Software
Traditional
Simple Adaptive
ComplexAdaptive
Empowerment of
project teams
Specialized AdaptiveTeams/HubsElectric
Car
Honda
AD
so
ftw
are
Creation of an every day tool for Project statisticians• Growing Familiarity and • Creation of a Comfortable
Environment
• Speed to be able torespond to team requests
Custom Designs
Continually advancing AD software tools
X-Industry Collaborative Initiatives
20
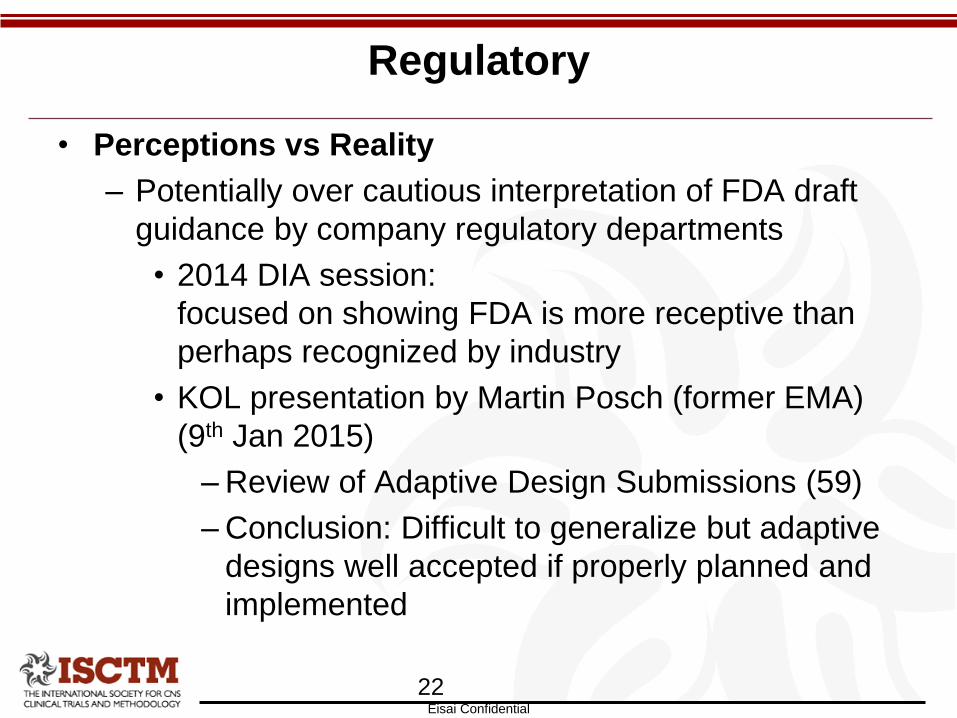
Regulatory
• Perceptions vs Reality
– Potentially over cautious interpretation of FDA draft
guidance by company regulatory departments
• 2014 DIA session:
focused on showing FDA is more receptive than
perhaps recognized by industry
• KOL presentation by Martin Posch (former EMA)
(9th Jan 2015)
– Review of Adaptive Design Submissions (59)
– Conclusion: Difficult to generalize but adaptive
designs well accepted if properly planned and
implemented
22Eisai Confidential

Logistics: Guiding Principles
• Maintaining Trial Integrity
• Minimizing Operational Bias
• Maintaining trial integrity and minimizing operational bias
go hand in hand
23
“…comprehensive and prospective, written standard operating
procedures (SOPs) that define who will implement the interim
analysis and adaptation plan…”(FDA Guidance For Industry, line 1685)
“…Many CROs do not have long histories of carrying out
these responsibilities. Study sponsors should have assurance
that the personnel performing these roles have appropriate
expertise…”(FDA Guidance For Industry, line 1725)

Link between Design & Execution
DesignSimple Complex
Sim
ple
Co
mp
lex
Exe
cuti
on
SSR/futility
single interim
(firewalls &
process)
Few treatments
Single /few interims
Dropping treatments
and/or early stops for
futility/efficacy
Response Adaptive
DR; ;
Seamless II/III
Traditional
Simple
Complex
24
Most adaptive trials today

Levels of Complexity:
Not all designs the same
• All Adaptive Designs require workflow for – Timely availability of data
– Processes for conducting the interim analysis
– Making Decisions
– Implementation of decisions
– Firewalls: Information access control
• Complexity driven by:– How many interims
– How many treatments
– How many things are being changed/impacted
• sample size alone, changes to randomization, drug supply
• How many studies are being conducted as adaptive– Resource (including DMCs)
25
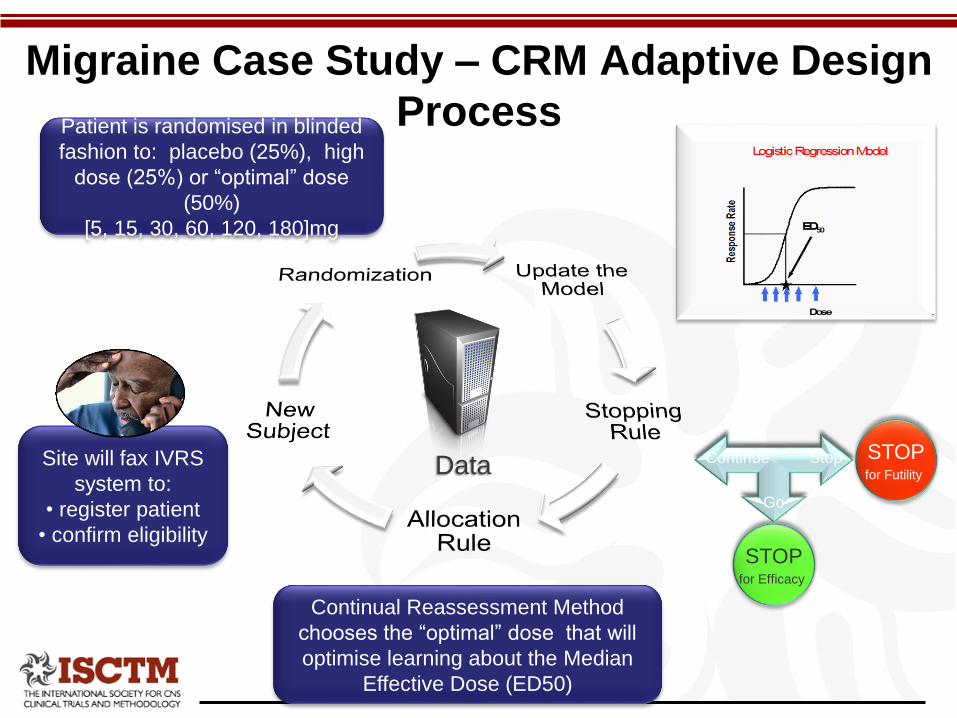
Migraine Case Study – CRM Adaptive Design
Process
Continue Stop
Go
STOPfor Futility
STOPfor Efficacy
Data
Continual Reassessment Method
chooses the “optimal” dose that will
optimise learning about the Median
Effective Dose (ED50)
Patient is randomised in blinded
fashion to: placebo (25%), high
dose (25%) or “optimal” dose
(50%)
[5, 15, 30, 60, 120, 180]mg
Site will fax IVRS
system to:
• register patient
• confirm eligibility
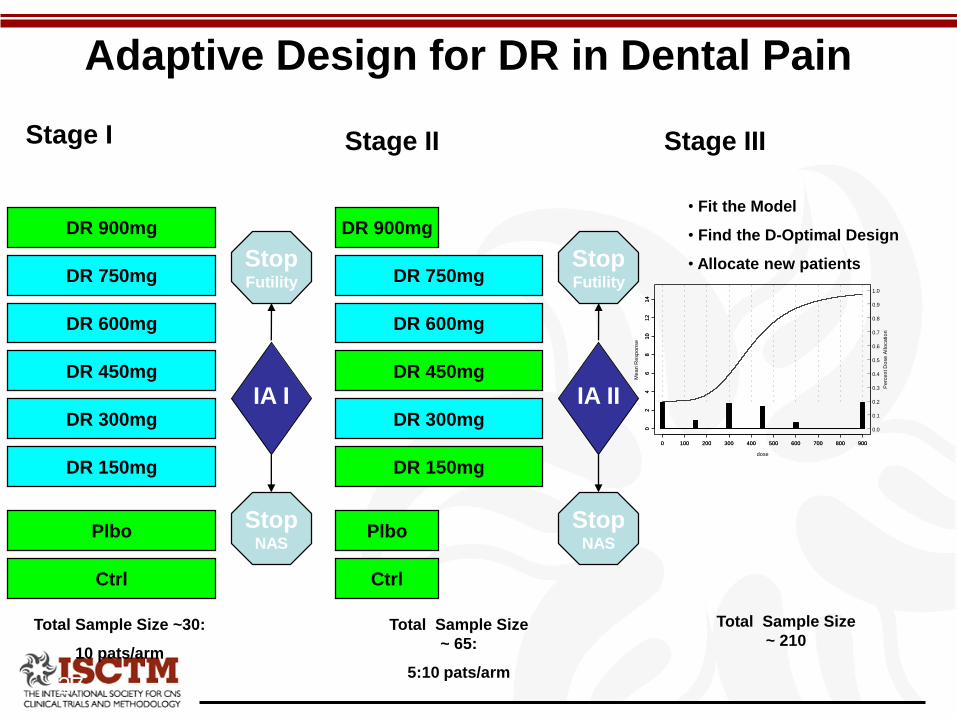
Adaptive Design for DR in Dental Pain
Plbo
Ctrl
Stage I
DR 150mg
IA I
StopNAS
DR 750mg
DR 600mg
DR 450mg
DR 300mg
DR 900mg
StopFutility
Total Sample Size ~30:
10 pats/arm
Plbo
Ctrl
DR 150mg
IA II
StopNAS
DR 750mg
DR 600mg
DR 450mg
DR 300mg
DR 900mg
StopFutility
Total Sample Size
~ 65:
5:10 pats/arm
Stage II Stage III
dose
Me
an
Re
sp
on
se
0 100 200 300 400 500 600 700 800 900
02
46
81
01
21
4
Pe
rce
nt D
ose
Allo
ca
tio
n
0.0
0.1
0.2
0.3
0.4
0.5
0.6
0.7
0.8
0.9
1.0
0 100 200 300 400 500 600 700 800 900
02
46
81
01
21
4
• Fit the Model
• Find the D-Optimal Design
• Allocate new patients
Total Sample Size
~ 210
27
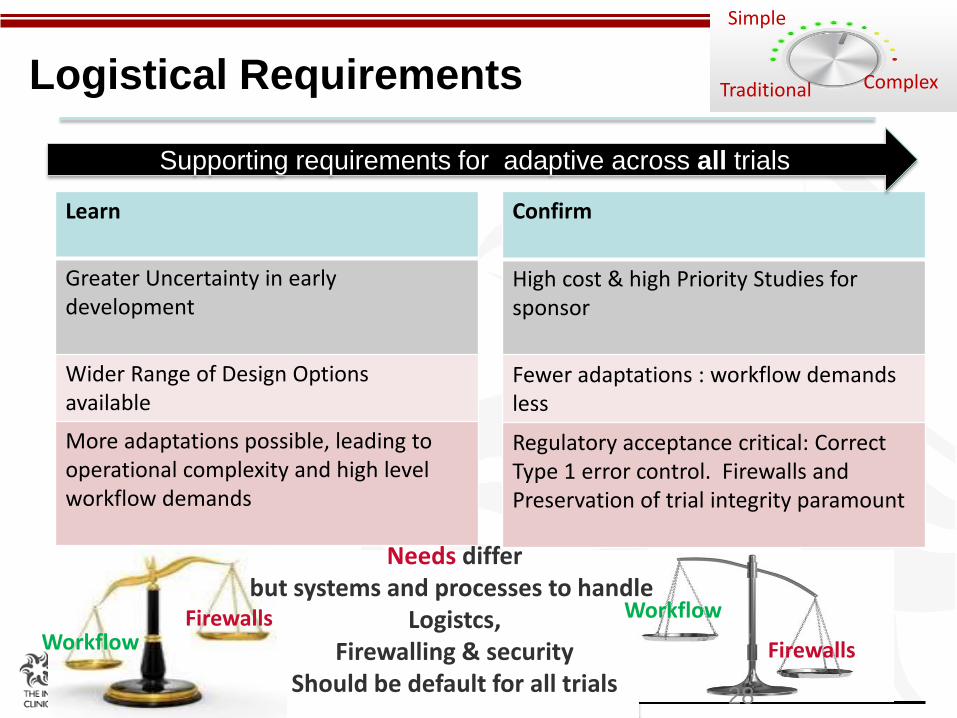
Learn
Greater Uncertainty in early development
Wider Range of Design Optionsavailable
More adaptations possible, leading to operational complexity and high level workflow demands
Confirm
High cost & high Priority Studies for sponsor
Fewer adaptations : workflow demands less
Regulatory acceptance critical: Correct Type 1 error control. Firewalls and Preservation of trial integrity paramount
Supporting requirements for adaptive across all trials
Logistical Requirements
Workflow Firewalls
Firewalls
Firewalls
Workflow
Needs differbut systems and processes to handle
Logistcs,Firewalling & security
Should be default for all trials
Traditional
Simple
Complex
28
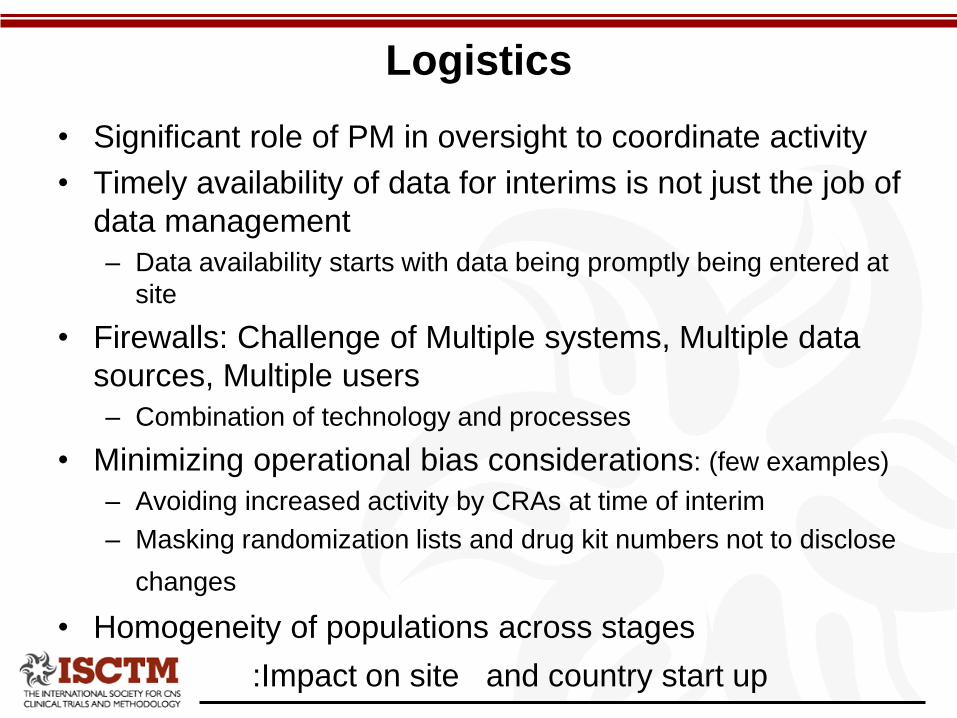
Logistics
• Significant role of PM in oversight to coordinate activity
• Timely availability of data for interims is not just the job of
data management
– Data availability starts with data being promptly being entered at
site
• Firewalls: Challenge of Multiple systems, Multiple data
sources, Multiple users
– Combination of technology and processes
• Minimizing operational bias considerations: (few examples)
– Avoiding increased activity by CRAs at time of interim
– Masking randomization lists and drug kit numbers not to disclose
changes
• Homogeneity of populations across stages
:Impact on site and country start up

LogisticsInterim decisions
• Ideal to have a DMC statistician who understand adaptive
trials
• Providing clear and understandable decision guidelines
for DMC members to enable then to make interim
decisions
– DMC external for confirmatory trials
– Relaxation of requirement for early phase trials
Implementation of changes:
• Changing randomization
• Challenge for Drug Supply:
– initial planning requirements/ post interim period
– Managing potential for post interim risks of stock out

Summary
31
• Adaptive trials range from the simple to the complex
• The number of adaptive trials is still small relative to the
number of traditional designs:
• We are far more advanced today than 10 years ago
– Software to design adaptive trials now exists
– Draft/ Regulatory Guidance documents exist
– Many case studies available
• Being executed using existing infrastructure
• Can be manually intense work around solutions
• Some changes to clinical operations are required
• The Future: For large scale uptake we need scalable &
integrated IT solutions to reduce the manual overhead of
work around solutions
Bayesian Adaptive Trial Design: A New Approach for Phase 2 Clinical
Trials in Alzheimer’s Disease
Andrew Satlin, M.D.
Head of Clinical Development
Neuroscience and General Medicine
Eisai, Inc.

We Need to Rethink Study Design for AD Trials
Motivation• Several Phase 3 failures
• Need proof-of-concept before Phase 3 – Identify the right dose
Inherent Challenges
• Studies shifting to earlier disease
– Progression slow = large sample sizes, long trials
• Multiple uncertainties
– Dose/regimen, treatment effect size, sample size, etc.
Novel Approach
• Bayesian adaptive design allows informed and efficient decision
making through ongoing analysis of existing study data
– Opportunity to make decisions earlier
33

Bayesian Adaptive Design
helps us to drive with our eyes open
• Adaptive design algorithm uses probability distributions for dose
effects
• Longitudinal model imputes later endpoints based on effects at
earlier points
• Multiple planned interim analyses (IA) update the probability
distributions and longitudinal model
• Based on IA results, the trial can be stopped for futility, or accrual
can be stopped for early success, leading to faster initiation of
Phase 3
• To find the most effective dose with fewer subjects
– Can start trial with larger number of active treatment arms than a
traditional Phase 2 trial
– Response adaptive randomization assigns patients to more favorable
doses based on IA results
• Bayesian Adaptive Design helps mitigate risk of multiple unknowns
34
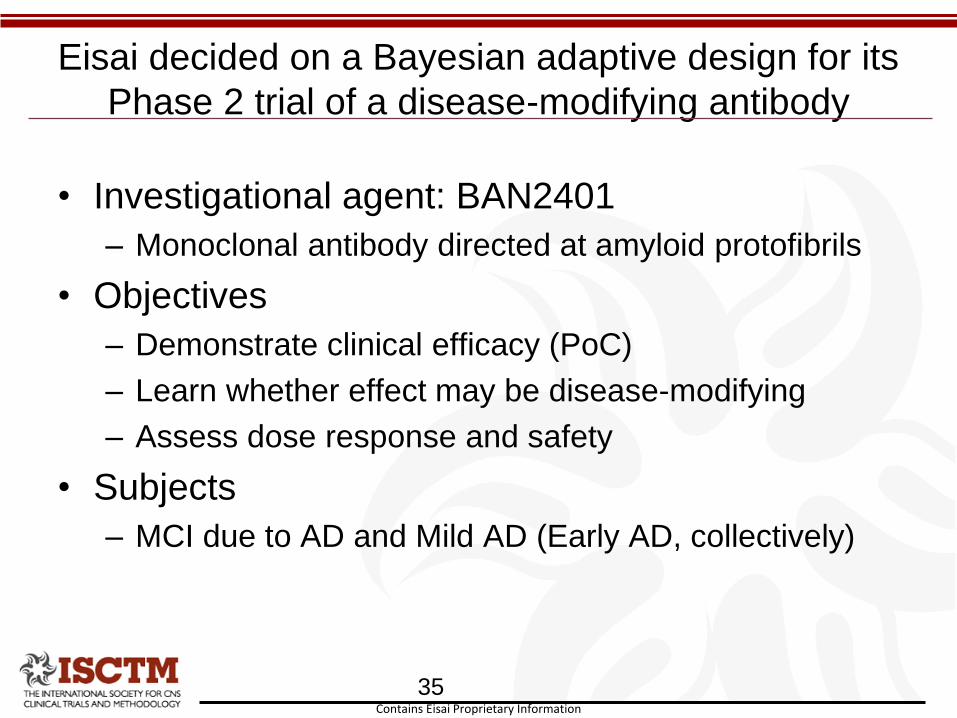
Eisai decided on a Bayesian adaptive design for its
Phase 2 trial of a disease-modifying antibody
• Investigational agent: BAN2401
– Monoclonal antibody directed at amyloid protofibrils
• Objectives
– Demonstrate clinical efficacy (PoC)
– Learn whether effect may be disease-modifying
– Assess dose response and safety
• Subjects
– MCI due to AD and Mild AD (Early AD, collectively)
35Contains Eisai Proprietary Information
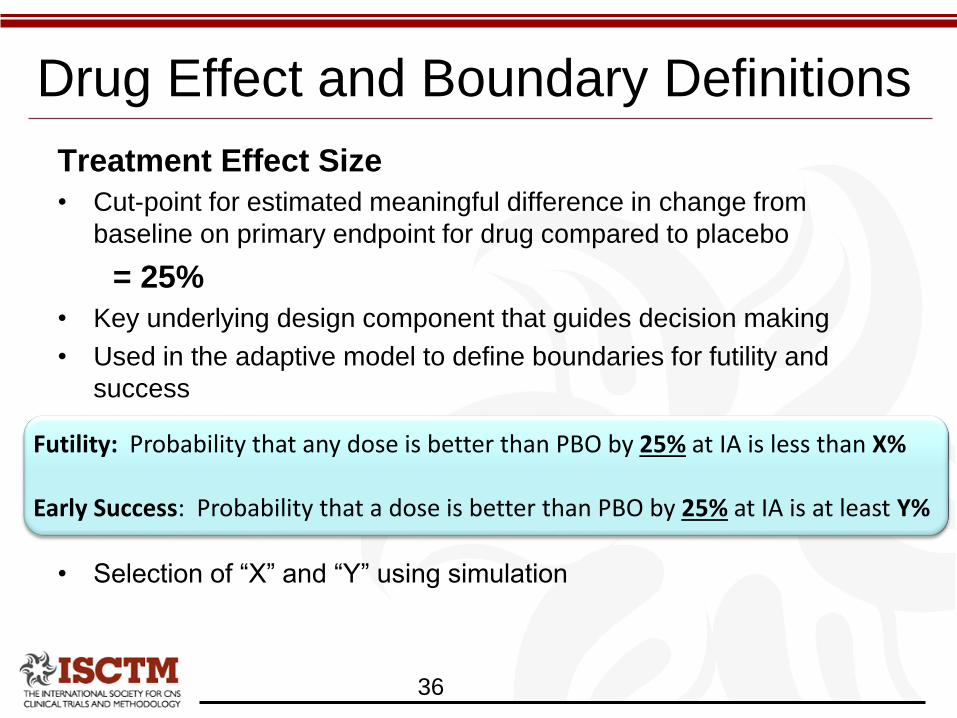
Treatment Effect Size
• Cut-point for estimated meaningful difference in change from
baseline on primary endpoint for drug compared to placebo
= 25%
• Key underlying design component that guides decision making
• Used in the adaptive model to define boundaries for futility and
success
•
• Selection of “X” and “Y” using simulation
Drug Effect and Boundary Definitions
36
Futility: Probability that any dose is better than PBO by 25% at IA is less than X%
Early Success: Probability that a dose is better than PBO by 25% at IA is at least Y%

Role of Simulations in Adaptive Design Process
Known Study Characteristics
Final Trial DesignConfirm Design Performance and Credibility
Dose Effect Scenarios
Design Components Simulations
• Dose arms • 1° endpoint and timing• Patient population
• Futility/success boundaries• Treatment effect size• Sample size • Allocation rules• Existing data/Modeling
Operating Characteristics
Objective• POC• Dose-Finding
Execution
• Accrual Rate• Drop out rate
• Type I and II error• Interim analysis timing• Probability of futility• Probability of early success• Probability of overall success• Probability Phase III go
decision
+
• 13 total
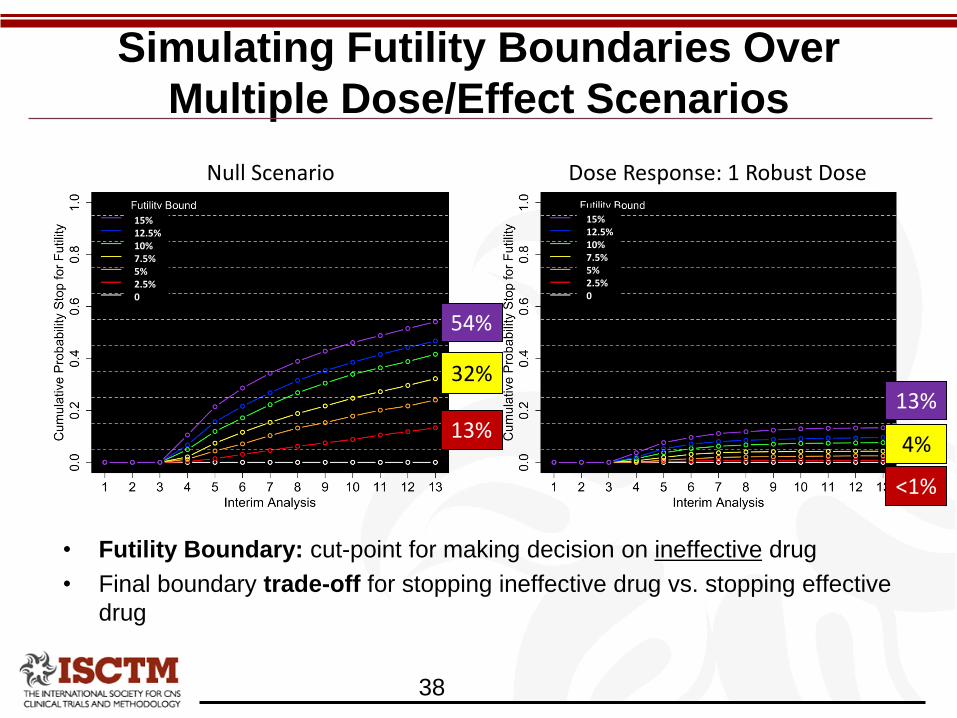
Simulating Futility Boundaries Over
Multiple Dose/Effect Scenarios
38
• Futility Boundary: cut-point for making decision on ineffective drug
• Final boundary trade-off for stopping ineffective drug vs. stopping effective
drug
54%
13%13%
<1%
32%
4%
Null Scenario
15%12.5%10%7.5%5%2.5%0
15%12.5%10%7.5%5%2.5%0
Dose Response: 1 Robust Dose
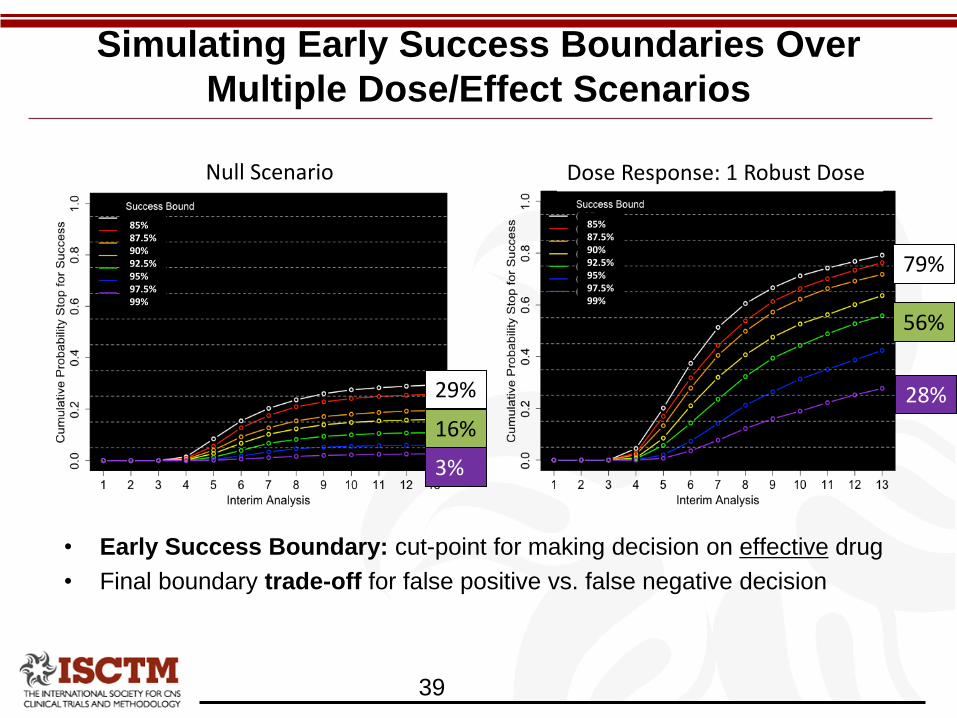
Simulating Early Success Boundaries Over
Multiple Dose/Effect Scenarios
39
• Early Success Boundary: cut-point for making decision on effective drug
• Final boundary trade-off for false positive vs. false negative decision
3%
29% 28%
Null Scenario
85%87.5%90%92.5%95%97.5%99%
85%87.5%90%92.5%95%97.5%99%
Dose Response: 1 Robust Dose
79%
16%
56%
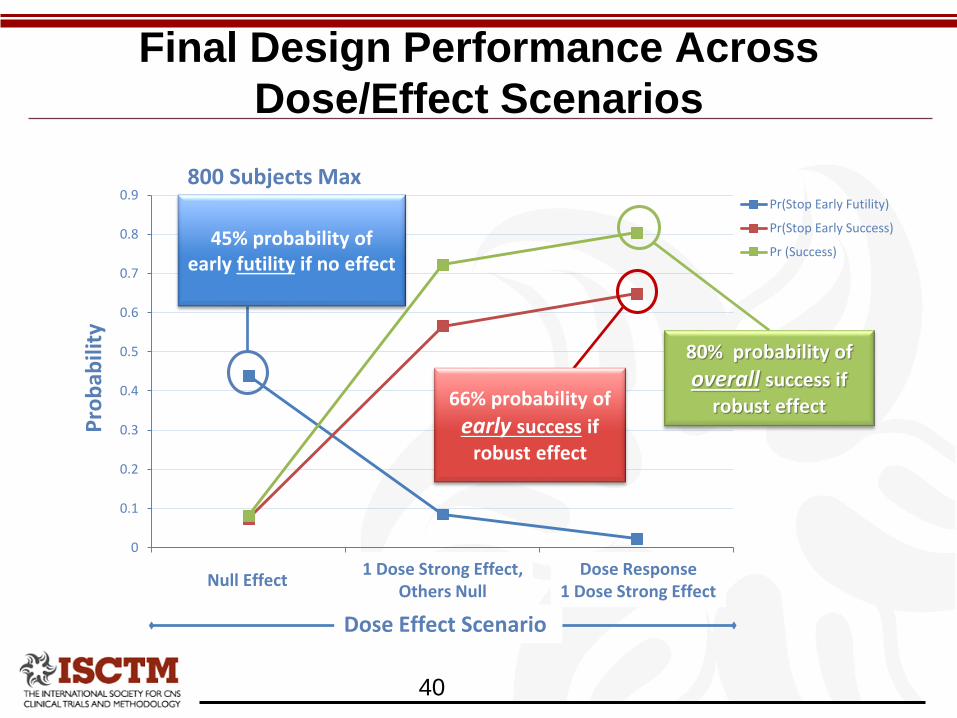
Final Design Performance Across
Dose/Effect Scenarios
40
0
0.1
0.2
0.3
0.4
0.5
0.6
0.7
0.8
0.9
Null One Good Two Good
Pr(Stop Early Futility)
Pr(Stop Early Success)
Pr (Success)45% probability of
early futility if no effect
80% probability of
overall success if robust effect
1 Dose Strong Effect,Others Null
Dose Response1 Dose Strong Effect
Null Effect
Pro
bab
ility
Dose Effect Scenario
66% probability of
early success if robust effect
800 Subjects Max
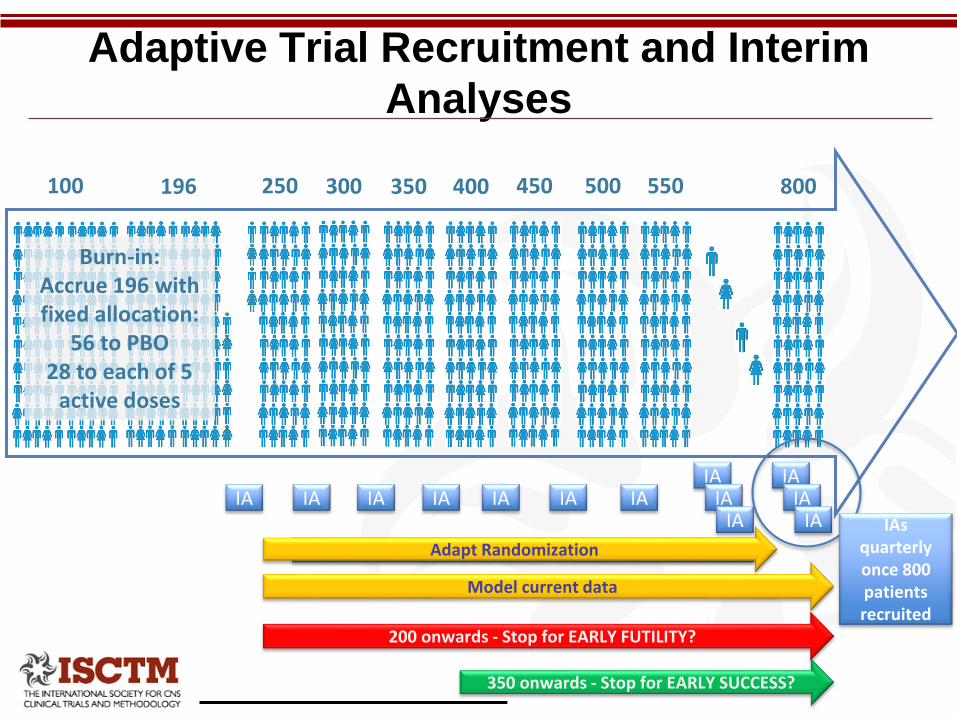
Adaptive Trial Recruitment and Interim
Analyses
100 196
Burn-in:Accrue 196 withfixed allocation:
56 to PBO28 to each of 5
active doses
IA
200 onwards - Stop for EARLY FUTILITY?
350 onwards - Stop for EARLY SUCCESS?
IA IA IA IA IA IA
300250 350 400 500450 550 800
IAIA
IA
IAIA
IA IAsquarterlyonce 800 patients recruited
Interim Analyses every 50 patients
Model current data
Adapt Randomization
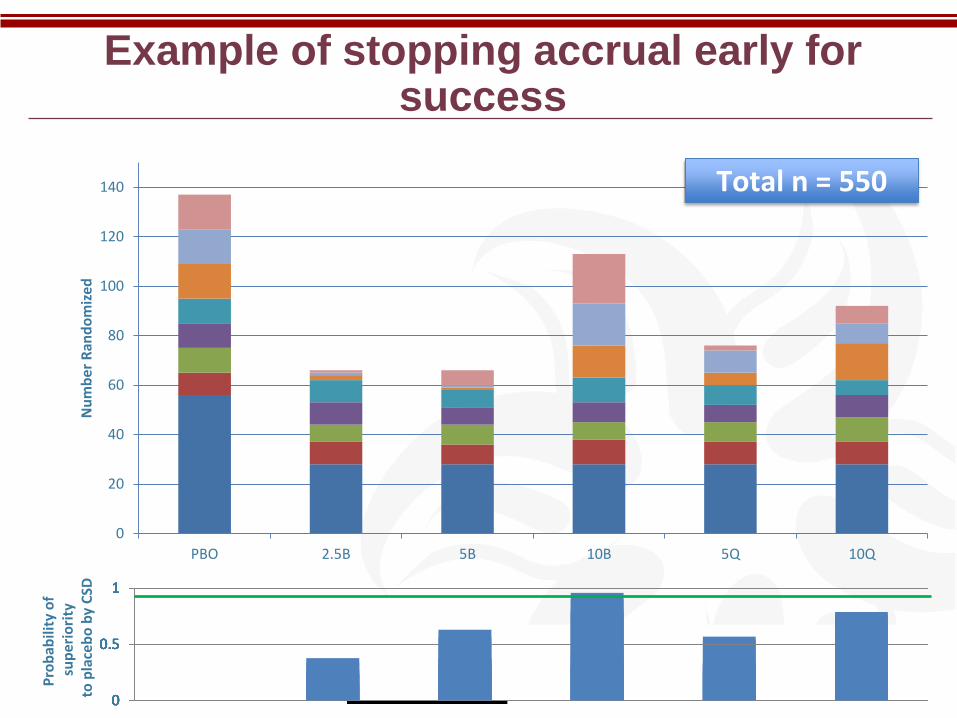
Example of stopping accrual early for success
0
0.5
1
0
20
40
60
80
100
120
140
PBO 2.5B 5B 10B 5Q 10Q
Nu
mb
er R
and
om
ized
0
0.5
1
0
0.5
1
0
0.5
1
0
0.5
1
0
0.5
1
0
0.5
1
0
0.5
1
Pro
bab
ility
of
sup
erio
rity
to p
lace
bo
by
CSD
Total n = 550

Example of stopping accrual early for futility
0
0.5
1
0
0.5
1
0
0.5
1
0
0.5
1
0
0.5
1
0
0.5
1
0
0.5
1
0
20
40
60
80
100
120
140
PBO 2.5B 5B 10B 5Q 10Q
Nu
mb
er R
and
om
ized
Pro
bab
ility
of
sup
erio
rity
to p
lace
bo
by
CSD
Total n = 500

Final Design Sample Size Distribution Across
Dose/Effect Scenarios
Simulation results for final design parameters
• 800 subjects max
•
– Almost never reach 800 subjects
• Time to decision with fewer subjects = shorter trial duration
• On average, decision reached 17 months earlier
44
Dose/Effect Scenarios
Scenario Null1 Robust Dose
Others Null
Dose Response
1 Robust Dose
Average Across
All 13
Subjects to
Decision
(average)
683 669 657 626

Summary
• Phase 2 clinical trials should demonstrate proof-of-efficacy before proceeding to
Phase 3
• BAN2401 is an amyloid-based investigational therapy predicted to work best in
an early AD population where disease progression is slow and sample size
requirements are therefore large for a traditional trial
• Bayesian adaptive design utilizes interim analyses to update randomization
allocation and assess futility or success
• Bayesian design mitigates risks associated with larger and longer trials
– Early termination if ineffective
– Early advancement to successful Phase 3
– Better dose selection
• Approach is encouraged by regulatory authorities
• A similar approach is now being used for Phase 2 with a BACE1 inhibitor
45

BMS-927711 for the Acute Treatment of Migraine: A Double-Blind,
Randomized, Placebo Controlled, Dose-Ranging Trial
Ronald Marcus, MDChief Medical Officer
Spinifex Pharmaceuticals

Migraine: Case Study of an Adaptive
Design • Migraine - episodic headache lasting 4-72 hours
– Associated symptoms include nausea, vomiting, photophobia and phonophobia
– Affects 12% of population (3:1 women to men)
– Treatment: Triptans, NSAIDs and Excedrin
• Adaptive designs have been successfully used by Merck and BI migraine programs
• Study examines a novel mechanism: calcitonin gene related peptide (CGRP) receptor antagonist
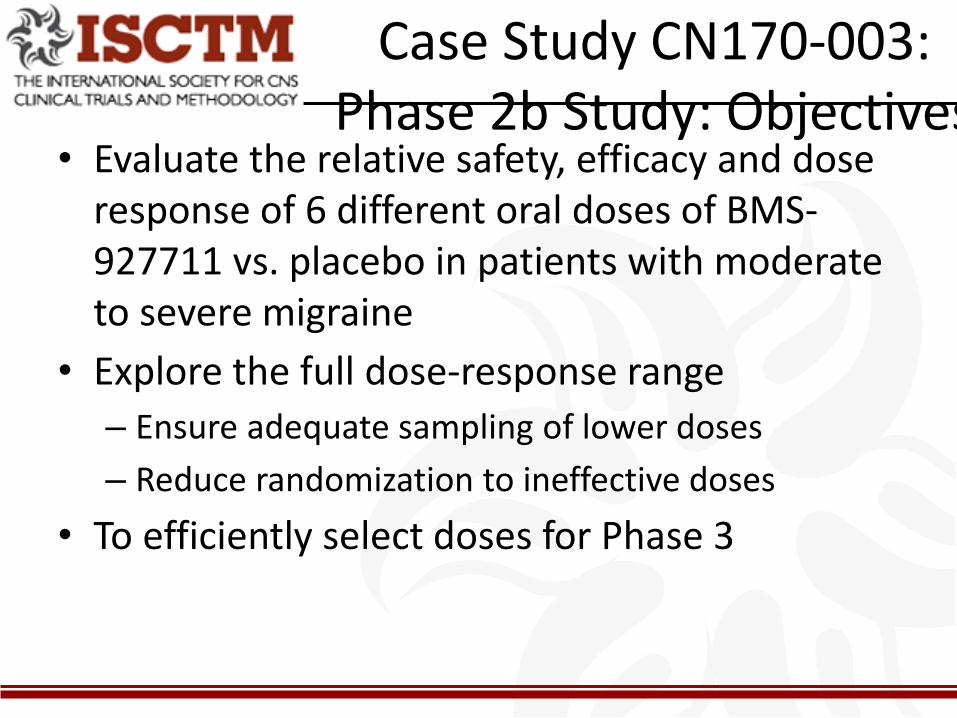
Case Study CN170-003:Phase 2b Study: Objectives
• Evaluate the relative safety, efficacy and dose response of 6 different oral doses of BMS-927711 vs. placebo in patients with moderate to severe migraine
• Explore the full dose-response range
– Ensure adequate sampling of lower doses
– Reduce randomization to ineffective doses
• To efficiently select doses for Phase 3

Case Study CN170-003:Study Design
• Randomized, double-blind, placebo and active-controlled, parallel group, outpatient study
• Single headache
• Dose Groups– BMS-927711 10mg, 25mg, 75mg, 150mg, 300
mg, 600mg
– Placebo
– Sumatriptan 100 mg
• Primary endpoint – pain relief at 2 hours
• Fixed 1:3 randomization ratio for placebo versus other treatments used to reduce
Study Schematic
Randomization
Treatment
(Treatment of one
migraine of
moderate or severe
intensity)
Evaluation*
(30 mins to 48
hours post dose)
End of
Study
3 - 28 days
Screening/
Baseline
Phase
Acute Treatment Phase
Treatment of migraine must occur within 45 days of randomization
End of Treatment
Visit
Within 7 days of
treatment
ScreeningVisit
* Data collection via electronic diary
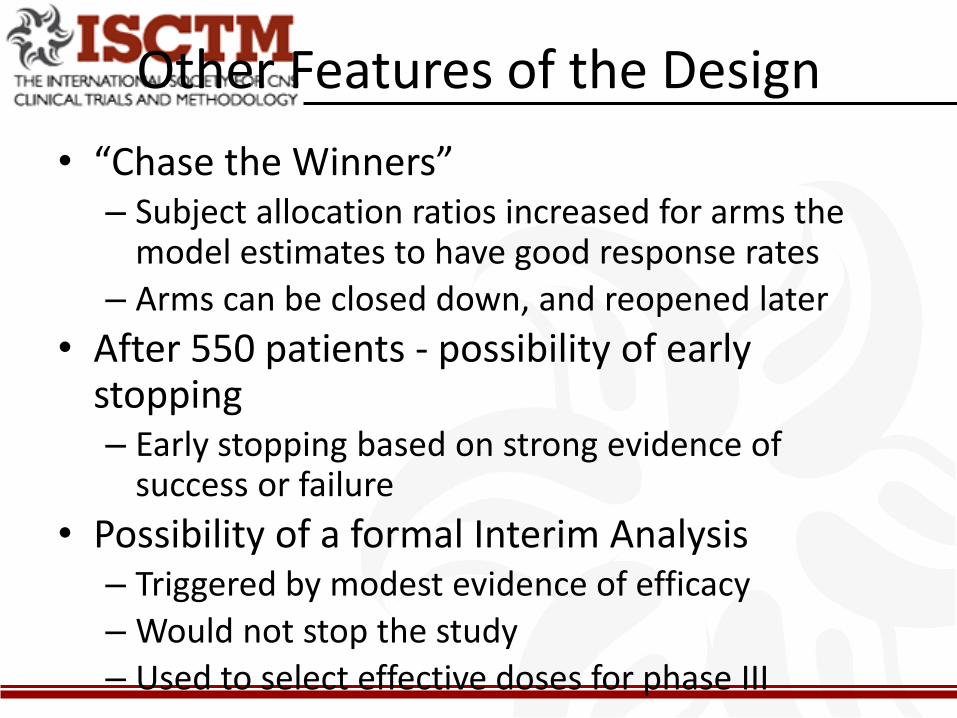
Other Features of the Design
• “Chase the Winners”– Subject allocation ratios increased for arms the
model estimates to have good response rates
– Arms can be closed down, and reopened later
• After 550 patients - possibility of early stopping – Early stopping based on strong evidence of
success or failure
• Possibility of a formal Interim Analysis– Triggered by modest evidence of efficacy
– Would not stop the study
– Used to select effective doses for phase III

Adaptive Design: Taking the Plunge
Statistical

Adaptation Process Bayesian with Weekly Adaptation
Weight randomization to doses most
informative about
ED90* & MED**
Dose
Allocator
Estimate dose-response curve
Single MigraineData collected /
processed
Predictive
ModelData Interface
Continue Early
Stop
Decision rule
Terminator
New Patient
Randomizeto placebo,
suma’ or BMS-’711
Randomizer
Success
or
Futility
* ED90 – is the dose that attains 90% of maximal efficacy response
** MED – “Minimum Effective Dose” – Smallest dose with efficacy 15% above PBO

Randomization
• Burn-in Period: 336 patients – 84 patients to placebo
– 36 to Sumatriptan
– 36 to each of the 6 BMS-927711 doses• 12 blocks of size 28 (7:3:3:3:3:3:3:3)
• Adaptive Phase: – 2 of each 8 patients to placebo
– 1 of each 8 to Sumatriptan
– 5 of each 8 to the 6 BMS doses• Block size of 32. 8 to PBO; 4 to sumatriptan;
20 to BMS-927711
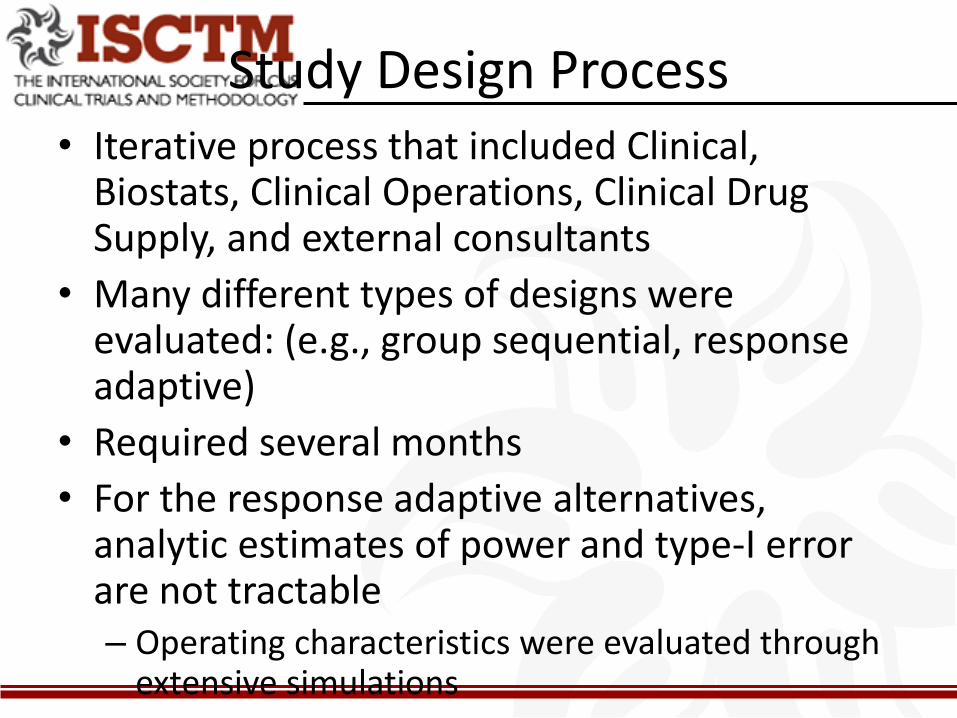
Study Design Process• Iterative process that included Clinical,
Biostats, Clinical Operations, Clinical Drug Supply, and external consultants
• Many different types of designs were evaluated: (e.g., group sequential, response adaptive)
• Required several months
• For the response adaptive alternatives, analytic estimates of power and type-I error are not tractable– Operating characteristics were evaluated through
extensive simulations
– Evaluating a single, response-adaptive design
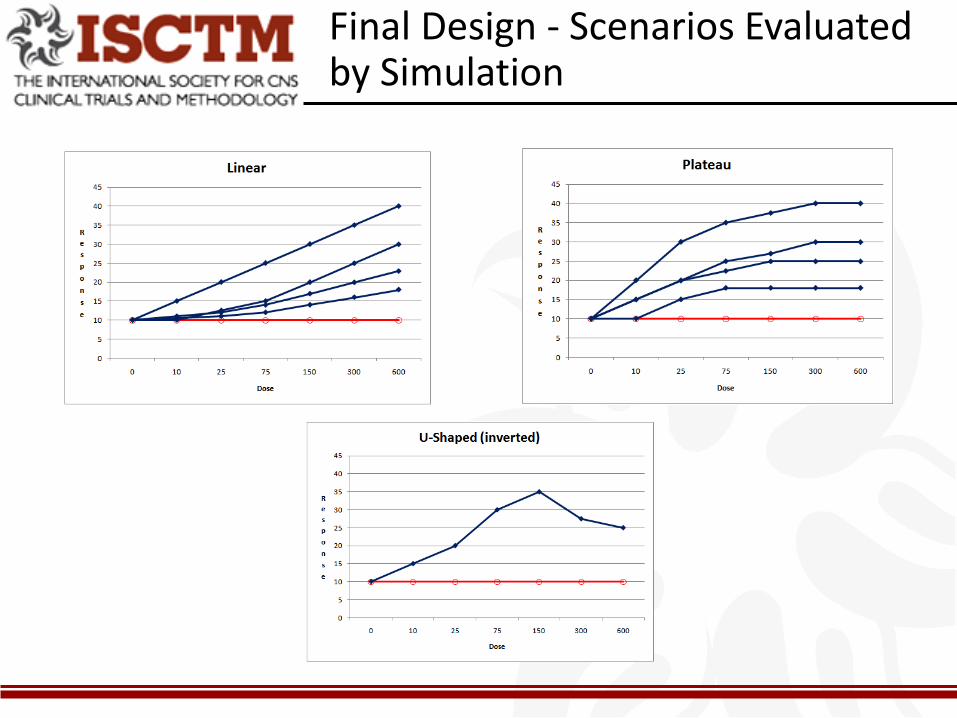
Final Design - Scenarios Evaluated by Simulation

Mean Allocation for Linear, Plateau and U-Shaped Scenarios
U-Shaped
Linear Plateau

Procedural
Adaptive Design: Taking the Plunge
Logistical
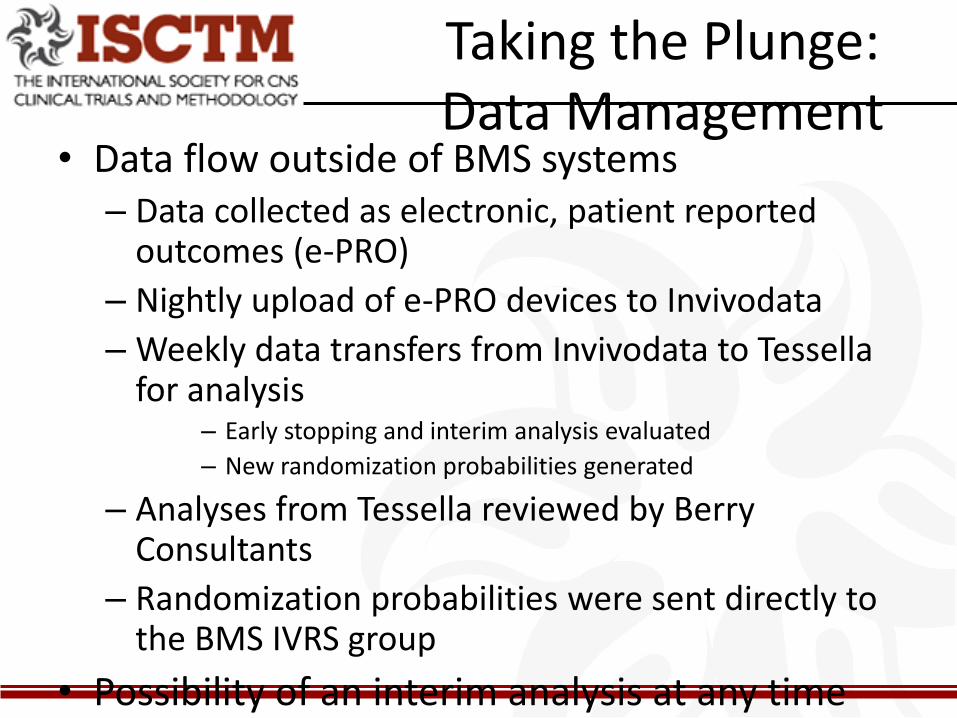
Taking the Plunge:Data Management
• Data flow outside of BMS systems– Data collected as electronic, patient reported
outcomes (e-PRO)
– Nightly upload of e-PRO devices to Invivodata
– Weekly data transfers from Invivodata to Tessellafor analysis
– Early stopping and interim analysis evaluated
– New randomization probabilities generated
– Analyses from Tessella reviewed by Berry Consultants
– Randomization probabilities were sent directly to the BMS IVRS group
• Possibility of an interim analysis at any time required constant data cleaning
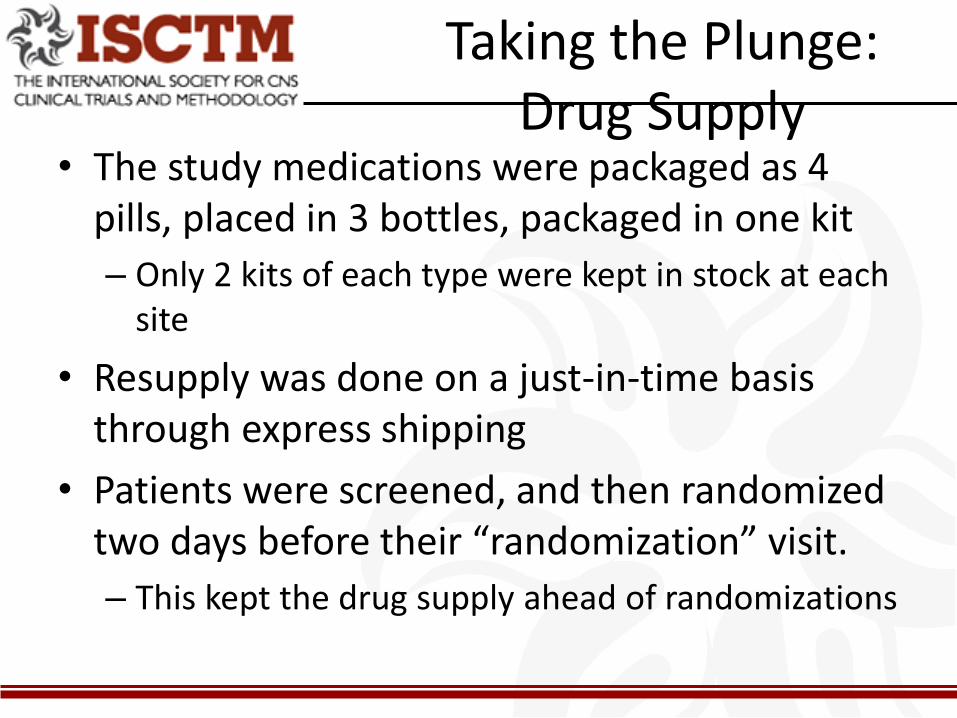
Taking the Plunge:Drug Supply
• The study medications were packaged as 4 pills, placed in 3 bottles, packaged in one kit
– Only 2 kits of each type were kept in stock at each site
• Resupply was done on a just-in-time basis through express shipping
• Patients were screened, and then randomized two days before their “randomization” visit.
– This kept the drug supply ahead of randomizations

Results
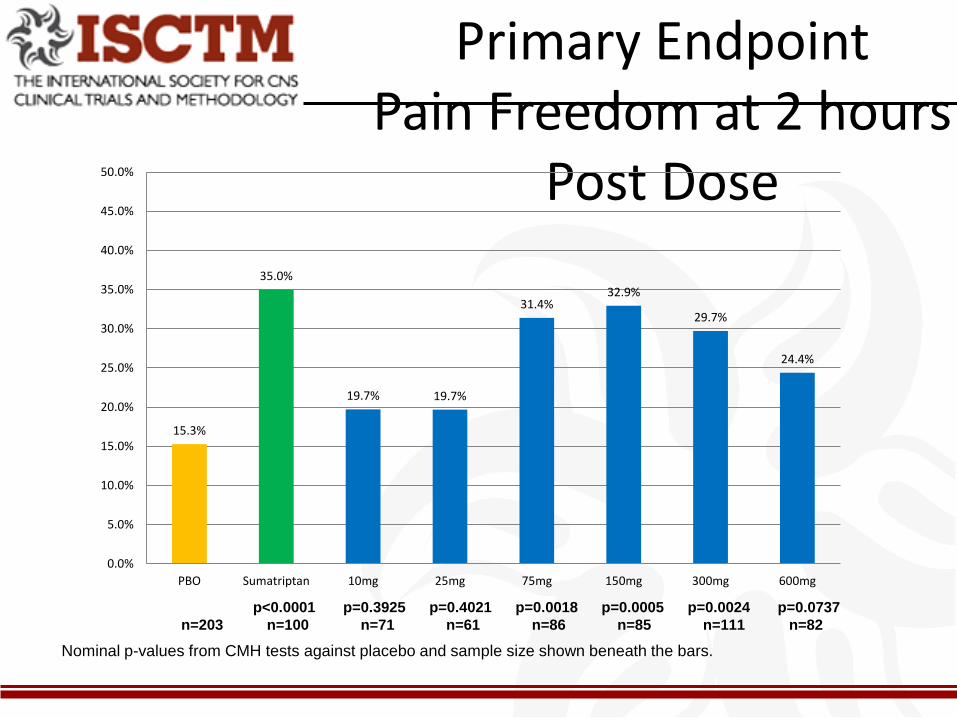
Primary EndpointPain Freedom at 2 hours
Post Dose
Nominal p-values from CMH tests against placebo and sample size shown beneath the bars.
p<0.0001 p=0.3925 p=0.4021 p=0.0018 p=0.0005 p=0.0024 p=0.0737
n=203 n=100 n=71 n=61 n=86 n=85 n=111 n=82
15.3%
35.0%
19.7% 19.7%
31.4%32.9%
29.7%
24.4%
0.0%
5.0%
10.0%
15.0%
20.0%
25.0%
30.0%
35.0%
40.0%
45.0%
50.0%
PBO Sumatriptan 10mg 25mg 75mg 150mg 300mg 600mg
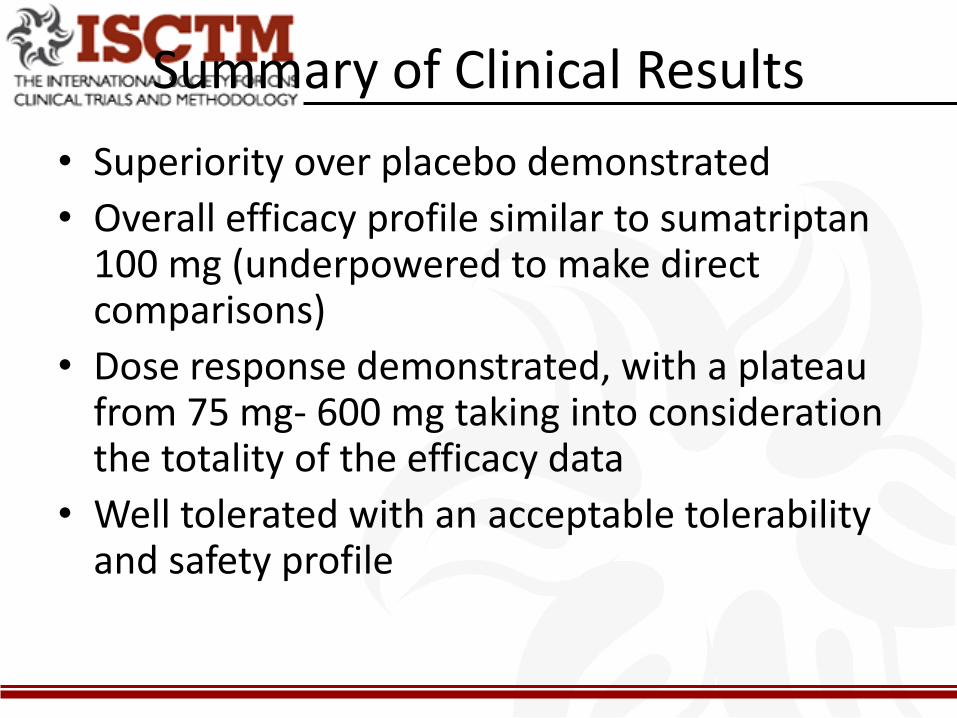
Summary of Clinical Results
• Superiority over placebo demonstrated
• Overall efficacy profile similar to sumatriptan100 mg (underpowered to make direct comparisons)
• Dose response demonstrated, with a plateau from 75 mg- 600 mg taking into consideration the totality of the efficacy data
• Well tolerated with an acceptable tolerability and safety profile
Lessons Learned
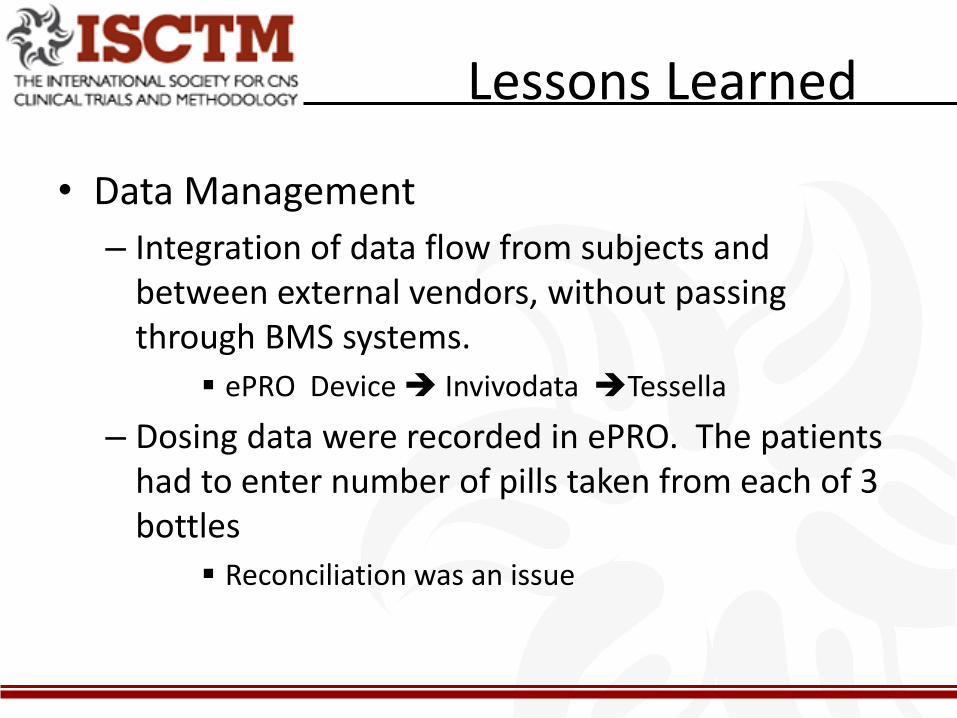
• Data Management
– Integration of data flow from subjects and between external vendors, without passing through BMS systems.
ePRO Device Invivodata Tessella
– Dosing data were recorded in ePRO. The patients had to enter number of pills taken from each of 3 bottles
Reconciliation was an issue
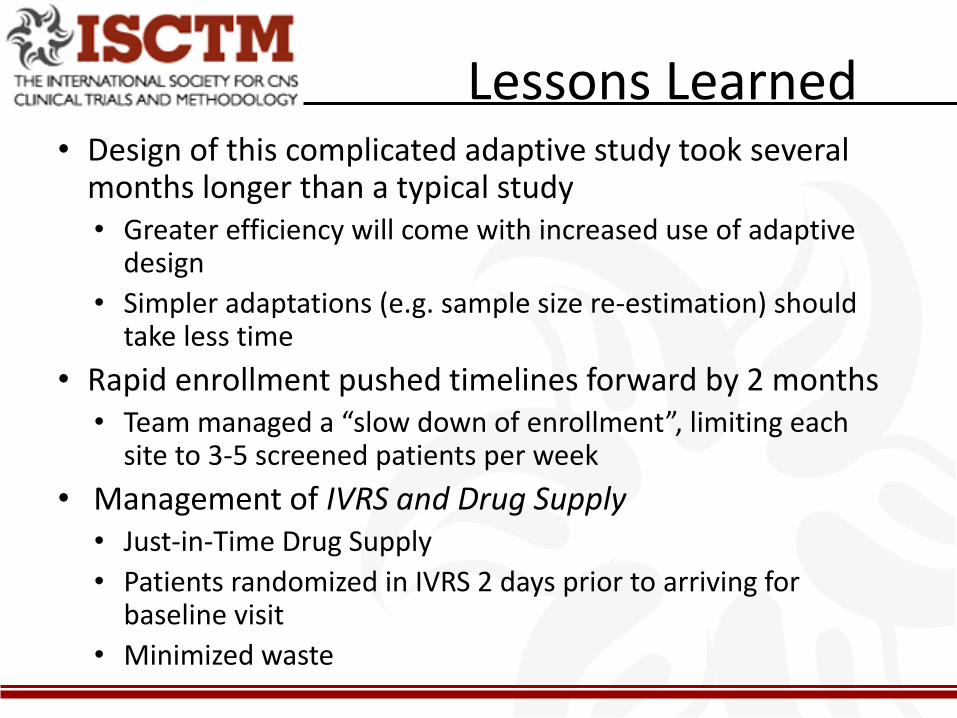
Lessons Learned• Design of this complicated adaptive study took several
months longer than a typical study• Greater efficiency will come with increased use of adaptive
design
• Simpler adaptations (e.g. sample size re-estimation) should take less time
• Rapid enrollment pushed timelines forward by 2 months• Team managed a “slow down of enrollment”, limiting each
site to 3-5 screened patients per week
• Management of IVRS and Drug Supply• Just-in-Time Drug Supply
• Patients randomized in IVRS 2 days prior to arriving for baseline visit
• Minimized waste

Benefits of Adaptive Randomization in CN170-003
• Design allowed a richer exploration of the dose-response relationship than could have been achieved using fixed sample size alternatives– Relative to fixed alternatives, this design allowed
for the examination of at least two more doses
– Burn-in period assured a minimum of n=36 subjects per treatment arm
– Study went to full enrollment.• Consistent with simulations for U-shaped dose-response
scenarios
• Other dose-response scenarios would have allowed the same richness of exploration with a smaller sample size
Adaptive Design in Phase 2:Potential Treatment for Insomnia Disorder
Margaret Moline, PhD
Senior Director
International Project Team Lead, E2006
Contains Eisai’s Proprietary Information – Not for Distribution
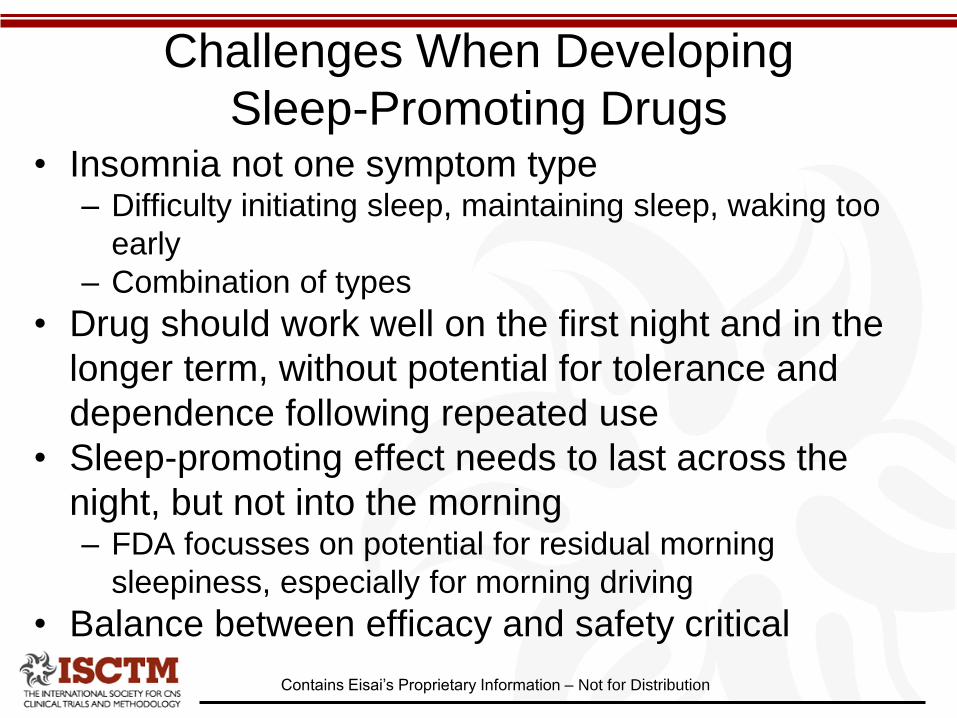
Challenges When Developing
Sleep-Promoting Drugs• Insomnia not one symptom type
– Difficulty initiating sleep, maintaining sleep, waking too
early
– Combination of types
• Drug should work well on the first night and in the
longer term, without potential for tolerance and
dependence following repeated use
• Sleep-promoting effect needs to last across the
night, but not into the morning– FDA focusses on potential for residual morning
sleepiness, especially for morning driving
• Balance between efficacy and safety critical
Contains Eisai’s Proprietary Information – Not for Distribution
Phase 2 Study Planned after POC
Achieved in SAD Study
• Program needed to accelerate development– Second in class
– Preserve patent life
• Sleep studies amenable to adaptive design approach– Fast recruitment
– Objective, rapidly reporting endpoints permitting IAs to occur
frequently
• Advantages over traditional crossover for Phase 2 sleep
compounds– More subjects enrolled onto doses likely to be used in future
studies
– More doses studied concurrently
– Can stop early for success or futility, hence saving time, subjects
exposed and resources
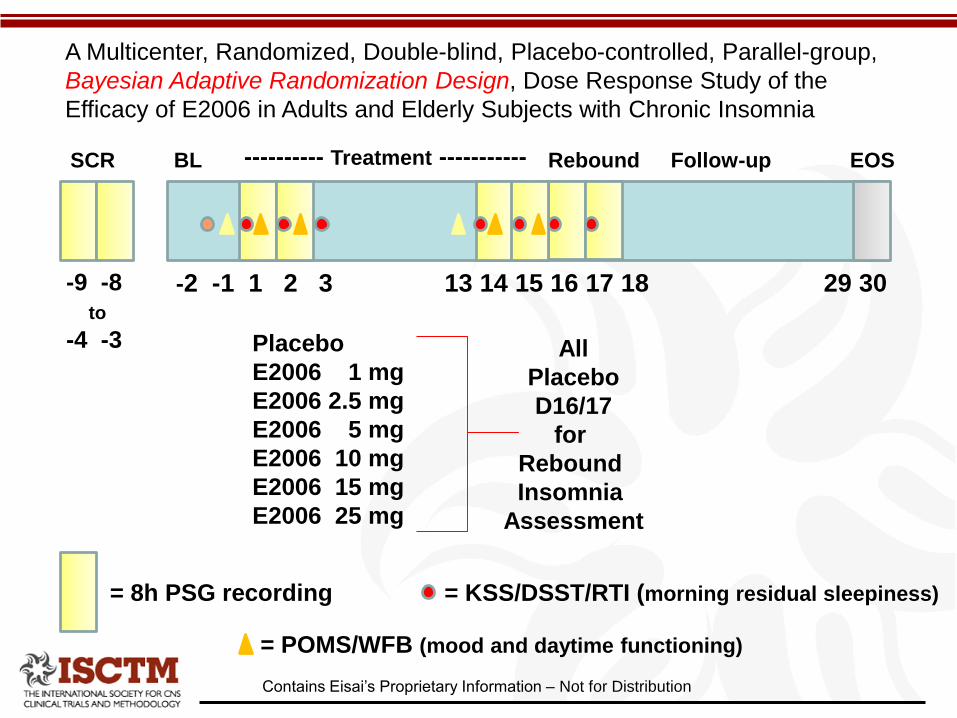
BLSCR ---------- Treatment ----------- Rebound Follow-up EOS
-2 -1 1 2 3 13 14 15 16 17 18 29 30-9 -8
to
-4 -3 Placebo
E2006 1 mg
E2006 2.5 mg
E2006 5 mg
E2006 10 mg
E2006 15 mg
E2006 25 mg
All
Placebo
D16/17
for
Rebound
Insomnia
Assessment
= 8h PSG recording = KSS/DSST/RTI (morning residual sleepiness)
= POMS/WFB (mood and daytime functioning)
A Multicenter, Randomized, Double-blind, Placebo-controlled, Parallel-group,
Bayesian Adaptive Randomization Design, Dose Response Study of the
Efficacy of E2006 in Adults and Elderly Subjects with Chronic Insomnia
Contains Eisai’s Proprietary Information – Not for Distribution
Contains Eisai’s Proprietary Information – Not for Distribution
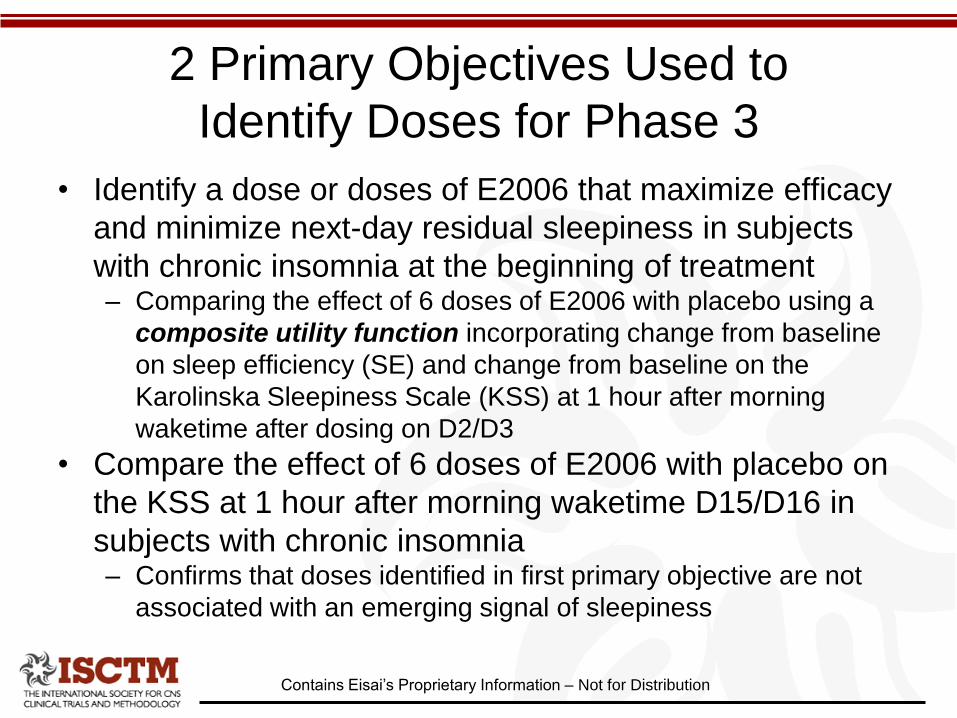
2 Primary Objectives Used to
Identify Doses for Phase 3
• Identify a dose or doses of E2006 that maximize efficacy
and minimize next-day residual sleepiness in subjects
with chronic insomnia at the beginning of treatment– Comparing the effect of 6 doses of E2006 with placebo using a
composite utility function incorporating change from baseline
on sleep efficiency (SE) and change from baseline on the
Karolinska Sleepiness Scale (KSS) at 1 hour after morning
waketime after dosing on D2/D3
• Compare the effect of 6 doses of E2006 with placebo on
the KSS at 1 hour after morning waketime D15/D16 in
subjects with chronic insomnia– Confirms that doses identified in first primary objective are not
associated with an emerging signal of sleepiness
Contains Eisai’s Proprietary Information – Not for Distribution
Development of the Primary Objectives• First Primary Objective
– SE used as it combines LPS and WASO endpoints
– D1/D2 used to show an immediate effect on efficacy
– KSS evaluates subjective sleepiness, so clinically very important to
assess residual morning sleepiness
– Utility function developed to combine the above• Defined minimally clinically significant CfB for SE (D1/D2) and KSS (D2/D3)
– CfB compared to placebo was considered to be 6% for SE and 4 units for KSS
– Simulations produced to review possible different dose response scenarios
• Second Primary Objective – KSS on D15/D16 determined if residual sleepiness present after dosing
for 2 weeks
– KSS for D15/D16 acceptable if the lower boundary of a 90% confidence
interval was less than 4 units (mean difference of CfB in KSS 1 hour
after waketime of dose relative to placebo)
– Study could not stop for early success if the above definition of
acceptable KSS was not met
Contains Eisai’s Proprietary Information – Not for Distribution
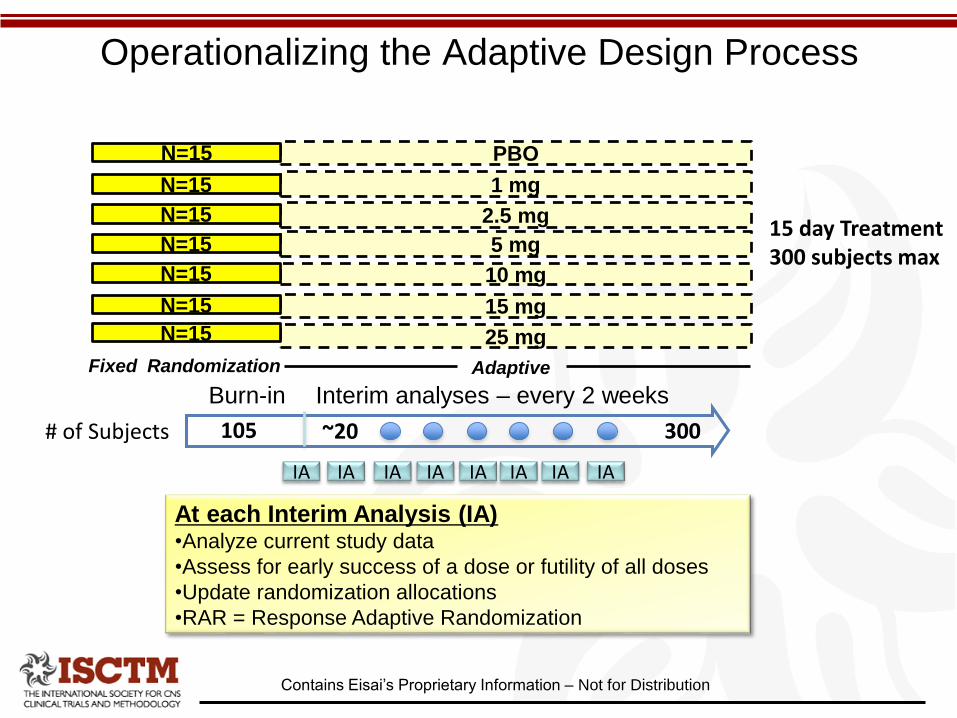
Operationalizing the Adaptive Design Process
IA IA IA IA
~20 300
At each Interim Analysis (IA)•Analyze current study data
•Assess for early success of a dose or futility of all doses
•Update randomization allocations
•RAR = Response Adaptive Randomization
105
IAIAIAIA
# of Subjects
Adaptive
PBO
1 mg
2.5 mg
5 mg
10 mg
15 mg
N=15
N=15
N=15
Fixed Randomization
N=15
N=15
N=15
15 day Treatment300 subjects max
Interim analyses – every 2 weeks
25 mgN=15
Burn-in

Score PSG
PSG1-PSG2
D1-D2 PSG
D2-D3 KSS
Enter KSS
Extract KSS
Run algo-
rithm
Review report
and decide to
continue or stop
Site (with CRO)
Central Scoring
External Stats
Independent
Monitoring Comm
IVR
transfer SE to Eisaitransfer to central scorer
in a.m. following recording
provide SE and KSS
to Biostats
Calculate
CFB of
mean SE and
mean KSS
Run
algorithm
Eisai DM
Eisai Stats
Enter updated rando
probabilities in IRT OR STOP
provide rando info to
External Stats
provide data to
External Stats
provide report to IMC
Confirm decision
with Eisai then
communicate
decision to IVR
Eisai Mgmt
Eisai Management
Contains Eisai’s Proprietary Information – Not for Distribution
Contains Eisai’s Proprietary Information – Not for Distribution
Bayesian Adaptive Design
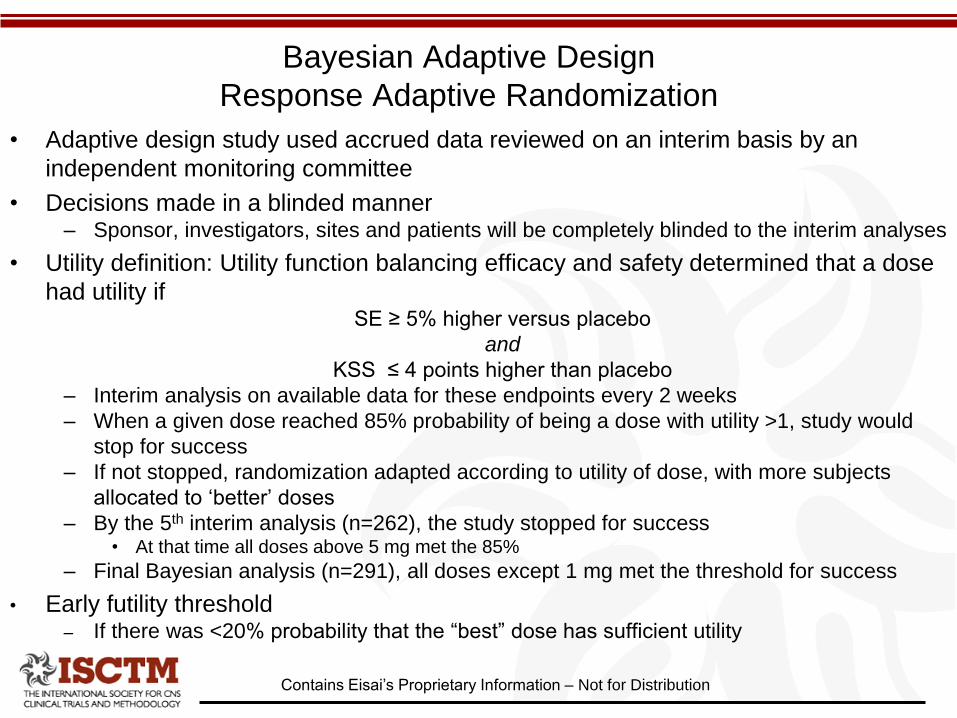
Response Adaptive Randomization
• Adaptive design study used accrued data reviewed on an interim basis by an
independent monitoring committee
• Decisions made in a blinded manner– Sponsor, investigators, sites and patients will be completely blinded to the interim analyses
• Utility definition: Utility function balancing efficacy and safety determined that a dose
had utility ifSE ≥ 5% higher versus placebo
and
KSS ≤ 4 points higher than placebo
– Interim analysis on available data for these endpoints every 2 weeks
– When a given dose reached 85% probability of being a dose with utility >1, study would
stop for success
– If not stopped, randomization adapted according to utility of dose, with more subjects
allocated to ‘better’ doses
– By the 5th interim analysis (n=262), the study stopped for success• At that time all doses above 5 mg met the 85%
– Final Bayesian analysis (n=291), all doses except 1 mg met the threshold for success
• Early futility threshold– If there was <20% probability that the “best” dose has sufficient utility
Contains Eisai’s Proprietary Information – Not for Distribution
Probability of Success at Interim Analyses
0
0.1
0.2
0.3
0.4
0.5
0.6
0.7
0.8
0.9
1
1 2.5 5 10 15 25
Pr(
uti
lity
)>
1
Dose (mg)
interim1 interim2 interim3 interim4 interim5
Success
threshold
N = 122
N = 167
N = 216
N = 240
N = 262
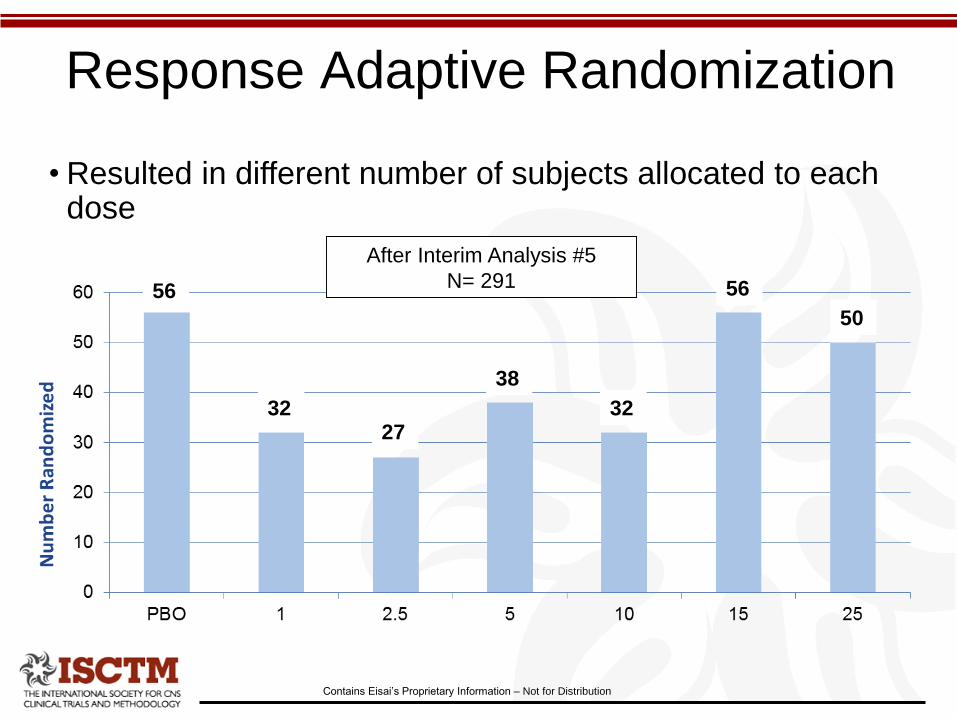
After Interim Analysis #5
N= 29156
3227
38
32
56
50
• Resulted in different number of subjects allocated to each dose
Contains Eisai’s Proprietary Information – Not for Distribution
Response Adaptive Randomization
Contains Eisai’s Proprietary Information – Not for Distribution
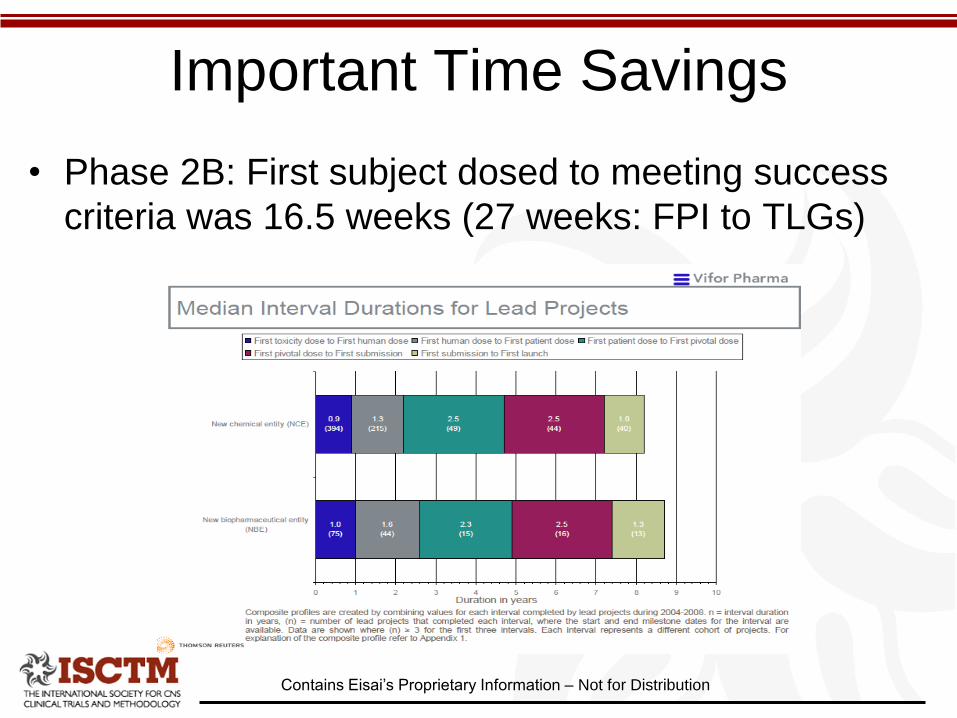
Important Time Savings
• Phase 2B: First subject dosed to meeting success
criteria was 16.5 weeks (27 weeks: FPI to TLGs)
Contains Eisai’s Proprietary Information – Not for Distribution
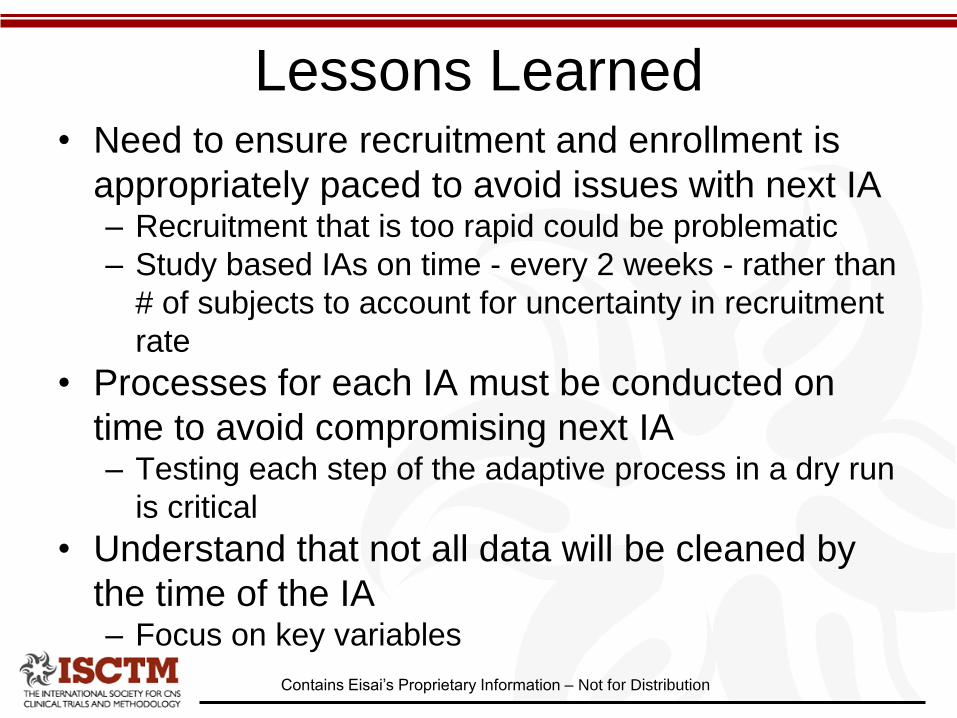
Lessons Learned• Need to ensure recruitment and enrollment is
appropriately paced to avoid issues with next IA– Recruitment that is too rapid could be problematic
– Study based IAs on time - every 2 weeks - rather than
# of subjects to account for uncertainty in recruitment
rate
• Processes for each IA must be conducted on
time to avoid compromising next IA – Testing each step of the adaptive process in a dry run
is critical
• Understand that not all data will be cleaned by
the time of the IA– Focus on key variables
Contains Eisai’s Proprietary Information – Not for Distribution
Conclusions
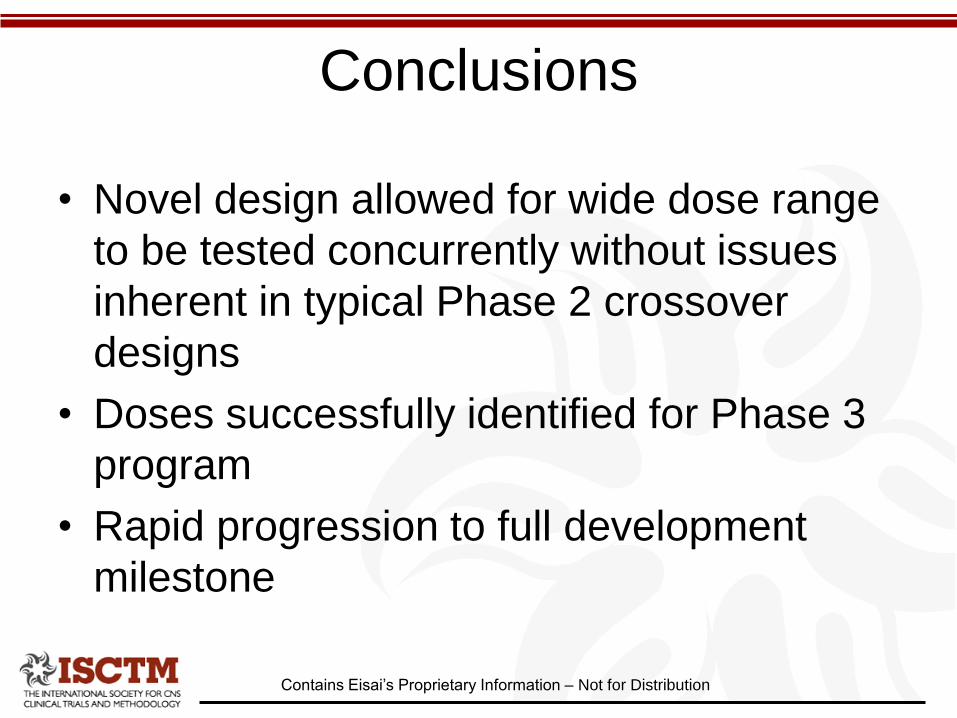
• Novel design allowed for wide dose range
to be tested concurrently without issues
inherent in typical Phase 2 crossover
designs
• Doses successfully identified for Phase 3
program
• Rapid progression to full development
milestone

When is Adaptive Design
useful in NeuroscienceWhat has worked well, what has not worked well –
where and when it can be optimally used
Tom Parke, Tessella Ltd
Overview
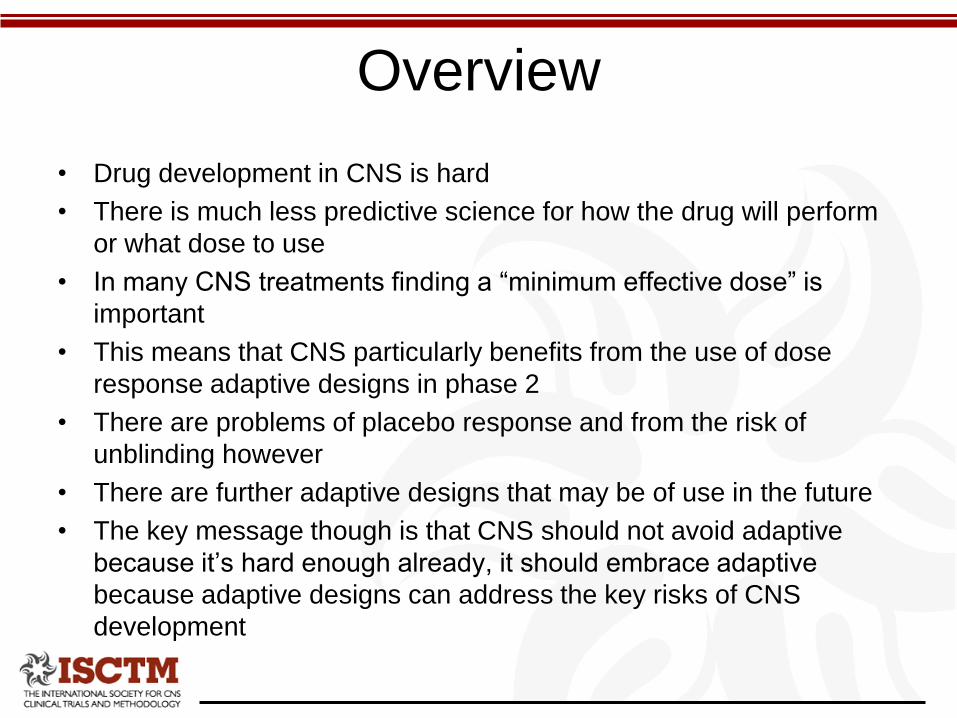
• Drug development in CNS is hard
• There is much less predictive science for how the drug will perform
or what dose to use
• In many CNS treatments finding a “minimum effective dose” is
important
• This means that CNS particularly benefits from the use of dose
response adaptive designs in phase 2
• There are problems of placebo response and from the risk of
unblinding however
• There are further adaptive designs that may be of use in the future
• The key message though is that CNS should not avoid adaptive
because it’s hard enough already, it should embrace adaptive
because adaptive designs can address the key risks of CNS
development
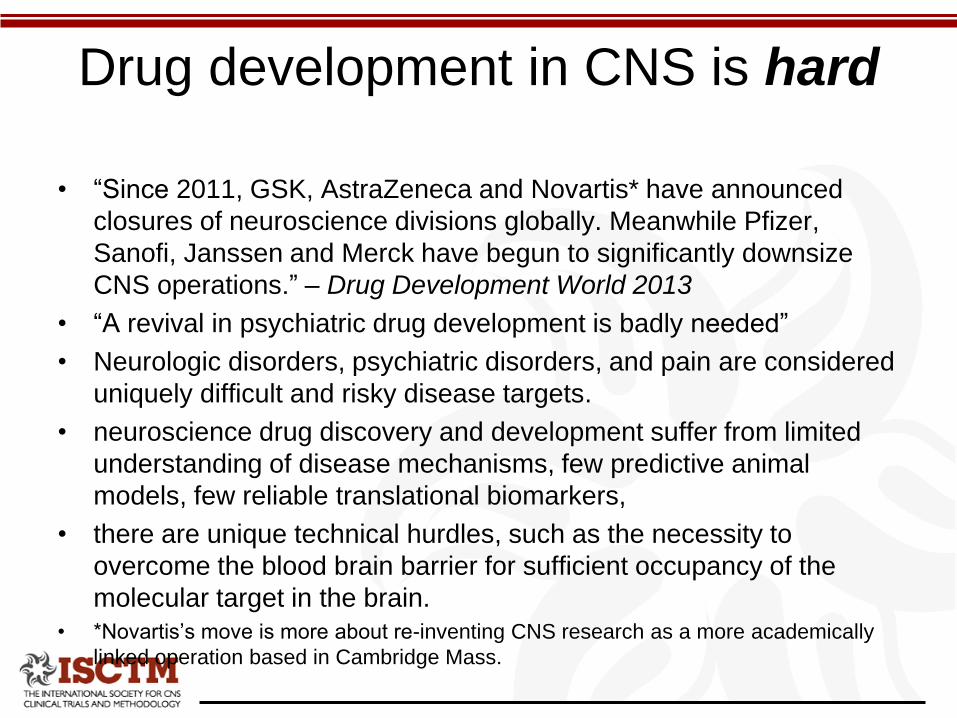
Drug development in CNS is hard
• “Since 2011, GSK, AstraZeneca and Novartis* have announced
closures of neuroscience divisions globally. Meanwhile Pfizer,
Sanofi, Janssen and Merck have begun to significantly downsize
CNS operations.” – Drug Development World 2013
• “A revival in psychiatric drug development is badly needed”
• Neurologic disorders, psychiatric disorders, and pain are considered
uniquely difficult and risky disease targets.
• neuroscience drug discovery and development suffer from limited
understanding of disease mechanisms, few predictive animal
models, few reliable translational biomarkers,
• there are unique technical hurdles, such as the necessity to
overcome the blood brain barrier for sufficient occupancy of the
molecular target in the brain.
• *Novartis’s move is more about re-inventing CNS research as a more academically
linked operation based in Cambridge Mass.
What is particular about CNS
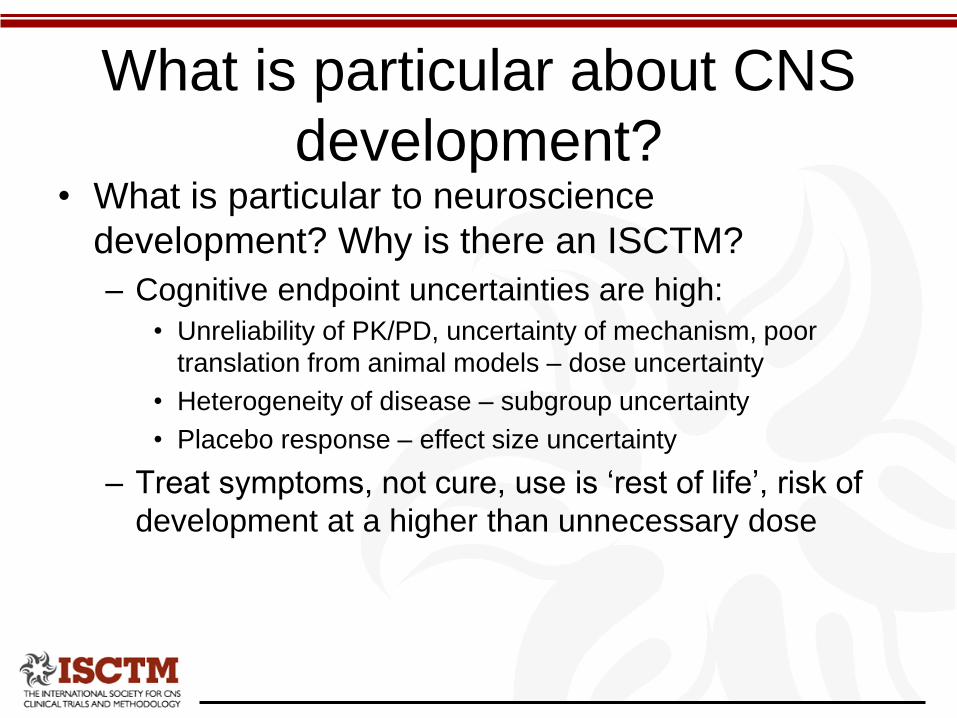
development?• What is particular to neuroscience
development? Why is there an ISCTM?
– Cognitive endpoint uncertainties are high:
• Unreliability of PK/PD, uncertainty of mechanism, poor
translation from animal models – dose uncertainty
• Heterogeneity of disease – subgroup uncertainty
• Placebo response – effect size uncertainty
– Treat symptoms, not cure, use is ‘rest of life’, risk of
development at a higher than unnecessary dose

As a result
• Going into phase 2 there is high uncertainty
concerning dose & a need to avoid selecting too
high a dose.
• Possibility of type-3 error. Correctly determine
success, but draw the wrong conclusion: wrong
dose or treatment population
• But many accepted clinical endpoints are
relatively short – permitting adaptive designs
– Migraine (2 hrs), Schizophrenia (4 weeks), Pain (6
weeks), Depression (8 weeks), Stroke (13 weeks)
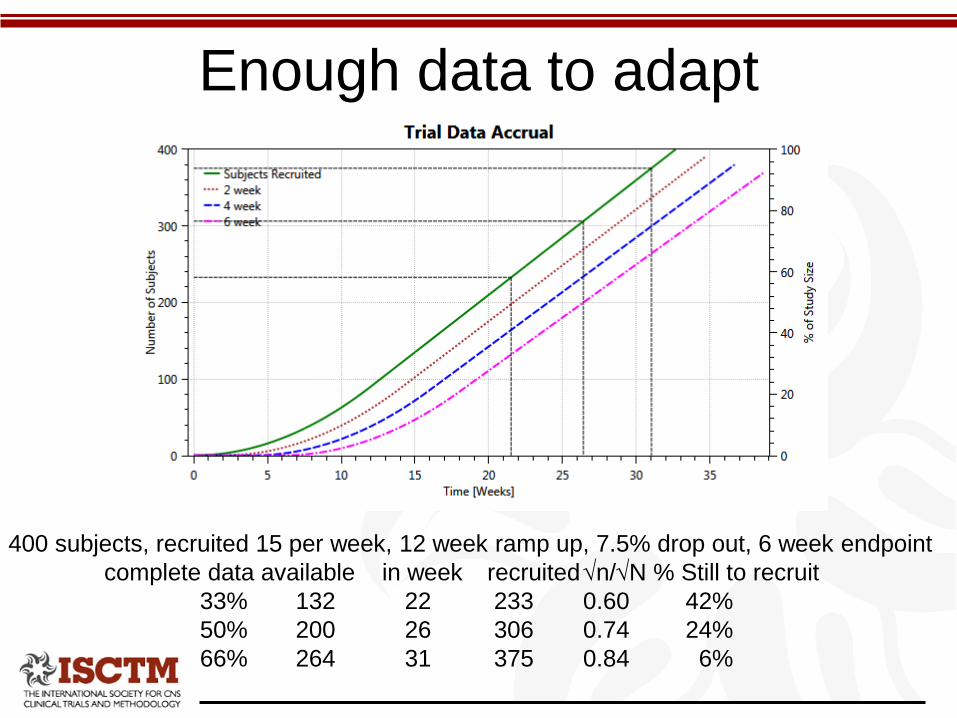
Enough data to adapt
400 subjects, recruited 15 per week, 12 week ramp up, 7.5% drop out, 6 week endpoint
complete data available in week recruitedn/N % Still to recruit
33% 132 22 233 0.60 42%
50% 200 26 306 0.74 24%
66% 264 31 375 0.84 6%
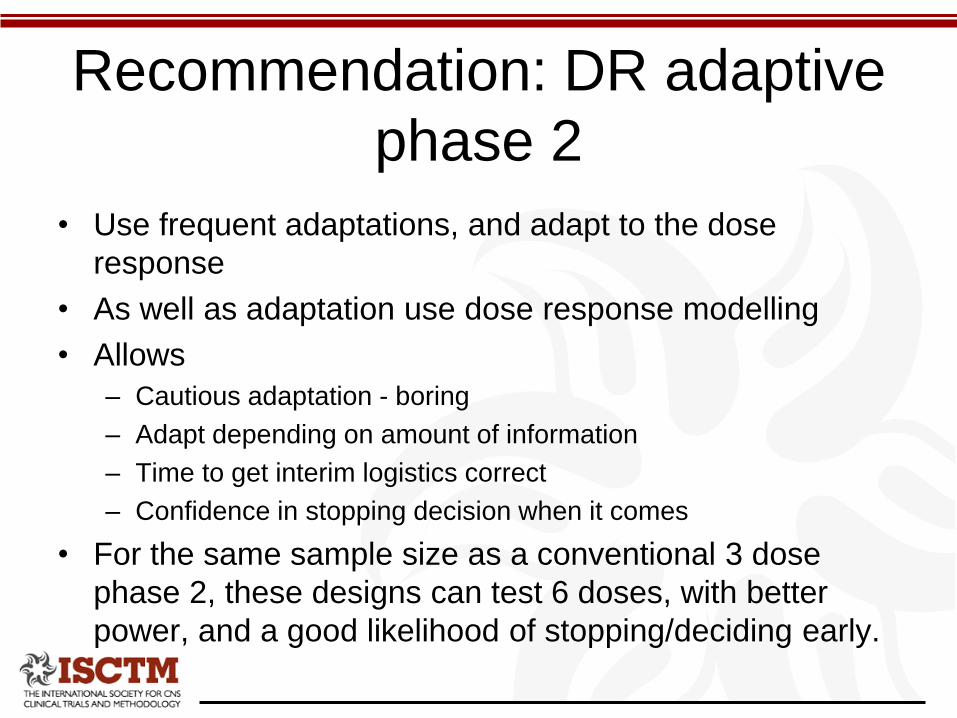
Recommendation: DR adaptive
phase 2
• Use frequent adaptations, and adapt to the dose
response
• As well as adaptation use dose response modelling
• Allows
– Cautious adaptation - boring
– Adapt depending on amount of information
– Time to get interim logistics correct
– Confidence in stopping decision when it comes
• For the same sample size as a conventional 3 dose
phase 2, these designs can test 6 doses, with better
power, and a good likelihood of stopping/deciding early.

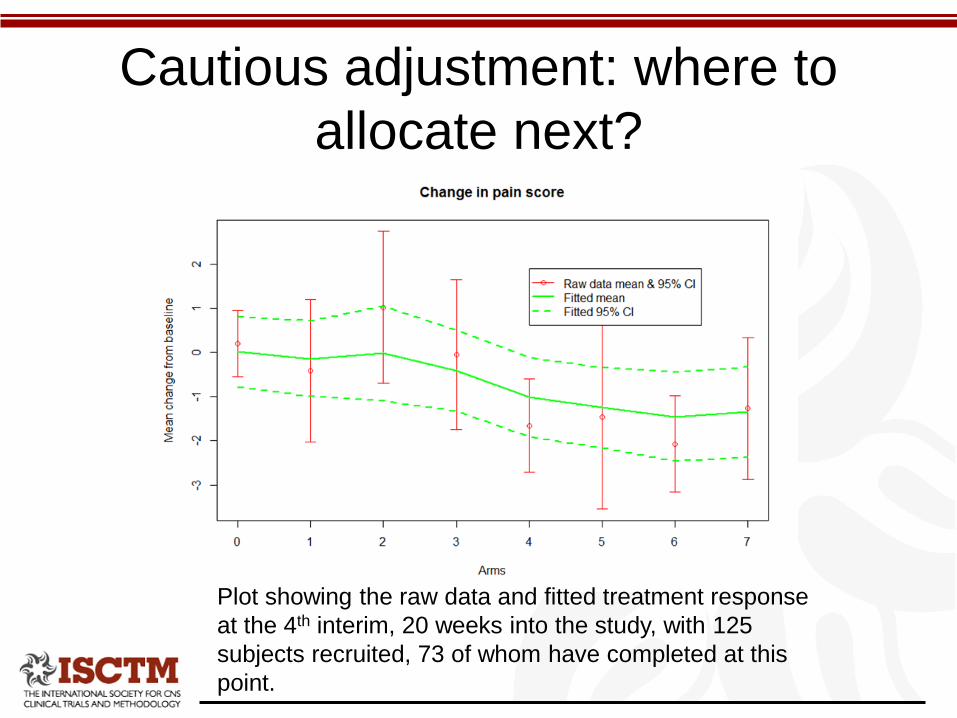
Cautious adjustment: where to
allocate next?
Plot showing the raw data and fitted treatment response
at the 4th interim, 20 weeks into the study, with 125
subjects recruited, 73 of whom have completed at this
point.
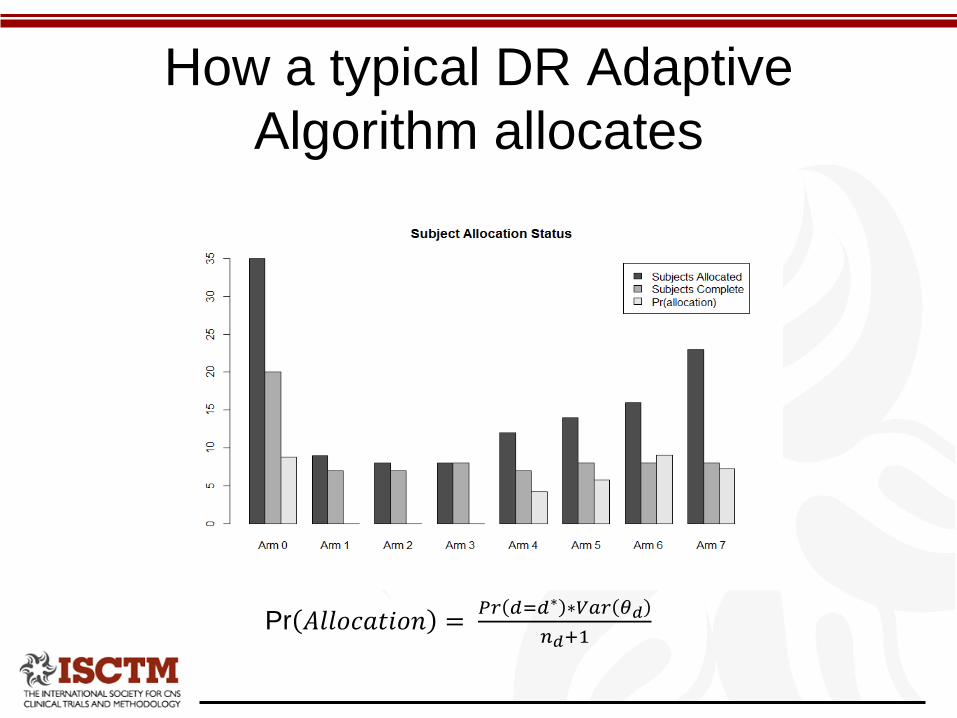
How a typical DR Adaptive
Algorithm allocates
Pr 𝐴𝑙𝑙𝑜𝑐𝑎𝑡𝑖𝑜𝑛 =𝑃𝑟 𝑑=𝑑∗ ∗𝑉𝑎𝑟 𝜃𝑑
𝑛𝑑+1
Cautious adjustment: where to
allocate next?
Plot showing the raw data and fitted treatment response
at the 4th interim, 20 weeks into the study, with 125
subjects recruited, 73 of whom have completed at this
point.
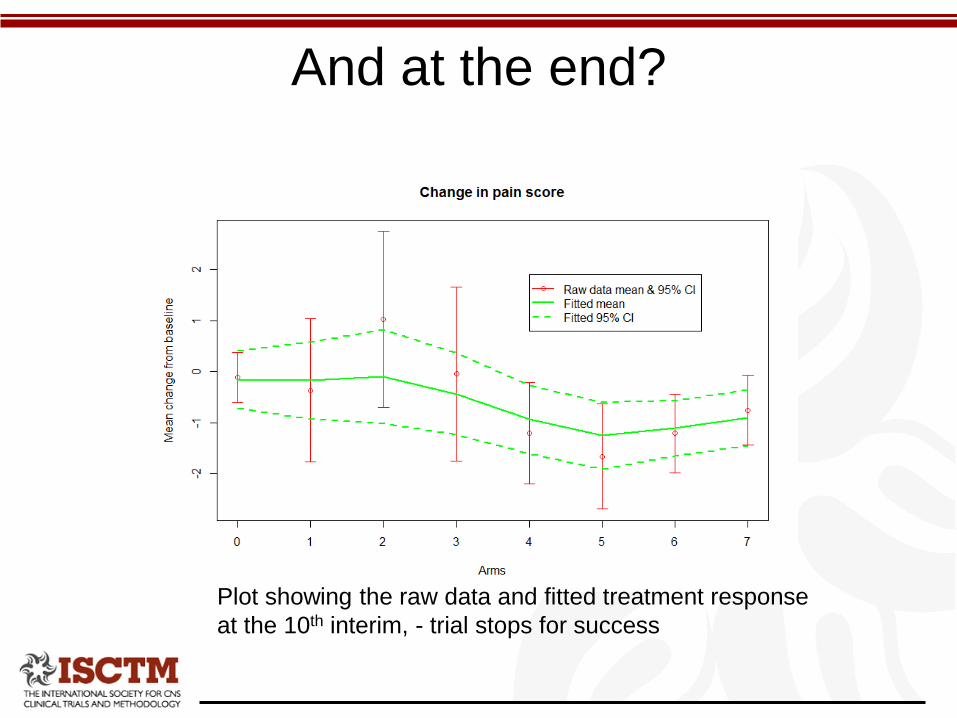
And at the end?
Plot showing the raw data and fitted treatment response
at the 10th interim, - trial stops for success

Stopping for success criteria
• At least 30 subjects on the dose selected
as having the maximum response
• Selected dose to have a probability that it
is the dose with the maximum response of
> 0.5
• Probability of that its response is better
than placebo > 0.985
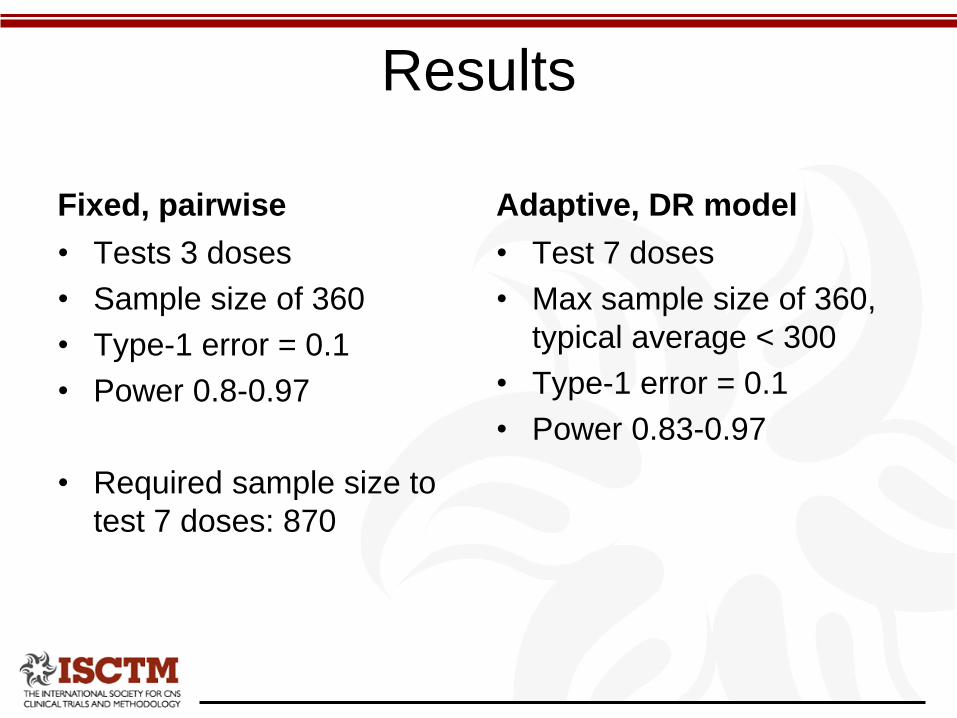
Results
Fixed, pairwise
• Tests 3 doses
• Sample size of 360
• Type-1 error = 0.1
• Power 0.8-0.97
• Required sample size to
test 7 doses: 870
Adaptive, DR model
• Test 7 doses
• Max sample size of 360,
typical average < 300
• Type-1 error = 0.1
• Power 0.83-0.97

Problems
• Using raters or patient reported outcomes,
maintaining blind is essential - ISC
• Take steps to ensure homogeneity of subjects
over time
– Stress to investigators
– Use RBM to check enrolment consistent over time
• Excessive Pbo repsonse:
– adjust ppn on Pbo
– Stop trial early
– Borrow Pbo data form past studies
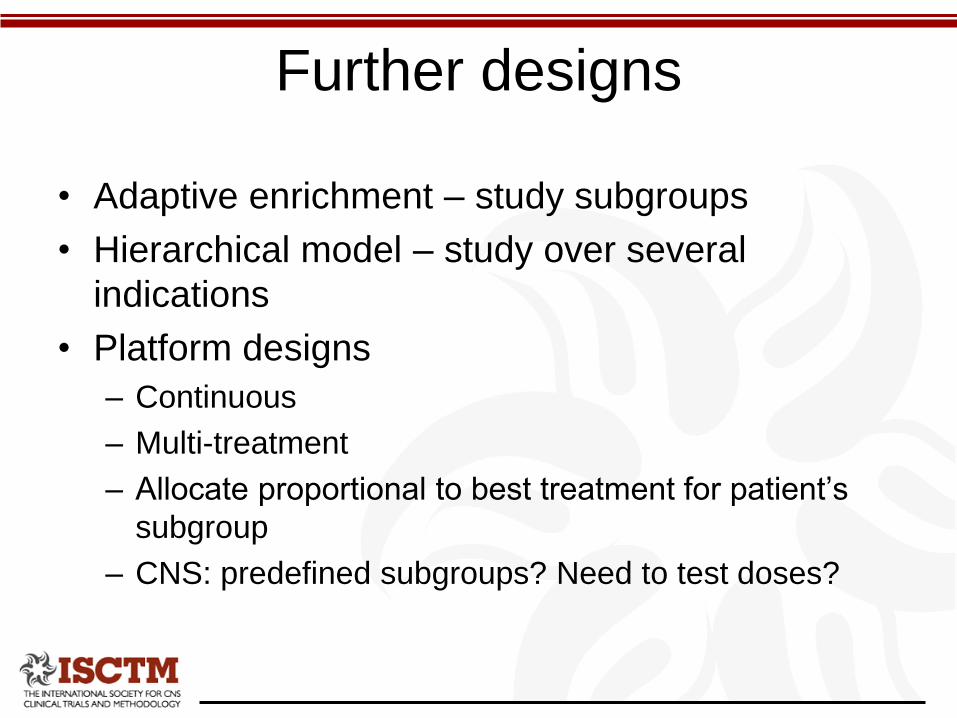
Further designs
• Adaptive enrichment – study subgroups
• Hierarchical model – study over several
indications
• Platform designs
– Continuous
– Multi-treatment
– Allocate proportional to best treatment for patient’s
subgroup
– CNS: predefined subgroups? Need to test doses?
Conclusion
• CNS development has many difficulties
• In particular less forecast of dose range,
need to dose “right”
• Dose response adaptive designs give us
the best chance to do just that.