adaptive light modulation for improved resolution and
TRANSCRIPT

IEEE TRANSACTIONS ON ULTRASONICS, FERROELECTRICS, AND FREQUENCY CONTROL, VOL. 63, NO. 1, JANUARY 2016 83
Adaptive Light Modulation for Improved Resolutionand Efficiency in All-Optical Pulse-Echo Ultrasound
Erwin J. Alles, Richard J. Colchester, and Adrien E. Desjardins
Abstract—In biomedical all-optical pulse-echo ultrasoundsystems, ultrasound is generated with the photoacoustic effectby illuminating an optically absorbing structure with a tempo-rally modulated light source. Nanosecond range laser pulses aretypically used, which can yield bandwidths exceeding 100 MHz.However, acoustical attenuation within tissue or nonuniformitiesin the detector or source power spectra result in energy loss atthe affected frequencies and in a reduced overall system efficiency.In this work, a laser diode is used to generate linear and nonlin-ear chirp optical modulations that are extended to microsecondtime scales, with bandwidths constrained to the system sensitivity.Compared to those obtained using a 2-ns pulsed laser, pulse-echoimages of a phantom obtained using linear chirp excitation exhibitsimilar axial resolution (99 versus 92 µm, respectively) and signal-to-noise ratios (SNRs) (10.3 versus 9.6 dB). In addition, the axialpoint spread function (PSF) exhibits lower sidelobe levels in thecase of chirp modulation. Using nonlinear (time-stretched) chirpexcitations, where the nonlinearity is computed from measure-ments of the spectral sensitivity of the system, the power spectrumof the imaging system was flattened and its bandwidth broadened.Consequently, the PSF has a narrower axial extent and still lowersidelobe levels. Pulse-echo images acquired with time-stretchedchirps as optical modulation have higher axial resolution (64 µm)than those obtained with linear chirps, at the expense of a lowerSNR (6.8 dB). Using a linear or time-stretched chirp, the conver-sion efficiency from optical power to acoustical pressure improvedby a factor of 70 or 61, respectively, compared to that obtainedwith pulsed excitation.
Index Terms—All-optical ultrasound, chirps, spectral flattening,ultrasonic imaging.
I. INTRODUCTION
W ITH all-optical pulse-echo ultrasound, sound is gen-erated optically by irradiating an optically absorbing
coating or structure. The absorbed optical energy gives rise toa local pressure increase, which propagates through the sur-rounding medium as an acoustic wave [1]. Reflections fromwithin the medium are received with optical ultrasound sen-sors, and the corresponding signals are processed to generateimages. All-optical pulse-echo ultrasound imaging [2]–[11] isvery promising for minimally invasive clinical procedures; highsensitivity can be achieved with MRI-compatible sources andreceivers that are fabricated at the distal end of optical fibers.In addition, sufficiently high pressure levels can be achievedto allow for therapeutic high-intensity focussed ultrasound[12], [13].
Manuscript received January 9, 2015; accepted October 25, 2015. Date ofpublication November 3, 2015; date of current version December 29, 2015.This work was supported by the European Research Council through EuropeanStarting Grant 310970 MOPHIM.
The authors are with the Department of Medical Physics and BiomedicalEngineering, University College London, London WC1E 6BT, U.K.
Digital Object Identifier 10.1109/TUFFC.2015.2497465
Conventionally, nanosecond-scale light pulses are used toobtain high acoustic pressures and bandwidths in excess of100 MHz [4], [14]. However, the light sources tend to be bulkyand expensive, and in addition they typically offer no controlover the pulse shape. Consequently, the acoustic power spec-trum tends to be fixed, whereas different applications requiredifferent resolutions and penetration depths. Especially at largepenetration depths, high frequencies are attenuated within thetissue, resulting in a narrower received bandwidth. Moreover,the optical absorbers typically employed in fiber-optic ultra-sound sources can exhibit strong acoustical attenuation, andhence much narrower transmit bandwidths are often observed[2], [15], [16]. As a result, a significant portion of the opti-cal energy is contained outside the bandwidth of the generatedacoustical signal, and hence effectively lost.
To maximize the conversion efficiency from optical to acous-tical energy, the optical energy should be constrained both to thebandwidth supported by the optically absorbing structure, andto the bandwidth required by the application. This bandwidthlimitation could be achieved by employing modulated CWlasers to perform frequency domain imaging [17], [18]. Whilein this case spectral matching is trivial, this method requiresmultiple measurements at different modulation frequencies toreconstruct a single time-domain image.
In this study, a low-cost, portable laser diode was used inconjunction with a high-bandwidth driver (combined dimen-sions: 65 mm × 85 mm × 20 mm, total cost: £3500 GBP),which enabled variation of the shape of the power spectrumof the optical modulation. As the peak power of these laserdiodes is typically five orders of magnitude lower than that oftypically employed pulsed light sources [16], coded excitationwas used in conjunction with pulse compression to recover theB-mode image signal-to-noise ratio (SNR) [19, Ch. 3]. Here,linear chirps with flat bandwidths [20] were used, of which thepulse energy is determined by the pulse duration. Linear chirpshave previously been used as optical modulation to improvethe SNR of photoacoustic images [21]–[23], but to our knowl-edge they have not been applied to improve the efficiency ofall-optical pulse-echo ultrasound imaging systems.
The power spectrum of the optical modulation can be mod-ified to compensate for nonidealities in the power spectrumcaused by the transduction technology, such as nonuniformdetector sensitivity or nonuniform acoustic power. While thistype of spectral shaping can be performed using amplitudemodulation, it would significantly decrease the overall acous-tical power due to the low-maximum optical intensity of alaser diode. Instead, spectral shaping is achieved by varyingthe rate of frequency change with time, thereby effectively
0885-3010 © 2015 IEEE. Personal use is permitted, but republication/redistribution requires IEEE permission.See http://www.ieee.org/publications_standards/publications/rights/index.html for more information.

84 IEEE TRANSACTIONS ON ULTRASONICS, FERROELECTRICS, AND FREQUENCY CONTROL, VOL. 63, NO. 1, JANUARY 2016
time-stretching a linear chirp. One class of time-stretchedchirps was shown to improve the image quality in photoacous-tic imaging [22], but in that work the frequency was restrictedto vary with time in a polynomial fashion. In this study, thatrestriction is lifted and the rate of frequency change is com-puted on a per-frequency basis to allow for greater flexibility inspectral shaping.
In this work, all-optical pulse-echo imaging is demonstratedusing a modulated laser diode and an all-optical source-receiver transducer pair designed for biomedical interventionaluse. While both the source and receiver are known to havenonuniform power spectra [16], [24], they provide an effec-tive demonstration of how an optical-to-acoustic transductionefficiency gain can be achieved by limiting the bandwidthof the optical modulation, and how the power spectrum uni-formity of the received acoustical signal can be improvedthrough spectral shaping. These demonstrations are achievedthrough measurements of the axial point spread functions(PSFs) using pulsed, linear chirp, and time-stretched chirp mod-ulations. In addition, B-mode pulse-echo ultrasound imagesof phantoms are presented, which demonstrate the gain inspatial resolution achieved by applying a time-stretched chirpmodulation.
II. METHODS
A. Experimental Setup
A step-index optical fiber with a core/cladding diameter of200/220 µm was used as ultrasound source. This fiber was dip-coated using the process described in [16], resulting in an opti-cally absorbing coating (transmittance < 5%) with a maximumthickness of approximately 30 µm, consisting of a compositeof functionalized carbon nanotubes (CNTs) and polydimethyl-siloxane (PDMS). This coating was illuminated using either apulsed laser (SPOT-10-500-1064, Elforlight, U.K.) or a modu-lated laser diode (LU1064M450, Lumics, Germany) driven bya high-frequency driver (BFS-VRM-03-HP, Picolas, Germany).Both lasers operated at a wavelength of 1064 nm. The excita-tion voltage provided to the laser driver was generated by anarbitrary waveform generator (33611A, Agilent, CA, USA) andsampled at 200 MSa/s. One percent of the optical power wastapped using a 99 : 1 fiber optic coupler (FC1064-99B-APC,Thorlabs, Germany) and its modulated intensity was moni-tored with a fast photodiode (DET10A, Thorlabs, Germany);the remaining 99% was used to generate the ultrasound. Asthe light generated by both sources was coupled into the samemultimode source fiber, the acoustic source geometry was inde-pendent of the light source and hence so was the directivitypattern of the acoustic source.
Acoustical detection was performed using either a customplanar Fabry–Pérot etalon (10-µm spacer thickness) featuringa uniform sensitivity [25], or a custom fiber-optic hydrophonewith a plano-convex Fabry–Pérot cavity at the distal end,similar in construction to that presented in [26]. While thefiber-optic hydrophone is known to have a nonuniform fre-quency response [24], it was selected for its high sensi-tivity and small lateral dimensions (<250 µm) suitable for
Fig. 1. Schematic of the experimental setup used in this work. Ultrasound isgenerated by illuminating an optically absorbing coating using either a pulsedlaser or a modulated laser diode. One percent of the emitted light is tapped fromthe output to be recorded by a photodiode. The transmitted ultrasound scattersoff the image object and is recorded using an optical hydrophone. A desktop PCwas used for data acquisition and synchronization and to program the arbitrarywaveform generator (AWG).
biomedical interventional application. Both sensors were inter-rogated by measuring the sensor’s reflectivity using a tunablelaser (TUNICS T100S-HP, Yenista, France) and a customphotodiode. The wavelength of the interrogation laser was con-tinuously adjusted to correspond with the peak derivative of thehydrophone’s cavity transfer function [25].
To measure the acoustic power spectrum of the opticallyabsorbing coating, acoustic transmission measurements wereperformed at a distance of 2 mm with the coated source fibercentred and at normal incidence to the planar sensor. Pulse-echo measurements were acquired with the coated source fiberand optical fiber hydrophone positioned adjacent to each otherand facing the same direction. The signals from the intensitymonitoring and hydrophone interrogation photodiodes wererecorded at 100 MSa/s using a digitiser card (NI PCI-5142,National Instruments, TX, USA). All equipment was controlledby a desktop PC running MATLAB R2012b and LabVIEW2012 SP1. The setup is shown schematically in Fig. 1.
B. Light Modulation
The light generated by the laser diode was modulated bya chirp of which the frequency increased monotonically withtime. Two types of chirp modulations were considered: a lin-ear chirp and a time-stretched version of the linear chirp. Bothchirp signals c(t) had the general form
c(t) = A sin
(φ0 + 2π
∫ t
0
f(τ)dτ
)(1)
where f(t) is the time-dependent frequency, the integrationruns over time τ , φ0 is a constant phase offset, and A is theamplitude of the chirp signal. In the case of a linear chirp, therate of frequency change with time f(t) is constant, i.e.,
f(t) =fmax − fmin
Δ= constant (2)
⇒ f(t) = fmin +fmax − fmin
Δt (3)
where fmin, fmax, and Δ are the minimum frequency, maximumfrequency, and chirp duration, respectively, and the integration
ALLES et al.: ADAPTIVE LIGHT MODULATION FOR IMPROVED RESOLUTION AND EFFICIENCY 85
constant is determined by requiring f(0) = fmin. Consequently,the analytic expression for a linear chirp is given by
c(t) = A sin
(φ0 + 2π
∫ t
0
∫ τ
0
f(θ)dθdτ
)(4)
= A sin
(φ0 + 2π
[fmint+
fmax − fmin
2Δt2])
.
The idealized case, in which the power spectrum |P (ω)|2 ofthe acoustical response p(t) is uniform across its bandwidth,i.e.,
|P (ω)|2 = |F{p(t)}|2 = constant, fmin ≤∣∣∣ ω2π
∣∣∣ ≤ fmax (5)
where F{.} indicates the Fourier transform and ω = 2πf isthe angular frequency, yields the smallest possible axial PSFwithin the bandwidth constraints. However, in reality, there arenonuniformities in the power spectrum that decrease the spatialresolution of the imaging system. To correct for these nonuni-formities, a time-stretched chirp signal can be used, of whichthe rate of frequency change f(t) is adjusted so that more timeis spent at frequencies corresponding to low acoustic power. Tocompensate for the nonuniformities in the power spectrum, therate of frequency change is set to
f
(ω = 2π
[fmin +
fmax − fmin
Δt
])∝ |P (ω)|2 (6)
where use was made of (3) to convert frequency into time.On a discrete time grid, (6) yields f(t) on a nonuniform timeaxis, which was converted to a uniform axis by means ofnearest-neighbour interpolation and then scaled to yield thecorrect duration Δ. Finally, the nonlinear, or time-stretched,chirp signal was obtained using (4) where the integrations wereevaluated numerically.
For a fixed temporal step size (i.e., for a fixed sample rate),the fidelity with which nonuniformities in the power spec-trum can be compensated increases with the chirp duration, asthe chirp duration is inversely related to the rate of frequencychange f(t). Consequently, for a longer chirp duration, the rateof frequency change can be sampled more densely and hencethe numerical integrations in (4) can be evaluated more accu-rately. To demonstrate this, results for linear and time-stretchedchirp lengths of both 4 and 40 µs are provided.
However, in a pulse-echo imaging context, a longer pulseduration could result in motion artifacts and reduced imagequality. Additionally, longer pulse durations result in longerA-scan acquisition times and consequently lower image framerates. The linear chirps used ranged between 0 and 50 MHz,corresponding to the full bandwidth of the digitiser card, andthe acoustical response to this optical modulation was usedas input p(t) to compute the time-stretched chirp. The time-stretched chirp was computed for frequencies between 3 and35 MHz, corresponding to the bandwidth where the receivedultrasound signal was above the noise level.
The chirped input signals were provided to the laser diodedriver by the arbitrary wave generator in the form of a dis-cretized voltage time series. The analogue voltage values werescaled and offset so that they ranged between the extremum
values of 0.09 and 0.7 V, corresponding to zero and maximumlight intensity, respectively. For all three optical modulations,the repetition rate of the chirps was chosen such that the time-averaged optical power of excitation light delivered to theabsorbing coating was O = 5.00 mW. At this optical powerlevel, reproducible acoustical responses were generated with-out causing damage to the coating. For the pulsed laser, thisamounted to a repetition rate of 175 Hz, whereas the scaledchirp signals were zero-padded to obtain a repetition rate of3350 Hz. As the discontinuities introduced by this zero-paddinggive rise to additional unwanted acoustical responses, the offsetwas tapered using a Tukey window with parameter α = 11%(determined empirically). All acoustical responses presentedbelow are averages over the relevant number of acquisitions(175 for pulses or 3350 for chirps) to ensure that the same totaloptical energy was associated with each measurement.
C. Signal Processing and Analysis
Power spectra of both the optical modulation and the acous-tical response were computed using MATLAB’s FFT routine.Bandwidths were defined by the −6-dB level in |P (ω)|2 rela-tive to the maximum power. Pulse compression based on cross-correlations using matched filters was applied to determine theaxial PSFs, where the filters were obtained by time-windowingthe A-scan measurements of echoes off a steel block. Mainlobe widths were determined by locating (by means of cubicinterpolation) the axial positions where the PSF was reducedto half its maximum value. Sidelobe levels were defined as themean of the maximum amplitudes of the first sidelobe occurringbefore and after the main lobe. Envelopes of PSFs and imageswere computed using the absolute value of MATLAB’s Hilberttransform.
A measure of the conversion efficiency at which opticalpower is converted to acoustical pressure η was obtained bycomputing the ratio between the maximum amplitude of theacoustical measurement (averaged over either 175 or 3350acquisitions to suppress noise) and the optical power during thepulse or chirp
η =maxt|p(t)|O /(R ·Δ)
(7)
where maxt is the maximum value of its argument, O is thetime-averaged optical power, R is the relevant repetition rate,and Δ the optical pulse duration. As the applied hydrophoneis not calibrated, this efficiency provides a relative measure inarbitrary units. The conversion efficiency ratio ε is defined as
ε =η
ηpulsed(8)
where ηpulsed is the conversion efficiency obtained with pulsedexcitation.
D. Phantom Imaging
Two separate phantoms were used in this study. The firstphantom consisted of a steel block placed, at right angles, at
86 IEEE TRANSACTIONS ON ULTRASONICS, FERROELECTRICS, AND FREQUENCY CONTROL, VOL. 63, NO. 1, JANUARY 2016
a distance of 4 mm from the source/receiver fiber pair. Asthese fibers were facing the same direction, pulse-echo datawere acquired to obtain the matched filters applied during pulsecompression and to measure the axial PSF.
The second phantom consisted of two layers of parallel car-bon fibers (100 µm diameter) spaced 1 mm apart. The firstlayer was located at a distance of approximately 4 mm from thefibers, the second layer at roughly 8 mm. A two-dimensionalpulse-echo image of this second phantom was acquired bytranslating the source and receive fibers along a straight path(forming the lateral direction) perpendicular to the fiber orien-tation. This translation was performed in an automated fashionusing a motorized stage (MTS50/M-Z8 + TDC001, Thorlabs,Germany), and acoustical pulse-echo A-scans were acquiredat 50-µm intervals. A-scans averaged over the same numbersof acquisitions as above were recorded, and pulse compressionbased on matched filtering was applied to each A-scan.
Image reconstruction was performed using the k-Wave tool-box [27], and the envelope of the resulting B-mode imageswas taken along the axial dimension. In the case of the time-stretched chirp, A-scans were first bandpass filtered with apassband between 3 ≤ f ≤ 35 MHz, tapered with a Tukey win-dow (parameter α = 1.5%), to suppress signals at frequenciesthat were not excited. SNRs were computed as the ratio betweenthe mean image amplitude within a region of interest containingthe image of a single carbon fiber over that of an equally largeregion containing only noise.
III. RESULTS
A. Pulsed Optical Excitation
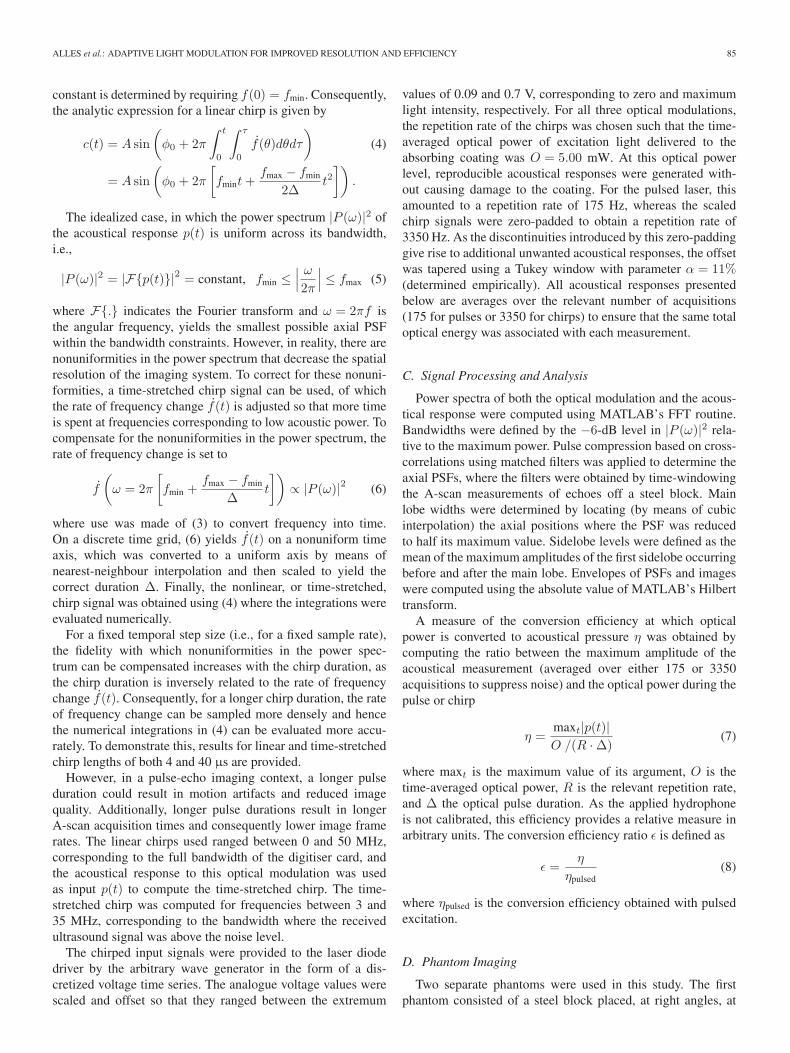
The large bandwidth contained in the 2-ns-long opticalpulse is visible in Fig. 2 (thin line, bottom panel). Using theplanar sensor exhibiting a uniform sensitivity, the acousticfield generated through pulsed excitation was found to have a−6-dB bandwidth ranging from 2.6 ≤ f ≤ 25.8 MHz (thickdotted line, bottom panel), which is significantly lower thanthe theoretical bandwidth. In addition, the fiber hydrophonewas observed to have a nonuniform sensitivity, resulting in abandwidth of 46% around a peak power frequency of 8.1 MHz(thick solid line, bottom panel) and a finite temporal extent ofthe acoustical response of about half a microsecond (thick solidline, top panel).
B. Pulsed Versus Linear Chirp Excitation
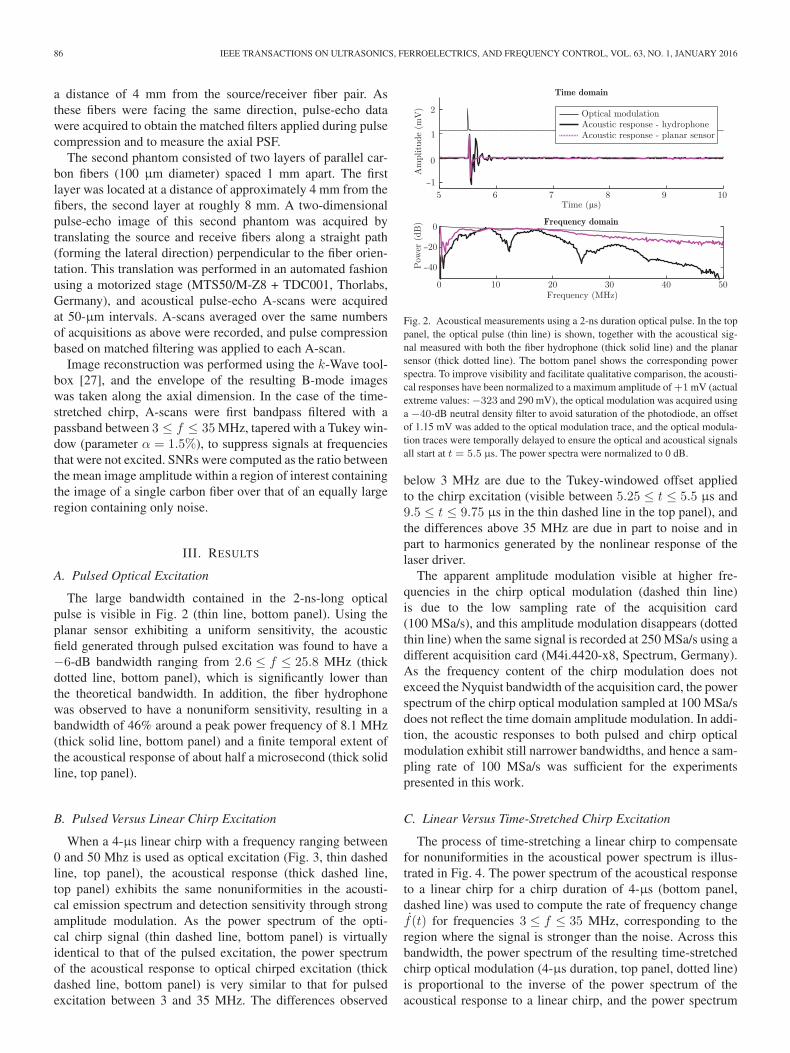
When a 4-µs linear chirp with a frequency ranging between0 and 50 Mhz is used as optical excitation (Fig. 3, thin dashedline, top panel), the acoustical response (thick dashed line,top panel) exhibits the same nonuniformities in the acousti-cal emission spectrum and detection sensitivity through strongamplitude modulation. As the power spectrum of the opti-cal chirp signal (thin dashed line, bottom panel) is virtuallyidentical to that of the pulsed excitation, the power spectrumof the acoustical response to optical chirped excitation (thickdashed line, bottom panel) is very similar to that for pulsedexcitation between 3 and 35 MHz. The differences observed
Fig. 2. Acoustical measurements using a 2-ns duration optical pulse. In the toppanel, the optical pulse (thin line) is shown, together with the acoustical sig-nal measured with both the fiber hydrophone (thick solid line) and the planarsensor (thick dotted line). The bottom panel shows the corresponding powerspectra. To improve visibility and facilitate qualitative comparison, the acousti-cal responses have been normalized to a maximum amplitude of +1 mV (actualextreme values: −323 and 290 mV), the optical modulation was acquired usinga −40-dB neutral density filter to avoid saturation of the photodiode, an offsetof 1.15 mV was added to the optical modulation trace, and the optical modula-tion traces were temporally delayed to ensure the optical and acoustical signalsall start at t = 5.5 µs. The power spectra were normalized to 0 dB.
below 3 MHz are due to the Tukey-windowed offset appliedto the chirp excitation (visible between 5.25 ≤ t ≤ 5.5 µs and9.5 ≤ t ≤ 9.75 µs in the thin dashed line in the top panel), andthe differences above 35 MHz are due in part to noise and inpart to harmonics generated by the nonlinear response of thelaser driver.
The apparent amplitude modulation visible at higher fre-quencies in the chirp optical modulation (dashed thin line)is due to the low sampling rate of the acquisition card(100 MSa/s), and this amplitude modulation disappears (dottedthin line) when the same signal is recorded at 250 MSa/s using adifferent acquisition card (M4i.4420-x8, Spectrum, Germany).As the frequency content of the chirp modulation does notexceed the Nyquist bandwidth of the acquisition card, the powerspectrum of the chirp optical modulation sampled at 100 MSa/sdoes not reflect the time domain amplitude modulation. In addi-tion, the acoustic responses to both pulsed and chirp opticalmodulation exhibit still narrower bandwidths, and hence a sam-pling rate of 100 MSa/s was sufficient for the experimentspresented in this work.
C. Linear Versus Time-Stretched Chirp Excitation
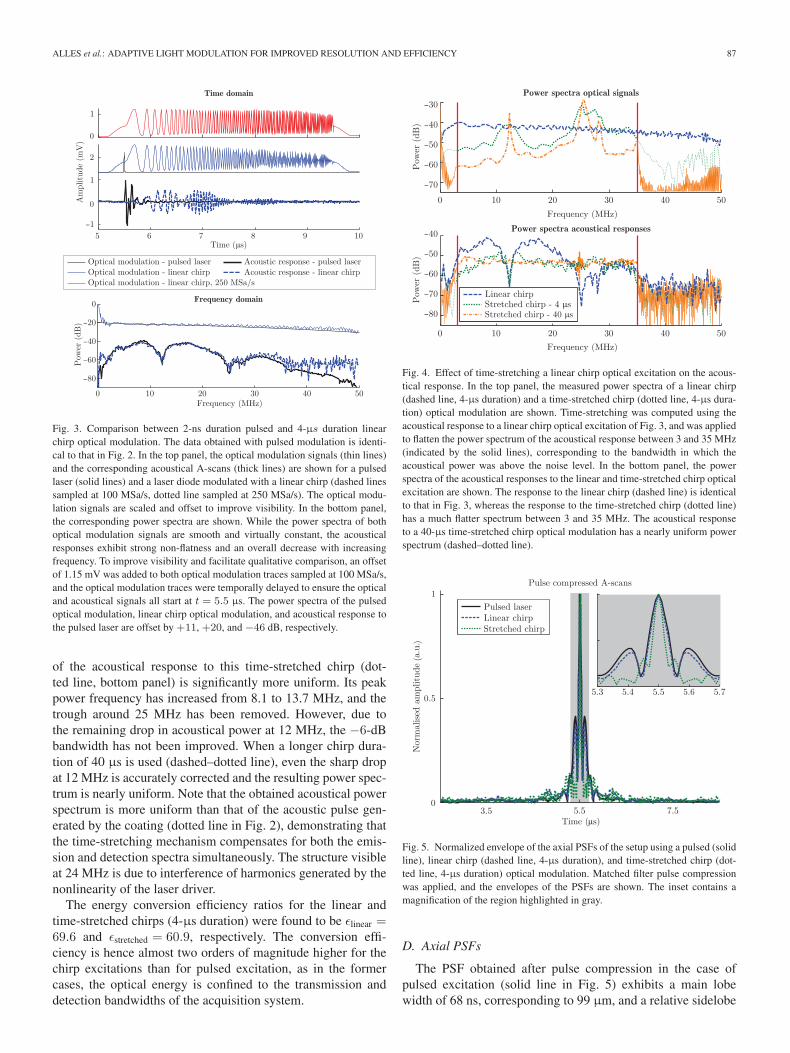
The process of time-stretching a linear chirp to compensatefor nonuniformities in the acoustical power spectrum is illus-trated in Fig. 4. The power spectrum of the acoustical responseto a linear chirp for a chirp duration of 4-µs (bottom panel,dashed line) was used to compute the rate of frequency changef(t) for frequencies 3 ≤ f ≤ 35 MHz, corresponding to theregion where the signal is stronger than the noise. Across thisbandwidth, the power spectrum of the resulting time-stretchedchirp optical modulation (4-µs duration, top panel, dotted line)is proportional to the inverse of the power spectrum of theacoustical response to a linear chirp, and the power spectrum
ALLES et al.: ADAPTIVE LIGHT MODULATION FOR IMPROVED RESOLUTION AND EFFICIENCY 87
Fig. 3. Comparison between 2-ns duration pulsed and 4-µs duration linearchirp optical modulation. The data obtained with pulsed modulation is identi-cal to that in Fig. 2. In the top panel, the optical modulation signals (thin lines)and the corresponding acoustical A-scans (thick lines) are shown for a pulsedlaser (solid lines) and a laser diode modulated with a linear chirp (dashed linessampled at 100 MSa/s, dotted line sampled at 250 MSa/s). The optical modu-lation signals are scaled and offset to improve visibility. In the bottom panel,the corresponding power spectra are shown. While the power spectra of bothoptical modulation signals are smooth and virtually constant, the acousticalresponses exhibit strong non-flatness and an overall decrease with increasingfrequency. To improve visibility and facilitate qualitative comparison, an offsetof 1.15 mV was added to both optical modulation traces sampled at 100 MSa/s,and the optical modulation traces were temporally delayed to ensure the opticaland acoustical signals all start at t = 5.5 µs. The power spectra of the pulsedoptical modulation, linear chirp optical modulation, and acoustical response tothe pulsed laser are offset by +11, +20, and −46 dB, respectively.
of the acoustical response to this time-stretched chirp (dot-ted line, bottom panel) is significantly more uniform. Its peakpower frequency has increased from 8.1 to 13.7 MHz, and thetrough around 25 MHz has been removed. However, due tothe remaining drop in acoustical power at 12 MHz, the −6-dBbandwidth has not been improved. When a longer chirp dura-tion of 40 µs is used (dashed–dotted line), even the sharp dropat 12 MHz is accurately corrected and the resulting power spec-trum is nearly uniform. Note that the obtained acoustical powerspectrum is more uniform than that of the acoustic pulse gen-erated by the coating (dotted line in Fig. 2), demonstrating thatthe time-stretching mechanism compensates for both the emis-sion and detection spectra simultaneously. The structure visibleat 24 MHz is due to interference of harmonics generated by thenonlinearity of the laser driver.
The energy conversion efficiency ratios for the linear andtime-stretched chirps (4-µs duration) were found to be εlinear =69.6 and εstretched = 60.9, respectively. The conversion effi-ciency is hence almost two orders of magnitude higher for thechirp excitations than for pulsed excitation, as in the formercases, the optical energy is confined to the transmission anddetection bandwidths of the acquisition system.
Fig. 4. Effect of time-stretching a linear chirp optical excitation on the acous-tical response. In the top panel, the measured power spectra of a linear chirp(dashed line, 4-µs duration) and a time-stretched chirp (dotted line, 4-µs dura-tion) optical modulation are shown. Time-stretching was computed using theacoustical response to a linear chirp optical excitation of Fig. 3, and was appliedto flatten the power spectrum of the acoustical response between 3 and 35 MHz(indicated by the solid lines), corresponding to the bandwidth in which theacoustical power was above the noise level. In the bottom panel, the powerspectra of the acoustical responses to the linear and time-stretched chirp opticalexcitation are shown. The response to the linear chirp (dashed line) is identicalto that in Fig. 3, whereas the response to the time-stretched chirp (dotted line)has a much flatter spectrum between 3 and 35 MHz. The acoustical responseto a 40-µs time-stretched chirp optical modulation has a nearly uniform powerspectrum (dashed–dotted line).
Fig. 5. Normalized envelope of the axial PSFs of the setup using a pulsed (solidline), linear chirp (dashed line, 4-µs duration), and time-stretched chirp (dot-ted line, 4-µs duration) optical modulation. Matched filter pulse compressionwas applied, and the envelopes of the PSFs are shown. The inset contains amagnification of the region highlighted in gray.
D. Axial PSFs
The PSF obtained after pulse compression in the case ofpulsed excitation (solid line in Fig. 5) exhibits a main lobewidth of 68 ns, corresponding to 99 µm, and a relative sidelobe

88 IEEE TRANSACTIONS ON ULTRASONICS, FERROELECTRICS, AND FREQUENCY CONTROL, VOL. 63, NO. 1, JANUARY 2016
Fig. 6. Images obtained of a phantom (top right) using a pulse (top left), alinear chirp (bottom left, 4-µs duration), or a time-stretched chirp (bottomright, 4-µs duration) as optical modulation. Data were acquired by linearlytranslating the source and receiver fiber pair and recording A-scans at 50-µmintervals, and images were reconstructed from pulse compressed RF data. Inthe time-stretched chirp case, RF data were filtered using a bandpass filter witha passband between 3 and 35 MHz. The regions indicated by the dashed boxesare magnified in Fig. 7, and the regions of interest used to determine the signaland noise levels are indicated by the solid and dotted boxes, respectively.
level of 0.41. As the acoustical power spectrum and band-width obtained using linear chirp excitation are very similarto that obtained using pulsed excitation (see Fig. 3), the mainlobe width (63 ns/92 µm) and relative sidelobe level (0.37)of the PSF using a linear chirp (dashed line) are comparable.However, when a time-stretched chirp is applied, the main lobewidth is smaller (44 ns/64-µm, dotted line) due to the broaderbandwidth demonstrated in the bottom panel of Fig. 4, and rel-ative sidelobe levels are further reduced to 0.30. The reductionin sidelobe levels observed for both chirp excitations was dueto the smoothly varying amplitude modulation introduced bythe nonuniform detector sensitivity, which suppresses discon-tinuities such as those observed in the acoustic response topulsed excitation (Fig. 3). As a result, the acoustic responsesto chirp excitations are effectively apodized, which decreasespulse compression sidelobe levels [19, Ch.3].
E. Phantom B-Mode Imaging
In the reconstructed images, the carbon fibers were clearlyvisible (Fig. 6). In the top left panel, the image obtained usingpulsed optical excitation is shown, which clearly reproduces thestructure of the phantom at an SNR of 10.3 dB. The regions ofinterest used to determine the signal and noise levels are indi-cated by the solid and dotted boxes, respectively. The phantomgeometry, orientation of the source and receive fibers, and scandirection are shown in the top right panel.
A similar image quality is obtained when a linear chirp isused, as is visible in the bottom left panel. The image is virtu-ally identical to that obtained using pulsed excitation, and hasa similar SNR of 9.6 dB. When a time-stretched chirp is used,the improved bandwidth results in a higher axial resolution thatmanifests itself in the higher resolution observed in the bot-tom right panel. However, as in this case more time is spentat frequencies of low acoustical power or sensitivity, thereby
Fig. 7. Magnifications of the dashed boxes in the images in Fig. 6, and ampli-tude profiles (top right) through the image along the path indicated by thedashed line.
decreasing the mean acoustical power, the SNR is reducedto 6.8 dB.
To facilitate image quality comparison, the sections indicatedby the dashed boxes are magnified in Fig. 7. Normalized pro-files through the images of one of the carbon fibers (along thedashed lines) are shown in the top right panel. Due to the lowersidelobes demonstrated in Fig. 5, the profile obtained using alinear chirp (dashed line) is marginally narrower (as is visibleat a depth of around 4.4 mm) than that obtained using pulsedexcitation (solid line). The profile obtained from images gener-ated using a time-stretched chirp is narrower still (dotted line)due to the increased bandwidth.
IV. DISCUSSION
This study provided the first demonstration of applyingmodulated instead of pulsed excitation to all-optical pulse-echo ultrasound. The presented advantages of using modulatedinstead of pulsed optical excitation depend strongly on thebandwidths of the applied source and receiver technologies.For sufficiently thin optically absorbing structures, thin-filmultrasound generation occurs and the generated acoustic fieldexhibits a wide bandwidth. However, if a thicker source struc-ture is employed, such as the 30-µm thick coating used in thiswork, bulk ultrasound generation occurs. In this case, the gen-erated acoustic field is convolved with the spatial distribution ofthe absorbed optical energy, and consequently an acoustic fieldis transmitted that has a narrower, nonuniform bandwidth.
Optically absorbing CNT-PDMS nanocomposite coatingswere chosen in this study as promising pulse-echo ultrasoundimaging results were previously achieved [11], [12], [28], andin addition these coatings tend to be robust and easy to fabricate.However, acoustic attenuation within this type of coating resultsin lower bandwidths than those previously achieved (cf. [14],[29]); for instance, as demonstrated in [30], a 25-µm thickcarbon-black PDMS coating gives rise to 15-dB attenuationat a frequency of 80 MHz. For many applications, the result-ing source bandwidth decrease is acceptable. For instance, in
ALLES et al.: ADAPTIVE LIGHT MODULATION FOR IMPROVED RESOLUTION AND EFFICIENCY 89
ultrasound imaging applications requiring penetration depthsexceeding a few millimeters, acoustical attenuation within thetissue limits the effective bandwidth to 30 MHz or less. Usingbandwidth-limited optical modulation, the system’s efficiencycan, therefore, be greatly improved.
In this work, time-stretched chirp optical modulations weresuccessfully used to simultaneously compensate for nonunifor-mities in both the source power spectrum and detector sensitiv-ity, and the resulting pulse-echo ultrasound image exhibited ahigher spatial resolution. Transmitting time-stretched chirps tocompensate for a nonuniform detector sensitivity is preferredover applying calibration curves, as the latter method tends toamplify and spectrally color noise.
The accuracy with which the acoustic power spectrum canbe flattened can be improved by extending the duration of theoptical modulation. However, in an in vivo imaging setting,using optical excitations with longer durations could result inmotion artifacts that suppress the benefits of spectral flatten-ing. Harmonic components in the optical signal generated bythe laser driver further limit the spectral flattening accuracy.In addition, due to acoustic diffraction, the pulse compressionscheme will be most accurate in the location where the matchedfilter was obtained.
Even in the ideal case in which the transmitted ultrasoundhas ultra-high bandwidth (e.g., [14], [29]) and the receiverexhibits uniform, broadband sensitivity (e.g., [24], [31]–[33]),using modulated optical excitation could prove beneficial. Forinstance, optical excitations with extended durations couldimprove the SNR in situations where the peak power is limitedby the material tolerances of the optically absorbing coatingor the underlying substrate. For instance, the damage thresh-old for fused silica (1 GW/cm2) limits the energy contained ina 2-ns-long pulse delivered in a 200-µm core optical fiber toapproximately 600 µJ [34]. The optically absorbing coating isdamaged at much lower values, typically around 30 µJ. Using amodulated laser diode, broad-band optical energy can be spreadout over longer time periods while keeping peak power levelsbelow material tolerances.
Contrary to piezo-electric ultrasound transducers, opticallygenerated ultrasound does not rely on resonance to generatethe acoustical energy. As a consequence, the bandwidth andcentre frequency can be optimized for different imaging con-texts. Using the same optical acoustic source and modulatedlight source, ultrasound can be generated with a bandwidth thatis either very narrow (useful for Doppler flowmetry or sam-ple characterization), very broad (for high resolution imaging),or intermediate (for larger penetration depth). This approachcan be extended to photoacoustic imaging, where the lightis absorbed within biological tissue or other samples. It hasbeen shown that the emitted acoustical spectrum depends onthe geometry of the optical absorber [35], [36], and hence byapplying modulated instead of pulsed light the spectral sen-sitivity of the system can be tuned to the specific geometryunder study. In a similar manner, an all-optical pulse-echoultrasound system could be tuned using modulated optical exci-tation to enhance sensitivity for particular structures such asmicrobubbles.
V. CONCLUSION
By switching from pulsed optical excitation to an opticalmodulation of larger temporal extent, the bandwidth of the opti-cal modulation can be constrained to those frequencies thatare generated and detected by the optically absorbing coatingand receiver. As a result, losses due to acoustical attenuationwithin the coating or tissue or due to a nonuniform detec-tion sensitivity can be avoided. With the ultrasound source andreceiver used in this study, the efficiency with which opticalenergy is converted to detected acoustic signal was increasedby almost two orders of magnitude. Pulse-echo B-mode imagescan be obtained using a modulated laser diode for transmis-sion, with SNRs similar to those of images acquired using apulsed laser, despite a peak power that is lower by nearly fiveorders of magnitude. In addition, by using nonlinear (time-stretched) chirp excitations, where the nonlinearity is computedfrom measurements of the spectral sensitivity of the system, thenonuniformities in the emitted acoustical power spectrum andthe detector sensitivity can simultaneously be reduced, result-ing in an increased bandwidth and consequently in an improvedspatial resolution.
ACKNOWLEDGMENT
The authors wish to thank P. Kostecki for technical assistancewith the laser diode, and J. Guggenheim for assistance with theplanar Fabry–Pérot measurements.
REFERENCES
[1] P. C. Beard, “Biomedical photoacoustic imaging,” Interface Focus, vol. 1,no. 4, pp. 602–631, 2011.
[2] Y. Hou, J.-S. Kim, S. Ashkenazi, S.-W. Huang, L. J. Guo, andM. O’Donnell, “Broadband all-optical ultrasound transducers,” Appl.Phys. Lett., vol. 91, no. 7, p. 073507, 2007.
[3] S.-W. Huang, S. Ashkenazi, Y. Hou, R. S. Witte, and M. O’Donnell,“Toward fiber-based high-frequency 3-D ultrasound imaging,” in Proc.SPIE BiOS, 2007, pp. 643728–643728-8.
[4] Y. Hou, J.-S. Kim, S.-W. Huang, S. Ashkenazi, L. Jay Guo, andM. O’Donnell, “Characterization of a broadband all-optical ultrasoundtransducer-from optical and acoustical properties to imaging,” IEEETrans. Ultrason. Ferroelectr. Freq. Control, vol. 55, no. 8, pp. 1867–1877,Aug. 2008.
[5] Y. Hou, S. Ashkenazi, S.-W. Huang, and M. O’Donnell, “An inte-grated optoacoustic transducer combining etalon and black pdms struc-tures,” IEEE Trans. Ultrason. Ferroelectr. Freq. Control, vol. 55, no. 12,pp. 2719–2725, Dec. 2008.
[6] E. Biagi et al., “Fiber optic broadband ultrasonic probe for virtual biopsy:Technological solutions,” J. Sens., vol. 2010, pp. 1–6, 2010.
[7] C. Sheaff and S. Ashkenazi, “An all-optical thin-film high-frequencyultrasound transducer,” in Proc. IEEE Int. Ultrason. Symp., 2011,pp. 1944–1947.
[8] B.-Y. Hsieh, S.-L. Chen, T. Ling, L. J. Guo, and P.-C. Li, “All-opticalscanhead for ultrasound and photoacoustic imaging—Imaging modeswitching by dichroic filtering,” Photoacoustics, vol. 2, no. 1, pp. 39–46,2014.
[9] C. Sheaff and S. Ashkenazi, “Polyimide-etalon all-optical ultrasoundtransducer for high frequency applications,” in Proc. SPIE BiOS, 2014,pp. 89434M–89434M-8.
[10] X. Zou, N. Wu, Y. Tian, and X. Wang, “Broadband miniature fiber opticultrasound generator,” Opt. Express, vol. 22, no. 15, pp. 18119–18127,2014.
[11] R. J. Colchester, E. Z. Zhang, C. A. Mosse, P. C. Beard,I. Papakonstantinou, and A. E. Desjardins, “Broadband miniature opticalultrasound probe for high resolution vascular tissue imaging,” Biomed.Opt. Express, vol. 6, no. 4, pp. 1502–1511, 2015.

90 IEEE TRANSACTIONS ON ULTRASONICS, FERROELECTRICS, AND FREQUENCY CONTROL, VOL. 63, NO. 1, JANUARY 2016
[12] H. W. Baac et al., “Carbon-nanotube optoacoustic lens for focused ultra-sound generation and high-precision targeted therapy,” Sci. Rep., vol. 2,pp. 1–8, 2012.
[13] A. Karabutov, A. Kaptilniy, A. Y. Ivochkin, D. Ksenofontov, andA. Trofimov, “Optoacoustic study of laser-induced near-critical statesof thin aluminum films,” Moscow Univ. Phys. Bull., vol. 68, no. 5,pp. 383–386, 2013.
[14] E Vannacci et al., “Miniaturized fiber-optic ultrasound probes for endo-scopic tissue analysis by micro-opto-mechanical technology,” Biomed.Microdevices, vol. 16, no. 3, pp. 415–426, 2014.
[15] S. H. Lee et al., “Reduced graphene oxide coated thin aluminum filmas an optoacoustic transmitter for high pressure and high frequencyultrasound generation,” Appl. Phys. Lett., vol. 101, no. 24, p. 241909,2012.
[16] R. J. Colchester et al., “Laser-generated ultrasound with optical fibresusing functionalised carbon nanotube composite coatings,” Appl. Phys.Lett., vol. 104, no. 17, p. 173502, 2014.
[17] O. Balogun and T. W. Murray, “Frequency domain photoacoustics usingintensity-modulated laser sources,” Nondestr. Test. Eval., vol. 26, nos. 3–4, pp. 335–351, 2011.
[18] B. Lashkari and A. Mandelis, “Features of the frequency-and time-domain photoacoustic modalities,” Int. J. Thermophys., vol. 34, nos. 8–9,pp. 1398–1404, 2013.
[19] C. Özdemir, Inverse Synthetic Aperture Radar Imaging With MATLABAlgorithms. Hoboken, NJ, USA: Wiley, 2012, vol. 210.
[20] T. Misaridis and J. A. Jensen, “Use of modulated excitation signalsin medical ultrasound—Part II: Design and performance for medicalimaging applications,” IEEE Trans. Ultrason. Ferroelectr. Freq. Control,vol. 52, no. 2, pp. 192–207, Feb. 2005.
[21] S. Telenkov, A. Mandelis, B. Lashkari, and M. Forcht, “Frequency-domain photothermoacoustics: Alternative imaging modality of biolog-ical tissues,” J. Appl. Phys., vol. 105, no. 10, p. 102029, 2009.
[22] B. Lashkari and A. Mandelis, “Photoacoustic radar imaging signal-to-noise ratio, contrast, and resolution enhancement using nonlinear chirpmodulation,” Opt. Lett., vol. 35, no. 10, pp. 1623–1625, 2010.
[23] S. Kellnberger, N. C. Deliolanis, D. Queirós, G. Sergiadis, andV. Ntziachristos, “In vivo frequency domain optoacoustic tomography,”Opt. Lett., vol. 37, no. 16, pp. 3423–3425, 2012.
[24] E. Z. Zhang and P. C. Beard, “Characteristics of optimized fibre-opticultrasound receivers for minimally invasive photoacoustic detection,” inProc. SPIE BiOS, 2015, pp. 932311–932311-9.
[25] E. Zhang, J. Laufer, and P. Beard, “Backward-mode multiwavelengthphotoacoustic scanner using a planar Fabry-Perot polymer film ultra-sound sensor for high-resolution three-dimensional imaging of biologicaltissues,” Appl. Opt., vol. 47, no. 4, pp. 561–577, 2008.
[26] E. Z. Zhang and P. C. Beard, “A miniature all-optical photoacousticimaging probe,” in Proc. SPIE BiOS, 2011, pp. 78991 F–78991 F-6.
[27] B. E. Treeby and B. T. Cox, “k-Wave: Matlab toolbox for the simulationand reconstruction of photoacoustic wave fields,” J. Biomed. Opt., vol. 15,no. 2, pp. 021314–021314-12, 2010.
[28] R. J. Colchester et al., “Real-time needle guidance with photoacous-tic and laser-generated ultrasound probes,” in Proc. SPIE BiOS, 2015,pp. 932321–932321-5.
[29] I. Pelivanov, D. Kopylova, N. Podymova, and A. Karabutov,“Optoacoustic technique for thickness measurement of submicron metalcoatings,” Laser Phys., vol. 19, no. 6, pp. 1350–1360, 2009.
[30] T. Buma, M. Spisar, and M. O’Donnell, “A high-frequency, 2-D arrayelement using thermoelastic expansion in PDMS,” IEEE Trans. Ultrason.Ferroelectr. Freq. Control, vol. 50, no. 9, pp. 1161–1176, Sep. 2003.
[31] A. Karabutov, V. Larichev, G. Maksimov, I. Pelivanov, and N. Podymova,“Relaxation dynamics of a broadband nanosecond acoustic pulse in abubbly medium,” Acoust. Phys., vol. 52, no. 5, pp. 582–588, 2006.
[32] A. Karabutov et al., “Laser ultrasonic diagnostics of residual stress,”Ultrasonics, vol. 48, no. 6, pp. 631–635, 2008.
[33] T. Ling, S.-L. Chen, and L. J. Guo, “High-sensitivity and wide-directivityultrasound detection using high Q polymer microring resonators,” Appl.Phys. Lett., vol. 98, no. 20, pp. 204103-1–204103-3, 2011.
[34] Thorlabs. (2015). Thorlabs Fibre Specification [Online]. Available:http://www.thorlabs.de/
[35] A. Gertsch, N. Bush, D. Birtill, and J. Bamber, “Toward characterizingthe size of microscopic optical absorbers using optoacoustic emissionspectroscopy,” in Proc. SPIE BiOS, 2010, pp. 75641M–75641M-10.
[36] G. Xu, J. B. Fowlkes, C. Tao, X. Liu, and X. Wang, “Photoacousticspectrum analysis for microstructure characterization in biological tissue:Analytical model,” Ultrasound Med. Biol., vol. 41, no. 5, pp. 1473–1480,2015.
Erwin J. Alles was born in Haarlem, TheNetherlands, in 1985. He received the B.Sc., M.Sc.,and Ph.D. degrees in applied physics from DelftUniversity of Technology, Delft, The Netherlands, in2005, 2007, and 2012, respectively.
In 2011, he worked as a Visiting Scholar atMichigan State University, East Lansing, MI, USA,where he extended the validity of an efficient methodfor computing the transient pressure field generatedby a piston transducer. From 2012 to 2014, he workedas a Postdoctoral Training Fellow with the Institute
of Cancer Research, London, U.K., where he developed a clinical spec-troscopic photoacoustic scanner. He is currently a Research Associate withthe Department of Medical Physics and Biomedical Engineering, UniversityCollege London, London, U.K. His research interests include developing inter-ventional medical imaging systems based on laser-generated ultrasound andphotoacoustics.
Richard J. Colchester was born in Ipswich, U.K., in1990. He received the M.Sc. degree in physics fromImperial College London, London, U.K., in 2012.He is currently pursuing the Ph.D. degree in medi-cal physics and biomedical engineering at UniversityCollege London.
His research interests include laser-generated ultra-sound using optical fibers and their biomedical appli-cation.
Adrien E. Desjardins was born in Nice, France. Hereceived the B.Sc. degree in physics and mathematicsfrom the University of British Columbia, Vancouver,BC, Canada, in 2001, and the Ph.D. degree in bio-physics and biomedical engineering from HarvardUniversity, Cambridge, MA, USA, in 2007.
He worked at Philips Research, Eindhoven, TheNetherlands, as a Senior Scientist from 2007 to 2010,where he led the technical development of a newmedical device with integrated optical sensors. He iscurrently a Lecturer with the Department of Medical
Physics and Biomedical Engineering, University College London, London,U.K. His research interests include the development of imaging and sens-ing modalities to guide minimally invasive medical procedures, laser gener-ated ultrasound, photoacoustic imaging, optical ultrasound sensing, endomi-croscopy, and optical spectroscopy.
Dr. Desjardins was recently awarded starting grants from the EuropeanResearch Council (ERC), the Engineering and Physical Sciences ResearchCouncil (EPSRC), and the Royal Society.