adaptive modeling of urban dynamics during ephemeral event via mobile phone traces
TRANSCRIPT

Informatics Engineering, an International Journal (IEIJ), Vol.4, No.2, June 2016
DOI : 10.5121/ieij.2016.4204 31
ADAPTIVE MODELING OF URBAN DYNAMICS
DURING EPHEMERAL EVENT VIA MOBILE PHONE
TRACES
Suhad Faisal Behadili1, Cyrille Bertelle
1, and
Loay E. George
2
1Normandie University, LITIS, FR CNRS 3638, ISCN, ULH, Le Havre, France
2 Baghdad University, Computer Science Department, Baghdad, Iraq
Abstract The communication devices have produced digital traces for their users either voluntarily or not. This type
of collective data can give powerful indications that are affecting the urban systems design and
development. In this study mobile phone data during Armada event is investigated. Analyzing mobile
phone traces gives conceptual views about individuals densities and their mobility patterns in the urban
city. The geo-visualization and statistical techniques have been used for understanding human mobility
collectively and individually. The undertaken substantial parameters are inter-event times, travel distances
(displacements) and radius of gyration. They have been analyzed and simulated using computing platform
by integrating various applications for huge database management, visualization, analysis, and
simulation. Accordingly, the general population pattern law has been extracted. The study contribution
outcomes have revealed both the individuals densities in static perspective and individuals mobility in
dynamic perspective with multi levels of abstraction (macroscopic, mesoscopic, microscopic).
Keyword
Modeling, urban, mobility, Armada, inter-event time, radius of gyration, travel distance, trajectory ,
CDRs.
1. INTRODUCTION
There's no doubt that mobile phone is the most dominant tool to gather human mobility data in
spatio-temporal pattern due to its intense usage by human. Assuming every individual is
represented by at least one mobile, even if he/she can use another communication method in
view of great ICT invasion [1, 2, 3, 4, 5, 6]. The human mobility studies using CDRs has to be
highlighted to find more modeling improvements, in order to have more realistic simulation
results with flexible skills. In general, these studies are done basically in several concepts
(Macroscopic, Mesoscopic, and Microscopic) of abstraction [7, 8, 9, 10].
The multi-agent simulations are very suggestive for spatio-temporal dynamics, since they are
elaborating the relationships between micro-level individual actions and emergent macro-level
phenomena as in [66]. According to [65], multi-agent system framework, which models
emergent human social behaviors (competitive, queuing, and herding) at the microscopic level is
used. This kind of models build artificial environment composed of agents, which have the
ability to interact in intelligence and adaptability with each other [9, 12, 13]. In these models the
agents are acting based on some strategies. However, their interactions are based on
predetermined mobility conditions like (leader, follower, inhibition) agents. This type of

Informatics Engineering, an International Journal (IEIJ), Vol.4, No.2, June 2016
32
simulation is very effective for large scale rescue scenario, complex systems, and modeling
crowd behaviors [7, 14].
Recently, researches focusing on the study of the collective and individual human mobility using
CDRs [44], the segmentation of urban spaces [67], and the understanding of social events [68]
were done. The research [69] suggested the activity-aware map, using the user mobile phone to
uncover the dynamic of inhabitants for urban planning, and transportation purposes. The
researchers in [70] deal with large telecommunication database for Great Britain to explore
human interactions, and emphasized on the highly interactions correlation with administrative
regions. And in [71] they invented the co-location perspective to outline the behavior of the
interacted telecom network users, who frequently call each other and share same spatio-temporal
in a city. Whereas, the research [72] is presented the digital footprints (left traces), that are put
through individuals during their mobility in urban space. This is performed using CDRs and
georeferenced images of Flickr in order to investigate the tourists presence and mobility in Rome
city. However, the research [73] is emphasized that urban mobility is highly correlated with
individuals behavior during mobile phone usage at spatio-temporal patterns.
The human mobility understanding, modeling and simulating among urban regions is a
challengeable effort, since it is very important for many kinds of events, either in the indoor
events like evacuation of buildings, stadiums, theaters, ships, aircraft or outdoor ones like public
assemblies, open concerts, religious gatherings, community evacuation ...etc. The simulation
models of individuals mobility could be classified according to their space representation, which
could be continuous; grid based or network structure. However, they could be classified
according to their intent (specific, general), or the level of abstraction (macroscopic, mesoscopic,
microscopic) [7, 8, 9, 10, 16, 17, 18]
The major limitation of CDRs data is the mass size, so they need the sampling and accurate
manipulations to preserve their accuracy and to avoid any misused or misunderstanding. Another
problem with the CDRs is the privacy problem, since the information of the mobile network
subscribers will be vulnerable, so be announced for unauthorized parties; therefore it is
anonymized (hidden) to protect the subscribers privacy. As well as, the graphical or geographical
representation of these datasets is difficult, because of the hardware/software limitations that
could be faced during processing. The CDRs datasets overcome the acquisition problems
(financially, time consuming), but their projection and trajectories tracing still time and resource
consuming. The researchers try to solve this limitation by selecting the samples randomly from
the CDRs, and obtain the highly frequent records [60, 62, 30, 42, 63, 64, 32, 10, 33, 20, 12, 28].
This research captures the case study data in two phases; the analysis phase, and the modeling
and simulation phase with regards to spatio-temporal features. The perspectives are elaborated in
both static and dynamic views. The analysis and representation of the individuals concentration
in the observed region are achieved in order to give a static view perspective for the investigated
data, as will be shown in section 3. Thereafter, the statistical techniques are applied on the
investigated data to model and simulate the human mobility, which gives the dynamic view
perspective. The modeling and simulating of the Armada data event is performed at two levels:
1. Collective level: The data of aggregated space, aggregated time intervals, and both of
them, which are pointing to aggregated data items. They are manipulated using statistical
probability distributions. As will be elaborated in section 4.
2. Individual level: The data of space and time, which are pointing to individual items, they
are used to reconstruct the individuals trajectories via a mathematical model of physical
mobility characteristics. As will be elaborated in section 5.

Informatics Engineering, an International Journal (IEIJ), Vol.4, No.2, June 2016
33
2. DATA SET OF ARMADA CASE STUDY AND MOBILE NETWORKS DATA
The analysis of mobile phone traces allows describing human mobility with accuracy as never
done before. These data are spatio-temporal data could be registered as CDRs (Call Detail
Records), which have both time and spatial properties. Their unique features enable them to
reflect human mobility in real time. Also, they have complex nature and a very rich environment
to obtain human life pattern elaboration from multi points of view [19, 20, 4]. The main objective
of this contribution is modeling and simulating individuals mobility during Armada event. The
essential material used in this study is database generated by the given mobile phone operator
(Orange Company in France) in form of CDRs.
Armada is the name of the famous marine festival takes ten days period, it takes place every 4
years periodically [21, 22]. Large sailing ships, private yachts, naval ships and even military
frigate schooners are gathering from twenty different countries, in one of world free spectacle in
Rouen (capital city of Upper Normandy in France), which is attracting 8 million visitors addition
to Rouen citizens (estimated to 460,000 in 2008). This case study is observing the fifth edition of
the Armada event during 4th - 15th July 2008. However, its miscellaneous activities are starting
from 10:00 to 20:00 every day. The last day of this event coincides 14th July (French national
day) [21, 6]. The available data of Armada case study composed of 51,958,652 CDRs for
615,712 subscribers during 288 hours with lack of 15 hours, so the actual observed data of 273
hours. Armada event days are classified in two categories (days out of Armada 4th and 15
th of
July, and days within Armada 5th - 14th of July). During Armada period there are 5 days are off
days, which are weekends and vacation, fall of (5, 6, 12, 13, and 14) of July, and other days (4, 7,
8, 9, 10, 11, and 15) of July which are work days. The Armada mobile phone database is
composed of CDRs that contain: mobile IDs (alias), towers IDs and positions which are geo-
referenced by 2D-coordinates (x, y), number of cells on each tower and Cells IDs, mobile
activity types (call in/out, SMS in/out, mobile hand over, abnormal call halt, normal call end),
and the date and time of the mobile phone activity recorded.
However, this kind of data is representing individuals occurrence in discrete (irrelevant) mode
only, means that any mobile individual activity is recorded at (start/end) time, but there is lost
information which is supposed to indicate the user's occurrence during inactive case (no data
meanwhile the mobile phone is idle i.e. inactive or doesn't make any communication activities
neither calls nor SMS activities). As well as, the available spatial data is only the towers (X, Y)
coordinates. So, they would be considered to estimate individual transitions from position to
another (from tower to tower), where each two consecutive activities between two towers could
be considered as the displacement (mobility from coverage region to another), it is the main
point to capture the transition from one location to another [25, 4]. These positions would be
estimated approximately with regard to tower coverage (signal strength).
Seeing as these data have non-deterministic and discrete nature, therefore the collective mode
would be the effective approach to be analyzed and simulated. As well as, since each individual
could be disappeared for a while from the DB records which makes individual tracing is
unworthy, and without significant indications on the individuals' mobility in the city.
Nevertheless, this kind of analysis has two limitations, first one is the information given by
mobile phone traces are incomplete to describe all individuals mobility. Actually, because many
individuals moving in the city without using a mobile phone. However, the intensity of mobile
phone usage nowadays helps to capture mobility analysis in an acceptable approximation.
Second one is the mobile phone traces are only caught by a tower that is located at some specific
places in the city, so the positions also would be estimated approximately. Consequentially, it is
supposed to interpolate individual positions and reconstruct his trajectories from the traces to
simulate his mobility (human mobility). The manipulation of these data requires several phases

Informatics Engineering, an International Journal (IEIJ), Vol.4, No.2, June 2016
34
to get required analysis results and obtain precise expected knowledge about individuals
densities and mobility [25, 26, 27, 2, 20, 12, 28].
Human mobility studies are benefiting from mobile phone data with concentration on the regions
of higher mobile phone network coverage, these regions are characterized as (mature, stable,
most developed). Under an assumption of that each mobile represents an individual, in other
words his occurrence and mobility. As a consequence, individuals densities and mobility could
be explored for the observed event.
3. DATA ANALYSIS AND VISUALIZATION
The GIS influences several scientific fields (urban planning, traffic management, sustainable
infrastructure establishment, tourism… etc.). So, the combination of social sensor data with data
mining techniques, and GIS could give deep total perception to urban dynamics towards socio-
technical conceptualization for the city by elaborating the implicit daily patterns [29, 30, 10, 33,
34, 35, 5, 36, 37, 38, 11].
Specific platform has been developed to integrate and analyze the initial raw database; PHP
server and SQL query language are used. Data visualization is accomplished using graphs,
representing regions densities corresponding to human activities. The combination of these tools
allows lining up the spatio-temporal data (CDRs) on the city map. ArcGIS platform is used for
geographic representation, and to extract the aggregated data of five classified sectors, which are
corresponding to the observed spatial sub-areas. The geographic region dividing considers sub-
area of Armada activities as the central region and other sub-areas are its surroundings from four
directions (north, south, east, and west). In order to summarize the spatial patterns, hence the
study area is divided into adjacent sub-areas [38], this is done by using Voronoi polygons like in
[39], where each polygon is associated with a tower and depicts the area under the main
influence of this tower. Each Voronoi cell centering the tower coverage area, it corresponds all
closest possible locations of individual detected in this coverage area. Each group of adjacent
Voronoi polygons is formulating one of the five sub-areas. However, the center sector is located
around Seine river banks where Armada event held, the eastern sector is located to the east of the
center sector, the western sector is located to the west of the center sector, the northern sector is
located to the north of center sector, and the southern sector is located to the south of the center
sector. The overall perspective of the 30x30 Km observed region activities could be elaborated
according to the daily intervals. As in figure 1, where the produced five sub-areas are presented
[6].
The basic concept of this phase deals with analyzing and representation of individuals
concentration in the observed region, according to (sub-areas during observed days, and sub-
areas during observed hours). However, daily activity ratios of the 5 sectors are analyzed
according to daily hours, and as obvious in figure 2.a. All sectors have similar patterns, but in
varying ratios. The sectors could be ordered in descending order (center, south, north, west, and
east). Whereas, highest activity ratios for all sectors are located in time intervals (00:00, 06:00-
20:00), otherwise the activity ratios are descending over time intervals (01:00-06:00) and (21:00-
23:00). The lowest activity ratios for all sectors are falling in time intervals (02:00-06:00), 15:00,
and 23:00). All sectors have peak values in common 12:00 and 18:00 which are lunch hour, and
end work hours respectively, where the social activities are in highest rank.

Informatics Engineering, an International Journal (
Figure 1: Densities analysis in macroscopic perspective: a. The five sub
and are built by grouping Voronoi cells. The black anchors represent places along the Seine river where held activities during Armada [6].
a.
Fig. 2: Activity patterns according to
average over the days period of Armada [6],
The most active sectors are the (center and south) along the observed period. There is high
difference in activity ratios among sectors, so it could be ranked in descending order (center,
south) as the most active sectors followed by (north, west, and sout
well as, in figure 2.b the analysis of daily activity ratios for the 5 sectors along the12 days.
Where all sectors have highly activity ratios in the day
event, hence the influence of all a
ratios in the days (6, 12, and 13), which they are off days. That means the citizens are in their
lowest activities during off days. All sectors have their high activity ratios in the day i
11) which they are work days. The anomalous event is appeared in day 1
are in their lowest activity ratios except the west sector where its activity ratios mark peak
values. This could be interpreted as France National
may be held in this sector during this
aggregated individuals (densities) in aggregated geographic locations. Where each mobile phone
could represent an individual, and each group of adjacent Voronoi polygons represents one
geographic sub-area, that are formulated the total observed region.
Informatics Engineering, an International Journal (IEIJ), Vol.4, No.2, June 2016
Figure 1: Densities analysis in macroscopic perspective: a. The five sub-areas appear in 5 colored zones,
and are built by grouping Voronoi cells. The black anchors represent places along the Seine river
b.
days and hours: a: Daily analysis of the 5 sectors along 24 hours with
the days period of Armada [6], b: Daily analysis of the 5 sectors along 12 days.
The most active sectors are the (center and south) along the observed period. There is high
difference in activity ratios among sectors, so it could be ranked in descending order (center,
south) as the most active sectors followed by (north, west, and south) sectors respectively. As
the analysis of daily activity ratios for the 5 sectors along the12 days.
Where all sectors have highly activity ratios in the day 4th July, since it is former to Armada
event, hence the influence of all arrangements is clear. All sectors are decreasing in their activity
ratios in the days (6, 12, and 13), which they are off days. That means the citizens are in their
lowest activities during off days. All sectors have their high activity ratios in the day i
11) which they are work days. The anomalous event is appeared in day 14th where all the sectors
are in their lowest activity ratios except the west sector where its activity ratios mark peak
values. This could be interpreted as France National Day influences this sector, the ceremonial
may be held in this sector during this day [6]. This phase considers the phones activities as
aggregated individuals (densities) in aggregated geographic locations. Where each mobile phone
idual, and each group of adjacent Voronoi polygons represents one
area, that are formulated the total observed region.
35
areas appear in 5 colored zones,
and are built by grouping Voronoi cells. The black anchors represent places along the Seine river platforms
: a: Daily analysis of the 5 sectors along 24 hours with
The most active sectors are the (center and south) along the observed period. There is high
difference in activity ratios among sectors, so it could be ranked in descending order (center,
h) sectors respectively. As
the analysis of daily activity ratios for the 5 sectors along the12 days.
July, since it is former to Armada
rrangements is clear. All sectors are decreasing in their activity
ratios in the days (6, 12, and 13), which they are off days. That means the citizens are in their
lowest activities during off days. All sectors have their high activity ratios in the day intervals (7-
where all the sectors
are in their lowest activity ratios except the west sector where its activity ratios mark peak
Day influences this sector, the ceremonial
This phase considers the phones activities as
aggregated individuals (densities) in aggregated geographic locations. Where each mobile phone
idual, and each group of adjacent Voronoi polygons represents one
Informatics Engineering, an International Journal (IEIJ), Vol.4, No.2, June 2016
36
4. DESCRIBING INDIVIDUALS' ACTIVITIES
The simulation process reflects the characteristics and behavior of any system. The word
(simulation) is used in several fields it includes the modeling of natural sentences or human
organs as an attempt to explore the details of this process. However, in this phase there is an
attempt to model and simulate the general pattern law for the collective data, and then they are
investigated in more detail by classifying them into work and off days. The mobile phone data
are very heterogeneous nature, since the users could be very active having many calls/SMSs, or
inactive having little usage of the network, so sampling the users would be depending on their
activities number [55]. Since, the individuals are varied in their usage of mobile phone, which
they are ranged between (rarely-frequently) usages during observed period. Therefore, the
individuals are grouped according to their total activities. However, the probability distribution
of waiting time (inter-event time ∆T) has been computed for each consecutive activity and for
each individual. In order to formulate simplified models with their quantitative analysis
parameters, thus the probability function should be computed to obtain the general system
pattern, which is done according to consecutive inter-event time parameter. The probability
distribution of individuals activities are made by [40, 41, 42, 43, 44, 50]:
1. Compute probability function to get the system universal behavior (pattern), according to
consecutive inter-event time.
2. Compute the probability density function to get each agent sample probability [48, 43].
The individuals are grouped with regard to their activities, as in figure 3.a, which it explores the
long waiting times are characterizes the individuals of less activities. The waiting time
distribution is also computed for the work days as in figure 3.b, and then it is computed for the
off days as in figure3.c. However, the distribution of the inert-event time ∆T is estimated by
equation (2): ��∆�� = �∆�����∆��……�2�
4.1. Fixed Inter-Event Time Observations
The modeling and simulation process starts by computing probability model, which is modeled
the data and simulated the responses of the model by using one of the well-known functions
probability density function PDF [50, 51].
The main parameters in this study are ∆t, mean of ∆t, and ��. The samples means of the
distributions are drawn from an exponential distribution. Then, compute the mean of all means.
However, understand the behavior of sample means from the exponential distribution in order to
have the universal system pattern (general population law). The computations are done
sequentially by manipulating all 12 days data (each day independently) for total individuals in
spatio-temporal manner, and then eliminate the individuals of the only one occurrence in the
CDRs, since they didn't have a significant indication on mobility. As well as, sorting the data by
time in order to have the real sequence of positions transitions of individuals trajectories, and
classify the data according to individuals' activities (sampling), by computing ∆t (inter-event
time/ waiting time), where it is the time elapsed between each successive activities of each
individual. It ranges between 15-1440 minutes, this sampling is done according to logical
intuition, since 15 minutes is the minimum time that can give mobility indication, and the 1440
(24 hours) could be considered as highest elapsed time to travel in the city, then compute ∆��
(average inter-event time) of all individuals, so classify (min, max) samples according to
activities score (activities densities). Thereafter, sort the samples of activities according to inter-
event time, and then compute the inter-event time of all individuals ∆t and ∆��for each sample,

Informatics Engineering, an International Journal (IEIJ), Vol.4, No.2, June 2016
37
Fig. 3: Waiting time distribution in mesoscopic perspective: a: Waiting time distribution �∆�� of mobile
phone activities, where ∆� is the spent time between each two successive activities, legend symbols are
used to distinguish the unique days and the curve of their mean (DayAve)for the total population during the
total period [78], b: Work days waiting time distribution p(∆t) of mobile phone activities, legend symbols
are used to distinguish the unique days and the curve of their mean (Daymoy)for the total population
during the total period, c: Off days waiting time distribution p(∆t) of mobile phone activities, legend
symbols are used to distinguish the unique days and the curve of their mean (Daymoy) for the total
population during the total period.
where (∆t / ∆���is the average inter-event time of the total individuals (population) as ∆�� =1431������ , then compute exponential distribution probability for the total data. Accordingly,
identify the general pattern law of the population.
Exponential distribution (probability distribution) is capable of modeling the events happened
randomly over time. In this case, it is able to describe the inter-event time and the average of
inter-event time [47, 54, 51, 53] of individuals' activities with PDF (Probability Density
Function) as in equation (3). However, the cutoff distribution is determined by the maximum
observed inter-event time at which the individual can wait to make any mobile activities, where
it is ∆t = 1431������ . The developed algorithm to compute probability distributions of
activities and displacements by inter-Event Times has "��# + 2�% + �� complexity, and it is
implemented with Matlab2015 platform. &��|(� = 1( �)* ……�3�
Informatics Engineering, an International Journal (IEIJ), Vol.4, No.2, June 2016
38
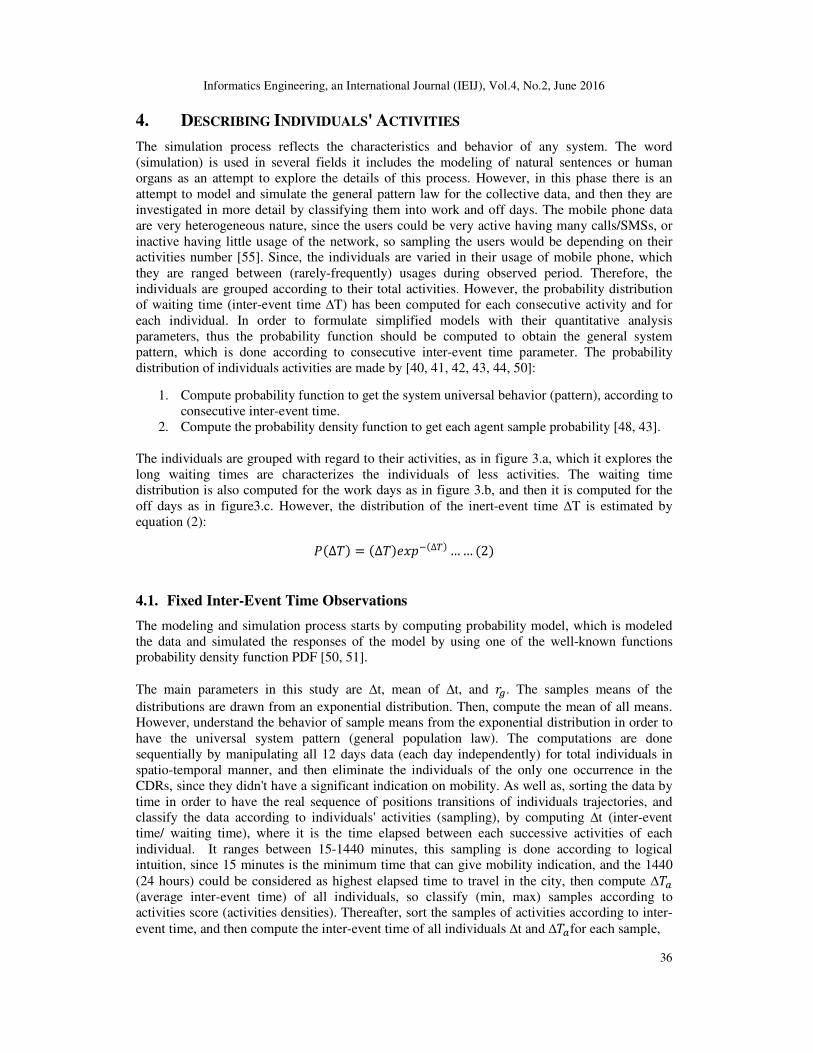
As well as, the displacement statistics �∆��has been computed for the total individuals
(population) during the observed period. As in figure 4.a the displacements distribution is
computed. Also, it is computed for work days as in figure 4.b, and computed for off days as in
figure 4.c. However, the ∆r is the covered distance between each two successive activities during
time ∆t, where it is in the range20 − 1440������ , the investigated distance would be limited
by the maximum distance that could be traveled by individuals in the ∆�. Hence, the cutoff
distribution is determined by the maximum observed distance at which the individual can travel,
where it is ∆� = 7.23e + 04m along day hours, since the maximum time slice couldn't exceed 24ℎ1�� with regards to observed region. The consequence is the �∆�� distributions for
different ∆� follows truncated power law, as in equation (4). ��∆�� = �∆�����∆2� …… �4�
The distribution of �� uncovers the population heterogeneity, where individuals traveled in P(��)
in (long/short) distances regularly within ��(t) as formulated in equation (5). which refers to the
center of mass of the individual trajectory.
��� = 3 1�4����5�26789− 2:;789�%<:7=>?
…… �5�
Where 26789 refers to i=1...�4���� positions recorded for individual a, and 2:;789 = ?<:7�A�∑ 26789<:7=>?
,
The distribution P(��) produces power law investigated in the aggregated traveled distance
(displacements) distribution P(��) as in equation (6). C��D = C��D��C2ED …… �6�
The developed algorithm to compute radius of gyration distribution has "��% + 4��complexity,
and it is implemented with Matlab2015 platform. Whereas, the C��D is computed for total
population along observed period, in order to classify the �� evolution along the time series, as
figure 5.a shows the ��G variance along time, they are approximately similar in their patterns,
also the highest ��G are the small once ranged�5 − 20�, while the range �25 − 30� are the
lowest once to indicate that individuals who have the tendency to mobile in small ��G and in
stable patterns along observed period. As well as, the distribution of ��G along time is computed
for the data of work days and for off days as in figures 5.b, 5.c respectively.
4.2. Trajectories in Intrinsic Reference Frame
The significant importance of revealing human trajectories enforces the tendency to build the
statistical models. Human trajectories have random statistical patterns; hence tracing human
daily activities is the most challengeable issue, in addition to its importance, which is mentioned
earlier as urban planning, spread epidemics... etc. In spite of data sources variance (billing
system, GSM, GPS), but the common characteristics are the aggregated jump size (∆�), and
waiting time (∆�) distributions. Where, (∆�) gives an indication on the covered distances by an
individual in (∆�) for each two consecutive activities, and the (∆�) is the time spent by the
Informatics Engineering, an International Journal (IEIJ), Vol.4, No.2, June 2016
39
Fig. 4: Displacements distribution in mesoscopic perspective: a: Displacements distribution �∆�� for
waiting times �∆��, cutoff distribution is determined by the maximum distance traveled by individuals for
specific inter-event-times, each day has its own curve and the curve of days mean is (DayAve) [77], b:
Work days displacements distribution p(∆r) for waiting times (∆t), cutoff distribution is determined by the
maximum distance traveled by individuals for specific inter-event-times, each day has its own curve and
the curve of days mean is (Daymoy), c: Off days displacements distribution p(∆r) for waiting times (∆t),
cutoff distribution is determined by the maximum distance traveled by individuals for specific inter-event-
times, each day has its own curve and the curve of days mean is (Daymoy).
individual between each two consecutive activities [53]. The individual's trajectory considered as
the microscopic level of mobility abstraction, which is constituted of sequenced coordinates
positions along the time, i.e. the agent displacement in spatio-temporal unit. Therefore, the
consecutive phone activities are good proxies to compute individuals travel distances
(displacements) [30, 53, 54, 57, 35]. These distributions are overlapped for groups, however the
radius of gyration (��) is considered to be a more dedicated feature that capable of characterizing
the travel distances (∆r) of individuals. The distributions showed that the (∆r) of individuals are
almost identical, where the periodic trajectories are invariant. As well as, the activities
distributions are uncovered the similarities of regular patterns, during the time evolution of
radius of gyration (��). The experiments revealed the possibility of classifying individuals
activities into some patterns samples. As well as, almost individuals have similar activities
patterns, and these activities in general could be varied depending on the days either working or
off days.
5. INDIVIDUAL TRAJECTORY CHARACTERISTICS
The individuals activities sparseness causes incomplete spatial information, therefore the mobile
individual has some general physical characteristics, which are useful to compensate the lack of
data (when no activity recorded), and that could be used to build a mathematical model of human
mobility patterns. In order to reconstruct the individual trajectory even if there is no mobile

Informatics Engineering, an International Journal (IEIJ), Vol.4, No.2, June 2016
40
activity (no data), so the most common mobility characteristics are used. They are as follows [55,
56, 57, 58, 32, 61, 24, 59]:
1. Center of mass: It’s the most visited positions by individual HI, as in equations (7-8)
respectively: �4I = 5 �= �⁄ … … (7)<
=>?
K4I = 5 K= �⁄ … … (8)<=>?
Fig. 5: Radius of gyration distribution in mesoscopic perspective: a: M� Distribution based on time series
during observed period, b: Rg distribution based on time series during work days period, c: Rg distribution
based on time series with loglog during off days period.
Where �= and K= are the coordinates of the spatial positions, � is the number of spatial positions,
that are recorded in the CDRs.
2. Radius of Gyration: It is the average of all individual's positions, which is the indication
of the area visited by the individual (traveled distance during the time ) as in equation (5)
3. Most frequent positions to uncover the individual tendency, according to visited
locations.
4. Principal axes N (moment of inertia): This technique makes it possible to study some
individuals trajectories in a common reference frame, by diagonalizing each of trajectory
Informatics Engineering, an International Journal (IEIJ), Vol.4, No.2, June 2016
41
inertia tensor, hence to compare their different trajectories. Moment of inertia to any
object is obtained from the average spread of the mass of an object from a given axis.
This could be elaborated using two dimensional matrix called tensor of inertia. Then, by
using standard physical formula, the inertia tensor of individual's trajectories could be
obtained, as in the equations (9-14) respectively: O = P O)) O�KOK� OKKQ … ... (9)
O)) = ∑ K=%<=>? … ... (10) ORR = ∑ �=%<=>? … … (11) O)R = OR) = − ∑ �=K=<=>? … … (12)
µ = S4O)R OR) + O))% − 2O))ORR + ORR% … …. (13)
Obtaining the following equation (19): cos N = − O)R (1 2O))⁄ − 1 2ORR + 1 2⁄⁄ µ)? ?
W?X YZ[\(] \YZZ⁄ ^] \Y[[_] \` a⁄ )\
… … (14)
Rotation by θ produced a conditional rotation of 180° as the most frequent position lays in � >0.
5. Standard Deviation: To verify the horizontal and vertical coordinates of individual
mobility in the intrinsic reference frame. However, trajectories are scaled on intrinsic
axes using standard deviation of the locations for each individual a, as in equations (15-
16) respectively.
c)� = S ?<:7 ∑ ��=� − �4I� �%<:7=>? …… (15)
cR� = S ?<:7 ∑ �K=� − K4I� �%<:7=>? …… (16)
Then, obtain the universal density function using the following equation (18):
ɸ̃ =�� c)⁄ , K cR⁄ � ...... (18)
By using the spatial density function to aggregate the individuals with the common ��e. Then,
individuals had been chosen from different classified groups with regard to their radius of
gyration, the trajectories would be rescaled for a group of individuals according to the mobility
characteristics mentioned above. The potential trajectory of the individual has been made to
visualize and analyze the mobility of 3 individuals during observed period. However, the
individuals had been chosen, according to their pertinence of ��, where each one is elected
randomly from the unique �� sample, then the potential trajectories of the individuals ( ��f�g�f�hi?, individual, ��f�g�f�hi#) are chosen from M�\, M�o, M�]p respectively, then
computed and simulated in off days as in figure 6 and in work days as in and figure 7
respectively.

Informatics Engineering, an International Journal (IEIJ), Vol.4, No.2, June 2016
42
Fig. 8: Estimated individuals' trajectories within intrinsic reference frame in microscopic perspective
during off days with red circle refers to most frequent position: a: Individual trajectory chosen from M�\, b:
individual scaled trajectory chosen from M�\, c: Individual trajectory chosen from M�o, d: Individual scaled
trajectory chosen from M�o, e: Individual trajectory chosen from M�]p, f: Individual scaled trajectory
chosen from M�]p.

Informatics Engineering, an International Journal (IEIJ), Vol.4, No.2, June 2016
43
Fig. 9: Estimated individuals' trajectories within intrinsic reference frame in microscopic perspective
during work days with red circle refers to most frequent position: a: Individual trajectory chosen from M�\,
b: individual scaled trajectory chosen from M�\, c: Individual trajectory chosen from M�o, d: Individual
scaled trajectory chosen from M�o, e: Individual trajectory chosen from M�]p, f: Individual scaled trajectory
chosen from M�]p.
6. Conclusions
This research aimed to understand human mobility using the CDRs. The investigation endorsed
that mobile phone activities can reflects individuals density, also could act as a feature of
grouping the total number of mobile network users, hence each group will have its own feature.
Individuals density and dense variance between the sub-areas could be estimated in order to
explore the tendency or the orientation of individuals in these areas, but almost in a static
manner.
As well as, it is concluded that the most common parameters of modeling human mobility (inter-
event time ∆t, travel distance (displacement) ∆r and radius of gyration ��) are represented by the
power-law distribution. These parameters can reveal mobility patterns of the evolved population.
This study confirmed that radius of gyration (��) is the most common quantity, which is
associated with human mobility trajectories, due to its capability in measuring the how far the
Informatics Engineering, an International Journal (IEIJ), Vol.4, No.2, June 2016
44
mass from the center of mass. However, in this case study it is gradually increased at the
beginning, but it settles down versus time. It has a key effect on the travel distance (∆r)
distributions.
It is recommended that further research be undertaken in the following areas: Perform more
mobility analysis for extracting new human mobility parameters to make a more detailed
description for individuals behavior. Use more comprehensive statistical methods to construct
human models for the society via CDRs. Analyze more CDRs data for the same region, but in
time periods other than Armada period, so the comparison between the two cases can be more
useful to describe the Armada impact on the city.
REFERENCES
[1] Francesco Calabrese, Mi Diao, Giusy Di Lorenzo, Joseph Ferreira, Jr. Carlo Ratti, Understanding
Individual Mobility Patterns from Urban Sensing Data: A Mobile Phone Trace Example, Elsevier,
September, 2012.
[2] Lin Sun, Enabling Pervasive Applications by Understanding Individual and Community
Behaviors, Université Pierre & Marie Curie-TELECOM SudParis, December,2012.
[3] Thomas Couronné, Zbigniew Smoreda, Ana-Maria Olteanu, Chatty Mobiles\: Individual Mobility
and Communication Patterns, Analysis of Mobile Phone Datasets and Networks, Oct. 10-11,
2011, MIT, Cambridge, MA, 2011.
[4] John Steenbruggen, EmmanouilTranos, PeterNijkamp, Data from Mobile Phone Operators:A tool
for Smarter Cities?, Elsevier Volume 39, Issues 3–4, May 2015, Pages 335–346, 2014.
[5] Guangnian Xiao, Zhicai Juan, Chunqin Zhang, Travel mode detection based on GPS track data
and Bayesian networks, Computers, Environment and Urban Systems, 2015.
[6] Behadili Suhad Faisal, Cyrille Bertelle, Loay Edwar George, Visualization of People Attraction
from Mobile Phone Trace Database: A Case study on Armada 2008 in French City of Rouen,
Proceedings of the 1st International Engineering Conference On Developments in Civil &
Computer Engineering Applications, 2014.
[7] Nirajan Shiwakoti, Majid Sarvi, Geoff Rose, Modelling Pedestrian Behaviour Under Emergency
Conditions State-of-the-Art and Future Directions, Institute of Transport Studies, Monash
University, 2008.
[8] Yikang Rui, Urban Growth Modeling Based on Land-use Changes and Road Network Expansion,
Doctoral Thesis in Geodesy and Geoinformatics with Specialization in Geoinformatics Royal
Institute of Technology Stockholm, Sweden, 2013.
[9] Armando Bazzani, Massimiliano Capriotti, Bruno Giorgini, Giuseppina Melchiorre, Sandro
Rambaldi, Graziano Servizi, Giorgio Turchetti, A Model for Asystematic Mobility in Urban
Space, Laboratory of Fisica della Città, University of Bologna, Italy, book The Dynamics of
Complex Urban Systems An Interdisciplinary Approach, Physica-Verlag Heidelberg, 2007.
[10] Michel Nabaa, Morphodynamique De Reseaux Viaires Application Au Risque}", Le Havre
University, 2011.
[11] Markus Schlapfer, Luis M. A. Bettencourt, Sebastian Grauwin, Mathias Raschke, Rob Claxton,
Zbigniew Smoreda, Geoffrey B. West, Carlo Ratti, The Scaling of Human Interactions with City
Size, Physics, July, 2014.
[12] Dapeng Li, Thomas J. Cova, Philip E. Dennison, A household-level approach to staging wildfire
evacuation warnings using trigger modeling, Computers, Environment and Urban Systems, 2015.
[13] Christian M. Schneider, Christian Rudloff, Dietmar Bauer, Marta C. González, Daily Travel
Behavior: Lessons from a Week-Long Survey for The Extraction of Human Mobility Motifs
Related Information, UrbComp '13 Proceedings of the 2nd ACM SIGKDD International
Workshop on Urban Computing article No.3, 2013.
[14] Héctor A. López-Ospina, Francisco J. Martínez b, Cristián E. Cortés, Microeconomic model of
residential location incorporating life cycle and social expectations, Computers, Environment and
Urban Systems, 2015.
[15] Rawan Ghnemat, Cyrille Bertelle, Gérard H.E. Duchamp, Self-Organization Simulation over
Geographical Information System Based on Multi-Agent Platform, book Complex Systems and
Self-Organization Modelling, Springer, 2009.

Informatics Engineering, an International Journal (IEIJ), Vol.4, No.2, June 2016
45
[16] Sankar Saravanan Subramanians, Geo-based Mobility Control for Mobile Traffic Simulators,
Doctoral Thesis in Geodesy and Geoinformatics with Specialization in Geoinformatics Royal
Institute of Technology Stockholm, Sweden, September, 2013.
[17] Armando Bazzani, Bruno Giorgini, Sandro Rambaldi, Modeling Urban Mobility for E-
Governance with Low Energy Complexity, Green Engineering P. 67-87,2010.
[18] ClusterSeer Software, ClusterSeer Software for The Detection and Analysis of Event Clusters,
User Manual Book1, version 2.5, BioMedware geospatial research and software, 2012.
[19] ClusterSeer Software, ClusterSeer Software for The Detection and Analysis of Event Clusters,
User Manual Book 2, version 2.5, BioMedware geospatial research and software, 2012.
[20] Raubal, Martin , mraubal , Axhausen, KayW., Yuan,Yihong, Goulias, Konstadinos, yriakidis,
Phaedon,Liu, Yu, liuyu, Characterizing Human Mobility from Mobile Phone Usage, ETH
Research Database, 2014.
[21] Roberto Trasarti, Ana-Maria Olteanu-Raimond, Mirco Nanni, Thomas Couronne, Barbara
Furletti, Fosca Giannotti, Zbigniew Smoreda, Cezary Ziemlicki, Discovering urban and Country
Dynamics from Mobile Phone Data with Spatial Correlation Patterns, Telecommunications Policy
archive, Volume 39 Issue 3, May 2015, Pages 347-362, 2015.
[22] http://www.armada.org/en/armada/historique/2008-l-armada-rouen-2008, April, 2014.
[23] http://rouen-armada-2013.soft112.com/, April, 2014.
[24] http://www.thefreelibrary.com/NORMAN+ARMADA%3B+TOM+Bodden+at+the+Tall+Ships+
festival+in+Rouen, April, 2014.
[25] http://www.armada.org/en/armada/historique/naissance-d-une-idee, April, 2014.
[26] http://www.meretmarine.com/fr/content/le-port-de-rouen-se-prepare-accueillir-larmada, April,
2014.
[27] http://www.drakkaronline.com/article62430.html, April, 2014.
[28] Alexander Amini, Kevin Kung, Chaogui Kang, Stanislav Sobolevsky, Carlo Ratti, The Impact of
Social Segregation on Human Mobility in Developing and Urbanized Regions, SENSEable City
Laboratory, Massachusetts Institute of Technology, Cambridge, MA, 02139, January, 2014.
[29] V. Soto, V. Frias-Martinez, J. Virseda and E. Frias-Martinez, Prediction of Socioeconomic
Levels using Cell Phone Records, 19th International Conference, UMAP 2011, Girona, Spain,
July 11-15, 2011.
[30] Elissalde B., Lucchini F., Freire-Diaz S., Mesurer la ville éphémére, Données Urbaines, 6,
Pumain D., Mattei M-F. (eds), Anthropos, Economica, pp 105-122, 2011.
[31] Elissalde B., Lucchini F., Freire-Diaz S. Caractériser l’attractivité des quartiers urbains par les
données de téléphonie mobile. L’Information géographique, n°1, Vol. 77, 2013, 44-62, 2013.
[32] Lucchini F., Bernard Elissalde, Sylviano-Freire-Diaz S, From the Event to the Ephemeral City,
mesm 2011 conference, Amman, Jordan, Nov. 14-16, 2011, pp 88-95, 2011.
[33] Marcos R. Vieira, Vanessa Frias-Martinez, Nuria Oliver, Enrique Frias-Martinez, Characterizing
Dense Urban Areas from Mobile Phone-Call Data: Discovery and Social Dynamics, Social
Computing (SocialCom), 2010 IEEE Second InternationalSocial Computing (SocialCom), 2010
IEEE Second International Conference, 2010.
[34] Gunther SAGL, Bernd RESCH, Bartosz HAWELKA, Euro BEINAT, From Social Sensor Data to
Collective Human Behaviour Patterns- Analysing and Visualising Spatio-Temporal Dynamics in
Urban Environments, GI_Forum 2012: Geovizualisation, Society and Learning. © Herbert
Wichmann Verlag, VDE VERLAG GMBH, Berlin/Offenbach. ISBN 978-3-87907-521-8., 2012.
[35] Corina Iovan, Ana-Maria Olteanu-Raimond, Thomas Couronn\é, Zbigniew Smoreda, Moving and
Calling: Mobile Phone Data Quality Measurements and Spatiotemporal Uncertainty in Human
Mobility Studies, Springer International Publishing Switzerland, 2013.
[36] Elijah Meeks, Possibility and Probability in Geospatial Information Visualization, digital
humanities specialist at Stanford University, 2012.
[37] Balázs Cs. Csájia, Arnaud Browetc, V.A. Traagc, Jean-Charles Delvennec, Etienne Huensc, Paul
Van Doorenc, Zbigniew Smoredae, Vincent D. Blondelc, Exploring the Mobility of Mobile
Phone Users, Physica A 392(6), pp. 1459-1473 2013.
[38] Santi Phithakkitnukoon, Zbigniew Smoreda, Patrick Olivier, Socio-Geography of Human
Mobility: A Study Using Longitudinal Mobile Phone Data, PLOS, Volume 7 | Issue 6 | e39253,
July, 2012.
[39] Vanessa Frias-Martinez, Cristina Soguero, Enrique Frias-Martinez, Estimation of Urban
Commuting Patterns Using Cellphone Network Data,
Informatics Engineering, an International Journal (IEIJ), Vol.4, No.2, June 2016
46
[40] UrbComp \'12 Proceedings of the ACM SIGKDD International Workshop on Urban Computing
Pages 9-16, 2012.
[41] Zahedeh Izakiana, Mohammad Saadi Mesgaria, Ajith Abrahamb, Automated clustering of
trajectory data using a particle swarm optimization, Computers, Environment and Urban Systems,
2015.
[42] Jie Lina, Robert G. Cromley, A local polycategorical approach to areal interpolation, Computers,
Environment and Urban Systems, 2015.
[43] Dani Broitman, Eric Koomen, Residential density change: Densification and urban expansion,
Computers, Environment and Urban Systems, 2015.
[44] Roberto Molowny-Horasa, Corina Basnoua, Joan Pinoa, A multivariate fractional regression
approach to modeling land use and cover dynamics in a Mediterranean landscape, Computers,
Environment and Urban Systems, 2015.
[45] Ryan Bravo, Research technical paper, summer research, August, 2006.
[46] Darakhshan J. Mir, Sibren Isaacmany, Ramon Caceres, Margaret Martonosi, Rebecca N. Wright,
DP-WHERE: Differentially Private Modeling of Human Mobility, IEEE BigData 2013.
[47] Siqi Shen, Niels Brouwers, and Alexandru Iosup, Human Mobility in Virtual and Real
Worlds:Characterization, Modeling, and Implications, report number PDS-2011-007, ISSN 1387-
2109, November, 2011.
[48] CS302 Lecture notes, CS302 Lecture notes, Simulating Random Events,
[49] http://web.eecs.utk.edu/~leparker/Courses/CS302-all06/Notes/PQueues/random\_num\_gen.html ,
2015.
[50] Stat414, Probability Theory and Mathematical Statistics, STAT 414/415,
[51] https://onlinecourses.science.psu.edu/stat414/node/97, April, 2015.
[52] solver, Simulation Tutorial Introduction,
[53] http://www.solver.com/simulation-tutorial, April, 2015.
[54] Ilya Narsky, Frank C. Porter, Statistical Analysis Techniques in Particle Physics, Fits, Density
Estimation and Supervised Learning, Wiley-VCH; 1 edition December 23, 2013.
[55] Sougata Biswas, Simulation of Exponential Distribution using R,
[56] https://rstudio-pubs-
tatic.s3.amazonaws.com/26693\_e1151035722942b2813c0063c6b220ae.html, August, 2014.
[57] Vincent Zoonekynd, Probability Distributions, http://zoonek2.free.fr/UNIX/48\_R/07.html,
April, 2015.
[58] Marta C. González, Cesar A. Hidalgo, Albert-Laszlo Barabasi,
[59] Understanding individual Human Mobility Patterns, nature 453, 2009.
[60] Stat, Chapter 10, Simulation: An Introduction,
http://www.stat.nus.edu.sg/~zhangjt/teaching/ST2137/lecture/lec%2010.pdf, 2015.
[61] Chaoming Song, Tal Koren, Pu Wang, Albert-Laszl\'o Barabasi, Modeling the Scaling Properties
of Human Mobility, nature physics, 2010.
[62] Christian M. Schneider, Vitaly Belik, Thomas Couronné, Zbigniew Smoreda, Marta C. Gonzalez,
Unravelling Daily Human Mobility Motifs, Royal Society, 2013.
[63] Vanessa Frias-Martinez, Alberto Rubio, Enrique Frias-Martinez, Measuring the Impact of
Epidemic Alerts on Human Mobility using Cell-Phone Network Data,
[64] Second Workshop on Pervasive Urban Applications Pervasive'12, Newcastle, UK, 2012.
[65] Xiao-Yong Yan, Xiao-Pu Han, Tao Zhou, Bing-Hong Wang,
[66] Exact Solution of Gyration Radius of Individual's Trajectory for a Simplified Human Mobility
Model, Physics, 2010.
[67] Marta C. González, Cesar A. Hidalgo, Albert-Laszlo Barabasi, Understanding Individual Human
Mobility Patterns Supplementary Material, nature, 2008.
[68] Farnaz Fathali, Hatairatch Charoenkulvanich, Human-Mobility Modeling for Cellular Networks,
Electrical Engineering Advanced level, Stockholm, Sweden, 2013.
[69] Pu Wang, Marta C. Gonzalez, Supporting Online Material, Science Express,
http://mobilephonevirus.barabasilab.com/paper/som.pdf, April, 2009.
[70] Fosca Giannotti, Luca Pappalardo, Dino Pedreschi, Dashun Wang, A complexity Science
Perspective on Human Mobility, http://www.dashunwang.com/pdf/2012-mobilitybook.pdf, 2012.
[71] James P. Bagrow, Tal Koren, Investigating Bimodal Clustering in Human Mobility, IEEE, 2009
International Conference on Computational Science and Engineering, 2009.
Informatics Engineering, an International Journal (IEIJ), Vol.4, No.2, June 2016
47
[72] Julian Candia, Marta C Gonzalez, Pu Wang, Timothy Schoenharl, Greg Madey, Albert-Laszlo
Barabasi, Uncovering Individual and Collective Human Dynamics from Mobile Phone Records,
Physics, May, 2008.
[73] Albert-Laszlo Barabasi, From Network Science to Human Dynamics, The first of CEE's
DES4:Distinguished Engineering and Science Speaker Seminar Series, Nov 3,2011.and in
Northeastern University, Harvard Medical School, 2011.
[74] Thomas Couronné, Zbigniew Smoreda, Ana-Maria Olteanu, Individual Mobility and
Communication Patterns, Analysis of Mobile Phone Datasets and Networks, NETMOB
conference, MIT, Cambridge, MA, Oct. 10-11, 2011.
[75] Michele Tizzoni, Paolo Bajardi, Adeline Decuyper, Guillaume Kon Kam King, Christian M.
Schneider, Vincent Blondel, Zbigniew Smoreda, Marta C. Gonzalez, Vittoria Colizza, On the Use
of Human Mobility Proxies for Modeling pidemics, PLOS Computational Biology, 2014.
[76] Olle Jarva, Rein Ahasa, Frank Witloxb, Understanding Monthly Variability in Human Activity
Spaces: A Twelve-Month Study Using Mobile Phone Call Detail Records, Elsevier, 2013.
[77] Suhad Faisal Behadili, Cyrille Bertelle, Loay E. George, Human Mobility Patterns Modelling
using CDRs, International Journal of UbiComp (IJU), Vol.7, No.1, 2016.
[78] Suhad Faisal Behadili, Cyrille Bertelle, Loay E. George, Modelling Dynamic Patterns using
Mobile Data, Sixth International Conference on Computer Science, Engineering and Applications
(CCSEA 2016, 2016.