adaptive threshold qrs detector with best channel ...cinc.mit.edu/archives/2007/pdf/0157.pdfadaptive...
TRANSCRIPT

Adaptive Threshold QRS Detector with Best Channel
Selection Based on a Noise Rating System
F Chiarugi
1, V Sakkalis
1, D Emmanouilidou
1,2, T Krontiris
1,2,
M Varanini3, I Tollis
1,2
1Institute of Computer Science, FORTH, Heraklion, Crete, Greece
2Computer Science Department, University of Crete, Heraklion, Crete, Greece
3Institute of Clinical Physiology, National Research Council, Pisa, Italy
Abstract
QRS detection performance can depend on the type of
noise present in each lead involved in the overall
processing. A common approach to QRS detection is
based on a QRS enhanced signal obtained from the
derivatives of the pre-filtered leads. However, the signal
pre-filtering cannot be able to perform a complete noise
rejection and the use of derivatives can enhance the noise
as well. In many cases the noise occurs only on one lead
and the addition of a noisy lead to the QRS enhanced
signal decreases the overall detection performances of
the QRS detector. For this reason the noise estimation on
each channel, providing information for the channel
inclusion or rejection in building the QRS enhanced
signal, can improve the overall performances of the QRS
detector.
The results have been evaluated on the 48 records of
the MIT-BIH Arrhythmia Database where each ECG
record is composed by 2 leads sampled at 360 Hz for a
total duration of about 30 minutes. The annotated QRSs
are 109494 in total. The results have been very satisfying
on all the annotated QRSs and, with the inclusion of an
automatic criterion for ventricular flutter detection, a
sensitivity=99.76% and a positive predictive
value=99.81% have been obtained.
1. Introduction
QRS detection in electrocardiograms (ECGs) is the
basic step for any further processing. Usually the limited
number of available leads can be an obstacle to the
attainment of high performances for a QRS detection
algorithm especially when there is a high noise in one or
more of the available leads. Noise in ECGs can appear
due to several different sources like poor contact between
the electrode and the skin, patient movements or
breathing, etc. All these different sources can produce
different types of noise like a) baseline wandering, b)
powerline interference, c) muscle artifacts, d) spikes, e)
sudden baseline shifts. In several circumstances the noise
can appear only in one or few leads, while the others have
a good-quality signal. A common approach to time-based
methods for QRS detection is through the QRS
enhancement achieved in a QRS enhanced signal (QeS)
based on the derivatives of pre-filtered leads. The
contribution of the noisy channel to the QeS can strongly
deteriorate the performances of the overall algorithm.
Thus, the estimation of the noise level in each channel
with a criterion for the best channel selection (excluding
the noisy channels from the algorithm) can improve the
total performances of the QRS detector.
In this paper the methods used for the QRS detection,
noise estimation and best channel selection, and the
results obtained on the entire MIT-BIH arrhythmia
database are reported. Finally, further improvements are
discussed in the final section.
2. Methods
Real data (surface ECGs) have been used from the
MIT-BIH Arrhythmia Database [1] for a total of 48
records. The records are half-hour excerpts of two-
channel ambulatory ECG recordings obtained from 47
subjects studied by the BIH Arrhythmia Laboratory
between 1975 and 1979. The recordings are digitized at
360 Hz with 11-bit resolution over a 10 mV range. Each
beat of each record has a reference annotation identifying
the QRS position and type.
Several different techniques can be applied for QRS
detection [2]. The selected approach belongs to the time-
domain techniques and is derived from the simple QRS
detector used in the Computers in Cardiology/PhysioNet
challenge 2004 [3]. The first step consists in a signal pre-
filtering using a moving-average linear filter in order to
reduce the baseline wandering and the high-frequency
noise, and to select the typical frequencies contained in
the QRS complexes. Several different bands have been
tested and the most appropriate results 5-15 Hz [4].
The QeS is built as the sum of the absolute derivatives
of each pre-filtered channel. The filter for the generation
ISSN 0276−6574 157 Computers in Cardiology 2007;34:157−160.
of the derivatives has been chosen trying to reduce the
effect of the high frequency residual noise. In practice a
pass-band filter is used with a derivative behaviour in the
band of interest.
An adaptive threshold is initially set up as 40% of the
average QeS peaks in windows of 2 sec discharging the
cases out of the 98% percentiles. The average QeS peak
(QeSap) is continuously updated after each QRS
detection using the QeS peak (QeSp) detected in the
current QRS with the formula (n is the progressive
number of the detected QRS):
If
QeSp(n) >= 1.5*QeSap(n-1)
Then
QeSap(n) = 0.97*QeSap(n-1) + 0.045*QeSap(n-1)
Else
QeSap(n) = 0.97*QeSap(n-1) + 0.03*QeSp(n)
End
The beginning of a QRS is detected when the QeS
overcomes the threshold (0.4*QeSap(n-1)) while the end
of the QRS is revealed when the QeS goes down to the
threshold and remains down for a sufficient number of
consecutive samples.
To avoid False Positives (FP) due to high T-waves
detection, a dead-time zone of 200 msec is set up in order
to reject any QRS detection too close to the previous one.
Furthermore, the QRS detection threshold is artificially
increased after detecting a QRS peak and linearly
decreased, with the time-distance from the previous QRS,
to its base value. The QeS and the detection threshold in
an excerpt of record 100 are shown in Fig. 1.
Figure 1. QeS and detection threshold for record 100 (on
the abscissa there is the time expressed in seconds).
Using only the above algorithm the QRS detection
results are good enough especially in recordings with low
or medium content of noise. However, when the noise in
one or both leads is high, the performances of the
detector are significantly reduced.
It has been decided to take into account the impact of
the noise in the QRS detection as already done in other
studies [5], but with a different approach. In fact, it has
been observed that, when the noise is present only in one
channel, the exclusion of this noisy channel from the QeS
improves the QRS detection results.
The noise level of each ECG lead is estimated with the
following procedure. For each detected beat, the QRS
average power is estimated as the square average of the
samples in a 100 msec interval located around the
detected R-peak. The T-P interval power is evaluated as
the square average of the samples in an interval obtained
by rough estimation of the end of T-wave and the onset
of the following P-wave [6].
For each detected QRS a noise index (NI) is defined as
the T-P interval average power divided by the QRS
average power. The NI is quantized in three levels:
NI<0.1 (low); 0.1<NI<0.2 (intermediate); NI>0.2 (high).
The weights 0, 1, 2 are respectively assigned to each of
these levels and, for any interval of an ECG, the Noise
Score (NS) is estimated averaging the weights of the
QRSs detected in that interval.
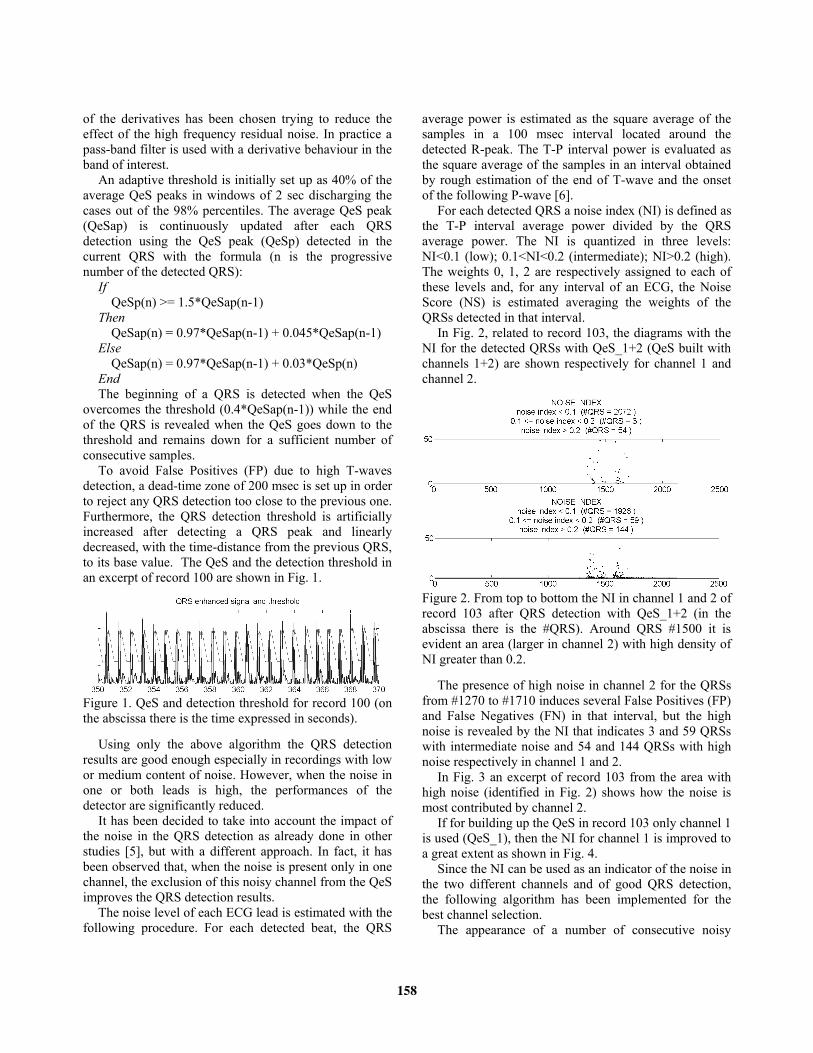
In Fig. 2, related to record 103, the diagrams with the
NI for the detected QRSs with QeS_1+2 (QeS built with
channels 1+2) are shown respectively for channel 1 and
channel 2.
Figure 2. From top to bottom the NI in channel 1 and 2 of
record 103 after QRS detection with QeS_1+2 (in the
abscissa there is the #QRS). Around QRS #1500 it is
evident an area (larger in channel 2) with high density of
NI greater than 0.2.
The presence of high noise in channel 2 for the QRSs
from #1270 to #1710 induces several False Positives (FP)
and False Negatives (FN) in that interval, but the high
noise is revealed by the NI that indicates 3 and 59 QRSs
with intermediate noise and 54 and 144 QRSs with high
noise respectively in channel 1 and 2.
In Fig. 3 an excerpt of record 103 from the area with
high noise (identified in Fig. 2) shows how the noise is
most contributed by channel 2.
If for building up the QeS in record 103 only channel 1
is used (QeS_1), then the NI for channel 1 is improved to
a great extent as shown in Fig. 4.
Since the NI can be used as an indicator of the noise in
the two different channels and of good QRS detection,
the following algorithm has been implemented for the
best channel selection.
The appearance of a number of consecutive noisy
158

QRSs (noise index greater than 0.1) determines the
beginning of a Noisy Interval (No.In.), which ends once a
few consecutive non-noisy QRSs appear. Based on the
detected QRSs with QeS_1+2, the No.In. of channel 1
(No.In._1) and the No.In. of channel 2 (No.In._2) are
calculated, and the total No.In. are evaluated as the union
of No.In._1 and No.In._2. For each unified interval, the
overlap percentages with channel 1 and channel 2 are
calculated. For example, if a No.In. comes exclusively
from channel 1, then the overlap percentage is 100% for
channel 1 and 0% for channel 2.
Figure 3. An excerpt of record 103 from the area with
high noise identified in Fig. 2. It is evident how the noise
is mostly contributed by channel 2.
Figure 4. The (QRS and T-P interval) average power and
NI in channel 1 of record 103 after QRS detection with
QeS_1 (in the abscissa there is the #QRS). NI is always
below 0.1.
For the record samples not belonging to any unified
No.In., the QRS detection results with QeS_1+2 are used
(best channel 1+2).
For the samples of each unified No.In., QRS detection
with QeS_1 and QeS_2 are performed as well. Then, the
following criterion is applied (j is the channel with the
lowest overlap percentage and k is the other one):
1) If the NS (QeS_1+2) in channel j is 0, the QRS
detection results with QeS_1+2 are used (best
channel 1+2).
2) If the NS (QeS_j) in channel j is more than 0.75*NS
(QeS_1+2) in the same channel, the QRS detection
results with QeS_1+2 are used (best channel 1+2).
3) If the NS (QeS_j) in channel j is less than 0.75*NS
(QeS_1+2) in channel j, the QRS detection results
with QeS_j are used (best channel j) unless the NS
(QeS_k) in channel k is less than the NS (QeS_j) in
channel j and less than 0.1*NS (QeS_1+2) in channel
k. In such case the QRS detection results with QeS_k
are used (best channel k).
Furthermore, the database includes intervals with
ventricular flutter waves that may be erroneously
detected as QRSs increasing the number of FP. Although
these VFL intervals might be manually excluded from the
QRS detection evaluation, a first implementation of an
automatic detection of the VFL intervals has been
performed in order to obtain a fully automatic algorithm.
Similarly to ventricular fibrillation (VF) [7], the
analysis of VFL can be performed with several different
techniques. However, being the flutter waveforms almost
sinusoidal, a frequency domain approach has been
considered more appropriate.
The raw signals (both channels) are filtered with a
moving average 1-30 Hz pass-band linear filter, with a
Hamming window. Each pre-processed ECG signal of a
record in the database (both channels of the record) is
divided into periods of 5 seconds with a 50% overlap
with the next one. Fourier transform of these intervals is
computed and spectral characteristics as power peak
amplitude and location are used to mark these 5-sec
intervals as VFL or not. Each 5-sec interval marked as
VFL is not considered in the QRS detection algorithm.
3. Results
In the overall database only record 207 contains VFL
intervals. It has 6 VFL intervals for a total of about 142.5
seconds. The proposed algorithm for VFL interval
identification has satisfying performance in all the
records of the database resulting in no FP and only 12.5
seconds of FN intervals.
In Table 1 the results of the overall QRS detection
algorithm, which includes noise estimation, best channel
selection and VFL detection, are reported.
The total number of annotated beats results 109494,
with 109288 TP. FN and FP are respectively 266 and
210. The sensitivity TP/(TP+FN) is 99.76% while the
positive predictive value (PPV) TP/(TP+FP) is 99.81%.
In 15 records a perfect detection without any FN and FP
has been obtained. 12 records have more than 10 FP+FN
and only 5 records more than 30 FP+FN.
4. Discussion and conclusions
The inclusion of best channel selection based on noise
level and the VFL interval identification improves the
performance of the original algorithm used in the
Computers in Cardiology/PhysioNet challenge 2004 [7].
159

The obtained performances have also been compared
with the ones of some published studies. The algorithm
proposed in [3] provides a Sensitivity=99.76% and a
PPV=99.80%, which are substantially the same of our
developed algorithm, but the reported statistic results
were obtained on a subset of the total annotated beats
(about 91000 annotated QRSs). Similarly, the best results
obtained by [4] are Sensitivity=99.74% and
PPV=99.65%, a little lower than the ones obtained with
our algorithm.
Table 1. The results in terms of annotated beats, detected
beats, True Positive (TP), FP and FN for each record of
the MIT-BIH Arrhythmia database. Record Annotat.
beats
(TP+FN)
Detect.
beats
(TP+FP)
True
Positive
(TP)
False
Negative
(FN)
False
Positive
(FP)
100 2273 2273 2273 0 0
101 1865 1867 1862 3 5
102 2187 2187 2184 3 3
103 2084 2094 2083 1 11
104 2229 2230 2222 7 8
105 2572 2592 2555 17 37
106 2027 2030 2027 0 3
107 2137 2134 2131 6 3
108 1763 1792 1758 5 34
109 2532 2530 2530 2 0
111 2124 2125 2124 0 1
112 2539 2539 2539 0 0
113 1795 1795 1795 0 0
114 1879 1879 1879 0 0
115 1953 1958 1951 2 7
116 2412 2396 2393 19 3
117 1535 1535 1535 0 0
118 2278 2279 2278 0 1
119 1987 1988 1987 0 1
121 1863 1863 1863 0 0
122 2476 2476 2476 0 0
123 1518 1518 1518 0 0
124 1619 1613 1609 10 4
200 2601 2598 2593 8 5
201 1963 1898 1898 65 0
202 2136 2134 2134 2 0
203 2980 2968 2947 33 21
205 2656 2649 2649 7 0
207 1860 1892 1852 8 40
208 2955 2947 2936 19 11
209 3005 3002 3000 5 2
210 2650 2631 2628 22 3
212 2748 2743 2743 5 0
213 3251 3250 3250 1 0
214 2262 2261 2259 3 2
215 3363 3361 3361 2 0
217 2208 2207 2206 2 1
219 2154 2154 2154 0 0
220 2048 2048 2048 0 0
221 2427 2427 2427 0 0
222 2483 2481 2480 3 1
223 2605 2605 2605 0 0
228 2053 2053 2052 1 1
230 2256 2256 2256 0 0
231 1571 1571 1571 0 0
232 1780 1782 1780 0 2
233 3079 3074 3074 5 0
234 2753 2753 2753 0 0
It has to be noticed that for the VFL detection
algorithm further improvements can be applied in order
to more precisely identify the start and the end of each
VFL intervals instead of using multiples of 2.5 seconds
and intervals with a length of 5 sec. Such approach
should be able to reduce the number of false QRS
detections with an increment in the total sensitivity.
Furthermore, the developed criteria for the VFL detection
algorithm could be further checked and improved on a
specific annotated database like the Creighton University
Ventricular Tachyarrhythmia Database.
Finally, it has to be mentioned that the implemented
algorithm for noise detection and best channel selection
can be easily extended to situations where the QeS is
built with more than 2 leads.
Acknowledgements
This research work is supported by the European
Community, under the Sixth Framework Programme,
Information Society Technology – ICT for Health, within
the STREP project “HEARTFAID: a knowledge based
platform of services for supporting medical-clinical
management of the Heart Failure within the elderly
population” (IST-2005-027107), 2006-2009.
References
[1] MIT-BIH Arrhythmia Database.
http://www.physionet.org/physiobank/database/mitdb/.
[2] Kohler BU, Hennig C, Orglmeister R. The principles of
software QRS detection. Engineering in Medicine and
Biology Magazine, IEEE Volume 21, Issue 1, Jan.-Feb.
2002:42 - 57.
[3] Chiarugi F, Varanini M, Cantini F, Conforti F, Vrouchos
G. Non-Invasive ECG as a Tools for Predicting
Termination of Paroxysmal Atrial Fibrillation. IEEE
Transactions on Biomedical Engineering. Aug 2007, Vol.
54, No. 8; 1399-1406.
[4] Hamilton PS. Open Source ECG Analysis Software
Documentation. E. P. Limited, Somerville, MA, USA,
2002.
[5] Christov II. Real time electrocardiogram QRS detection
using combined adaptive threshold. BioMedical
Engineering OnLine 2004:3-28.
[6] Talmon JL. Pattern recognition of the ECG: a structured
analysis. PHD thesis at the Vrije Universitet of
Amsterdam, 1983.
[7] Jekova I. Comparison of five algorithms for the detection
of ventricular fibrillation from the surface ECG. Physiol
Meas. 2000; 21:429–39.
Address for correspondence
Franco Chiarugi
Institute of Computer Science, FORTH
PO 1385 Vassilika Vouton
Science & Technology Park of Crete
71110, Heraklion, Crete, Greece
E-mail address: [email protected]
160