adbi working paper series - adb.org · pdf fileadbi working paper series . impact of the...
TRANSCRIPT

ADBI Working Paper Series
IMPACT OF THE PEOPLE’S REPUBLIC OF CHINA’S SLOWDOWN ON THE GLOBAL ECONOMY
Soumyananda Dinda
No. 784 October 2017
Asian Development Bank Institute

The Working Paper series is a continuation of the formerly named Discussion Paper series; the numbering of the papers continued without interruption or change. ADBI’s working papers reflect initial ideas on a topic and are posted online for discussion. Some working papers may develop into other forms of publication.
The Asian Development Bank recognizes “China” as the People’s Republic of China.
In this report, “$” refers to US dollars.
Suggested citation:
Dinda, S. 2017. Impact of the People’s Republic of China’s Slowdown on the Global Economy. ADBI Working Paper 784. Tokyo: Asian Development Bank Institute. Available: https://www.adb.org/publications/impact-prc-slowdown-global-economy Please contact the authors for information about this paper.
Email: [email protected], [email protected]
I am grateful to Prof. Yanrui for his valuable comments and suggestions on the earlier draft. I am also grateful and thankful to Prof. Lee, Prof. Zhang, Prof. Feng, Prof. Wang, Prof. Barro, Dr. Morgan, Dr. Abiad, Dr. Mallick, and other conference participants for their comments at ADB Institute, Tokyo, Japan, during the period 25–26 November 2015.
Soumyananda Dinda is a professor at the Department of Economics, University of Burdwan, West Bengal, India. The views expressed in this paper are the views of the author and do not necessarily reflect the views or policies of ADBI, ADB, its Board of Directors, or the governments they represent. ADBI does not guarantee the accuracy of the data included in this paper and accepts no responsibility for any consequences of their use. Terminology used may not necessarily be consistent with ADB official terms. Working papers are subject to formal revision and correction before they are finalized and considered published.
Asian Development Bank Institute Kasumigaseki Building, 8th Floor 3-2-5 Kasumigaseki, Chiyoda-ku Tokyo 100-6008, Japan Tel: +81-3-3593-5500 Fax: +81-3-3593-5571 URL: www.adbi.org E-mail: [email protected] © 2017 Asian Development Bank Institute

ADBI Working Paper 784 S. Dinda
Abstract Across the world, researchers and business analysts are closely watching the People’s Republic of China (PRC), especially its recent economic slowdown. The Asia and Pacific region is extremely anxious about the PRC’s slowdown, but the rest of the world has a definite reason to worry about the consequences of the slowdown in the world’s second-largest economy. During the last few decades, the PRC has integrated strongly with Asia and also with the rest of the world. This paper investigates what the impact of the PRC’s slowdown on the global economy is. If there is a crisis in the PRC, how much does it affect developed and emerging or developing economies? Using a panel data model, this paper focuses on these issues. The study considers international linking variables for the period 2000–2012. Evidence based on panel data analysis for six developed countries (G6: the United States, the United Kingdom, Germany, Japan, Canada, and Australia) and four BRICS countries (G4: Brazil, Russian Federation, India, and South Africa) shows that the impact of the PRC’s slowdown is greater on emerging BRICS nations than on developed economies. The impact of the PRC’s GDP growth shock on the rest of emerging Asia is greater since it has a strong production network in East and Southeast Asia. So, the PRC’s slowdown certainly affects Asia more than Western developed economies. Keywords: the PRC’s economic slowdown, global linking variable, GDP shock, emerging BRICS nations, developing country, developed economy, panel data JEL Classification: C32, O54
ADBI Working Paper 784 S. Dinda
Contents
1. INTRODUCTION ....................................................................................................... 1
2. DATA AND METHODOLOGY ................................................................................... 3
2.1 Econometric Strategy ..................................................................................... 4 2.2 Preliminary Observations ............................................................................... 5
3. RESULTS AND DISCUSSION................................................................................... 6
4. CONCLUSION ......................................................................................................... 12
REFERENCES ................................................................................................................... 14

ADBI Working Paper 784 S. Dinda
1. INTRODUCTION Across the world, researchers and business analysts are closely watching the PRC’s economic performance, especially its recent economic slowdown. The Asia and Pacific region is extremely anxious about the PRC’s slowdown, but the rest of the world has a definite reason to worry about the consequences of the slowdown in the world’s second-largest economy. During the last few decades, the PRC has integrated strongly with Asia and also with the rest of the world.1 This paper investigates what the impact of the PRC’s slowdown on the global economy is. If there is an economic crisis in the PRC, how much does it affect developed and emerging or developing economies? Using panel data analysis, this paper highlights these issues. It explores the PRC’s impact on the rest of the world with certain variations among groups of countries of a similar nature. The estimated impact of the PRC growth is greater on emerging nations than on developed countries. The world economy has undergone a profound structural change since the 1990s. Over the last two and a half decades, the PRC has emerged as a dominant global economic player. With its large trade surplus, the PRC has already made a position in the world economy (Rodrik 2010). This paper focuses on the PRC and its strong linkage with both the local and the global economy. Asia2 and the United States (US) are the PRC’s top trading partners. Recently, the PRC has also been significantly visible in Africa and Latin America. Very recently, the PRC reopened the Silk Route, thereby strengthening its linkage with Central Asia and Europe with global value chains (Paul and Khan 2015). Currently, the PRC is present in each and every corner of the world. This success is possibly due to the openness that began with the PRC’s Cultural Revolution, which started in 1978. In the 21st century, the PRC has become the leading destination for foreign direct investment and has come into the focus of the global economy by opening several dimensions. Interdependency is increasing in this globalized world, and consequently macroeconomic risk also increases. We examine empirically how shock in the PRC’s GDP is transmitted to both emerging and developed countries. Macroeconomic managers and policy makers should consider the interdependency issues and focus on raising interdependency in the market and in the national economy. The national economy should be analyzed from the global perspective and as a major source of variability of risk management. Macroeconomic variability emerges through different channels of transmission that should be incorporated into accounting measurements. Each and every economy in this globalized world is interconnected through different channels, such as labor and capital movements across countries, cross-border trade in goods and services, sharing scarce resources, financial assets, political and technological developments etc. All these interlinking variables ultimately affect
1 The integration of the PRC into the global economy in general, and East Asia in particular, has further deepened international production fragmentation to unprecedented levels (Haddad 2007; Athukorala 2007; Ng and Yeats 2003; Kimura and Obashi 2008; World Bank 2005). At the turn of the decade, the PRC’s processing exports (which are produced from processing and/or assembly of imported inputs) accounted for nearly half of its total exports. In 2006, 51.5% of the PRC’s intra East Asian trade was in machinery products, of which more than half was trade in parts and components. The rate of annual growth was 22.7% in parts and components with its East Asian partners between 1993 and 2006 (Kimura and Obashi 2008).
2 Asian countries include the Republic of Korea; Japan; Hong Kong, China; Singapore; Taipei,China; Malaysia; Indonesia; the Philippines; Thailand; India; etc.
1

ADBI Working Paper 784 S. Dinda
individual countries’ economic growth. 3 The GDP growth rate of a nation depends on both internal and external factors. This paper focuses more on external factors, especially trade linkage factors such as export, net inflow of foreign direct investment (FDI), and openness, etc. The growth of PRC exports in market share over the last 2 decades has increased remarkably. Husted and Nishioka (2012) observe that the PRC’s export share growth has come largely at the expense of exporters based in developed countries, especially Japan and the US. The PRC’s rising export market share does not reduce the export share of developing economies. The PRC’s rise is at the cost of the developed, not the developing world (Husted and Nishioka 2012). Hence, export is an important variable that explains the economic growth of a nation. Sometimes, FDI may boost a country’s economic growth. Pan (2012) examines the FDI determinants for the PRC provinces during the period 1993–2008 and observes the effects of FDI over time. FDI solves currency problems and also plays an important role in promoting economic growth and development, raising a country’s technological level and creating employment and overall quality of life. The contribution of FDI is crucial for countries where incomes and hence domestic savings are low. They need external capital as an investment for promoting their economic growth and development. FDI also works as a means of integrating underdeveloped countries into the global market and increases the availability of capital for investment. Worldwide FDI flow has been increasing rapidly since the beginning of the 21st century 4 (UNCTAD 2007). FDI inflow to underdeveloped economies will normally affect foreign exchange rate and price level in the domestic market, which helps to mobilize the economic resources for overall economic development. Trade liberalization or openness is a crucial policy variable through which all other variables may be affected and FDI inflow stimulates overall economic development in the country. FDI inflow certainly helps underdeveloped economies to overcome the bottlenecks or constraints of availability of capital and updated technology. Really FDI ought to raise economic growth through removing all bottlenecks or constraints in underdeveloped economies. In this context, this study considers FDI an important factor influencing the GDP growth rate of a country. We use trade intensity or openness to quantify the linkages among all the economies that we include in this study. As per recent experiences, the PRC’s economy is expected to continue to grow rapidly, but the pace of credit-fueled growth in investment (since the global financial crisis in 2008) has increased the chance of a sharp slowdown and that started in the year 2015. Recognizing the risk, the PRC has adopted a few reforms in its agenda. This helps to address economic imbalances and support on-going productivity growth. Recently, the PRC started to devalue its currency. So, the PRC’s export may increase but the volume of its import may decline or may be relatively robust in the face of a slowdown in the country. The devaluation of the PRC’s currency also has a certain impact on the global economy. So the question arises: Does the PRC’s economic performance have
3 There is no such model that captures all complex interlinking. So, there are possibilities of residual interdependencies mainly due to unobserved interactions and spillover effects not taken properly into account by using the common channels of interactions. These channels of interactions pose a major challenge to modeling the global economy. The Global VAR (GVAR) approach provides an effective way of modeling interactions in a complex global economy. The GVAR model was developed in the aftermath of the 1997 Asian financial crisis to quantify the effects of macroeconomic developments on the losses of major financial institutions. Originally, the GVAR was used as a tool for credit risk analysis (Chudik and Pesaran 2014a and 2014b).
4 The most attractive region is South and Southeast Asia (UNCTAD 2007) and the largest FDI flow among developing economies goes to the PRC.
2

ADBI Working Paper 784 S. Dinda
any impact on the rest of the world? How do we measure the impact of the PRC’s slowdown on other economies? This paper attempts to estimate the impact of the PRC’s growth on other countries and on the rest of the world for the period 2000–2012. This assists in predicting other emerging or developed countries’ growth due to the PRC’s slowdown. 5 In this globalized world, every nation is economically integrated with the rest of the world through trade. To conduct an empirical analysis, Chudik and Pesaran (2014a and 2014b) suggested using a variant of the global vector autoregressive (GVAR) model. Initially, Pesaran, Schuermann, and Weiner (2004) proposed the GVAR model and Dees et al. (2007) developed it further. This is a newly developed approach to global macroeconomic modelling (Han and Ng 2011; Kendall 2014). Each country is modelled individually as a small open economy by estimating country-specific vector error-correction models in which domestic variables are related to country-specific foreign variables or global variables that are common across all countries. This GVAR model is applicable for a large number of cross-sectional and long-time series data. With limited data we apply panel data analysis technique for our estimation purpose. However, following the GVAR model, we adopt the concept of a foreign variable in our model, which is discussed in the next section. Exogenous shock is incorporated within the GVAR model, where the exogenous variable is converted to an endogenous variable. This study differs from this and incorporates the PRC’s impact as a purely exogenous or foreign variable to an individual country. The paper is organized as follows: section 2 describes the data and methodology; section 3 discusses the results and analyses with proper interpretation; and finally, section 4 concludes.
2. DATA AND METHODOLOGY All data (GDP, GDP growth rate, population, export, import, merchandise trade, net inflow of foreign direct investment [FDI], etc.) are taken from the World Bank data set of the World Development Indicators for the period 2000–2012. Dividing FDI by the population we get net flow of per capita FDI (PCFDI). Including the PRC, we have 20 countries that represent the world. Excluding the PRC, we form three different economic groups, i.e., a developed country group of six, the G6 (the US, the UK, Germany, Japan, Canada, and Australia); an emerging country group, the G4 [Brazil, the Russian Federation, India, and South Africa]; and another developing country group of nine, the G9 (Argentina, Afghanistan, Egypt, Indonesia, Malaysia, Mexico, Pakistan, Turkey, and Viet Nam). Now, the PRC is the reference country in this study. So, excluding the PRC, the paper investigates the impact of the PRC’s growth on that of the rest of the world (G19), which is divided into the G4, G6, and G9, as mentioned above.
5 Since the PRC has emerged at a faster rate in the 21st century with the integration of Asia and the world (Cesa-Bianchi et al. 2011; Dinda 2014), its slowdown, if any, definitely affects other economies, but to what extent? We have to measure the impact of the PRC’s growth on other countries (Kendall 2014).
3
ADBI Working Paper 784 S. Dinda
Table 1: Basic Summary Statistics of a Few Variables for the PRC and Other Groups during 2000–2012
Variables PRC G4 G6 G9 G19 Growth rate 10.067 4.79 1.86 4.53 3.92 SD 1.808 3.15 2.08 3.94 3.56 PCGDP 2,770.28 5,049.4 38,592.9 4,009.4 15,149.45 SD 1,801.07 3,863.8 9,528.9 3,708.8 17,112.9 Openness 51.18 45.09 48.66 74.95 60.36 SD 9.24 14.59 19.4 52.5 40.7
PRC = People’s Republic of China. Source: Author.
Table 1 provides basic summary statistics of the growth rate, per capita income (PCGDP), and openness for all groups for the period 2000–2012. The PRC’s average PCGDP during 2000–2012 is $2,770.28 whereas its average growth rate is 10.067% and average openness is 51.18%. The average growth rate is high in G4 and low in G6, while openness is the highest in G9 with high variation but it is the lowest in G4 with low variation. With limited time series data for the period 2000–2012 we construct a panel data set6 and estimate the impact applying panel data analysis techniques.
2.1 Econometric Strategy
Now, we formulate the econometric strategy for estimating panel data. Our basic model is:
𝑦𝑖𝑡 = 𝛽′𝑥𝑖𝑡 + 𝑢𝑖𝑡 (1)
where y is the GDP growth rate of ith country in tth year, x is the vector of other variables, and u is the disturbance term. This study constructs a foreign variable that is directly connected with the openness of a country. Here, openness is measured as the ratio of export plus import to GDP, which is also known as the trade intensity of a country for a given year. The impact of the PRC’s growth affects any other country through openness. Here, we construct a foreign variable as the product of the PRC’s growth rate weighted with a country’s openness, i.e., GrChnOp = w*g, where w = Openness (Op) and g = the PRC’s growth rate (GrChn). Let 𝑥𝑖𝑡∗ ≡ 𝑤𝑖𝑡 ∗ 𝑔𝑡 ≡ 𝐺𝑟𝐶ℎ𝑛𝑂𝑝𝑖𝑡 = 𝐺𝑟𝐶ℎ𝑛𝑡 ∗ 𝑂𝑝𝑖𝑡
So, we modify Eq. (1) as
𝑦𝑖𝑡 = 𝛽′𝑥𝑖𝑡 + 𝛾′𝑥𝑖𝑡∗ + 𝑢𝑖𝑡 (2)
where x* is the foreign variable conditional on the PRC’s growth effect on the rest of the world. Equation (2) is the model that measures the instantaneous effect, but in
6 The economic performance of an individual country is observed over time and we also note that groups of countries evolve over time. The evolution of a group of countries is more important than that of an individual country. This panel data analysis provides a strong estimated value with a higher level of significance.
4

ADBI Working Paper 784 S. Dinda
reality, lag value may have a strong effect on current economic variables, hence we introduce lag variables in Eq. (2),
𝑦𝑖𝑡 = 𝛽′𝑥𝑖𝑡 + 𝛾′𝑥𝑖𝑡∗ + 𝛽′′𝑥𝑖𝑡−1 + 𝛾′′𝑥𝑖𝑡−1∗ + 𝑢𝑖𝑡 (3)
and finally, lag dependent variable is added in Eq. (3) and the modified model is
𝑦𝑖𝑡 = 𝛽′𝑥𝑖𝑡 + 𝛾′𝑥𝑖𝑡∗ + 𝛿𝑦𝑖𝑡−1 + 𝛽′′𝑥𝑖𝑡−1 + 𝛾′′𝑥𝑖𝑡−1∗ + 𝑢𝑖𝑡. (4)
In this study, our main focus is on the coefficients of x* variables (both or either in instantaneous and/or lag value). Equation (3) is the base model for this study. In our limited data, we use the concept of foreign variable, x*, as a channel through foreign impact transmitted to domestic economy. This study is not in the framework of GVAR; it is only a group of panel data setup7 and estimates the impact for all subgroups. So, we use panel data analysis techniques for this study. In this context, we concentrate our study only on the period 2000–2012. Here, the major variables are y = [GDP and GDP growth rate], x = [export, net per capita FDI inflow], and x* = GrChnOp. This paper mainly focuses on the impact of the PRC’s growth on other economies in the 21st century. It is true that the PRC has become a global player in international trade since the 1990s. It is also highly significant that the PRC joined the World Trade Organization (WTO) only at the beginning of the 21st century. In joining the WTO, the PRC has emerged with a faster growth rate in the 21st century and this has affected the global economy. In the globalized world, the economic performance of an individual country depends on its export and also the inflow of foreign capital.8 The PRC’s global linking variable is the trade openness through which the PRC is exporting to, and importing from, the rest of the world. In connecting the rest of the world, the PRC grew at the fastest rate (more than 10%) in the world during 2000–2012. Obviously, GrChnOp transmits the PRC’s economic performance to other countries through its openness. GrChnOp is considered here as a foreign and exogenous variable that links to an individual country that depends on the PRC directly or indirectly. In other ways, the PRC influences other economies. This study also considers other international linking variables for the period 2000–2012.
2.2 Preliminary Observations
Preliminary observations suggest that there was a drastic fall in the GDP growth rate during 2008–2009 in almost all countries except Afghanistan. This fall in the growth rate is also associated with trade. The economic crisis of 2008–2009 was a global shock that affected all countries, but the impact varied from nation to nation in line with their openness and dependency. The GDP growth rate and PCFDI are stationary, and export (percentage of GDP) is a stationary trend. All our study variables are stationary with a break in 2009.
7 The question of simultaneity may arise in the panel setup, but in the VAR structure there is no question about simultaneity. The problem of endogeneity may also arise due to the export variable, which is a part of GDP. To overcome this endogeneity and simultaneity problem, we estimate the panel VAR model using GrChnOp as the exogenous variable.
8 Foreign direct investment (FDI) inflow is a crucial factor for the economic growth of an individual country. FDI is more important in a developing economy where capital is scarce than in that of a developed country.
5

ADBI Working Paper 784 S. Dinda
We examine data characteristics regarding whether the variables are endogenous or exogenous. Applying Hausman-Taylor regression (random effect model), we see that GrChnOp is an exogenous variable,9 while all others are endogenous variables in our panel data set. Only bilateral trade is not considered here, because, directly or indirectly, the PRC’s growth influences other nations in the globalized world. The PRC’s economic momentum affects other nations through its trade intensity in this globalized era.
3. RESULTS AND DISCUSSION For our analysis purpose, we estimate the growth rate of several country groups. This paper mainly focuses on random effect estimates. Using panel data analysis we examine both random effect (RE) and fixed effect (FE) models10. Table 2 provides the estimated results of the GDP growth rate of emerging (G4), developed (G6), and other developing (G9) countries without the global linking variable. The results of G4, G6, and G9 are obtained from panel data analysis and compare the estimated results of RE and FE models.
Table 2: GDP Growth Rate of Emerging (G4), Developed (G6), and Other Developing (G9) Economies during 2000–2012
Variables G4 G6 G9
Re Fe Re Fe Re Fe Export t 0.1498
(0.99) 0.1872 (1.18)
0.512*** (4.55)
0.6466*** (5.67)
–0.298*** (–3.23)
–0.303*** (–2.81)
PCFDIt 0.0165*** (3.68)
0.0175*** (3..97)
0.0005** (2.06)
0.0002 (0.85)
0.0167*** (3.38)
0.0208*** (3.95)
Growtht-1 0.192 (1.78)
–0.0043 (–0.04)
0.1977 (1.92)
0.1036 (1.08)
0.1296 (1.46)
–0.0125 (–0.13)
Exportt-1 –0.1549 (–1.11)
0.1313 (0.94)
–0.514*** (–4.59)
–0.6453*** (–5.82)
0.3066*** (3.36)
0.2727*** (2.66)
PCFDIt-1 –0.027*** (–5.55)
–0.0265*** (–5.98)
–0.00045 (–1.82)
–0.00058** (2.52)
–0.026*** (–5.13)
–0.0224*** (–4.07)
Constant 4.913*** (4.11)
4.225 (1.34)
1.253** (2.24)
1.743 (1.11)
4.636*** (6.3)
5.989*** (2.66)
Within R2 0.5001 0.5276 0.3689 0.4205 0.1846 0.2145 Between R2 0.6622 0.2679 0.0159 0.1772 0.7576 0.0992 Overall R2 0.5231 0.4614 0.3106 0.2604 0.2755 0.1710
Note: Figures in parentheses are t-values. ‘***’ and ‘**’ denote the level of significance at 1% and 5%, respectively. Source: Author.
Table 2 suggests that PCFDI is highly significant and affects the GDP growth rate of emerging (G4) and developing countries (G9) but there is no significant result of FE for developed countries (G6). There is no transmission mechanism in this case, because these estimates do not incorporate the foreign variable, GrChnOp. Developed
9 The coefficient of GrChnOp is 0.00445 with t-value of 3.00 that rejects null hypothesis of endogenous. So, alternative hypothesis of exogenous is accepted with 99% confidence. In this study, GrChnOp is exogenous variable in our panel data set.
10 Houseman Chi-square test suggests RE model compared to FE model. We also examine MLE and PA models and provide similar results. So, we confine with RE model estimation.
6

ADBI Working Paper 784 S. Dinda
countries’ GDP growth rate is directly related to export and highly significant, but PCFDI is significant only in RE for G6. Both export and PCFDI are highly significant and affect the GDP growth rate of developing countries. PCFDI has a significant direct effect on the GDP growth of emerging economies. Export is significant in G6 and G9 while it is insignificant in emerging G4 economies in the absence of a global linking variable. Table 3 shows the results of the impact of the PRC’s growth on the GDP growth rate of emerging (G4), developed (G6), and other developing (G9) countries incorporating global linking or the foreign variable, GrChnOp. The estimated results are obtained from panel data analysis for G4, G6, and G9. The estimated results of export and PCFDI for all groups are very similar to the results in Table 2. Table 3 presents the global linking variable GrChnOp, which is an important additional variable. The impact of the PRC’s economic performance percolates into the channel of the global linking variable, GrChnOp. The coefficient of GrChnOp is highly significant in G4 and G6, but insignificant in G9. However, the coefficient of GrChnOp (impact of the PRC’s growth) is greater on G4 than on G6. Emerging (G4) economies gain more if the PRC’s economy grows at a faster rate, and on the other hand lose a lot due to the PRC’s economic slowdowns. From Table 3 it is clear that the PRC’s growth directly affects emerging G4 and developed G6 economies, however there is no effect on G9. Export and PCFDI really affect the economic growth rate of G9 but the global linking variable is insignificant. Hence, the PRC’s growth slowdown may not affect developing G9 countries through our interacting global linking variable; however, it affects G9 through export and FDI. Past value of export, GrChnOp and PCFDI significantly affect growth rate of G6 and G9, G4 and G6, and G4 and G9, respectively.
Table 3: Impact of the PRC’s Growth on GDP Growth Rate of Emerging (G4), Developed (G6), and Other (G9) Developing Economies during 2000–2012
G4 G6 G9 RE FE RE FE RE FE
Export t –0.007 (–0.04)
0.061 (0.39)
0.4105*** (3.4)
0.5537*** (4.6)
–0.332*** (–3.38)
–0.356*** (–3.0)
PCFDIt 0.0174*** (4.1)
0.0199*** (4.33)
0.00045 (1.72)
0.00016 (0.62)
0.0152*** (3.06)
0.0191*** (3.38)
GrCHN*Opt 0.0136*** (2.94)
0.0157*** (3.86)
0.0071*** (2.71)
0.0064*** (2.64)
0.003 (1.27)
0.0027 (1.1)
Exportt-1 –0.036 (–0.27)
0.0706 (0.49)
–0.4038*** (–3.6)
–0.5328*** (–4.69)
0.2626*** (2.65)
0.2815** (2.47)
GrCHN*Opt-1 –0.011** (–2.27)
–0.0119** (–2.14)
–0.0076*** (–2.58)
–0.0058** (–2.12)
0.0013 (0.56)
–0.00095 (–0.34)
Growtht-1 o.2357** (2.2)
–0.0134 (–0.13)
0.2545** (2.56)
0.149 (1.58)
0.068 (0.74)
–0.0136 (–0.14)
PCFDIt-1 –0.024*** (–5.3)
–0.0226*** (–5.69)
–0.00025 (–1.02)
–0.0004 (1.65)
–0.0235*** (–4.39)
–0.0207*** (–3.4)
Constant 3.977*** (3.45)
–0.0583 (–0.02)
1.0418 (1.93)
0.7735 (0.5)
4.356*** (5.93)
6.28*** (2.59)
Within R2 0.6095 0.6636 0.4450 0.4897 0.1946 0.2254 Between R2 0.7398 0.0016 0.1067 0.0840 0.8879 0.1259 Overall R2 0.6099 0.3345 0.4010 0.3397 0.3167 0.1695 GDP = gross domestic product, PRC = People’s Republic of China. Note: Figures in parentheses are t-values. ‘***’ and ‘**’ denote the level of significance at 1% and 5%, respectively. Source: Author.
7

ADBI Working Paper 784 S. Dinda
The results of the random effect model are consistent for the whole data set and are displayed in the following tables (Tables 4–7). Table 4 and Table 5 present the estimated results of the PRC’s growth impact on the growth rate and per capita income level of the rest of the world (G19), respectively. Most of the models find that export is highly significant and suggest that export-led growth predominates in the rest of the world (G19), as is the likely case scenario in this globalized era. Overall PCFDI has no significant impact on economic growth rate (Table 4), while PCFDI significantly affects income level (Table 5). The global linking variable, GrChnOp, plays a crucial role and we now focus on it. GrChnOp is called an interactive variable and shows the diffusion of the PRC’s growth. The PRC’s growth impact on the growth rate of the rest of the world (G19) is positive and highly significant (Table 4). The PRC distributes its performance to the rest of the world through export. More export requires more capital, which is fulfilled by FDI inflow. The PRC’s growth affects other countries through trade.
Table 4: Random Effect Estimation of the PRC’s Growth Impact on the Growth Rate of the Rest of the World (G19) during 2000–2012
Variables I II III IV Export –0.0847***
(–2.27) –0.0906***
(–3.5) –0.0854***
(–3.07) –0.0905***
(–3.49) PCFDI –0.0009
(–1.36) 0.000035
(0.09) –0.00047 (–1.28)
0.00003 (0.07)
GrChnOp 0.00547*** (4.27)
0.0053*** (4.31)
0.0057*** (4.49)
0.0054*** (4.31)
Dc –
–2.972*** (–4.11)
– –2.856*** (–3.64)
De –
– 1.424 (1.63)
0.314 (0.39)
Constant 3.18*** (5.05)
4.203*** (7.3)
2.724*** (4.11)
4.059*** (5.92)
R2 w 0.0418 0.0471 0.0424 0.0470 R2 b 0.5175 0.6872 0.5688 0.6927 R2 O 0.1534 0.2527 0.1793 0.2543
PRC = People’s Republic of China. Note: Figures in parentheses are t-values. ‘***’ and ‘**’ denote the level of significance at 1% and 5%, respectively. Source: Author.
Table 4 shows the estimated random effect results of the impact of the PRC’s economic performance on the GDP growth of the group of emerging (de) and developed countries (dc) during 2000–2012. Our constructed international linkage variable, GrChnOp, is highly significant and instantaneously affects the GDP growth rates of other countries. So, the PRC’s economic slowdown instantaneously affects the rest of the world. The coefficient of the dc (developed country) group dummy is negative and highly significant, which suggests that the PRC’s growth strongly affects and reduces the average growth rate of developed nations. The coefficient of the de (BRICS excluding the PRC) dummy is insignificant. Table 5 displays the results of the random effect model estimation of the PRC’s growth impact on the income level of the rest of the world. PCFDI is the main determining factor of the income level of the rest of the world. Here, the coefficient of GrChnOp is insignificant in all cases. The coefficient of dc is significant. Table 6 presents estimated results of income level and its growth rate of G4, G6, and G9, controlling all other
8

ADBI Working Paper 784 S. Dinda
variables. The PRC’s growth affects both the income level and growth rate of the G9 developing country group only, whereas the PRC’s growth affects only the growth of G4 nations. PCFDI determines per capita income level only, not the growth rate of all subgroups.
Table 5: Random Effect estimation of the PRC’s Growth Impact on the per Capita Income Level (Lnpcgdp) of the Rest of the World (G19) during 2000–2012
Variables I II III IV Export –0.0083
(–1.37) –0.004 (–0.72)
–0.0086 (–1.43)
–0.0035 (–0.71)
PCFDI 0.000225*** (4.02)
0.000205*** (3.73)
0.00022*** (3.99)
0.0002*** (3.72)
GrChnOp –0.00009 (–0.47)
–0.000108 (–0.60)
–0.00009 (–0.48)
–0.0001 (–0.55)
Dc – 2.4336*** (6.88)
– 2.5443*** (6.49)
De – – –0.6974 (–1.22)
0.35 (0.79)
Constant 8.9537*** (32.52)
8.0786*** (33.23)
9.1136*** (29.95)
7.963*** (27.1)
R2 w 0.0818 0.0778 0.0820 0.0777 R2 b 0.1744 0.6692 0.1698 0.6773 R2 O 0.1575 0.6373 0.1699 0.6437
PRC = People’s Republic of China. Note: Figures in parentheses are t-values. ‘***’ and ‘**’ denote the level of significance at 1% and 5%, respectively. Source: Author.
Table 6: Random Effect Estimation of the PRC’s Growth Impact on the GDP Growth Rate and Income Level of G4, G6, and G9 during 2000–2012
Variables lnPCGDP Growth rate
G4 G6 G9 G4 G6 G9 Export 0.01545
(0.9) –0.0146**
(–2.43) 0.00966*
(1.68) –0.1254 (–1.54)
–0.0614 (–1.19)
–0.09398*** (–2.99)
PCFDI 0.00576*** (8.52)
0.00006** (2.01)
0.0045*** ((8.35)
–0.0044 (–1.38)
0.00024 (0.96)
–0.0032 (–0.96)
GrChnOp 0.0004 (0.44)
0.0052* (1.66)
–0.00064*** (–2.73)
0.0105** (2.46)
0.0039 (1.53)
0.005944*** (3.75)
Constant 6.872*** (24.57)
10.57*** (147.78)
7.931*** (40.86)
3.55*** (2.69)
1.212 (1.63)
4.108*** (6.45)
R2 w 0.6107 0.1345 0.2911 0.2037 0.0499 0.0137 R2 b 0.7070 0.2971 0.9481 0.0966 0.2450 0.8680 R2 O 0.6176 0.1449 0.6818 0.1628 0.0692 0.1272
PRC = People’s Republic of China. Note: Figures in parentheses are t-values. ‘***’, ‘**’, and ‘*’ denote the level of significance at 1%, 5% and 10%, respectively. Source: Author.
9

ADBI Working Paper 784 S. Dinda
For the rest of the world, G19, which includes the US, we now re-estimate all countries excluding the US. Table 7 presents the results of the random effect model for the PRC’s growth effect on the GDP growth of G18 during 2000–2012. Model 1 (M1) presents the estimated GDP growth of all countries excluding the US. GrChnOp is positive and statistically significant. So, M1 suggests that the PRC’s economic performance directly affects the economic growth rate of G18. M2 and M3 add the dummy variables D_dc and D_ec for developed and emerging country groups, respectively. The coefficients of D_dc are negative and significant, while that of D_ec is positive but insignificant (Table 5). So, the estimated intercept term of the developed country group is less than that of the emerging country group. M3–M5 represent autoregressive models with lag one. In all cases (M3–M5), the coefficients of last year’s growth rate are positive and highly significant. Here, the estimated impact of the PRC’s economic growth is greater on the growth rate of emerging economies than on that of developed economies.
Table 7: Results of Random Effect Model for the PRC’s Growth Effect on the GDP Growth of G18 (Excluding US from the Rest of the World) during 2000–2012
Variables M 1 M 2 M 3 M 4 M 5 Exportt –0.0676**
(–2.27) –0.0735***
(–2.63) –0.1052***
(–3.83) –0.0725**
(-2.25) -0.1416 (-1.85)
PCFDIt -0.0003 (-0.93)
0.00013 (0.39)
–0.000002 (–0.01)
0.00009 (0.26)
0.0001 (0.30)
Grchnopt 0.0053*** (3.89)
0.0052*** (3.88)
0.0063*** (4.50)
0.0076*** (4.9)
0.0082*** (4.94)
Growtht-1 0.202*** (3.17)
0.2345*** (3.57)
0.23278*** (3.55)
Exportt-1 0.0694 (0.99)
Grchnopt-1 –0.0031 (–1.91)
–0.0037** (–2.14)
D_dc –2.35*** (–3.25)
–1.918*** (–3.41)
–1.9388*** (–3.47)
–1.9479*** (–3.48)
D_ec 0.825 (1.11)
0.6207 (1.19)
0.52686 (1.01)
0.5196 (1.0)
Constant 2.64*** (4.5)
3.31*** (5.14)
2.6956*** (5.17)
2.645*** (5.1)
2.674*** (5.14)
Within R2 0.0656 0.0698 0.1062 0.1178 0.1231 Between R2 0.2309 0.6711 0.7806 0.7980 0.7974 Overall R2 0.1102 0.2334 0.2943 0.3065 0.3098 Observations 234 234 216 216 216 N 18 18 18 18 18
GDP = gross domestic product, PRC = People’s Republic of China. Note: Figures in parentheses are t-values. ‘***’ and ‘**’ denote the level of significance at 1% and 5%, respectively. The US is not included in this data set. Source: Author.
Evidence based on panel data analysis for G6, G4, and G9 shows that the impact of the PRC’s growth slowdown is greater on emerging BRICS than on that of developed nations.
10

ADBI Working Paper 784 S. Dinda
The question of endogeneity and simultaneity may arise in the single equation model, even in the panel data in our above exercise. To overcome such a problem (if any), we estimate the vector autoregressive (VAR) model in the panel data setup and also examine its response function. In this part, we are more interested in the impact of the PRC’s growth on another country group and prediction of the future through a response function. Considering GrChnOp as an exogenous variable, the estimated VAR results are presented in Table 8.
Table 8: Vector Autoregression Estimates for G19 GDPGROWTH LNPCGDP EXPORT LNPCFDI
GDPGROWTH(-1) 0.250455** 0.008436 –0.113613 0.008185 t -Value [2.49] [1.90] [–1.188] [0.35] GDPGROWTH(-2) 0.037409 –0.003614 –0.141813** 0.002864 t -Value [0.55] [–1.208] [–2.199] [0.18] LNPCGDP(-1) –5.339729** 0.935521*** 2.361116 1.087663 t -Value [–2.14] [8.49] [0.99] [1.88] LNPCGDP(-2) 5.067629** 0.054014 –1.937078 –0.682531 t -Value [2.003] [0.48] [–0.805] [–1.16] EXPORT(-1) –0.174793** –0.004378 1.028581*** 0.003983 t -Value [–2.184] [–1.24] [13.51] [0.21] EXPORT(-2) 0.130163 0.004173 –0.150677** –0.018851 t -Value [1.69] [ 1.23] [–2.06] [–1.06] LNPCFDI(-1) –0.171921 0.004254 –0.512925 0.416035*** t -Value [–0.52] [0.29] [–1.63] [5.43] LNPCFDI(-2) –0.492425 –0.006567 0.094539 0.201679*** t -Value [–1.58] [–0.48] [0.32] [2.798] Constant 8.292014*** 0.165739 –1.128793 –1.970947*** t -Value [3.366] [1.52] [–0.48] [–3.45] GRCHNOP 0.003073** 2.63E-05 0.006159*** 0.001097*** t -Value [2.29] [0.44] [4.83] [3.527] R-squared 0.381737 0.992420 0.984415 0.842690 Adj. R-squared 0.350121 0.992033 0.983618 0.834645 Sum sq. resids 1599.564 3.115870 1446.674 85.89815 S.E. equation 3.014702 0.133056 2.867008 0.698611 F-statistic 12.07427 2560.399 1235.220 104.7563 Log likelihood –464.0343 116.3766 –454.6912 –192.0722 Akaike AIC 5.097143 –1.143834 4.996680 2.172820 Schwarz SC 5.270571 –0.970407 5.170107 2.346247 Mean dependent 4.198516 8.745706 30.29855 4.779193 S.D. dependent 3.739627 1.490647 22.39997 1.718016 Determinant resid covariance (dof adj.) 0.251287
Determinant resid covariance 0.201451 Log likelihood –906.6846 Akaike information criterion 10.17940 Schwarz criterion 10.87311 Note: ‘***’ and ‘**’ denote the level of significance at 1% and 5%, respectively. Source: Author.
11
ADBI Working Paper 784 S. Dinda
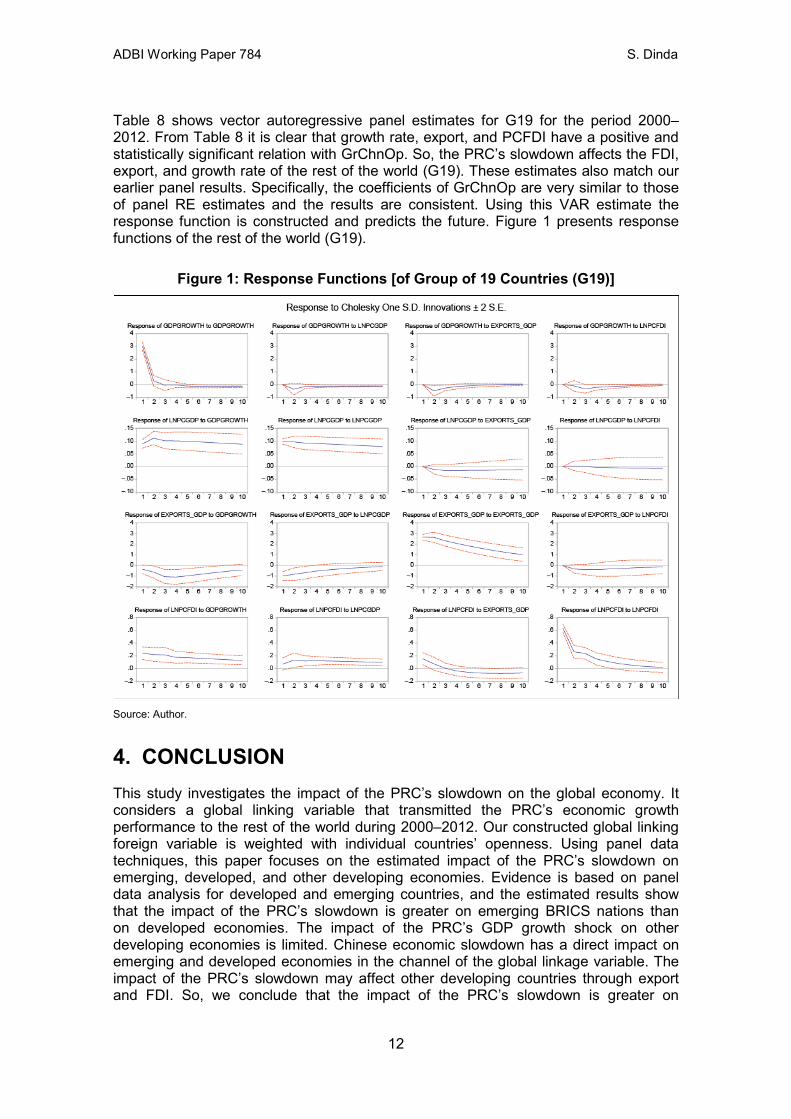
Table 8 shows vector autoregressive panel estimates for G19 for the period 2000–2012. From Table 8 it is clear that growth rate, export, and PCFDI have a positive and statistically significant relation with GrChnOp. So, the PRC’s slowdown affects the FDI, export, and growth rate of the rest of the world (G19). These estimates also match our earlier panel results. Specifically, the coefficients of GrChnOp are very similar to those of panel RE estimates and the results are consistent. Using this VAR estimate the response function is constructed and predicts the future. Figure 1 presents response functions of the rest of the world (G19).
Figure 1: Response Functions [of Group of 19 Countries (G19)]
Source: Author.
4. CONCLUSION This study investigates the impact of the PRC’s slowdown on the global economy. It considers a global linking variable that transmitted the PRC’s economic growth performance to the rest of the world during 2000–2012. Our constructed global linking foreign variable is weighted with individual countries’ openness. Using panel data techniques, this paper focuses on the estimated impact of the PRC’s slowdown on emerging, developed, and other developing economies. Evidence is based on panel data analysis for developed and emerging countries, and the estimated results show that the impact of the PRC’s slowdown is greater on emerging BRICS nations than on developed economies. The impact of the PRC’s GDP growth shock on other developing economies is limited. Chinese economic slowdown has a direct impact on emerging and developed economies in the channel of the global linkage variable. The impact of the PRC’s slowdown may affect other developing countries through export and FDI. So, we conclude that the impact of the PRC’s slowdown is greater on
12

ADBI Working Paper 784 S. Dinda
emerging economies than on mature developed economies. These findings definitely help policy makers to adopt appropriate domestic as well as foreign economic policy. This study has a limitation regarding data. Quarterly data may provide more data points than annual data. A global vector autoregressive (GVAR) approach may provide more accurate results capturing international linking complexities. Our next research agenda is to update the database, applying GVAR analysis sensitivity and forecasting major macro variables for selected economies or groups of countries.
13
ADBI Working Paper 784 S. Dinda
REFERENCES Athukorala, P. 2007. The Rise of China and East Asian Export Performance: Is the
Crowding-out Fear Warranted? Working Papers in Trade and Development, No. 2007/10. Australian National University.
Cesa-Bianchi, A., Pesaran, M. H., Rebucci, A., and Xu, T. T. 2011. China’s Emergence in the World Economy and Business Cycles in Latin America, IDB Working Paper Series: 266.
Chudik, A. and Pesaran, M. H. 2014a. Aggregation in large dynamic panels, Journal of Econometrics, vol. 178, 273–285.
———. 2014b. Theory and Practice of GVAR Modelling, at Federal Reserve Bank of Dallas, Globalization and Monetary Policy Institute, Working Paper No. 180. May 2014.
Dees, S., di Mauro, F., Pesaran, M. H., and Smith, L. V. 2007. Exploring the international linkages of the Euro Area: a global VAR analysis, Journal of Applied Econometrics, vol. 22, 1–38.
Dinda, S. 2014. China integrates Asia with the world: An empirical study, Journal of Chinese Economic and Foreign Trade Studies, vol. 8(2), 70–89.
Haddad, M. (March 2007), Trade Integration in East Asia: The Role of China and Production Networks, World Bank Policy Research Working Paper 4160.
Han, F. and Ng, T. H. 2011. ASEAN-5 Macroeconomic Forecasting Using a GVAR Model, ADB Working Paper Series on Regional Economic Integration, WP No.76
Husted, S. and Nishioka, S. 2012. China’s Fare Share? The Growth of Chinese Exports in World Trade, University of Pittsburgh, Working Paper 2012/March.
Kendall, R. 2014. Economic Linkages between New Zealand and China, Reserve Bank of New Zealand Analytical Note Series AN2014/06.
Kimura, F. and Obashi, A. 2008. East Asian Production Networks and the Rise of China: Regional Diversity in Export Performance. Paper presented at the China and the World Economy Conference, University of Nottingham, Ningbo Campus, 5–6 November 2008.
Ng, F. and Yeats, A. 2003. Major Trade Trends in East Asia: What are Their Implications for Regional Cooperation and Growth? Policy Research Working Paper No. 3084, Washington, DC: The World Bank.
Pan, M. 2012. FDI agglomeration change in China, Journal of Chinese Economic and Foreign Trade Studies, vol. 5(3), 172–184.
Paul, Vandenberg, and Khan, K. 2015. Global Value Chains along the New Silk Road, Asia Development Bank Institute, ADBI Policy Brief No. 2015-02 (May).
Pesaran, M. H., Schuermann, T. and Weiner, S. M. 2004. Modelling regional interdependencies using a global error-correcting macro econometric model, Journal of Business and Economics Statistics, vol. 22, 129–162.
Rodrik, D. 2010. Making a Room for China in the World Economy, American Economics Review: Paper and Proceedings 100: 89–93.
UNCTAD. 2007. World Investment Report, United Nations, New York. World Bank. 2005. Global Economic Prospects: Trade, Regionalism, and Development,
World Bank, Washington, DC.
14