adding the dimension of knowledge trading to source impact
TRANSCRIPT
1
Adding the dimension of knowledge trading to source impact assessment: Approaches, indicators, and implications
Erjia Yan1; Yongjun ZhuCollege of Computing and Informatics, Drexel University, 3141 Chestnut Street, Philadelphia, PA 19104, USA. {ey86; yz493}@drexel.edu
AbstractThe objective of this paper is to systematically assess sources’ (e.g., journals’ and proceedings’) impact in knowledge trading. While there were efforts in evaluating different aspects of journal impact, the dimension of knowledge trading was largely absent. To fill the gap, this study employs a set of trading-based indicators, including weighted degree centrality, Shannon entropy, and weighted betweenness centrality, to assess sources’ trading impact. These indicators are applied to several time-sliced source-to-source citation networks that comprise 33,634 sources indexed in the Scopus database. Results show that several interdisciplinary sources, such as Nature, PLOS ONE, Proceedings of the National Academy of Sciences, and Science, and several specialty sources, such as Lancet, Lecture Notes in Computer Science,Journal of the American Chemical Society, Journal of Biological Chemistry, and New England Journal of Medicine, have demonstrated their marked importance in knowledge trading. Furthermore, this study also reveals that, overall, sources have established more trading partners, increased their trading volumes, broadened their trading areas, and diversified their trading contents over the past 15 years from 1997 to 2011. These results inform the understanding of source-level impact assessment and knowledge diffusion.
IntroductionStudies of knowledge trading have garnered interest from scholars for centuries (David & Foray, 2002). Because of the intangible nature of knowledge, proxies, such as social networks and publications and patents, have been employed to study the subject matter. Among these, citations serve as an effectiveresearch instrument to quantitatively study knowledge transfer in science and technology. While scholars cite literature for various reasons be they functional, rhetorical, social, discourse-related, or even convenience purposes, it has been demonstrated that citations can imply the transfer of knowledge from acited entity (e.g., a paper, patent, journal, author, institution, or discipline) to a citing entity (e.g., Jaffe,Trajtenberg, & Fogarty, 2000).
Prior research has primarily focused on examining knowledge diffusion among macro-level entities that include institutions and disciplines. A number of statistical- and network-based approaches have been applied in conjecture with citation analysis, for instance, the knowledge trading metaphor (Lockett & McWilliams, 2005; Cronin & Meho, 2008; Yan, Ding, Cronin, & Leydesdorff, 2013; Yan, 2014),maximum spanning trees (Yan & Yu, in press), Shannon diversity and egocentric network analysis (Yan, in press), and shortest path analysis (Yan, 2014; Yan & Yu, in press). These studies have probed intodisciplinary knowledge trading characteristics, dynamics, and diversity and identified the most important knowledge hubs and paths. Some key observations have been made: most disciplines are carrying out more diversified knowledge trading by importing higher volumes of knowledge from a greater number of disciplines; meanwhile, most knowledge paths are within STEM fields and two critical paths connecting
1 Corresponding author: Phone: (215)895-1459; Fax: (215)895-2494; Email: [email protected]
This is a preprint of an article accepted for publication in Journal of the Association for
Information Science and Technology Copyright © [2015] (Association for Information Science
and Technology)
2
STEM and non-STEM fields are the ones from Mathematics to Decision Sciences and from Medicine to Social Sciences.
For micro-level entities such as journals, emphases have been placed on impact assessments rather than knowledge flows. Source-level impact assessments can be traced back to the 1970s when indicators such as influence weight (Pinski & Narin, 1976) and impact factor (Hirst, 1978) were first introduced. Recent years have witnessed a renewed interest in this area with the proliferation of a number of network-based indicators, such as Eigenfactor (Bergstrom & West, 2008), Y-Factor (Bollen, Rodriguez, & Van de Sompel, 2006), SCImago Journal Rank Indicator (Guerrero-Bote & Moya-Anegón, 2012), PageRank and centrality measures (Leydesdorff, 2009), mean normalized citation score (MNCS; Waltman, Yan, & Van Eck, 2011), Source normalized impact per paper (SNIP; Moed, 2010) as well as altmetric indicators such as journal usage statistics (e.g., Bollen et al., 2009; Haustein, 2012).The underlying assumption of the network-based indicators is that a source is considered important if it is cited by other important sources.These studies have extended the scope of journal impact assessments by developing mechanisms to attribute different citation weights based on the importance of journals’ citing sources. Nonetheless, the use of journal citation networks was merely a means to differentiate the weight of citations but not to reveal knowledge diffusion patterns.
Needs assessmentBy surveying the literature, we identified three critical needs that should be addressed to further advance knowledge in bibliometric research: the need to propose appropriate source-level indicators to assess sources’ roles in knowledge trading, the need to examine source-level knowledge trading characteristics, and the need to introduce time as a variable to reveal diachronical knowledge trading patterns.
On indicators. Historically, there are a number of indicators to measure journal status, including citation-(Bollen et al., 2009; Leydesdorff, 2009; Leydesdorff & Rafols, 2011), usage- (Bollen et al., 2009),acceptance rate- (Sugimoto et al., 2013), or social and cognitive proximity-based indicators (Ni et al., 2013). Using Borgman’s (1990) bibliometric framework, these prior studies investigated journal status largely through two aspects , and
a journal codifies epistemological characteristics often tied with certain disciplines.The third aspect producers which captures not yet been examined. It is thus our goal to complement the bibliometric framework by designing and applying appropriate source-level indicators to assess individual journals’ roles in knowledge trading. Moreover, the bibliometric community has the pressing need to utilize more fine-grained indicators that can tackle the complexity of weighted and directed bibliometric networks.
On source-level knowledge trading. Using citations to quantitatively study knowledge trading has gained popularity. Citations as a useful instrument provide a flexible means for scholars to aggregate citations and investigate knowledge trading at several academic levels, such as paper-, patent-, author-, journal-,institution-, and discipline-levels. While previous efforts in this vein have drawn strength from scientific trading (e.g., Cronin & Meho, 2008; Yan et al., 2013) and journal diffusion measures (e.g., Alvarez & Pulgarín, 1997; Frandsen, Rousseau, & Rowlands, 2006), patterns of source-level knowledge tradingwere not fully investigated and a large-scale assessment of sources’ role in knowledge trading is lacking.

3
On knowledge trading dynamics. With the rise of online databases and the ubiquity of the Internet, knowledge diffusion in the past decade is becoming more permeable (Yan et al., 2013), characterized by the ever-diversified knowledge trading practices among disciplines (Yan, in press) and mobilized research activities across various geographical regions (e.g., Breschi & Lissoni, 2009; Veugelers, 2010). While these studies have formed the foundational understanding of global knowledge transfers, it is vital to gain insight on the local, source-level knowledge patterns diachronically and triangulate node-, link-, and network-level network analyses to not merely illustrate the research landscape at a fixed point in time, but,more importantly, reveal the trend of knowledge trading.
This study will build off these needs and use a set of weighted and directed indicators to comprehensively assess the dynamic impact of sources in knowledge trading including weighted degree centrality, Shannon entropy, and weighted betweenness centrality.
Research objectivesTo afford these analyses, we will use a large-scale data set awarded by the Elsevier Bibliometric Research Program. It contains source-level citations among 33,634 sources in life sciences, health sciences, physical sciences, and social sciences during five citation windows from 1997 to 2011. The quality, inclusiveness, and dynamic character of this data set allow us to address some of the central questions in source-level knowledge trading, specifically:
To address the first need on indicators, what indicators can be proposed and applied to effectively study sources’ impact in knowledge trading;To address the second need on source-level knowledge trading characteristics, what are sources’ knowledge trading characteristics measured by the proposed indicators; andTo address the third need on diachronical analytics, at the source-level, what dynamic patterns can be found regarding knowledge trading impact?
Findings of this study will contribute to discussions of journal impact assessment as well as the scholarship of knowledge trading. The employed weighted and directed indicators will create a new dimension to journal status by measuring journals’ impact in knowledge trading. Diachronical results delivered by this study will inform the understanding of source-level knowledge flows, interdisciplinarity, and other pertinent social-scientific processes.
Data and methodsDataThe data set contains source-to-source citations for journals and proceedings indexed in Elsevier’s Scopus database with a two-year citation window: that is, a source in year t cited another source in year t-2. Wechose a two-year citation window to align with the original two-year impact factor. Other window sizes may be chosen, for instance, a five-year citation window. The use of a narrower window may favor journals that have a higher immediacy and the use of a wider window may favor journals that have a lower immediacy (Schubert & Glänzel, 1986). The following five citation matrices were thus obtained (cited/citing year): 1997/1999, 2000/2002, 2003/2005, 2006/2008, and 2009/2011. The number of sources and the number of citations for each citation window are shown in Table 1.
Table 1. Data statisticsCitation window Number of sources Number of source-level citations
4
1997/1999 13,655 1,636,7372000/2002 14,772 2,043,0782003/2005 17,559 2,609,6252006/2008 20,565 3,160,3792009/2011 23,473 3,923,885
The total number of unique sources for all five citation windows combined is 33,634. These sources can be classified into 332 minor subject areas2 and 27 major subject areas based on Elsevier’s All Science Classification Code (ASJC). The unit of analysis for this study is sources, with results aggregated at minor and major subject areas for macro-level analyses. While ASJC provides a set of consistent journal classification schema, science journals, particularly those in the biomedical domain, may be more heavily represented in this schema (Guerrero-Bote et al., 2007). This schema also tends to have more detailed classification hierarchies for science domains than social science domains (Yan, in press). These “indexer effects” (Rafols & Leydesdorff, 2009; García et al., 2012; Ruiz-Castillo & Waltman, 2015) should be noted when interpreting the results of this study. For instance, some journals’ more active trading behavior may be attributed to the fact that there are more possible trading candidates indexed in their own domain. We see these indexer effects a limitation of this research but in the meantime they help bring forward promising research opportunities as scholars have already embarked on proposing alternative paper- and journal-level classification schemas predicated on citation relations (e.g., Zhang et al., 2010; Börner et al., 2012; Waltman & Van Eck, 2012).
MethodsA set of methods are proposed to measure the impact of sources in knowledge trading. The trading metaphor has gained popularity in depicting knowledge diffusion, with the notion that an entity (e.g., a journal) trades knowledge through citations it exports knowledge via incoming citations and imports knowledge via outgoing citations (Cronin & Pearson, 1991; Cronin & Meho, 2008; Larivière, Sugimoto & Cronin, 2012; Hessey & Willett, 2013)3. The trading metaphor “enable[s] us to develop a unique, data-rich bird’s-eye view of trends in knowledge trading between disciplines and fields” (Yan, Ding, Cronin, & Leydesdorff, 2013, p. 263). Through the trading metaphor, for instance, one can measure interdisciplinarity by looking at a discipline’s trading dependence: independent disciplines tend to possess a more salient cognitive core and thus having a high self-citation rate and dependent disciplines tend to be more permeable and thus having a low self-citation rate (Yan et al., 2013). In this regard, knowledge diffusion is seen as a directed process and can be quantified by its citation strength (we use knowledge diffusion interchangeably with knowledge trading to show connections with previous diffusion studies(e.g., Frandsen, Rousseau, & Rowlands, 2006)). Although previous studies have applied a set of centrality
2 In ASJC, there are 307 minor subject areas and 27 major subject areas. Minor subject areas are the first-level classification hierarchy: a source is typically assigned to one or a few minor subject areas. Major subject areas are the secondary-level classification hierarchy to group minor subject areas. However, some sources are directly assigned to secondary-level areas without a first-level assignment. In that case, major subject areas are treated as the first-level classification hierarchy. Meanwhile, no source was associated with two minor subject areas in the data set;thus, the total number of working minor subject areas is 307+27-2=332.3 We operationalized citations in the context of knowledge trading. Note that not all citations signify knowledge flows because it has been reported that some citations may express negative sentiments and some were made primarily for format or structure considerations but not for contexts. Discussions of citation functions are out of the scope of this paper; readers are encouraged to refer to Garfield and Merton (1979), Leydesdorff (1998), Nicolaisen (2007), Bornmann and Daniel (2008), and Zhang, Ding, and M
5
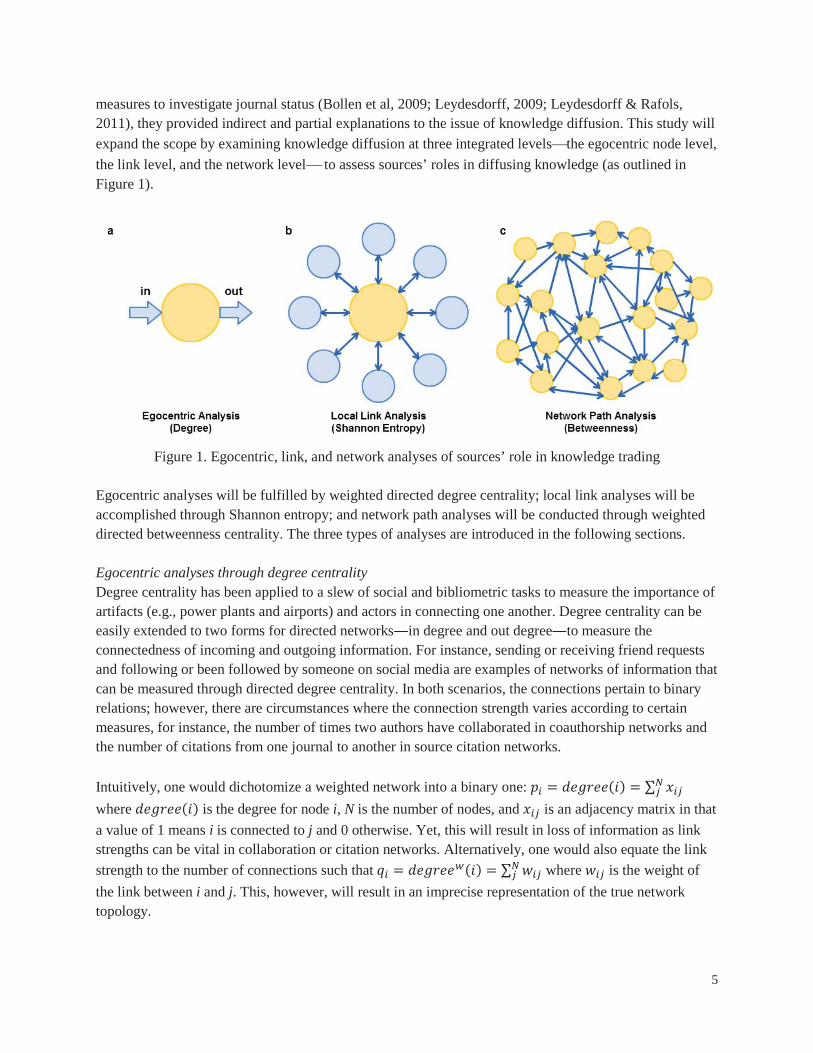
measures to investigate journal status (Bollen et al, 2009; Leydesdorff, 2009; Leydesdorff & Rafols, 2011), they provided indirect and partial explanations to the issue of knowledge diffusion. This study will expand the scope by examining knowledge diffusion at three integrated levels the egocentric node level,the link level, and the network level to assess sources’ roles in diffusing knowledge (as outlined in Figure 1).
Figure 1. Egocentric, link, and network analyses of sources’ role in knowledge trading
Egocentric analyses will be fulfilled by weighted directed degree centrality; local link analyses will be accomplished through Shannon entropy; and network path analyses will be conducted through weighted directed betweenness centrality. The three types of analyses are introduced in the following sections.
Egocentric analyses through degree centralityDegree centrality has been applied to a slew of social and bibliometric tasks to measure the importance of artifacts (e.g., power plants and airports) and actors in connecting one another. Degree centrality can be easily extended to two forms for directed networks in degree and out degree to measure the connectedness of incoming and outgoing information. For instance, sending or receiving friend requestsand following or been followed by someone on social media are examples of networks of information that can be measured through directed degree centrality. In both scenarios, the connections pertain to binary relations; however, there are circumstances where the connection strength varies according to certain measures, for instance, the number of times two authors have collaborated in coauthorship networks and the number of citations from one journal to another in source citation networks.
Intuitively, one would dichotomize a weighted network into a binary one: = ( ) =where ( ) is the degree for node i, N is the number of nodes, and is an adjacency matrix in that a value of 1 means i is connected to j and 0 otherwise. Yet, this will result in loss of information as link strengths can be vital in collaboration or citation networks. Alternatively, one would also equate the link strength to the number of connections such that = ( ) = where is the weight of the link between i and j. This, however, will result in an imprecise representation of the true network topology.
6
To address these hindering limits, we employed a weighted directed degree centrality (Opsahl, Agneessens, & Skvoretz, 2010) for source citation networks. This centrality introduces a parameter to tune the number of connections and the connection strengths. Specifically,( ) = × ( ) = ×For node i, ( ) is the product of , the number of connections of i, and / , the average weight of i’s connections.
ighted degree centrality favors the number of connections that the same as , the weighted sum of degrees for i
, the binary sum of degrees for i; and when captures both the number of connections and the strength of connections. For directed networks such as our source citation networks, two forms of ( ) are defined:( ) = × ( )
( ) = × ( )Aggregating all sources into 332 minor subject areas and 27 major subject areas based on ASJC, we also measure, for each source, how many minor or major areas this source has traded with, for both incoming and outgoing knowledge flows. Thus, four forms of degree centrality are defined:_ ( ) = _
_ ( ) = __ ( ) = _
_ ( ) = _where _ and _ are N by 332 adjacency matrices in that a value of 1 means source i has traded with the minor subject area j, N is the number of sources shown in Table 1, and _ and _ are N by 27 adjacency matrices and a value of 1 means source i has traded with the major subject area j._ ( ) and _ ( ) calculate among all 332 minor subject areas, the number of areas that source i has received citations from (i.e., exporting knowledge) or sent citations to (i.e., importing knowledge). _ ( ) and _ ( ) calculate among all 27 major subject areas, the number of areas that source i has exported or imported knowledge.
Opsahl and colleagues’ (2010) version of weighted degree centrality has been previously applied to assess author impact in social network analysis, using the classic Freeman’s EIES dataset (Freeman, 1979). The merit of this version is that it takes both the number of connections and the strength of connections into considerations; however, setting a proper tuning value may0.5, and 1) in the analysis of this paper. There are also other forms of weighted degree centrality, for instance, the use of edge clustering coefficient and Pearson correlation coefficient as weighting terms to identify important proteins in protein and protein interaction networks (Tang et al., 2014) and the use of

7
h-index as a weighting term to evaluate important information scientists on a given research topic (Zhao, Rousseau, & Ye, 2011). A comparison of these versions of weighted degree centrality, however, has not yet been reported in literature.
Local link analyses through Shannon entropyShannon entropy has been used to assess the diversity of the flow of information (e.g., Lin, 1991; Zhang et al., 2010; Yan, in press). In bibliometric research, for instance, Leydesdorff and Rafols (2011) used Shannon entropy to assess the citation diversity of science and social science journals in the Web of Science database; using Scopus data, Yan (in press) used Shannon entropy to gain understanding of the evolving features of disciplinary knowledge trading. In this study, Shannon entropy measures, for each source, the proportions of each incoming or outgoing citation sources:
: = lnwhere : is the Shannon entropy for source s measured by incoming citations to s, is the incoming citations from source i to s (i.e., the weighted links in citation networks), is the proportion of
incoming citations from i to s over the total incoming citations of s, and N is the number of sources. The Shannon entropy for source s measured by outgoing citations from s can thus be expressed as:
: = lnwhere : is the Shannon entropy for source s measured by outgoing citations from s. To calculate the Shannon entropy for source s at minor and major subject areas levels, we can use the weighted version of adjacency matrices _ , _ , _ , and _ that accumulate the weight of citation links.
Network path analyses through betweenness centralityAt the network level, an effective measure to quantify the flow of information is the betweenness centrality. It uses the concept of shortest paths to access the number of times artifacts or actors are located on the shortest paths. Therefore, a higher betweenness means a stronger capability in controllinginformation flows. Betweenness centrality also faces the same problem as degree centrality in that the classic form is only conditioned for unweighted networks. In these binary networks, the shortest path between two nodes i and j is ( , ) = min ( + + ) where k denotes the nodes on the path between i and j and is a member in the binary adjacency matrix. Although this binary calculation can be applied to dichotomized weighted networks, the accuracy is compromised. There are attempts to transform it for weighted networks (e.g., Brandes, 2001; Opsahl, Agneessens, & Skvoretz, 2010). For instance, Brandes (2001) redefined the shortest path for weighted networks: ( , ) = min ( + +) where is the link weight in the weighted network. This weighted version, however, did not
consider the number of links in finding the shortest path because a path is identified as long as the weighted sum is minimized. Here, we adopted a recent advance in weighted betweenness centrality (Opsahl, Agneessens, & Skvoretz, 2010). This new version considers both the link weight and the number
:( , ) = min 1( ) + + 1( )
8
weighted distance calculation is the same as the binary calculation of the shortest paths; and a value between 0 and 1 takes both the weight and the number of links into considerations when finding the shortest path from i to j. The weighted directed betweenness centrality can thus be defined as:( ) = g ( )gwhere g is the number of shortest paths from one node to another and g ( ) is the number of thepaths that go through node i in weighted directed networks.
The performance of Opsahl and colleagues’ (2010) version of weighted betweenness, again, is directly affected by the tuning value degree centrality, betweenness centrality also has a number of variants. As introduced, one can use the inverse link weight to identify the shortest paths (Brandes, 2001). One can also include all paths but not just the shortest paths in calculating betweenness centrality with the notion that information may flow through all possible paths (Borgatti, 2005). Similarly, one can set a limit on the path length and only include the shortest paths within a certain threshold k, thus forming the k-betweenness centrality (Borgatti& Everett, 2006). A detailed algorithmic comparison of these variants can be found at Brandes (2008) and Borgatti and Everett (2006).
ResultsResults on analyzing sources’ neighbors through degree centralityIn this section, we first illustrate the distributions of weighted in and out degree centrality ( )and ( ) with three s 0, 0.5, and 1. We then report the distributions of the aggregated in and out degree at minor and major subject area levels: _ ( ), _ ( ),_ ( ), and _ ( ).
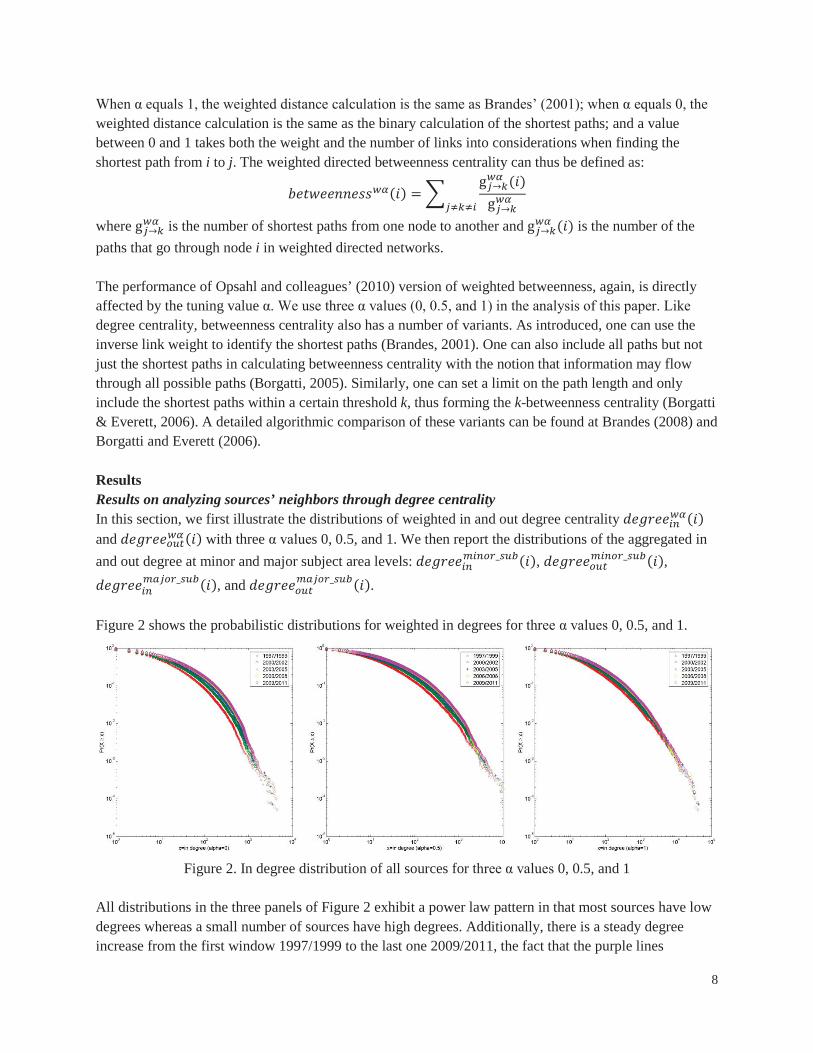
Figure 2 shows the probabilistic distributions for weighted in degrees for 0, 0.5, and 1.
Figure 2. In degree distribution of all sources for 0, 0.5, and 1
All distributions in the three panels of Figure 2 exhibit a power law pattern in that most sources have low degrees whereas a small number of sources have high degrees. Additionally, there is a steady degree increase from the first window 1997/1999 to the last one 2009/2011, the fact that the purple lines

9
(2009/2011) are located above all other lines in all three panels, followed by the yellow lines (2006/2008), blue lines (2003/2005), green lines (2000/2002), and red lines (1997/1999). This pattern is the most
s 0 equals 1 the case link weight (i.e., number of citations) is considered, the probabilistic distributions of the five citation windows are more similar to each other.
Using the 2009/2011 data, Table 2 shows the top 10 sources measured by weighted in degree for thrvalues 0, 0.5, and 14.
Table 2. Top ranked sources based on in degree for 0, 0.5, and 1 (2009/2011 data)Source Source SourcePNAS 4497 PNAS 13720 PNAS 41856Science 4256 Nature 11666 Nature 34738Nature 3918 Science 11535 JACS 34047PLOS ONE 3756 New Engl J Med 9467 Science 31262New Engl J Med 3630 PLOS ONE 9363 Phys Rev Lett 25256Lancet 3085 JACS 6622 New Engl J Med 24688JAMA 2474 JBC 6506 PLOS ONE 23341JBC 2129 Lancet 6230 Phys Rev B 20742Circulation 1887 J Clin Oncol 5149 JBC 19883Cochrane Db Syst Rev 1886 Phys Rev Lett 5132 Angew Chem Int Edit 19785
s the number of sources that imported knowledge from the sources in Table 2. For instance, among all 23,473 sources in 2009/2011, Proceedings of the National Academy of Sciences (PNAS) exported knowledge to 4,497 sources, Science exported knowledge to 4,256sources, and Nature exported knowledge to 3,918 sources.denotes the volume of exported knowledge for sources in Table 2 measured by the number of citations. PNAS exported 41,856 citations in the 2009/2011 citation window, followed by Nature whose volume is 34,738, Journal of the American Chemical Society whose volume is 34,047, and Science whose volume is 31,262. the volume of exported knowledge. Table 2 includes some of the best known multidisciplinary journals in the scientific community and also some specialty journals that excel in knowledge trading. The results provide another dimension to complement related journal-level impact assessments (e.g., Leydesdorff, 2009; Bollen et al., 2009; Leydesdorff & Rafols, 2011).
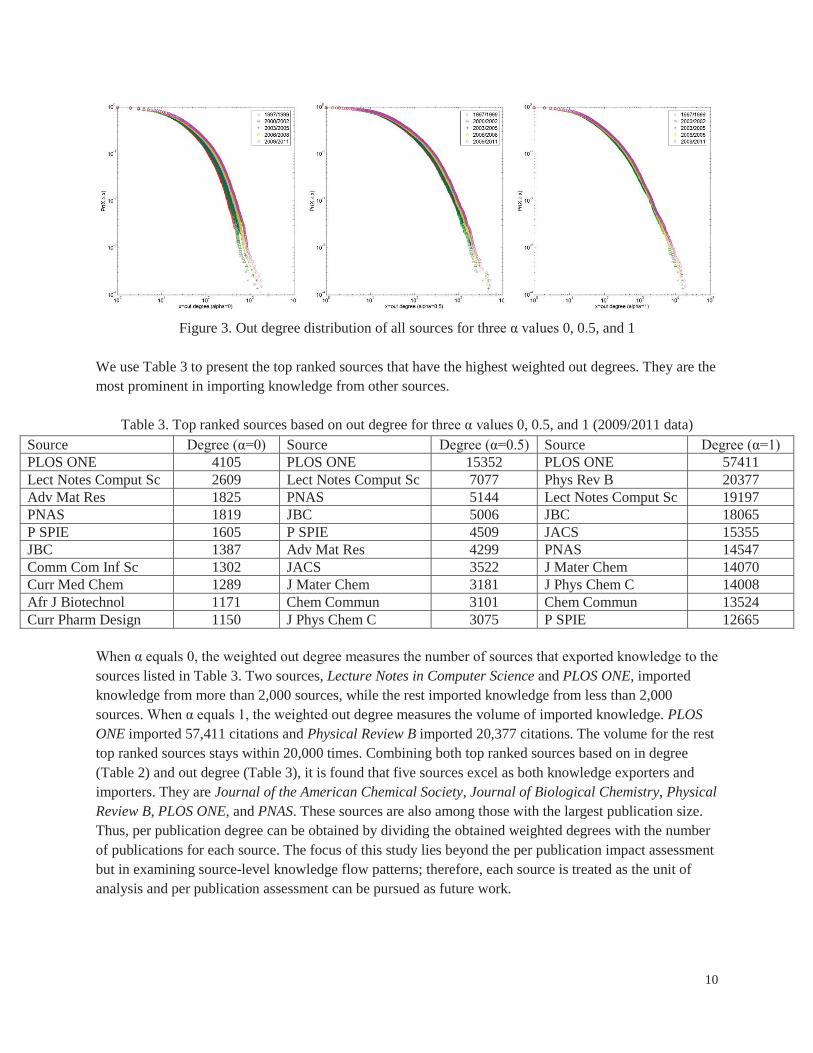
Figure 3 illustrates the probabilistic distributions of weighted out degrees. Similar to Figure 2, a power law pattern can be seen for sources’ out degree distributions. Lines in the third panel of Figure 3overlapped to a noticeable extent .
4 The full list can be found in http://www.pages.drexel.edu/~ey86/p/sourceknowledge.
10
Figure 3. Out degree distribution of all sources for 0, 0.5, and 1
We use Table 3 to present the top ranked sources that have the highest weighted out degrees. They are the most prominent in importing knowledge from other sources.
Table 3. Top ranked sources based on out degree for 0, 0.5, and 1 (2009/2011 data)Source Source SourcePLOS ONE 4105 PLOS ONE 15352 PLOS ONE 57411Lect Notes Comput Sc 2609 Lect Notes Comput Sc 7077 Phys Rev B 20377Adv Mat Res 1825 PNAS 5144 Lect Notes Comput Sc 19197PNAS 1819 JBC 5006 JBC 18065P SPIE 1605 P SPIE 4509 JACS 15355JBC 1387 Adv Mat Res 4299 PNAS 14547Comm Com Inf Sc 1302 JACS 3522 J Mater Chem 14070Curr Med Chem 1289 J Mater Chem 3181 J Phys Chem C 14008Afr J Biotechnol 1171 Chem Commun 3101 Chem Commun 13524Curr Pharm Design 1150 J Phys Chem C 3075 P SPIE 12665
sources listed in Table 3. Two sources, Lecture Notes in Computer Science and PLOS ONE, imported knowledge from more than 2,000 sources, while the rest imported knowledge from less than 2,000 sources. out degree measures the volume of imported knowledge. PLOSONE imported 57,411 citations and Physical Review B imported 20,377 citations. The volume for the rest top ranked sources stays within 20,000 times. Combining both top ranked sources based on in degree (Table 2) and out degree (Table 3), it is found that five sources excel as both knowledge exporters and importers. They are Journal of the American Chemical Society, Journal of Biological Chemistry, Physical Review B, PLOS ONE, and PNAS. These sources are also among those with the largest publication size. Thus, per publication degree can be obtained by dividing the obtained weighted degrees with the number of publications for each source. The focus of this study lies beyond the per publication impact assessment but in examining source-level knowledge flow patterns; therefore, each source is treated as the unit of analysis and per publication assessment can be pursued as future work.
11
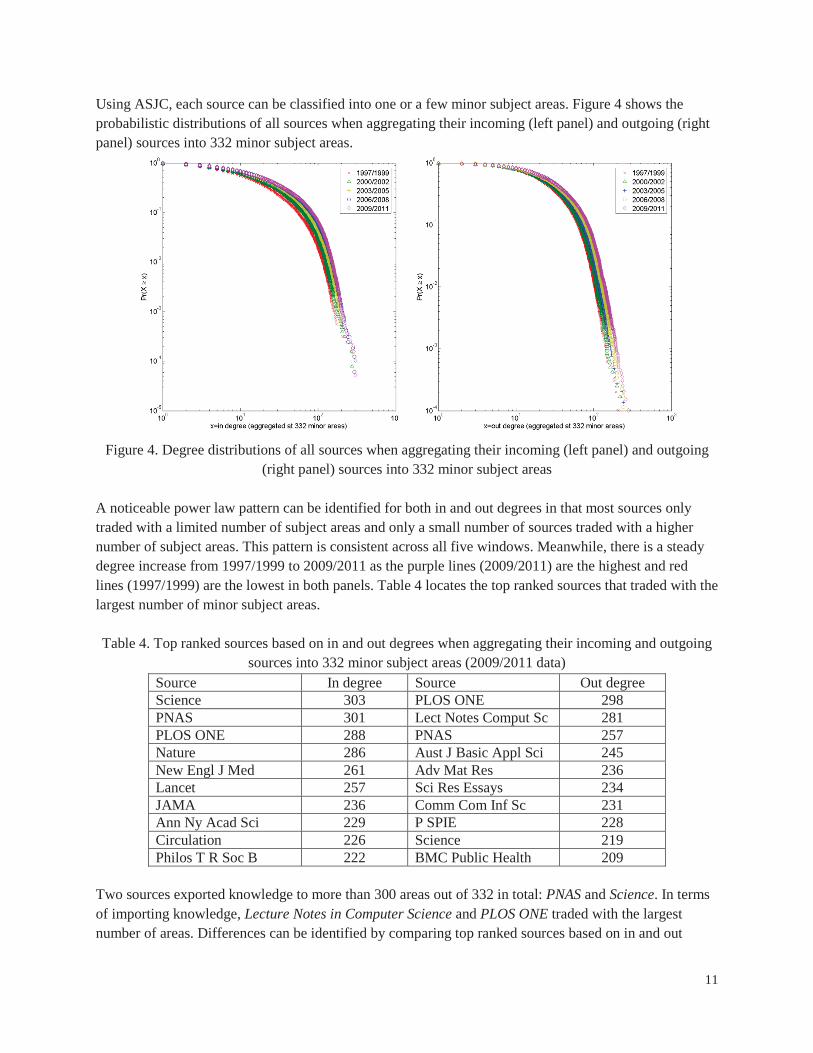
Using ASJC, each source can be classified into one or a few minor subject areas. Figure 4 shows the probabilistic distributions of all sources when aggregating their incoming (left panel) and outgoing (right panel) sources into 332 minor subject areas.
Figure 4. Degree distributions of all sources when aggregating their incoming (left panel) and outgoing (right panel) sources into 332 minor subject areas
A noticeable power law pattern can be identified for both in and out degrees in that most sources only traded with a limited number of subject areas and only a small number of sources traded with a higher number of subject areas. This pattern is consistent across all five windows. Meanwhile, there is a steady degree increase from 1997/1999 to 2009/2011 as the purple lines (2009/2011) are the highest and red lines (1997/1999) are the lowest in both panels. Table 4 locates the top ranked sources that traded with the largest number of minor subject areas.
Table 4. Top ranked sources based on in and out degrees when aggregating their incoming and outgoing sources into 332 minor subject areas (2009/2011 data)
Source In degree Source Out degreeScience 303 PLOS ONE 298PNAS 301 Lect Notes Comput Sc 281PLOS ONE 288 PNAS 257Nature 286 Aust J Basic Appl Sci 245New Engl J Med 261 Adv Mat Res 236Lancet 257 Sci Res Essays 234JAMA 236 Comm Com Inf Sc 231Ann Ny Acad Sci 229 P SPIE 228Circulation 226 Science 219Philos T R Soc B 222 BMC Public Health 209
Two sources exported knowledge to more than 300 areas out of 332 in total: PNAS and Science. In terms of importing knowledge, Lecture Notes in Computer Science and PLOS ONE traded with the largest number of areas. Differences can be identified by comparing top ranked sources based on in and out
12
degrees. This indicates that hubs of knowledge exporters may not necessarily be the hubs of knowledge citations (i.e., exporting knowledge) from a variety of areas may be considered as a
form of endorsement but sending citations may take place in a freer form. Despite the differences, three sources, PLOS ONE, PNAS, and Science, are among the top 10 list for both in and out degrees. They are thus the most interdisciplinary in knowledge trading.
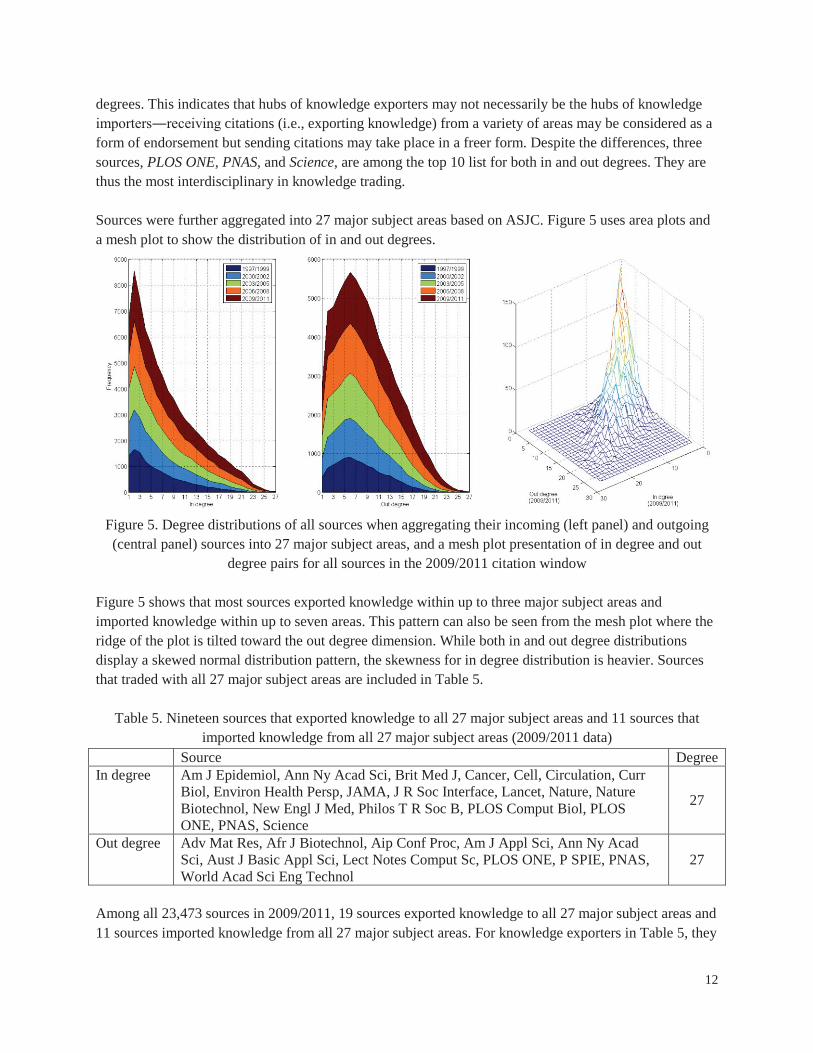
Sources were further aggregated into 27 major subject areas based on ASJC. Figure 5 uses area plots and a mesh plot to show the distribution of in and out degrees.
Figure 5. Degree distributions of all sources when aggregating their incoming (left panel) and outgoing (central panel) sources into 27 major subject areas, and a mesh plot presentation of in degree and out
degree pairs for all sources in the 2009/2011 citation window
Figure 5 shows that most sources exported knowledge within up to three major subject areas and imported knowledge within up to seven areas. This pattern can also be seen from the mesh plot where the ridge of the plot is tilted toward the out degree dimension. While both in and out degree distributionsdisplay a skewed normal distribution pattern, the skewness for in degree distribution is heavier. Sources that traded with all 27 major subject areas are included in Table 5.
Table 5. Nineteen sources that exported knowledge to all 27 major subject areas and 11 sources that imported knowledge from all 27 major subject areas (2009/2011 data)
Source DegreeIn degree Am J Epidemiol, Ann Ny Acad Sci, Brit Med J, Cancer, Cell, Circulation, Curr
Biol, Environ Health Persp, JAMA, J R Soc Interface, Lancet, Nature, Nature Biotechnol, New Engl J Med, Philos T R Soc B, PLOS Comput Biol, PLOSONE, PNAS, Science
27
Out degree Adv Mat Res, Afr J Biotechnol, Aip Conf Proc, Am J Appl Sci, Ann Ny Acad Sci, Aust J Basic Appl Sci, Lect Notes Comput Sc, PLOS ONE, P SPIE, PNAS,World Acad Sci Eng Technol
27
Among all 23,473 sources in 2009/2011, 19 sources exported knowledge to all 27 major subject areas and 11 sources imported knowledge from all 27 major subject areas. For knowledge exporters in Table 5, they

13
are among the most recognized sources in science. These exporters include esteemed interdisciplinary sources, such as Nature and Science, and also include specialty sources, such as British Medical Journaland Cell. The results suggest that both interdisciplinary and specialty sources have created knowledge that all scientific fields deemed as valuable. In regards to importers, there are established interdisciplinary sources on the list, such as Annals of the New York Academy of Sciences, PLOS ONE, and PNAS; in the meantime, there are newer, less recognized sources whose inclusion is partly due to their broad scope and considerable volume/issue sizes.
In Figure 6, we present results on the dynamics of average in and out degrees as well as the average degrees aggregated at minor and major subject areas.
Figure 6. Average in and out degrees of all sources for 0, 0.5, and 1 (left panel) and average in and out degrees of all sources when aggregating their incoming and outgoing sources into 332 minor
and 27 major subject areas (right panel)
There is a steady increase for both weighted in and out degrees the number of exporters or importers), the average number of exporters increased from 36 in 1997/1999 to 68 in 2009/2011 and the average number of importers increased from 46 to 68. 0.5 the average in degree increased from 64 to 111 and the average out degree increased from 82 to 110.(i.e., the number of citations) the average volume of exported knowledge increased from 131 to 201 and the average volume of imported knowledge increased from 166 to 199. For aggregated degrees, a steady gain can also be identified: on average, sources exported knowledge to 22 minor areas and 6 major areas in 1997/1999 and to 33 minor areas and 8 major areas in 2009/2011; sources imported knowledge from 29 minor areas and 9 major areas in 1997/1999 and to 38 minor areas and 10 major areas in 2009/2011.These numbers are partly the result of an increased number of sources added to the Scopus database (see Table 1) and may also be attributed to a more interconnected science communication at the source level.
Results on analyzing sources’ links through Shannon entropy
14
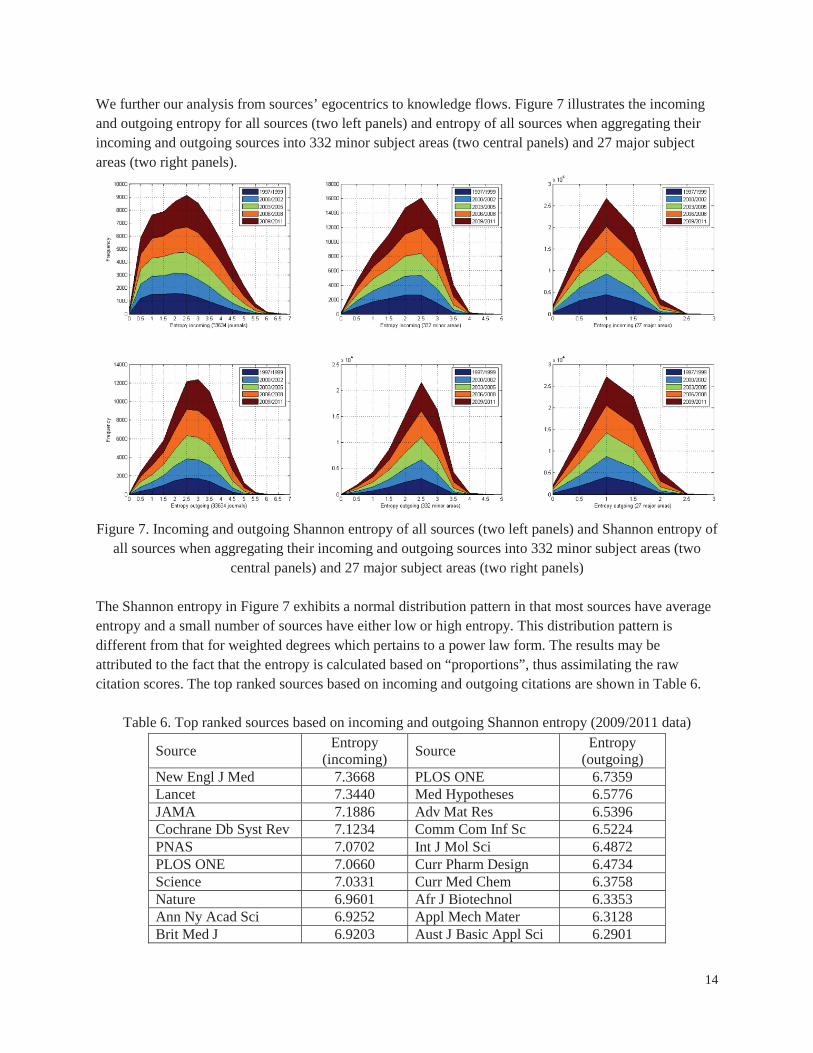
We further our analysis from sources’ egocentrics to knowledge flows. Figure 7 illustrates the incoming and outgoing entropy for all sources (two left panels) and entropy of all sources when aggregating their incoming and outgoing sources into 332 minor subject areas (two central panels) and 27 major subject areas (two right panels).
Figure 7. Incoming and outgoing Shannon entropy of all sources (two left panels) and Shannon entropy of all sources when aggregating their incoming and outgoing sources into 332 minor subject areas (two
central panels) and 27 major subject areas (two right panels)
The Shannon entropy in Figure 7 exhibits a normal distribution pattern in that most sources have averageentropy and a small number of sources have either low or high entropy. This distribution pattern is different from that for weighted degrees which pertains to a power law form. The results may be attributed to the fact that the entropy is calculated based on “proportions”, thus assimilating the raw citation scores. The top ranked sources based on incoming and outgoing citations are shown in Table 6.
Table 6. Top ranked sources based on incoming and outgoing Shannon entropy (2009/2011 data)
Source Entropy (incoming) Source Entropy
(outgoing)New Engl J Med 7.3668 PLOS ONE 6.7359Lancet 7.3440 Med Hypotheses 6.5776JAMA 7.1886 Adv Mat Res 6.5396Cochrane Db Syst Rev 7.1234 Comm Com Inf Sc 6.5224PNAS 7.0702 Int J Mol Sci 6.4872PLOS ONE 7.0660 Curr Pharm Design 6.4734Science 7.0331 Curr Med Chem 6.3758Nature 6.9601 Afr J Biotechnol 6.3353Ann Ny Acad Sci 6.9252 Appl Mech Mater 6.3128Brit Med J 6.9203 Aust J Basic Appl Sci 6.2901
15
Measured by incoming entropy, top ranked sources include specialty journals, such as Journal of the American Medical Association, Lancet, and New England Journal of Medicine, as well as interdisciplinary journals, such as the Nature, PNAS, and Science. The definition of Shannon entropy shows that it is predicated by the number of trading partners and the uniformity of each trading share. Thus, these journals have the highest entropy because they exported knowledge more evenly to a greater number of sources. As for the outgoing entropy, except for PLOS ONE, other top ranked sources are less known most of these sources are open access journals that publish a larger number of papers.Accordingly, these sources are more likely to cite papers from a greater number of sources, resulting in ahigher entropy. Leydesdorff and Rafols (2011) also reported Shannon entropy for a large set of science and social science journals drawn from the 2008 version of the Web of Science data. Although the coverage and the number of sources (23,473 in our 2009/2011 citation window vs. 8,207 in theirs) are different, eight journals in Table 6 are among their top 10 list based on incoming citations (except for Cochrane Db Syst Rev and PLOS ONE) and four journals in Table 6 are among their top 10 list based on outgoing citations (i.e., Afr J Biotechnol, Curr Med Chem, Curr Pharm Design, and Med Hypotheses).
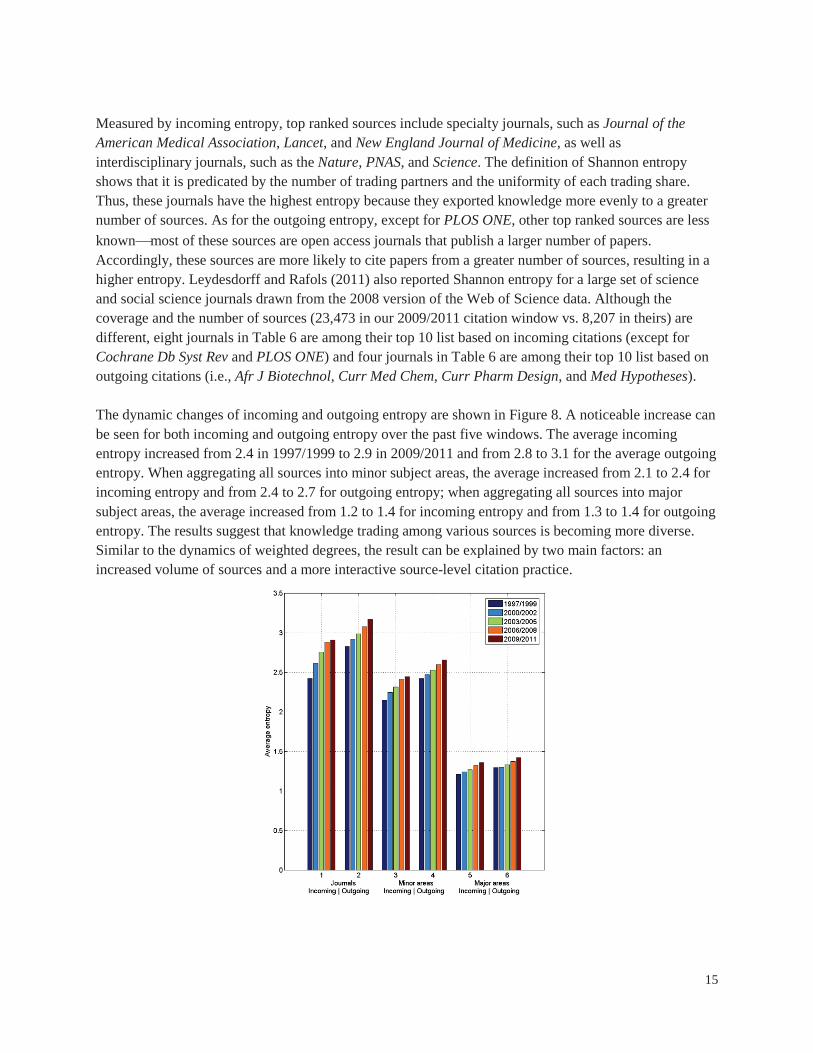
The dynamic changes of incoming and outgoing entropy are shown in Figure 8. A noticeable increase can be seen for both incoming and outgoing entropy over the past five windows. The average incoming entropy increased from 2.4 in 1997/1999 to 2.9 in 2009/2011 and from 2.8 to 3.1 for the average outgoing entropy. When aggregating all sources into minor subject areas, the average increased from 2.1 to 2.4 for incoming entropy and from 2.4 to 2.7 for outgoing entropy; when aggregating all sources into major subject areas, the average increased from 1.2 to 1.4 for incoming entropy and from 1.3 to 1.4 for outgoing entropy. The results suggest that knowledge trading among various sources is becoming more diverse. Similar to the dynamics of weighted degrees, the result can be explained by two main factors: an increased volume of sources and a more interactive source-level citation practice.
16
Figure 8. The average incoming and outgoing Shannon entropy of all sources and the average Shannon entropy of all sources when aggregating their incoming and outgoing sources into 332 minor and 27
major subject areas
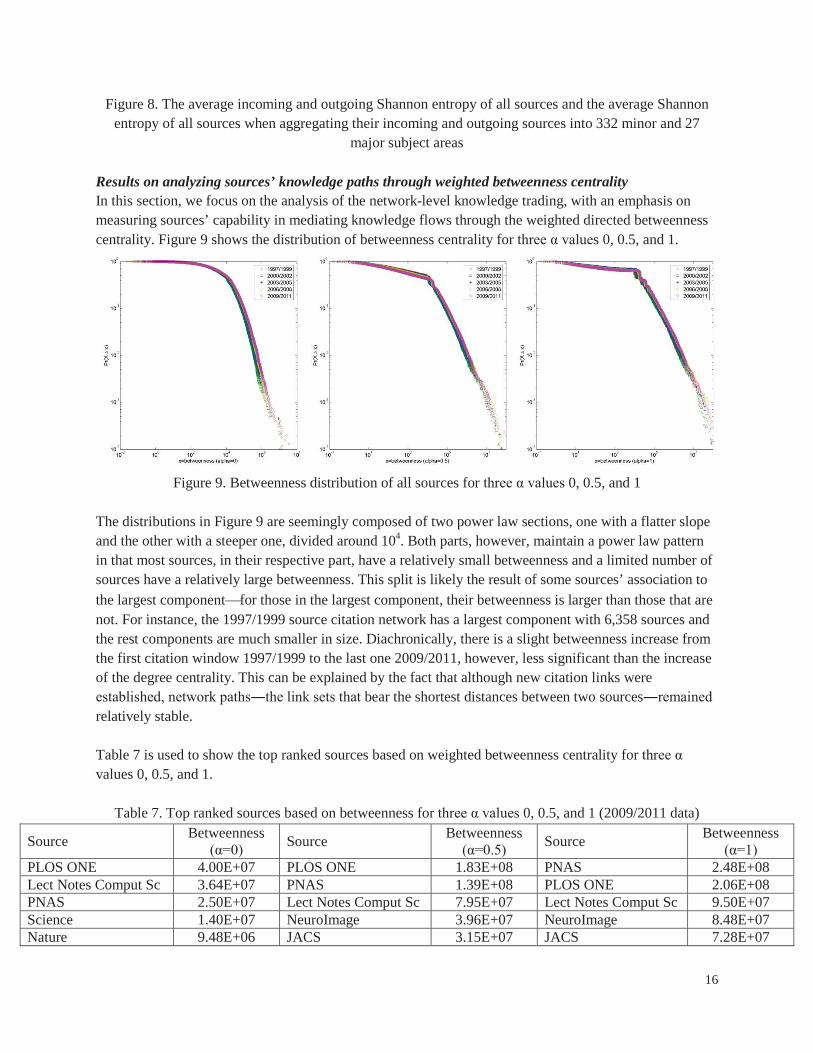
Results on analyzing sources’ knowledge paths through weighted betweenness centralityIn this section, we focus on the analysis of the network-level knowledge trading, with an emphasis on measuring sources’ capability in mediating knowledge flows through the weighted directed betweenness centrality. Figure 9 shows the distribution of betweenness centrality for s 0, 0.5, and 1.
Figure 9. Betweenness distribution of all sources for 0, 0.5, and 1
The distributions in Figure 9 are seemingly composed of two power law sections, one with a flatter slope and the other with a steeper one, divided around 104. Both parts, however, maintain a power law pattern in that most sources, in their respective part, have a relatively small betweenness and a limited number of sources have a relatively large betweenness. This split is likely the result of some sources’ association to the largest component for those in the largest component, their betweenness is larger than those that are not. For instance, the 1997/1999 source citation network has a largest component with 6,358 sources and the rest components are much smaller in size. Diachronically, there is a slight betweenness increase from the first citation window 1997/1999 to the last one 2009/2011, however, less significant than the increase of the degree centrality. This can be explained by the fact that although new citation links were
bear the shortest distances between two sourcesrelatively stable.
Table 7 is used to show the top ranked sources based on weighted betweenness centrality for values 0, 0.5, and 1.
Table 7. Top ranked sources based on betweenness for 0, 0.5, and 1 (2009/2011 data)
Source Betweenness Source Betweenness Source Betweenness
PLOS ONE 4.00E+07 PLOS ONE 1.83E+08 PNAS 2.48E+08Lect Notes Comput Sc 3.64E+07 PNAS 1.39E+08 PLOS ONE 2.06E+08PNAS 2.50E+07 Lect Notes Comput Sc 7.95E+07 Lect Notes Comput Sc 9.50E+07Science 1.40E+07 NeuroImage 3.96E+07 NeuroImage 8.48E+07Nature 9.48E+06 JACS 3.15E+07 JACS 7.28E+07

17
Expert Syst Appl 6.01E+06 Phys Rev Lett 2.66E+07 Blood 5.76E+07P SPIE 5.14E+06 J Phys Chem C 2.17E+07 J Clin Oncol 5.47E+07Lancet 4.74E+06 Phys Rev B 2.10E+07 Phys Rev B 4.45E+07Soc Sci Med 4.07E+06 Science 1.87E+07 Phys Rev Lett 3.74E+07BMC Public Health 3.48E+06 Expert Syst Appl 1.47E+07 J Phys Chem C 3.68E+07
Although the three top 10 lists give different insights on the importance of sources on facilitating Lecture Notes in Computer Science, PLOS ONE, PNAS and are
included in all three lists, demonstrating their significance in channeling knowledge. The top 10 lists also include some biomedical specialty journals. It is largely due to the fact that biomedical sources are more heavily represented in Scopus and as a result top journals measured by betweenness in biomedicines are more likely to become global top journals. Leydesdorff and Rafols (2011) also reported betweenness centrality for Web of science indexed journals. Compared with their results, four journals secured their positions in the top 10 in both studies, including Lancet, Nature, PNAS, and Science.
Last, Figure 10 shows the evolving features of the average betweenness of all sources for 0,0.5, and 1.
Figure 10. Average betweenness of all sources for 0, 0.5, and 1
A steady increase can be seen: when the average betweenness increased from 35,709 in 1997/1999 to 54,045 in 2009/2011; when equals 0.5, the average betweenness increased from 73,003 to 115,820; and when equals 1, the average betweenness increased from 144,100 to 257,280.
DiscussionsIdeally, the proposed source-level indicators should be evaluated against certain rubrics or gold standards;however, in reality, such gold standards are largely lacking. Alternatively, it is possible to compare the newly proposed indicators with existing ones as has been practiced in several source-level assessments
18
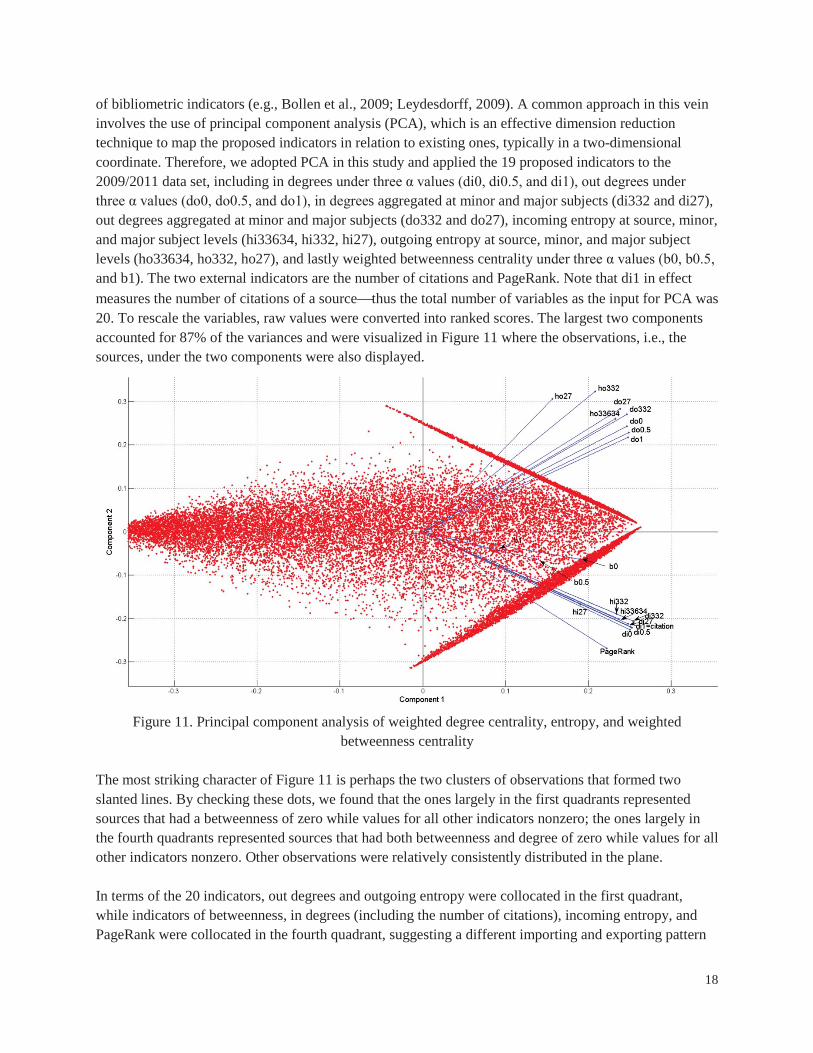
of bibliometric indicators (e.g., Bollen et al., 2009; Leydesdorff, 2009). A common approach in this vein involves the use of principal component analysis (PCA), which is an effective dimension reduction technique to map the proposed indicators in relation to existing ones, typically in a two-dimensionalcoordinate. Therefore, we adopted PCA in this study and applied the 19 proposed indicators to the 2009/2011 data set, including in degrees s under
s aggregated at minor and major subjects (di332 and di27), out degrees aggregated at minor and major subjects (do332 and do27), incoming entropy at source, minor,and major subject levels (hi33634, hi332, hi27), outgoing entropy at source, minor, and major subject levels (ho33634, ho332, ho27), and lastly weighted betweenness centrality and b1). The two external indicators are the number of citations and PageRank. Note that di1 in effect measures the number of citations of a source thus the total number of variables as the input for PCA was 20. To rescale the variables, raw values were converted into ranked scores. The largest two components accounted for 87% of the variances and were visualized in Figure 11 where the observations, i.e., the sources, under the two components were also displayed.
Figure 11. Principal component analysis of weighted degree centrality, entropy, and weighted betweenness centrality
The most striking character of Figure 11 is perhaps the two clusters of observations that formed two slanted lines. By checking these dots, we found that the ones largely in the first quadrants represented sources that had a betweenness of zero while values for all other indicators nonzero; the ones largely in the fourth quadrants represented sources that had both betweenness and degree of zero while values for all other indicators nonzero. Other observations were relatively consistently distributed in the plane.
In terms of the 20 indicators, out degrees and outgoing entropy were collocated in the first quadrant, while indicators of betweenness, in degrees (including the number of citations), incoming entropy, and PageRank were collocated in the fourth quadrant, suggesting a different importing and exporting pattern

19
of knowledge trading. Betweenness, in degree, and PageRank were closely located the result is consistent with prior PCA maps of source-level indicators (Bollen et al., 2009). Furthermore, dvalues have a more discernable impact on betweenness than in and out degrees. While degree centrality and entropy were more closely located, betweenness centrality was located further off, indicating that it is the most distinctive from the other indicators in Figure 11. These results help exemplify the roles of the proposed indicators in measuring journal impact.
Indeed, the assessment of journal impact is not a new task. The set of indicators employed in this study is not to replace prior efforts or to claim which one outperformed the others, but to provide a new perspective of measuring sources’ impact in knowledge trading. The three-step “node-link-network” approach allows for an integrated examination of the different levels of roles a source plays in knowledge trading. Integrating the evidences, we have found that several interdisciplinary sources, such as PLOSONE (15 times of occurrence in all tables in this paper), PNAS (14 times), Science (9 times), and Nature(7 times), and several specialty sources, such as Lecture Notes in Computer Science (8 times), Lancet (6 times), Journal of Biological Chemistry (6 times), Journal of the American Chemical Society (6 times), and New England Journal of Medicine (6 times), have demonstrated their marked importance in knowledge trading among various sources. While it is not surprising to find that these journals were also among the top ranked sources in other journal-level evaluations (e.g., Bollen, Rodriguez, & Van de Sompel, 2006; Bergstrom & West, 2008; Moed, 2010; Leydesdorff & Rafols, 2011; Guerrero-Bote & Moya-Anegón, 2012), findings from this study have established another dimension for journal impact assessments this new dimension focuses on measuring sources’ roles in knowledge trading and will complement other citation impact- and usage-based source-level indicators. Thus, this research extendsthe scope of journal status and enriches our understanding of knowledge diffusion.
ConclusionsThis study employed a set of citation-based indicators to examine the impact of different sources in knowledge trading. To afford the examination, weighted degree centrality, Shannon entropy, and weighted betweenness centrality were applied to several large time-sliced source-to-source citation networks. These weighted indicators have the advantage of considering both the strength and quantity of citation links that a source has s largely lacking in previous bibliometric indicators.The citation networks were operationalized into knowledge flow networks using the scientific trading metaphor proposed in our prior work (Yan et al., 2013). This metaphor enabled us to use source citations as an effective instrument to investigate the source-level knowledge trading at node-, link-, and network-levels. Three indicators were employed, including weighted degree centrality, Shannon entropy, and weighted betweenness centrality. Although the use of these indicators in social network analysis is not a new concept (e.g., Opsahl, Agneessens, & Skvoretz, 2010; Leydesdorff & Rafols, 2011), the combinatorial use of all three indicators has gained advantages to comprehensively reveal the source-level knowledge diffusion patterns at a new depth and extent.
Through weighted degrees, this study found that the degree distributions have exhibited a power law pattern, with the exception of the aggregated distribution at the major subject level where a skewed normal distribution pattern was present. The study also found that Shannon entropy displayed a normal distribution pattern in that most sources have average incoming and outgoing entropy. In the meantime, the distributions of weighted betweenness centrality were composed of two power law curves split at

20
value 104, revealing a divide of sources’ knowledge brokerage abilities. The power law distribution has been evidenced in a variety of scholarly communication facets, such as collaboration (Newman, 2004) and publication impact (Newman, 2005; Clauset, Shalizi, & Newman, 2009). The distribution patterns are attributed to network topologies and also the ways the indicators are formulated: for instance, both degree and betweenness are based on accumulative counting one counts the number of connections, weights of connections, or both, and the other counts the number of shortest paths yet, Shannon entropy is based on proportions.
Another contribution of this study is the use of a time-sliced data set that comprised source citations from 1997 to 2011 in five citation windows. This data set has afforded us to conduct diachronical analyses forsource-level impact assessments. We have found that on average sources have gained trading impact measured by all three indicators: degree, entropy, and betweenness. Note that the results may be the result of an increased number of sources available to the data set; nonetheless, the results have tentatively shown that various sources have established more trading partners, increased their trading volumes, broadened their trading areas, and diversified their trading contents over the past 15 years. Similar growth patterns have also been found by our prior work on discipline-level trading practices (Yan et al., 2013)and related work on interdisciplinarity (e.g., Van Leeuwen & Tijssen, 2000; Cronin & Meho, 2008; Porter& Rafols, 2009). Findings of this study have captured trends of global scientific knowledge advancementand serve to portray the international intellectual landscape at large. They can be used in conjunction with other science indicators by researchers and practitioners to help promote innovation creation, regulate funding allocation, and facilitate science communication and other social-scientific processes.
AcknowledgmentThe data set used in this paper is supported by the Elsevier Bibliometric Research Program (EBRP).
References
Alvarez, P., & Pulgarín, A. (1997). The diffusion of scientific journals analyzed through citations. Journal of the American Society for Information Science, 48(10), 953-958.
Bergstrom, C. T., & West, J. D. (2008). Assessing citations with the Eigenfactor™ Metrics. Neurology, 71(23), 1850-1851.
Bollen, J., Rodriguez, M. A., & Van de Sompel, H. (2006). Journal status. Scientometrics, 69(3), 669-687.
Bollen, J., Van de Sompel, H., Hagberg, A., & Chute, R. (2009). A principal component analysis of 39 scientific impact measures. PLOS ONE, 4(6), e6022.
Borgatti, S. P., & Everett, M. G. (2006). A graph-theoretic perspective on centrality. Social networks, 28(4), 466-484.
Borgatti, S.P., 2005. Centrality and network flow. Social Networks 27(1), 55-71.
Borgman, C.L. (1990). Scholarly communication and bibliometrics. Newbury Park, CA: Sage.
Börner, K., Klavans, R., Patek, M., Zoss, A. M., Biberstine, J. R., Light, R. P., ... & Boyack, K. W. (2012). Design and update of a classification system: The UCSD map of science. PloS ONE, 7(7), e39464.

21
Bornmann, L., & Daniel, H. D. (2008). What do citation counts measure? A review of studies on citing behavior. Journal of Documentation, 64(1), 45-80.
Brandes, U. (2001). A faster algorithm for betweenness centrality*. Journal of Mathematical Sociology, 25(2), 163-177.
Brandes, U. (2008). On variants of shortest-path betweenness centrality and their generic computation. Social Networks, 30(2), 136-145.
Breschi, S., & Lissoni, F. (2009). Mobility of skilled workers and co-invention networks: An anatomy of localized knowledge flow. Journal of Economic Geography, 9(4), 439-468.
Clauset, A., Shalizi, C. R., & Newman, M. E. (2009). Power-law distributions in empirical data. SIAM Review, 51(4), 661-703.
Cronin, B. & Pearson, S. (1990). The export of ideas from information science. Journal of Information Science, 16(6), 381-391.
Cronin, B., & Meho, L. I. (2008). The shifting balance of intellectual trade in information studies. Journal of the American Society for Information Science & Technology, 59(4), 551-564.
David, P. A., & Foray, D. (2002). An introduction to the economy of the knowledge society. International social science journal, 54(171), 9-23.
Faber Frandsen, T., Rousseau, R., & Rowlands, I. (2006). Diffusion factors. Journal of Documentation, 62(1), 58-72.
Freeman, L. C. (1979). Centrality in social networks conceptual clarification. Social networks, 1(3), 215-239.
García, J. A., Rodríguez-Sánchez, R., Fdez-Valdivia, J., Robinson-García, N., & Torres-Salinas, D. (2012). Mapping academic institutions according to their journal publication profile: Spanish universities as a case study. Journal of the American Society for Information Science and Technology, 63(11), 2328-2340.
Garfield, E., & Merton, R. K. (1979). Citation indexing: Its theory and application in science, technology, and humanities (Vol. 8). New York: Wiley.
Goldstone, R. L., & Leydesdorff, L. (2006). The import and export of cognitive science. Cognitive Science, 30(6), 983-993.
Guerrero-Bote, V. P., & Moya-Anegón, F. (2012). A further step forward in measuring journals’ scientific prestige: The SJR2 indicator. Journal of Informetrics, 6(4), 674-688.
Guerrero-Bote, V., Zapico-Alonso, F., Espinosa-Calvo, M., Gómez-Crisóstomo, R., & de Moya-Anegón, F. (2007). Import-export of knowledge between scientific subject categories: The iceberg hypothesis. Scientometrics, 71(3), 423-441.
Haustein, S. (2012). Multidimensional journal evaluation: Analyzing scientific periodicals beyond the impact factor. München, Germany: De Gruyter Saur.
Hessey, R., & Willett, P. (2013). Quantifying the value of knowledge exports from librarianship and information science research. Journal of Information Science, 39(1), 141-150.
22
Hirst, G. (1978). Discipline impact factors: Method for determining core journal lists. Journal of the American Society for Information Science, 29(4), 171-172.
Jaffe, A. B., Trajtenberg, M., & Fogarty, M. S. (2000). Knowledge spillovers and patent citations: Evidence from a survey of inventors. American Economic Review, 90(2), 215-218.
Larivière, V., Sugimoto, C. R., & Cronin, B. (2012). A bibliometric chronicling of Library and Information Science’s first hundred years. Journal of the American Society for Information Science and Technology, 63(5), 997-1016.
Leydesdorff, L. (1998). Theories of citation? Scientometrics, 43(1), 5-25.
Leydesdorff, L. (2009). How are new citation-based journal indicators adding to the bibliometric toolbox?Journal of the American Society for Information Science and Technology, 60(7), 1327-1336.
Leydesdorff, L., & Rafols, I. (2011). Indicators of the interdisciplinarity of journals: Diversity, centrality, and citations. Journal of Informetrics, 5(1), 87-100.
Lin, J. (1991). Divergence measures based on the Shannon entropy. IEEE Transactions on Information Theory, 37(1), 145-151.
Lockett, A., & McWilliams, A. (2005). The balance of trade between disciplines: do we effectively manage knowledge? Journal of Management Inquiry, 14(2), 139-150.
Moed, H. F. (2010). Measuring contextual citation impact of scientific journals. Journal of Informetrics, 4(3), 265-277.
Newman, M. E. (2005). Power laws, Pareto distributions and Zipf's law. Contemporary Physics, 46(5), 323-351.
Newman, M. E. J. (2004). Coauthorship networks and patterns of scientific collaboration. Proceedings of the National Academy of Sciences of the United States of America, 101(suppl. 1), 5200-5205.
Ni, C., Shaw, D., Lind, S. M., & Ding, Y. (2013). Journal impact and proximity: An assessment using bibliographic features. Journal of the American Society for Information Science and Technology, 64(4), 802-817.
Nicolaisen, J. (2007). Citation analysis. Annual review of information science and technology, 41(1), 609-641.
Opsahl, T., Agneessens, F., & Skvoretz, J. (2010). Node centrality in weighted networks: Generalizing degree and shortest paths. Social Networks, 32(3), 245-251.
Pinski, G., & Narin, F. (1976). Citation influence for journal aggregates of scientific publications: Theory, with application to the literature of physics. Information Processing & Management, 12(5), 297-312.
Porter, A., & Rafols, I. (2009). Is science becoming more interdisciplinary? Measuring and mapping six research fields over time. Scientometrics, 81(3), 719-745.
Rafols, I., & Leydesdorff, L. (2009). Content-based and algorithmic classifications of journals: Perspectives on the dynamics of scientific communication and indexer effects. Journal of the American Society for Information Science and Technology, 60(9), 1823-1835.
23
Ruiz-Castillo, J., & Waltman, L. (2015). Field-normalized citation impact indicators using algorithmically constructed classification systems of science. Journal of Informetrics, 9(1), 102-117.
Schubert, A., & Glänzel, W. (1986). Mean response time: A new indicator of journal citation speed with application to physics journals. Czechoslovak Journal of Physics, 36(1), 121-125.
Stigler, S. M. (1994). Citation patterns in the journals of statistics and probability. Statistical Science, 9(1), 94-108.
Sugimoto, C. R., Larivière, V., Ni, C., & Cronin, B. (2013). Journal acceptance rates: A cross-disciplinary analysis of variability and relationships with journal measures. Journal of Informetrics, 7(4), 897-906.
Tang, X., Wang, J., Zhong, J., & Pan, Y. (2014). Predicting essential proteins based on weighted degree centrality. Computational Biology and Bioinformatics, IEEE/ACM Transactions on, 11(2), 407-418.
Van Leeuwen, T., & Tijssen, R. (2000). Interdisciplinary dynamics of modern science: analysis of cross-disciplinary citation flows. Research Evaluation, 9(3), 183-187.
Veugelers, R. (2010). Towards a multipolar science world: trends and impact. Scientometrics, 82(2), 439-456.
Waltman, L., & Van Eck, N. J. (2012). A new methodology for constructing a publication-level classification system of science. Journal of the American Society for Information Science and Technology, 63(12), 2378-2392.
Waltman, L., Yan, E., & van Eck, N. J. (2011). A recursive field-normalized bibliometric performance indicator: An application to the field of library and information science. Scientometrics, 89(1), 301-314.
Yan, E. (2014). Finding knowledge paths among scientific disciplines. Journal of the Association for Information Science & Technology, 65(11), 2331-2347.
Yan, E. (in press). Disciplinary knowledge production and diffusion in science. Journal of the Association for Information Science & Technology.
Yan, E., & Yu, Q. (in press). Using path-based approaches to examine the dynamic structure of discipline-level citation networks: 1997-2011. Journal of the Association for Information Science & Technology.
Yan, E., Ding, Y., Cronin, B., & Leydesdorff, L. (2013). A bird's-eye view of scientific trading: Dependency relations among fields of science. Journal of Informetrics, 7(2), 249-264.
and semantic analysis of citation content. Journal of the American Society for Information Science and Technology, 64(7), 1490-1503.
Zhang, L., Liu, X., Janssens, F., Liang, L., & Glänzel, W. (2010). Subject clustering analysis based on ISI category classification. Journal of Informetrics, 4(2), 185-193.
Zhao, S. X., Rousseau, R., & Ye, F. (2011). H-degree as a basic measure in weighted networks. Journal of Informetrics, 5(4), 668-677.