adding value in product development by creating...
TRANSCRIPT
IEEE TRANSACTIONS ON ENGINEERING MANAGEMENT, VOL. 49, NO. 4, NOVEMBER 2002 443
Adding Value in Product Development by CreatingInformation and Reducing Risk
Tyson R. Browning, John J. Deyst, Steven D. Eppinger, Member, IEEE, and Daniel E. Whitney, Senior Member, IEEE
Abstract—Many firms expend a great amount of effort toincrease the customer value of their product development (PD)processes. Yet, in PD, determining how and when value is addedis problematic. The goal of a PD process is to produce a product“recipe” that satisfies requirements. Design work is done both tospecify the recipe in increasing detail and to verify that it does infact conform to requirements. As design work proceeds, certaintyincreases surrounding the ability of the evolving product design(including its production process) to be the final product recipe(i.e., technical performance risk decreases). The goal of this paperis to advance the theory and practice of evaluating progress andadded customer value in PD. The paper proposes that makingprogress and adding customer value in PD equate with producinguseful information that reduces performance risk. The paperalso contributes a methodology—therisk value method—thatintegrates current approaches such as technical performancemeasure tracking charts and risk reduction profiles. The methodsare demonstrated with an industrial example of an uninhabitedcombat aerial vehicle.
Index Terms—Lean, performance measurement, productdevelopment, project management, risk management, systemsengineering, value stream.
I. INTRODUCTION
OVER the last decade, lean manufacturing has entrencheditself as part of the Western industrial landscape [74],
[75]. Many manufacturing firms are expending tremendous ef-forts in the quest for lean production. Some firms also realizethat most of a product’s life cycle cost is determined beforeproduction, during theproduct development(PD) process. Todeliver better products faster and cheaper, some firms are at-tempting to create “lean PD” processes that continuously addcustomer value—i.e., that sustain a level of “progress” towardtheir goals. Recent emphasis on “earned value management sys-tems” in project management is another example of this trend.
Manuscript received August 4, 2000; revised February 15, 2002. This workwas supported in part by the Lean Aerospace Initiative at the MassachusettsInstitute of Technology, Lockheed Martin Aeronautics Company, The BoeingCompany, and the National Science Foundation under a graduate fellowship.Review of this manuscript was arranged by Department Editor R. Balachandra.
T. R. Browning is with Lockheed Martin Aeronautics Company, Fort Worth,TX 76101 USA (e-mail: [email protected]).
J. J. Deyst is with the Department of Aeronautics and Astronautics,Massachusetts Institute of Technology, Cambridge, MA 02139 USA (e-mail:[email protected]).
S. D. Eppinger is with the Sloan School of Management, Massachusetts Insti-tute of Technology, Cambridge, MA 02142 USA (e-mail: [email protected]).
D. E. Whitney is with the Center for Technology, Policy, and Industrial De-velopment, Massachusetts Institute of Technology, Cambridge, MA 02142 USA(e-mail: [email protected]).
Digital Object Identifier 10.1109/TEM.2002.806710
1Figure adapted from [28]. A similar concept can be found in [1].
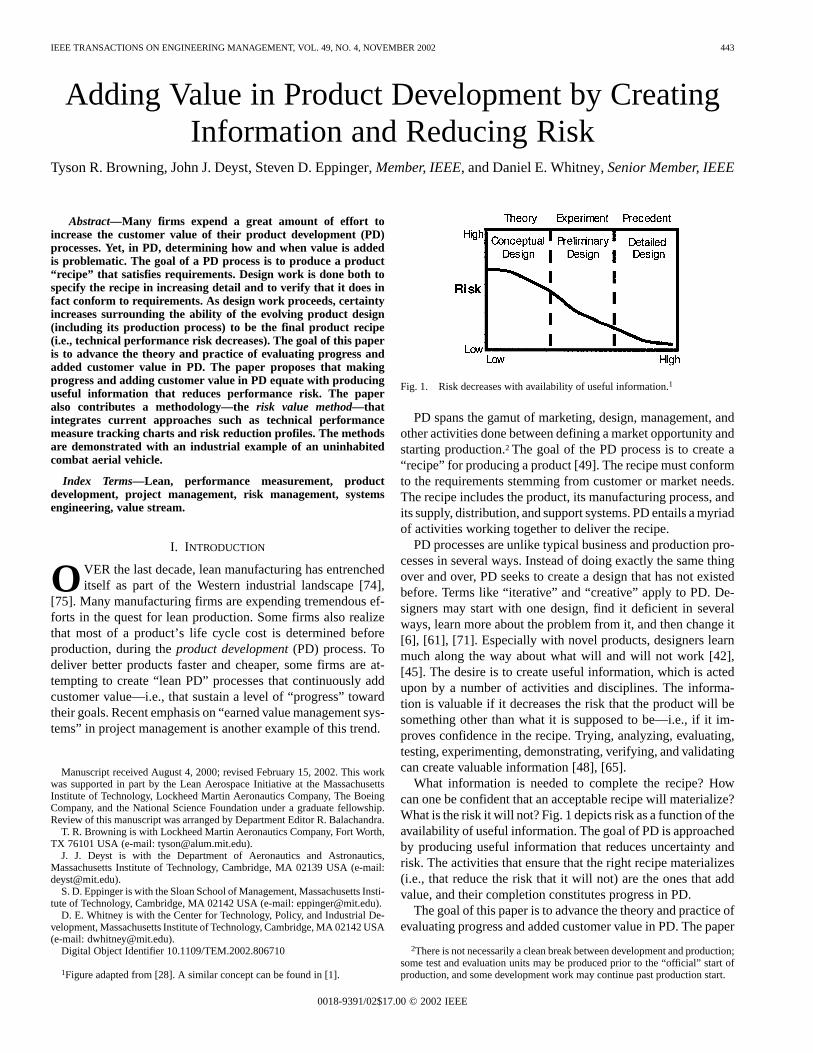
Fig. 1. Risk decreases with availability of useful information.1
PD spans the gamut of marketing, design, management, andother activities done between defining a market opportunity andstarting production.2 The goal of the PD process is to create a“recipe” for producing a product [49]. The recipe must conformto the requirements stemming from customer or market needs.The recipe includes the product, its manufacturing process, andits supply, distribution, and support systems. PD entails a myriadof activities working together to deliver the recipe.
PD processes are unlike typical business and production pro-cesses in several ways. Instead of doing exactly the same thingover and over, PD seeks to create a design that has not existedbefore. Terms like “iterative” and “creative” apply to PD. De-signers may start with one design, find it deficient in severalways, learn more about the problem from it, and then change it[6], [61], [71]. Especially with novel products, designers learnmuch along the way about what will and will not work [42],[45]. The desire is to create useful information, which is actedupon by a number of activities and disciplines. The informa-tion is valuable if it decreases the risk that the product will besomething other than what it is supposed to be—i.e., if it im-proves confidence in the recipe. Trying, analyzing, evaluating,testing, experimenting, demonstrating, verifying, and validatingcan create valuable information [48], [65].
What information is needed to complete the recipe? Howcan one be confident that an acceptable recipe will materialize?What is the risk it will not? Fig. 1 depicts risk as a function of theavailability of useful information. The goal of PD is approachedby producing useful information that reduces uncertainty andrisk. The activities that ensure that the right recipe materializes(i.e., that reduce the risk that it will not) are the ones that addvalue, and their completion constitutes progress in PD.
The goal of this paper is to advance the theory and practice ofevaluating progress and added customer value in PD. The paper
2There is not necessarily a clean break between development and production;some test and evaluation units may be produced prior to the “official” start ofproduction, and some development work may continue past production start.
0018-9391/02$17.00 © 2002 IEEE
444 IEEE TRANSACTIONS ON ENGINEERING MANAGEMENT, VOL. 49, NO. 4, NOVEMBER 2002
contributes a method for evaluating the customer value addedin PD as a function of the generation of useful information thatreduces risk. Therisk value methodis based on understandingoverall technical performance risk and its components. The ap-proach integrates several concepts and methods, includingtech-nical performance measures(TPMs), risk reduction profiles,customer preferences, and uncertainty. After discussing the con-cepts and methods used to formulate the risk value method, thepaper shows how to apply the approach using an industrial ex-ample, anuninhabited combat aerial vehicle(UCAV).
II. A DDING CUSTOMERVALUE IN PRODUCTDEVELOPMENT
“In an information economy, improving the utility of in-formation is synonymous with creating economic value.Where intelligence resides, so too does value.”
—Sawhney and Parikh [51]The goal of PD is to produce a product recipe that conforms
to requirements or acceptance criteria with some certainty. PDis a problem-solving and knowledge-accumulation process.Progress is made and value is added by creating useful in-formation that reduces uncertainty and/or ambiguity [22],[52], [60]. But it is challenging to produce information at theright time, when it will be most useful [57], [66]. Developingcomplex and/or novel systems multiplies these challenges. Thissection reviews some important considerations and challengesin adding value in PD and measuring it.
The final product recipe contains a large amount of informa-tion, which is based on an enormous amount of supporting data,which in turn rest on still other data, etc. This information struc-ture must be built from the ground up. Certain information mustbe created and propositions made before it becomes possible tocreate other information. For example, components must be de-signed to some level of detail before certain kinds of informa-tion is available about assemblies of those components. The de-pendencies between PD activities define a necessary sequencein the process of producing useful information [13]–[15], [42],[66]. Most of the work done and the decisions made depend onthe results of other work and decisions—i.e., on the structure ofthe activity network [26], [58]. The value of the information anactivity produces is a function of, among other things, the valueof the information it receives and uses. In general, then, activi-ties are done to create deliverables, andthe value of an activitydepends on the value of the deliverables it uses and creates. Aperfectly efficient processor may still produce bad results basedon bad inputs. Thus, in many cases,lack of value stems lessfrom doing unnecessary activities and more from doing neces-sary activities with the wrong information(and then having toredo them). Adding customer value can belessa function ofdoing the right activities (or of not doing the wrong ones) thanof getting the right information in the right place at the righttime. Hence, the focus of lean must turn away from activity “li-posuction” and toward addressing the PD process as a system[10].
It is well known that progress in PD is difficult to gauge.Several authors have noted various reasons contributing to theproblem. First, Goldratt [27] and others note how, if severalwork items must be done, people tend to do the easiest ones
first. For example, when eight of ten items are completed, manynaïvely assume 80% of the work is finished. Rework provides asecond complication. PD planners often “plan to succeed,” typ-ically paying little attention toprocess failure modesand theireffects (i.e., rework). Third, actually doing PD work may un-earth the need for additional information (and additional activ-ities to generate it). These three effects and others, combined,can make the last 10% of a project take half of the time (im-plying a schedule overrun or a cost overrun to prevent one; see,e.g., [18]). Thus, one cannot equate added customer value withprogress through an arbitrarily defined statement of work orprocess for several reasons: it may contain superfluous activi-ties for which no value is added, its work elements may not beequally valuable, and it may not account for missing activities,rework, or iterations. This is a significant weakness of the earnedvalue management systems (EVMS) currently used in industry.
Since PD is a nonlinear process [36], [42], it is harder to deter-mine what value is added and when. Especially in novel PD, de-sign elements are proposed, analyzed, evaluated, and advancedor rejected. The effect of one activity changing its approach andoutputs can ripple throughout the process, changing other ac-tivities’ inputs and assumptions and causing rework [10]. PDprocesses typically have lots of change and rework [19]. PD isiterative, with additional details explored during each pass. Thevalues of its activities are not predetermined—they are partly afunction of the information they use and create, and therefore ofthe activities that precede them and those that follow [10].
When an activity produces some information, the quality ofthat information is extremely difficult to determine immediately.There is a time lag between the point of value creation andthe point of value determination.3 When does the value actu-ally accrue? Rework can render useless what was previouslyuseful information, because it can negate supposed progressand assumed value. (Actually, the desired customer value wasnot added in the first place—although the designers may havelearned something.) Again, forecasting which activities will addvalue and when is problematic in the PD process.
The latest performance estimates of a design can also be illu-sory indicators of progress. When a design baseline is proposed,it is put forward with the expectation that it will be able to sat-isfy requirements. The collection of performance estimates willlook good until a problem is revealed, at which point they maysuddenly degrade. Design performance levels cannot indicateprogress unless they include a notion of how much uncertaintyremains.
Furthermore, what are the contributions of analysis, measure-ment, review, test, and prototyping activities to progress andvalue in PD? Activities such as these may not change the per-formance level (or “form, fit, and function”) of a design at all(although they may create information that may cause anotheractivity to do so). The purpose of these activities is to increasecertaintyabout the ability of the design to meet requirements.That is, these activities decrease performance uncertainty andrisk.
All of these issues point to the need for a way to measureprogress that provides a more realistic picture of the state of a
3As in control systems, time lags contribute to process instability.

BROWNING et al.: ADDING VALUE IN PRODUCT DEVELOPMENT 445
project, based on how much is known about a product design.This paper proposes tracking the uncertainty surrounding theability of the design to meet requirements as a way to measureprogress and added customer value in PD. The paper shows howboth: 1) increasing the performance level and 2) reducing per-formance risk can be accounted for by a single measure. Theapproach can help PD managers add value by focusing efforton eliminating the critical sources of risk in their projects. Itcan also help project planners ensure that a proposed processaddresses all of the known significant sources of performancerisk.
III. CONCEPTS ANDDEFINITIONS
This section discusses how customer value is providedthrough product attributes and how estimates of these attributesenable calculation of performance risk.
A. Technical Performance
The customer value provided by a product depends on its af-fordability, lead time, and technical performance. This paperfocuses on technical performance (sometimes just called per-formance), which refers to a product’s technical attributes andentails a product’s conformance to its technical requirements.Does the product do everything it is required to do, as well asit should? Is there an absence of defects, bugs, and noncon-formances? Is there reasonable confidence about these condi-tions? Generally, technical performance relates to the benefitsprovided by a product because of its design, capabilities, andfunctionality. A product performs well technically if it does ev-erything it should as well as it should.4
Technical performance typically contains many attributes. Anaircraft’s technical performance, for example, includes payload,range, reliability, noise level, altitude ceiling, etc. Product per-formance attributes that the market cares about and expressespreferences for are the primary attributes.
Additional technical performance attributes may be derivedand acknowledged within the development organization toguide the design process. For example, weight is an importantaspect of aircraft performance because it directly impactspayload, range, and other performance attributes. Yet, it maynot be a primary performance attribute because customers maynot care about the actual weight of the aircraft as long as itperforms well.5
The tendency for the primary performance attributes to de-pend on several lower level attributes suggests that it can beconvenient to represent attributes in a hierarchy. Attributes re-late to each other horizontally as well as vertically in the hier-archy—i.e., they can be interdependent. For example, payloadand range can be traded: the amount of one impacts the amountof the other. Independence is a desirable characteristic of perfor-mance attributes [59], however, and sometimes choices can bemade to select attributes that are relatively independent (e.g., by
4Whether or not the chosen “design to” requirements are in fact the ones theusers would specify (if they could) is a matter ofmarket risk[8, Ch. 3].
5Yet, weight has such a strong, direct impact on payload and range that aircraftcustomers tend to be interested in it. Also, weight may be a primary performanceattribute if the aircraft will operate on certain types of runways.
Fig. 2. PDF showing relative probability of various range TPM outcomes.
combining attributes such as payload, range, and operating costinto “seat cost per mile” for commercial passenger aircraft).
B. Technical Performance Measures (TPMs)
System designers use metrics to plan and track the levelof important technical performance attributes as PD unfolds.These metrics are calledtechnical performance measures(TPMs), measures of effectiveness (MOEs), figures of merit(FOMs), and other names [5], [16], [25], [32], [38], [41], [47].TPMs often have the same name as the performance attributethey measure, such as payload, range, etc. TPMs may alsomeasure aggregate defects or nonconformances.
TPMs change as the design progresses. Each TPM may beestimated early in the design process, once a baseline designis established. Initial estimates are very subjective and uncer-tain. As design work is done, estimates are refined based on datafrom analyses, simulations, prototypes, demonstrations, etc. Es-timates become more and more objective and certain as designwork provides TPM verification. When the product recipe isready, the TPMs indicate the level of performance provided bythe product.
The idea that TPMs become more accurate as the design ma-tures relates to the reduction of uncertainty. Information pro-duced by design work is used to reduce the uncertainty sur-rounding TPMs. Some design work (analyses, evaluations, re-views, experiments, tests) may not change the actual capabilityof the design (the TPM levels), but these kinds of efforts arecrucial for reducing the uncertainty in the design (representedby the TPM bounds).
C. Technical Performance Risk( )
Technical performance risk is uncertainty that a product de-sign will satisfy technical requirements and the consequencesthereof (cf., [9]). Thus, the amount of performance risk associ-ated with any TPM depends on two factors: 1) the number ofpossible outcomes, cases, or situations that fail to meet require-ments and 2) the consequence or impact of each.
1) Uncertainty: The familiar methods of schedule riskassessment apply to quantifying performance uncertainty.Treating a TPM as a random variable, its possible outcomescan be represented by aprobability density function(PDF).The PDF in Fig. 2 shows the relative likelihood of an aircraftproduct having various range capabilities. The vertical line at725 nautical miles (nmiles) signifies the required performancelevel. The part of the PDF to the left of the requirements line

446 IEEE TRANSACTIONS ON ENGINEERING MANAGEMENT, VOL. 49, NO. 4, NOVEMBER 2002
Fig. 3. Conversion of three-point estimate to TriPDF.
represents the fraction of potential outcomes that fail to meetrequirements—the probability that the design will not conformto requirements.
Since the PDF represents possible outcomes and their relativeprobability, its shape depends on what kinds of outcomes areanticipated and how likely each is thought to be. Usually, onedoes not have much information about every possible outcome.When information is scarce, it helps to focus on a few potentialoutcomes—the most likely case, the optimistic (best) case, andthe pessimistic (worse) case. Estimates of these cases can beused to construct a rough triangular PDF (TriPDF) as in Fig. 3.The area under the PDF is normalized to one.6
2) Consequences:The consequences of failing to meet a re-quirement must also be considered. Some requirements are ab-solute thresholds below which the entire design is unacceptable.Other requirements represent customer preferences, where moreis better but less might be acceptable. In the case of aircraftrange, would missing the requirement by 1 nmile be as bad asmissing it by 50? Customer needs and preferences data can beused to estimate the impacts of various adverse outcomes. Forexample, the customer may allow missing the range requirement(as long as this lack of value is compensated for in some otherproduct attribute). However, the customer becomes more dis-pleased the more range falls short. This decreasing satisfactionmight be represented using a quadratic impact function, wheredissatisfaction grows as the square of the gap between the TPMand the requirement.7 Fig. 4 exhibits A) quadratic and B) linearimpact functions.
Instead of a simple quadratic or linear impact function, utilitycurves provide a more powerful approach for documentingcustomer preferences for various performance levels. Fig. 5shows an example (piecewise linear) utility curve for aircraftrange. The length of the-axis is chosen to span the continuumfrom disgusting to delighting the customer or market. In thisexample, perhaps the customer wants an aircraft for a particularuse that requires a 700-nmile range. Nothing less will do.Slightly greater range is of marginally increasing value to thecustomer, to the point that a range of 1000 nmiles would bedelightful. The utility curve can be used to determine the impactof various range TPM outcomes in terms of customer utility
6To allow for best and worse cases beyond those proposed, the area underthe TriPDF can be normalized to 0.8 and the assumption made that 10% of theoutcomes lie to either side of the range bounded by the given best and worsecases.
7Taguchi [62] highlighted the usefulness of quadratic quality loss functions.
Fig. 4. Two example impact functions overlaid on triPDF.
Fig. 5. Utility curve for aircraft range.
or value.8 The consequence or impact of failing to achieve atarget level of performance is a function of the gap between theutility of the outcome and the utility of the target
(1)
where is an outcome (a TPM level), is the target (re-quirement), (•) is the utility curve function, and isa normalization constant (e.g., for converting units of utility tomore intuitive measures of value, such as number of units likelyto be purchased).
3) Risk: The performance risk in a dimension of productperformance is the sum of the products of probability and im-pact for each unacceptable outcome, which, for the continuouscase and a “larger is better” (LIB) 9 TPM, is
(2)
where is the PDF of all TPM outcomes. The integralis approximated with a summation for the usual case of a finitenumber of discrete outcomes.
D. Product Performance Risk ()
The overall performance risk for a product design,, is theweighted sum of all the s
(3)
8For more information on constructing utility curves, see, e.g., [23].9Aircraft range is a LIB TPM. “Smaller is better” (SIB) and “nominal is best”
(NIB) TPMs may characterize other product attributes.

BROWNING et al.: ADDING VALUE IN PRODUCT DEVELOPMENT 447
TABLE ITPM DATA AT A POINT IN PROJECTTIME, t
*The UCAV capabilities presented in this paper are hypothetical.
where is the relative importance of and all sum toone.10 (The Appendix discusses an alternative approach to cal-culating the overall performance risk using multiattribute utilitytheory.)
For example, consider four UCAV TPMs: payload, range,reliability (mean time before failure—MTBF), and detectability(“stealthiness”). At project time , Table I shows TPM targets,PDFs, utility curves, relative importance (weights), risk levels,and—for example—arbitrary statuses ( ;
; ).According to (2), the risk level of each TPM is a function of
the PDF shape, the target, and the utility curve.11 In Table I,is large because of the shape of its utility curve and the
position of its PDF; a significant portion of the PDF lies in theregion where customer utility is zero, indicating a large impact.
is not a linear function. It grows quickly as the WCVdecreases. Thus, large individual values will have a largeinfluence on . This effect is helpful, since we do not want asingle high-risk TPM to be “washed out” by a large number oflow-risk TPMs when determining overall performance risk. Thethresholds for assigning statuses are arbitrary, depending on thedevelopment organization’s level of risk acceptance or aversion.
The risk factor values are primarily significant in a relativesense, as a measure of progress. However, by choosing appro-priate units for , could represent, say, dollars of sales at risk.For example, suppose the development organization assumesthat 1000 units will be sold at $10 million each if all productattributes provide maximum customer utility. Then, ($10
10This form for the overall risk equation was suggested by H. McManus.11For all calculations in Table I,� = 10 “risk units,” yielding risk factors
with whole number magnitudes. Equation (2) was solved numerically by di-viding the unacceptable region of the PDF into 100 intervals and summing theprobability and impact of each.
million/unit)(1000 units/full utility)(full utility) $10 billion inpotential sales. Furthermore, it assumes demand is a linear func-tion of the overall utility level, such that each 0.01 of lost overallutility represents an impact of $100 million in lost sales. Basedon achieving all of the targets listed in Table I, the developmentfirm might estimate selling 821 units ($8.21 billion). But giventhe PDFs and risk levels, $431 million in potential sales are atrisk. While this number is interesting, it is extremely sensitive tothe assumptions about market size and the relationship betweenutility and demand (which is not actually linear). Nevertheless,business cases regularly make assumptions about markets anddemand, despite the problems with such forecasts. An organi-zation with market savvy and historical data could calibrateso that would provide useful support for business decisions.
IV. M ETHODS FORPLANNING AND TRACKING TECHNICAL
PERFORMANCE
This section reviews two performance planning and moni-toring methods, the TPM tracking chart and the risk reductionprofile [5], [25], [38], [41]. Both methods are used in a numberof system development projects in industry (e.g., [16], [32],[34], [47], [50], [53], and [54]). The two methods are combinedand used to illustrate the risk value method.
A. TPM Tracking Chart
A TPM tracking chart predicts and monitors an evolvingTPM relative to its requirement. Initially, experts with ap-plicable product, project, and technology experiences mayforecast aplannedprofile for the TPM. The profile is projectedbased on a number of factors, including technology risk,planned verification and validation activities, historical data,experience, and expert opinion. As the project unfolds, demon-strated measures are recorded periodically. Ideally, theactual
448 IEEE TRANSACTIONS ON ENGINEERING MANAGEMENT, VOL. 49, NO. 4, NOVEMBER 2002
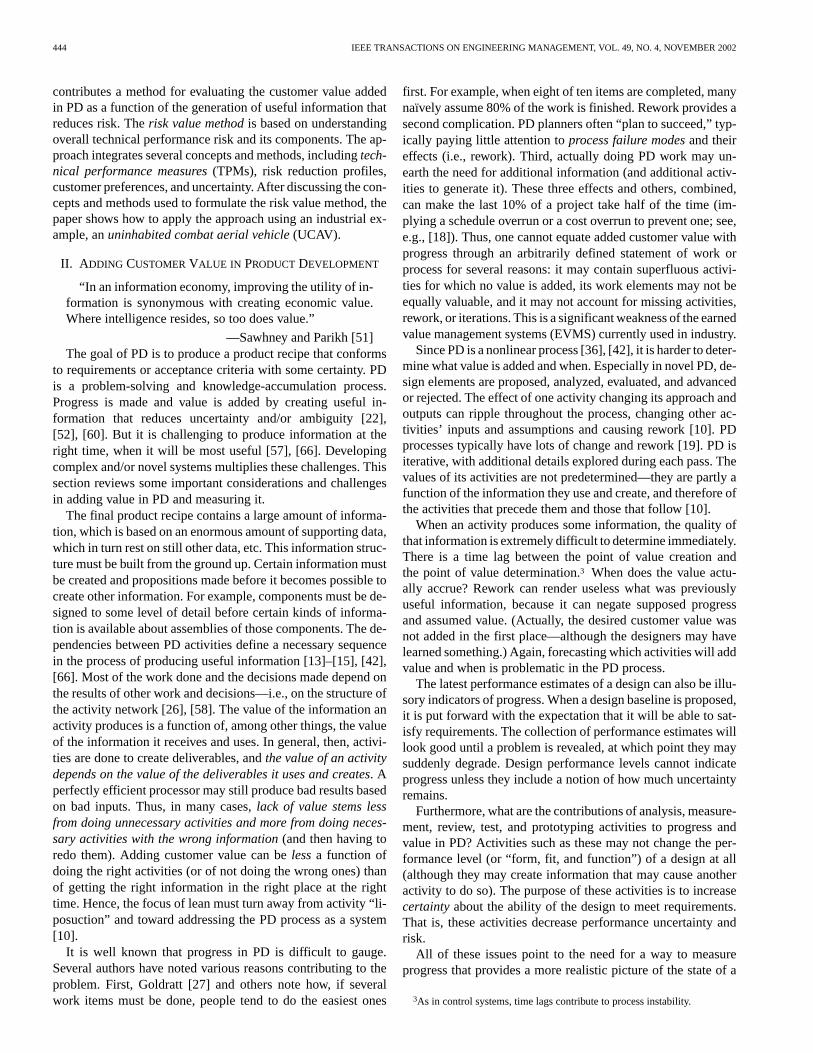
Fig. 6. Example TPM tracking chart for aircraft range.
Fig. 7. Example risk reduction profile for aircraft structural loads.
profile will meet or exceed the requirement, and uncertaintywill decrease.12
In Fig. 6, an example aircraft design project is planned to lasteight months. The requirement for effective mission range is setat 725 nautical smiles and is shown in the tracking chart as thedashed, horizontal line. Each circle represents a point estimateor measure of the most likely level of performance delivered bythe design at various times. The high–low bars, showing the bestand worst case possibilities, convey the uncertainty in each es-timate. (In practice, however, many projects unfortunately omitthe uncertainty bars.)
B. Risk Reduction Profile Chart
Areas requiring risk reduction may be anticipated and trackedusing a risk reduction profile or “risk waterfall” chart. The ex-ample in Fig. 7 shows an assessed risk level for a particularstructural loading case in an aircraft operational scenario. At theoutset of the project, it is determined that the risk of unaccept-able performance in this case is medium to high. The goal is toplan and track a chain of activities intended to reduce this risk.The amount of risk reduction anticipated for each activity is in-dicated on the chart as a step function. In Fig. 7, the informationproduced by activities 1, 2, and 3 directly contributes to reducingthe risk that the aircraft will not conform to requirements in thisarea. The expected combined effect of the information createdby these activities is to decrease the risk to a level deemed ac-ceptable.
C. Combination Chart
The convenient format of the risk reduction profile can beadded to the TPM tracking chart to monitor the risk inherent in
12TPM tracking also enables margin management methods (e.g., [41, p. 62]).
Fig. 8. Combination TPM and risk tracking chart.
Fig. 9. Change in performance risk over time.
a TPM level (Fig. 8). Each risk level is computed as discussedin Section III-D.
At the beginning of a project, TPM and risk reductionprofiles are plans, forecasts, predictions. Planned profiles likethose above are based on the inputs of experts who have experi-ence with similar types of products, projects, and technologies.Planned profiles integrate their experience, knowledge, andopinions into a format that helps planners and managers makedecisions. It is by no means a perfect situation, a good plannerassumes the forecast is wrong. Yet, using TPM profiles—basedon planned events in the PD process—presents the best infor-mation available in a helpful format. As the project proceeds,revised TPM estimates or actual values replace or supplementthe projections.
V. ADDING CUSTOMER VALUE BY DECREASING
PERFORMANCERISK
If adding customer value equates with reducing performancerisk, , how can this effect be measured over specific time in-tervals? How much customer value is added betweenand
? Or, how much has been reduced between and ?Fig. 9 shows an example risk reduction profile for a project (cf.,Fig. 1). During some interval, , information is created thatprovides some risk reduction, . The profile in Fig. 9 sug-gests continuously added value. Fig. 10 depicts some alterna-tive performance risk reduction profiles. Project A reduces riskquickly and then has diminishing returns. Project B makes slowprogress at first but then advances quickly.13 Project C has pe-
13Profiles A and B are like the profiles proposed by Krishnan [37] for taskevolution. The concept is similar.

BROWNING et al.: ADDING VALUE IN PRODUCT DEVELOPMENT 449
Fig. 10. Alternative performance risk reduction profiles.
Fig. 11. Reduction in unacceptable outcomes fromt to t .
riods of increasing risk when problems are detected; this profileis probably the most realistic. Project D is never able to reduceperformance risk to satisfactory levels.
The profiles are functions of how new information affects theTPMs (including uncertainty) and the impact of falling short ofrequirements. To illustrate, consider the TPM tracking chart inFig. 8. Let be February and let be August. Fig. 11 showsthe TPM at these two times with the uncertainties representedby TriPDFs. At time , useful information has been createdthat has reined in the uncertainty that was evident at time.The probability of an unacceptable outcome has decreased, andespecially poor outcomes with greater consequences have beeneliminated. The combined effect is a reduction in risk for thisTPM. Fig. 12 shows this effect for all of the data from Fig. 8.
In some circumstances, equating added value with per-formance risk reduction becomes difficult. For example,some activities may create useful information that reveals anincreasedlevel of performance risk. Do such activities havenegative value? Actually, they are revising (downward) thevalue supposedly added by previous activities (q.v., the down-ward-sloped portions of trajectory C in Fig. 10). The value theyadd is to increase certainty about the value added. Browning [8]discusses market risk (or “customer value risk”) as another cat-egory of risk in addition to performance risk. Indeed, activitiescan add value in several areas and from several perspectives, inaddition to the customers’. However, this paper focuses on thecustomer value added through performance risk reduction.
VI. TPM BEHAVIOR
Over the course of a project, predicting TPM behavior isdifficult. TPM starting points depend on the quality of initialestimates. For many TPMs, their change over the intervalto seems random. For example, Cusumano and Selbyshow defect (bug) TPMs for Microsoft Excel 5.0 and MicrosoftWord 4.0 where the overall effect is a gradual decrease butthe localized fluctuation seems random [20, pp. 318, 324].McDaniel [40] also documents that design quality did notimprove monotonically over design time for aspects of anautomotive design process. While progress occurs in one area,other activities discover new problems. There is no guaranteethat problems will be solved faster than they are discoveredduring any given interval. Global composite performance mayimprove more steadily, but local performance (represented bya TPM) may seem more random. In many cases, however, thedirection and approximate magnitude of a TPM change duringa specific interval can be predicted by an experienced personwith knowledge of the information created during the interval[47]. If an interval contains a number of design decisions, theexpected result may be improved performance. On the otherhand, an interval containing many tests and reviews may leadto decreased TPM estimates.
VII. L INKING PERFORMANCERISK REDUCTION TO PDACTIVITIES
Linking a TPM change to a risk reduction provides a way toquantify progress that accounts for the value of uncertainty re-duction in PD. Current practice involves TPM estimates linkedto certain activities and/or events (which result from one or moreactivities).14 Risk waterfall charts also show anticipated and ac-tual risk reductions caused by specific activities and/or events.If risk remains high during the course of a project, additionalactivities may be added to the originally planned set to achievethe desired risk reductions. Hence, current practice supports thelink between thecompletion of specific activitiesand thereduc-tion of specific risks[16].
Some activities make a direct contribution to a change in aparticular TPM and/or its bounds. Other activities may onlymake an indirect contribution, by providing information to anactivity that has a direct effect. Determining the effect of an ac-tivity on a TPM requires thinking about how having that infor-mation would affect the TPM, including its bounds.
Each link and its strength can be recorded in anac-tivity-to-TPM table, such as the example shown in the nextsection (Table II). The activity-to-TPM table provides someinteresting insights. For example, looking across a row of thetable, one gets an idea about the direct effects of an activityon all TPMs. Some activities affect only one or a few TPMs,while other activities may have more global impacts on thedesign. If the table includes all PD activities, then it may lookrelatively sparse: many activities may not have adirect effecton any TPM. Reading down a column in the table is similar tolooking at a TPM’s planned trajectory. One can ask if enoughactivities (e.g., analyses, tests, verifications, etc.) have been
14Here, we define activities broadly as any effort resulting in new information,including decisions and reviews.

450 IEEE TRANSACTIONS ON ENGINEERING MANAGEMENT, VOL. 49, NO. 4, NOVEMBER 2002
Fig. 12. Another view of the combination TPM and risk tracking chart.
included in the planned PD process to reduce risk sufficiently ina given area. This matter is important since PD activity networkmodels—which are often relied on to analyze cost and schedulerisk—assume a deterministic set of activities and relationships.
While it is impossible to forecast accurately the outcomes offuture activities, TPMs, and risks, itispossible to systematicallyaccount for the best historical data and expert knowledge in thedevelopment organization regarding the typical effects of cer-tain types of activities on various dimensions of technical per-formance and risk.
VIII. A N INDUSTRIAL EXAMPLE: UCAV
As the basis for a contrived example of product performance,we use data collected from activities in the preliminary designprocess of a UCAV.15 In this case, the purpose of the preliminarydesign phase is to do the background work necessary for prepa-ration of a proposal to the customer (here, the U.S. Air Force).The designers must create enough information to increase theirconfidence in the proposed design to a certain level. After all,they must have reasonable confidence that they can actually de-sign (in detail) and build what they propose.
This section presents the UCAV data in the activity-to-TPMtable and discusses how insights from the table led to the iden-tification of additional activities. Then, a hypothetical projectexecution is presented and discussed.
A. Activity-to-TPM Table
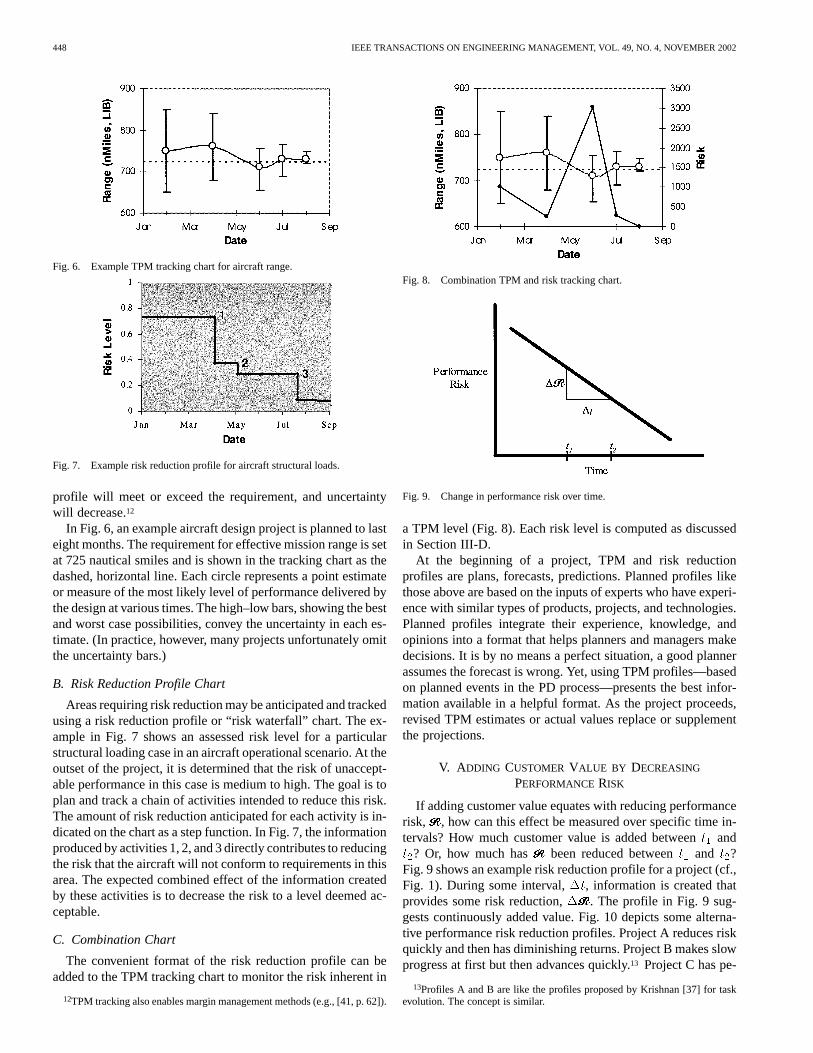
The example activity-to-TPM table in Table II lists 14UCAV preliminary design activities and shows their typical,anticipated, direct effects on each of four TPMs. Listed in
15The UCAV data were provided by The Boeing Company and are fully doc-umented in [8].
the rows of the table, activities are arranged in anticipatedchronological order. Columns represent TPMs.16 Each entry inthe table shows the forecasted effect of an activity on a TPM.A “T” represents setting or modifying a target, which is doneat the beginning of the project and again when the proposalis prepared at the end of the project. An “IE” entry indicatesthat an initial estimate is made for a TPM for which no priorestimates or measures existed. Numbered entries correspond toone of the nine types of effects given in Fig. 13. Each numberedeffect also has a magnitude, shown by the cell’s backgroundpattern and shading. In two cases, two numbers are separatedby a comma. These two entries indicate one type of effect onthe first pass and another type of effect on successive iterationsof the activity.
The data in the activity-to-TPM table are similar to the data inTPM tracking charts, yet with some important differences. Anactivity-to-TPM table is not intended to replace TPM trackingcharts and their graphical advantages. Rather, it links the entireset of project activities and TPMs (not all of which are shown inthe example), thereby integrating the planning and managementof both with the rest of PD process planning and management.The process of building and verifying an activity-to-TPM tablehelps project planners ensure that all essential customer value-adding activities are included in the statement of work.
A quick overview of Table II’s columns reveals a lack of ef-fect on certain TPMs. This type of examination helps identifymissing activities. For example, certain aspects of the UCAV
16If the number of activities or TPMs becomes large, they can be groupedusing hierarchical headings like those used for quality function deployment(QFD) matrices. The activity-to-TPM table is reminiscent of a QFD matrix (e.g.,[2] and [29]). However, while a QFD matrix typically (initially) maps customerdesires to functional solutions, the activity-to-TPM table maps customer de-sires to the activities that will create those functional solutions. The use of eachmethod may inform the other.

BROWNING et al.: ADDING VALUE IN PRODUCT DEVELOPMENT 451
Fig. 13. Types of activity effects on TPMs.
system design such as avionics, propulsion, communications,and other subsystems, which have an impact on reliability, arenot accounted for in the existing process. As a result, projectparticipants mentioned several preliminary design activities thatthey felt ought to be added. These are summarized in an exten-sion to the activity-to-TPM table (Table III). (Since activitieswere added on a TPM-by-TPM basis, each has not yet beenevaluated regarding its potential effects on the other TPMs.)Other activities, such as performance and signature analyses,were also absent from the preliminary design process. Thus,examining columns of the activity-to-TPM table provides anopportunity to establish the bounds of the process more ade-quately by ensuring the inclusion of all activities necessary toreduce uncertainty in important areas. Or, in some cases, activ-ities may affect a TPM, but the magnitude of the effect mightbe too small—another case in which additional activities maybe necessary. The activity-to-TPM table helps verify the exis-tence of a sufficient chain of value-adding activities designedto reduce risk to acceptable levels for important dimensions ofproduct performance.
The information may affect a TPM in several ways. It maycause the MLV to go up or down, and it may cause the TPMbounds (BCV and WCV) to widen or narrow. Types of effectsare categorized in Fig. 13 for a LIB TPM. (Simply exchangethe first and third row labels in the figure for a SIB TPM.) Inaddition to a directional effect, the magnitude of an activity’seffect on a TPM may typically be “small,” “medium,” or“large.” When a TPM trajectory or risk reduction profile isforecast early in a PD project, the typical effects of the activitiesassociated with each change can be classified as one of thetypes and strengths. While effects such as number nine inFig. 13 may not be desired, sometimes they can be anticipated.For example, those familiar with aircraft design will recognizethe trend for aircraft weight estimates (a SIB TPM) to go up asthe result of doing certain activities.
At the beginning of a project, data in an activity-to-TPMtable represent the estimates, forecasts, and opinions that go intoa plan. As the development effort proceeds, entries in the ac-tivity-to-TPM table can be replaced by revised estimates and ac-tual results. Alternatively, an activity-to-TPM table can be built
452 IEEE TRANSACTIONS ON ENGINEERING MANAGEMENT, VOL. 49, NO. 4, NOVEMBER 2002
TABLE IIEXAMPLE ACTIVITY -TO-TPM UCAV
TABLE IIIADDITIONAL ACTIVITIES TO ADD TO UCAV PRELIMINARY DESIGN PROCESS
with an additional subcolumn under each TPM for actuals asthey become available. This format enables quick comparisonand post-project analysis of the organization’s forecasting ca-pabilities.
B. Hypothetical Project Planning and Execution
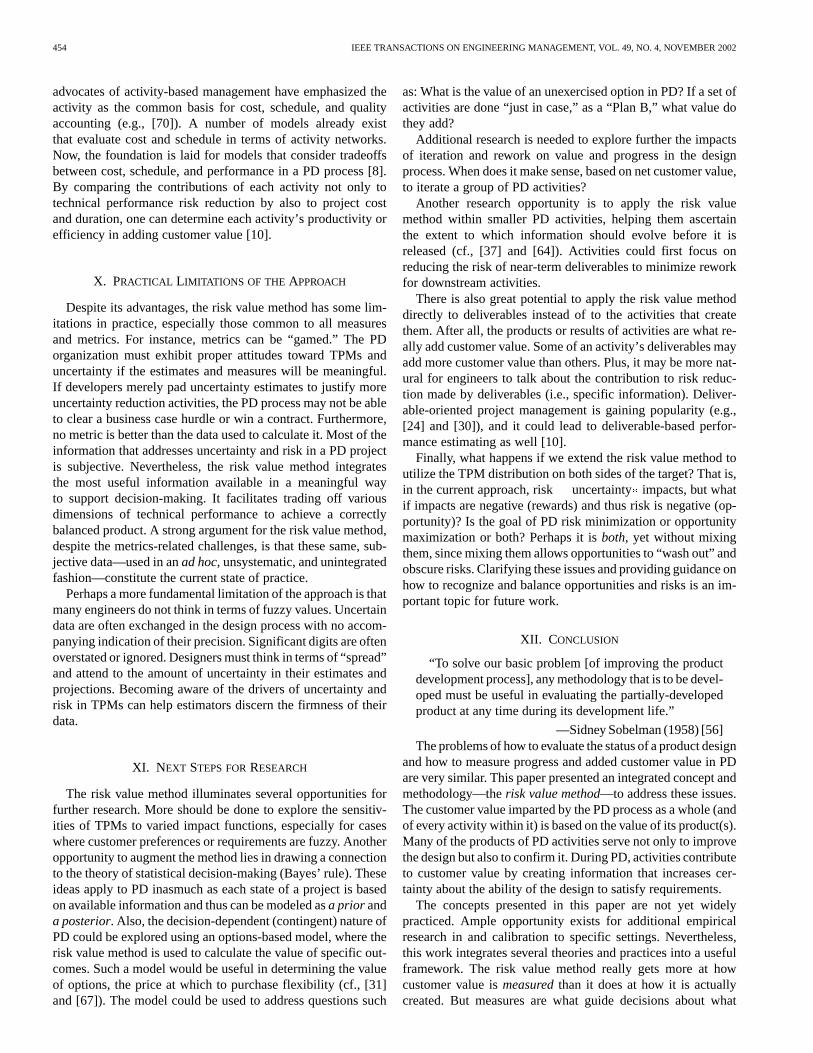
Given the activities and TPMs in Table II, project plannersmight anticipate TPM and risk-level profiles such as those inFig. 14. Based on the results of the conceptual design phase,each TPM has a PDF and target as shown at week zero of thepreliminary design phase.17 (Week zero corresponds to timein Table I.) Fig. 15 shows the planned profile for overall riskreduction.
The planned profiles show risk reductions for each TPM ex-cept detectability. The lack of effect on detectability should spur
17Technically, an initial estimate of reliability is not made until the completionof activity two, about week two.
project planners to consider adding one or more activities to ad-dress the detectability of the UCAV during the preliminary de-sign phase, such as the signature analysis activity suggested inTable III. Similarly, the activities suggested in Table III mightalso reduce the remaining risk in reliability. The design processwill have to be tailored in accordance with the existing designconcept and customer preferences so that it contains the appro-priate activities to satisfactorily reduce risk.
It is worth pointing out that some activities have a propensityto increase certain risks (as discussed at the end of Section V)and that such activities should not be hastily removed from PDprocesses as a result. For example, looking at the risk profile forrange in Fig. 14, the risk level drops to zero at week 19, afterthe positive effect of completing the structural strength, stiff-ness, and life evaluation. Since range risk is then zero, does thatmean the PD process no longer must pay attention to UCAVrange, and that downstream activities geared to reducing uncer-
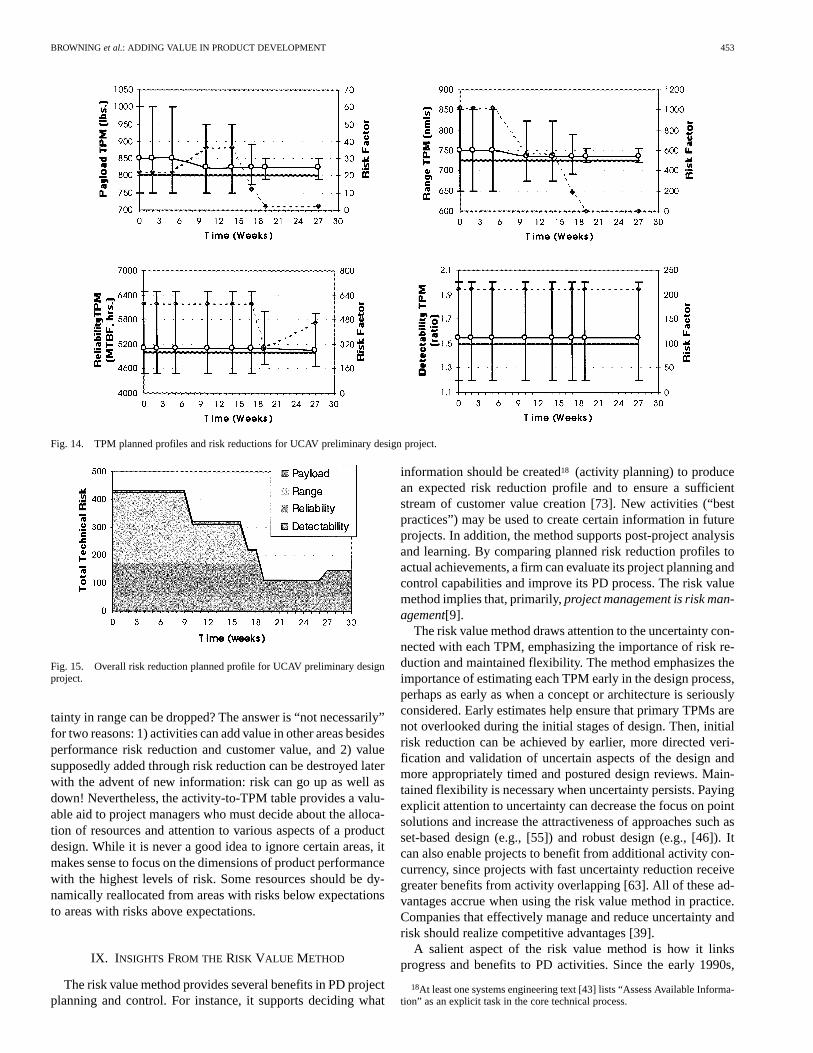
BROWNING et al.: ADDING VALUE IN PRODUCT DEVELOPMENT 453
Fig. 14. TPM planned profiles and risk reductions for UCAV preliminary design project.
Fig. 15. Overall risk reduction planned profile for UCAV preliminary designproject.
tainty in range can be dropped? The answer is “not necessarily”for two reasons: 1) activities can add value in other areas besidesperformance risk reduction and customer value, and 2) valuesupposedly added through risk reduction can be destroyed laterwith the advent of new information: risk can go up as well asdown! Nevertheless, the activity-to-TPM table provides a valu-able aid to project managers who must decide about the alloca-tion of resources and attention to various aspects of a productdesign. While it is never a good idea to ignore certain areas, itmakes sense to focus on the dimensions of product performancewith the highest levels of risk. Some resources should be dy-namically reallocated from areas with risks below expectationsto areas with risks above expectations.
IX. I NSIGHTSFROM THE RISK VALUE METHOD
The risk value method provides several benefits in PD projectplanning and control. For instance, it supports deciding what
information should be created18 (activity planning) to producean expected risk reduction profile and to ensure a sufficientstream of customer value creation [73]. New activities (“bestpractices”) may be used to create certain information in futureprojects. In addition, the method supports post-project analysisand learning. By comparing planned risk reduction profiles toactual achievements, a firm can evaluate its project planning andcontrol capabilities and improve its PD process. The risk valuemethod implies that, primarily,project management is risk man-agement[9].
The risk value method draws attention to the uncertainty con-nected with each TPM, emphasizing the importance of risk re-duction and maintained flexibility. The method emphasizes theimportance of estimating each TPM early in the design process,perhaps as early as when a concept or architecture is seriouslyconsidered. Early estimates help ensure that primary TPMs arenot overlooked during the initial stages of design. Then, initialrisk reduction can be achieved by earlier, more directed veri-fication and validation of uncertain aspects of the design andmore appropriately timed and postured design reviews. Main-tained flexibility is necessary when uncertainty persists. Payingexplicit attention to uncertainty can decrease the focus on pointsolutions and increase the attractiveness of approaches such asset-based design (e.g., [55]) and robust design (e.g., [46]). Itcan also enable projects to benefit from additional activity con-currency, since projects with fast uncertainty reduction receivegreater benefits from activity overlapping [63]. All of these ad-vantages accrue when using the risk value method in practice.Companies that effectively manage and reduce uncertainty andrisk should realize competitive advantages [39].
A salient aspect of the risk value method is how it linksprogress and benefits to PD activities. Since the early 1990s,
18At least one systems engineering text [43] lists “Assess Available Informa-tion” as an explicit task in the core technical process.
454 IEEE TRANSACTIONS ON ENGINEERING MANAGEMENT, VOL. 49, NO. 4, NOVEMBER 2002
advocates of activity-based management have emphasized theactivity as the common basis for cost, schedule, and qualityaccounting (e.g., [70]). A number of models already existthat evaluate cost and schedule in terms of activity networks.Now, the foundation is laid for models that consider tradeoffsbetween cost, schedule, and performance in a PD process [8].By comparing the contributions of each activity not only totechnical performance risk reduction by also to project costand duration, one can determine each activity’s productivity orefficiency in adding customer value [10].
X. PRACTICAL LIMITATIONS OF THE APPROACH
Despite its advantages, the risk value method has some lim-itations in practice, especially those common to all measuresand metrics. For instance, metrics can be “gamed.” The PDorganization must exhibit proper attitudes toward TPMs anduncertainty if the estimates and measures will be meaningful.If developers merely pad uncertainty estimates to justify moreuncertainty reduction activities, the PD process may not be ableto clear a business case hurdle or win a contract. Furthermore,no metric is better than the data used to calculate it. Most of theinformation that addresses uncertainty and risk in a PD projectis subjective. Nevertheless, the risk value method integratesthe most useful information available in a meaningful wayto support decision-making. It facilitates trading off variousdimensions of technical performance to achieve a correctlybalanced product. A strong argument for the risk value method,despite the metrics-related challenges, is that these same, sub-jective data—used in anad hoc, unsystematic, and unintegratedfashion—constitute the current state of practice.
Perhaps a more fundamental limitation of the approach is thatmany engineers do not think in terms of fuzzy values. Uncertaindata are often exchanged in the design process with no accom-panying indication of their precision. Significant digits are oftenoverstated or ignored. Designers must think in terms of “spread”and attend to the amount of uncertainty in their estimates andprojections. Becoming aware of the drivers of uncertainty andrisk in TPMs can help estimators discern the firmness of theirdata.
XI. NEXT STEPS FORRESEARCH
The risk value method illuminates several opportunities forfurther research. More should be done to explore the sensitiv-ities of TPMs to varied impact functions, especially for caseswhere customer preferences or requirements are fuzzy. Anotheropportunity to augment the method lies in drawing a connectionto the theory of statistical decision-making (Bayes’ rule). Theseideas apply to PD inasmuch as each state of a project is basedon available information and thus can be modeled asa prior anda posterior. Also, the decision-dependent (contingent) nature ofPD could be explored using an options-based model, where therisk value method is used to calculate the value of specific out-comes. Such a model would be useful in determining the valueof options, the price at which to purchase flexibility (cf., [31]and [67]). The model could be used to address questions such
as: What is the value of an unexercised option in PD? If a set ofactivities are done “just in case,” as a “Plan B,” what value dothey add?
Additional research is needed to explore further the impactsof iteration and rework on value and progress in the designprocess. When does it make sense, based on net customer value,to iterate a group of PD activities?
Another research opportunity is to apply the risk valuemethod within smaller PD activities, helping them ascertainthe extent to which information should evolve before it isreleased (cf., [37] and [64]). Activities could first focus onreducing the risk of near-term deliverables to minimize reworkfor downstream activities.
There is also great potential to apply the risk value methoddirectly to deliverables instead of to the activities that createthem. After all, the products or results of activities are what re-ally add customer value. Some of an activity’s deliverables mayadd more customer value than others. Plus, it may be more nat-ural for engineers to talk about the contribution to risk reduc-tion made by deliverables (i.e., specific information). Deliver-able-oriented project management is gaining popularity (e.g.,[24] and [30]), and it could lead to deliverable-based perfor-mance estimating as well [10].
Finally, what happens if we extend the risk value method toutilize the TPM distribution on both sides of the target? That is,in the current approach, risk uncertainty impacts, but whatif impacts are negative (rewards) and thus risk is negative (op-portunity)? Is the goal of PD risk minimization or opportunitymaximization or both? Perhaps it isboth, yet without mixingthem, since mixing them allows opportunities to “wash out” andobscure risks. Clarifying these issues and providing guidance onhow to recognize and balance opportunities and risks is an im-portant topic for future work.
XII. CONCLUSION
“To solve our basic problem [of improving the productdevelopment process], any methodology that is to be devel-oped must be useful in evaluating the partially-developedproduct at any time during its development life.”
—Sidney Sobelman (1958) [56]The problems of how to evaluate the status of a product design
and how to measure progress and added customer value in PDare very similar. This paper presented an integrated concept andmethodology—therisk value method—to address these issues.The customer value imparted by the PD process as a whole (andof every activity within it) is based on the value of its product(s).Many of the products of PD activities serve not only to improvethe design but also to confirm it. During PD, activities contributeto customer value by creating information that increases cer-tainty about the ability of the design to satisfy requirements.
The concepts presented in this paper are not yet widelypracticed. Ample opportunity exists for additional empiricalresearch in and calibration to specific settings. Nevertheless,this work integrates several theories and practices into a usefulframework. The risk value method really gets more at howcustomer value ismeasuredthan it does at how it is actuallycreated. But measures are what guide decisions about what

BROWNING et al.: ADDING VALUE IN PRODUCT DEVELOPMENT 455
additional customer value remains to be added and, therefore,project planning and control.
In closing, consider the value of certainty and predictability,both to the PD organization and to the customer. Customers ofcommercial products usually assume the PD organization hasconfidence in its products. After all, the PD firm has a reputa-tion to maintain. This aspect of certainty is primarily of valueto the PD enterprise. However, especially in the case of large,novel, complex systems, “low risk” is clearly a criterion of cus-tomer preference (because the customer is really buying a PDprocess as well as a product). At least in these cases, if not moregenerally, certainty is of direct value to the customer.Certaintyalso translates into an increased ability for PD project managersto establish and fulfillcommitmentsandexpectations. Recently,a government customer project manager said thatcredibility,manifest as the ratio of expectations met to expectations set, washis primary measure of the value provided by contractors.
It is also helpful to turn the problem around and considerthe cost of uncertainty. Uncertainty has many costs duringPD—e.g., costs of resource buffers and options—and thesecosts are passed along to the customer as higher acquisitioncosts. Whether the customer considers certainty explicitly ornot, product costs reflect the costs of uncertainty. Reducinguncertainty in PD increases customer value by improvingaffordability.
APPENDIX
COMPOSITEPERFORMANCEMEASURE APPROACH TO
QUANTIFYING PERFORMANCERISK
Composite Performance Measure
The overall performance of complex products depends on anumber of TPMs. During PD, a single TPM may fluctuate likean individual security in a stock market. Moreover, TPMs maybe coupled in various ways. To get an idea of the overall perfor-mance level of a design, one can use acomposite performancemeasure(CPM) or global objective function that may take TPMinteractions into account. The CPM discussed in this Appendixprovides an alternative approach to (3) for determining overallproduct performance risk, .
Several issues make it challenging to construct an acceptableCPM. What approach should be used to evaluate the perfor-mance of the overall design? Does it depend on the bestbal-anceof all the TPMs? How much should extremely good or badTPMs affect the CPM? How can the CPM account for the rela-tive importance of TPMs? Will the design strategy be aggressive(risk taking) or conservative (risk averse)? These issues influ-ence the type of CPM used. Otto and Antonsson [44] discussthem in detail. Another issue is ensuring completeness of theCPM. Also, it may be important that problems deep within thedesign surface in the CPM. On the other hand, customer percep-tion of the product may depend mostly on just a few TPMs (suchas aircraft payload, range, speed, operating cost, and safety), inwhich case a simple objective function may suffice for someanalyses.
Several types of CPMs have been proposed in the literature.(See [12] and [21] for additional reviews.) The simplest is theweighted, arithmetic mean of the TPMs (e.g., [33]), where
weighting factors serve both to represent the relative impor-tance of the elements and to normalize the units. The weightingfactors can be determined from customer preferences using anapproach such as theanalytic hierarchy process(AHP—e.g.,[41], [72]). The advantage of the arithmetic mean is its sim-plicity. However, it does not handle outliers well: a TPM ofrelatively minor importance can ruin a product, but this wouldnot show up in the CPM.
A second approach to building a CPM is the weighted geo-metric mean. This method is similar to the arithmetic mean ex-cept that the TPMs and their weighting factors are multipliedinstead of added, and theth root is taken (instead of dividingby ), where is the number of TPMs. The geometric meanimproves the awareness of outliers, because any TPM close tozero will cause the entire CPM to diminish significantly. How-ever, both the geometric and arithmetic means assume a linearrelationship between customer preferences and TPM levels. Infact, customer preferences tend to vary nonlinearly with perfor-mance levels (e.g., Fig. 5).
A third method for constructing a CPM is based onmulti-attribute utility theory(MAUT—e.g., [23], [35]). The CPM isbased on a multiplicative relationship between scaling factorsand single attribute utility curves. The utility levels of each TPMare combined to yield the utility of the CPM
(4)
where is a normalization factor, determined such thatwhen all the and
when all the , and the are scaling factors[23, p. 410]. Thurston and Locascio [68], [69] applied MAUTto product design evaluation and tradeoff support.19 The maindrawback to the MAUT approach is its relative complexityand the amount of data required (single attribute utility curvesand scaling factors). However, these data are not superfluous;they should already exist somewhere, in some format, in theorganization. (If not, then they should be documented and madereadily available to product designers.)
Other techniques of CPM construction have also beenproposed. Cook [17] presents an approach called multiattributevalue theory, a hybrid additive and multiplicative method usingmarginal changes in TPMs derived through ANOVA. Brinket al. [7] use a customer satisfaction index similar to MAUT.Rather than striving for a generic CPM technique, some suggestconstructing a unique CPM based on the particular relation-ships between the TPMs involved (e.g., [4]), yet this may beimpractical for complex products. Woodet al.[44], [76] presentthe ”method of imprecision” as an alternative to MAUT thatcan accommodate several types of design strategies. Otto andAntonsson [44] also present four axioms for CPM construction.
Three points remain to be noted. First, the concepts andmethods presented in this paper could apply using any of theabove methods of CPM construction. Second, the CPM must
19The MAUT approach can also be used in reverse to analyze customer pref-erences for various product scenarios (combinations of TPMs, features, etc.).A designed experiment can maximize the information gathered from a minimalnumber of scenarios. Analysis of Variance (ANOVA) can be used to extractscaling factors and single attribute utility curves.

456 IEEE TRANSACTIONS ON ENGINEERING MANAGEMENT, VOL. 49, NO. 4, NOVEMBER 2002
completely span the requirements and items valued by the cus-tomer. When a complex system has thousands of requirements,this is tough. Sometimes many requirements can be groupedinto a TPM called “defects” or “nonconformances.” Third,CPMs are an abstraction, and as such they omit certain infor-mation. Some of the information neglected by the weightedmean approach was mentioned above. Bahillet al.[3] discusssome of the difficulties and pitfalls in using any CPM. Methodsfor building CPMs remain a fertile area for further research.
Getting To Product Performance Risk
When the inputs to the CPM are random variables, the CPMbecomes a random variable. Thus, a PDF can represent a CPMas well as a TPM.20 If the PDF in Fig. 2 represents a CPM, thenthe requirements line is derived as the CPM of the individualTPM requirements. Additional vertical lines could be added torepresent competitive products or alternative market segments.Together, the PDF and the requirements line determine the prob-ability of an unacceptable design. These and an impact func-tion determine the composite performance risk. At the CPMlevel, the consequences of unacceptable designs may be moreobvious, e.g., fewer units sold. Using the PDF of the CPM andan appropriate target and impact function, (2) determines.
An important issue in risk management is whether it is pos-sible or advisable to “roll up” risks from deep within a design.The rollup tends to obscure individual risks. Looking only atthe CPM, how can one determine if the risk stems from one ex-tremely risky TPM or from several low-risk TPMs? Part of theproblem can be addressed by the choice of impact function. Ifa shortcoming in a particular TPM will really ruin the wholeproject, the impact function (and the scaling constants) shouldreflect this importance. In some cases, for purposes of identi-fying risk areas, it may be appropriate to roll up the pessimistic(worst case) TPM estimates. In any case, a CPM should not beused alone. A helpful companion is a list of the critical risk con-tributors, which falls in line with the approach recommended inthe body of the paper.
The body of the paper recommends gettingby simply sum-ming all [see (3)]. This Appendix has presented an al-ternative approach, deriving a CPM using MAUT. In compar-ison, a weakness of the CPM approach is the difficulty in seeingthe effect of large risks in particular TPMs. Other drawbacks tothe CPM approach are that it is more cumbersome and it requiressophisticated information about customer preferences. The ad-vantage of the MAUT CPM approach lies in its ability to repre-sent confounding effects among TPMs. Single attribute utilitycurves assume that customer preferences can be evaluated foreach TPM independently. However, customer preferences formost attributes are not independent, especially near the extremesof the utility scale. Case studies comparing thevalues gener-ated by the two approaches (and the effort to obtain them) areneeded to identify guidelines for their appropriate use in spe-cific situations.
20This paper treats TPMs and the CPM stochastically and the utility curvesand scaling factors deterministically. However, an argument can be made foraddressing the uncertainty inherent in the latter factors as well.
ACKNOWLEDGMENT
This paper draws on material from [8, Ch. 7] and [11]. H. Mc-Manus, J. Dean, and two anonymous reviewers provided helpfulcomments that improved the paper.
REFERENCES
[1] R. Ahmadi and R. H. Wang, “Managing development risk in productdesign processes,”Oper. Res., vol. 47, no. 2, pp. 235–246, 1999.
[2] Y. Akao, Ed.,Quality Function Deployment: Integrating Customer Re-quirements into Product Design. Cambridge, MA: Productivity, 1990.
[3] T. Bahill, S. O. Dahlberg, and R. A. Lowe, “Difficulties in using mul-ticriterion decision making techniques for selecting amongst alternativeconcepts,” inEighth Annu. Int. Symp. INCOSE, Vancouver, BC, Canada,1998, pp. 165–170.
[4] D. G. Bell, S. M. Kannapan, and D. L. Taylor, “Product developmentprocess dynamics,” inASME Fourth Int. Conf. Design Theory andMethodology, Scottsdale, AZ, 1992, pp. 257–266.
[5] B. S. Blanchard,System Engineering Management, Second ed. NewYork: Wiley, 1997.
[6] D. Braha and O. Maimon, “The design process: Properties, paradigms,and structure,”IEEE Trans. Syst., Man, Cybern., vol. 27, pp. 146–166,Apr. 1997.
[7] J. R. Brink, G. D. Peisert, and C. Ventresca, “Managing research and de-velopment projects: A systems engineering approach in the early stagesof design,” inNinth Annu. Int. Symp. INCOSE, Brighton, U.K., 1999,pp. 1233–1242.
[8] T. R. Browning, “Modeling and analyzing cost, schedule, and perfor-mance in complex system product development,” Ph.D. dissertation,Massachusetts Instit. Technol., Cambridge, MA, 1998.
[9] , “Sources of performance risk in complex system development,”in Ninth Annu. Int. Symp. INCOSE, Brighton, U.K., 1999, pp. 711–718.
[10] , “On customer value and improvement in product developmentprocesses,”System Eng., vol. 6, no. 1, 2003.
[11] T. R. Browning, J. J. Deyst, S. D. Eppinger, and D. E. Whitney, “Com-plex system product development: Adding value by creating informationand reducing risk,” inTenth Annu. Int. Symp. INCOSE, Minneapolis,MN, 2000, pp. 581–589.
[12] D. M. Buede, The Engineering Design of Systems: Models andMethods. New York: Wiley, 2000.
[13] T. Burns and G. M. Stalker,The Management of Innovation. London,U.K.: Tavistock, 1961.
[14] K. B. Clark and T. Fujimoto,Product Development Performance:Strategy, Organization, and Management in the World Auto In-dustry. Boston, MA: Harvard Business School Press, 1991.
[15] K. B. Clark and S. C. Wheelwright,Managing New Product and ProcessDevelopment. New York: Free Press, 1993.
[16] C. Coleman, K. Kulick, and N. Pisano, “Technical performance mea-surement (TPM) retrospective implementation and concept validationon the T45ts cockpit-21 program,” Program Executive Office for AirAnti-Submarine Warfare, Assault, and Special Mission Programs, WhitePaper, Apr. 1996.
[17] H. E. Cook, “New avenues to total quality management,”ManufacturingRev., vol. 5, no. 4, pp. 284–292, 1992.
[18] K. G. Cooper, “The rework cycle: Benchmarks for the project manager,”Project Management J., vol. 24, no. 1, pp. 17–21, 1993.
[19] , “The rework cycle: Why projects are mismanaged,”PMNETwork,Feb. 1993.
[20] M. A. Cusumano and R. W. Selby,Microsoft Secrets: How the World’sMost Powerful Software Company Creates Technology, Shapes Markets,and Manages People. New York: Free Press, 1995.
[21] J. Daniels, P. W. Werner, and A. T. Bahill, “Quantitative methods fortradeoff analyses,”Syst. Eng., vol. 4, no. 3, pp. 190–212, 2001.
[22] A. De Meyer, C. H. Loch, and M. T. Pich, “Managing project uncer-tainty: From variation to chaos,”Sloan Management Rev., vol. 43, no. 2,pp. 60–67, 2002.
[23] R. de Neufville,Applied Systems Analysis: Engineering Planning andTechnology Management. New York: McGraw-Hill, 1990.
[24] DHBA, “WTC OpCenter: Introducing deliverable-oriented project man-agement ,” D. H. Brown Associates, New York, DHBA Product Defini-tion and Commercialization (PDC) Report, 1999.
[25] Systems Engineering Management Guide, Defense Systems Manage-ment College, Fort Belvoir, VA, 1990.
[26] S. D. Eppinger, D. E. Whitney, R. P. Smith, and D. A. Gebala, “A model-based method for organizing tasks in product development,”Res. Eng.Design, vol. 6, pp. 1–13, 1994.
[27] E. M. Goldratt,Critical Chain. Great Barrington, MA: North RiverPress, 1997.

BROWNING et al.: ADDING VALUE IN PRODUCT DEVELOPMENT 457
[28] E. Harmon, “Anatomy of the product and process design process,” pre-sentation to the Lean Aerospace Initiative Product Development FocusTeam, Northrop Grumman, 1999.
[29] J. R. Hauser and D. Clausing, “The house of quality,”Harvard BusinessRev., vol. 66, pp. 63–73, 1988.
[30] P. A. Howard, “Deliverable-Oriented project management,” inProjectWorld ’98, 1998.
[31] A. Huchzermeier and C. H. Loch, “Project management under risk:Using the real options approach to evaluate flexibility in R&D,”Management Sci., vol. 47, no. 1, pp. 85–101, 2001.
[32] D. S. Huff, “Prophet —The engine for integrated risk management,”in Seventh Annu. Int. Symp. INCOSE, Los Angeles, 1997, pp. 737–743.
[33] J. W. Hunger,Enigneering the System Solution: A Practical Guide toDeveloping Systems. Englewood Cliffs, NJ: Prentice Hall PTR, 1995.
[34] R. Justice, “Risk in the F-22 program: A defense science board task forceanalyzes F-22 concurrency and risk,”Program Manager, pp. 68–74,July–Aug. 1996.
[35] R. L. Keeney and H. Raiffa,Decisions With Multiple Objectives: Pref-erences, and Value Tradeoff. New York: Wiley, 1976.
[36] S. J. Kline, “Innovation is not a linear process,”Res. Management, pp.36–45, July–Aug. 1985.
[37] V. Krishnan, S. D. Eppinger, and D. E. Whitney, “A model-based frame-work to overlap product development activities,”Management Sci., vol.43, no. 4, pp. 437–451, 1997.
[38] K. A. Kulick, “Technical performance measurement: A systematic ap-proach to planning, integration, and assessment (3 Parts),” inThe Mea-surable News, 1997.
[39] N. S. Levy, “Reducing uncertainty and innovation risk in product devel-opment,” inTechnology Management Handbook, R. C. Dorf, Ed. BocaRaton, FL: Chapman & Hall/CRCnetBASE, 1999, pp. 90–96.
[40] C. D. McDaniel, “A linear systems framework for analyzing the auto-motive appearance design process,” Master’s Thesis (Mgmt./EE), MIT,Cambridge, MA, 1996.
[41] NASA Systems Engineering Handbook, NASA Headquarters, 1995.[42] P. Nightingale, “The product-process-organization relationship in com-
plex development projects,”Res. Policy, vol. 29, pp. 913–930, 2000.[43] D. W. Oliver, T. P. Kelliher, and J. J. G. Keegan,Engineering Complex
Systems with Models and Objects. New York: McGraw-Hill, 1997.[44] K. N. Otto and E. K. Antonsson, “Trade-Off strategies in engineering
design,”Res. Eng. Design, vol. 3, pp. 87–103, 1991.[45] H. Petroski,To Engineer is Human: The Role of Failure in Successful
Design. New York: St. Martin’s, 1985.[46] M. S. Phadke,Quality Engineering Using Robust Design. Englewood
Cliffs, NJ: Prentice Hall, 1989.[47] N. D. Pisano. (1996) Technical performance measurement, earned value,
and risk management: An integrated diagnostic tool for program man-agement. [Online] Available: http://www.acq.osd.mil/pm/paperpres/pa-perpres.html#pisano
[48] D. Reinertsen, “Testing: Annoyance or opportunity,”Electron. Design,vol. 46, p. 64H, 1998.
[49] , “Lean thinking isn’t so simple,”Electron. Design, vol. 47, p. 48,1999.
[50] B. B. Roberts and R. C. Winterlin, “Integrated risk assessment: A casestudy,” in Sixth Annu. Int. Symp. INCOSE, Boston, MA, 1996, pp.847–856.
[51] M. Sawhney and D. Parikh, “Where value lives in a networked world,”Harvard Business Rev., vol. 79, pp. 79–86, 2001.
[52] S. Schrader, W. M. Riggs, and R. P. Smith, “Choice over uncertainty andambiguity in technical problem solving,”J. Eng. Technol. Management,vol. 10, pp. 73–99, 1993.
[53] R. Shishko and E. J. Jorgensen, “Evaluation of risk management strate-gies for a low-cost, high-risk project,” inSixth Annu. Int. Symp. INCOSE,Boston, MA, 1996, pp. 711–718.
[54] R. Shishko and J. R. Matijevic, “Summary of results from the risk man-agement program for the mars microrover flight experiment,” inNinthAnnu. Int. Symp. INCOSE, Brighton, U.K., 1999, pp. 503–514.
[55] D. K. Sobek, A. C. Ward, and J. K. Liker, “Toyota’s principles of set-based concurrent engineering,”Sloan Management Rev., vol. 40, pp.67–83, 1999.
[56] S. Sobelman,A Modern Dynamic Approach to Product Develop-ment. Dover, NJ: Office of Technical Services (OTS), 1958.
[57] J. Sobieszczanski-Sobieski, “Multidisciplinary optimization for engi-neering systems: Achievements and potential,” NASA Langley Res.Center, Hampton, VA, Technical Memo TM-101 566, 1989.
[58] D. V. Steward,Systems Analysis and Management: Structure, Strategy,and Design. New York: PBI.
[59] N. P. Suh,The Principles of Design. New York: Oxford Univ. Press,1990.
[60] J. W. Sutherland,Administrative Decision-Making: Extending theBounds of Rationality. New York: Van Nostrand Reinhold, 1977.
[61] M. Suwa, J. Gero, and T. Purcell, “Unexpected discoveries and S-inven-tion of design requirements: Important vehicles for a design process,”Design Studies, vol. 21, no. 6, pp. 539–567, 2000.
[62] G. Taguchi and Y. Wu,Introduction to Off-Line Quality Con-trol. Nagoya, Japan: Central Japan Quality Assoc., 1980.
[63] C. Terwiesch and C. H. Loch, “The role of uncertainty reduction in con-current engineering: An analytical model and an empirical test,” IN-SEAD Working Paper 96/17/TM, Fontainebleau, France, 1996.
[64] , “Management of overlapping development activities: A frame-work for exchanging preliminary information,” INSEAD Working Paper97/117/TM, Fontainebleau, France, 1997.
[65] S. Thomke and D. Bell, “Optimal testing in product development,” Har-vard Business School, Boston, Working Paper 99-053, 1999.
[66] S. Thomke and D. E. Bell, “Sequential testing in product development,”Management Sci., vol. 47, no. 2, pp. 308–323, 2001.
[67] S. Thomke and D. Reinertsen, “Agile product development: Managingdevelopment flexibility in uncertain environments,”California Manage-ment Rev., vol. 41, no. 1, pp. 8–30, 1998.
[68] D. L. Thurston, “A formal method for subjective design evaluation withmultiple attributes,”Res. Eng. Design, vol. 3, pp. 105–122, 1991.
[69] D. L. Thurston and A. Locascio, “Multiattribute design optimizationand concurrent engineering,” inConcurrent Engineering: Contempo-rary Issues and Modern Design Tools, H. R. Parsaei and W. G. Sullivan,Eds. New York: Chapman & Hall, 1993, pp. 207–230.
[70] P. B. B. Turney, “Beyond TQM with workforce activity-based manage-ment,”Management Accounting, Sept. 1993.
[71] R. Verganti, “Leveraging on systematic learning to manage the earlyphases of product innovation projects,”R&D Management, vol. 27, no.4, pp. 377–392, 1997.
[72] J. F. Wagner, “An implementation of the analytic hierarchy process(AHP) on a large scale integrated launch vehicle avionics systems en-gineering architecture trade study,” inNinth Annu. Int. Symp. INCOSE,Brighton, U.K., 1999, pp. 1395–1403.
[73] S. I. Weiss and J. M. Warmkessel, “Systems engineering the product de-velopment value stream,” inNinth Annu. Int. Symp. INCOSE, Brighton,U.K., 1999, pp. 969–975.
[74] J. P. Womack and D. T. Jones,Lean Thinking: Banish Waste and CreateWealth in Your Corporation. New York: Simon & Schuster, 1996.
[75] J. P. Womack, D. T. Jones, and D. Roos,The Machine That Changed theWorld. New York: Rawson Associates, HarperCollins, 1990.
[76] K. L. Wood and E. K. Antonsson, “Computations with imprecise param-eters in engineering design: Background and theory,”ASME J. Mecha-nisms, Transmissions, and Automation in Design, vol. 111, no. 4, pp.616–625, 1989.
Tyson R. Browning received the B.S. degree in en-gineering physics from Abilene Christian University,Abilene, TX, and two S.M. degrees and the Ph.D. de-gree in technology, management and policy (systemsengineering and operations management) from Mass-achusetts Institute of Technology, Cambridge.
He holds the position of Senior Project Manager inIntegrated Company Operations at Lockheed MartinAeronautics Company in Fort Worth, TX. He is thetechnical lead and chief integrator for a number ofteams in developing the enterprise process architec-
ture for the Aeronautics Company. He is also the lead author of company poli-cies and processes driving the transition to a process-based company. He previ-ously worked with the Product Development Focus Team of the Lean AerospaceInitiative at MIT, conducting research at Lockheed Martin, General Electric,Boeing, Raytheon, Sundstrand, and Daimler Chrysler. He has published paperson organizational integration, risk management, the design structure matrix, andprocess modeling.
Dr. Browning is a member of INCOSE, INFORMS, and AIAA.

458 IEEE TRANSACTIONS ON ENGINEERING MANAGEMENT, VOL. 49, NO. 4, NOVEMBER 2002
John J. Deyst is Professor of aeronautics andastronautics at Massachusetts Institute of Tech-nology (MIT), where he has been teaching anddoing research in the general areas of avionics andaerospace product development. Before joiningthe MIT faculty in 1994, he worked for nearly30 years as an Engineer and Project Manger onvarious developments of guidance and controlsystems for aircraft and spacecraft. His publicationsinclude work on fault tolerant systems, control andestimation theory and applications, and methods for
enhancing productivity in the development of aerospace systems. He has servedon numerous government panels and committees concerned with issues ofintegrity for fault tolerant avionics and flight control systems; he was a previousChairman of the AIAA Guidance and Control Committee. Currently he is onthe advisory board of the SAE Aerospace Control and Guidance Committee.
Dr. Deyst is a Fellow of the AIAA.
Steven D. Eppinger(S’86–M’88) received the S.B.,S.M., and Sc.D. degrees from the Massachusetts In-stitute of Technology (MIT), Cambridge, MA.
He is currently the General Motors Professor ofManagement Science and Engineering Systems atthe Sloan School of Management, MIT. He servesas co-director of the Leaders for ManufacturingProgram and the System Design and ManagementProgram, both at MIT. His research interests includethe management of complex engineering processes.He has published articles in IEEE TRANSACTIONS
ON ENGINEERING MANAGEMENT, Management Science, ASME Journal ofMechanical Design, Research in Engineering Design, Journal of EngineeringDesign, Harvard Business Review, and other publications. He also co-au-thored the textbook entitledProduct Design and Development(New York:McGraw-Hill, 1995 and 2000).
Dr. Eppinger is a member of INFORMS.
Daniel E. Whitney (M’94-SM’00) is a SeniorResearch Scientist at the Massachusetts Institute ofTechnology (MIT) Center for Technology, Policy,and Industrial Development and Senior Lecturerin the Engineering Systems Division. He conductsresearch on product development, automation, CAD,mechanical assembly, outsourcing strategy, andcomparisons of American and Foreign companies.His main activities are in the Leaders for Manufac-turing Program, the Center for Innovation in ProductDevelopment, the System Design and Management
Program, and the Ford-MIT Alliance. He teaches mechanical assembly andproduct development in the MIT Engineering and Business Schools. Priorto joining MIT, he spent 19 years at Draper Laboratory where he conductedresearch and consulting on robotics, assembly automation, design for assembly,and CAD tools for assembly processes. He has published over 80 technicalarticles, co-authored a book on concurrent engineering, and holds a numberof patents.
Dr. Whitney is a Fellow of the ASME and a Charter Member of SME/RIA.