adding value to nzssds - cdn.auckland.ac.nz · adding value to nzssds underpinning transparency in...
TRANSCRIPT

Adding Value to NZSSDS
Underpinning Transparency in Research: establishing a template for a research repository with real-world examples
Modifying and Archiving Survey Data Sets for Teaching Purposes
1
Who are we?
Faculty of Science:
Karl Parker- BSC PGDip/MSC in Medical Statisticsp
Carmen Lim- BSC in Statistics
Faculty of Arts:
Kaylyn Oon – BA/BCom in Statistics, Marketing and Operations Management
2
Outline•Aim
•Other examples
H NZSSDS ld b d•How NZSSDS could be improved
•What we did
•How to integrate our materials in NZSSDS•How to integrate our materials in NZSSDS
•What more could be done
•Challenges we facedg
•Lessons we learnt
•Conclusion
3
Data Archiving - NZSSDS
•Aim
•Other examples
•How NZSSDS could be improvedp
4

AiAim
The NZ Social Science Data Service is an ongoing initiative being undertaken by COMPASS.
The vision is that data sets, all well documented with metadata for users, will be made publicly available for examination, basic analysis online and authorised download (via Nesstar software) to the wider research community.( ) y
Key published papers will be documented along with computer code for data manipulation and analysis.
Allow greater transparency since results can be easily replicated
Used for teaching purposes.
5
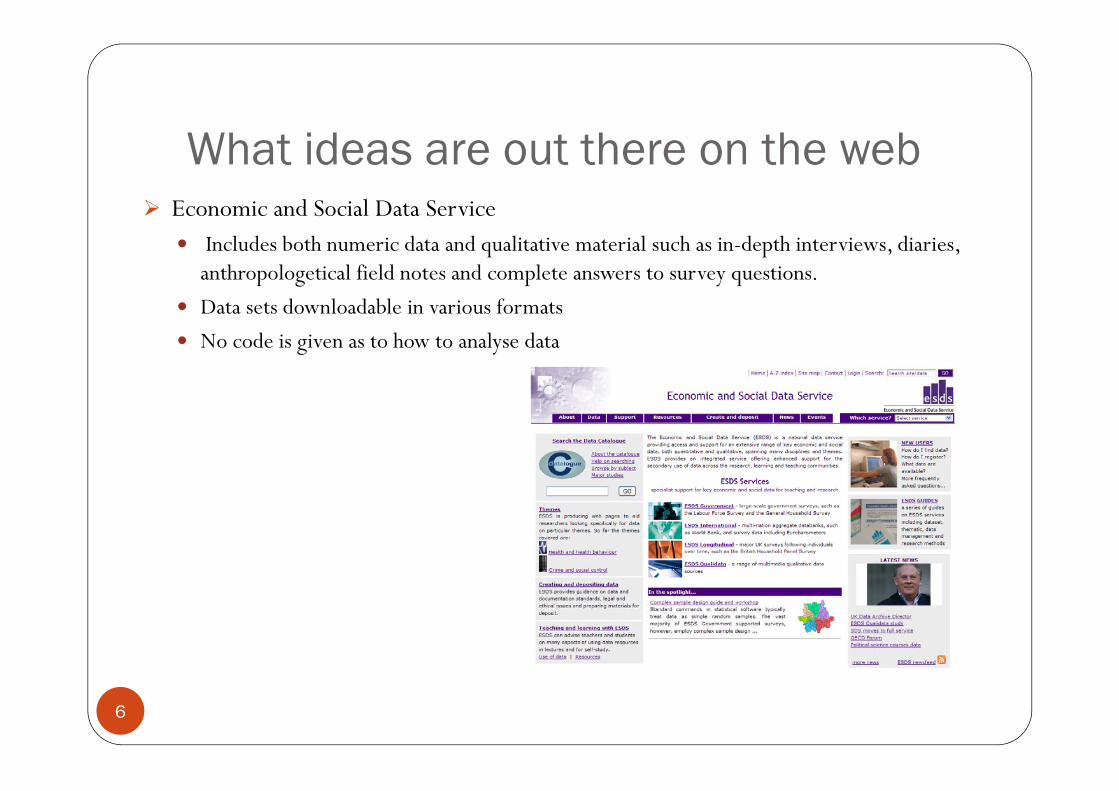
What ideas are out there on the web Economic and Social Data Service S S
Includes both numeric data and qualitative material such as in-depth interviews, diaries, anthropologetical field notes and complete answers to survey questions.
Data sets downloadable in various formats Data sets downloadable in various formats
No code is given as to how to analyse data
6
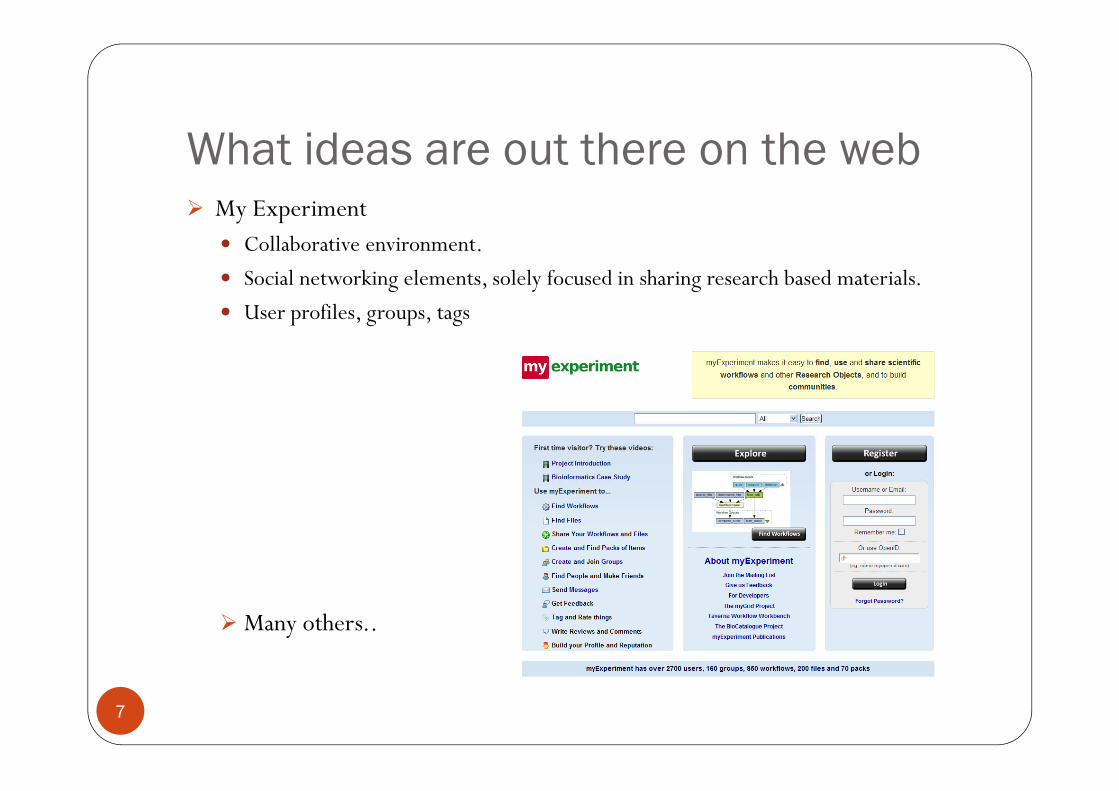
What ideas are out there on the web My Experimenty p
Collaborative environment.
Social networking elements, solely focused in sharing research based materials.
U fil User profiles, groups, tags
Many others..
7
How could NZSSDS be improved Provide a single document – ‘user guide’: a pdf containing the g g : p g
questionnaire, variables, derived variables, interviewer instructions/notes, coding etc.
N hi h ll h b i l/i f New users page which tells them about essential/important features of the website (FAQs).
Provide public with a list of “most searched items”.p
Dedicate an entire page to search results, where each result contains all the information concerning the project and related materials.
Provide a space where users can give feedback.
Make it easier to find the data sets section of the website.
Separate yet integrated ‘research’ and ‘teaching’ spaces depending on Separate yet integrated research and teaching spaces depending on need with maximum visibility and minimal drilling down.
8

Ideas implemented, what we did.Articles/Surveys
Karl’s - Do Hospital Bed Reduction and Multiple System Reform Affect Patient Mortality? A Trend and Multilevel Analysis in New Z l d O th P i d 1988 2001 M di l (2007)Zealand Over the Period 1988 – 2001 – Medical care (2007)
Carmen’s –Early Sex and Its Behavioral Consequences in New Zealand- (PRS)- (1991)( ) ( )
Kaylyn- Quality of hospital care for Maori patients in New Zealand: retrospective cross-sectional assessment- (NZQHS) - hospital records data (1998)data (1998)
Carmen and Kaylyn - The Impact of Organizational and Professional Context on Social Variation in Clinical Activity: A multi-level analysis of primary care NatMedCa 2001/2
9

Medical care - Karl
Do Hospital Bed Reduction and Multiple System Reform Affect Patient Mortality? A Trend and Multilevel Analysis in New Zealand Over the Period 1988 20011988 – 2001.
To assess the impact of hospital system restructuring on the quality of care.
Used a sample of approx six million hospital admittance records over the time Used a sample of approx six million hospital admittance records over the time period 1988 to 2001.
Used summary statistics and mixed models to analysis trends.
The results show that despite a decline in hospital beds and multiple reforms did not affect 60 day post admission death.
10

The Project
•The Beginning
•The Process
•The Product (Master File)
11

The Beginning
We started with the following files and info:
SAS Files - between 80 to 160 files.
Log/output – also between 80 to 160 files.g p
Article
Datasets – up to 6 million observations.
bl / l d d Variables/original data dictionary.
Additional files – excel spreadsheets for calculations.
12

The Process
Read article
Familiarised with variables
Locating figures in tables from SAS output
Organising code into one file for each table presented in the journal article
Rerunning SAS programmes
Read supplementary material to understand topic
Ch k i k Check mistakes
Create Master File
13

The Product
Master File
This is the documentation that contains everything that a user would need to know about the study
The purpose of the creation of the master file is to ensure that the data and The purpose of the creation of the master file is to ensure that the data and the analytical process are easy for users or students to understand and follow
Adapted from the Scottish Health Survey, Joint Health Survey Unit from the University College London
14

Master File
•Instructions to user
•User Guide
•Code and Output
15

Quality of hospital care for Maori patients in Q y p pNew Zealand - Kaylyn
Retrospective cross-sectional assessment
NZ Quality of Healthcare Study (NZQHS) - hospital records data (1998)
Objective: Assess possible disparities in quality of hospital care for Maori with data on preventable adverse events as an indicator of suboptimum treatment
C ti l f l bli h it l ith th 100 b d Cross sectional survey of general public hospitals with more than 100 beds
13 hospitals selected, 6579 patients sampled
Findings: Findings: Significant differences between groups:14% of Maori admissions were associated
with an adverse event vs. 11% for non-Maori/non-Pacific patients
N ifi f thi id t b t i li d t i b No specific causes for this were evident, but various policy and system issues can be addressed
16
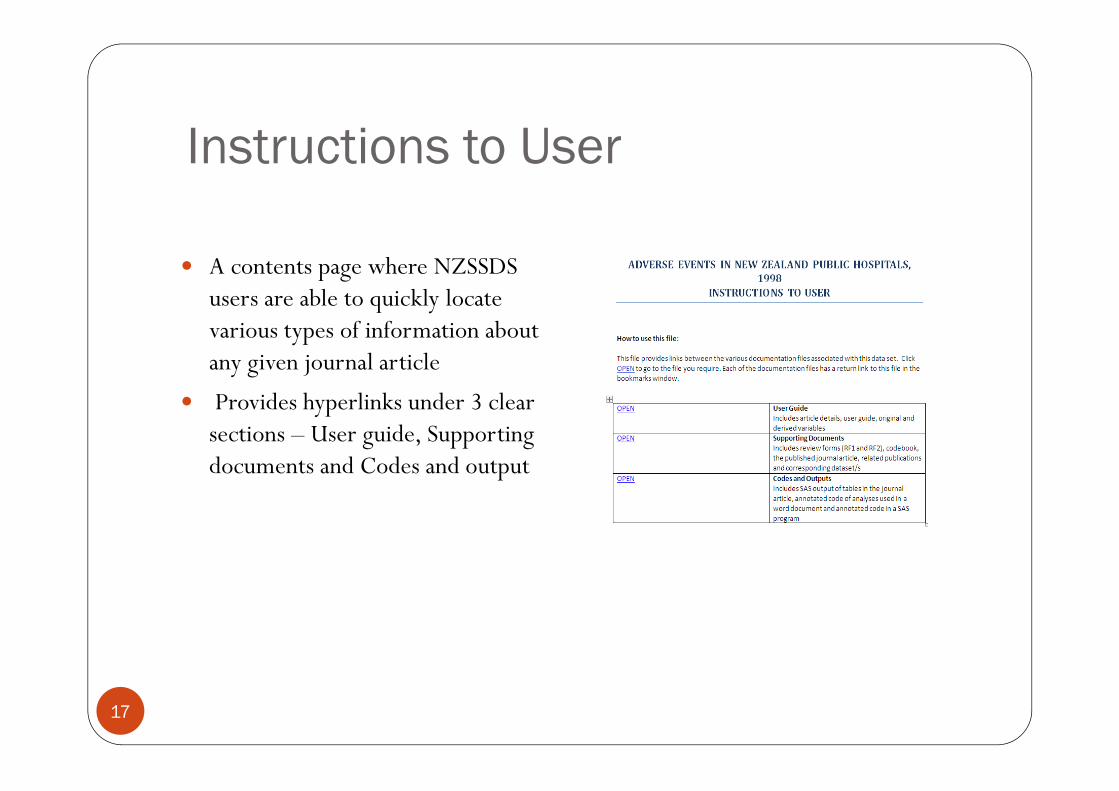
Instructions to User
A contents page where NZSSDS users are able to quickly locate q y various types of information about any given journal article
P id h li k d 3 l Provides hyperlinks under 3 clear sections – User guide, Supporting documents and Codes and output
17

User Guide
Purpose:Introduce the background & analysis of the study to the users who intend to plan on extending the analysis of the study
Divided into five sections:1. Article Details
• Background Objective Methods Conclusion• Background, Objective, Methods, Conclusion
2. Purpose of Metadata3. Using the Data
V i bl th fil• Variables on the files
4. Analyses5. Data Dictionary
O i i l V i bl• Original Variables• Derived Variables
18

Article Details
Background
Contains a brief abstract of the study
Objective of the study
Methods Methods
Survey that the study based on
Survey designy g
Conclusion
Implications
R li bili & V lidi f h d Reliability & Validity of the data
19
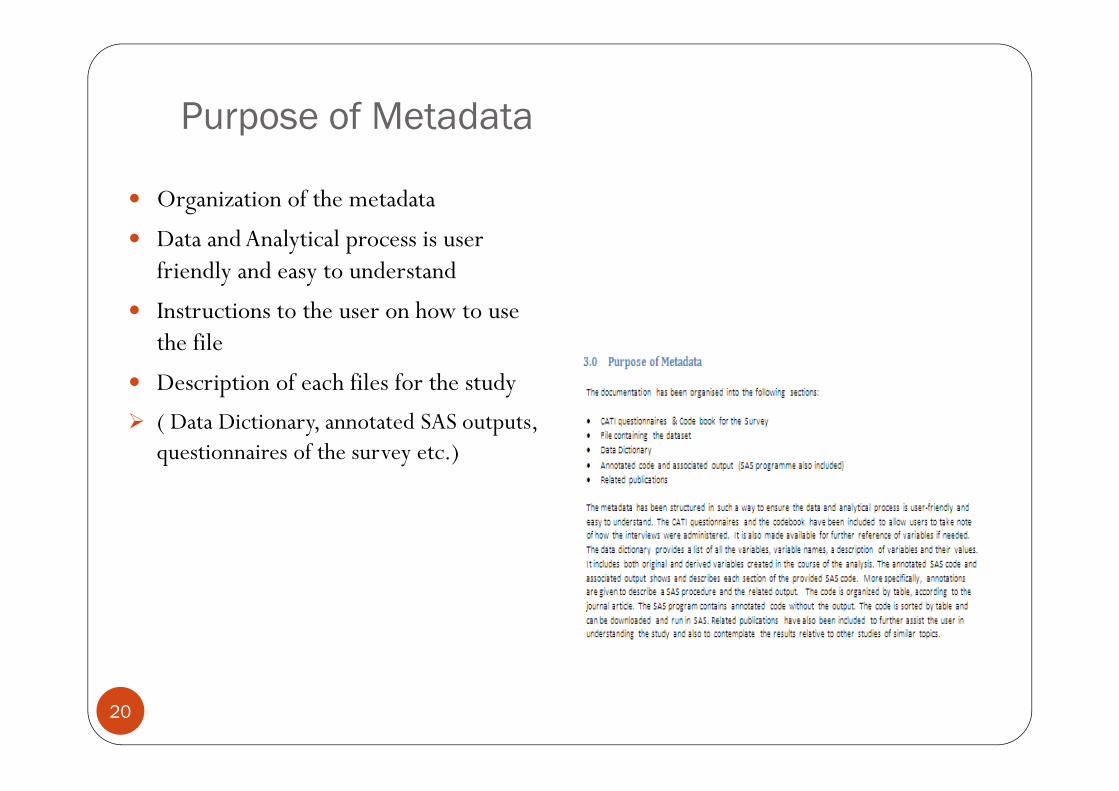
Purpose of MetadataPurpose of Metadata
Organization of the metadata
Data and Analytical process is user friendly and easy to understand
I t ti t th h t Instructions to the user on how to use the file
Description of each files for the study p y
( Data Dictionary, annotated SAS outputs, questionnaires of the survey etc.)
20

Using the Data
Description of the datasets
Variables on the filesVariables on the files
Information on how to re-run or extend the current analysis
Comments on the original and the derived variables
21

Analyses
Analysis used for each table in the result section of the studyresult section of the study
SAS procedure
Details of the analysis y
Comment on the result of the table, why analysis is used, weighting factor
22

Data Dictionary
Original variablesOriginal variables Variables from the original
questionnaire
Derived variables The original variable is The original variable is
processed, producing new variables in a format more
i t f hi h appropriate for higher analysis
23
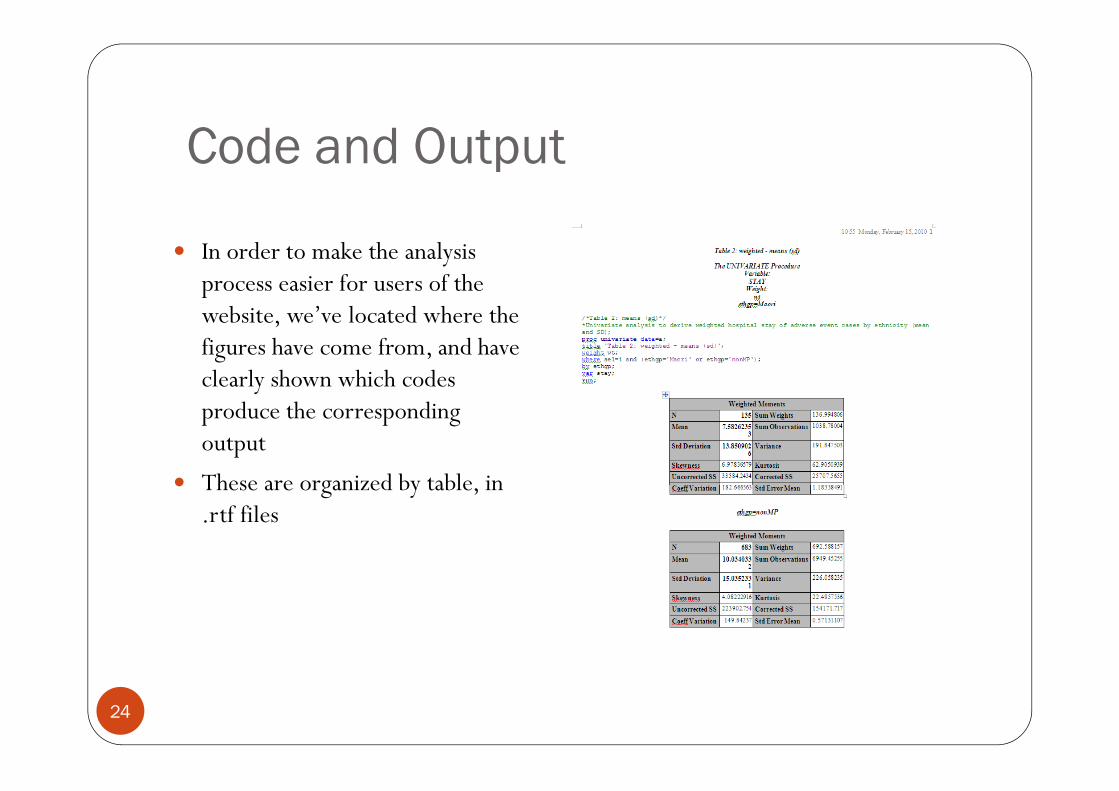
Code and Output
In order to make the analysis process easier for users of the
b ’ l d h hwebsite, we’ve located where the figures have come from, and have clearly shown which codes produce the corresponding output
These are organized by table in These are organized by table, in .rtf files
24

Annotated Codes
Made short notes about what the d h d h codes mean, what it does to the
dataset and what analysis is used
Annotated codes are available in SAS programs and in Word documents
25

Spreadsheet of Calculations
This spreadsheet contains the calculations necessary
d f hto derive some of the figures that appear in the articles
The resultant figures The resultant figures are bolded
Formulas are displayed on the bottom of the page to help the user understand how figures were derived
26

Codes and Outputs Compiled
Provides direct hyperlinks to all the given code and output for each article by table
27

Summary
•How to integrate our materials in NZSSDS
•Challenges we faced
•Lessons we learnt
•What more could be done
•Conclusions
28

Early Sex and Its Behavioural Consequences in New Zealand - Carmen
Objective: Investigate the sexual behaviour of adults during their adolescent years and analyse the behavioural consequences of this process
Partner Relations Survey 1991 (PRS)
2-stage stratified national survey administered using CATI
Fi di Th t d fi t d t d t d li l i Findings: The study confirms a steady trend towards earlier sexual experience and a rapid progression to a long term sexual partnership.
Implication towards future risk behaviours
Preventative strategies
29
The Impact of Organizational and Professional Context on Social Variation in Clinical Activity
Ob T h h l d f l f Objective: To assess whether organizational and professional context of primary care is associated with practitioner clinical decisions for patients from lower socio-economic areas or of minority ethnic background
NatMedCa 2001/02
Multi-stage probability sample involving 244 physicians & 9,272 patients across 185 ti i N Z l d185 practices in New Zealand
Findings: Practitioner variability was more defined for patients from ethnically and socio-economically disadvantaged backgroundsy g g
Influence of organizational setting
30
How to integrate our materials in NZSSDS
Four journal articles to incorporate.
These will be added to the “article and program resources” p gsection of the website.
Contains links to and from data sets
Suggestions:ggMock up 1 ( next slide)Mock up 2
31
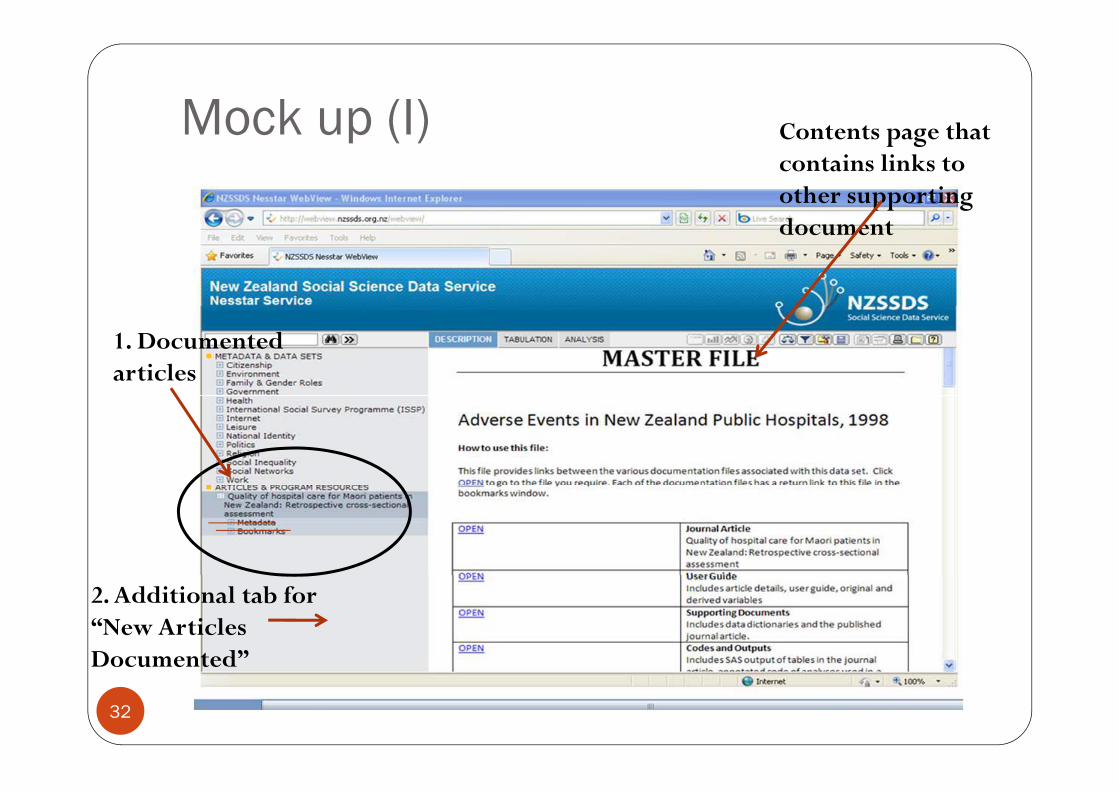
Mock up (I) C t t th t Mock up (I) Contents page that contains links to other supporting document
1. Documented articles
2. Additional tab for “New Articles Documented”
32
Documented

Instructions to User
A contents page where NZSSDS users are able to quickly locate q y various types of information about any given journal article
P id h li k d 3 l Provides hyperlinks under 3 clear sections – User guide, Supporting documents and Codes and output
33
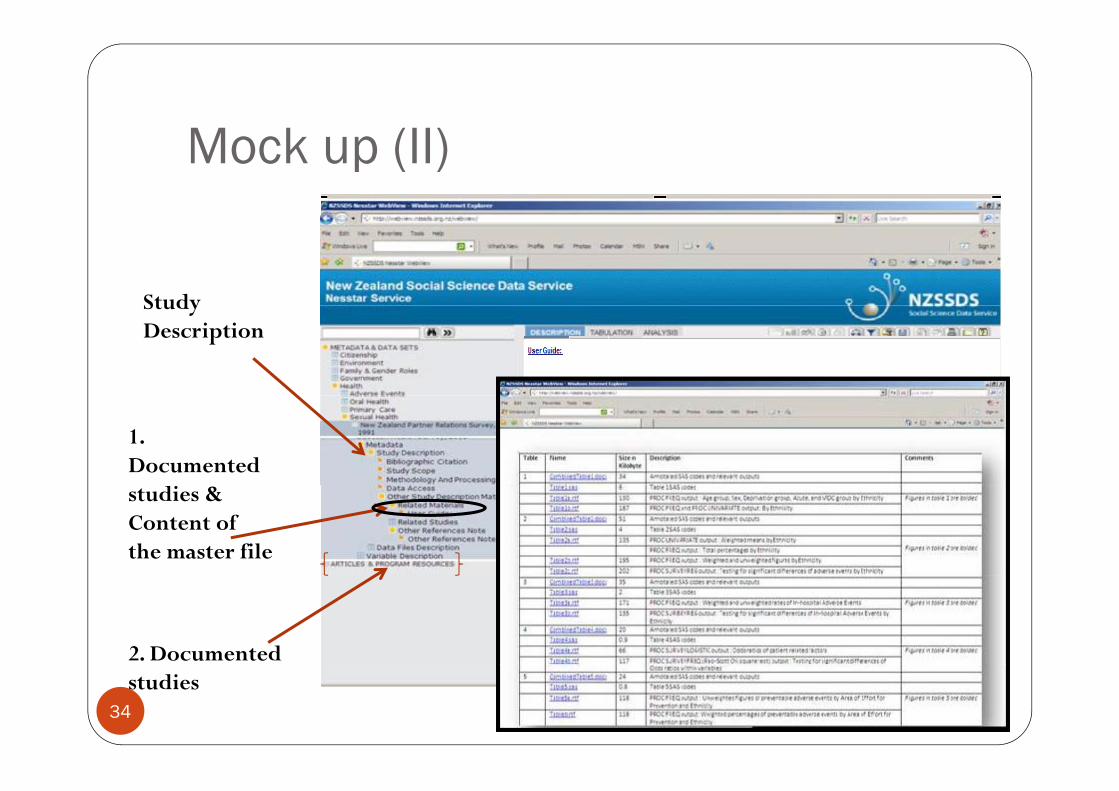
Mock up (II)
Study Study Description
1. Documented studies & Content of the master file
2. Documented studies
34

What more could be done (I) Projectj
More integration between article and documentation/code used Eventually place hyperlinks in the article itself
Backlog of older journal articles to be packaged and put online Backlog of older journal articles to be packaged and put online
For teaching purposes, a subset of the original datasets could be usedg p p , g Additional weighting variable can be used to accommodate for the smaller number of
observations
Variables may be recoded for the ease of use Variables may be recoded for the ease of use
35

What more could be done (II) On NZSSDS website
Page containing MF of all major studies conducted
Place a search engine on the home page
Promote NZSSDS in the University of Auckland Statistics website
Research space & teaching space in NZSSDS (next slide)
36

Proposed Research and Teaching SpaceProposed Research and Teaching Space
Research Datasets
T hi Teaching Data sets
37

Challenges we faced
Locating figures in the output that appear in the tables
Deleting unnecessary output in the Code and Output i.e. Including output which contained figures in the article
Moving output from SAS to Excel to conduct calculations
G i ll t d t t i l i l d t di ti SAS Grouping all metadata components in a logical manner- data dictionary, SAS code and output, SAS program into a “Master File” with article details, purpose of metadata and instructions to the user
38

Lessons we learnt through this process
Data not archived is rarely used or even lost
Reduce the cost duplications of data collection
Need to be meticulous when cleaning code
Need to make instructions to users obviously clear- avoid miscommunications hi h ld l d t tl which could lead to costly errors
Always need to understand theory behind analyses Mixed modelling/multi-level analysis (easier to locate figures)g y ( g )
Survival analysis
Survey logistic regression, survey freq, survey regression
39

Conclusion
4 key published journal article has now been documented with metadata for users
The 4 master files & final data sets with full mark up awaiting to be uploaded to NZSSDS archive
All the articles has been documented along with SAS codes for data All the articles has been documented along with SAS codes for data manipulation and analysis
Hopefully, this would assist the users in understanding more about the study, hence fortify future investigations & scientific inquiries
40

We want to thank.....
Faculty of Science and Arts
Roy Lay-Yeey y
Peter Davis
And of course........
All the lovely people at COMPASS
41

Studentship experience
42

QUESTIONS??
43