additional file 1 – supplementary information10.1186/s12864-015-1434... · additional file 1 –...
TRANSCRIPT

1
Additional File 1 – Supplementary Information
Prokaryotic assemblages and metagenomes in pelagic zones of the South China Sea
Ching-Hung Tseng, Pei-Wen Chiang, Hung-Chun Lai, Fuh-Kwo Shiah, Ting-Chang Hsu, Yi-Lung Chen, Liang-Saw Wen, Chun-Mao Tseng, Wung-Yang Shieh, Isaam Saeed, Saman Halgamuge and Sen-Lin Tang
Methods
Sampling and DNA extraction for DGGE analysis PCR-DGGE analysis
Results
Hydrography of the South China Sea Poisson regression analysis
Figure
Figure S1. PCR-DGGE analysis of the 16S rRNA genes from the SCS Figure S2. Water temperature, salinity, and density profile in the SCS
Figure S3. The temperature-salinity diagram in the SCS Figure S4. Rarefaction curves of (A) bacterial and (B) archaeal community in the SCS
Figure S5. Bacterial OTU profiles in the SCS Figure S6. Archaeal OTU profiles in the SCS Figure S7. nMDS analysis of bacterial communities in the SCS and other oceans
Figure S8. Vertical profile of oceanographic parameters in the SCS Figure S9. Top-10 COGs of decreasing abundance with increasing depth in the SCS Figure S10. Top-10 COGs of increasing abundance with increasing depth in the SCS Figure S11. Top-10 globally enriched functions in ocean surfaces versus deep oceans Figure S12. Top-10 globally enriched functions in deep oceans versus ocean surfaces Figure S13. Phylogenetic tree of Betaproteobacteria V6 amplicon reads
Table
Table S1. Oceanographic data measured in the SCS during Cruise 845 Table S2. Bacterial and archaeal diversity indices based on 16S rRNA gene libraries of the SEATS station Table S3. Bacterial diversity indices based on 16S rRNA gene libraries of the SEATS station and other oceans Table S4. Reciprocal tBLASTx analysis results Table S5. Pearson’s correlation coefficients among oceanographic parameters Table S6. Top-20 globally enriched functions in ocean surfaces versus deep oceans Table S7. Top-20 globally enriched functions in deep oceans versus ocean surfaces Table S8. Bacterial and archaeal primer coverages Table S9. Bacterial 16S rRNA V6 amplicon libraries from other oceans

2
Methods
Sampling and DNA extraction for DGGE analysis
Seawater samples were collected at the SEATS station (18°15'N, 115°30'E) on October
20 and 21, 2006. Twenty liter Go-Flo sampling bottles with CTD rosettes were deployed for
water collection at 15 different depths covering epi- to bathypelagic zones (i.e., 10, 20, 30,
40, 50, 60, 80, 100, 300, 400, 500, 1000, 1200, 1500, and 2000 m). For each depth, 700 ml
seawater was collected and stored in 1-liter plastic carboy bottles at -80 °C until DNA
extraction. In laboratory, the seawater samples were melted on ice and filtered for
bacterioplanktons using cellulose acetate membranes of 0.2 µm pore size (ADVANTEC).
The membranes were removed by sterile forceps to clean centrifuge tubes and washed with
TE buffer (50 mM Tris-HCl and 1 mM EDTA at pH 8.0). The solution was collected in a
microtube and used for DNA extraction as previously described [1]. The DNA pellet was
then resolved in sterilized water, and the DNA solution was aliquoted into smaller volumes
for storage at -20 °C.
PCR-DGGE analysis
To amplify the 16S rRNA gene for DGGE, a PCR was conducted with a pair of
universal primers, 341F with GC clamp (5’-CGC-CCG-CCG-CGC-GCG-GCG-GGC-GGG-
GCG-GGG-GCA-CGG-GGG-GCC-TAC-GGG-AGG-CAG-CAG-3’) and 907R (5’-CCG-
TCA-ATT-CMT-TTG-AGT-TT-3’). The total volume was 50 µl, including 200 µM dNTP,
0.5 µM of each primer, 1.5 µl (1.5 U) of Taq enzyme (Finnzymes, DyNAzyme EXT), 1.5
mM of MgCl2, 5 µl of 10 X PCR buffer (Finnzymes), and 30 ng of template DNA. The
amplification program was conducted using a PxE Thermal Cycler (Thermo Electron Corp.).
The first cycle was initiated at 94°C for 5 min, and followed by 30 cycles. Each cycle was
94°C for 30 sec, 47°C for 30 sec, and 72°C for 1 min. The last cycle was 72°C for 10 min
before cooling at 4°C. The PCR products were checked using electrophoresis and visualized
by a UV trans-illuminator, ImageQuant 300 (GE Healthcare). The PCR product was
resolved by DGGE using the DCode gel system (Bio-Rad). The acrylamide concentration
was 7% (bis-acrylamide gel stock solution, 37.5:1). The running buffer was 1X
Tris-actate-EDTA and the denaturing gradient was set from 30-45%. Electrophoresis was
conducted at 70 Volts and 60°C for 13 h. The gel was visualized using silver staining [2].
To verify the identity of bands in the gel, selected bands were firstly cut out and
resolved in small volumes of Milli-Q water. The DNA fragments were amplified by PCR
using the primers 341F without GC clamp and 907R, and the PCR product was confirmed
by 1.5% agarose electrophoresis. If the product contained non-specific DNA, the desired
DNA band would be cut out from the agarose gel for purification again using the QIAEXII
gel extraction kit (QIAGEN), and sent to sequencing at Mission Biotech Corp. (Taipei,

3
Taiwan) for confirmation. A total of 139 bacterial rDNA sequences from the DGGE were
identified, among which 13 sequences were obtained by the clone-library because of the
unsuccessful purification of methods mentioned above. Sequences longer than 150 base
pairs and best matched to 16S rDNA homologs in the NCBI nucleotide database with ≥95%
identity have been deposited in the NCBI GenBank [HQ879850-HQ879969].

4
Results
Hydrography of the South China Sea
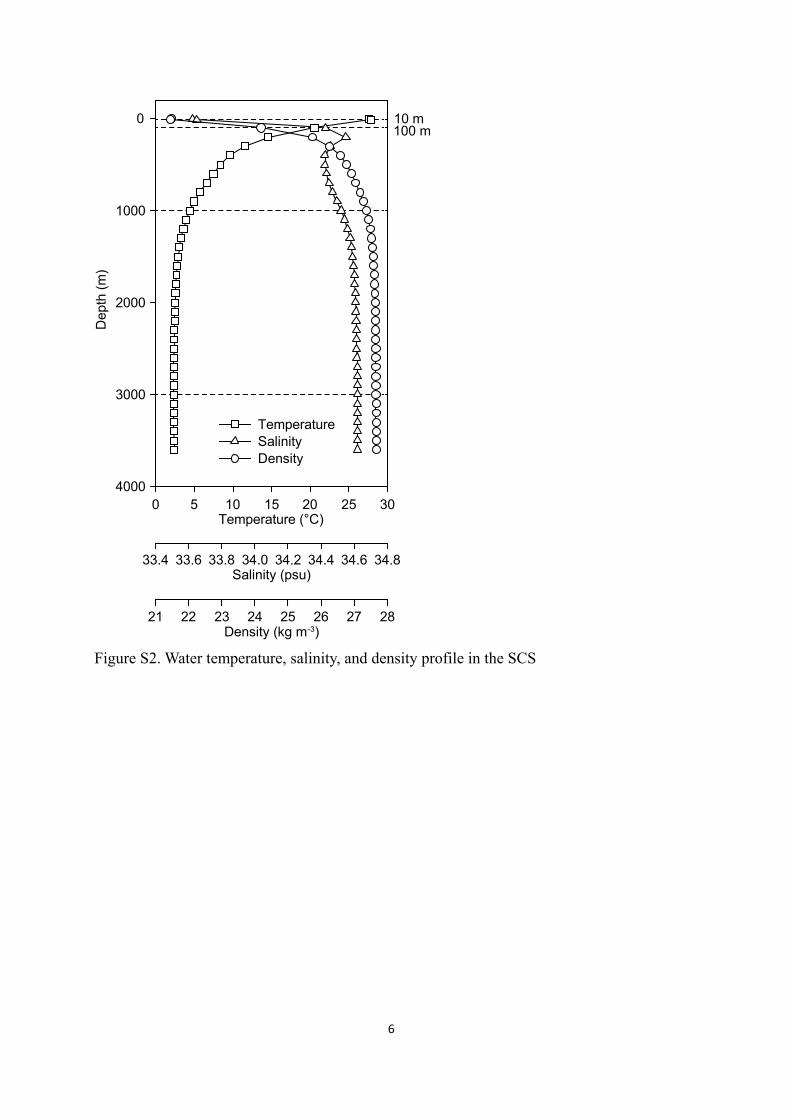
The temperature profile of the SEATS water column was continuously stratified
(Additional File 1, Figure S2). The thermocline, which separates the upper mixed layer from
the calm deep water, was approximately between 70 and 200 m. The temperature was nearly
28°C at the upper mixed layer and decreased as the depth increased, whereas the potential
density showed a contrary profile along depth. The salinity was about 33.6 psu at the sea
surface, increased with increasing depth, peaked to 34.6 psu at 130 m, decreased slightly to a
local minimum 34.4 psu between 350 and 430 m, and increased with increasing depth again.
The salinity was stable below 1000 m (34.5 psu at 1000 m; 34.6 psu at 3000 m).
The temperature-salinity diagram indicated that three water masses existed in the
sampling site (Additional File 1, Figure S3), corresponding to previous reports [3-5]. The
northern SCS surface water is influenced by both the freshwater input from the Pearl River
in China and the Kuroshio intrusion, so it has lower salinity than the Kuroshio and Pacific
water. The SCS intermediate water has similar characteristics with the North Pacific
Intermediate Water [5]. The cold deep water is a mixture of Circumpolar Deep Water and
Pacific Subarctic Intermediate Water [6, 7].
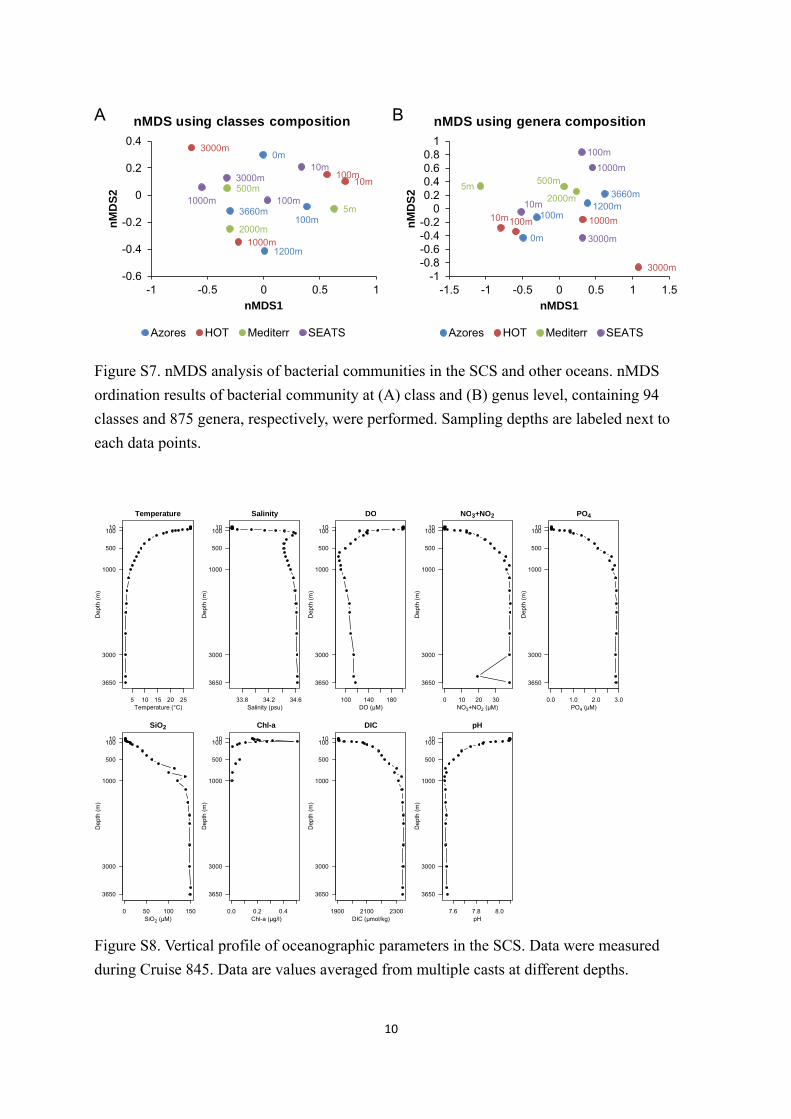
Several nutrients were measured during the sampling cruise (Additional File 1, Table
S1). The concentration of dissolved oxygen was highest in the surface water (about 200 μM),
decreased with increasing depth, and rose to about 110 μM at 3000 m. The concentrations of
nitrite, nitrate, dissolved inorganic phosphate, and silicate increased with increasing depth.
The concentration of chlorophyll-a in the SCS surface (0.16 μg l-1) and dissolved inorganic
carbon was approximately 2000 μmol kg-1. The pH values in SCS decreased with increasing
depth. Consistency of our measurements to previous reports [8-10] demonstrated a relative
stable nature of these nutrient concentrations in the SCS.
Poisson regression analysis
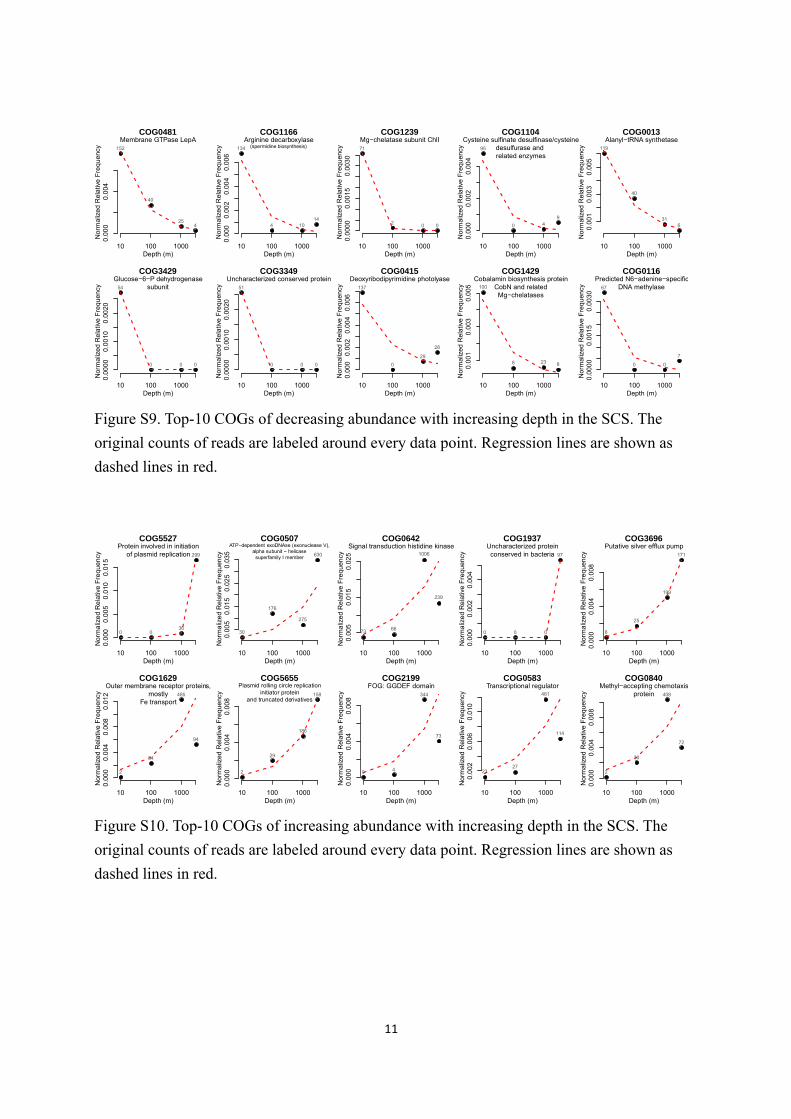
Most of the top-10 significant COGs (Pearson correlation, P-value ≤0.05) showing
negative correlation to the depth (i.e., the deeper, the less) enriched at 10 m, such as
Mg-chelatase (COG1239), Glucose-6-P dehydrogenase (COG3429), cobalamin biosynthesis
protein CobN (COG1429), and photolyase (COG0415) (Additional File 1, Figure S10).
Similarly, COGs enriched at 1000 and 3000 m were more abundant at deeper depths,
including iron transporter (COG1629), histidine kinase (COG0642), chemotaxis protein
(COG0840), and plasmid replication initiation protein (COG5527 and COG5655).
Transcription regulator (COG0583) and efflux pump (COG3696) were likely also
metabolisms specific to the deep SCS community (Additional File 1, Figure S11).

5
Figure
Figure S1. PCR-DGGE analysis of the 16S rRNA genes in the SCS. Color lines represent
different bacterial taxonomic groups. These groups include SAR11 (red line), SAR324 (light
purple line), SAR406 (gray line), Actinobacteria (blue line), Cyanobacteria (green line),
Flavobacteria (yellow line), Rhodobacteraceae (pink line), Nitrospinaceae (light blue line),
Alphaproteobacteria (purple line), and Bacteriodetes (brown line). Black lines are sequences
with <95% alignment identity to the best match in the NCBI nucleotide database. Lanes A to
O represent samples of different depths, which are shown in figure and followed by the
number of bands that were cut and sequenced.
K12
A B C D E F G H I J K L M N O
O1
O2
O3
O4
O5
O6
O7
O8
O9
N1
N2
N3N4
N5N6
N7N8
N9
N10
N11
N12
M1
M2
M3
M4
M5M6
M7
M8
M9
M10
L1
L2
L3L4
L5
L6
L7L8
L9
L10
L11
K1
K2
K3K4
K5K6
K7
K8K9
K10K11
K13
J1
J2J3
J4
J5J6
J7
I1
I2
I3I4
I5
I6
I7
H1
H2
H3
H4
H5
G1
G2
G3G4
G5
G6
G7G8G9G10
G11G12G13
F1
F2
F3
F4F5
F6
E1
E2
E3
E4
E5E6
E7
E8E9
E10E11E12
D1D2
D3
D4
D5
D6D7D8
C1
C2
B1
B2A1
C3C4
B3
C5C6C7C8C9C10
C11C12C13
B5B6B7
B4
A4
A5
A6
A7
A3
A2
A(2000m, 7)B(1500m, 7)C(1200m, 13)D(1000m, 8)E(500m, 12)F(400m, 6)G(300m, 13)H(100m, 5)
I(80m, 7)J(60m, 7)K(50m, 13)L(40m, 11)M(30m, 10)N(20m, 12)O(10m, 9)
SAR11SAR324SAR406ActinobacteriaCyanobacteriaFlavobacteriaRhodobacteraceaeNitrospinaceaeAlphaproteobacteriaBacteroidete
6
Figure S2. Water temperature, salinity, and density profile in the SCS
Temperature (°C)10 15 20 25 30
Dep
th (
m)
4000
3000
2000
1000
0
Salinity (psu)33.4 33.6 33.8 34.0 34.2 34.4 34.6
Density (kg m-3)21 22 23 24 25 26 27 28
TemperatureSalinityDensity
34.8
0 5
10 m100 m

7
Figure S3. Temperature-Salinity diagram in the SCS. Dashed lines indicate four sampling
depths.
Figure S4. Rarefaction curves of (A) bacterial and (B) archaeal community in the SCS.
0
5
10
15
20
25
30
33.5 33.7 33.9 34.1 34.3 34.5 34.7
Tem
pe
ratu
re(
C)
Salinity (psu)
10 m
100 m
1000 m3000 m
0
200
400
600
800
1000
1200
0 3000 6000 9000 12000 15000
#O
TU
# sequence sampled
bacteria.10mbacteria.100mbacteria.1000mbacteria.3000m
0
20
40
60
80
100
120
140
160
0 500 1000 1500 2000
#O
TU
# sequence sampled
archaea.10marchaea.100marchaea.1000marchaea.3000m
A B

8
Figure S5. Bacterial OTU profiles in the SCS. The x-axis represents 2982 OTUs from the
whole bacterial dataset. Different taxa are colored accordingly and named in the format of
phylum or phylum_class_order for clarity. Taxon names deeper than order level are listed in
parenthesis. Bacterial phyla with <1% relative abundance in average are grouped into
“Others”. Bacterial OTUs of interest are shaded in gray with numbers labeled in the figure.
Abbreviations: Pro, Prochlorococcus; Syn, Synechococcus; Alpha, Alphaproteobacteria;
Beta, Betaproteobacteria; Gamma, Gammaproteobacteria; Delta, Deltaproteobacteria.
Re
lativ
eA
bu
nd
an
ce (
%)
0 500 1000 1500 2000 2500
0
10
20 SEATS bacteria 10 mR
ela
tive
Ab
un
da
nce
(%
)
0 500 1000 1500 2000 2500
0
10
20 SEATS bacteria 100 m
0 500 1000 1500 2000 2500
0
10
20 SEATS bacteria 1000 m
OTU serial number
0 500 1000 1500 2000 2500
0
10
20 SEATS bacteria 3000 m
Re
lativ
eA
bu
nd
an
ce (
%)
Re
lativ
eA
bu
nd
an
ce (
%)
Cyanobacteria_(Pro)Cyanobacteria_(Syn)Cyanobacteria_othersProteobacteria_Alpha_SAR11Proteobacteria_Alpha_CaulobacteralesProteobacteria_Alpha_RhizobialesProteobacteria_Alpha_RhodobacteralesProteobacteria_Alpha_RhodospirillalesProteobacteria_Alpha_RickettsialesProteobacteria_Alpha_others
Proteobacteria_Delta_DesulfobacteralesProteobacteria_Delta_othersProteobacteria_Gamma_AlteromonadalesProteobacteria_Gamma_OceanospirillalesProteobacteria_Gamma_PseudomonadalesProteobacteria_Gamma_VibrionalesProteobacteria_Gamma_othersProteobacteria_othersBacteroidetesDeferribacteresVerrucomicrobiaOthersNo Relative
Proteobacteria_Beta_BurkhoderialesProteobacteria_Beta_others
2 31
2 31
2 31
2 31
4
4
4
4

9
Figure S6. Archaeal OTU profiles in the SCS. The x-axis represents 419 OTUs from the
whole archaeal dataset. Different taxa are colored accordingly and named in the format of
phylum or phylum_class_order for clarity. Taxon names deeper than order level are listed in
parenthesis. Archaeal OTUs of interest are shaded in gray with numbers labeled in the figure.
Abbreviations: Eury, Euryarchaeota; Thau, Thaumarchaeota; MG, Marine Group.
Rela
tive
Abu
ndan
ce (%
)
50 100 150 200 250 300 350 400
0
10
20 SEATS archaea 10 m
50 100 150 200 250 300 350 400
0
10
20 SEATS archaea 100 m
50 100 150 200 250 300 350 400
0
10
20 SEATS archaea 1000 m
OTU ser ial number
50 100 150 200 250 300 350 400
0
10
20 SEATS archaea 3000 m
0
0
0
0
Rela
tive
Abun
danc
e (%
)Re
lativ
eA
bund
ance
(%)
Rela
tive
Abu
ndan
ce (%
)
Eury_Halobacteria_HalobacterialesEury_Thermoplasmata_(Methanomethylophilus)Eury_Thermoplasmata_(MG II)Eury_Thermoplasmata_(MG III)Eury_Thermoplasmata_others
Thau_MG I_CenarchaealesThau_MG I_(Nitrosopumilus)Thau_MG I_othersThau_othersNo Relative
1
1
1
1
2
2
2
2 3
3
3
3
10
Figure S7. nMDS analysis of bacterial communities in the SCS and other oceans. nMDS
ordination results of bacterial community at (A) class and (B) genus level, containing 94
classes and 875 genera, respectively, were performed. Sampling depths are labeled next to
each data points.
Figure S8. Vertical profile of oceanographic parameters in the SCS. Data were measured
during Cruise 845. Data are values averaged from multiple casts at different depths.
A B
0m
100m
1200m
3660m
10m100m
1000m
3000m
5m
500m
2000m
10m
100m1000m
3000m
-0.6
-0.4
-0.2
0
0.2
0.4
-1 -0.5 0 0.5 1
nM
DS
2
nMDS1
nMDS using classes composition
Azores HOT Mediterr SEATS
0m
100m1200m
3660m
10m100m 1000m
3000m
5m500m
2000m10m
100m
1000m
3000m
-1-0.8-0.6-0.4-0.2
00.20.40.60.8
1
-1.5 -1 -0.5 0 0.5 1 1.5
nM
DS
2
nMDS1
nMDS using genera composition
Azores HOT Mediterr SEATS
●●●●●●●●●●●●●●
●
●
●
●
●
●
●
●
●
●
●
●
●
●
●
●
Temperature
Temperature (°C)
De
pth
(m
)
5 10 15 20 25
3650
3000
1000
500
10010 ●●●●●● ● ● ● ● ● ●●
●
●
●
●
●
●
●
●
●
●
●
●
●
●
●
●
●
Salinity
Salinity (psu)
De
pth
(m
)
33.8 34.2 34.6
3650
3000
1000
500
10010 ●●●●●●●●●●● ●●
●
●
●
●
●
●
●
●
●
●
●
●
●
●
●
●
●
DO
DO (μM)
De
pth
(m
)
100 140 180
3650
3000
1000
500
10010 ●●●●●●●● ● ● ●● ●
●
●
●
●
●
●
●
●
●
●
●
●
●
●
●
●
●
NO3+NO2
NO3+NO2 (μM)
De
pth
(m
)
0 10 20 30
3650
3000
1000
500
10010 ●●●●●●●● ● ● ●● ●
●
●
●
●
●
●
●
●
●
●
●
●
●
●
●
●
●
PO4
PO4 (μM)
De
pth
(m
)
0.0 1.0 2.0 3.0
3650
3000
1000
500
10010
●●●●●●●●●●●●●●
●
●
●
●
●
●
●
●
●
●
●
●
●
●
●
●
SiO2
SiO2 (μM)
De
pth
(m
)
0 50 100 150
3650
3000
1000
500
10010 ●●●● ●● ● ●●●●●●
●
●
●
●
●
Chl-a
Chl-a (μg/l)
De
pth
(m
)
0.0 0.2 0.4
3650
3000
1000
500
10010 ●●●●●●● ● ● ● ●●●
●
●
●
●
●
●
●
●
●
●
●
●
●
●
●
●
●
DIC
DIC (μmol/kg)
De
pth
(m
)
1900 2100 2300
3650
3000
1000
500
10010 ●●●●●●●●●●●●●
●
●
●
●
●
●
●
●
●
●
●
●
●
●
●
●
●
pH
pH
De
pth
(m
)
7.6 7.8 8.0
3650
3000
1000
500
10010
11
Figure S9. Top-10 COGs of decreasing abundance with increasing depth in the SCS. The
original counts of reads are labeled around every data point. Regression lines are shown as
dashed lines in red.
Figure S10. Top-10 COGs of increasing abundance with increasing depth in the SCS. The
original counts of reads are labeled around every data point. Regression lines are shown as
dashed lines in red.
●
●
●●
10 100 1000
0.0
00
0.0
04
COG0481Membrane GTPase LepA
Depth (m)
No
rma
lize
d R
ela
tive
Fre
qu
en
cy 152
40
254
●
● ●
●
10 100 1000
0.0
00
0.0
02
0.0
04
0.0
06
COG1166Arginine decarboxylase
(spermidine biosynthesis)
Depth (m)
No
rma
lize
d R
ela
tive
Fre
qu
en
cy 134
4 1014
●
●● ●
10 100 1000
0.0
00
00
.00
15
0.0
03
0
COG1239Mg−chelatase subunit ChlI
Depth (m)
No
rma
lize
d R
ela
tive
Fre
qu
en
cy 71
20 0
●
● ●
●
10 100 1000
0.0
00
0.0
02
0.0
04
COG1104Cysteine sulfinate desulfinase/cysteine
desulfurase andrelated enzymes
Depth (m)
No
rma
lize
d R
ela
tive
Fre
qu
en
cy 95
0 49
●
●
●
●
10 100 1000
0.0
01
0.0
03
0.0
05
COG0013Alanyl−tRNA synthetase
Depth (m)
No
rma
lize
d R
ela
tive
Fre
qu
en
cy 119
40
316
●
● ● ●
10 100 1000
0.0
00
00
.00
10
0.0
02
0
COG3429Glucose−6−P dehydrogenase
subunit
Depth (m)
No
rma
lize
d R
ela
tive
Fre
qu
en
cy 54
0 0 0
●
● ● ●
10 100 1000
0.0
00
00
.00
10
0.0
02
0
COG3349Uncharacterized conserved protein
Depth (m)
No
rma
lize
d R
ela
tive
Fre
qu
en
cy 51
0 0 0
●
●
●
●
10 100 1000
0.0
00
0.0
02
0.0
04
0.0
06
COG0415Deoxyribodipyrimidine photolyase
Depth (m)
No
rma
lize
d R
ela
tive
Fre
qu
en
cy 137
0
29
28
●
● ●●
10 100 1000
0.0
01
0.0
03
0.0
05
COG1429Cobalamin biosynthesis protein
CobN and relatedMg−chelatases
Depth (m)
No
rma
lize
d R
ela
tive
Fre
qu
en
cy 100
8 23 8
●
● ●
●
10 100 1000
0.0
00
00
.00
15
0.0
03
0
COG0116Predicted N6−adenine−specific
DNA methylase
Depth (m)
No
rma
lize
d R
ela
tive
Fre
qu
en
cy 67
0 0
7
● ●●
●
10 100 1000
0.0
000
.005
0.0
10
0.0
15
COG5527Protein involved in initiation
of plasmid replication
Depth (m)
Nor
mal
ize
d R
elat
ive
Fre
quen
cy
0 036
299
●
●
●
●
10 100 1000
0.00
50
.01
50
.02
50
.035
COG0507ATP−dependent exoDNAse (exonuclease V),
alpha subunit − helicasesuperfamily I member
Depth (m)
Nor
mal
ize
d R
elat
ive
Fre
quen
cy
30
176
275
630
●●
●
●
10 100 1000
0.0
050
.01
50.
025
COG0642Signal transduction histidine kinase
Depth (m)
Nor
mal
ize
d R
elat
ive
Fre
quen
cy
73 66
1006
239
● ● ●
●
10 100 1000
0.0
000
.00
20.
004
COG1937Uncharacterized proteinconserved in bacteria
Depth (m)
Nor
mal
ize
d R
elat
ive
Fre
quen
cy
0 0 0
97
●
●
●
●
10 100 1000
0.0
000.
004
0.0
08
COG3696Putative silver efflux pump
Depth (m)
Nor
mal
ize
d R
elat
ive
Fre
quen
cy
6
25
199
171
●
●
●
●
10 100 1000
0.0
00
0.0
040.
008
0.0
12
COG1629Outer membrane receptor proteins,
mostlyFe transport
Depth (m)
No
rma
lized
Re
lativ
e F
req
uenc
y
2
34
485
94
●
●
●
●
10 100 1000
0.0
00
0.0
04
0.0
08
COG5655Plasmid rolling circle replication
initiator proteinand truncated derivatives
Depth (m)
No
rma
lized
Re
lativ
e F
req
uenc
y
2
29
186
158
●●
●
●
10 100 1000
0.0
00
0.0
04
0.0
08
COG2199FOG: GGDEF domain
Depth (m)
No
rma
lized
Re
lativ
e F
req
uenc
y
0 4
344
73
●●
●
●
10 100 1000
0.0
020.
006
0.0
10
COG0583Transcriptional regulator
Depth (m)
No
rma
lized
Re
lativ
e F
req
uenc
y
2327
461
114
●
●
●
●
10 100 1000
0.0
000
.004
0.0
08
COG0840Methyl−accepting chemotaxis
protein
Depth (m)
No
rma
lized
Re
lativ
e F
req
uenc
y
2
30
408
72

12
Figure S11. Top-10 globally enriched functions in ocean surfaces versus deep oceans. The
original counts are labeled on each bar.
Figure S12. Top-10 globally enriched functions in deep oceans versus ocean surfaces. The
original counts are labeled on each bar.
No
rma
lize
d R
ela
tive
Fre
qu
en
cy
02
46
8COG0404
Glycine cleavage system T protein(aminomethyltransferase)
56
493
637
392
415
337555
643
36
28
49
25
667
292
No
rma
lize
d R
ela
tive
Fre
qu
en
cy
01
23
4
COG0697Permeases of the drug/metabolite
transporter (DMT) superfamily
42
455701
490330
347
490494
1544
12 62751616
No
rma
lize
d R
ela
tive
Fre
qu
en
cy
01
23
45
COG0451Nucleoside−diphosphate−sugar
epimerases
148
396
707573
327306496
367
35
54
62
32
821
1031
No
rma
lize
d R
ela
tive
Fre
qu
en
cy
05
10
15
COG1754Uncharacterized C−terminal domain
of topoisomerase IA
47
166246187
9183156158
4
44 2
159
0
No
rma
lize
d R
ela
tive
Fre
qu
en
cy
05
10
15
20
25
30
COG1233Phytoene dehydrogenase and
related proteins
75
92
19114089
116168169
12
1816
3123
0
No
rma
lize
d R
ela
tive
Fre
qu
en
cy
05
10
15
COG4664TRAP−type mannitol/chloroaromatic compoundtransport system, large permease component
15
137210
125
142
89
199190
12
23
12
3162
0
No
rma
lize
d R
ela
tive
Fre
qu
en
cy
01
23
45
COG0069Glutamate synthase domain 2
123
355
437
402233
283
380425
25
83
19
13559
919
No
rma
lize
d R
ela
tive
Fre
qu
en
cy
01
23
4
COG0086DNA−directed RNA polymerase,
beta' subunit/160 kD subunit
74346
440341190
228366
415
27
21
25
2
860
500
No
rma
lize
d R
ela
tive
Fre
qu
en
cy
02
46
81
01
4
COG4663TRAP−type mannitol/chloroaromatic compound
transport system, periplasmic component
0
132173
107
9993144
161
6 15
6
1
137
0
No
rma
lize
d R
ela
tive
Fre
qu
en
cy
01
23
4
COG0665Glycine/D−amino acid
oxidases (deaminating)
33
321421318
216214352
38430
18
40
19
500
764
SEATS 10 m GS001C GS018 GS026 GS037 GS047 GS113 GS123 HF10SEATS 3000 m HF4000 KM3 PRT MATAPAN
Nor
ma
lized
Re
lativ
e F
requ
ency
0.0
0.4
0.8
1.2
COG0583Transcriptional regulator
231051401567876114107
13
114
25
3
686
9795
Nor
ma
lized
Re
lativ
e F
requ
ency
0.0
0.4
0.8
1.2
COG0642Signal transduction histidine kinase
73289465346141
19731023818
239
6420
1331
22027
Nor
ma
lized
Re
lativ
e F
requ
ency
0.0
0.4
0.8
1.2
COG0840Methyl−accepting chemotaxis protein
2 2 1634 8 3 11 5 0
72
15
0
296
7958
Nor
ma
lized
Re
lativ
e F
requ
ency
0.0
0.4
0.8
1.2
COG0845Membrane−fusion protein
7
94148164
5962921036
74
174
296
6393
Nor
ma
lize
d R
ela
tive
Fre
quen
cy
0.0
0.4
0.8
1.2
COG1020Non−ribosomal peptidesynthetase modules and
related proteins
0 1 13 8 8 3 4 7
6
0
6
1
107
2648
No
rmal
ize
d R
elat
ive
Fre
que
ncy
0.0
0.4
0.8
1.2
COG1309Transcriptional regulator
0182319 6
171816 2
25
6
0
148
2534
No
rmal
ize
d R
elat
ive
Fre
que
ncy
0.0
0.4
0.8
1.2
COG1609Transcriptional regulators
0 11252026
1130224
24
0 0
113
3092
No
rmal
ize
d R
elat
ive
Fre
que
ncy
0.0
0.4
0.8
1.2
COG1629Outer membrane receptor proteins,
mostly Fe transport
2
399418217
2121922992432194
4317
1653
29109
No
rmal
ize
d R
elat
ive
Fre
que
ncy
0.0
0.4
0.8
1.2
COG2199FOG: GGDEF domain
0 4 9 12 1 2 1 1 0
73
60
78
4863
No
rmal
ize
d R
elat
ive
Fre
que
ncy
0.0
0.4
0.8
1.2
COG2200FOG: EAL domain
42 3 4 6 3 1 4
2
156
1
123
3568
SEATS 10 m GS001C GS018 GS026 GS037 GS047 GS113 GS123 HF10SEATS 3000 m HF4000 KM3 PRT MATAPAN
13
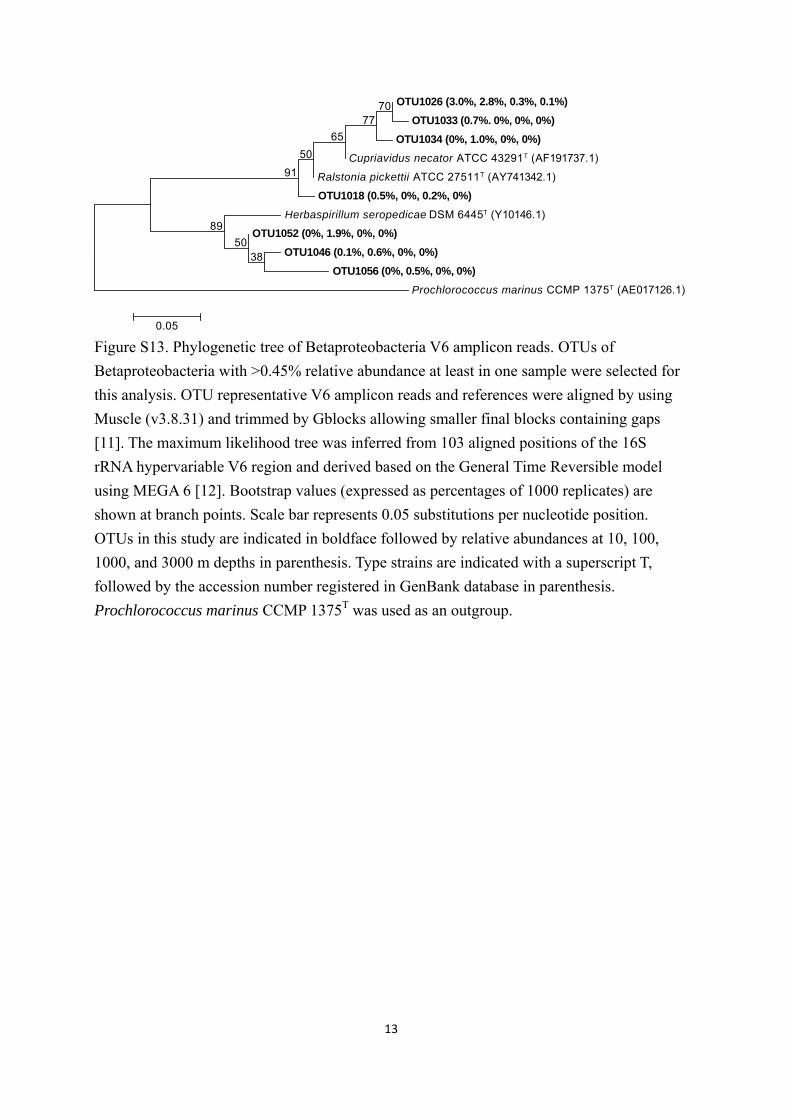
Figure S13. Phylogenetic tree of Betaproteobacteria V6 amplicon reads. OTUs of
Betaproteobacteria with >0.45% relative abundance at least in one sample were selected for
this analysis. OTU representative V6 amplicon reads and references were aligned by using
Muscle (v3.8.31) and trimmed by Gblocks allowing smaller final blocks containing gaps
[11]. The maximum likelihood tree was inferred from 103 aligned positions of the 16S
rRNA hypervariable V6 region and derived based on the General Time Reversible model
using MEGA 6 [12]. Bootstrap values (expressed as percentages of 1000 replicates) are
shown at branch points. Scale bar represents 0.05 substitutions per nucleotide position.
OTUs in this study are indicated in boldface followed by relative abundances at 10, 100,
1000, and 3000 m depths in parenthesis. Type strains are indicated with a superscript T,
followed by the accession number registered in GenBank database in parenthesis.
Prochlorococcus marinus CCMP 1375T was used as an outgroup.
OTU1026 (3.0%, 2.8%, 0.3%, 0.1%)
OTU1033 (0.7%. 0%, 0%, 0%)
OTU1034 (0%, 1.0%, 0%, 0%)
Cupriavidus necator ATCC 43291T (AF191737.1)
Ralstonia pickettii ATCC 27511T (AY741342.1)
OTU1018 (0.5%, 0%, 0.2%, 0%)
Herbaspirillum seropedicae DSM 6445T (Y10146.1)
OTU1052 (0%, 1.9%, 0%, 0%)
OTU1046 (0.1%, 0.6%, 0%, 0%)
OTU1056 (0%, 0.5%, 0%, 0%)
Prochlorococcus marinus CCMP 1375T (AE017126.1)
50
89
7077
65
91
50
0.05
38
14
Table
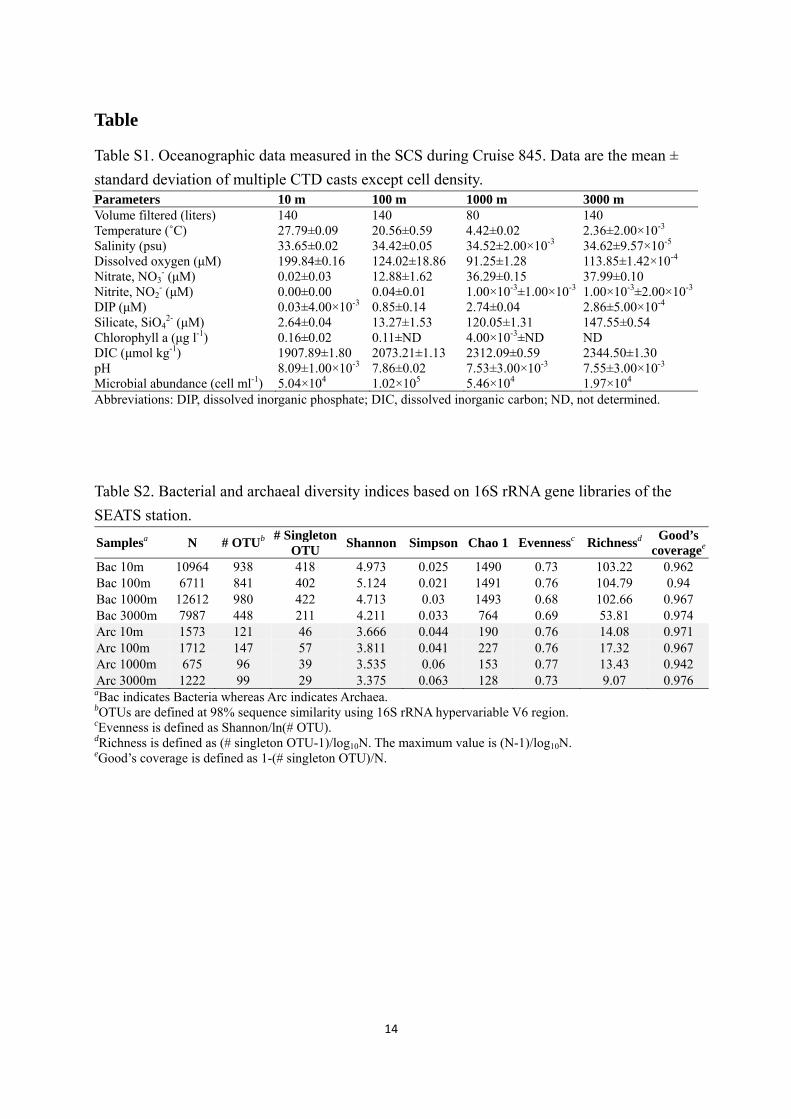
Table S1. Oceanographic data measured in the SCS during Cruise 845. Data are the mean ±
standard deviation of multiple CTD casts except cell density. Parameters 10 m 100 m 1000 m 3000 m Volume filtered (liters) 140 140 80 140 Temperature (˚C) 27.79±0.09 20.56±0.59 4.42±0.02 2.36±2.00×10⁻³ Salinity (psu) 33.65±0.02 34.42±0.05 34.52±2.00×10⁻³ 34.62±9.57×10⁻⁵ Dissolved oxygen (μM) 199.84±0.16 124.02±18.86 91.25±1.28 113.85±1.42×10⁻⁴ Nitrate, NO3
- (μM) 0.02±0.03 12.88±1.62 36.29±0.15 37.99±0.10 Nitrite, NO2
- (μM) 0.00±0.00 0.04±0.01 1.00×10⁻³±1.00×10⁻³ 1.00×10⁻³±2.00×10⁻³
DIP (μM) 0.03±4.00×10⁻³ 0.85±0.14 2.74±0.04 2.86±5.00×10⁻⁴ Silicate, SiO4
2- (μM) 2.64±0.04 13.27±1.53 120.05±1.31 147.55±0.54 Chlorophyll a (μg l-1) 0.16±0.02 0.11±ND 4.00×10⁻³±ND ND DIC (μmol kg-1) 1907.89±1.80 2073.21±1.13 2312.09±0.59 2344.50±1.30 pH 8.09±1.00×10⁻³ 7.86±0.02 7.53±3.00×10⁻³ 7.55±3.00×10⁻³ Microbial abundance (cell ml-1) 5.04×10⁴ 1.02×10⁵ 5.46×10⁴ 1.97×10⁴ Abbreviations: DIP, dissolved inorganic phosphate; DIC, dissolved inorganic carbon; ND, not determined.
Table S2. Bacterial and archaeal diversity indices based on 16S rRNA gene libraries of the
SEATS station.
Samplesa N # OTUb # Singleton
OTU Shannon Simpson Chao 1 Evennessc Richnessd
Good’s coveragee
Bac 10m 10964 938 418 4.973 0.025 1490 0.73 103.22 0.962 Bac 100m 6711 841 402 5.124 0.021 1491 0.76 104.79 0.94 Bac 1000m 12612 980 422 4.713 0.03 1493 0.68 102.66 0.967 Bac 3000m 7987 448 211 4.211 0.033 764 0.69 53.81 0.974 Arc 10m 1573 121 46 3.666 0.044 190 0.76 14.08 0.971 Arc 100m 1712 147 57 3.811 0.041 227 0.76 17.32 0.967 Arc 1000m 675 96 39 3.535 0.06 153 0.77 13.43 0.942 Arc 3000m 1222 99 29 3.375 0.063 128 0.73 9.07 0.976 aBac indicates Bacteria whereas Arc indicates Archaea. bOTUs are defined at 98% sequence similarity using 16S rRNA hypervariable V6 region. cEvenness is defined as Shannon/ln(# OTU). dRichness is defined as (# singleton OTU-1)/log10N. The maximum value is (N-1)/log10N. eGood’s coverage is defined as 1-(# singleton OTU)/N.
15
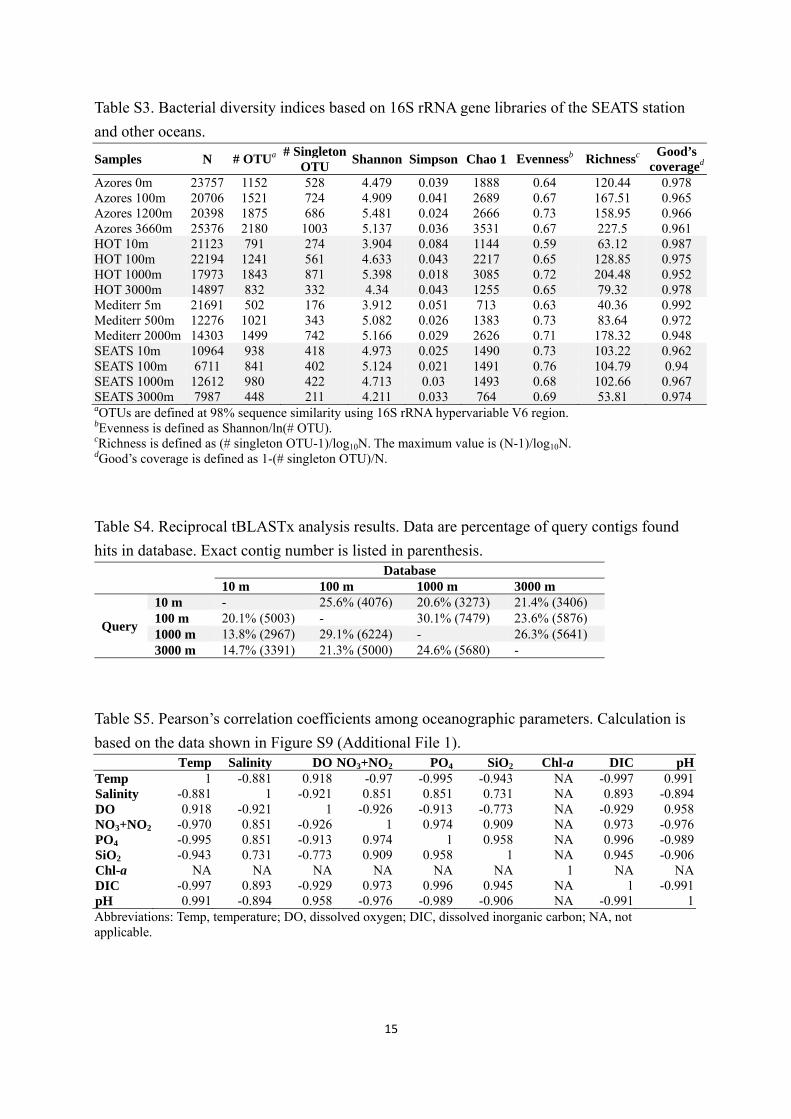
Table S3. Bacterial diversity indices based on 16S rRNA gene libraries of the SEATS station
and other oceans.
Samples N # OTUa # Singleton
OTU Shannon Simpson Chao 1 Evennessb Richnessc
Good’s coveraged
Azores 0m 23757 1152 528 4.479 0.039 1888 0.64 120.44 0.978 Azores 100m 20706 1521 724 4.909 0.041 2689 0.67 167.51 0.965 Azores 1200m 20398 1875 686 5.481 0.024 2666 0.73 158.95 0.966 Azores 3660m 25376 2180 1003 5.137 0.036 3531 0.67 227.5 0.961 HOT 10m 21123 791 274 3.904 0.084 1144 0.59 63.12 0.987 HOT 100m 22194 1241 561 4.633 0.043 2217 0.65 128.85 0.975 HOT 1000m 17973 1843 871 5.398 0.018 3085 0.72 204.48 0.952 HOT 3000m 14897 832 332 4.34 0.043 1255 0.65 79.32 0.978 Mediterr 5m 21691 502 176 3.912 0.051 713 0.63 40.36 0.992 Mediterr 500m 12276 1021 343 5.082 0.026 1383 0.73 83.64 0.972 Mediterr 2000m 14303 1499 742 5.166 0.029 2626 0.71 178.32 0.948 SEATS 10m 10964 938 418 4.973 0.025 1490 0.73 103.22 0.962 SEATS 100m 6711 841 402 5.124 0.021 1491 0.76 104.79 0.94 SEATS 1000m 12612 980 422 4.713 0.03 1493 0.68 102.66 0.967 SEATS 3000m 7987 448 211 4.211 0.033 764 0.69 53.81 0.974 aOTUs are defined at 98% sequence similarity using 16S rRNA hypervariable V6 region. bEvenness is defined as Shannon/ln(# OTU). cRichness is defined as (# singleton OTU-1)/log10N. The maximum value is (N-1)/log10N. dGood’s coverage is defined as 1-(# singleton OTU)/N.
Table S4. Reciprocal tBLASTx analysis results. Data are percentage of query contigs found
hits in database. Exact contig number is listed in parenthesis. Database
10 m 100 m 1000 m 3000 m
Query
10 m - 25.6% (4076) 20.6% (3273) 21.4% (3406) 100 m 20.1% (5003) - 30.1% (7479) 23.6% (5876) 1000 m 13.8% (2967) 29.1% (6224) - 26.3% (5641) 3000 m 14.7% (3391) 21.3% (5000) 24.6% (5680) -
Table S5. Pearson’s correlation coefficients among oceanographic parameters. Calculation is
based on the data shown in Figure S9 (Additional File 1). Temp Salinity DO NO3+NO2 PO4 SiO2 Chl-a DIC pH
Temp 1 -0.881 0.918 -0.97 -0.995 -0.943 NA -0.997 0.991Salinity -0.881 1 -0.921 0.851 0.851 0.731 NA 0.893 -0.894DO 0.918 -0.921 1 -0.926 -0.913 -0.773 NA -0.929 0.958NO3+NO2 -0.970 0.851 -0.926 1 0.974 0.909 NA 0.973 -0.976PO4 -0.995 0.851 -0.913 0.974 1 0.958 NA 0.996 -0.989SiO2 -0.943 0.731 -0.773 0.909 0.958 1 NA 0.945 -0.906Chl-a NA NA NA NA NA NA 1 NA NADIC -0.997 0.893 -0.929 0.973 0.996 0.945 NA 1 -0.991pH 0.991 -0.894 0.958 -0.976 -0.989 -0.906 NA -0.991 1Abbreviations: Temp, temperature; DO, dissolved oxygen; DIC, dissolved inorganic carbon; NA, not applicable.

16
Table S6. Top-20 globally enriched functions in ocean surfaces versus deep oceans.
Gene Family Coefficienta AICb P-value (BH) Annotation
COG0404 1.76 1543.88 0 Glycine cleavage system T protein (aminomethyltransferase)
COG0697 1.09 204.54 0 Permeases of the drug/metabolite transporter (DMT) superfamily
COG0451 1.06 936.41 1.69E-321 Nucleoside-diphosphate-sugar epimerases
COG1754 2.45 644.30 1.14E-310 Uncharacterized C-terminal domain of topoisomerase IA
COG1233 2.43 663.55 1.23E-284 Phytoene dehydrogenase and related proteins
COG4664 2.27 759.76 2.13E-283 TRAP-type mannitol/chloroaromatic compound transport system, large permease component
COG0069 1.06 542.17 6.56E-254 Glutamate synthase domain 2
COG0086 1.09 1450.77 1.14E-241 DNA-directed RNA polymerase, beta' subunit/160 kD subunit
COG4663 2.30 645.89 9.50E-235 TRAP-type mannitol/chloroaromatic compound transport system, periplasmic component
COG0665 1.08 489.81 6.13E-225 Glycine/D-amino acid oxidases (deaminating)
COG1304 2.16 342.73 5.97E-219 L-lactate dehydrogenase (FMN-dependent) and related alpha-hydroxy acid dehydrogenases
COG0280 2.07 754.55 1.57E-207 Phosphotransacetylase
COG4176 2.42 488.08 1.62E-204 ABC-type proline/glycine betaine transport system, permease component
COG0623 2.44 459.71 3.35E-203 Enoyl-[acyl-carrier-protein] reductase (NADH)
COG0209 1.05 866.12 6.21E-191 Ribonucleotide reductase, alpha subunit
COG0538 2.32 492.34 5.97E-185 Isocitrate dehydrogenases
COG0411 2.05 660.97 1.98E-181 ABC-type branched-chain amino acid transport systems, ATPase component
COG0465 1.24 291.21 2.83E-172 ATP-dependent Zn proteases
COG0174 1.10 778.43 1.35E-170 Glutamine synthetase
COG1121 2.78 350.29 7.26E-170 ABC-type Mn/Zn transport systems, ATPase component
aThe coefficient is the estimated difference between the two groups using Poisson model. bThe Akaike Information Criterion (AIC) represents a measure of the model fit.

17
Table S7. Top-20 globally enriched functions in deep oceans versus ocean surfaces.
Gene Family Coefficienta AICb P-value (BH) Annotation
COG0583 -2.03 1551.69 0 Transcriptional regulator
COG0642 -1.89 3796.85 0 Signal transduction histidine kinase
COG0840 -4.09 2011.64 0 Methyl-accepting chemotaxis protein
COG0845 -1.68 1427.55 0 Membrane-fusion protein
COG1020 -3.47 759.23 0 Non-ribosomal peptide synthetase modules and related proteins
COG1309 -2.58 527.69 0 Transcriptional regulator
COG1609 -2.53 873.32 0 Transcriptional regulators
COG1629 -2.19 5948.54 0 Outer membrane receptor proteins, mostly Fe transport
COG2199 -4.57 1633.61 0 FOG: GGDEF domain
COG2200 -4.31 988.31 0 FOG: EAL domain
COG2801 -3.90 357.59 0 Transposase and inactivated derivatives
COG3436 -5.46 608.08 0 Transposase and inactivated derivatives
COG3437 -3.94 888.67 0 Response regulator containing a CheY-like receiver domain and an HD-GYP domain
COG3547 -4.92 261.00 0 Transposase and inactivated derivatives
COG3696 -4.24 327.02 0 Putative silver efflux pump
COG3706 -3.59 1531.50 0 Response regulator containing a CheY-like receiver domain and a GGDEF domain
COG4584 -4.15 109.93 0 Transposase and inactivated derivatives
COG4644 -4.82 888.31 0 Transposase and inactivated derivatives, TnpA family
COG5001 -4.38 2254.97 0 Predicted signal transduction protein containing a membrane domain, an EAL and a GGDEF domain
COG3550 -6.07 336.77 2.83E-292 Uncharacterized protein related to capsule biosynthesis enzymes
aThe coefficient is the estimated difference between the two groups using Poisson model. bThe Akaike Information Criterion (AIC) represents a measure of the model fit.

18
Table S8. Bacterial and archaeal primer coverages. Primer coverages are estimated by using
TestProb program [13] against the SILVA SSU r121 database based on SILVA Ref NR
taxonomy.
Primer Taxon (level) # mismatch
0 1 2 3
Bacteria V6 forward primer
Bacteria (kingdom) 50.0% 68.2% 71.8% 82.0% Acidobacteria (phylum) 82.6% 89.0% 91.3% 91.7% Actinobacteria (phylum) 75.3% 82.1% 83.0% 83.4% Proteobacteria (phylum) 39.0% 75.2% 78.3% 81.2%
Alphaproteobacteria (class) 9.1% 74.7% 77.3% 84.9% Betaproteobacteria (class) 6.0% 77.4% 79.2% 79.7% Deltaproteobacteria (class) 50.7% 86.0% 89.6% 90.9% Gammaproteobacteria (class) 71.0% 76.2% 76.9% 77.3%
Cyanobacteria (phylum) 68.2% 79.2% 81.4% 83.0% Cyanobacteria (class) 77.5% 81.0% 81.6% 81.9%
Bacteroidetes (phylum) 6.0% 6.7% 7.3% 81.8% Flavobacteriia (class) 1.8% 2.3% 2.7% 84.2%
Firmicutes (phylum) 74.6% 80.4% 81.3% 82.0% Verrucomicrobia (phylum) 85.6% 89.0% 89.7% 90.3% Chloroflexi (phylum) 18.5% 41.5% 79.9% 90.2% Planctomycetes (phylum) 16.3% 50.3% 85.3% 90.9%
Bacteria V6 reverse primer
Bacteria (kingdom) 46.9% 81.4% 83.3% 83.6% Acidobacteria (phylum) 87.9% 92.1% 92.3% 92.3% Actinobacteria (phylum) 52.3% 81.9% 83.5% 83.7% Proteobacteria (phylum) 74.9% 81.2% 81.5% 81.6%
Alphaproteobacteria (class) 82.5% 85.1% 85.3% 85.4% Betaproteobacteria (class) 71.4% 79.7% 80.1% 80.2% Deltaproteobacteria (class) 85.5% 91.2% 91.4% 91.5% Gammaproteobacteria (class) 73.3% 77.0% 77.4% 77.5%
Cyanobacteria (phylum) 75.5% 80.2% 83.6% 84.1% Cyanobacteria (class) 79.7% 81.7% 82.2% 82.3%
Bacteroidetes (phylum) 17.1% 82.6% 84.6% 84.9% Flavobacteriia (class) 8.0% 83.6% 85.6% 85.8%
Firmicutes (phylum) 3.4% 78.4% 81.9% 82.2% Verrucomicrobia (phylum) 66.5% 89.9% 90.6% 91.0% Chloroflexi (phylum) 76.5% 90.1% 91.2% 91.5% Planctomycetes (phylum) 89.0% 81.2% 93.6% 93.7%
Archaea V6 forward primer
Archaea (kingdom) 61.7% 76.3% 77.7% 78.3% Euryarchaeota (phylum) 67.0% 77.2% 78.6% 79.4% Crenarchaeota (phylum) 57.9% 88.3% 91.7% 91.9% Thaumarchaeota (phylum) 52.4% 74.0% 75.1% 75.5%
Archaea V6 reverse primer
Archaea (kingdom)) 70.5% 80.9% 82.7% 83.4% Euryarchaeota (phylum) 68.8% 80.6% 82.8% 83.7% Crenarchaeota (phylum) 81.5% 89.7% 90.9% 90.9% Thaumarchaeota (phylum) 75.5% 81.2% 81.7% 82.0%

19
Table S9. Bacterial 16S rRNA V6 amplicon libraries from other oceans. Sample ID is the
sample name given by the VAMPS database (http://vamps.mbl.edu/). Sampling site Depth (m) Sample ID Azores 0 AWP_0014_2007_06_11 Azores 100 AWP_0013_2007_06_11 Azores 1200 AWP_0011_2007_06_11 Azores 3660 AWP_0009_2007_06_11 Mediterranean Sea 5 BMO_0006_2007_09_23 Mediterranean Sea 500 BMO_0011_2007_09_23 Mediterranean Sea 2000 BMO_0010_2007_09_23 HOT 10 KCK_HOT_Bv6.HOT186_10 HOT 100 KCK_HOT_Bv6.HOT186_100 HOT 1000 KCK_HOT_Bv6.HOT186_1000 HOT 3000 KCK_HOT_Bv6.HOT186_3000

20
References
1. Tang SL, Hong MJ, Liao MH, Jane WN, Chiang PW, Chen CB et al: Bacteria
associated with an encrusting sponge (Terpios hoshinota) and the corals partially
covered by the sponge. Environ Microbiol. 2011;13:1179‒91.
2. Sanguinetti CJ, Dias Neto E, Simpson AJ: Rapid silver staining and recovery of PCR
products separated on polyacrylamide gels. Biotechniques. 1994;17:914‒21.
3. Qu T, Mitsudera H, Yamagata T: Intrusion of the North Pacific waters into the South
China Sea. Journal of Geophysical Research: Oceans. 2000;105:6415‒24.
4. Higginson MJ, Maxwell JR, Altabet MA: Nitrogen isotope and chlorin
paleoproductivity records from the Northern South China Sea: remote vs. local
forcing of millennial- and orbital-scale variability. Marine Geology. 2003;201:223‒
50.
5. Wong GTF, Ku TL, Mulholland M, Tseng CM, Wang DP: The SouthEast Asian
time-series study (SEATS) and the biogeochemistry of the South China Sea - An
overview. Deep-Sea Research Part II-Topical Studies in Oceanography.
2007;54:1434‒47.
6. Emery WJ: Water types and water masses. Encyclopedia of Ocean Sciences.
2001;6:3179‒87.
7. Chang YT, Hsu WL, Tai JH, Tang TY, Chang MH, Chao SY: Cold Deep Water in the
South China Sea. Journal of Oceanography. 2010;66:183‒90.
8. Cai WJ, Dai MH, Wang YC, Zhai WD, Huang T, Chen ST et al: The
biogeochemistry of inorganic carbon and nutrients in the Pearl River estuary and the
adjacent Northern South China Sea. Continental Shelf Research. 2004;24:1301‒19.
9. Liu HB, Chang J, Tseng CM, Wen LS, Liu KK: Seasonal variability of picoplankton
in the northern South China Sea at the SEATS station. Deep-Sea Research Part
Ii-Topical Studies in Oceanography. 2007;54:1602‒16.
10. Chen CTA, Wang SL, Chou WC, Sheu DD: Carbonate chemistry and projected
future changes in pH and CaCO3 saturation state of the South China Sea. Marine
Chemistry. 2006;101:277‒305.
11. Talavera G, Castresana J: Improvement of phylogenies after removing divergent and
ambiguously aligned blocks from protein sequence alignments. Systematic Biology.
2007;56:564‒77.
12. Tamura K, Stecher G, Peterson D, Filipski A, Kumar S: MEGA6: Molecular
Evolutionary Genetics Analysis Version 6.0. Molecular Biology and Evolution.
2013;30:2725‒29.
13. Quast C, Pruesse E, Yilmaz P, Gerken J, Schweer T, Yarza P et al: The SILVA
ribosomal RNA gene database project: improved data processing and web-based
21
tools. Nucleic Acids Research. 2013;41:D590‒6.