additional mathematics sba was the best offensive and ... · additional mathematics sba was the...
TRANSCRIPT
Additional Mathematics SBA
Was the best offensive and defensive player from each team able to affect the results of the final outcome of the matches?
PURPOSE OF THE PROJECT:
Intro:
The purpose of this project is to give an idea based on
the information collected to inform us who the best
offensive and defensive player on each team that made it
to the National Basketball’s Association Championship
series are.
Twenty-nine teams participated in the regular season
and at the end the top eight teams (the top four from
each conference) was selected to contest the conference
finals.
WHY AM I DOING THIS PROJECT?

I am doing this to compare the statistics of the best
offensive and defensive player from each team that
made it to the NBA championship finals. It was done to
see if the player’s performance would affect the overall
outcome of the competition. The players that were
selected for the Miami Heat were: Lebron James and
Chris Anderson. Lebron James would be the offensive
study while the defensive study would be Chris
Anderson.
For the San Antonio Spurs, the players selected were:
Tim Duncan and Tony Parker. Tim Duncan was seen as
the defensive study while Tony Parker is the offensive
study.
METHOD OF DATA COLLECTION:
- Data was collected from the official NBA website.
- Data was collected from each conference final
match.
- Miami was seeded 1st followed by New York in 2nd
position. In 3rd we had Indiana and 4th was Brooklyn.
In 5th position was Chicago and 6th was Atlanta. The
lower end was rounded up with 7th position going to

Boston whilst 8th went to Houston. This was the
positioning of the teams in the eastern conference.
- Oklahoma City was seeded in 1st place and San
Antonio in 2nd. In 3rd position we had Denver and 4th
was Los Angeles clippers. In 5th was Memphis and 6th
was golden state. The lower end was rounded up
with 7th position going to Los Angeles Lakers and 8th
to Houston. This was the positioning of the teams in
the western conference.
- The 1st placed teams had to play the 8th placed team
while the 2nd would play the 7th, the 3rd would play
the 6th and 4th would play the 5th in each conference.
- These series were contested and the winner
determined by the best out of 7.
- The data collected to do this research and
experiment was: points per game, 3 point shooting,
rebounds, blocks, steals and field goals.
PRESENTATION OF DATA:
- TABLES:

Lebron James record for all the games in the 1st playoff
round, 2nd playoff round, conference finals and the
Finals.
Table 1:
Playoff round 1 Points scored Game 1 27 Game 2 19 Game 3 20 Game 4 30
0 5 10 15 20 25 30 35
Game 1
Game 2
Game 3
Game 4
Points scored
Points scored

This table show us the amount of points that Lebron
James scored in the 1st playoff round.
Table 2:
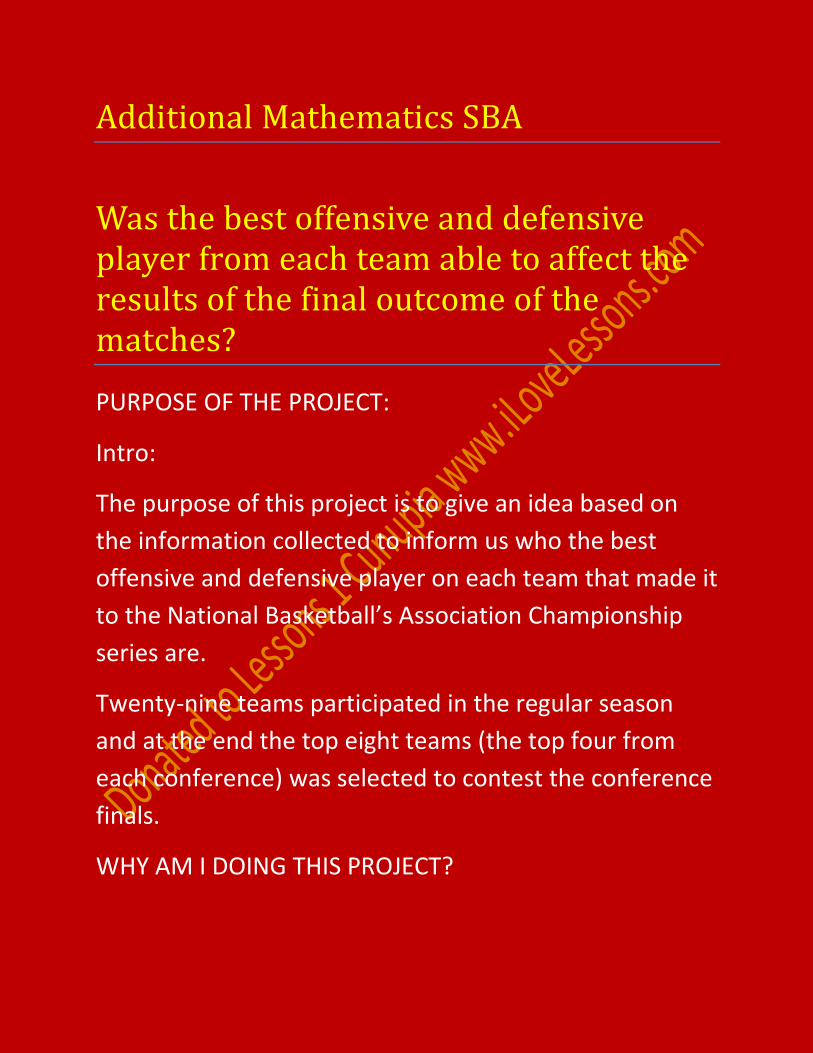
Playoff round 2 Points scored Game 1 24 Game 2 15 Game 3 25 Game 4 27 Game 5 23
This table shows us the amount of points Lebron James
scored in the 2nd playoff round.
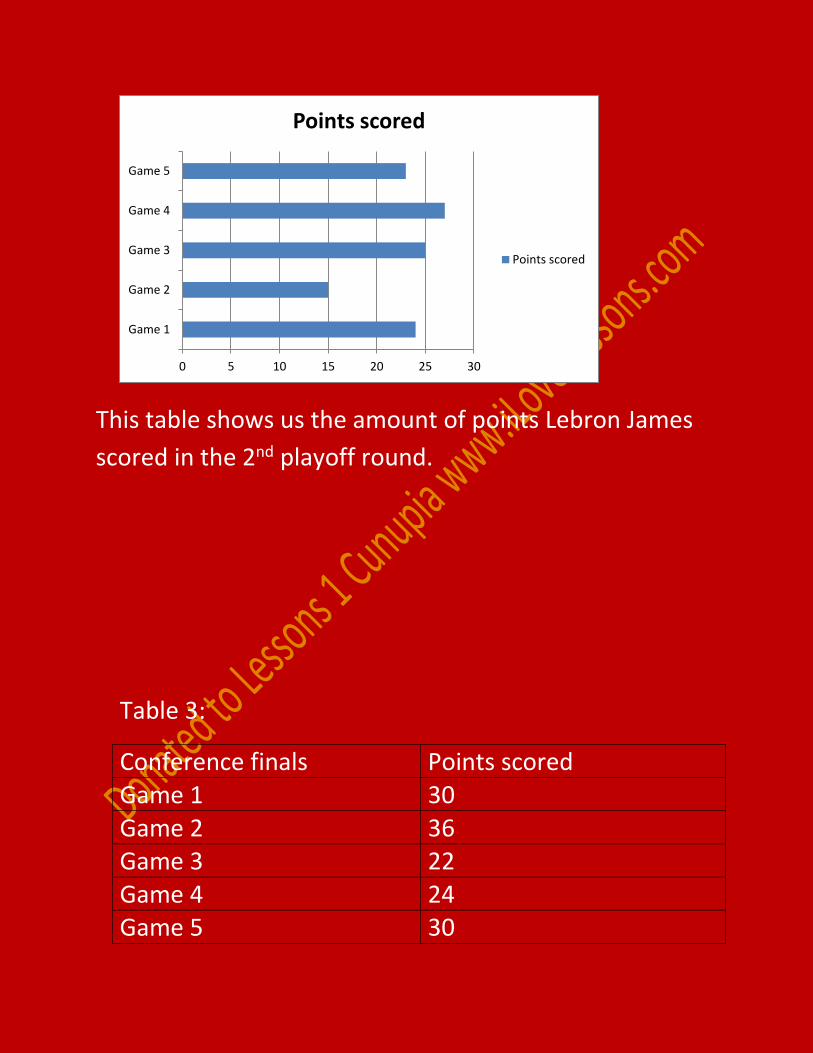
Table 3:
Conference finals Points scored Game 1 30 Game 2 36 Game 3 22 Game 4 24 Game 5 30
0 5 10 15 20 25 30
Game 1
Game 2
Game 3
Game 4
Game 5
Points scored
Points scored

Game 6 29 Game 7 24
This table shows us all the points scored by Lebron James
in the conference finals.
Table 4:
The Finals Points scored Game 1 18 Game 2 15 Game 3 12 Game 4 33 Game 5 25 Game 6 32 Game 7 37
0 10 20 30 40
Game 1
Game 2
Game 3
Game 4
Game 5
Game 6
Game 7
Points scored
Points scored

This table show us the point scored by Lebron James in
The Finals.
- We would now look at the statistics of the defensive
study for the Miami Heat. The table would show us
the number of steals/blocks made by Chris
Anderson.
0 10 20 30 40
Game 1
Game 2
Game 3
Game 4
Game 5
Game 6
Game 7
Points scored
Points scored
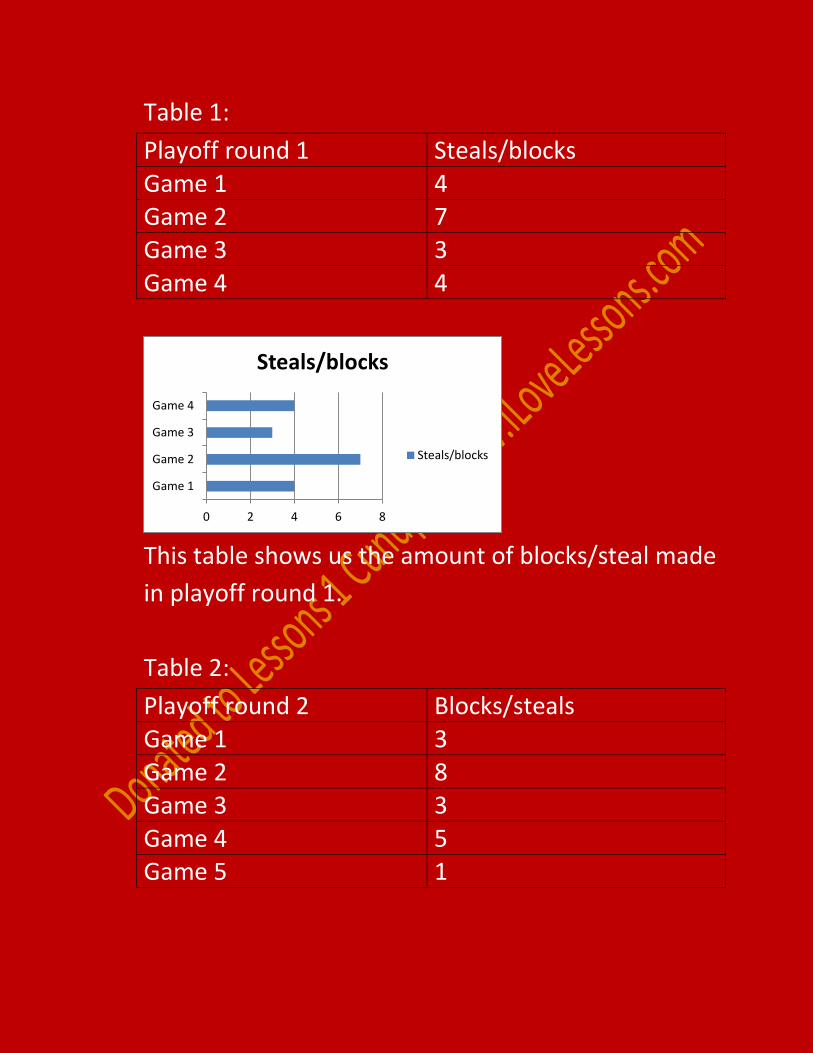
Table 1:
Playoff round 1 Steals/blocks Game 1 4 Game 2 7 Game 3 3 Game 4 4
This table shows us the amount of blocks/steal made
in playoff round 1.
Table 2:
Playoff round 2 Blocks/steals Game 1 3 Game 2 8 Game 3 3 Game 4 5 Game 5 1
0 2 4 6 8
Game 1
Game 2
Game 3
Game 4
Steals/blocks
Steals/blocks

This table shows us the number of blocks/steals made in
playoff round 2.
Table 3:
Conference finals Blocks/steals Game 1 4 Game 2 3 Game 3 7 Game 4 2 Game 5 5 Game 6 1 Game 7 6
0 2 4 6 8 10
Game 1
Game 2
Game 3
Game 4
Game 5
Blocks/steals
Blocks/steals

This table shows us the amount of blocks/steals this
player made in the conference finals.
Table 4:
The Finals Blocks/steals Game 1 2 Game 2 6 Game 3 0 Game 4 3 Game 5 5 Game 6 7 Game 7 4
0 2 4 6 8
Game 1
Game 2
Game 3
Game 4
Game 5
Game 6
Game 7
Blocks/steals
Blocks/steals

This table recorded the results for the amount of
blocks/steals this player made in The Finals.
- Now we shall look at the offensive study for the San
Antonio Spurs. His name is Tony Parker. The
following tables would give us a better idea into his
contribution to his team and their effort into making
it to The Finals.
0 2 4 6 8
Game 1
Game 2
Game 3
Game 4
Game 5
Game 6
Game 7
Blocks/steals
Blocks/steals

Table 1:
Playoff round 1 Points Game 1 25 Game 2 16 Game 3 33 Game 4 28 Game 5 21
This table shows us how many points were scored by
this player in the 1st round playoffs.
Table 2:
Playoff round 2 Points Game 1 18 Game 2 25 Game 3 31 Game 4 23
0 5 10 15 20 25 30 35
Game 1
Game 2
Game 3
Game 4
Game 5
Points
Points

This table showed us the amount of points scored by
the player in the 2nd playoff round.
Table 3:
Conference finals Points Game 1 18 Game 2 33 Game 3 24 Game 4 14 Game 5 28 Game 6 26
0 5 10 15 20 25 30 35
Game 1
Game 2
Game 3
Game 4
points
points

This table shows us the number of points scored in the
conference finals.
Table 4:
The Finals Points Game 1 23 Game 2 12 Game 3 34 Game 4 25 Game 5 08 Game 6 41 Game 7 23
0 5 10 15 20 25 30 35
Game 1
Game 2
Game 3
Game 4
Game 5
Game 6
points
points

This table shows us the number of points scored by the
offensive study for the San Antonio Spurs.
- Now, we shall look at the data for the San Antonio
Spurs’ defensive study. For this we have chosen Tim
Duncan. The following tables would give us a better
idea on his performances during the playoffs and
finals.
0 10 20 30 40 50
Game 1
Game 2
Game 3
Game 4
Game 5
Game 6
Game 7
Points
Points

Table 1:
Playoff round 1 Blocks/steals Game 1 5 Game 2 7 Game 3 4 Game 4 3 Game 5 6

This table showed us the performances made by this
player during the 1st round playoffs.
Table 2:
Playoff round 2 Blocks/steals Game 1 5 Game 2 3 Game 3 1 Game 4 6
0 2 4 6 8
Game 1
Game 2
Game 3
Game 4
Game 5
Blocks/steals
Blocks/steals

This table shows us the results for playoff round 2.
Table 3:
Conference finals Blocks/steals Game 1 4 Game 2 0 Game 3 10 Game 4 8 Game 5 7 Game 6 4
0 2 4 6 8
Game 1
Game 2
Game 3
Game 4
Blocks/steals
Blocks/steals

This table shows us the results obtained from the
defensive study during the conference finals.
Table 4:
The Finals Blocks/steals Game 1 5 Game 2 7 Game 3 8 Game 4 4 Game 5 4 Game 6 3 Game 7 6
0 2 4 6 8 10 12
Game 1
Game 2
Game 3
Game 4
Game 5
Game 6
Blocks/steals
Blocks/steals

This table shows us the amount of blocks/steals
made by this player during The Finals.
Analysis of Data:
The following calculations would show us the mean
number of points each player scored per game:
-Lebron James- 575/23
= 25 points per game
-Tony Parker- 552/23
= 24 points per game
0 2 4 6 8 10
Game 1
Game 2
Game 3
Game 4
Game 5
Game 6
Game 7
Blocks/steals
Blocks/steals

The next set of calculations would show us the mean
number of blocks/steals made by each defensive player:
-Chris Anderson- 93/23
= 4.04 blocks/steals per game
-Tim Duncan- 110/23
= 4.78 blocks/steals per game
STANDARD DEVIATION:
What is standard deviation?
𝑆𝑡𝑎𝑛𝑑𝑎𝑟𝑑 𝑑𝑒𝑣𝑖𝑎𝑡𝑖𝑜𝑛 𝑖𝑠 𝑡ℎ𝑒 𝑚𝑒𝑎𝑠𝑢𝑟𝑒 𝑜𝑓 𝑠𝑝𝑟𝑒𝑎𝑑 𝑚𝑜𝑠𝑡
Commonly used in statistics when the mean is used to
calculate central tendency.
To show the results of the standard deviation, we 1st
calculate the mean of the data set, and then subtract the

mean from each data set. After doing this, the results are
squared from the previous step. Following this, we add
these squared results together and then divide by the
total number of observations.
The following would show us the results recorded when
the standard deviation method was used:
Lebron James: 6.47
Tony Parker: 6.57
Chris Anderson: 2.00
Tim Duncan: 2.25
Stem and leaf diagram:

Discussion of findings:
After working out and studying the results we came up
with a few observations. The difference of the mean
points scored by both Lebron James and Tony Parker
were close. Lebron James had a mean of 25 points per
game while Tony Parker was slightly lower at a decent 24
points per game. Also, the average amount of blocks
made by Chris Anderson was 4.04 while Tim Duncan had
an average of 4.78 blocks per game. Since both sets of
calculations were extremely close, using the information
to come to any sort of conclusions would have been
unfair to the other player. Although Lebron James scored
more points his team wasn’t able to win The Finals.
Tim Duncan had the better results when it came to the
amount of blocks/steals made per game. Using the mean
number, he had 4.78 blocks. In essence, his team was
able to win The Finals.
The more consistent offensive player was Lebron James.
His average was 25 points per game and the standard
deviation of his results was 6.47. This means that on

average he would usually score 6.47 points more than 25
or 6.47 points less than 25. Tony Parker had a higher
standard deviation of .1.
In the defensive aspect of things, Tim Duncan mean was
higher as well as his standard deviation. Chris Anderson
mean was 4.04 and his standard deviation was 2.00. So,
in simple terms, each game he either had 2 blocks/steals
less than 4 or 2 blocks/steals more than 4.
Suggestions:
Here are some ways in which we can further develop
better findings and be able to make a larger comparision.
-have a wider range of matches to show results.
-have a specific age group to do the research.
