addressing changing demographics in environmental justice
TRANSCRIPT

Addressing Changing Demographics in Environmental Justice Analysis, State of Practice
TRB Annual Meeting
January 13, 2020
Funding:
Federal Highway Administration
DTFH61-17-D-00010

Introduction: Core Project Team
2
Les Brown,
Project Manager (ICF)
Dr. Aaron Golub, Primary
Investigator (Portland State)
Fleming El-Amin, Contracting
Officer’s Representative
(FHWA)
Report FHWA–HEP–19–022: available at FHWA >
Environment > EJ > Publications
Agenda
I.Context, Goals and Objectives
II. Changing Demographics: Trends and Forecasts
III. State of the Practice & Notable Practices
IV. Key Takeaways and Practitioner Considerations
V. Notable Practice Example Case Studies
I. Metropolitan Transportation Commission
II.Metro (Portland, OR)
III. Atlanta Regional Commission
IV. Florida Department of Transportation
3
\
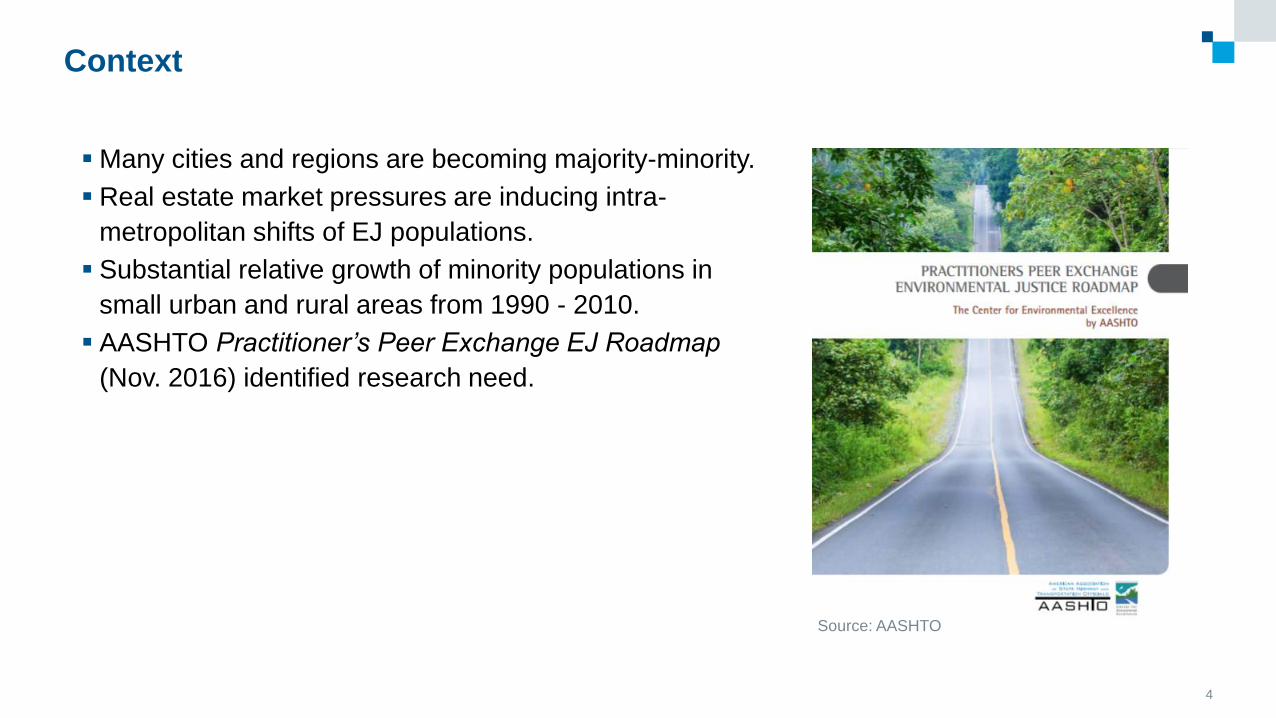
Context
▪ Many cities and regions are becoming majority-minority.
▪ Real estate market pressures are inducing intra-
metropolitan shifts of EJ populations.
▪ Substantial relative growth of minority populations in
small urban and rural areas from 1990 - 2010.
▪ AASHTO Practitioner’s Peer Exchange EJ Roadmap
(Nov. 2016) identified research need.
4
Source: AASHTO

Goals and Objectives
Primary Goals
▪ Improve understanding of the nature and magnitude of demographic change
▪ Highlight approaches to adapt the EJ analysis process to these conditions
Objectives
▪ Analyze national demographic trends and forecasts (state- and county-level)
▪ Document the state of practice/notable practices for considerations of demographic change in EJ
▪ Provide case studies of five notable agency practices
5
\

Demographic Trends and Forecasts
▪ White (Non-Hispanic) population: 80% in 1980; 63% today;
44% by 2060
▪ Substantial growth in LEP populations driven by
immigration
▪ Greatest relative change in small/urban areas
▪ Poverty rates for minority groups have declined, but are still
higher than for white households
▪ EJ populations living in central city or inner suburban areas
are increasingly being displaced by real estate market
pressures
6
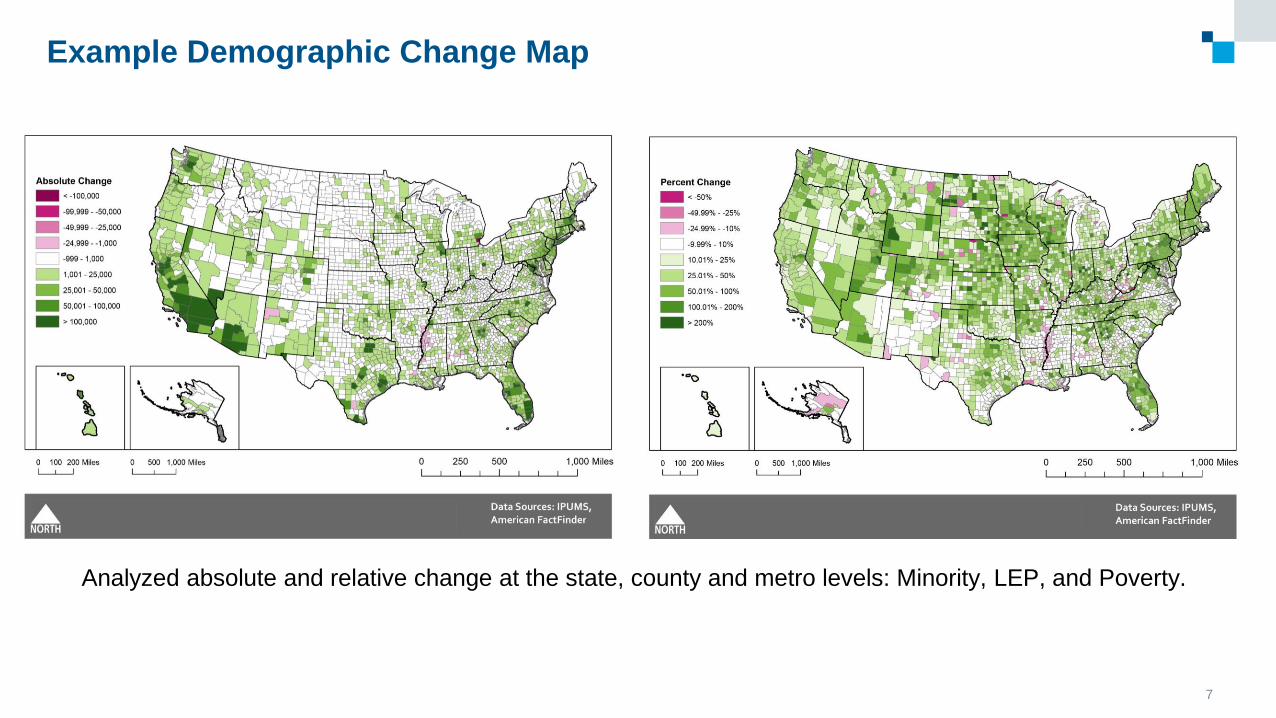
Analyzed absolute and relative change at the state, county and metro levels: Minority, LEP, and Poverty.
7
Example Demographic Change Map

▪ Demographic Forecasting
▪ EJ Analysis Methods
▪ Engaging EJ Communities
▪ Agency Practices
State of the Practice and Notable Practices: Highlights
8
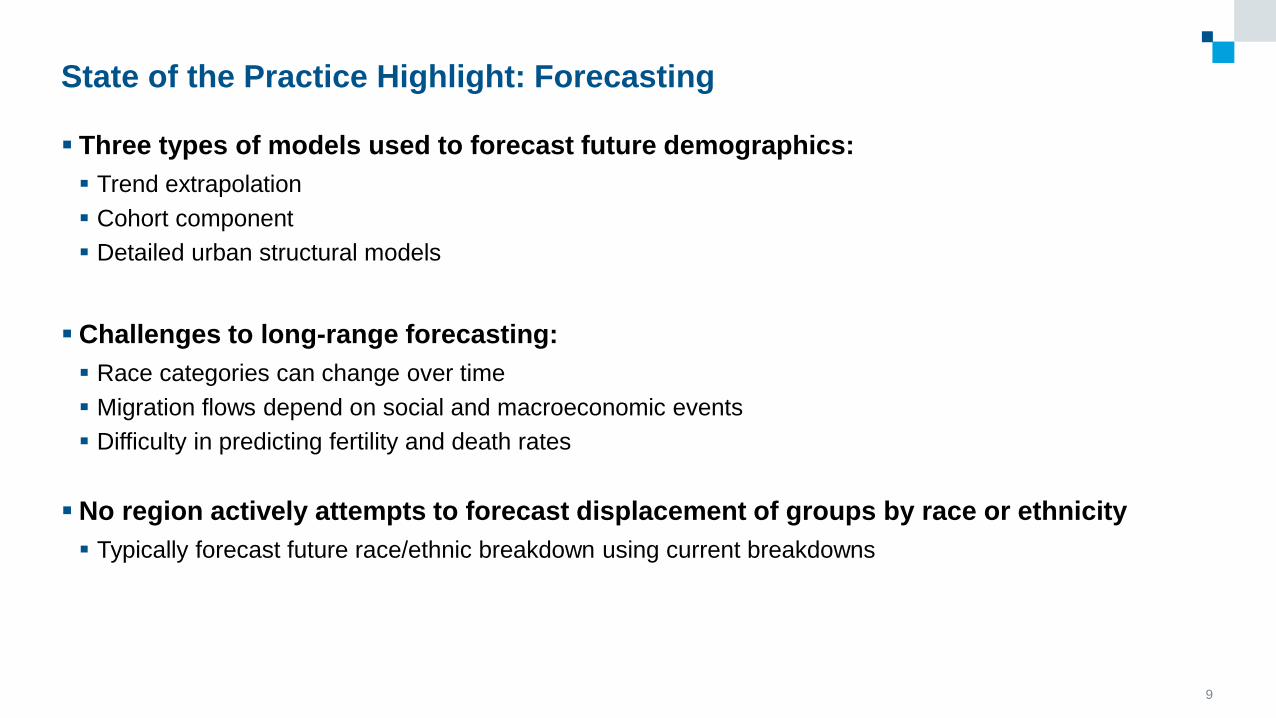
▪ Three types of models used to forecast future demographics:
▪ Trend extrapolation
▪ Cohort component
▪ Detailed urban structural models
▪ Challenges to long-range forecasting:
▪ Race categories can change over time
▪ Migration flows depend on social and macroeconomic events
▪ Difficulty in predicting fertility and death rates
▪ No region actively attempts to forecast displacement of groups by race or ethnicity
▪ Typically forecast future race/ethnic breakdown using current breakdowns
State of the Practice Highlight: Forecasting
9
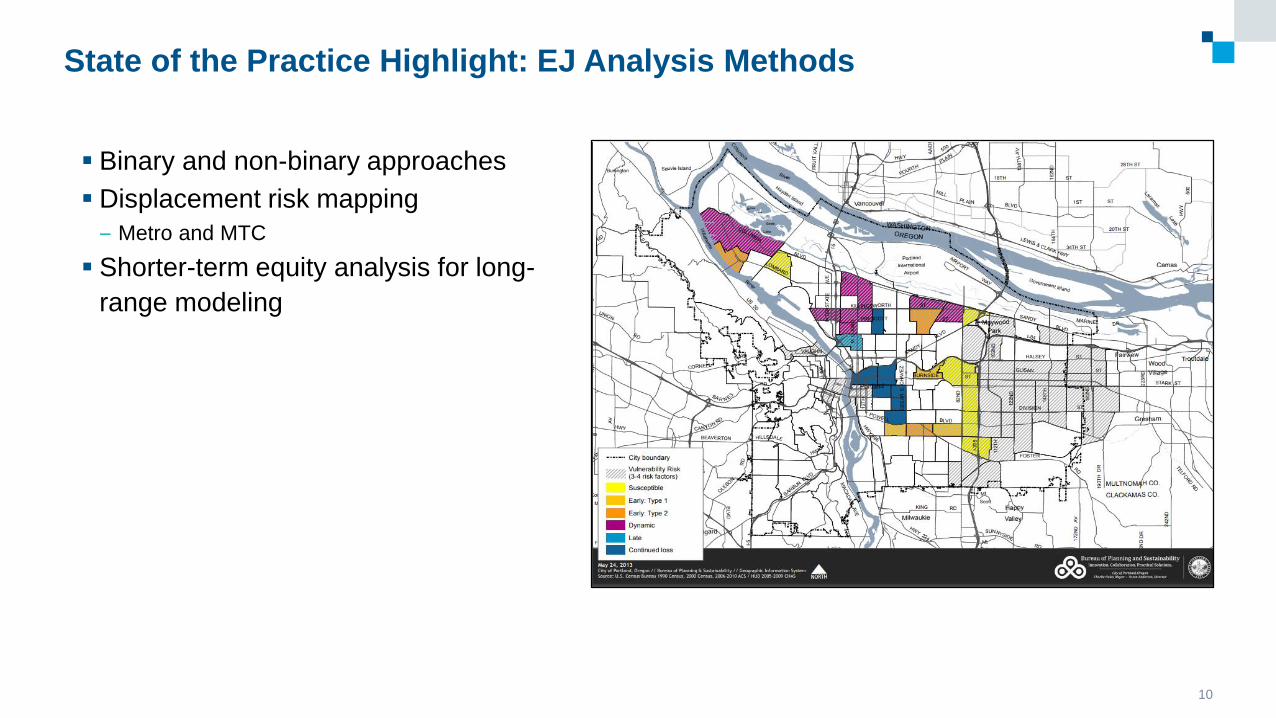
State of the Practice Highlight: EJ Analysis Methods
10
▪ Binary and non-binary approaches
▪ Displacement risk mapping
– Metro and MTC
▪ Shorter-term equity analysis for long-
range modeling
State of the Practice Highlight: Engaging EJ Communities
11
Gathering data directly from communities improves understanding of community
change dynamics.
Many agencies are:
▪ Using online tools, such as websites and social media, to communicate with the public
▪ Engaging in regular evaluations and adjustments of their engagement processes.
▪ Partnering with community organizations to obtain a better sense of community needs,
communicate decision-making issues to the community, and gather information from the
community.
▪ Establishing advisory committees to solicit citizen feedback.
Key Takeaways for Practitioners and Decision Makers
• Population change dynamics can be nuanced and complex
• This study found a lack of EJ analysis approaches designed to explicitly address demographic
change
• This study highlighted practices that can improve an agency’s ability to predict community change
and EJ impacts that may accompany this change in affected areas.
• Accurate, complete and accessible demographic data is key to understanding demographic
change in EJ and potential for adverse effects.
12
Key Takeaways: A Few Questions to Consider When Implementing EJ
13
Local Trends
▪ Is your community addressing the issue of demographic change when engaging the public?
▪ Is your community aware of demographic changes to date that may have already shifted
community composition?
▪ Do recent trends suggest the community is likely to shift over the lifecycle of a transportation
plan or investment?
▪ If it will change, how will you address that at later decision points?
Impacts of Planned Investments
▪ Is your community considering how planned investments could result in local demographic
change?
▪ Has your community developed a process to evaluate impacts of investments on
neighborhood change?
▪ Do investments address the needs of EJ populations and are there scenarios considering
community change?

Notable Practice Case Studies
14
Case Studies
15
I. Metro (Portland, Oregon)
II. Metropolitan Transportation Commission
III. Atlanta Regional Commission
IV. Florida Department of Transportation

Metro (Portland, Oregon)
16
METROKey Challenges
17
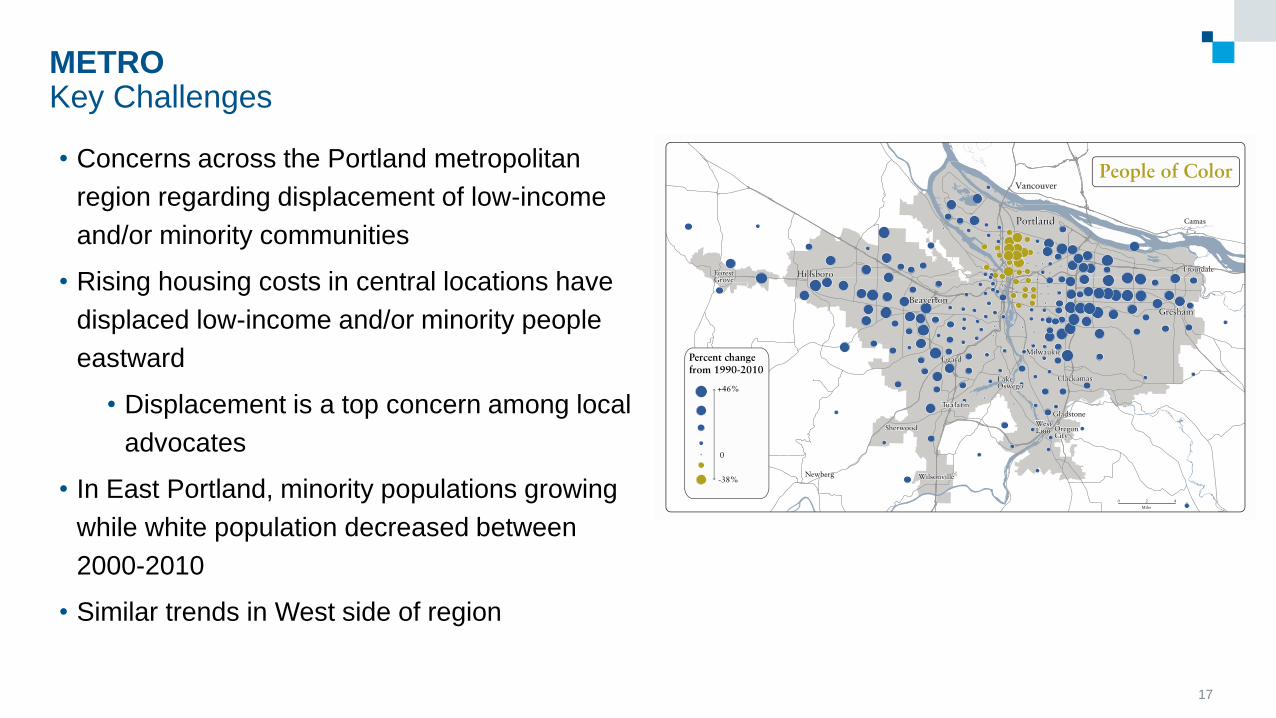
• Concerns across the Portland metropolitan
region regarding displacement of low-income
and/or minority communities
• Rising housing costs in central locations have
displaced low-income and/or minority people
eastward
• Displacement is a top concern among local
advocates
• In East Portland, minority populations growing
while white population decreased between
2000-2010
• Similar trends in West side of region
METRO – “Interim year” Equity Analysis of Regional PlanProblem Statement and Objectives
18
▪ Changing community demographics affect the accuracy of long-range forecasts and
models
▪ Objective: under the existing limitations, design a method to evaluate the long-range
transportation plan while addressing the concern around changing community
demographics and accuracy of projections
METRO – “Interim year” Equity Analysis of Regional PlanMethod of Analysis
19
▪ Equity Work Group
▪ Defined the EJ analysis measures
▪ Define transportation disadvantaged communities
▪ Determining size and location of transportation disadvantaged communities now and
in the future for equity analysis
▪ Metro forecasted population at TAZ scale assumes similar race/ethnicity profile to today
▪ “Interim” evaluation period at year 10 (2027) proposed with no change in race/ethnicity profile
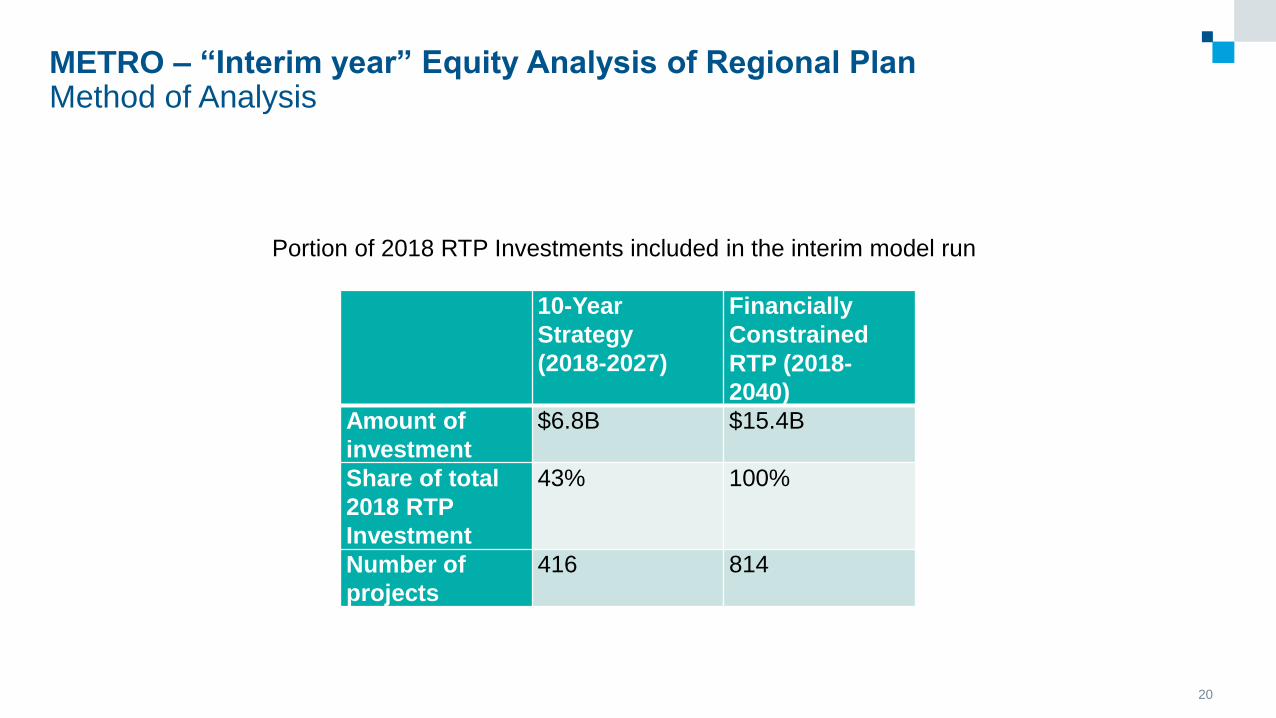
METRO – “Interim year” Equity Analysis of Regional PlanMethod of Analysis
20
10-Year
Strategy
(2018-2027)
Financially
Constrained
RTP (2018-
2040)
Amount of
investment
$6.8B $15.4B
Share of total
2018 RTP
Investment
43% 100%
Number of
projects
416 814
Portion of 2018 RTP Investments included in the interim model run

METRO: Displacement Forecasting Scenario Problem Statement and Objective
21
▪ Forecasting practice typically projects race and ethnic profiles using current day profiles,
placing them onto future population growth
▪ Avoid modeling intra-metropolitan shifts
▪ Objective: Better understand the dynamics of community displacement within forecasting
systems to try to predict patterns of displacement to assist housing planners in understanding
potential housing and neighborhood change
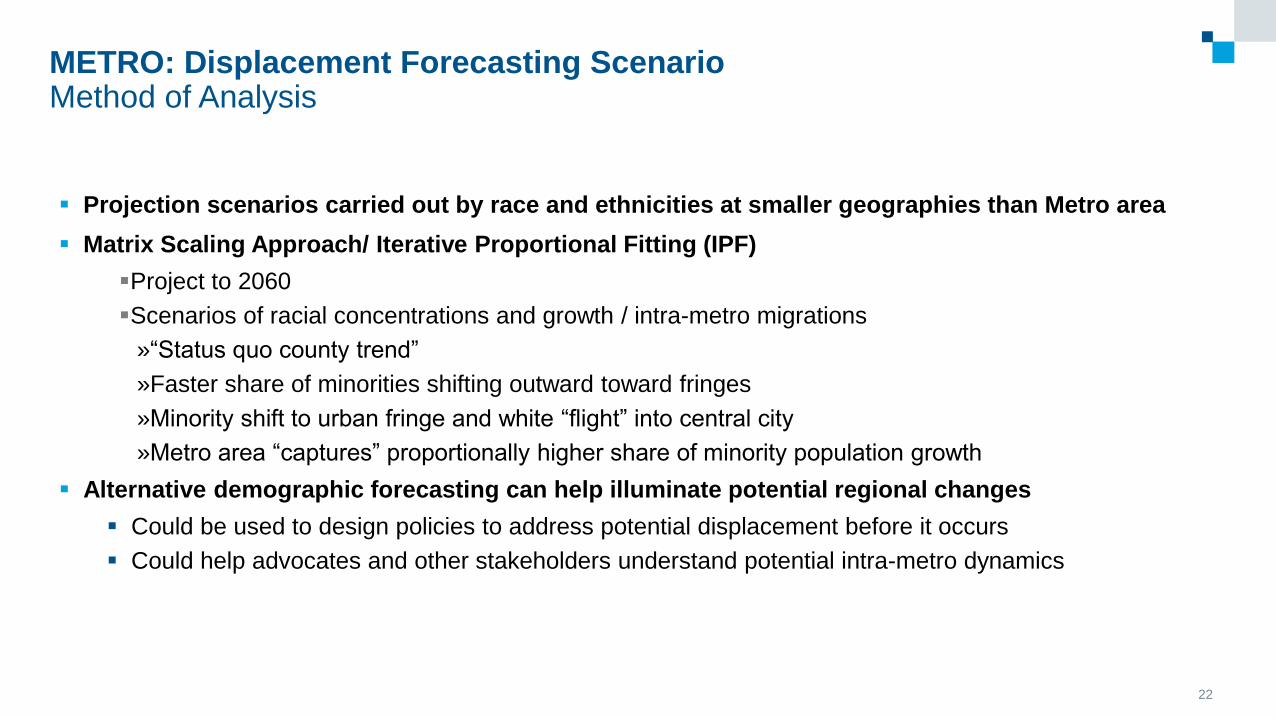
METRO: Displacement Forecasting Scenario Method of Analysis
22
▪ Projection scenarios carried out by race and ethnicities at smaller geographies than Metro area
▪ Matrix Scaling Approach/ Iterative Proportional Fitting (IPF)
▪Project to 2060
▪Scenarios of racial concentrations and growth / intra-metro migrations
»“Status quo county trend”
»Faster share of minorities shifting outward toward fringes
»Minority shift to urban fringe and white “flight” into central city
»Metro area “captures” proportionally higher share of minority population growth
▪ Alternative demographic forecasting can help illuminate potential regional changes
▪ Could be used to design policies to address potential displacement before it occurs
▪ Could help advocates and other stakeholders understand potential intra-metro dynamics

Metropolitan Transportation Commission (MTC) – San Francisco Bay Area
23

Metropolitan Transportation CommissionKey Challenges and Objective
24
▪ Rising housing costs and decreasing affordability
▪ 2000: 19 percent of renter households severely rent
burdened
▪ 2010-2014 ACS: 26 percent
▪ Lack of housing supply, especially near transit and/or jobs
▪ Spatial mismatch between jobs and housing locations
▪ Inadequate public funding to provide new/preserve
existing affordable units
▪ Congestion and increased desirability of central
neighborhoods causing pressure
▪ Fear that transportation investments exacerbate
displacement pressures
▪ Objective: Evaluate long-range plans for their potential to
decrease or increase displacement risk
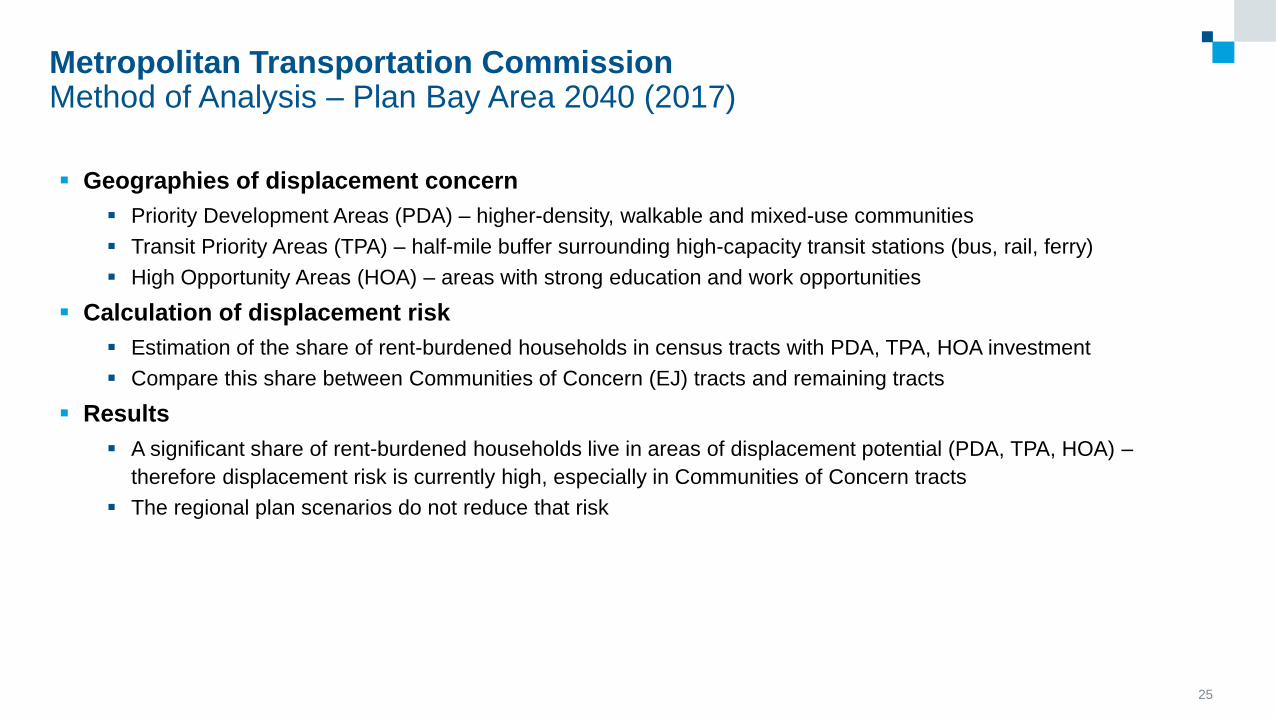
Metropolitan Transportation CommissionMethod of Analysis – Plan Bay Area 2040 (2017)
25
▪ Geographies of displacement concern
▪ Priority Development Areas (PDA) – higher-density, walkable and mixed-use communities
▪ Transit Priority Areas (TPA) – half-mile buffer surrounding high-capacity transit stations (bus, rail, ferry)
▪ High Opportunity Areas (HOA) – areas with strong education and work opportunities
▪ Calculation of displacement risk
▪ Estimation of the share of rent-burdened households in census tracts with PDA, TPA, HOA investment
▪ Compare this share between Communities of Concern (EJ) tracts and remaining tracts
▪ Results
▪ A significant share of rent-burdened households live in areas of displacement potential (PDA, TPA, HOA) –
therefore displacement risk is currently high, especially in Communities of Concern tracts
▪ The regional plan scenarios do not reduce that risk

Metropolitan Transportation CommissionMethod of Analysis – Plan Bay Area 2050
26
▪ Next regional plan equity analysis will build on the 2017 efforts
▪ Currently undergoing the “Horizons” planning exercise
▪ Transportation, Housing, Economic Development and Resilience
▪ Different future scenarios are being tested to address displacement and housing shortage,
such as:
▪ Allow a Greater Mix of Housing Types and Densities in Transit Rich Areas and High Resource Areas
▪ Increasing Renter Protections
▪ Fund Affordable Housing Preservation and Production from a range of sources
▪ Require 10% to 20% of New Housing to Be Affordable
▪ Preliminary results:
▪ Renter protections reduce displacement risk in the short term but did not have strong effects in the long
term due to tenant turn-over
▪ Increasing the stock of permanently affordable deed-restricted housing were more effective for the long
term
Atlanta Regional Commission (ARC)
27
Atlanta Regional Commission:Key Challenges and Objective
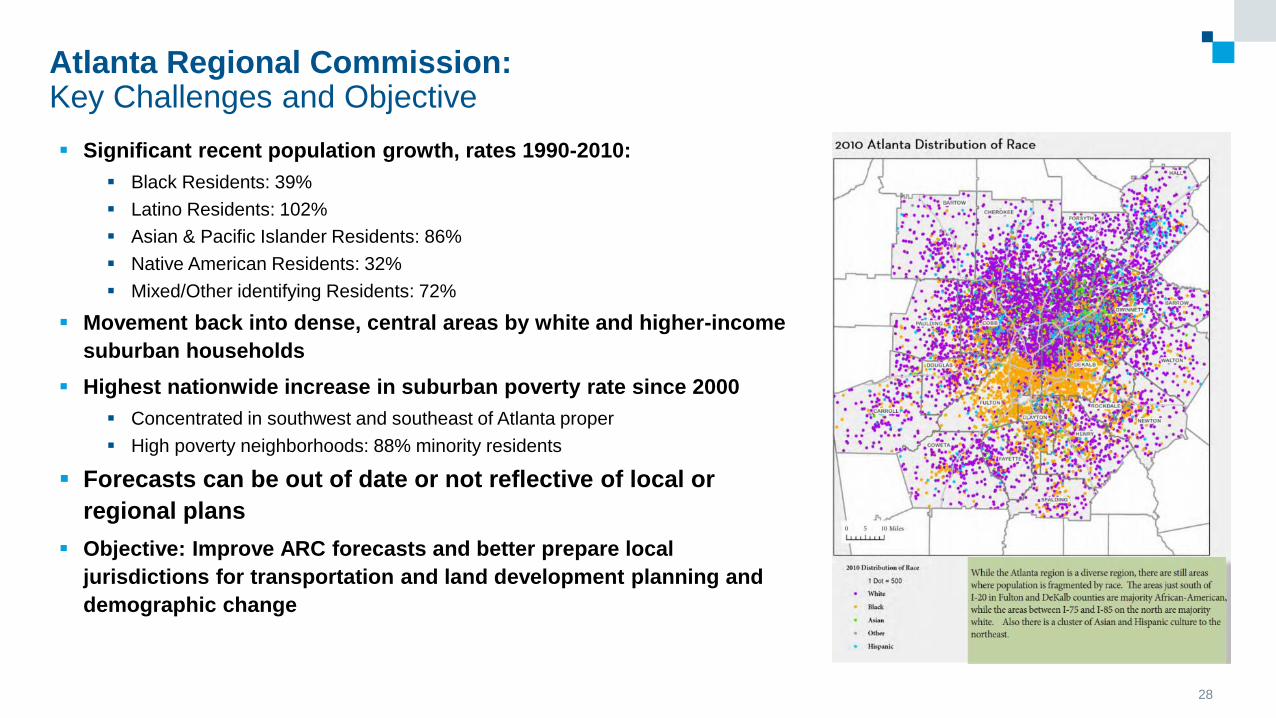
28
▪ Significant recent population growth, rates 1990-2010:
▪ Black Residents: 39%
▪ Latino Residents: 102%
▪ Asian & Pacific Islander Residents: 86%
▪ Native American Residents: 32%
▪ Mixed/Other identifying Residents: 72%
▪ Movement back into dense, central areas by white and higher-income
suburban households
▪ Highest nationwide increase in suburban poverty rate since 2000
▪ Concentrated in southwest and southeast of Atlanta proper
▪ High poverty neighborhoods: 88% minority residents
▪ Forecasts can be out of date or not reflective of local or
regional plans
▪ Objective: Improve ARC forecasts and better prepare local
jurisdictions for transportation and land development planning and
demographic change
Atlanta Regional Commission:Method of Analysis
29
▪ “Small Area Outreach” process between ARC and local jurisdictions
▪ ARC becomes aware of trends, plans, and growth at local level
▪ Local jurisdictions understand larger trends, plans, investments and forecasts throughout
metro region and how other decisions across the metro impact their jurisdiction
▪ Meet every three years with local jurisdictions
Florida Department of Transportation (FDOT)
30
Florida Department of Transportation:Key Challenges and Objective
31
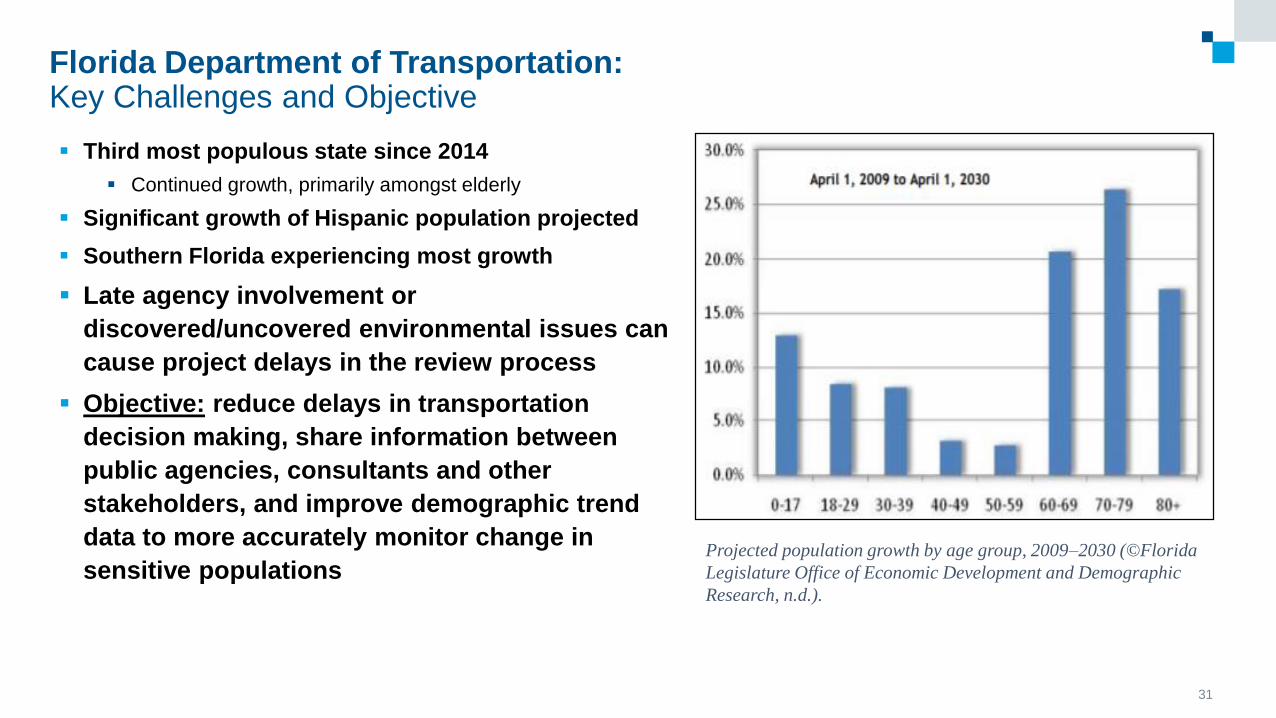
▪ Third most populous state since 2014
▪ Continued growth, primarily amongst elderly
▪ Significant growth of Hispanic population projected
▪ Southern Florida experiencing most growth
▪ Late agency involvement or
discovered/uncovered environmental issues can
cause project delays in the review process
▪ Objective: reduce delays in transportation
decision making, share information between
public agencies, consultants and other
stakeholders, and improve demographic trend
data to more accurately monitor change in
sensitive populationsProjected population growth by age group, 2009–2030 (©Florida
Legislature Office of Economic Development and Demographic
Research, n.d.).
Florida Department of Transportation:Multi-Stage Decision-Making Process
32
▪ Florida DOT established a multi-stage decision-making process for transportation projects
▪ Spatial analysis tool updated during each phase of the review process
▪ Collaborative approach between transportation, land use, and environmental resource
planning within:
▪ 27 MPOs within the State of Florida
▪ 7 FDOT districts plus Florida’s Turnpike
▪ 6 Tribal governments
▪ Publics – local governments, affected communities, business owners
▪ Efficient Transportation Decision-making (ETDM) framework:
▪ Project review process facilitated through Environmental Screening Tool (EST)
▪ Demographic Analysis conducted through these beginning phases of project proposal and planning to be
updated at project milestones
Florida Department of Transportation:Method of Analysis
33
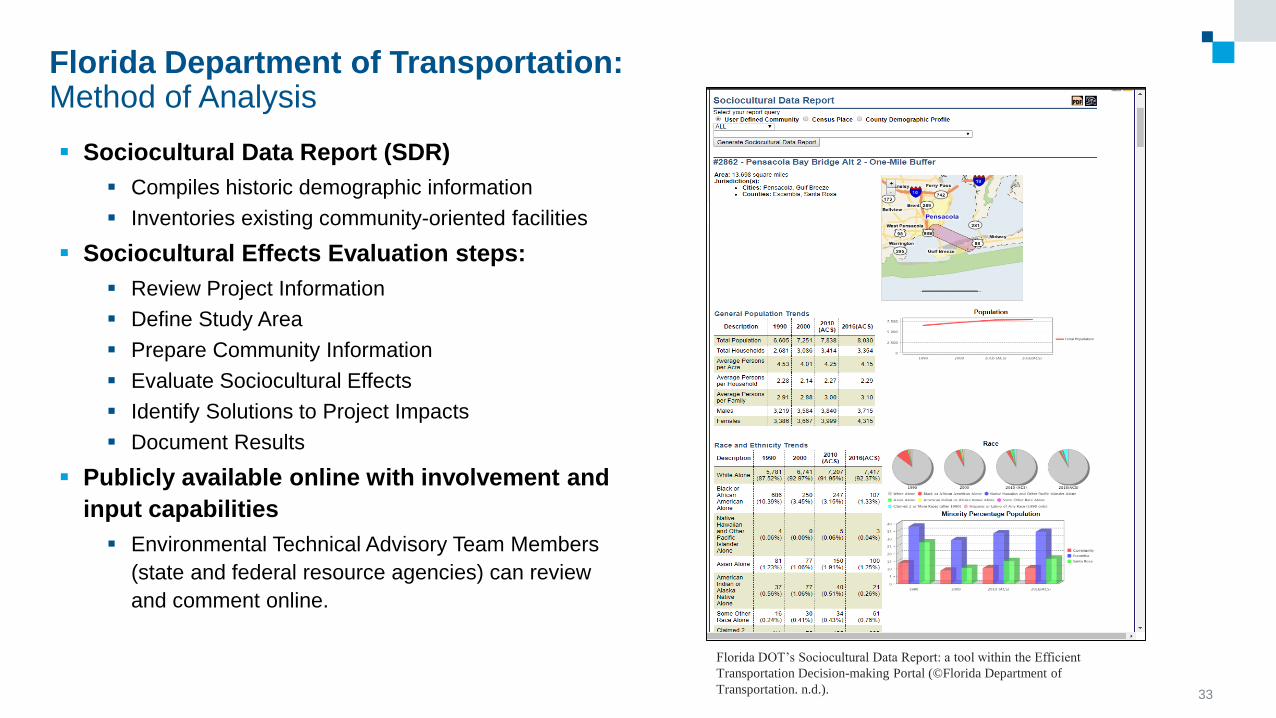
▪ Sociocultural Data Report (SDR)
▪ Compiles historic demographic information
▪ Inventories existing community-oriented facilities
▪ Sociocultural Effects Evaluation steps:
▪ Review Project Information
▪ Define Study Area
▪ Prepare Community Information
▪ Evaluate Sociocultural Effects
▪ Identify Solutions to Project Impacts
▪ Document Results
▪ Publicly available online with involvement and
input capabilities
▪ Environmental Technical Advisory Team Members
(state and federal resource agencies) can review
and comment online.
Florida DOT’s Sociocultural Data Report: a tool within the Efficient
Transportation Decision-making Portal (©Florida Department of
Transportation. n.d.).

Thank You!
34