addressing insider threats from smart...
TRANSCRIPT

ADDRESSING INSIDER THREATS FROM SMART DEVICES
A Dissertation
by
ALLEN T. WEBB
Submitted to the Office of Graduate and Professional Studies ofTexas A&M University
in partial fulfillment of the requirements for the degree of
DOCTOR OF PHILOSOPHY
Chair of Committee, A. L. Narasimha ReddyCommittee Members, Riccardo Bettati
Ulisses de Mendonça Braga-NetoGuofei GuSrinivas Shakkottai
Head of Department, Miroslav M. Begovic
August 2017
Major Subject: Computer Engineering
Copyright 2017 Allen T. Webb

ABSTRACT
Smart devices have unique security challenges and are becoming increasingly com-
mon. They have been used in the past to launch cyber attacks such as the Mirai attack.
This work is focused on solving the threats posed to and by smart devices inside a network.
The size of the problem is quantified; the initial compromise is prevented where possible,
and compromised devices are identified.
To gain insight into the size of the problem, campus Domain Name System (DNS)
measurements were taken that allow for wireless traffic to be separated from wired traffic.
Two-thirds of the DNS traffic measured came from wireless hosts, implying that mobile
devices are playing a bigger role in networks. Also, port scans and service discovery
protocols were used to identify Internet of Things (IoT) devices on the campus network
and follow-up work was done to assess the state of the IoT devices.
Motivated by these findings, three solutions were developed. To handle the scenario
when compromised mobile devices are connected to the network, a new strategy for step-
pingstone detection was developed with both an application layer and a transport layer
solution. The proposed solution is effective even when the mobile device cellular con-
nection is used. Also, malicious or vulnerable applications make it through the mobile
app store vetting process. A user space tool was developed that identifies apps contacting
malicious domains in real time and collects data for research purposes. Malicious app
behavior can then be identified on the user’s device, catching malicious apps that were
overlooked by software vetting. Last, the variety of IoT device types and manufacturers
makes the job of keeping them secure difficult. A generic framework was developed to
lighten the management burden of securing IoT devices, serve as a middle box to secure
legacy devices, and also use DNS queries as a way to identify misbehaving devices.
ii

DEDICATION
To my beloved wife Faith.
iii

CONTRIBUTORS AND FUNDING SOURCES
Contributors
This work was supported by a dissertation committee consisting of Professors A. L
Narasimha Reddy, Ulisses Braga Netto, Srinivas Shakkottai of the Department of Elec-
trical & Computer Engineering; and Professors Riccardo Bettati and Guofei Gu of the
Department of Computer Science & Engineering.
Chapter 3 and chapter 6 are based on a paper jointly written with Zhiyuan Zheng. The
Android app discussed in section 5.3 was developed with help by an undergrad intern,
Abhinav Bajaj.
All the remaining work for this dissertation was conducted by the student.
Funding Sources
The first year of graduate study was supported by the Delbert Whitaker Fellowship
from the Texas A&M Department of Electrical and Computer Engineering. The remaining
research and study were supported by the NPRP award [NPRP 5-648-2-264] from the
Qatar National Research Fund, and by a seed grant from College of Engineering, Texas
A&M University.
iv
NOMENCLATURE
AIDL Android Interface Definition Language [1].
ANM App Network Monitor (see page 60).
API Application Program Interface.
ARPA Address and Routing Parameter Area [2].
CDF Cumulative distribution function.
CDN Content Delivery Network.
CPU Central Processing Unit.
C&C Command and Control.
DDoS Distributed Denial of Service.
DGA Domain Generation Algorithms.
DHCP Dynamic Host Configuration Protocol [3].
DNP3 Distributed Network Protocol Version 3.
DNS Domain Name System [4, 5].
DNS-SD Domain Name System Service Discovery [6].
DVR Digital Video Recorder.
ENUM E.164 to Uniform Resource Identifiers [7].
FTP File Transfer Protocol [8].
GPS Global Positioning System.
HTTP Hypertext transfer protocol [9].
HTTPS Hypertext transfer protocol over SSL or TLS.
v

HTTP-RT Hypertext transfer protocol Response Time Method (seesubsection 4.2.2).
IMAP Internet Message Access Protocol [10].
IoT The Internet of Things.
IP Internet Protocol [11].
IPC Interprocess Communication.
IPP Internet Printing Protocol [12].
IPsec Internet Protocol Security [13].
JSD Jensen Shannon Divergence (see page 40).
KVM Keyboard Video and Mouse.
LAN Local Area Network.
LDAP Lightweight Directory Access Protocol [14].
Mbps Megabits per Second, 1,000,000 Bits per Second [15].
mDNS Multicast DNS [15].
MMD Mean Minimum Distance (see page 41).
MPGS Mean Pairwise Gaussian Similarity (see page 41).
MTU Maximum Transmission Unit.
NAT Network Address Translation [16].
NAS Network Attached Storage.
NFC Near Field Communication.
OS Operating System.
PBX Private Branch Exchange.
PDL Page Description Language.
POP2 Post Office Protocol Version 2 [17].
vi

POP3 Post Office Protocol Version 3 [18].
RFU Remote Firmware Update.
ROC Receiver Operating Characteristic.
RTT Round Trip Time.
SCADA Supervisory Control and Data Acquisition.
SDN Software-Defined Networking.
SIP Session Initiation Protocol [19].
SLD Second Level Domain.
SMTP Simple Mail Transfer Protocol [20, 21].
SOA Start of Authority.
SOAP Simple Object Access Protocol [22].
SOCKS Socket Secure [23].
SSDP Simple Service Discovery Protocol [24].
SSH Secure Shell [24].
SSL Secure Socket Layer.
TCP Transmission Control Protocol [25].
TCP-DD Transmission Control Protocol Delay DistributionMethod (see subsection 4.2.1).
TLD Top Level Domain.
TLS Transport Layer Security [26].
TTL Time to Live.
UID User Identification.
UPnP Universal Plug and Play.
UPS Uninterrupted Power Supply.
vii

URI Uniform Resource Identifier [27].
URL Uniform Resource Locator [28].
VoIP Voice Over IP.
VM Virtual Machine.
VNC Virtual Network Computing [29].
VPN Virtual Private Networking.
WAN Wide Area Network.
WPA Wi-Fi Protected Access.
WEP Wired Equivalent Privacy.
µ Mean, Average.
σ Standard Deviation.
viii

TABLE OF CONTENTS
Page
ABSTRACT . . . . . . . . . . . . . . . . . . . . . . . . . . . . . . . . . . . . . . ii
DEDICATION . . . . . . . . . . . . . . . . . . . . . . . . . . . . . . . . . . . . iii
CONTRIBUTORS AND FUNDING SOURCES . . . . . . . . . . . . . . . . . . iv
NOMENCLATURE . . . . . . . . . . . . . . . . . . . . . . . . . . . . . . . . . . v
TABLE OF CONTENTS . . . . . . . . . . . . . . . . . . . . . . . . . . . . . . . ix
LIST OF FIGURES . . . . . . . . . . . . . . . . . . . . . . . . . . . . . . . . . . xii
LIST OF TABLES . . . . . . . . . . . . . . . . . . . . . . . . . . . . . . . . . . xiv
1. INTRODUCTION . . . . . . . . . . . . . . . . . . . . . . . . . . . . . . . . . 1
2. THE TWO FACES OF DNS TRAFFIC . . . . . . . . . . . . . . . . . . . . . 7
2.1 Introduction . . . . . . . . . . . . . . . . . . . . . . . . . . . . . . . . . 72.2 Datasets / Methods . . . . . . . . . . . . . . . . . . . . . . . . . . . . . 92.3 Wired vs. Wi-Fi DNS Traffic . . . . . . . . . . . . . . . . . . . . . . . . 112.4 Other Observations . . . . . . . . . . . . . . . . . . . . . . . . . . . . . 192.5 Related Work . . . . . . . . . . . . . . . . . . . . . . . . . . . . . . . . 202.6 Summary . . . . . . . . . . . . . . . . . . . . . . . . . . . . . . . . . . 22
3. IOT MEASUREMENT STUDY . . . . . . . . . . . . . . . . . . . . . . . . . 24
3.1 Introduction . . . . . . . . . . . . . . . . . . . . . . . . . . . . . . . . . 243.2 Survey . . . . . . . . . . . . . . . . . . . . . . . . . . . . . . . . . . . . 26
3.2.1 Methodology . . . . . . . . . . . . . . . . . . . . . . . . . . . . 263.2.2 Findings . . . . . . . . . . . . . . . . . . . . . . . . . . . . . . . 27
3.3 Summary . . . . . . . . . . . . . . . . . . . . . . . . . . . . . . . . . . 32
4. FINDING PROXY USERS AT THE SERVICE USING ANOMALY DETEC-TION . . . . . . . . . . . . . . . . . . . . . . . . . . . . . . . . . . . . . . . 34
4.1 Introduction . . . . . . . . . . . . . . . . . . . . . . . . . . . . . . . . . 344.2 Detection Methods at the Service . . . . . . . . . . . . . . . . . . . . . . 37
4.2.1 TCP Delay Distribution Method . . . . . . . . . . . . . . . . . . 38
ix

4.2.2 Application Layer Response Time Method . . . . . . . . . . . . . 424.2.3 Identifying proxies during training . . . . . . . . . . . . . . . . . 44
4.3 Experimental Evaluation . . . . . . . . . . . . . . . . . . . . . . . . . . 454.3.1 Wide Area Network Measurements . . . . . . . . . . . . . . . . . 464.3.2 Local Area Network Measurements . . . . . . . . . . . . . . . . 514.3.3 Sensitivity . . . . . . . . . . . . . . . . . . . . . . . . . . . . . . 52
4.4 Related Work . . . . . . . . . . . . . . . . . . . . . . . . . . . . . . . . 554.5 Summary . . . . . . . . . . . . . . . . . . . . . . . . . . . . . . . . . . 58
5. IDENTIFYING MALICIOUS ACTIVITY FROM ANDROID APPS . . . . . . 59
5.1 Introduction . . . . . . . . . . . . . . . . . . . . . . . . . . . . . . . . . 595.2 Dynamic Analysis Test Platform . . . . . . . . . . . . . . . . . . . . . . 60
5.2.1 Methods . . . . . . . . . . . . . . . . . . . . . . . . . . . . . . . 615.2.2 Results . . . . . . . . . . . . . . . . . . . . . . . . . . . . . . . 65
5.3 App Network Monitor: A DNS Based Device Hygiene Solution . . . . . 665.3.1 Implementation . . . . . . . . . . . . . . . . . . . . . . . . . . . 665.3.2 Results . . . . . . . . . . . . . . . . . . . . . . . . . . . . . . . 70
5.4 Related Work . . . . . . . . . . . . . . . . . . . . . . . . . . . . . . . . 715.5 Summary . . . . . . . . . . . . . . . . . . . . . . . . . . . . . . . . . . 72
6. IOTAEGIS: A SCALABLE FRAMEWORK TO SECURE THE INTERNETOF THINGS . . . . . . . . . . . . . . . . . . . . . . . . . . . . . . . . . . . . 73
6.1 Introduction . . . . . . . . . . . . . . . . . . . . . . . . . . . . . . . . . 736.2 Attacker Model . . . . . . . . . . . . . . . . . . . . . . . . . . . . . . . 746.3 Solution . . . . . . . . . . . . . . . . . . . . . . . . . . . . . . . . . . . 766.4 Evaluation . . . . . . . . . . . . . . . . . . . . . . . . . . . . . . . . . . 816.5 Related Work . . . . . . . . . . . . . . . . . . . . . . . . . . . . . . . . 856.6 Summary . . . . . . . . . . . . . . . . . . . . . . . . . . . . . . . . . . 86
7. CONCLUSIONS . . . . . . . . . . . . . . . . . . . . . . . . . . . . . . . . . 87
7.1 Future Work . . . . . . . . . . . . . . . . . . . . . . . . . . . . . . . . . 887.1.1 Proxy Detection . . . . . . . . . . . . . . . . . . . . . . . . . . . 887.1.2 App Network Monitor . . . . . . . . . . . . . . . . . . . . . . . 897.1.3 IoTAegis . . . . . . . . . . . . . . . . . . . . . . . . . . . . . . 89
REFERENCES . . . . . . . . . . . . . . . . . . . . . . . . . . . . . . . . . . . . 91
APPENDIX A. ANDROID LINUX KERNEL MODIFICATIONS FOR BINDERIPC LOGGING . . . . . . . . . . . . . . . . . . . . . . . . . . . . . . . . . . 107
x

APPENDIX B. CODE FOR CREATING A DATABASE OF BINDER TRANS-ACTION CODES . . . . . . . . . . . . . . . . . . . . . . . . . . . . . . . . . 111
xi

LIST OF FIGURES
FIGURE Page
2.1 CDF of DNS Address Record TTL Values . . . . . . . . . . . . . . . . . 12
2.2 Volume of DNS Requests for Each Domain . . . . . . . . . . . . . . . . 12
2.3 Wired vs. Wi-Fi DNS Response Volume . . . . . . . . . . . . . . . . . . 15
2.4 Percent of Total DNS Requests from Wi-Fi Hosts for Software SpecificDomain Names (Dataset 4) . . . . . . . . . . . . . . . . . . . . . . . . . 16
2.5 Distribution of Average Delay Between DNS Requests . . . . . . . . . . 17
3.1 Categorized Sample of Devices from the Port Scan. . . . . . . . . . . . . 28
3.2 Top Ten Identified Services . . . . . . . . . . . . . . . . . . . . . . . . . 29
3.3 Security Readiness of Printer Sample . . . . . . . . . . . . . . . . . . . . 30
3.4 Printer Firmware (FW) Release Dates . . . . . . . . . . . . . . . . . . . 30
3.5 Authentication for VoIP Phone Administration . . . . . . . . . . . . . . . 31
4.1 Direct Traffic vs. Socket Proxy Backdoor . . . . . . . . . . . . . . . . . 34
4.2 TCP Delay Distribution Measurements . . . . . . . . . . . . . . . . . . . 39
4.3 HTTP Response Time Method . . . . . . . . . . . . . . . . . . . . . . . 43
4.4 Jensen Shannon Divergence Between Training Data from Similar Paths . 45
4.5 Path Pings of Each Set of Selected PlanetLab Nodes . . . . . . . . . . . . 47
4.6 Performance Comparison of Implementation Options: ROC Area of EachTCP-DD Trial Using Smoothed JSD Listed in Descending Order . . . . . 48
4.7 Performance Comparison of Implementation Options: ROC Area of EachHTTP-RT Trial For Three Samples Using Minimum Listed in DescendingOrder . . . . . . . . . . . . . . . . . . . . . . . . . . . . . . . . . . . . 49
xii

4.8 Performance Comparison of Implementation Options: TCP-DD Process-ing Method Comparison with Socat and SSH Combined . . . . . . . . . . 50
4.9 Performance Comparison of Implementation Options: HTTP-RT Process-ing Method Comparison with Socat and SSH Combined . . . . . . . . . . 51
4.10 True positives of Direct Traffic Over Time After Initial Training AveragedAcross Trials . . . . . . . . . . . . . . . . . . . . . . . . . . . . . . . . 52
4.11 Percent of HTTP-RT Trials with ROC Area Above 0.999 . . . . . . . . . 53
4.12 Classifiers Using µ± 2σ . . . . . . . . . . . . . . . . . . . . . . . . . . 54
4.13 Identification of Direct Traffic Across Load Using TCP-DD Smooth JSD. 56
5.1 Basic Architecture of the Experimental Setup . . . . . . . . . . . . . . . 62
5.2 Internet Usage Timing . . . . . . . . . . . . . . . . . . . . . . . . . . . . 65
5.3 Example Weighted Binder IPC Graph . . . . . . . . . . . . . . . . . . . 67
5.4 App Network Monitor Overview . . . . . . . . . . . . . . . . . . . . . . 68
6.1 Exploitation Attacks Considered in the Chapter . . . . . . . . . . . . . . 75
6.2 An Overview of Our Solution—IoTAegis . . . . . . . . . . . . . . . . . 77
6.3 Printer Configuration Page Before (Left) and After (Right) IoTAegis Down-loaded and Updated the Firmware. . . . . . . . . . . . . . . . . . . . . . 82
6.4 Authentication Prompt When Accessing a Sensitive Page After IoTAegisSet a Password. . . . . . . . . . . . . . . . . . . . . . . . . . . . . . . . 83
6.5 Network Usage During the First 60 Seconds of Operation . . . . . . . . . 84
xiii

LIST OF TABLES
TABLE Page
2.1 Volume of Traffic Present in Each Dataset. . . . . . . . . . . . . . . . . . 10
2.2 25 Second-level Domains (SLD) with the Most Error-free Responses. . . 14
2.3 Mobile Domain Responses Wired (W) and Wi-Fi (RF) IPs . . . . . . . . 17
2.4 ICANN Name Collision Block List Stats . . . . . . . . . . . . . . . . . . 19
5.1 ANM Data Set Statistics . . . . . . . . . . . . . . . . . . . . . . . . . . 71
xiv

1. INTRODUCTION
The development of computers has had a profound and far reaching effect on society.
This development is ongoing, and with innovation comes many new challenges. While
the new technology has benefitted society, it has also created problems that need to be ad-
dressed. Though the Internet provides unprecedented opportunity for freedom of expres-
sion, learning, and trade, some would use it as a weapon or to take advantage of others.
Computer and network security deals with the protection of users from malicious attacks.
When dealing with security threats, two factors that can maximize the positive impact
are: (1) How widespread is the threat? (e.g. How many devices and people are affected?)
(2) How severe is the impact of the threat? (e.g. Is it life threatening? Could it cause a
company to go bankrupt?) Based on these factors, this work is focused on smartphones
and smart devices because they have widespread usage and can be found in safety critical
environments such as hospitals.
Mobile devices are gaining increased attention because laptops and mobile handsets
are ubiquitous. Three-quarters of the US population own one [30], and the global median
for adult smartphone ownership of a country is 43% [31]. These devices are brought
along with the user and come in contact with a variety of networks and devices such
as public Wi-Fi hotspots, bluetooth headsets, home networks, and office networks. Since
these devices are not tied down within a secure domain, they can carry infections and other
malware from outside into a protected network. When these devices are brought back into
the network, the network provider has more to worry about than just the vulnerabilities of
these mobile devices. They also need to protect the desktops, servers and other equipment
that remains within the protected domain. Thus, smartphones are attractive targets and
need appropriate protection.
1

People store significant personal data on their phones. Some examples include contact
information, personal calendars, personal photos, and payment information. In addition,
smartphones can use services like GPS, the Cellular network, and Wi-Fi to locate and track
the device. This information is vulnerable when malicious applications are present on the
user’s smartphone. The major smartphone app stores police the apps they host as a mea-
sure to prevent the spread of malware. Android even can remove malicious apps installed
on user devices remotely. However, some malicious apps end up on user devices either
by being preinstalled, by using an exploit, or by masquerading as a benign application.
Malicious behavior may not be evident until long after an app was originally installed for
various reasons. Apps can download new instructions to execute at runtime, they can de-
tect when they are being observed, and they can have zero day vulnerabilities. Therefore,
monitoring can play a crucial role in identifying malicious activity on the end-user device.
In addition to smartphones, many other devices are being connected to networks and
are already widespread in medical, educational, and industrial facilities. While smart de-
vices offer new features and remote management capability, these conveniences come with
added complexity and management burden. Handling one device may not be that much
trouble; however, it becomes a challenge when scaled up to a variety of device types and
vendors. In addition these devices pose new challenges to providing protection from at-
tacks because most have no capability to run third party security applications. When these
devices are medical equipment or are used at medical facilities, they can become safety
critical.
These challenges justify research effort to identify and address potential security risks.
Ideally, solutions to important issues would be found and deployed before there is an
opportunity for known vulnerabilities to be exploited by attackers. First, mobile devices
provide attackers with a way to avoid detection at the network edge. Second, malicious
behavior needs to be detected on mobile devices even with policing at the app store. Third,
2

monitoring and deploying patches to each device is difficult and motivates solutions that
require less effort and upkeep.
This dissertation addresses security issues related to mobile and non-compute devices
on the network, and has two main parts. The first two chapters are measurement stud-
ies that cover the security considerations and prevalence of non-compute devices such as
smartphones and IoT devices. The last three chapters cover solutions to inside network
threats posed by non-compute devices.
The first measurement study investigates wireless vs. wired DNS traffic and ana-
lyzes DNS traffic for suspicious traffic. The second measurement study investigates non-
compute devices that have open ports. Findings from these studies show that wireless
devices (such as smartphones) dominate the DNS traffic (chapter 2) and that IoT devices
outnumber the compute devices with open services (chapter 3). These results motivate the
study of potential security problems that can arise from these smart devices.
First, chapter 4 presents a solution to the problem of securing sensitive internal services
from compromised mobile devices. Second, solutions for detecting malicious smartphone
apps are covered in chapter 5. Third, chapter 6 details a solution for securing and managing
IoT devices.
Before developing a solution to a problem, it helps to understand the size of the prob-
lem as well as any previously unnoticed cravats. The first measurement study utilizes
Domain Name System (DNS) traffic. The Domain Name System (DNS) is fundamental to
the day-to-day operation of the Internet. As new uses for DNS are introduced and the ways
people use the Internet change, the impact on existing network utilities and services need
to be continuously studied and evaluated. We present a study of the DNS traffic on a large
campus network (chapter 2) that is based on an investigation of wireless and wired traffic
and the impact of new applications of DNS. We look into the differences in DNS traffic
from wired hosts and Wi-Fi hosts. In addition, we study various aspects of DNS traffic
3

including the network sources, application sources, and especially the various sources of
DNS nonexistent domain responses. Our results indicate that non-negligible fraction (10-
15%) of DNS queries result in nonexistent domain responses, many new applications have
come to rely on DNS as a side channel through network firewalls and that wireless DNS
traffic can exceed the wired DNS traffic.
DNS traffic is a sign of devices communicating with the Internet, but some devices
primarily have local communication. Smart devices such as printers, VoIP phones, and
IP cameras host services but typically generate few DNS queries or none. These devices
are still important from a security perspective. The infamous Mirai attack [32] which
hijacked nearly half a million Internet connected devices demonstrated the widespread
security vulnerabilities of the Internet-of-Things (IoT). In chapter 3 a set of active and
passive observation methods are employed to discover the security vulnerabilities of IoT
devices within a university campus. We show that (a) the number of non-compute devices
dominates the number of compute devices with open ports in a campus network; (b) 58.9%
or more devices do not keep up-to-date firmware and 51.3% or more do not have a user
defined password; and (c) the number of devices together with the diversity of device ages
and vendors make the protection of IoT devices a difficult problem.
Since mobile devices outnumbered wired devices in the DNS study, this work was
focused on attacks enabled by the unique properties of mobile devices. Smartphones can
connect over both Wi-Fi and Cellular interfaces allowing data to be funneled off of a
network without it passing through the network edge. When compromised they can be
used by attackers as steppingstones for accessing sensitive or protected information. We
propose a class of detection methods based on anomaly detection at the service and present
two lightweight methods of detecting proxies at the service: one for TCP and one for the
application layer. These methods can potentially be deployed to monitor connections in
real time so attackers may be stopped before accessing sensitive data. We evaluate these
4
methods on local and wide area networks, with different proxy applications, and under
different load conditions to show that the proposed techniques can provide high detection
rates at low false positive rates. Our techniques are effective even when the client to proxy
connections are out of scope of surveillance and resilient to attacks even during training1.
In addition to detecting proxies, other strategies can be used for identifying malicious
activity on smartphones. Some malicious apps for smartphones have been already iden-
tified, and there is a need to have the capability to quickly identify attacks and respond
in ways that minimize the damage they cause. Mobile apps are checked for malicious
behavior before being published on app stores, but this does not catch all the malicious or
vulnerable apps. In addition to determining aspects of the future behavior of an app, mali-
cious activity can be detected on users’ devices in real time. Chapter 5 expounds methods
for creating a controlled test environment that runs untrusted Android apps for security
research. These methods were used to determine that 20 out of the top 100 most popular
apps on the Google play store access the Internet regardless of user activity. This makes
the presence of periodic network traffic a poor indicator of malicious apps. A platform was
constructed for using DNS traffic to identify malicious apps. This platform also enables
data collection to gain new insights into the domains accessed by different apps with a
goal of detecting previously unknown malicious activity.
Smartphones are not the only new growing area that needs to be addressed. Smart
devices such as printers, VoIP phones, IP cameras, and other network enabled devices also
can be compromised. Motivated by the findings in chapter 3 we developed the IoTAegis
framework, which offers device-level protection to automatically manage device config-
urations and security updates. With cloud-based device profile updates, the development
effort to use IoTAegis to handle one device can be shared by all other users of the frame-
1 c© 2016 IEEE. Reprinted, with permission, from Allen T. Webb and A. L. N. Reddy, Finding proxy usersat the service using anomaly detection, 2016 IEEE Conference on Communications and Network Security(CNS), October, 2016.
5

work. Our solution is shown to be effective, scalable, lightweight, and can be deployed
in different forms and network types. The above solutions together constitute solutions to
insider threats posed by smart devices.
6

2. THE TWO FACES OF DNS TRAFFIC
2.1 Introduction
The availability of low cost and portable computers such as laptops, smart phones,
and tablets has introduced new variation into the way networks are used. One window
for observing changes in usage is the DNS requests made by different classes of devices.
The Domain Name System (DNS) [4, 5] provides a mapping from human readable names
into Internet Protocol addresses that can be routed to specific endpoints on the Internet (e.g.
www.domain.tld). It serves as a distributed database for records identified with a multi-part
name where DNS servers have authority over subsets of names delegated to them. In this
way the administrative burden of updating records is spread across organizations that have
authority over particular domains. DNS traffic is typically allowed through firewalls; thus,
many new services use DNS infrastructure as a means of communicating information.
DNS traffic has been widely studied to understand network traffic at large. It provides
a view into traffic patterns [33] and popular domains. DNS responses give a view into
the mechanisms of load balancing [34] [35] and how Content Delivery Networks (CDNs)
function [36]. DNS traffic has recently been used to provide a view into botnet behavior, by
distinguishing the botnet generated DNS query traffic from human generated query traffic
[37]. Collecting and analyzing DNS traffic is more scalable than carrying out similar
analysis on all the network traffic.
This study is motivated by two trends in network usage. First, usage of mobile and
wireless devices is the growing. Users have started replacing desktop computers with lap-
tops and other devices; the widespread adoption of smartphones with Wi-Fi capabilities is
changing the network usage patterns. The introduction of mobile devices brings several
aspects to the study of DNS traffic. The network traffic can be different because of differ-
7

ences in application usage, network usage, and the different resources in the devices. The
application usage on mobile devices may include more frequent accesses to social net-
working and video sites. The wireless devices on a campus that has wide Wi-Fi coverage
allow for more continuous or longer usage of network resources compared to desktop de-
vices. Mobile devices with limited resources (and hence lower caching) may also generate
more traffic than desktop devices.
Second, DNS is now used as a side channel by many applications. Most campus and
enterprise networks are protected by firewalls at the edge. These firewalls restrict the flow
of traffic between the protected network and the outside world. However, most network
firewalls typically allow communication on a few designated ports. The ports for HTTP
and DNS are commonly open, and a number of applications rely on these open ports for
getting through the firewalls. This is significant because attackers may utilize DNS for
this same purpose. DNS is being used by a number of applications from spam checkers
to anti virus software as a side channel to contact outside servers to provide their service.
Other new services we observed are ENUM over DNS (section 2.4), and the ICANN name
collision block list. ENUM is an important part of the VoIP infrastructure that enables one
type of smart device, VoIP phones, to perform their intended function. New services that
make use of the Domain Name System (DNS) infrastructure change the nature of DNS
queries.
This chapter studies the DNS traffic to observe and understand the impact of these two
trends. We collect and analyze DNS traffic at an educational institution to understand any
differences in mobile device traffic over wired devices. A better understanding of spam
DNS traffic improves decision-making in the area of how much monitoring is warranted
to stop outbreaks of malicious software and detect intrusions while protecting individual
privacy. A better picture of DNS traffic will also help gain an understanding of scalability
and other issues. For example, DNS traffic has been recently used as a means to identify
8

botnet C&C (command and control) [38, 39], and [40]. Specifically, these earlier studies
have used DNS nonexistent domain responses as a means of identifying potential botnet
traffic. Many new applications such as spam checkers and antivirus tools that use DNS as a
side channel generate a significant number of nonexistent domain responses as part of their
legitimate service. Understanding and separating this traffic is important for continuing to
provide security of the networks.
This chapter makes the following significant contributions: (1) Collects and analyzes
the DNS traffic over several days at a campus network, separating the traffic from wired
networks and wireless networks; (2) Shows that wireless networks are starting to dominate
the campus traffic, leading to implications on scalability and throughput of these networks;
(3) Shows that mobile devices have much less failed DNS queries than wired devices.
Some of this traffic is originating from new services exploiting DNS as a side channel.
These increased failure traffic increase the processing burden for separating legitimate
traffic from malicious traffic; (4) Shows that the application usage across wireless and
wired networks leads to different network accesses.
2.2 Datasets / Methods
Our measurements were taken from a campus of about 60,000 users. We collected
all the DNS traffic from three time periods: the summer of 2014, the fall semester of
2014, and the spring semester of 2015. Our data includes requests for which the campus
DNS servers are the start of authority (SOA) and also local queries which were recursively
resolved. The size of the datasets and some basic statistics about their constituents can be
found in Table 2.1.
To collect our data we tapped DNS traffic directed to the campus DNS resolvers. We
excluded traffic involved in the process of recursive DNS resolution. Thus, each dataset
contains those DNS requests made to the local campus resolvers, as well as the correspond-
9

Dataset 1 Dataset 2 Dataset 3 Dataset 4
Time Period Summer Fall SemesterSpring Sem.
WeekendSpring Sem.
WeekStart Date June 19, 2014 Sep. 9, 2014 Jan. 16, 2015 Jan. 22, 2015
Duration (days) 13.07 10.26 2.26 7.02
RequestsTotal 2.02E+09 2.57E+09 2.36E+08 1.82E+09
% No Error 70.11% 92.02% 86.35% 91.10%% Error 29.89% 7.43% 13.00% 7.99%
UniqueDomains
Total 9.22E+06 9.08E+06 1.08E+06 4.81E+06% Resolved 47.10% 57.72% 76.67% 76.66%% Not Res. 52.90% 42.28% 23.33% 23.34%
Unique IPsTotal 1.77E+05 1.66E+05 9.65E+04 1.78E+05
% Wired 42.96% 29.63% 24.74% 26.59%% Wi-Fi 57.04% 70.37% 75.26% 73.41%
Table 2.1: Volume of traffic present in each dataset. It should be noted that for Dataset 1,which was during the summer, and Dataset 3, which was during a weekend, there are fewerstudents on campus than the other datasets. This provides a variety of different conditionsto observe the unique and common features across the datasets.
ing responses from the resolver back to the requester. These traces were then processed
afterward. DNS names longer than the 255 byte limit are included in the count as an empty
domain, “”. These made up 0.05% to 0.18% of the total requests.
It is notable that in Table 2.1 between 7.43% and 29.89% of the DNS requests failed
across the datasets. The DNS failure rates were higher during the summer and weekends.
The hosts that filter out Spam emails generate a higher ratio of failed to successful DNS
responses than typical users. When there are more typical users such as the university stu-
dents during the semester or week, the relative contribution of the Spam filter traffic is less.
In dataset 1 the hosts that accessed Spam blacklists had a 50.7% DNS error rate and were
responsible for 37.5% of the total DNS responses. We found that four forwarding name-
servers were responsible for the much larger nonexistent domain percentage in dataset 1.
For datasets 2 and 4 the error rates of hosts accessing Spam blacklists were between 16.4%
and 19.0%, while for dataset 3 the error rate was 29.4%. The higher error rate for dataset
10
3 is due to the volume of DNS errors remaining relatively flat across the week while the
successful traffic is more dependent on the time of day and day of the week, see Figure 2.3.
Also of note, is the difference in percentages of domains that resolved versus domains
that did not resolve. Domains that resolved had at least one successful DNS response while
domains that didn’t resolve had no successful DNS responses. There were a higher per-
centage, 70.11% to 92.02%, of successful DNS responses than resolved domains, 47.10%
to 76.66%. This means there was a higher proportion of non-existent domains than re-
quests of non-existent domains. This can be attributed to Spam and URL blacklists as well
as the fact that a few domains account for a large percentage of the total requests (see 2.2).
The unique IPs in Table 2.1 show the change in relative percentage of IP addresses
between the wired and Wi-Fi networks during the summer when students were away versus
during the semesters when students were present. Between datasets 1 and 2 this difference
was 13.33%.
2.3 Wired vs. Wi-Fi DNS Traffic
By observing how DNS traffic from wired vs Wi-Fi hosts differ, the top potential se-
curity issues facing mobile devices in particular can be found. Along with the DNS traces
we identified the IP addresses that had server related ports including FTP, SSH, Telnet,
SMTP, DNS, DHCP, HTTP, Kerberos, POP2, POP3, IMAP, LDAP, and secure versions
of these protocols. This set of hosts represents 2.52% of the total hosts and 9.46% of
the wired hosts. These hosts received 15.28% of all the successful DNS responses and
46.39% of the successful DNS responses to wired hosts. This suggests that server traffic is
a significant fraction of the wired network even though they constitute a small fraction of
the number of machines. More and more, the wired and wireless networks are becoming
“server” networks and “client” networks.
11

100 102 104 106 108 1010
TTL (seconds)
0.00.20.40.60.81.0
CDF
WiredWi-Fi
Figure 2.1: CDF of DNS Address Record TTL Values
100 102 104 106 108
Domain Number
100101102103104105106107108
Requests
WiredWi-Fi
Figure 2.2: Volume of DNS Requests for Each Domain
Four second level domains were responsible for 21.93% of all the successful DNS
requests, and of these 83.30% of the requests originated from Wi-Fi IP addresses. This
shows that a small subset of domains are responsible for a significant bias in the amount
of successful DNS queries between wired and Wi-Fi devices. In Table 2.2 the top 25 most
requested second level domains are listed. Only successful requests are counted in this
table. The % All column is the percentage of all successful DNS requests that match the
12

specified second level domain. The Wi-Fi % column is the fraction of successful DNS
requests for the specified second level domain that originate from Wi-Fi IP addresses.
The Time to Live (TTL) value of a DNS record conveys how long the record should
be cached before expiring. More information can be inferred from the TTL values as
they reflect a trade off between DNS server load and update response time. A record
with a higher TTL is cached longer and is requested less frequently as a result. Web
services that depend heavily on load balancing to provide better quality-of-service such
as video streaming use small TTLs to allow for faster control over which servers receive
new clients. Fast-fluxing DNS botnets use small TTL values to make it more difficult to
blacklist all their IP addresses and domain names. The TTL CDF plots for are shown in
Figure 2.1. More than 80% of the domains ranked 51st through 500th had TTL values of
60 seconds or fewer. For the top 25 domains almost half of the requests had TTL values
between 60 seconds and 5 minutes. The remaining domains had more of a spread over the
different TTL values with about half having TTL values 60 seconds or fewer. Figure 2.1
shows the CDF of the TTL values of address records for Wi-Fi and wired devices. We saw
that more of the TTL values of DNS address records requested by Wi-Fi devices were sixty
seconds or fewer than 5 minutes. Other common TTL values include three hours and one
day. This suggests that users of Wi-Fi devices requested more CDN hosted content such
as online videos than users of wired devices. Table 2.2 confirms that several well-known
CDN domains (akadns.net, akamai.net, akamaihd.net, amazonaws.com,
etc.) were requested more often by Wi-Fi hosts.
Figure 2.2 shows that the volume of requests of domains is nearly linear on a log-log
plot. This resembles a distribution following a power law [41]. However, there is a slight
curve that suggests that it is actually a power law with exponential cutoff or a log-normal
distribution. The distribution of requests from wired devices is more linear on the log-log
plot than from Wi-Fi devices. Wired devices made more requests to domains with less than
13

SLD Wi-Fi % % All µTTLapple.com 92.44% 8.61% 5495.2<local #1> 9.41% 8.34% 14719.4google.com 73.27% 7.67% 31188.1akadns.net 86.10% 6.12% 90.5
facebook.com 85.36% 3.52% 1255.7groupme.com 96.32% 2.48% 31.6
amazonaws.com 77.87% 2.14% 455.7akamaihd.net 79.19% 2.06% 179.4
flurry.com 94.92% 1.99% 31.5instagram.com 94.56% 1.90% 108.1
akamai.net 61.62% 1.74% 37akamaiedge.net 67.12% 1.45% 37.2
in-addr.arpa 16.89% 1.40% 15423.3
SLD Wi-Fi % % All µTTLyahoo.com 74.98% 1.32% 756.2icloud.com 89.83% 1.23% 37210.6twitter.com 77.10% 1.16% 50.7
yahooapis.com 92.52% 1.01% 194.8gstatic.com 65.12% 0.99% 175.7
doubleclick.net 71.63% 0.97% 20786.8googleapis.com 82.27% 0.76% 6167microsoft.com 48.95% 0.74% 1819.8
bing.com 86.50% 0.64% 1493.3yahoodns.net 76.79% 0.60% 148.9cloudfront.net 66.25% 0.55% 64.6
google-analytics 81.85% 0.55% 49556.4.com
Table 2.2: 25 Second-level Domains (SLD) with the Most Error-free Responses. TheWi-Fi % column shows what percentage of these requests came from Wi-Fi IP addresses.The % All column shows the percentage of total valid requests were for this domain. Theaverage TTL values are shown in the µTTL column.
100 requests each and significantly more to domains with only 2 requests. This shows the
wired network accesses were more diverse than the wireless network accesses.
From Table 2.2 the top three SLDs, apple.com, <local #1> and google.com, make
up a very large percentage of the successful DNS responses, about one quarter. This can
be explained by synchronization or other mobile device features on devices running iOS
and Android, as well as local services such as authentication servers. Contributing factors
to the results include cache misses due to smaller TTL values and unique subdomains.
The more unique subdomains a SLD has, the more requests and cache entries will be. In
Table 2.2 only <local #1> and in-addr.arpa, have more DNS requests from wired hosts
than Wi-Fi hosts.
Figure 2.3 shows the number of DNS responses with and without errors per five minute
interval. The data showed a different diurnal cycle for wired versus wireless hosts espe-
cially for DNS error responses. This difference is likely due to the Wi-Fi devices being
14

0.0
0.5
1.0
1.5
2.0
2.5
3.0
3.5
4.0
4.5
5.0
5.5
6.0
6.5
7.0
Days Fr om Star t of Captur e (5-minute bins)
103
104
105
106
Nu
mb
er
of
DN
S R
esp
on
ses
Wired with ErrorNo Error No Error with ErrorWi-Fi
Figure 2.3: Wired vs. Wi-Fi DNS Response Volume
used after work hours for personal use, but the wired devices mostly being used during
work hours. Typically, the wired hosts see a drop-off in activity after 5-6PM and the
wireless hosts were active until 10-11PM.
The volume of DNS errors for Wi-Fi hosts more closely follows the volume of DNS
successes. The relatively flat error response volume for wired hosts in Figure 2.3 is due
to the requests from Spam filters which are related to the volume of email traffic. The
Wi-Fi hosts are responsible for more successful DNS responses than the wired hosts, but
the Wi-Fi hosts produce less failed responses than the wired hosts. The spikes in Wi-Fi
error responses on Figure 2.3 result from anomalous traffic.
One interesting feature in Figure 2.3 is centered 4.5 days after the start of the trace.
There was a football game during this time that resulted in less than half the Wi-Fi DNS
responses on each side of the valley. The DNS responses from wired hosts did not have a
noticeable change in the volume.
15

Android iOS
Other M obi leM ac OS
'N IX
Windows
Oper at ing Systems
0
20
40
60
80
100
% D
NS
Re
qu
ests
Fro
m W
i-F
i
ChromeFir efox
Safar i
Br owser s
0
20
40
60
80
100
Figure 2.4: Percent of Total DNS Requests from Wi-Fi Hosts for Software Specific Do-main Names (Dataset 4)
It is possible to predict when students are between classes by changes in the volume of
traffic. There are regular peaks on the Wi-Fi DNS responses without errors in Figure 2.3
during the breaks between classes.
Figure 2.4 shows the percentages of DNS requests made for software specific domain
names. The particular domains chosen were those used for software updates and account
synchronization. An example software specific domain is android.clients.google.com,
which is used by android to download application updates and to access the Google Play
API. As expected Android and iOS DNS requests predominantly originated from Wi-Fi IP
addresses. Rogue access points are one source of mobile specific domains being accessed
from wired IP addresses. There is a strong bias toward mobile traffic originating from Wi-
Fi IPs, so by observing the Wi-Fi tendencies we can infer mobile usage trends. Windows
was split about evenly between the Wi-Fi and wired IP addresses; however, Mac OS had
a higher number of requests from Wi-Fi IP addresses. Safari is closely tied to iOS and
Mac OS so its percentage lied between the two operating systems. Requests from Firefox
were more common from wired hosts; requests from Chrome was more common on Wi-Fi
hosts. These percentages are from the raw total number of requests.
16

Dataset 1 2 3 4
api.*RF 2.46% 3.63% 4.68% 5.71%W 0.61% 1.19% 0.64% 1.02%
m.*RF 0.42% 0.38% 0.34% 0.30%W 0.26% 0.29% 0.18% 0.24%
mobile.*RF 0.12% 0.18% 0.22% 0.21%W 0.03% 0.06% 0.03% 0.05%
*.mobiRF 0.11% 0.18% 0.17% 0.18%W 0.01% 0.03% 0.01% 0.02%
Table 2.3: Mobile Domain Responses Wired (W) and Wi-Fi (RF) IPs
0100
200300
400500
600700
800900
Average Inter-packet Arrival Time (s)
10-6
10-5
10-4
10-3
10-2
10-1
100
Pro
ba
bil
ity
De
nsit
y
Wir ed
Wi-Fi
Figure 2.5: Distribution of Average Delay Between DNS Requests
Mobile devices such as smart-phones and tablets are increasingly common. These de-
vices typically connect to local networks through Wi-Fi. Separate web sites are provided
for these devices because they have touch screens instead of a mouse and keyboard. Also,
their screens may be much smaller so that a different layout is preferable than for desk-
tops or laptops. Domains of the following formats are associated with mobile devices: (1)
*.mobi is a TLD dedicated to mobile websites. (2) api.* are for web and mobile applica-
tion programming interfaces. (3) m.*, and mobile.* are for websites formatted for mobile
devices.
17

The api.* subdomains made up the largest percentage of the responses with no error
with between 0.61% and 1.19% for wired hosts and between 2.46% and 5.71% for Wi-Fi
hosts. Although we did observe requests made to other mobile related domains (mini.*,
palm.*, pda.*, wap.*, wireless.*, and xhtml.*), these made up less than 0.005% of the
total requests. Table 2.3 shows that the mobile handsets are not necessarily always visiting
mobile domains. The api.* domain group is commonly used with mobile applications
instead of websites in a browser. Not all mobile websites use mobile domains; some
share the same domain as the website formatted for desktops. Also, many websites are
designed using a “responsive design” [42] which is shared across different devices and
screen formats. Although there are still hits for older style mobile domains such as palm.*,
pda.*, wap.*, and xhtml.*, these domains make up a very small percentage of the total
responses.
Besides differences in the domains being queried, there were also rate differences be-
tween wired and Wi-Fi hosts. We observed higher DNS packet rates on wired hosts vs
Wi-Fi hosts based sessions defined by a 15-minute separation between packets for a given
IP address shown in Figure 2.5. To exclude the bias introduced by the edge of the session
window we calculated the mean time between packets to be the time of the last packet
minus the time to the first packet divided by the total number of packets minus one. Wi-Fi
IP addresses had a higher likelihood of long periods of time between DNS requests than
wired IP addresses. Wi-Fi devices may be used more intermittently than wired devices.
Wired IP addresses with multiple simultaneous hosts through NAT, and higher demand
from DNS dependent services such as Spam filtering contribute to the higher rate on wired
IP addresses.
We found that across all four datasets 16.53% of all the DNS responses had the error
flag set, while only 28.55% of these came from Wi-Fi hosts. Furthermore, 23.00% of all
the error responses were for the ARPA TLD, and only 1.69% of these were from Wi-Fi
18

Dataset 1 2 3 4Number of blocked domains 1 772 45 427
Number of blocked TLDs 0 24 7 39TLDs with any DNS record 420 354 132 335
Table 2.4: ICANN Name Collision Block List Stats
hosts. We attributed 13.42% of the error responses to local domains either the campus
domain or domains with the local, and localdomain TLDs. Wi-Fi hosts were recipients of
20.11% of this traffic. DNS Service Discovery made up 8.43% of the DNS error responses
18.08% of which went to Wi-Fi hosts. Lastly, anti-virus and spam blacklists made up
7.90% of the total error responses, but only 4.79% were for Wi-Fi hosts.
2.4 Other Observations
In investigating top level domains that were coming back as having IP addresses we
found some with records to 127.0.53.53. Since, August 2014 this address has been pur-
posed for ICANN name collision management. Table 2.4 shows the number of unique
domains returning 127.0.53.53 versus the total number of requests for a domain name
with only a top level that returned an IP address.
Several malicious and compromised machines were detected through the analysis of
failed DNS queries. However, this analysis is increasingly becoming difficult with several
applications generating nonexistent domain responses as part of their operation. We did
observe fast fluxing DNS responses, and suspicious DNS traffic likely related to botnets.
Some suspicious traffic appeared to be aggregated either by NAT or a DNS forwarder. Of
the domains with DNS failures 89.11% to 99.53% of them had an edit distance greater than
two to the nearest valid domain. The remaining percentage includes those typos where in
one or two instances a letter is omitted, different, or inserted.
19

Examples of domains we identified that indicate the presence of malware include:
bvkaymxoioe.www.game499.com.2014-12-30.pw
bvkcrzkdcsb.www.gannme499.com
loooplollokp80.com
With each example the bold part of the domain name was constant while the rest of the
domain had variation. The last example was accompanied by several requests to the same
prefix with different numbers at the end. This is an attempt to lower the edit distance
between requests and avoid detection.
One source of a large volume of nonexistent domains was the nrenum.net second level
domain. Nrenum provides an ENUM database over DNS for participating universities.
ENUM provides a way for E.164 numbers to be converted to a URI [7]. Protocols such
as SIP and H.323 then provide a way of initiating the voice communication. 99.98% of
the nonexistent ENUM domain responses were for a single host. In Dataset 4 for every
successful lookup this host had 9.67 failures, but the next most common requester had
more than 350 successful lookups for every failure. This appears to be a brute force search
of the entire ENUM database. The results of this kind of search could be used to asso-
ciate IP addresses with VoIP phone numbers, or determine what numbers are active for
purposes like robo-callers, etc. One technique to mitigate this kind of attack is to impose
rate limiting per IP by the number of unique ENUMs requested with a higher penalty for
non-existent numbers. Heavy offenders could be blacklisted, and legitimate services that
require higher rates could be white-listed.
2.5 Related Work
DNS traffic has been widely studied to understand network traffic at large. It provides
a view into traffic patterns [33], popular domains and through responses a view into the
20

mechanisms of load balancing [34] [35] and the functioning of Content Delivery Networks
(CDNs) [36].
DNS traffic in cellular networks has been recently studied [36]. They investigate the
impact on CDN load balancing performance from using a single DNS server for a geo-
graphically diverse set of mobile devices. DNS has been widely used for load balancing
and reducing delays over wide area networks through redirection [34] and [35]. It has also
been used as a way to measure delays across the internet [43]. DNS measurement studies
have been conducted in the past from the point of view of a root DNS server [33]. This
study identified violations of the DNS standard, reflection attacks, and divided up DNS
failure responses by the reasons they failed.
Domain registration has been studied for the possibility of identifying spammers early
in [44]. DNS behavior has been studied from several vantages to understand the global
DNS query patterns that can be used to detect malicious domain groups [45].
DNS traffic has recently been used to provide a view into botnet behavior, by distin-
guishing the botnet generated DNS query traffic from human generated query traffic. In
[46, 38, 39], and [40] non-existent domain queries are used to identify botnets that use
domain generation algorithms (DGA) for locating the C&C channel. The query rates for
bots were observed to be high, occurring over a short period, and generating nonexis-
tent domain responses in [46]. DNS error responses were classified using the type of error,
query entropy over the number of requests per local resolver and authoritative name server,
and query content in [47]. They found a string of malicious domains copying strings from
common social network domains. In [48] and [37] rather than focusing on DGA, a classifi-
cation scheme is developed for malicious domains. [37] makes use of timing information,
address record IP related information, reverse record information, TTL statistics, and do-
main name features to perform the classification.
21

The possibility of information being leaked through DNS is investigated in [49]. Sev-
eral services now use DNS for purposes beyond looking up the address record of a server
by name. In addition to intentional leakage of information, the architecture of a network
can be inferred through DNS traffic. The problem of remotely identifying the type of DNS
client infrastructure is addressed in [50]. They perform this classification by probing for
DNS servers by issuing requests to an authoritative name server they control.
DNS traffic can be analyzed to identify the operating systems of hosts. DNS query
traffic has been employed to carry out passive OS fingerprinting in [51] using OS-specific
DNS queries and timing of DNS queries. They also estimated the number of devices
generating the queries.
Work has been done to evaluate the performance of DNS caches in [41]. In their study
DNS traffic was collected along with TCP SYN, FIN, and RST packets. They investigated
the relationship between TTL and DNS cache hit rate and found that most of the DNS
cache hits occur within minutes of the initial miss.
Other work has investigated the difference in usage patterns between traditional com-
puters such as desktops and mobile devices [52]. This work makes no mention of DNS but
instead relies on other measurements. Our work seeks to gain insights into mobile device
usage with only a subset of the network traffic.
2.6 Summary
We collected DNS traffic from a campus over several days distinguishing wireless
from wired traffic. We compared DNS usage between wired and Wi-Fi hosts. The wire-
less hosts were responsible for close to two-thirds of the DNS traffic. Most of the popular
domains received more DNS requests from wireless devices. The traffic could loosely
be categorized into traffic from server machines and traffic from users. The Wi-Fi hosts
generated the bulk of the traffic and servers contributing half the traffic from wired IP ad-
22

dresses. More and more, the wired and wireless networks are becoming “server” networks
and “client” networks. Also, we have investigated network sources, application sources,
and sources of nonexistent domain responses that account for a significant percent of the
traffic (10-15%). Many of these were from applications that use DNS as a side channel
through network firewalls. This increase in failures makes it more difficult to identify ma-
licious traffic. DNS traffic analysis has proved useful in identifying several anomalies and
infected machines on the network. This investigation of the contributing sources of DNS
traffic provides insight into DNS and its relationship to the Internet as well as how new
technologies influence this relationship.
23

3. IOT MEASUREMENT STUDY
The infamous Mirai attack which hijacked nearly half a million Internet connected de-
vices demonstrated the widespread security vulnerabilities of the Internet-of-Things (IoT).
This study employs a set of active and passive observation methods to discover the security
vulnerabilities of IoT devices within a university campus. We show that (a) the number
of non-compute devices dominates the number of compute devices with open ports in a
campus network; (b) 58.9% or more devices do not keep up-to-date firmware and 51.3%
or more do not have a user defined password; and (c) the number of devices together with
the diversity of device ages and vendors make the protection of IoT devices a difficult
problem.
3.1 Introduction
Network connected sensors and devices are being used in several application domains
from inventory tracking to smart automation of buildings and other applications. Con-
nected printers, smart lightbulbs, VoIP phones, web cameras, and smart appliances (televi-
sions, refrigerators, washers, etc) are commonly seen IoT devices. Other common exam-
ples include smart meters, gas pumps, medical equipment, and industrial devices. These
devices employ different types of technologies such as Bluetooth [53], Wi-Fi, Near Field
Communication (NFC) [54], or Ethernet to improve their functionality and performance.
However, the lack of adequate security awareness in IoT deployment has led to
widespread cybersecurity vulnerabilities that threaten to undermine individuals, compa-
nies, and national infrastructures. In recent years, the IoT has become a ripe target of hack-
ers. For example, lightbulbs have been shown to be hackable via a drone [55], smart TVs
could be eavesdropping people’s conversations [56], and vulnerable Internet-connected
printers can leak sensitive documents from print jobs [57]. In addition, IoT devices could
24

be leveraged to launch disreputable attacks against other infrastructures. The recent DDoS
attack against DynDNS [58] was launched from nearly half a million Mirai-powered IoT
devices (mostly IP cameras and DVRs).
While computer security has received significant attention, the security of non-compute
devices or IoT devices is only beginning to receive a similar level of attention. A num-
ber of studies disclose the security vulnerabilities of individual IoT devices. In [59] static
analysis is performed and the permission granularity is exploited to craft a number of
proof-of-concept attacks against smart home components. They were able to secretly plant
door lock codes, extract the current door lock codes, disable the home’s “vacation mode,”
and set off the fire alarm. Vulnerabilities were disclosed for a home sensor monitor plat-
form and smart meter in [60]. The insecurity of baby monitors was demonstrated in [61].
Authors in [62] employ SHODAN [63] to reveal the scale of vulnerable IoT devices and
identify ones with default passwords. Another work [64] provides details of an IoT honey-
pot and sandbox to analyze Telnet-based attacks against various IoT devices. These studies
focus on narrow domains of IoT devices with limited services, but a complete vulnerability
disclosure of IoT devices is still unknown.
This chapter discovers security vulnerabilities of various IoT device types. In con-
trast to previous study [62] that uses SHODAN search engine [63] to identify Internet-
connected IoT devices, we employ a set of active and passive observation methods to dis-
cover a complete-as-possible list of IoT devices within a university campus. Our datasets
include not only IoT devices that can be directly visited by external hosts, but also devices
that are only visible to hosts within their subnet. Next, we evaluate the security of these
devices where we mainly focus on default/weak credentials and unpatched firmware or
software.
25
3.2 Survey
In order to understand the scope of the IoT security problem, we carried out a mea-
surement study of a campus network. This study is expected to provide an understanding
of the relative number of computers versus other non-compute devices on a typical cam-
pus network. Second, we expect this study to reveal the status of the IoT devices in a well
managed network. Third, we expect this study to point to potential security problems from
IoT devices since the security practices for them may be different from the computers e.g.,
the operating system software (or the firmware) may not be automatically updated on these
devices and they may not be protected by anti-virus software.
The section below covers the methodology used and our findings on the security issues
of IoT devices.
3.2.1 Methodology
We employed two primary strategies for device discovery: port scanning and use of
service discovery protocols.
Devices that advertise through service discovery protocols are only visible within a
subnet. Thus, we walked through the campus to collect data across a random sample of
the subnets in a university campus. Our dataset includes computing devices, IP phones,
printers, NAS, network infrastructure, cameras and surveillance equipment, industrial con-
trol devices used in electrical grid and water distribution facilities, scientific measurement
equipment, and other less common equipment.
Port scanning. Nmap [65] and Zmap [66] are both open source utilities for network
discovery and security auditing. In our study, Nmap was used to identify non-SCADA
devices with TCP ports 80 and 443 open, as well as SCADA devices with open TCP port
502 (Modbus protocol), TCP port 20,000 (DNP3 protocol) and UDP port 47,808 (BACnet
protocol). This data can be combined with external scripts [67] to retrieve additional
26

device information such as firmware version, device ID and operating status. Both DNS
resolution and host discovery were disabled to minimize the impact on the network. The
landing pages for devices with a service running on port 80 or 443 were downloaded using
curl. The resulting pages were clustered using unique strings and each group was manually
identified. Figure 3.1 shows the distribution of IoT devices across the different categories.
Service discovery protocols. DNS-SD (DNS Service Discovery) and UPnP (Univer-
sal Plug and Play) SSDP (Simple Service Discovery Protocol) are two different technolo-
gies both designed to allow devices to easily discover and browse other devices on the
local network so that the average user does not have to deal with the complexities of IP
addresses, ports, and protocols. DNS-SD [6] uses multicast [15] instead of broadcast for
cross communication and leverages the DNS protocol to advertise services available on
each host as part of zeroconf (Zero Configuration Networking). UPnP’s SSDP uses HTTP
and SOAP (Simple Object Access Protocol) for host and service discovery instead of DNS.
3.2.2 Findings
We found 1828 index pages from unique hosts with port scan and 584 unique hosts
from the service discovery technique. There were 13 hosts that were common to both
datasets, so the total number of unique hosts from both datasets is 2399. One dataset was
a port scan of a random sample of the hosts on all the subnets on the campus network.
The other dataset was a random sample of subnets on the campus that were scanned using
service discovery protocols. The port scan data revealed that IoT devices with open ser-
vices are about three times more common than compute devices such as servers, desktops,
laptops and smartphones. The results of the classified data from the port scan are shown
in Figure 3.1. 34 different manufacturers were represented in the sample, some spanning
more than one device category. Among all hosts from both datasets, we grouped all the
computing devices into one category that had 692 devices making up 28.8% of the total.
27

IP Phones
Comp
ute De
vices
ers
AV Eq
uipme
ntUP
S
Network
Infra
structur
eNA
S
Serve
r Managem
ent
Came
ras / S
urveillan
ce PBXKV
M
Scien
ce Eq
uipme
nt
Digital Sign
100
101
102
103
Num
ber of D
evices
Figure 3.1: Categorized Sample of Devices from the Port Scan.
The non-compute or IoT devices are represented as separate categories. IP phones com-
prised the largest group with 1001 unique devices and 41.7% of the total. The next largest
category was printers with 194 devices followed by AV (Audio/Video) equipment with 41
devices. Uninterrupted power supplies (UPS), network infrastructure such as router and
wireless access points, network attached storage (NAS), server remote management cards,
private branch exchanges (PBX), keyboard video and mouse (KVM) switches, a piece of
science equipment and a digital sign each had less than 30 devices.
While some of these devices are less critical such as KVM switches, others such as
NAS, UPS and network infrastructure could lead to serious problems if compromised.
Critical data could be leaked or lost, critical systems could be powered off on demand, or
parts of the network could be cut off. Each brand has one or more unique administration
pages for their devices, so the variety of IoT devices increases the difficulty of managing
them all.
28

HTTP
PDL P
rinter
Worksta
tion
UNIX
erVN
C
Intern
et Print
er FTP
_ni-lo
gos._
tcp SFTP
Telne
t0
5
10
15
Perc
enta
ge of H
osts
Figure 3.2: Top Ten Identified Services
The service discovery based dataset included 78 different services. Fig. 3.2 shows the
top ten identified services. The most common service was _http._tcp or web services
that account for 16.00% of the unique devices identified. These web services have a wide
variety of uses ranging from public web sites to administration interfaces for IoT devices
such as printers, cameras, network attached storage, and more. Therefore, the presence or
absence of the HTTP service is not enough to classify a device. Page description language
(PDL) printers, workstations, and UNIX printers each account for about 9% of the devices;
VNC, Internet printers, FTP services were identified in about 7% of the unique devices.
Of these services workstation and virtual network computing (VNC) are associated with
compute devices. For this dataset compute devices represent 36.1% of the included hosts.
Printers. We identified printers from 11 different manufacturers. The presence of
custom passwords and the firmware dates for printers were obtained using web scraping
scripts. Of all the printers identified, we confirmed 51.3% had no password ever specified
29

by the user (see Figure 3.3b). The no data percentage is different between the two plots
because for some printers with a password set the firmware version is inaccessible.
Out-of-date58.9%
Up-to-date
6.0%
No data35.1%
(a) Printer Firmware
No Password 51.3%
Password37.0%
No data
11.7%
(b) Printer Passwords
Figure 3.3: Security Readiness of Printer Sample
200320042005200620072008200920102011201220132014201520162017
Firmware Release Year
10
20
30
Percen
t of P
rinters Observed FW Newest FW
Figure 3.4: Printer Firmware (FW) Release Dates
Figure 3.3a shows the percentage of printers identified known to have out-of-date
firmware 58.9% as well as the 6.0% that were known to have up-to-date firmware. The
30

devices in the no data category timed out while trying to access the HTTP index page or
had a password preventing access to the firmware date. Figure 3.4 is a histogram of the
dates of the firmwares installed on printers we observed along with the dates of the latest
firmwares available for those printers. There is a cluster of printers with firmwares made
in 2010 and the first half of 2011. The newest firmware available for 12.5% of the printers
was from 2014 or before. This data points to the fact that the firmware on these devices
is both not being updated by the manufacturers and not being updated by the users even
when new version of firmware is available. This shows that even on a well managed net-
work IoT devices like printers may be overlooked, receive minimal initial configuration,
and fall behind in updates. We did observe newer devices that automatically update their
firmware.
Default Password 45.3%
Custom Password
34.0%
No login
20.7%
Figure 3.5: Authentication for VoIP Phone Administration
VoIP Phones. VoIP (Voice over Internet Protocol) telephones can be connected to a
Private branch exchange (PBX) through a local area network (LAN). Given an VoIP phone
with minimal custom configuration, the default admin password will be known [68]. Using
this access the SIP configuration can be changed to launch a man in the middle attack. This
31

enables attackers to record calls, and keep track of call log information. If the attacker
manages to steal the SIP authentication data, they can place calls from the victim’s phone
number.
The VOIP phones dominated the sample of devices scanned on port 80 prompting us
to conduct a more in-depth scan of the VOIP subnet. We found a total of 6999 VoIP
phones from the focused port scan. Only about a third of the VoIP phones were pro-
tected with a custom admin password (see: Figure 3.5) None of the VoIP phones had the
newest firmware. One brand of VoIP phone had no password authentication for the HTTP
management page and represented 20.7% of the VoIP phones. This data strengthens the
point that some IoT devices do not receive the same attention to configuration and security
updates as compute devices.
SCADA devices. We have identified a total of 415 SCADA devices that are used
across building automation networks, water metering system and electrical grid. This
includes 197 BACnet field panels and workstations, 188 water system meters and 30 DNP3
devices. Security vulnerabilities have been identified among these devices. However,
due to security reasons, we are not allowed to further discuss these vulnerabilities in this
chapter.
We also identified a piece of scientific measurement equipment that could be tampered
with over the network interface. Adjusting the default configuration of the device with
awareness of the potential problems could go a long way toward securing the scientific
measurements. Ideally, the network access to the device would be restricted through a
VPN to only authorized individuals.
3.3 Summary
The infamous Mirai attack has shown that many IoT devices do not have adequate se-
curity protections and can be leveraged to cause significant damage. In this chapter, an IoT
32

security disclosure is provided that shows that about 58.9% devices do not keep up-to-date
firmware and 51.3% or more do not have a user defined password. Our measurements
also indicate that the number of non-compute devices may dominate the number of com-
pute devices in a typical campus network. This work motivates the solution proposed in
chapter 6.
33
4. FINDING PROXY USERS AT THE SERVICE USING ANOMALY DETECTION
4.1 Introduction
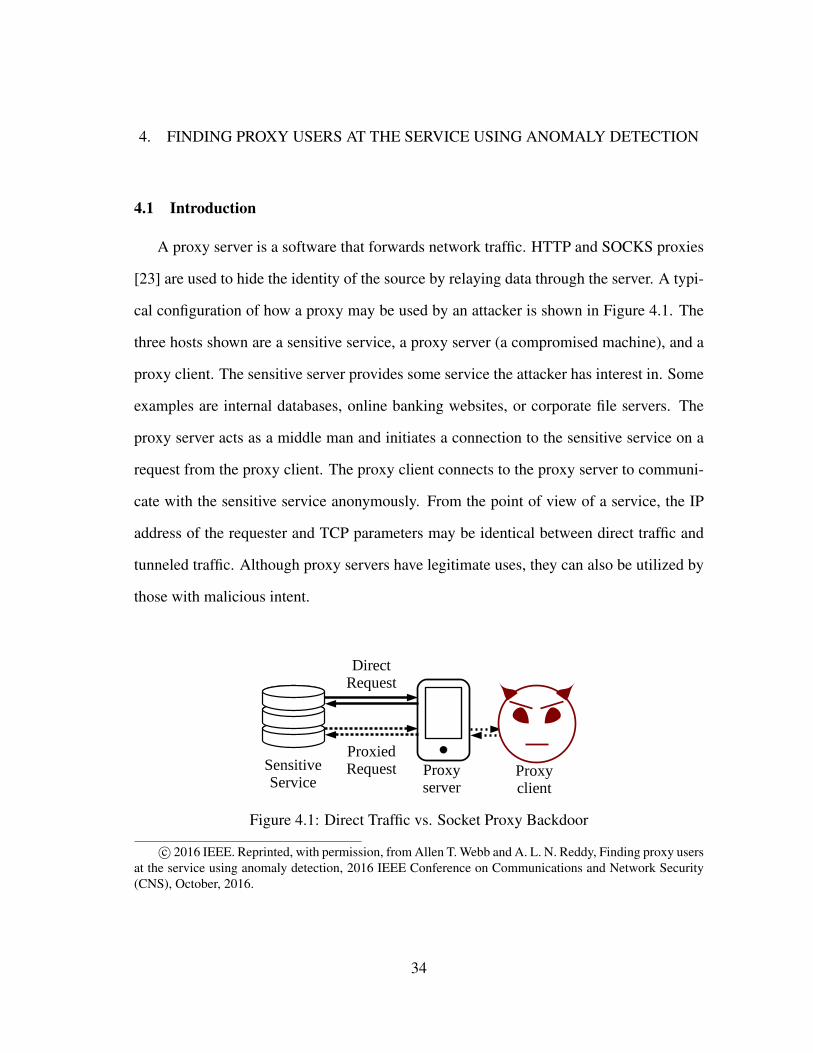
A proxy server is a software that forwards network traffic. HTTP and SOCKS proxies
[23] are used to hide the identity of the source by relaying data through the server. A typi-
cal configuration of how a proxy may be used by an attacker is shown in Figure 4.1. The
three hosts shown are a sensitive service, a proxy server (a compromised machine), and a
proxy client. The sensitive server provides some service the attacker has interest in. Some
examples are internal databases, online banking websites, or corporate file servers. The
proxy server acts as a middle man and initiates a connection to the sensitive service on a
request from the proxy client. The proxy client connects to the proxy server to communi-
cate with the sensitive service anonymously. From the point of view of a service, the IP
address of the requester and TCP parameters may be identical between direct traffic and
tunneled traffic. Although proxy servers have legitimate uses, they can also be utilized by
those with malicious intent.
Figure 4.1: Direct Traffic vs. Socket Proxy Backdoor
c© 2016 IEEE. Reprinted, with permission, from Allen T. Webb and A. L. N. Reddy, Finding proxy usersat the service using anomaly detection, 2016 IEEE Conference on Communications and Network Security(CNS), October, 2016.
34

Trojans and backdoors provide attackers a foothold on the network. Even with anti-
virus software, firewalls, and intrusion detection, new threats emerge that have been tai-
lored to disable the protection and/or evade detection. Once a machine is compromised, it
can be used for detrimental purposes. For example, the machine could be used as an in-
side proxy, a steppingstone, that allows an attacker access to sensitive internal network re-
sources. The trusted machine may even connect to the sensitive network remotely through
VPN. It then operates in the role of the proxy server in Figure 4.1 and may still issue le-
gitimate direct requests along with proxy requests. The attackers can then create a covert
channel from which they can probe the network, steal private information, compromise
other systems, and cause service outages. Preventing the systems from being compro-
mised is preferable, but expecting attacks never to succeed is unreasonable. Thus, we
focus on identifying and stopping unauthorized access to services.
Open proxy servers are available on the Internet, and blacklists of their IP addresses
are also available [69]. Information from logs of VPN servers and proxy servers can be
useful in tracing abusers back to their original IP address. However, when the proxy server
is hosted by the attackers themselves on a compromised machine, the attackers are free to
implement the proxy servers as they choose. Proxy logs will likely not exist in this case,
so there is a need for additional measures to identify attackers in these cases. All this is
done after the fact. Would it not be better to prevent leaking information first?
Whenever information systems are managed by a third party such as a cloud provider,
the cloud user may have limited ability to enhance the security of their services beyond
what is already provided by the third party. Attacks can be detected without collaboration
with the service provider by developing methods that operate at the service rather than
the network infrastructure. The level of difficulty required for an attacker to compromise
a service can be increased by writing security-aware services that have built in detection
strategies requiring only a small amount of data. These detection schemes would aim to
35

detect or deter attackers with minimal impact on performance and with minimal increase
to the attack surface of the service.
Although there are methods to detect the channels by which an attacker can funnel
information outside the network, most rely on having access to more than one flow of that
traffic [70] and [71]. In cases where a virtual private network (VPN) is used, the attacker
could funnel the data through a side channel without passing it back through the VPN.
Examples of channels which an attacker might use to avoid monitoring include Bluetooth,
cellular data, air-gap techniques, and third party infrastructure. In other words the attacker
could create a proxy to services using a compromised host’s VPN and connect to that
proxy through a side channel such as cellular data. This scenario is of interest because it
bypasses typical intrusion detection systems, which typically need to have access to the
proxy-to-client traffic. Our work specifically investigates techniques for identifying covert
proxy traffic at the sensitive server or network resource. Although the proposed detection
methods do not provide the originating IP address of the attacker, they do point out that
a particular machine is being used as a proxy. Once a compromised machine is detected,
attention can be focused on that machine’s traffic to identify the attacker and clean off any
malicious software or additional security checks can be required.
Our approach employs timing information, specifically delays at the transport layer
and application layer measured at the sensitive server to distinguish direct traffic from
proxy traffic. The chapter makes the following significant contributions: (1) Proposes a
new class of steppingstone detection methods based on anomaly detection. Two examples
are provided, one at the TCP layer and another at the application layer. These anomaly
detection based methods have the following properties: (1a) Only the traffic at the server is
required. (1b) The traffic may or may not be interactive (1c) Detection can be performed
near real-time allowing for intervention. (1d) Training is per endpoint and detection is
per flow thus reducing the computational complexity of network traffic analysis. (2) Pro-
36

poses a technique for hardening the training process against manipulation by attackers. (3)
Shows that the proposed techniques are lightweight and can be effective with a very small
number of samples enabling them to detect attacks in real-time.
4.2 Detection Methods at the Service
Previous work, [72] and [73], has made progress in detecting abuse of privileges. We
consider the scenario in which the attacker is stealing data from a service. Our methods
can identify tunnels and proxies at the sensitive service providing a way to log, limit, or
deny access after detection.
Our approach relies on network delay measurements. Rather than depending on the
contents of the traffic, which may be controlled by the attacker, this method relies on
properties of the network path and timing of the traffic. Our hypothesis is that the RTT
measurements of traffic when the service is accessed by the attacker through the proxy
will be different from the RTT measurements when the service is accessed by the proxy
machine directly.
Let dsp denote the variable RTTs observed between the server and the proxy, dspa the
variable RTTs observed when the service is accessed by the attacker through the proxy,
{du} a set of unlabeled measurements (one that may contain either dsp or dspa), and {dtr}
a collection of training measurements of dsp. Our hypothesis is that dsp and dspa will have
different distributions and will be distinguishable.
Several techniques and measurements can be employed to distinguish dsp and dspa.
Our goal is that given training data, {dtr}, we can identify and assign an accurate label
to {du}. In addition, the delays themselves can be measured at different levels to provide
different levels of protection.
In this chapter, we consider two types of delay measurements, one at the transport layer
and the second at the application layer. The transport layer approach has the advantage of
37

not having to modify or enhance the applications whereas the application layer approach
can leverage application semantics to enable the design of a better tool.
We present two detection methods: the TCP Delay Distribution (TCP-DD) method,
which relies on timing information from TCP packets; and the Application Layer Re-
sponse Time (AL-RT) method, which leverages data dependencies in the application layer.
Many machine learning algorithms require training data for each label. Our detection
methods fall into the category of anomaly detection because we only have access to train-
ing data for one label, direct traffic. Direct traffic from trusted machines can be observed
before an attack. Prior measurements for tunneled traffic can only be obtained after an
attack has been carried out and identified. Our goal is to identify an attack as it is being
carried out to prevent it from being successful. Requests classified as proxy traffic can
be required to go through additional security checks or can be denied access to sensitive
network services. This method has the flexibility of being deployed as part of an intrusion
detection system or as part of a service.
4.2.1 TCP Delay Distribution Method
We measure TCP delays at the transport layer. A set of training samples are employed
to indicate the characteristics of direct traffic. TCP delays are constantly measured and
compared against the training set to see if proxy traffic is originating from the machine.
This method does not require modifications to the server or client software. Because it
does not require access to the client machine, the detection does not require changes to
the application layer software, and it supports the commonly used protocol, TCP. If the
intrusion detection system controls a dynamic firewall, unwanted TCP flows could be
interrupted or blocked. If this is integrated into a service, the service could limit, or block
access to TCP flows or SSL sessions that are not classified as direct traffic. Note that once
38

Figure 4.2: TCP Delay Distribution Measurements
a session is classified initially, it still may be monitored because sessions can be hijacked
[74].
Here is an examination of how this method works (see Figure 4.2): Consider the in-
stantaneous delay between the server resource and the proxy server for direct traffic, dsp,
and the instantaneous delay between the proxy and the client, dpa. Although the round trip
time for acknowledgments will follow dsp for the most part, the timing of acknowledg-
ments is typically also affected by techniques to reduce the number of acknowledgments
sent such as Nagle’s algorithm and TCP large segment offload. As long as these techniques
are dependent on whether there is new data to send, there will be information leakage from
dpa to the server resource.
Although TCP timestamps could be used instead of measuring the delay, the TCP
timestamp fields could be forged by the attacker; the attacker could send a future times-
tamp. It is conceivable that the attacker could use a custom implementation of TCP to
have more control over the distribution of delays between packets and their correspond-
ing acknowledgments. For the attacker to successfully launch an attack, they would need
to know the characteristics of direct traffic observed from the service and have a way to
replicate them.
39

The mean values of dsp and dspa could appear to be the same. However, functions other
than the mean could reveal differences between dsp and dspa. TCP-DD has the following
procedure: Record the delays between a TCP ACK and the most recent TCP segment it
acknowledges to obtain an unlabeled set of measurements, du, for the RTT. Compute a
function on the timings, du, such as a binned distribution estimate, a density estimate, the
variance, etc. Compare the result with training data for dsp and classify the connection as
normal or anomalous.
One category of statistical measures we used provided a comparison of empirical dis-
tributions or densities. A simple way to obtain an empirical distribution is binning, the
technique used to generate histograms. After binning, the probability mass function is
obtained by dividing the value of each bin by the sum of the values of all the bins. Also, a
smoothing function such as the Gaussian function (see Equation 4.2) can be applied to the
histogram to obtain a density estimate from sparse data. An expected distribution can be
constructed by aggregating all the training data into one distribution.
Raw JSD: The similarity of distributions can be measured using the Jensen–Shannon
divergence (JSD) [75]. The JSD is shown in Equation 4.1 where p1 and p2 are the dis-
tributions, and X is the set of bins. This allows for the measurements of one trial to be
compared to the expected distribution. To identify when a measurement is anomalous it
is necessary to have some notion of what range of values the data should have. This can
be obtained by using the JSD to calculate a distance between the distribution estimates for
each trial and the distribution estimates for the aggregate of the training data. The JSD
becomes undefined whenever there is at least one bin with a zero value, the solution we
used was to initialize the bins to a very small positive number before performing binning.
JSπ(p1, p2) =∑x∈X
[p1(x)
2log
p1(x)
p2(x)+p2(x)
2log
p2(x)
p1(x)
](4.1)
40

For simple binning and JSD there is an order O(n +m) computation cost that scales
with the number of samples, n, and the number of bins, m.
Smooth JSD: If a Gaussian (see Equation 4.2) smoothing filter is applied to the binned
results to obtain a different density estimate before using the JSD, it has an order O(n +
m × l) computation cost that scales with the number of samples, n, and the number of
bins, m, times the number of filter taps, l.
G(x) =1
σ√2πe
−(x−µ)2
2σ2 (4.2)
Variance: Another statistic measure that we found to distinguish dsp from dspa is the
variance. Although the mean between dsp and dspa could be too similar to distinguish
them, the variance may not be. Training data isn’t needed to show the separability of the
variances calculated for the direct traffic trials from the variances calculated for the tun-
neled traffic, but it is necessary for anomaly detection. This is an order O(n) computation
cost that scales with the number of samples, n.
MPGS: The mean pairwise Gaussian similarity (MPGS) also can be used. The Gaus-
sian similarity [76] can be described as a measure of closeness and could be compared
with the inverted squared Euclidean distance. The mathematical formulation for this mea-
sure is shown in Equation 4.3. This is calculated for each pair of a training sample with
an unlabeled data sample. The results are averaged to obtain the MPGS that is compared
against the MPGS values for the trials in the training data. The computational cost for
calculating the MPGS is O(n × k) where n is the number of samples in du, and k is the
number of training samples.
MPGS(du) =1
|du||dtr|∑
x∈du,y∈dtr
1
σ√2πe
−(x−y)2
2σ2 (4.3)
41

Mean distance measures are another way to distinguish the direct and tunneled traffic.
The mean minimum distance (MMD) from the inter-arrival times, du, in an unlabeled set
to the times in the training data can also be used. The L1 norm was used for the distance.
It is the absolute value of the difference between the values being compared, |a − b|. We
took the mean of the lower quartile of the distance values. The computation cost depends
on the implementation but costs of O(n log k), and O(n log n+ k) can be achieved where
n is the number of samples in du, and k is the number of training samples. This was
chosen because it uses the k-distance measure, which is part of the formulation for the
Local Outlier Factor [77].
4.2.2 Application Layer Response Time Method
This method estimates the round-trip-time by measuring the end-to-end delay at the
application layer. Socket proxies may hide the RTT at the transport layer, but they forward
the unmodified application layer data. One potential way of identifying tunneled traffic is
to measure the RTT at the application layer. Ideally, this would be done without requiring
changes to the application layer protocol. Many applications have data dependencies be-
tween served content and requests. The time delay between a message being sent and the
receipt of the first dependent message can be used to bound the round trip time between
the server and client applications. For this to be an effective way of detecting a tunnel, the
attacker should not be able to send the dependent message early. This challenge can be
solved by requiring a sufficiently hard to guess random token in the dependent message.
In this chapter we use HTTP to validate the concept of the Application Layer Re-
sponse Time Method. HTTP serves pages typically containing references to additional
content such as images, scripts, styles, or frames with other pages. The HTTP example for
determining if a visitor to a website is using a proxy or not is as follows: Create a chain of
iframes such that a browser will not cache the iframes (they will be loaded every time), and
42

the delay between HTTP requests is logged. Nonces are used to ensure that each iframe
in the chain must be loaded one after the other. This establishes a data dependency which
is used to measure the delay from the browser to the web server. We can then compare a
function of the delays between requests for the iframes to training data to determine if they
are anomalous. Although we focus on HTTP in this chapter here, it is possible to extract
delays at the application layer similarly with other protocols.
Iframes were chosen because they allow for chaining multiple measurements one after
the other even when JavaScript is disabled. Figure 4.3 shows how embedded iframes
can be used to create data dependencies for measuring the end-to-end RTT. If only one
measurement is needed, an image or style file could be used instead.
An attacker may employ an application-layer proxy server. This would potentially
defeat TCP-DD; however, without prefetching the proxy server would still leak the end-
to-end time to HTTP-RT. Prefetching proxy servers neglect images by default because of
the cost of prefetching all the images on all related pages, so images could be incorporated
into the HTTP-RT method to prevent prefetching of certain resources. The access times
of these non-prefetched resources would then be used in the HTTP-RT measurements.
Figure 4.3: HTTP Response Time Method
43

For HTTP-RT the absolute minimum round trip time between the service resource and
the proxy server is a lower bound; attackers cannot cross except in highly improbable
situations: Assume a set of nonces is chosen randomly from a set such that the chance of
guessing each nonce is much smaller than the number of times the valid user connects. A
nonce is sent as part of a URL for the destination of a resource such as an iframe. Each
resource loads another resource at a URL including the next nonce. The first nonce isn’t
known until after the first page loads, the second until after the first resource loads, the
third until after the second resource loads, and so on. For the attacker to request the next
resource they must know (or guess) the nonce. An incorrect guess identifies an attack.
The probability of the attacker correctly guessing all the nonces in a chain of dependent
resources quickly drops off to zero. The chain provides more data points to reduce the
effects of noise. If the attacker receives the nonce through the proxy server, the delay will
be greater than the delay between the proxy server and the requested service.
4.2.3 Identifying proxies during training
Adaptive methods or retraining open up the possibility of the attacker manipulating the
results of the training data. Any classification method that uses training data is sensitive to
the quality or truthfulness of that data. When these methods are put into a situation with
adversaries, one might ask whether an adversary has the ability to taint the training data
to thwart the classification method. We propose a solution to prevent attackers from being
able to manipulate the training data. Training data from similar network paths can be cross
checked to notify the administrator when retraining falls outside the acceptable limits. An
example definition of a similar network path is one that is only different in at most the first
and last links of the path. Using this definition we tested the similarity of the distributions
of training data across similar paths as well as with the proxy data. We collected additional
data from Planetlab for groups of nodes which are hosted by the same organization. The
44

0 20 40 60 80 100JS Divergence
050
100150200250300350400
Simila
r Pa
th Pairs
Direct Socat SSH
Figure 4.4: Jensen Shannon Divergence Between Training Data from Similar Paths. Notethat the proxy data, SSH and Socat, are included to show where an attacker’s distributionwould fall, but these would not be available as training data.
results for HTTP-RT are shown in Figure 4.4. We include the proxy traffic represented
by socat and SSH on the plot to show how the attacker’s distributions compare with the
direct traffic. Ideally the direct traffic would be clustered together, and the proxy traffic
would not overlap with the direct traffic. In most cases the direct traffic has a lower Jensen-
Shannon Divergence with the similar paths than the proxy traffic. For TCP-DD the results
are much less spread, but the direct and proxy traffic were completely separable for 77%
of the groups of similar paths. This cross-check method for verifying the training data
increases the difficulty the attacker faces. Either they will have to compromise more hosts
to launch a successful attack, or they will be limited in how much their attack traffic can
vary from hosts on similar paths.
4.3 Experimental Evaluation
We evaluated our approach in three settings. The first setting employed PlanetLab
[78] with the sensitive server, proxy and the attacker location distributed across the globe.
45

The second setting considered attacks within a local area network where all three parties,
sensitive server, proxy and attacker, all reside on the same network. The two settings
provide different vantage points with wide-delay measurements and tight-delay measure-
ments. Third we tested the sensitivity of the results to various parameters such as CPU
load.
As part of our evaluation we compared the accuracy of different statistical measures for
the function computed on du. On one hand, this shows that using the RTT measurements
has some flexibility. On the other hand, the comparison shows which measures might be
best in deploying TCP-DD.
We considered different download intensive communication models that the attacker
could employ. With socat the traffic is passed unencrypted to the proxy client, whereas
with ssh the traffic is encrypted between the proxy and the proxy client. Transparent
proxies that work by network address translation (NAT) will not hide the end-to-end RTT
so they were not tested because the end-to-end RTT should be enough to distinguish direct
and tunneled traffic.
4.3.1 Wide Area Network Measurements
PlanetLab offers a network testbed spanning diverse geographic locations. Our slice
provided 80 active nodes covering different continents with which we conducted our mea-
surements. Figure 4.1 shows the basic setup we used for each trial. One node functions as
the service. It hosts the web server and records access times and packet traces. Another
node functions as the proxy server. It hosts proxies both through socat [79] and SSH [24].
It also makes a direct request to the web server. The last node functions as the proxy client
and makes requests to the web server both through the socat and ssh proxies.
Combinations of three nodes were randomly selected. For each combination all per-
mutations were tested. 1727 working configurations were tested for the 80 PlanetLab
46

0.0 0.1 0.2 0.3 0.4 0.5Delay: Proxy to Server (sec)
0.0
0.1
0.2
0.3
0.4
0.5
Del
ay: A
ttac
ker
to P
roxy
(sec
)
Figure 4.5: Path Pings of Each Set of Selected PlanetLab Nodes
nodes. Groups of nearby nodes were also selected to allow for measuring the accuracy
when network distances were smaller. Figure 4.5 shows the delays between nodes in each
working configuration tested. Notice there is a good spread; in some cases the attacker is
closer to the proxy than the proxy is to the server and vice versa. The measurements were
taken once every thirty minutes over a 24-hour period.
The separability between the proxy traffic and the direct traffic can be seen in the ROC
(Receiver operating characteristic) area plots in Figure 4.6 and Figure 4.7. ROC plots are
typically used to show how well a communication channel operates. In our case we are
plotting the percentage of true positives achievable by selecting a specific threshold for a
percentage of false positives. An ROC area of 1.0 is ideal where all the true positives can
be included by a threshold without including any false positives.
Figure 4.6 and Figure 4.7 show the results of our experiments using both TCP-DD and
HTTP-RT methods and different measures in the PlanetLab setting. Figure 4.6 shows the
47

0200
400
600
8001000
1200
1400
1600
Trial Number
0.00.20.40.60.81.0
ROC Area
SocatSSH
Figure 4.6: Performance Comparison of Implementation Options: ROC Area of EachTCP-DD Trial Using Smoothed JSD Listed in Descending Order
TCP-DD measure with the highest accuracy, smoothed JSD. A maximum of forty-eight
training points were used when training data was needed in the TCP-DD measures. After
analyzing how many training points are needed for smoothed JSD, we found that with
five trials most of the separation between the direct traffic and proxy traffic was already
achieved. Different training points (dsp) are needed for each pair of a service host with a
proxy host because they represent different possible paths. The true positives of the ROC
plot are min({dsp}) for each trial and the false positives are min({dspa}) for each trial.
Figure 4.7 shows the HTTP-RT measure with the highest accuracy, the minimum RTT.
The results between the unencrypted and encrypted socket tunnel implementations,
socat and ssh, are almost the same with ssh having a few more measurement failures
resulting in fewer trials. The majority of trials had a close to ideal separation. In each of
these cases a threshold could be chosen for TCP-DD using smoothed JSD in those trials
to distinguish the direct traffic from the tunneled traffic.
In Figure 4.8 the separability of different functions are used over the samples collected
for each trial for TCP-DD. These functions are discussed in more detail earlier in subsec-
48

020040060080010001200140016001800
Trial Number
0.00.20.40.60.81.0
ROC Area
SocatSSH
Figure 4.7: Performance Comparison of Implementation Options: ROC Area of EachHTTP-RT Trial For Three Samples Using Minimum Listed in Descending Order
tion 4.2.1. “MMD.” represents mean minimum distance for the highest quartile. “Raw
JSD” represents binning the inter-arrival times to obtain a distribution estimate and us-
ing the Jensen–Shannon Divergence (JSD). “MPGS” represents using the Mean Pairwise
Gaussian Similarity (MPGS). Bins of 25 milliseconds were used, but further optimization
could be done for this parameter. “Variance” represents taking the variance of the mea-
surements within a trial. The variance values were then compared across trials to test for
separability. “Smooth JSD” represents first binning to obtain a density estimate. The result
is smoothed using a Gaussian smoothing filter that is truncated to 4 standard deviations of
1250 µ-seconds. Lastly, then the JSD is used to compare the smoothed density of the
training data with the one for the unlabeled data.
The results show that both TCP-DD and HTTP-RT can separate the direct traffic from
proxy traffic. Figure 4.8 and Figure 4.9 show the percentage of trials that had ROC areas
above 0.9, 0.99, and 0.999. From these figures it is clear that HTTP-RT outperforms TCP-
DD for the configurations tested. An ROC area of 0.90 can be likened to a 90% true
positive detection rate for 0% false positives. It does not correspond directly because an
49
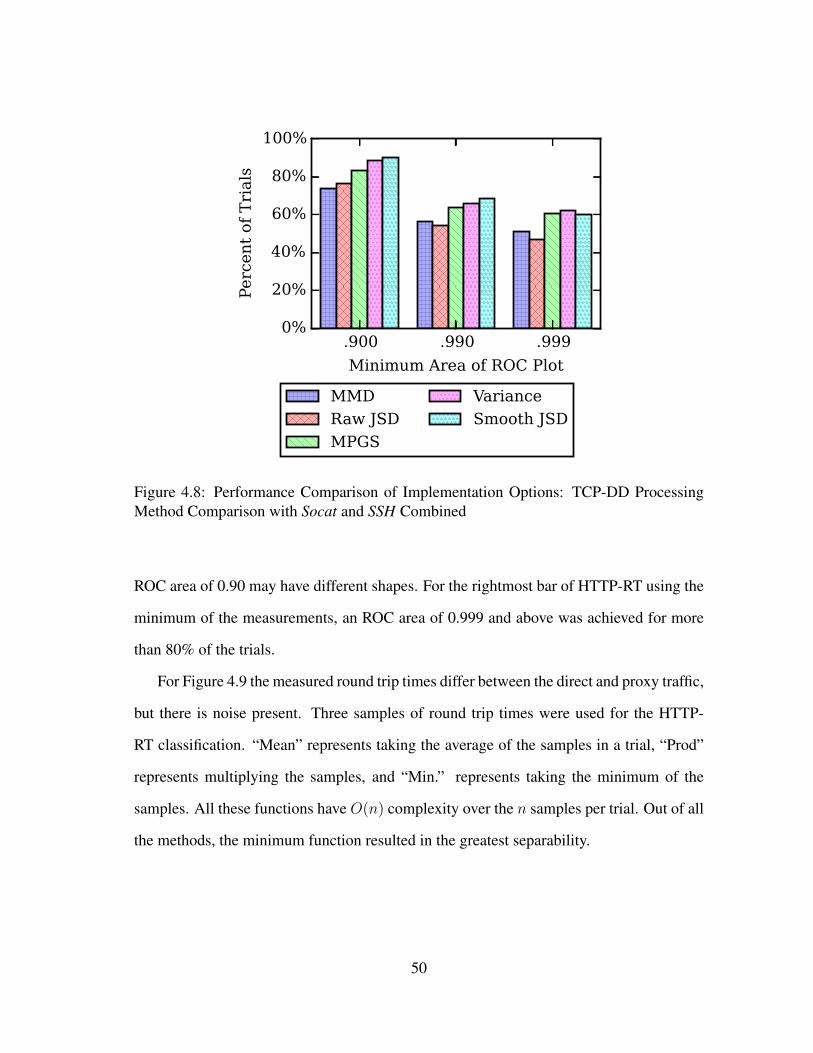
.900 .990 .999Minimum Area of ROC Plot
0%
20%
40%
60%
80%
100%
Perc
ent o
f Trials
MMDRaw JSDMPGS
VarianceSmooth JSD
Figure 4.8: Performance Comparison of Implementation Options: TCP-DD ProcessingMethod Comparison with Socat and SSH Combined
ROC area of 0.90 may have different shapes. For the rightmost bar of HTTP-RT using the
minimum of the measurements, an ROC area of 0.999 and above was achieved for more
than 80% of the trials.
For Figure 4.9 the measured round trip times differ between the direct and proxy traffic,
but there is noise present. Three samples of round trip times were used for the HTTP-
RT classification. “Mean” represents taking the average of the samples in a trial, “Prod”
represents multiplying the samples, and “Min.” represents taking the minimum of the
samples. All these functions have O(n) complexity over the n samples per trial. Out of all
the methods, the minimum function resulted in the greatest separability.
50
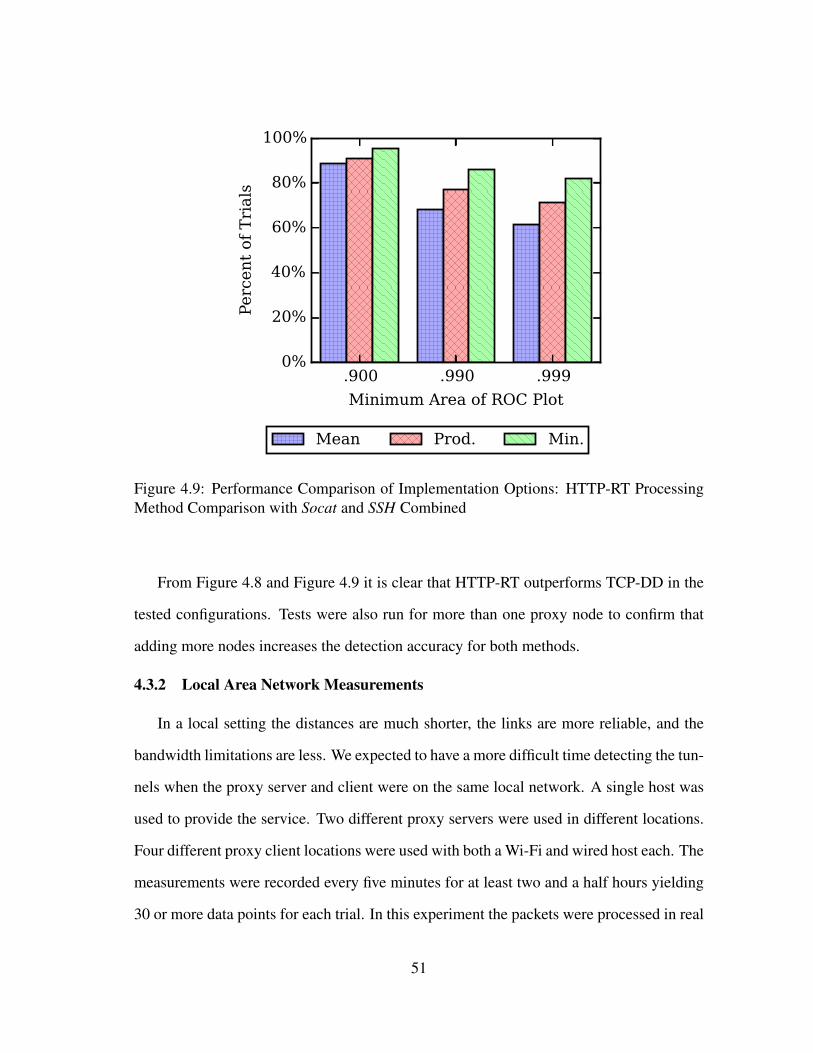
.900 .990 .999Minimum Area of ROC Plot
0%
20%
40%
60%
80%
100%
Percen
t of T
rials
Mean Prod. Min.
Figure 4.9: Performance Comparison of Implementation Options: HTTP-RT ProcessingMethod Comparison with Socat and SSH Combined
From Figure 4.8 and Figure 4.9 it is clear that HTTP-RT outperforms TCP-DD in the
tested configurations. Tests were also run for more than one proxy node to confirm that
adding more nodes increases the detection accuracy for both methods.
4.3.2 Local Area Network Measurements
In a local setting the distances are much shorter, the links are more reliable, and the
bandwidth limitations are less. We expected to have a more difficult time detecting the tun-
nels when the proxy server and client were on the same local network. A single host was
used to provide the service. Two different proxy servers were used in different locations.
Four different proxy client locations were used with both a Wi-Fi and wired host each. The
measurements were recorded every five minutes for at least two and a half hours yielding
30 or more data points for each trial. In this experiment the packets were processed in real
51

0 5 10 15 20 25 30 35Days After Training
0.70
0.75
0.80
0.85
0.90
0.95
1.00
Fractio
n of True Po
sitiv
esTCP-DD Var.TCP-DD Smooth JSDHTTP-RT Min.
Figure 4.10: True positives of Direct Traffic Over Time After Initial Training AveragedAcross Trials
time to obtain the TCP ACK delays and iframe delays. In this dataset about twelve TCP
ACK delays were recorded per measurement
A good separability was achieved in all the trials. The direct traffic was completely
separable from the tunneled traffic in more than half of the trials. For the local measure-
ments TCP-DD outperformed HTTP-RT.
4.3.3 Sensitivity
Planetlab measurements were taken over a 34-day period to determine how often re-
training is needed. The measurements were taken every 30 minutes, and only the first 24
were used as training data. Figure 4.10 shows the fraction of true positives out of direct
measurements averaged across trials plotted over time. HTTP-RT Min. had over a 97%
true positive rate after a month. The true positive accuracy of TCP-DD degraded after 20
days. The decision to retrain can be made on a per host basis once the false positive rate is
high enough.
52

1 2 3 4 5 6 7 8iFrame / Measurement Count
0%
20%
40%
60%
80%
100%
Percen
t of T
rials
Figure 4.11: Percent of HTTP-RT Trials with ROC Area Above 0.999
How many measurements are warranted for HTTP-RT? Figure 4.11 shows the rela-
tionship between separability and the number of measurements used. A higher percentage
corresponds to better separation between the direct traffic and the tunneled traffic. At three
measurements three iframes are loaded after the initial page load. It is observed that most
of the separability is achieved within 3 measurements. Since the cost in terms of delay
to the user increases linearly with the number of measurements, three is probably the best
number of measurements to take based on our results.
Figure 4.12 shows the classification accuracy using separate training data and direct
measurements from the PlanetLab data. In these experiments, the measured data contains
both direct traffic and proxy traffic. These experiments are designed to see if presence
of proxy traffic can be detected when the compromised machine is being used both for
direct and proxy communications. Up to 48 training points were used to find the mean
and standard deviation of each measure. The accepted range was defined as µ± 2σ for the
training data. Separate direct measurements and proxy measurements for both socat and
ssh were tested to determine the experimental true positive and true negative rates. Note
that the performance of TCP-DD using the variance is poor in this case even though it has
53

020
040
060
080
010
0012
00
Trial Number
0.00.20.40.60.81.0
RO
C A
rea
TCP-DD Var.TCP-DD Smooth JSDHTTP-RT Min.
Figure 4.12: Classifiers Using µ± 2σ
a high separability in Figure 4.8. We then used the true positive percentage times the true
negative percentage as the ROC area in the plot. Again HTTP-RT outperforms TCP-DD.
It is observed that the proposed techniques provide very high detection rates with very low
false positive rates across the many experiments.
To investigate the effects of CPU load on TCP-DD we conducted an experiment using
iperf3 [80] under different load conditions. We used the tool in download mode because
the traffic from the server to the proxy is what generates the TCP acknowledgments used
in TCP-DD. These tests were done with three machines connected through a single switch
to eliminate uncontrolled network factors. This allowed us to observe the difference in the
steady state delay distribution for different amounts of CPU load. We tested the effects of
CPU load at both the server and the proxy. The results are shown in Figure 4.13.
Varying the load on the proxy case does introduce variance into the detection rates as
shown in Figure 4.13a. There is a noticeable degradation of performance in the server
54

case Figure 4.13b. The loss is about 2% less true positives for every 10% point increase of
Server CPU usage. Since, the CPU load on the server can be measured training could be
done across different CPU load regions to increase detection performance if needed. It is
noted that even when tested against different loads from the training loads, the proposed
methods provide reasonable detection rates.
4.4 Related Work
A body of work exists for detecting steppingstones. Recently proxy detection at the
service has started to get attention. In [81] motivated by Nagle’s algorithm the size of
segments and inter arrival times were used to identify proxies. They rely on a steady
stream of small segments to detect proxies, while TCP-DD works for download intensive
streams which may have segments at the MTU. They achieved a 94.0% true positive rate
with a false positive rate ranging from 0.8% to 85.4% averaging 10.2% across all their
trials. This corresponds to an ROC area of 0.844. Machine learning is used for proxy
detection in [82]. Their method works well for the proxy server configurations they tested
(squid) with a 94.1% true positive rate and a 7.9% false positive rate for distinguishing
proxy traffic from direct traffic. This corresponds to an ROC area of 0.867. Using a µ±2σ
classifier, HTTP-RT using the minimum has a greater ROC area in 67.4% of our trials, and
TCP-DD using smooth JSD in 56.8% of our trials. While they employ timing features for
classification, they do not contrast delay distributions as employed in our approach. We
chose to use anomaly detection to avoid requiring labeled proxy data which targets the
classification on particular proxy implementations and behaviors.
Prior steppingstone detection techniques fall into one of three categories: (1) content
based methods, which require clear text or the same content across the observed flows[83]
and [84]; (2) passive time based methods, which rely on the assumption of a maximum
tolerable delay [84], [85], [86], and [87]; and (3) active time based methods often called
55

(a) Effect of Proxy Loading
(b) Effect of Server Loading
Figure 4.13: Identification of Direct Traffic Across Load Using TCP-DD Smooth JSD. Foreach plot a µ ± 2σ classifier was trained using the data for 0% load. Measurements wereconducted using 10 second iperf3 traces at 100Mbps for each load level. The traces werepartitioned into sets of 100 measurements for the classification. Each trace had about 50partitions.
watermarking [88] and [89]. The typical threat model used by the above steppingstone
detection papers assume all the traffic on the network is being monitored and that the
attackers do not have access to an alternative unmonitored Internet connection. Our work
56

does not make these assumptions. Instead of tracing the attack back to an IP address at
the edge of the network, we identify connections that have steppingstones. These methods
rely on correlating two or more connections to identify steppingstones and thus cannot
detect a steppingstone that has only one visible connection. For this reason we argue
steppingstone detection at the service can be applied in addition to the previous methods
to detect steppingstones that would not be detected otherwise.
Timing of packets has already been shown to betray information in the past such as
keystrokes over SSH in [90]. TCP jitter has been used as a means of identifying rogue
Wi-Fi access points on a network [91]. It has also been used to defeat location spoofing
VPNs in [92].
Work has been done to identify the destination of encrypted HTTP traffic (over WPA
and WEP) by using statistical analysis, lengths of the packets, and the distribution of in-
terarrival times [93]. Statistical measures of packet lengths [94] and information theoretic
measures [95] have been employed to classify TCP flows and to detect anomalous traffic.
Detection of middleboxes such as NATs has been explored through observation of
instant messaging traffic [96]. Tracetcp, [97], uses TCP SYN packets and TTL values to
perform a traceroute over TCP ports. It can identify transparent TCP tunnels and proxies,
but is designed for the client side. It is also dependent on the proxy forwarding the TTL
values, which is up to the proxy implementation. Our methods handle proxies at the server
side and are not dependent on TTL values.
Work has been done to identify tunnels through application layer protocols such as
HTTP [70] and [71]. These are aimed at detecting information leakage from a network,
whereas we are addressing the problem of whether trusted clients are compromised and
are serving as a proxy.
In [98] HTTP proxy traffic is detected to find attempts to circumvent firewalls, and
spyware back channels. This work focuses on detecting anomalies using a variety of
57

different techniques such as the HTTP header fields, request sizes, request rates, bandwidth
usage, and request interarrival times. Our goal is to find proxies on trusted nodes rather
than find trusted nodes that are accessing proxies. A key difference in our work is that
instead of using interarrival times to look for periodic traffic, we are estimating the end-
to-end RTT or comparing interarrival time distributions.
There are existing methods for HTTP client fingerprinting that can serve to distinguish
proxy clients. Client side Javascript is used for detection in [99]. SSL handshakes are used
to fingerprint clients in [100]. A survey of these methods is provided in [101]. If a machine
is compromised, metrics used in fingerprinting such as screen resolution, browser plugins,
etc. may be determined and spoofed by the attacker. Even the IP address of the machine
can be used by the attacker through proxies. Our work seeks to address this issue.
4.5 Summary
This chapter proposed using anomaly detection as a new class of steppingstone de-
tecting methods by monitoring traffic at the server. These methods handle the case when
an attacker has access to unmonitored communication channels, which thwart previous
detection techniques. Although compromised machines may be used as proxies, we have
presented techniques that can be used to identify such proxies at the service. We have
shown two working examples of these methods work on actual networks both on a global
scale and a local scale. Our results show that the proposed techniques can provide very
high detection rates of up to 99% with very low false positive rates. In addition, we show
that comparing training data from similar paths can be used to harden the method against
manipulation of the training data. The methods we present may also be combined with
other features as part of a machine learning system for proxy detection, or used as an early
detection system to supplement more computationally expensive post processing methods.
58

5. IDENTIFYING MALICIOUS ACTIVITY FROM ANDROID APPS
5.1 Introduction
Smartphones are widely used and have become an attractive target to cyber thieves.
These devices often contain sensitive information such as the owner’s location, contacts,
emails and login credentials. They can be tied to payment methods such as credit cards
and may have apps related to banking. Examples of malicious apps for smartphones have
already been discovered. Thus, there is a need to develop the tools necessary to identify
attacks as quickly as possible and to minimize the damage they cause. We present methods
for creating a controlled test environment that runs untrusted Android apps for security
research.
Four main approaches are used to analyze applications to find malicious behavior.
First, static analysis is performed on the compiled code of an app to determine as much
as possible. However, this doesn’t always capture dynamically loaded code, which may
be downloaded or decrypted at runtime. Second, dynamic analysis involves executing all
or part of the app and using predefined rules. By running the app in a test environment,
malicious behavior can be observed rather than inferred. Third, manual inspection is per-
formed when static and dynamic methods fail since attackers change their techniques to
avoid detection. Lastly, data about application behavior can be collected from devices in
the field. This has the potential for providing the best picture about the behavior of mali-
cious apps because it uses the same environment the attacker is targeting. However, it also
is the most difficult because the data collection must not noticeably impact performance,
and a large enough user-base is needed to collect meaningful data.
When an app is in use, user actions can trigger network traffic. During startup apps may
check for updated resource files. As the user navigates a web based app, web pages will be
59

accessed and downloaded. Other examples of network activity from user actions include
taking sending an email or taking a photograph which is backed up online. Network
traffic outside of user activity results from background services such as email apps polling
for new emails, messaging apps checking for messages, or the system checking for app
updates.
In a test environment, we captured traffic from 100 of the most downloaded apps from
the Google Play Store as well as samples of known malicious applications. From these
traces we were able to identify what domains each app was contacting, when they were
contacting them, and how often the app was sending traffic. Although we expected that
most activity from benign applications would coincide with user activity, we found that ad
networks commonly generate network traffic during times when the user is not interacting
with that particular app or the device.
We also used the test environment to determine if the malicious apps were trying to
make use of the Bluetooth on the device by monitoring Interprocess Communication (IPC).
This method could also be used to catch malicious activity that involves IPC such as ex-
ploiting flaws in other apps or using other communication methods that interact with apps
through IPC.
Finally, we developed a method for collecting the domain names requested by each
app without requiring root access on Android devices. We built an Android app, App
Network Monitor (ANM), using this method and deployed it on the Google Play Store.
Three malicious domains were identified from the data collected. Two of them could be
traced back to the original app. This work is ongoing.
5.2 Dynamic Analysis Test Platform
One challenge faced in providing tools for monitoring the behavior of potentially mali-
cious applications is the time required for setup and execution. While ARM emulators are
60

available, they have a higher performance overhead than running a virtual machine (VM).
Android ARM code can be executed on x86 architecture using helper libraries [102]. An-
other challenge is to make the environment as authentic as possible. Attackers can avoid
detection when they are able to distinguish a test environment from a real phone (e.g. by
relying on user input). To make this as difficult as possible, the test environment should
not have any differences that are detectable by the app being tested.
Finally, the test environment should be setup to prevent harm that results from execut-
ing malicious apps. This is difficult to achieve because Internet access may be needed in
order for an app to function properly; however, unrestricted Internet access could allow a
malicious app to communicate with its author. Also, the app would be free to carry out
any instructions it was given such as participating in denial of service attacks. We present
a method for isolating the test environment while giving the phone the illusion of Internet
connectivity. This method can also allow for connectivity to authorized sites.
Our goal is to determine if there are network features we can identify that distinguish
known malware samples from the top 100 Android apps on the Google play store. We also
wanted to obtain the interprocess communication (IPC) from malicious apps to search for
interesting features. Ideally, these features would help find malicious apps that had not
been classified as malicious.
5.2.1 Methods
Mobile devices favor maximizing efficiency over performance because they rely on
batteries for power. The x86_64 architecture provides low-cost high-performance hard-
ware, hypervisors, and virtual machines. This gap leads to interesting opportunities and
challenges when executing Android apps on x86_64. To retrieve the domains accessed by
Android apps in a scalable way, the amount of human intervention should be minimized.
Malicious apps are sometimes used to launch attacks on remote computers and networks,
61

Figure 5.1: Basic Architecture of the Experimental Setup
so the testbed setup should prevent this from taking place. There are trade-offs to allowing
some Internet traffic, but for the purpose of this work, the testbed did not have access to
the Internet during the testing.
A general view of the testbed setup is shown in Figure 5.1. Each Android x86 VM
is created as a clone of a preconfigured VM with Android x86 [103] installed along with
the base Android Google apps. Any high popularity app with access to personal accounts,
data, or sensitive permissions would be an attractive target for IPC attacks. With this in
mind, we preloaded the base Google apps that are commonly included on most Android
phones.
The base Android x86 kernel was modified to add logging to Binder IPC transactions
(see Source Code A.1). If the transactions were intercepted at another layer (e.g. by
modifying the Java Binder implementation), it would be tricky to guarantee that all the
transactions were being logged since Android has a mix of Java and native code. Later
versions of the kernel used by Android have a hook that can be used by kernel modules
to audit or log Binder IPC. These IPC transaction logs include the time, the sending and
receiving process id, a transaction code, and a data field (that has the interface name and
optional arguments). For these logs to be useful, the process IDs need to be converted
to the package name strings that identify the apps; the Binder interface name needs to
62

be extracted from the data field; and the code needs to be converted to the corresponding
function for the particular Binder interface. Additionally, the remaining data could be
parsed into the transaction arguments in the form of a Parcel, but that was left for future
work. To convert the process ID to package name of the application, the process name can
be used since Android uses the package name as the process name. It is recommended to
double check the user ID of the process and its associated package name to make sure they
match. A mismatch would be suspicious.
Converting a Binder transaction code from a log entry is an involved process. Code
was written to scrape the android source code for AIDL files (Android Interface Defini-
tion Language [1]) as well as Java and C/C++ files that inherit from IBinder (Source
Code B.3). These files need to be parsed to infer the association between transaction codes
and interface function calls. This association is then used to translate an (interface, code)
pair into an (interface, function) pair.
Auditd was configured to log SYS_LISTEN and SYS_CONNECT socketcalls using the
script in Source Code 5.1. While tcp, tcp6, udp, and udp6 can be monitored without
requiring root privileges in /proc/net/, they must be polled whereas auditd provides
event driven results. Unfortunately, the logged arguments for socket call include a pointer
that would need to be dereferenced during runtime to determine what was being connected
to or which port was being opened.
1 #!/system/xbin/sh2 auditctl -e 0 # Disable auditing3 # Close the auditd service4 kill ‘cat /data/local/tmp/auditd.pid‘5 auditctl -D # Clear all rules6 auditctl -b 3207 # Log socketcalls for SYS_LISTEN8 auditctl -a exit,always -S socketcall -F a0=49 # Log socketcalls for SYS_CONNECT
63

10 auditctl -a exit,always -S socketcall -F a0=311 auditctl -e 1 # Enable auditing12 # Start the auditd service13 auditd14 auditctl -l # List all rules
Source Code 5.1: “start_auditd.sh”
It is possible to use a single virtual machine for multiple Android apps and still at-
tribute all the traffic back to each app in the following way. The following commands
can be executed to add iptables rules that log new TCP connections along with their user
identification (UID).
1 iptables -I OUTPUT 1 -j LOG -m state --state NEW --log-prefix "[IPT_LOG] " --log-level 4 --log-uid
2 iptables -I INPUT 1 -j LOG -m state --state NEW --log-prefix "[IPT_LOG] " --log-level 4 --log-uid
On Android each UID usually corresponds to a single application. The option:
-m state -state NEW
can be replaced to monitor individual packets instead of new connections if needed.
The sinkhole server is configured to be the default gateway for the virtualized network
so that all traffic from the Android x86 VMs is routed through it. It also fills the roles
of the DHCP server and DNS recursive resolver. As the DHCP server, it supplies the
default DNS server and gateway addresses. As the DNS server, it has a wildcard record
that directs all domain names to itself. A network address translation (NAT) firewall rule
is set up to redirect all non-local IP addresses to the sinkhole server.
The HTTP server (with HTTPS too) is configured to accept requests from any domain
name, and the private key of the webserver can be imported into Wireshark to decrypt SSL
sessions. This allows the hostname, the path, any custom headers, GET the parameters,
POST the data, and the uploaded files to be recorded for requests initiated by the client
application. This configuration could be modified to create a more sophisticated setup that
64

Popu
lar Ap
psAD
RD
Anser
verBot
BaseB
ridge
Droid
Kung
Fu
Gemini
Pjapp
sOther
Uncla
ssifie
d0
10
20
30
40
50
Perc
ent o
f sam
ples
Internet Use at First Run Periodic Internet Use
Figure 5.2: Internet Usage Timing
would allow partial connections to the Internet. Another option would be to serve cached
copies of pages with the goal of getting apps to expose more of their behavior.
5.2.2 Results
The network usage measurements are summarized in Figure 5.2. The data was col-
lected over 4-hour time windows, so periods larger than 4 hours would not show up in the
results. Almost 20% of the top 100 Android apps on the Google Play store periodically
accessed the Internet in the background after simply installing the app and running it once.
Three of the six malware families did not show periodic background Internet usage during
the 4-hour monitoring period. This suggests that identifying malware based on Internet
usage when the user isn’t actively using the device is not feasible.
Figure 5.3 shows an example Binder IPC graph from a clean Android system. Though
we did not find any evidence of Bluetooth usage by the malicious applications in our
65

dataset, we were able to collect the IPC data from the various apps that could be further
investigated.
5.3 App Network Monitor: A DNS Based Device Hygiene Solution
Aside from a data usage chart, Android does not have features to help a user police how
apps use the Internet Users can decide whether to remove an app if it uses too much data,
but nothing is provided to indicate what is being sent or received. Similarly, if the user
wants to limit network access on the device, they have fairly coarse-grained control. They
can turn the Wi-Fi or Cellular data on or off, but that affects the entire device. Android 6.0
and newer OS versions allow permissions to be granted or denied to apps, but this feature
does not include the network access permission. When a user installs an app that requests
Internet or network access, they grant it permission simply by installing the app.
The Linux kernel that Android is based on has support for iptables, but modifying
the firewall rules requires root access. However, Android does provide an API (application
program interface) for setting up virtual private network (VPN) client applications. This
API provides a way to read and write the packets that normally would travel over the
device’s network interfaces. We developed ANM using the Android VPN API.
5.3.1 Implementation
Figure 5.4 shows an overview of how ANM is able to collect statistics on the domains
accessed by each app to determine which apps are malicious. At a high level, the DNS
traffic is handled by the Pseudo VPN service while the rest of the network traffic isn’t
touched by the VPN service. The mapping of IP address to UID for open sockets is
recorded from entries in the path /proc/net/. These entries are linked with the DNS
responses and the mapping of each UID to a package name to determine the domains
accessed by each app. This information is aggregated at a statistics server to establish the
66

com.android.defcontainer:com.android.defcontainer
/system/bin/servicemanager:
system_server:
system_server:system_server
com.android.defcontainer:
com.noshufou.android.su:com.noshufou.android.su
com.android.launcher:com.android.launcher
com.android.contacts:com.android.contacts
:
com.android.gallery3d:
com.android.gallery3d:com.android.gallery3d
<pre-initialized>:<pre-initialized>
<pre-initialized>:
com.android.voicedialer:
com.android.quicksearchbox:com.android.quicksearchbox
com.android.quicksearchbox:
com.android.systemui:com.android.systemui
android.process.media:android.process.media
com.android.phone:
com.android.phone:com.android.phone
android.process.media:android.process.acore:android.process.acore
com.android.providers.calendar:
app_process:app_process
/system/bin/mediaserver:
/system/bin/mediaserver:/system/bin/mediaserver
dumpsys:dumpsys
android.os.IServiceManager
android.ui.ISurfaceComposer
IMountService
android.os.IServiceManager
m.android.internal.app.IMediaContainerService
com.android.internal.telephony.IPhoneSubInfo
android.media.IAudioFlinger
android.content.pm.IPackageManager
android.app.ISearchManager
android.accounts.IAccountManager
android.app.IApplicationThread
android.app.IApplicationThread
android.app.IApplicationThread
android.app.IApplicationThread
android.app.IApplicationThread
android.app.IApplicationThread
android.os.IServiceManager
android.ui.ISurfaceComposer
android.os.IServiceManager
android.ui.ISurfaceComposer
android.os.IServiceManager
android.utils.IMemoryHeap
android.os.IServiceManager
com.android.internal.app.IBatteryStats
com.android.internal.telephony.ITelephony
android.app.INotificationManager
droid.content.IContentService
droid.content.IContentService
android.os.IServiceManager
android.content.pm.IPackageManager
droid.app.IAlarmManager
android.os.IServiceManager
android.app.IActivityManager
android.os.IPermissionController
android.os.IServiceManager
Figu
re5.
3:E
xam
ple
Wei
ghte
dB
inde
rIPC
Gra
ph.T
heno
des
repr
esen
tAnd
roid
proc
esse
sla
bele
dby
pack
age
nam
e.T
heed
ges
repr
esen
tBin
derc
onne
ctio
nsan
dar
ew
eigh
ted
byth
evo
lum
eof
tran
sact
ions
.Thi
sgr
aph
was
gene
rate
dus
ing
Gep
hi[1
04].
67

Figure 5.4: App Network Monitor Overview
domain access patterns of apps regardless of variations in user behavior so that malicious
apps can be identified.
The VPN API allows for specification of custom routes to filter which traffic is selected
to pass through the VPN. Routes were added for the DNS server IP addresses so that do-
main name resolution requests and responses could be captured by ANM. These packets
include information about what domains are being accessed and can be checked against a
list of known malicious domains such as Google Safe Browsing [105]. ANM uses much
less system resources than solutions that monitor all the network traffic. This is true be-
cause DNS traffic makes up a small percentage of the total number of network packets.
The downside of this is that contents of connections such as HTTP request headers cannot
be checked.
Implementing this technique required (1) parsing the IP and UDP headers of the DNS
requests; (2) sending them over datagram sockets to each DNS server; and (3) generating
new IP and UDP headers for the DNS responses. This functionality replaces the VPN
client, tunnel, and server with network address translation performed by the application.
DNS requests are sent to the virtual DNS server IP address provided by the pseudo VPN
68

service. These requests are forwarded to the actual DNS server. The responses are then
forwarded back as if they were sent from the virtual DNS server IP address.
The DNS packets do not indicate which app initiated the request. To obtain this in-
formation the pseudo files tcp, udp, tcp6, and udp6 from /proc/net/ are polled at
least once per minute to record the UID to destination address information for each socket
connection. The destination addresses are then checked to find the most recent matching
DNS record from the answer section of a response. This circumstantially implies the do-
main that was requested to initiate the socket connection and thus the UID associated with
the domain.
There are some challenges faced by this method. First, DNS records are cached for a
period specified by a TTL value, so not every socket connection will have a DNS request.
Second, multiple domain names can be associated with a single IP address so it is possible
to have multiple answer records pointing to the same domain name. HTTP requests can be
sent for both domains to the same IP address causing a possible confusion of the domain
that was being accessed by an app. Third, when an domain request results in an error, there
is no way to associate the original request with a UID. This makes it difficult to attribute
the original request to the app that initiated it.
While it is possible to create a scenario where multiple domain name requests are
answered with records to the same IP address, the risks of this scenario can be mitigated in
a variety of ways depending on the goal. If the goal is to identify suspicious apps, all the
matching domains could be attributed to all the matching apps making the requests. This
data could then be checked across devices to eliminate the false positives.
DNS errors are useful in detecting the presence of malware that uses DGAs (domain
generation algorithms). While it isn’t possible to directly attribute requests to non-existent
domains to the app which made the request, it is possible to monitor these requests to
69

establish patterns across devices. It is also possible to guess the format of the DGA, check
for domain requests that succeeded, and match the same pattern.
The UID to app relationship is strong on Android. Apps are assigned a unique UID
when they are installed. A notable exception occurs when the app writer specifies a shared
UID to use for a group of applications. Apps can also be assigned to a group belonging
to system apps, which are part of the original software on the system partition. In this
case, the malicious behavior could be traced to the shared UID, which would point to the
publisher responsible for the app. There is the possibility of malicious apps trying to hide
their behavior by using an Android intent to open a malicious URI from whichever app
is configured to accept that specific content type. However, the malicious app would still
need to be able to access the data that was retrieved in order to use this for a C&C channel.
For the user interface, we chose to warn the user when an app accesses a known mali-
cious domain. This gives the user an opportunity to decide if they want to navigate away
from that page, avoid clicking on a malicious ad, or uninstall an app that frequently ac-
cesses malicious domains. The user is also given access to the complete list of domains
accessed by each app on their device.
5.3.2 Results
We deployed ANM on the Google play store and had 550 unique installs over a six-
month period. Only about a fifth of those opted in to the study and provided meaningful
data. The summary statistics of the dataset are shown in Table 5.1. The dataset includes
4885.6 device hours of network activity that was calculated by merging the overlapping
connection intervals so that the time shared over several connections is only counted once
per device. There were 10963 unique domains resolved in the dataset and 1443 domain
requests that resulted in errors.
70

Total Mean Std.Unique Packages Installed 7542 293.1 111.0
Unique Domains Successfully Resolved 10963 183.6 406.1Unique Domains with Error Responses 1443 23.6 39.8
Device×Hours of Network Activity 4885.6 hours 44.4 hours 141.4 hours
Table 5.1: ANM Data Set Statistics
We found three different malicious domains that were each accessed on a different
device. Google Safe Browsing classified two of the domains as hosting malware and one
of the domains as being a social engineering platform. We were able to trace two of the
domains back to the apps which accessed them. One was a text messaging app, and the
other was confirmed to be a malicious app by AVG.
In one case we found domain errors for IP version 6 records that appeared to be from a
DGA. However, matching records were received for the IP version 4 addresses. We traced
back the IP version 4 address to a Internet security company and suspect they are using
the DNS for checking signatures against a cloud-based threat database.
We plan to continue the development of ANM and expand its user base to get further
insight into the behavior of malicious apps.
5.4 Related Work
There is already work which was concurrently developed in [106] that also uses a
user-space solution for monitoring network traffic. Their work focuses on privacy and
loss of personal information. They also monitor all the network traffic and even intercept
encrypted TLS streams adding significant overhead. This imposes a latency overhead that
has trade-offs with CPU usage. During active network usage they see a 9% increase in
CPU overhead. ANM avoids this problem by only monitoring the DNS traffic. Thus,
71

ANM only has added latency to the DNS lookup, and other traffic has no performance
penalty.
5.5 Summary
We found that network activity during the times a device isn’t being used does not give
a good indication of whether an app is malicious.
However, we developed a lightweight method for identifying malicious activity with-
out requiring root access on Android devices. We deployed this method and were able
to identify malicious activity through an analysis of DNS requests of Apps. This work is
ongoing and will be continued by other students.
72
6. IOTAEGIS: A SCALABLE FRAMEWORK TO SECURE THE INTERNET OF
THINGS
Motivated by the findings in chapter 3 we developed the IoTAegis framework, which
offers device-level protection to automatically manage device configurations and security
updates. It also acts as a middle-box to protect legacy devices that no longer receive
updates and leverages DNS to identify when a device has been compromised With cloud-
based device profile updates, the development effort to use IoTAegis to handle one device
can be shared by all other users of the framework. Our solution is shown to be effective,
scalable, lightweight, and can be deployed in different forms and network types.
6.1 Introduction
The protection of IoT devices is a challenging research topic because of the diversity of
IoT device types, communication media, protocols, and network topologies. A number of
solutions [107, 108, 109, 110, 111] already exist for securing IoT devices, but the expertise
and management burden of applying these fixes has led to this problem of IoT devices left
insecure. These solutions can be classified into two categories: device level and network
level. At the network level, the Norton Core [112] identifies unpatched or unsecured IoT
devices in a home network. In [110], an SDN platform is applied to identify suspicious
network behavior and dynamic security rules are enforced on IoT devices. At device
level, authors in [111] propose a secure authentication algorithm to verify the identities of
clients and servers in a CoAP-based IoT environment. Studies in [107] and [108] focus
on the security of IoT apps. We developed a framework to effectively secure IoT devices
from the device level: it checks the unsecured IoT devices in the network and updates
their firmwares, passwords, and configurations. It also includes a network based option
to provide extra security for devices which are no longer supported, and a DNS based
73
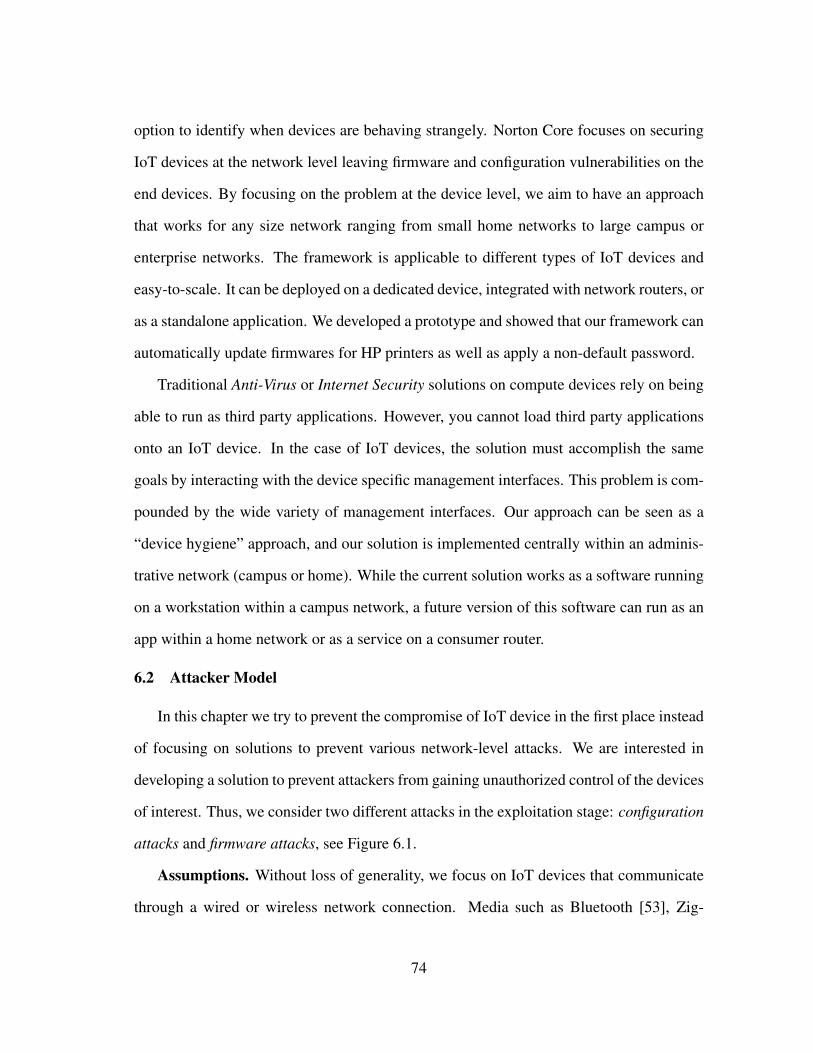
option to identify when devices are behaving strangely. Norton Core focuses on securing
IoT devices at the network level leaving firmware and configuration vulnerabilities on the
end devices. By focusing on the problem at the device level, we aim to have an approach
that works for any size network ranging from small home networks to large campus or
enterprise networks. The framework is applicable to different types of IoT devices and
easy-to-scale. It can be deployed on a dedicated device, integrated with network routers, or
as a standalone application. We developed a prototype and showed that our framework can
automatically update firmwares for HP printers as well as apply a non-default password.
Traditional Anti-Virus or Internet Security solutions on compute devices rely on being
able to run as third party applications. However, you cannot load third party applications
onto an IoT device. In the case of IoT devices, the solution must accomplish the same
goals by interacting with the device specific management interfaces. This problem is com-
pounded by the wide variety of management interfaces. Our approach can be seen as a
“device hygiene” approach, and our solution is implemented centrally within an adminis-
trative network (campus or home). While the current solution works as a software running
on a workstation within a campus network, a future version of this software can run as an
app within a home network or as a service on a consumer router.
6.2 Attacker Model
In this chapter we try to prevent the compromise of IoT device in the first place instead
of focusing on solutions to prevent various network-level attacks. We are interested in
developing a solution to prevent attackers from gaining unauthorized control of the devices
of interest. Thus, we consider two different attacks in the exploitation stage: configuration
attacks and firmware attacks, see Figure 6.1.
Assumptions. Without loss of generality, we focus on IoT devices that communicate
through a wired or wireless network connection. Media such as Bluetooth [53], Zig-
74
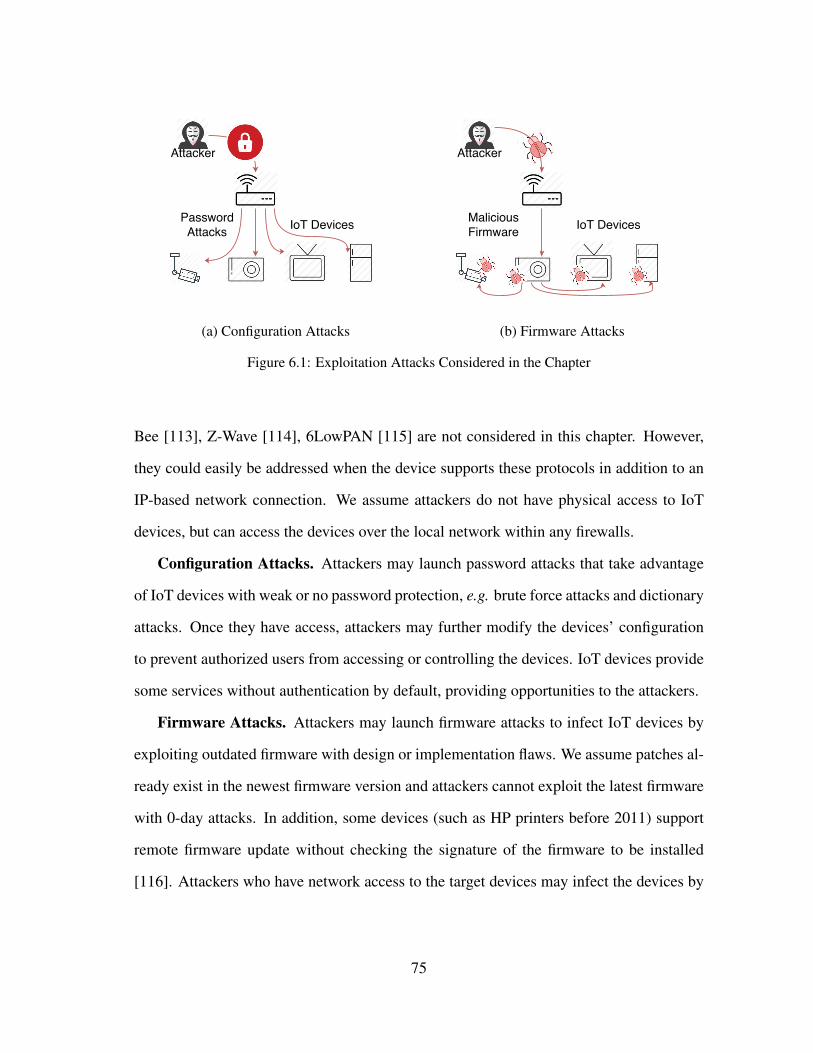
(a) Configuration Attacks (b) Firmware Attacks
Figure 6.1: Exploitation Attacks Considered in the Chapter
Bee [113], Z-Wave [114], 6LowPAN [115] are not considered in this chapter. However,
they could easily be addressed when the device supports these protocols in addition to an
IP-based network connection. We assume attackers do not have physical access to IoT
devices, but can access the devices over the local network within any firewalls.
Configuration Attacks. Attackers may launch password attacks that take advantage
of IoT devices with weak or no password protection, e.g. brute force attacks and dictionary
attacks. Once they have access, attackers may further modify the devices’ configuration
to prevent authorized users from accessing or controlling the devices. IoT devices provide
some services without authentication by default, providing opportunities to the attackers.
Firmware Attacks. Attackers may launch firmware attacks to infect IoT devices by
exploiting outdated firmware with design or implementation flaws. We assume patches al-
ready exist in the newest firmware version and attackers cannot exploit the latest firmware
with 0-day attacks. In addition, some devices (such as HP printers before 2011) support
remote firmware update without checking the signature of the firmware to be installed
[116]. Attackers who have network access to the target devices may infect the devices by
75

uploading a malicious firmware. Exploitation may also result from unsecured protocols
such as Telnet or SNMP and from flawed parsers for data like postscript print jobs.
Once the IoT devices have been exploited, attackers may launch (a) actuation attacks:
change the state of an IoT device with malicious intent, e.g. false command injection
attacks; (b) data acquisition attacks: obtain a user’s sensitive data such as print jobs or
phone calls; (c) data integrity attacks: send false sensor data or status information to a
server or other IoT device; and (d) Botnet attacks: leverage the infected IoT devices to
attack other hosts, e.g. Mirai attacks.
6.3 Solution
From the results of our measurement study outlined in chapter 3, it is clear that the
number of IoT devices could be more than that of compute devices. While compute
devices are generally protected by Antivirus and security patches are regularly updated,
many IoT devices are not adequately protected. Specifically, while firmware updates may
be available, 58.9% or more of the devices were not kept up-to-date. In addition, 51.3% or
more devices did not have a user defined password. This problem has been recognized by
others [62, 117]. The solution is made difficult by the number of devices on the network,
their age range, and the number of vendors supplying these devices. Thus, we developed
IoTAegis to address these identified problems directly while simultaneously reducing the
management burden. The IoTAegis provides a central tool for keeping firmware up-to-date
and device configurations secure.
An overview of IoTAegis is shown in Figure 6.2. The framework discovers hosts,
identifies device types and supported services. Then, it can perform tasks needed to update
the devices to the newest firmware and address security holes in the device configuration.
In this way an application or system service uses the framework to manage the network
devices and handle security issues as they are detected. Ideally, checks will be performed
76
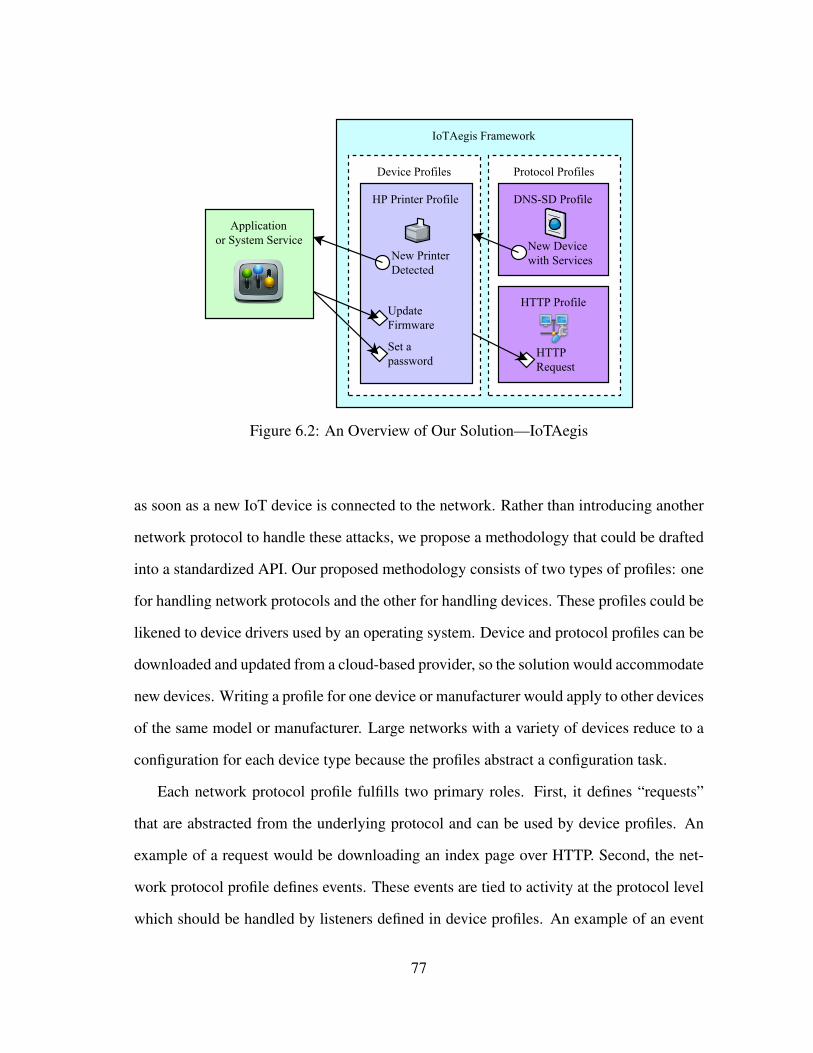
Figure 6.2: An Overview of Our Solution—IoTAegis
as soon as a new IoT device is connected to the network. Rather than introducing another
network protocol to handle these attacks, we propose a methodology that could be drafted
into a standardized API. Our proposed methodology consists of two types of profiles: one
for handling network protocols and the other for handling devices. These profiles could be
likened to device drivers used by an operating system. Device and protocol profiles can be
downloaded and updated from a cloud-based provider, so the solution would accommodate
new devices. Writing a profile for one device or manufacturer would apply to other devices
of the same model or manufacturer. Large networks with a variety of devices reduce to a
configuration for each device type because the profiles abstract a configuration task.
Each network protocol profile fulfills two primary roles. First, it defines “requests”
that are abstracted from the underlying protocol and can be used by device profiles. An
example of a request would be downloading an index page over HTTP. Second, the net-
work protocol profile defines events. These events are tied to activity at the protocol level
which should be handled by listeners defined in device profiles. An example of an event
77

would be the discovery of a new device and its services over mDNS. The DNS-SD profile
includes the logic needed to discover devices using mDNS and generate events whenever
a service advertisement is received.
Each device profile depends on network protocol requests or events to provide the logic
required to perform a set of standard tasks. Some tasks are device specific, but here are a
few key examples: discovering the device, identifying the device model and state, defin-
ing the password, checking what the latest available firmware is, checking the firmware
version on the device, applying a secure set of configuration options, recommending re-
strictive firewall rules. Not all tasks will apply to every device.
IoTAegis uses an event driven architecture where protocols such as DNS-SD over
mDNS produce events. These events are multiplexed by their service discovery data to
the appropriate handlers. For example an IoT printer may advertise the _http._tcp,
and _printer._tcp services. The _printer._tcp service includes a TXT record
with information about the printer that aids in the identification of the printer manufacturer
and model number. At this point the appropriate device profile can be notified through its
registered event listener. Based on these events, follow-up requests are made to query the
firmware version of the new printer and check if the new printer has a custom password
set. Further execution on that event tree can be halted, and the tasks registered for that
device would then be made available to the application or system service. These tasks
could be executed once on demand, periodically, or as updates are released for the device.
A device-centric solution requires the following key functions (a) host discovery, (b)
device identification, (c) configuration management, and (d) firmware updates.
Host Discovery. Several well-known techniques can be leveraged for host discovery,
as discussed in Section 2. IoTAegis uses the Avahi-client library [118] in our framework
to construct a DNS-SD profile. When new devices are services are discovered events are
78

generated by the framework. Next, we aggregate the list of services advertised by each
host.
Device Identification. IoTAegis matches service strings with different types of de-
vices and automatically identifies IoT device types. Specifically, _printer._tcp cor-
responds to a Unix printer, _pdl-datastream._tcp to a Page Description Language
(PDL) printer, _ipp._tcp to an Internet Printing Protocol (IPP) printer, _ipps._tcp
and _ipp-tls._tcp to IPP printers using HTTPS. Within the DNS-SD TXT records
are key-value-pairs, one of which describes the product by including the brand and model
number.
Devices with insufficient identifying information or no DNS-SD advertisement may
require a request to be made through a protocol profile. For example, a check could be
performed on their HTTP index page to match against signatures. Additional protocol
profiles can be provided to expand the capabilities of the framework as necessary, and
new device profiles would provide the logic required to identify more devices. Ideally, a
standard API could be drafted and the device manufacturer would provide its own device
profiles, but third parties could develop them as well.
Configuration Management. Some printers for example do not have an administra-
tive password set by default or have a default password that is easy to look up. When
devices use simple HTTP authentication, IoTAegis sets a header with the default authen-
tication information. If a page requiring authentication can be accessed with the default
username and password, it is clear the device needs to have a custom password set. The
user can be prompted or an automatic password can be generated, set, and stored in a pass-
word manager where both the security framework and the user can access it as needed.
In addition to problems with the default password configuration, tasks defined in the
device profile can address extraneous services enabled by default or device specific secu-
rity considerations. Thus, a device profile for IoTAegis can serve as a replacement for the
79

vendor specific device configuration software that is shipped with IoT devices. This pro-
vides the end user with a common place and interface to manage a wide variety of devices
connected to their home or business network in contrast to needing to use each device’s
individual management interface.
Firmware Updates. While newer devices may include automatic firmware updates,
our survey demonstrates there are plenty of devices running old firmware versions. To
update the firmware of an HP printer IoTAegis downloads the appropriate remote firmware
update (RFU) file and transmits it using TCP to the raw print port of the printer (9100).
The latest update can be found by querying an FTP site for a matching RFU file with
the greatest version number of date code. Some logic may be required to update very
old firmware to intermediate versions prior to updating to the latest version. This logic
can be included in the device profile, but in general the devices should be at most one
version behind. In this case, the latest supported firmware version will install without
requiring intermediate updates. Once the firmware is downloaded and transmitted, the
printer executes the update commands contained in the RFU file that perform the update
using the self-contained data without user intervention. Thus, the devices on the network
can be kept up-to-date with the latest firmware versions available to prevent attackers from
exploiting known vulnerabilities that have already been patched.
Middle-box Solution for Vulnerable Devices. Some devices are old enough that they
no longer receive updates from the manufacturer. Any vulnerabilities on these devices will
remain and may be exploited by attackers. A solution to this scenario requires preventing
exploits from reaching the vulnerable device. This is achieved by (1) using a managed
switch or user access control to prevent direct access to the vulnerable service on the de-
vice; and (2) implementing a transparent proxy with signature detection to block exploits.
The signatures are included in the device profile.
80

This feature is more costly in terms of performance because it requires funneling all
the traffic to the affected devices through the middle box. As long as the usage of these
devices doesn’t saturate the network link and the cost of running the signature checks
doesn’t saturate the CPU, the cost of this feature will be negligible. If these limits are
reached, one option would be to run additional middle boxes and another option would
be to replace the legacy hardware with newer hardware that doesn’t need the middle box
feature.
DNS-based Compromise Detection. IoT devices have a very limited set of behaviors
compared to compute devices. Thus, it is easier to establish a pattern of network access
behavior such as DNS lookups. These DNS lookups can provide insight into whether
the devices are properly configured and detect malicious behavior when the devices have
abnormal accesses.
For example, VoIP phones connect through a PBX which is configured on the device.
If the VoIP phones only access the domains for the proper PBX server, it demonstrates the
phone is configured correctly. If the phone accesses other domains or doesn’t look up the
proper PBX server, its configuration should be reset.
Printers were observed accessing vendor specific domains and performing reverse
lookups for local IP addresses. Any other DNS accesses would be suspicious and sug-
gest a printer was compromised.
IoTAegis can be integrated with the local DNS server to check the domain lookups
against the expected behavior defined in the device profile. This provides a way to know
when devices have been compromised, so proper action can be taken.
6.4 Evaluation
We tested the features of IoTAegis on an HP 2055x printer. We first verified that the
firmware files downloaded by IoTAegis matched the ones downloaded through a browser.
81
Then, we successfully updated the firmware twice by applying the next newest update
and an update to the newest version. The initial firmware datecode was 20120615, the
intermediate datecode was 20131112, and the final datecode was 20141201. The before
and after screenshots of the device configuration administration page hosted by the printer
for the last update are displayed in Figure 6.3. We hid most of the identifying information,
but the last few digits of the serial number and hardware address are shown to validate that
the screenshots were taken from the same device.
Figure 6.3: Printer Configuration Page Before (Left) and After (Right) IoTAegis Down-loaded and Updated the Firmware.
IoTAegis also successfully configured the printer to use custom password. Figure 6.4
shows the authentication prompt when attempting to access a sensitive part of the printer’s
administration page. We envision IoTAegis being integrated with a password manager of
the user’s choice. This gives the user easy access to the passwords in a secure place, and
82

IoTAegis can retrieve the passwords when future configuration or firmware updates are
needed.
Figure 6.4: Authentication Prompt When Accessing a Sensitive Page After IoTAegis Seta Password.
These demonstrations show that IoTAegis is able to solve the two primary channels of
attack motivated by our survey data. Attackers will not be able to exploit known vulnera-
bilities in out-of-date firmware or gain control of devices through insecure configurations
such as default passwords.
Solution Costs We implemented a proof-of-concept framework and demonstrated that
we are able to automatically check passwords on IoT devices and update firmware on HP
printers. We tested the proof-of-concept on an Intel Core i5-3330 CPU at 3.00GHz run-
ning Ubuntu 16.10 and recorded the CPU time as well was the network usage for the first
60 seconds of operation. The test subnet had 67 compute devices and 25 printers. The
network usage by protocol is shown in Figure 6.5, where the mDNS traffic was gener-
ated by the avahi library for service discovery and the HTTP traffic was used to obtain
83

the firmware and password state information from the detected printers. Also, the peak
network usage was about 350kBps (2.8Mbps), and most of the traffic occurred in the first
20 seconds of operation.
0 10 20 30 40 50 60Seconds
0
100
200
300
kB
mDNS HTTP
Figure 6.5: Network Usage During the First 60 Seconds of Operation
During the 60-second test interval the service avahi-daemon used 1.34 seconds of CPU
time in user mode and 0.32 seconds in kernel mode. The proof-of-concept app used 0.51
seconds of CPU in user mode and 0.08 seconds in kernel mode. This amounts to a uti-
lization of 3.75% of one core during the 60-second test period. The utilization would be
11.25% if we assume all the activity took place in the first 20 seconds. The peak mem-
ory usage of the proof-of-concept app was 99.6MB, but with rate limits on the DNS-SD
queries and optimization this number could be brought down to a number that would be
practical for consumer grade routers.
Our password update demonstration only requires a single HTTP request. This should
apply in most cases unless an initial request is required to obtain a nonce to use the sub-
mission form. Verification that the update succeeded requires an additional request. One
84

limitation of the firmware updates is the printer being updated must be in the “ready” state
for the update to complete—there can be no paper jams or active print jobs.
Scalability and Scope. While our proof-of-concept is limited in scope because of the
limited protocol and device profiles it contains, the general principles behind its design can
be applied to a wide variety of IoT devices. The primary requirement for IoTAegis to work
with an IoT device is it must have the appropriate device profile network protocol profile
and the network profile dependencies. Protocol profiles can be created for Bluetooth and
near field communications to support non-IP-based devices.
IoTAegis can be easily deployed in different forms such as a phone app, a browser
extension, or as a feature of a network device or home router. It is already suitable for both
wired and wireless Ethernet interfaces. The development of a standardized API would
make it easier for device manufacturers and third parties to develop profiles supporting
more IoT devices. This also enables alternative, but compatible, framework implementa-
tions to be developed that can use the same profiles.
6.5 Related Work
IoT Defense Solutions. A number of solutions have been proposed to secure IoT
devices through a security framework [109], SDN (software-defined networking) [110],
and authentication [111].
ZENworks [119] is an effective security and configuration management solution for
compute devices. Symantec Norton Core Router [112] aims to protect IoT devices in a
home network from network-level perspective. It detects suspicious activities within a
home network, and quarantines infected connected devices, but does not handle updates to
the device firmware or changes to the device configuration. IoTAegis solves the problem
from device level and provides a general framework that can be applied to different IoT de-
vices regardless of their type, manufacturers, and network interfaces (wired and wireless).
85

Our solution also provides password checks and automatic firmware updates to prevent
potential exploits.
Jia et. al [107] provide a taxonomic IoT attack app dataset based on reported IoT at-
tacks and constructing new IoT attacks. They also propose a context-based access control
system for IoT devices. This system supports fine-grained context identification and run-
time prompts with rich context information to help users authenticate sensitive actions and
perform access control.
Fernandes et al. [108] propose the FlowFence framework that enforces the declared
data flow patterns within IoT apps for sensitive data and prevent all other flows. The
solution can be incorporated with existing IoT apps with small overhead.
6.6 Summary
The infamous Mirai attack has shown that many IoT devices do not have adequate se-
curity protections and can be leveraged to cause significant damage. To solve the problems
uncovered in chapter 3, we developed IoTAegis to offer device-level security protection
for various IoT devices. Having one management interface for all IoT devices and device
profile updates via the cloud, significantly decrease the management burden for securing
the IoT. By incorporating a middle box feature, older IoT devices that no longer receive
updates are secured. The DNS traffic from IoT devices is used to verify that they are be-
having as expected. Our framework is effective, scalable, easy-to-deploy with low compu-
tational cost. It enables the development of a single management platform for configuring
and securing the IoT.
86
7. CONCLUSIONS
In order to identify and solve internal network threats related to non-compute devices,
this work includes quantitative studies of the number of devices and their condition. It
also includes three solutions to handle security issues present in non-compute devices in
particular smartphones and the IoT.
In chapter 2 we found that two-thirds of the DNS traffic came from wireless hosts.
This shows that mobile devices are playing a bigger role in networks. Also, DNS was
being used as a side channel to access data even through firewalls, and anomalous requests
that pointed to infected machines on the network were found. While these results apply
to both mobile and non-mobile devices, they show that DNS traffic can provide enough
information to identify malicious activity.
After performing measurements to estimate the impact of IoT devices on the network
in chapter 3, we found that 58.9% of printers had out-of-date firmware and 51.3% did
not have a user-defined password. The discovered VoIP phones composed the largest
category of IoT devices, and 45.3% of them had default passwords. At least 34 different
manufacturers were represented in the data, which included at least 12 different device
types. Each manufacturer had unique management interfaces, and some even had several
for each device type. This poses a significant challenge in securing and configuring all
these devices.
Mobile devices often have multiple connectivity options, which leads to novel security
challenges. While previous steppingstone detection techniques rely on correlating multi-
ple network flows, mobile devices can be steppingstones with only one observable flow.
Solutions were developed to this problem and are presented in chapter 4. One solution uses
87

timing measurements at the transport layer and the other at the application layer. These
solutions provide very high detection rates and low false positive rates.
Two different solutions for identifying malicious apps were tried in chapter 5. First, we
expected to see most of the harmful network activity happen regardless of whether a user
was interacting with the device; however, we did not expect to see a significant percentage
of benign apps actively using the Internet during this time. We found that contrary to
expectation, 20% of the 100 most popular Android apps exhibited periodic background
network activity when neither that app nor the device were in use. The second solution
was App Network Monitor, an Android app that monitors which domains are accessed
by each app and warns the user when malicious domains are accessed. This also allows
the malicious activity to be attributed to the app responsible. From the preliminary data
collected, we identified three malicious domains and one malicious app. This work will
be continued by other students.
Finally, the IoTAegis framework is presented in chapter 6. It addresses the challenge
of securing and configuring the wide variety of non-compute devices in a scalable way.
A proof of concept app was used to demonstrate the IoTAegis framework by updating the
firmware of a printer and setting a non-default password.
The aforementioned work contributes to the well-being of society by addressing insider
attacks that are enabled by the rise of non-compute devices such as smartphones and the
Internet of Things.
7.1 Future Work
7.1.1 Proxy Detection
The proxy detection methods worked well, but there are some additional improvements
which can be investigated. For example, other features could be investigated to determine
if the classification accuracy may be improved. Along with new features, methods that
88

perform anomaly detection across a combination of features can be evaluated. Investiga-
tion could be done to find a method for preventing the case when an attacker does not use
a tunnel but instead funnels the information first to the compromised machine and later
extracts it. IPsec [120] could be investigated to see if similar results could be achieved at
the network layer. Also instead of group of similar paths merely to detect compromised
hosts during training, training could be performed for each of these groups. This would
reduce the amount of training needed. Lastly, this method could be tested on a service
with fewer controls to see how it performs and to solve any challenges that did not come
up in the previous measurements.
7.1.2 App Network Monitor
There are two main tasks that would increase the benefit of the App Network Moni-
tor. First, work needs to be done to expand the userbase of the app to collect more data.
More data will provide the opportunity to establish patterns of app behavior across de-
vices. Second, changes can be made to the app so it can notify users of malicious domains
without having to wait for updated domain lists. This would simultaneously reduce the
effort required to upkeep the app and make the app more useful.
7.1.3 IoTAegis
IoTAegis would be even more beneficial with the following future contributions. First,
the IoTAegis framework can be extended to include additional network based protection
(firewall rules), support other IoT devices. Firewall rules can be used to add additional
protection to devices which do not include access control features. Second, the middle box
functionality could be further developed to allow for reprocessing of application specific
data such as print jobs to strip out common attack vectors. This would act as a more
proactive preventative measure then blocking data sent to IoT devices based on signatures.
Signatures require analysis on known malware samples while the reprocessing task will
89

validate and translate the input into a trusted format. Lastly, a flexible API can be extracted
from IoTAegis to aid in the development of third party protocol and device profiles that
may serve as the basis of a standardized API.
90

REFERENCES
[1] Android Open Source Project, “Android Interface Definition Language (AIDL),”
2017. [Online]. Available: https://developer.android.com/guide/components/aidl.
html
[2] G. Huston, “Management Guidelines & Operational Requirements for the Address
and Routing Parameter Area Domain ("arpa"),” RFC 3172, Sep. 2001. [Online].
Available: http://www.ietf.org/rfc/rfc3172.txt
[3] R. Droms, “Dynamic Host Configuration Protocol,” RFC 2131, Mar. 1997,
updated by RFCs 3396, 4361, 5494, 6842. [Online]. Available: http:
//www.ietf.org/rfc/rfc2131.txt
[4] P. Mockapetris, “Domain Names - Concepts and Facilities,” RFC 1034, Internet
Engineering Task Force, 1987. [Online]. Available: https://www.ietf.org/rfc/
rfc1034.txt
[5] ——, “Domain Names - Implementation and Specification,” RFC 1035, Internet
Engineering Task Force, 1987. [Online]. Available: https://www.ietf.org/rfc/
rfc1035.txt
[6] S. Cheshire and M. Krochmal, “DNS-Based Service Discovery,” RFC 6763, Feb.
2013. [Online]. Available: http://www.ietf.org/rfc/rfc6763.txt
[7] S. Bradner, L. Conroy, and K. Fujiwara, “The E.164 to Uniform Resource
Identifiers (URI) Dynamic Delegation Discovery System (DDDS) Application
(ENUM),” RFC 6116, Internet Engineering Task Force, 2011. [Online]. Available:
http://www.ietf.org/rfc/rfc6116.txt
91

[8] J. Postel and J. Reynolds, “File Transfer Protocol,” RFC 959, Oct. 1985,
updated by RFCs 2228, 2640, 2773, 3659, 5797, 7151. [Online]. Available:
http://www.ietf.org/rfc/rfc959.txt
[9] T. Berners-Lee, R. Fielding, and H. Frystyk, “Hypertext Transfer Protocol –
HTTP/1.0,” RFC 1945, May 1996. [Online]. Available: http://www.ietf.org/rfc/
rfc1945.txt
[10] M. Crispin, “Internet Message Access Protocol - Version 4rev1,” RFC 3501, Mar.
2003, updated by RFCs 4466, 4469, 4551, 5032, 5182, 5738, 6186, 6858. [Online].
Available: http://www.ietf.org/rfc/rfc3501.txt
[11] J. Postel, “Internet Protocol,” RFC 791, Sep. 1981, updated by RFCs 1349, 2474,
6864. [Online]. Available: http://www.ietf.org/rfc/rfc791.txt
[12] R. Herriot, S. Butler, P. Moore, R. Turner, and J. Wenn, “Internet
Printing Protocol/1.1: Encoding and Transport,” RFC 2910, Sep. 2000,
updated by RFCs 3380, 3381, 3382, 3510, 3995, 7472. [Online]. Available:
http://www.ietf.org/rfc/rfc2910.txt
[13] R. Atkinson, “Security Architecture for the Internet Protocol,” RFC 1825, Aug.
1995, obsoleted by RFC 2401. [Online]. Available: http://www.ietf.org/rfc/rfc1825.
txt
[14] W. Yeong, T. Howes, and S. Kille, “Lightweight Directory Access Protocol,”
RFC 1777, Mar. 1995, obsoleted by RFC 3494. [Online]. Available: http:
//www.ietf.org/rfc/rfc1777.txt
[15] S. Cheshire and M. Krochmal, “Multicast DNS,” RFC 6762 (Proposed
Standard), Internet Engineering Task Force, 2013. [Online]. Available: http:
//www.ietf.org/rfc/rfc6762.txt
92

[16] F. Audet and C. Jennings, “Network Address Translation (NAT) Behavioral
Requirements for Unicast UDP,” RFC 4787 (Best Current Practice), Jan. 2007,
updated by RFC 6888. [Online]. Available: http://www.ietf.org/rfc/rfc4787.txt
[17] M. Butler, J. Postel, D. Chase, J. Goldberger, and J. Reynolds, “Post
Office Protocol: Version 2,” RFC 937, Feb. 1985. [Online]. Available:
http://www.ietf.org/rfc/rfc937.txt
[18] J. Myers and M. Rose, “Post Office Protocol - Version 3,” RFC 1939,
May 1996, updated by RFCs 1957, 2449, 6186. [Online]. Available: http:
//www.ietf.org/rfc/rfc1939.txt
[19] J. Rosenberg, H. Schulzrinne, G. Camarillo, A. Johnston, J. Peterson,
R. Sparks, M. Handley, and E. Schooler, “SIP: Session Initiation Protocol,”
RFC 3261, Jun. 2002, updated by RFCs 3265, 3853, 4320, 4916, 5393,
5621, 5626, 5630, 5922, 5954, 6026, 6141, 6665, 6878. [Online]. Available:
http://www.ietf.org/rfc/rfc3261.txt
[20] J. Klensin, “Simple Mail Transfer Protocol,” RFC 5321, Oct. 2008. [Online].
Available: http://www.ietf.org/rfc/rfc5321.txt
[21] P. Resnick, “Internet Message Format,” RFC 5322, Oct. 2008, updated by RFC
6854. [Online]. Available: http://www.ietf.org/rfc/rfc5322.txt
[22] W3C, “SOAP Version 1.2,” 2007. [Online]. Available: https://www.w3.org/TR/
soap12/
[23] M. Leech, M. Ganis, Y. Lee, R. Kuris, D. Koblas, and L. Jones,
“SOCKS Protocol Version 5,” RFC 1928, 1996. [Online]. Available: http:
//www.ietf.org/rfc/rfc1928.txt
93

[24] T. Ylonen and C. Lonvick, “The Secure Shell (SSH) Protocol Architecture,” RFC
4251, 2006. [Online]. Available: http://www.ietf.org/rfc/rfc4251.txt
[25] J. Postel, “Transmission Control Protocol,” RFC 793, Sep. 1981, updated by RFCs
1122, 3168, 6093, 6528. [Online]. Available: http://www.ietf.org/rfc/rfc793.txt
[26] T. Dierks and C. Allen, “The TLS Protocol Version 1.0,” RFC 2246, Jan. 1999,
obsoleted by RFC 4346, updated by RFCs 3546, 5746, 6176, 7465. [Online].
Available: http://www.ietf.org/rfc/rfc2246.txt
[27] L. Masinter, “The "Data" URL Scheme,” RFC 2397, Aug. 1998. [Online].
Available: http://www.ietf.org/rfc/rfc2397.txt
[28] T. Berners-Lee, L. Masinter, and M. McCahill, “Uniform Resource Locators
(URL),” RFC 1738, Dec. 1994, obsoleted by RFCs 4248, 4266, updated
by RFCs 1808, 2368, 2396, 3986, 6196, 6270. [Online]. Available: http:
//www.ietf.org/rfc/rfc1738.txt
[29] T. Richardson, Q. Stafford-Fraser, K. R. Wood, and A. Hopper, “Virtual Network
Computing,” IEEE Internet Computing, vol. 2, no. 1, pp. 33–38, Jan 1998.
[Online]. Available: https://doi.org/10.1109/4236.656066
[30] Pew Research Center, “Mobile Fact Sheet,” 2017. [Online]. Available:
http://www.pewinternet.org/fact-sheet/mobile/
[31] P. Jacob Poushter, “Smartphone Ownership and Internet Usage Con-
tinues to Climb in Emerging Economies,” 2016. [Online]. Avail-
able: http://www.pewglobal.org/2016/02/22/smartphone-ownership-and-internet-
usage-continues-to-climb-in-emerging-economies/
[32] B. Herzberg, D. Bekerman, and I. Zeifman, “Breaking Down Mirai: An IoT
DDoS Botnet Analysis,” 2016. [Online]. Available: https://www.incapsula.com/
94

blog/malware-analysis-mirai-ddos-botnet.html
[33] N. Brownlee, K. Claffy, and E. Nemeth, “DNS measurements at a Root Server,”
in GLOBECOM ’01, vol. 3, 2001, pp. 1672–1676 vol.3. [Online]. Available:
http://dx.doi.org/10.1109/GLOCOM.2001.965864
[34] A.-J. Su, D. R. Choffnes, A. Kuzmanovic, and F. E. Bustamante, “Drafting
Behind Akamai (Travelocity-based Detouring),” SIGCOMM Comput. Commun.
Rev., vol. 36, no. 4, pp. 435–446, 2006. [Online]. Available: http:
//dx.doi.org/10.1145/1151659.1159962
[35] J. S. Otto, M. A. Sánchez, J. P. Rula, and F. E. Bustamante, “Content Delivery
and the Natural Evolution of DNS: Remote DNS Trends, Performance Issues and
Alternative Solutions,” in Proc. of the 2012 ACM Conf. on Internet Measurement
Conf., ser. IMC ’12. New York, NY, USA: ACM, 2012, pp. 523–536. [Online].
Available: http://dx.doi.org/10.1145/2398776.2398831
[36] J. P. Rula and F. E. Bustamante, “Behind the Curtain: Cellular DNS and Content
Replica Selection,” in Proc. of the 2014 Conf. on Internet Measurement Conf., ser.
IMC ’14. New York, NY, USA: ACM, 2014, pp. 59–72. [Online]. Available:
http://dx.doi.org/10.1145/2663716.2663734
[37] L. Bilge, S. Sen, D. Balzarotti, E. Kirda, and C. Kruegel, “Exposure: A Passive
DNS Analysis Service to Detect and Report Malicious Domains,” ACM Trans.
Inf. Syst. Secur., vol. 16, no. 4, pp. 14:1–14:28, 2014. [Online]. Available:
http://dx.doi.org/10.1145/2584679
[38] S. Yadav, A. K. K. Reddy, A. N. Reddy, and S. Ranjan, “Detecting Algorithmically
Generated Malicious Domain Names,” in IMC ’10. ACM, 2010, pp. 48–61.
[Online]. Available: http://dx.doi.org/10.1145/1879141.1879148
95

[39] S. Yadav and A. L. N. Reddy, “Winning with DNS Failures: Strategies for Faster
Botnet Detection,” in SecureComm ’11, London, United Kingdom, Sep. 2011.
[Online]. Available: http://dx.doi.org/10.1007/978-3-642-31909-9_26
[40] M. Antonakakis, R. Perdisci, Y. Nadji, N. Vasiloglou, S. Abu-Nimeh,
W. Lee, and D. Dagon, “From Throw-away Traffic to Bots: Detecting
the Rise of DGA-based Malware,” in USENIX Security’12, 2012, pp.
24–24. [Online]. Available: https://www.usenix.org/conference/usenixsecurity12/
technical-sessions/presentation/antonakakis
[41] J. Jung, E. Sit, H. Balakrishnan, and R. Morris, “DNS Performance and the
Effectiveness of Caching,” IEEE/ACM Trans. Netw., vol. 10, no. 5, pp. 589–603,
Oct. 2002. [Online]. Available: http://dx.doi.org/10.1109/TNET.2002.803905
[42] E. Marcotte, “Responsive Web Design,” 2015. [Online]. Available: http:
//alistapart.com/article/responsive-web-design
[43] D. Leonard and D. Loguinov, “Turbo King: Framework for Large-Scale Internet
Delay Measurements,” in INFOCOM 2008, 2008, pp. 31–35. [Online]. Available:
http://dx.doi.org/10.1109/INFOCOM.2008.15
[44] S. Hao, M. Thomas, V. Paxson, N. Feamster, C. Kreibich, C. Grier, and
S. Hollenbeck, “Understanding the Domain Registration Behavior of Spammers,”
in IMC ’13. New York, NY, USA: ACM, 2013, pp. 63–76. [Online]. Available:
http://dx.doi.org/10.1145/2504730.2504753
[45] H. Gao, V. Yegneswaran, Y. Chen, P. Porras, S. Ghosh, J. Jiang, and
H. Duan, “An Empirical Reexamination of Global DNS Behavior,” SIGCOMM
Comput. Commun. Rev., vol. 43, no. 4, pp. 267–278, 2013. [Online]. Available:
http://dx.doi.org/10.1145/2534169.2486018
96

[46] R. Villamarin-Salomon and J. Brustoloni, “Identifying Botnets Using Anomaly
Detection Techniques Applied to DNS Traffic,” in CCNC ’08, January 2008, pp.
476–481. [Online]. Available: http://dx.doi.org/10.1109/ccnc08.2007.112
[47] Y. Kazato, K. Fukuda, and T. Sugawara, “Towards Classification of DNS
Erroneous Queries,” in AINTEC ’13, 2013. [Online]. Available: http:
//dx.doi.org/10.1145/2534142.2534146
[48] M. Antonakakis, R. Perdisci, W. Lee, N. Vasiloglou, II, and D. Dagon, “Detecting
Malware Domains at the Upper DNS Hierarchy,” in Proc. of the 20th USENIX
Conf. on Security, ser. SEC’11. Berkeley, CA, USA: USENIX Association,
2011, pp. 27–27. [Online]. Available: https://www.usenix.org/conference/usenix-
security-11/detecting-malware-domains-upper-dns-hierarchy
[49] V. Paxson, M. Christodorescu, M. Javed, J. Rao, R. Sailer, D. Schales, M. P.
Stoecklin, K. Thomas, W. Venema, and N. Weaver, “Practical Comprehensive
Bounds on Surreptitious Communication over DNS,” in Proc. USENIX Security
Conf. 2013, 2013, pp. 17–32. [Online]. Available: https://www.usenix.org/
conference/usenixsecurity13/technical-sessions/presentation/paxson
[50] K. Schomp, T. Callahan, M. Rabinovich, and M. Allman, “On Measuring the
Client-side DNS Infrastructure,” in IMC ’13, 2013, pp. 77–90. [Online]. Available:
http://dx.doi.org/10.1145/2504730.2504734
[51] T. Matsunaka, A. Yamada, and A. Kubota, “Passive OS Fingerprinting by DNS
Traffic Analysis,” in AINA ’13. IEEE Computer Society, 2013, pp. 243–250.
[Online]. Available: http://dx.doi.org/10.1109/AINA.2013.119
[52] H. Falaki, R. Mahajan, S. Kandula, D. Lymberopoulos, R. Govindan, and D. Estrin,
“Diversity in Smartphone Usage,” in MobiSys ’10, 2010, pp. 179–194. [Online].
Available: http://dx.doi.org/10.1145/1814433.1814453
97

[53] Bluetooth SIG, “Bluetooth Specification Version 2.0,” 2017. [Online]. Avail-
able: https://www.bluetooth.com/specifications/adopted-specifications/legacy-
specifications
[54] European Computer Manufacturers Association, “ECMA340–Near Field Com-
munication Interface and Protocol (NFCIP-1),” 2013. [Online]. Available:
https://www.ecma-international.org/publications/files/ECMA-ST/Ecma-340.pdf
[55] E. Ronen, C. O’Flynn, A. Shamir, and A. Weingarten, “IoT Goes Nuclear: Creating
a ZigBee Chain Reaction,” 2017. [Online]. Available: http://iotworm.eyalro.net/
[56] Samsung, “Samsung Privacy Policy–SmartTV Supplement,” 2015. [Online].
Available: http://www.samsung.com/sg/info/privacy/smarttv/?CID=AFL-hq-mul-
0813-11000170
[57] J. MÃijller, V. Mladenov, and J. Somorovsky, “SoK: Exploiting Network Printers,”
2017. [Online]. Available: https://www.nds.rub.de/media/ei/veroeffentlichungen/
2017/02/03/printer-security.pdf
[58] Wikipedia, “2016 Dyn Cyberattack — Wikipedia, The Free Encyclopedia,”
2017. [Online]. Available: https://en.wikipedia.org/w/index.php?title=2016_Dyn_
cyberattack&oldid=763071700
[59] E. Fernandes, J. Jung, and A. Prakash, “Security Analysis of Emerging
Smart Home Applications,” in IEEE S&P, May 2016. [Online]. Available:
https://doi.org/10.1109/SP.2016.44
[60] J. Wurm, K. Hoang, O. Arias, A. R. Sadeghi, and Y. Jin, “Security Analysis
on Consumer and Industrial IoT Devices,” in IEEE ASP-DAC, January 2016, pp.
519–524. [Online]. Available: https://doi.org/10.1109/ASPDAC.2016.7428064
98

[61] M. Stanislav and T. Beardsley, “HACKING IoT: A Case Study
on Baby Monitor Exposures and Vulnerabilities,” 2015. [Online].
Available: https://www.rapid7.com/docs/Hacking-IoT-A-Case-Study-on-Baby-
Monitor-Exposures-and-Vulnerabilities.pdf
[62] M. Patton, E. Gross, R. Chinn, S. Forbis, L. Walker, and H. Chen, “Uninvited
Connections: A Study of Vulnerable Devices on the Internet of Things
(IoT),” in IEEE JISIC, September 2014, pp. 232–235. [Online]. Available:
https://doi.org/10.1109/JISIC.2014.43
[63] J. Matherly, “Shodan Search Engine,” 2009. [Online]. Available: https:
//www.shodan.io
[64] Y. M. P. Pa, S. Suzuki, K. Yoshioka, T. Matsumoto, T. Kasama, and C. Rossow,
“IoTPOT: Analysing the Rise of IoT Compromises,” in USENIX WOOT,
2015. [Online]. Available: https://www.usenix.org/conference/woot15/workshop-
program/presentation/pa
[65] G. Lyon, “What is Your Operating System Letting Others Do? NMAP Now!”
2017. [Online]. Available: https://nmap.org/
[66] Z. Durumeric, E. Wustrow, and J. A. Halderman, “ZMap: Fast Internet-wide
Scanning and Its Security Applications,” in USENIX SEC, 2013, pp. 605–
620. [Online]. Available: https://www.usenix.org/conference/usenixsecurity13/
technical-sessions/paper/durumeric
[67] DigitalBond, “Redpoint: Digital Bond ICS Emulation Tools,” 2014. [Online].
Available: https://github.com/digitalbond/Redpoint
[68] I. Polycom, “Polycom Web Configuration Utility User Guide.” [Online]. Avail-
able: http://supportdocs.polycom.com/PolycomService/support/global/documents/
99

support/user/products/voice/UC_Web_Config_Utility_User_Guide_v4_0_0.pdf
[69] SORBS, “The Open SOCKS Proxy Server,” 2015. [Online]. Available:
http://www.sorbs.net/information/proxy.shtml
[70] M. Dusi, M. Crotti, F. Gringoli, and L. Salgarelli, “Tunnel Hunter: Detecting
Application-layer Tunnels with Statistical Fingerprinting,” Comput. Netw., vol. 53,
no. 1, pp. 81–97, 2009. [Online]. Available: https://doi.org/10.1016/j.comnet.2008.
09.010
[71] M. Crotti, M. Dusi, F. Gringoli, and L. Salgarelli, “Detecting HTTP Tunnels with
Statistical Mechanisms,” in ICC, June 2007, pp. 6162–6168. [Online]. Available:
https://doi.org/10.1109/ICC.2007.1020
[72] Y. Chen, “Protection of Database Security via Collaborative Inference Detection,”
Ph.D. dissertation, University of California at Los Angeles, Los Angeles, CA,
USA, 2007. [Online]. Available: http://www.cobase.cs.ucla.edu/tech-docs/chen/
tkde-final.pdf
[73] N. Baracaldo and J. Joshi, “A Trust-and-risk Aware RBAC Framework: Tackling
Insider Threat,” in SACMAT. ACM, 2012, pp. 167–176. [Online]. Available:
https://doi.org/10.1145/2295136.2295168
[74] P. G. Sarkar and S. Fitzgerald, “Attacks on SSL a Comprehensive Study of BEAST,
CRIME, TIME, BREACH, Lucky 13 & RC4 Biases,” ISEC Partners, Tech.
Rep., 2013. [Online]. Available: https://www.isecpartners.com/media/106031/ssl_
attacks_survey.pdf
[75] J. Lin, “Divergence Measures Based on the Shannon Entropy,” IEEE
Trans. Inf. Theor., vol. 37, no. 1, pp. 145–151, 2006. [Online]. Available:
https://doi.org/10.1109/18.61115
100
[76] J. Kunegis, A. Lommatzsch, and C. Bauckhage, “Alternative Similarity Functions
for Graph Kernels,” in ICPR, December 2008, pp. 1–4. [Online]. Available:
https://doi.org/10.1109/ICPR.2008.4761801
[77] M. M. Breunig, H.-P. Kriegel, R. T. Ng, and J. Sander, “LOF: Identifying
Density-based Local Outliers,” SIGMOD Rec., vol. 29, no. 2, pp. 93–104, May
2000. [Online]. Available: https://doi.org/10.1145/335191.335388
[78] B. Chun, D. Culler, T. Roscoe, A. Bavier, L. Peterson, M. Wawrzoniak, and
M. Bowman, “PlanetLab: An Overlay Testbed for Broad-coverage Services,”
SIGCOMM Comput. Commun. Rev., vol. 33, no. 3, pp. 3–12, 2003. [Online].
Available: https://doi.org/10.1145/956993.956995
[79] Dest-unreach, “Socat - Multipurpose Relay,” 2015. [Online]. Available: http:
//www.dest-unreach.org/socat/
[80] ESnet, “Iperf3,” 2015. [Online]. Available: http://software.es.net/iperf/
[81] R.-M. Lin, Y.-C. Chou, and K.-T. Chen, “Stepping Stone Detection at
the Server Side,” in INFOCOMW, April 2011. [Online]. Available: https:
//doi.org/10.1109/INFCOMW.2011.5928952
[82] V. Aghaei-Foroushani and A. Zincir-Heywood, “A Proxy Identifier Based
on Patterns in Traffic Flows,” in HASE, January 2015. [Online]. Available:
https://doi.org/10.1109/HASE.2015.26
[83] S. Staniford-Chen and L. T. Heberlein, “Holding Intruders Accountable on the
Internet,” in SP, 1995. [Online]. Available: https://doi.org/10.1109/SECPRI.1995.
398921
[84] Y. Zhang and V. Paxson, “Detecting Stepping Stones,” in SSYM. USENIX
Association, 2000, pp. 13–13. [Online]. Available: https://www.usenix.org/
101

conference/9th-usenix-security-symposium/detecting-stepping-stones
[85] A. Blum, D. X. Song, and S. Venkataraman, “Detection of Interactive Stepping
Stones: Algorithms and Confidence Bounds,” in RAID, E. Jonsson, A. Valdes, and
M. Almgren, Eds., vol. 3224. Springer, 2004, pp. 258–277. [Online]. Available:
https://doi.org/10.1007/978-3-540-30143-1_14
[86] Y.-W. Kuo and S.-H. Huang, “An Algorithm to Detect Stepping-Stones in the
Presence of Chaff Packets,” in ICPADS, December 2008, pp. 485–492. [Online].
Available: https://doi.org/10.1109/ICPADS.2008.101
[87] G. Di Crescenzo, A. Ghosh, A. Kampasi, R. Talpade, and Y. Zhang, “Detecting
Anomalies in Active Insider Stepping Stone Attacks,” Journal of Wireless Mo-
bile Networks, Ubiquitous Computing, and Dependable Applications, vol. 2, no. 1,
2011.
[88] X. Wang, S. Chen, and S. Jajodia, “Tracking Anonymous Peer-to-peer VoIP Calls
on the Internet,” in CCS. New York, NY, USA: ACM, 2005, pp. 81–91. [Online].
Available: https://doi.org/10.1145/1102120.1102133
[89] A. Houmansadr, N. Kiyavash, and N. Borisov, “Non-blind Watermarking of
Network Flows,” IEEE/ACM Trans. Netw., vol. 22, no. 4, pp. 1232–1244, 2014.
[Online]. Available: https://doi.org/10.1109/TNET.2013.2272740
[90] D. X. Song, D. Wagner, and X. Tian, “Timing Analysis of Keystrokes and
Timing Attacks on SSH,” in SSYM. USENIX Association, 2001. [Online].
Available: https://www.usenix.org/conference/10th-usenix-security-symposium/
timing-analysis-keystrokes-and-timing-attacks-ssh
[91] G. XIE, T. He, and G. Zhang, “Rogue access point detection using segmental
tcp jitter,” in WWW. ACM, 2008, pp. 1249–1250. [Online]. Available:
102

https://doi.org/10.1145/1367497.1367750
[92] A. Abdou, A. Matrawy, and P. Van Oorschot, “CPV: Delay-based Location
Verification for the Internet,” Dependable and Secure Computing, IEEE
Transactions on, vol. PP, no. 99, pp. 1–1, 2015. [Online]. Available:
https://doi.org/10.1109/TDSC.2015.2451614
[93] G. D. Bissias, M. Liberatore, D. Jensen, and B. N. Levine, “Privacy Vulnerabilities
in Encrypted HTTP Streams,” in PET. Springer, 2005, pp. 1–11. [Online].
Available: https://doi.org/10.1007/11767831_1
[94] L. Bernaille, R. Teixeira, I. Akodkenou, A. Soule, and K. Salamatian, “Traffic
Classification on the Fly,” SIGCOMM Comput. Commun. Rev., vol. 36, no. 2, pp.
23–26, Apr. 2006. [Online]. Available: https://doi.org/10.1145/1129582.1129589
[95] W. Lee and D. Xiang, “Information-Theoretic Measures for Anomaly Detection,”
in SP. IEEE Computer Society, 2001, pp. 130–. [Online]. Available:
https://doi.org/10.1109/SECPRI.2001.924294
[96] J. Bi, M. Zhang, and L. Zhao, “Security Enhancement by Detecting Network
Address Translation Based on Instant Messaging,” in EUC. Springer-Verlag,
2006, pp. 962–971. [Online]. Available: https://doi.org/10.1007/11807964_97
[97] SimulatedSimian, “Tracetcp: Traceroute Utility That Uses TCP SYN Packets to
Trace Network Routes.” 2014. [Online]. Available: https://simulatedsimian.github.
io/tracetcp.html
[98] K. Borders and A. Prakash, “Web Tap: Detecting Covert Web Traffic,” in CCS.
ACM, 2004, pp. 110–120. [Online]. Available: https://doi.org/10.1145/1030083.
1030100
103

[99] MaxMind, Inc., “Device Tracking Add-on for minFraud and Proxy Detection
Services,” 2014. [Online]. Available: http://dev.maxmind.com/minfraud/device/
[100] Qualys, Inc., “HTTP Client Fingerprinting Using SSL Handshake Analysis,” 2015.
[Online]. Available: https://www.ssllabs.com/projects/client-fingerprinting/
[101] N. Nikiforakis, A. Kapravelos, W. Joosen, C. Kruegel, F. Piessens, and
G. Vigna, “Cookieless Monster: Exploring the Ecosystem of Web-Based Device
Fingerprinting,” in SP. IEEE Computer Society, 2013, pp. 541–555. [Online].
Available: https://doi.org/10.1109/SP.2013.43
[102] I. Colleen C., “Tips and Tricks to Optimize Android Apps on x86,” 2014. [Online].
Available: https://software.intel.com/en-us/node/517681?wapkw=libhoudini
[103] C.-W. Huang, “Android-x86: Porting Android to x86,” 2017. [Online]. Available:
http://www.android-x86.org
[104] T. G. Consortium, “Gephi Makes Graphs Handy,” 2017. [Online]. Available:
https://gephi.org/
[105] Google, “Google Safe Browsing,” 2017. [Online]. Available: https://safebrowsing.
google.com/
[106] A. Razaghpanah, N. Vallina-Rodriguez, S. Sundaresan, C. Kreibich, P. Gill,
M. Allman, and V. Paxson, “Haystack: In Situ Mobile Traffic Analysis
in User Space,” CoRR, vol. abs/1510.01419, 2015. [Online]. Available:
http://arxiv.org/abs/1510.01419
[107] Y. J. Jia, Q. A. Chen, S. Wang, A. Rahmati, E. Fernandes, Z. M. Mao, and
A. Prakash, “ContexIoT: Towards Providing Contextual Integrity to Appified IoT
Platforms,” in NDSS, 2017. [Online]. Available: https://www.internetsociety.org/
doc/contexlot-towards-providing-contextual-integrity-appified-iot-platforms
104

[108] E. Fernandes, J. Paupore, A. Rahmati, D. Simionato, M. Conti, and A. Prakash,
“FlowFence: Practical Data Protection for Emerging IoT Application Frameworks,”
in USENIX SEC, 2016, pp. 531–548. [Online]. Available: https://www.usenix.org/
conference/usenixsecurity16/technical-sessions/presentation/fernandes
[109] A. F. A. Rahman, M. Daud, and M. Z. Mohamad, “Securing Sensor to
Cloud Ecosystem Using Internet of Things (IoT) Security Framework,” in ACM
ICC, 2016, pp. 79:1–79:5. [Online]. Available: https://doi.org/10.1145/2896387.
2906198
[110] V. Sivaraman, H. H. Gharakheili, A. Vishwanath, R. Boreli, and O. Mehani,
“Network-Level Security and Privacy Control for Smart-Home IoT Devices.” in
IEEE WiMob, 2015, pp. 163–167. [Online]. Available: https://doi.org/10.1109/
WiMOB.2015.7347956
[111] M. A. Jan, P. Nanda, X. He, Z. Tan, and R. P. Liu, “A Robust
Authentication Scheme for Observing Resources in the Internet of Things
Environment,” in IEEE TrustCom, September 2014, p. 370. [Online]. Available:
http://doc.utwente.nl/94046/
[112] Symantec Corp., “Norton Core,” 2017. [Online]. Available: https://us.norton.com/
core
[113] ZigBee Standards Organization, “ZigBee Specification,” 2012. [Online]. Available:
http://www.zigbee.org/download/standards-zigbee-specification/#
[114] Z-Wave Alliance, “Z-Wave,” 2015. [Online]. Available: http://zwavepublic.com/
specifications
[115] Z. Shelby and C. Bormann, 6LoWPAN: The Wireless Embedded Internet. The
Atrium, Southern Gate, Chichester, West Sussex, PO19 QSQ, United Kingdom:
105

John Wiley & Sons, 2011, vol. 43.
[116] H.-P. D. Company, “Certain HP Printers and HP Digital Senders, Remote
Firmware Update Enabled by Default,” 2011. [Online]. Available: http:
//h20564.www2.hp.com/hpsc/doc/public/display?docId=emr_na-c03102449
[117] C. Botnet, “Internet Census 2012,” 2012. [Online]. Available: http://census2012.
sourceforge.net/paper.html
[118] L. Poettering, T. Lloyd, and S. Simons, “Avahi,” 2017. [Online]. Available:
http://avahi.org/
[119] Micro Focus, “ZENworks Endpoint Security Management,” 2017. [Online].
Available: https://www.microfocus.com/products/zenworks/endpoint-security-
management/
[120] S. Kent and K. Seo, “Security Architecture for the Internet Protocol,” RFC 4301,
2005. [Online]. Available: http://www.ietf.org/rfc/rfc4301.txt
106
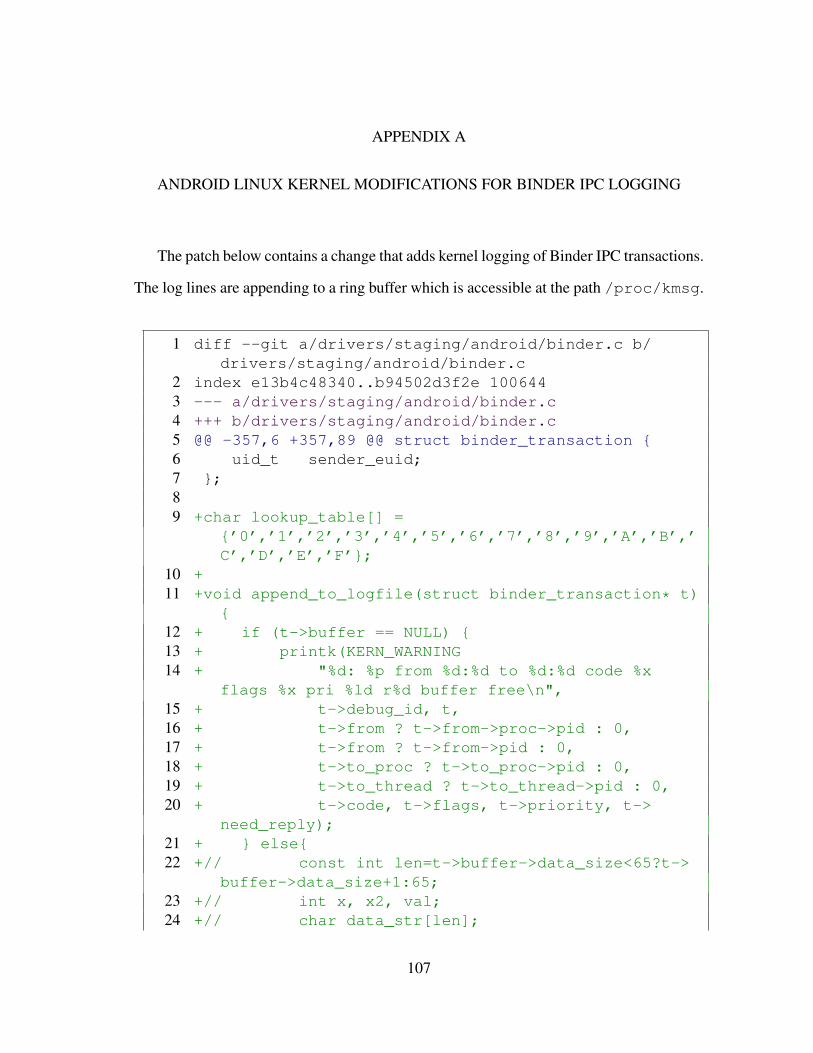
APPENDIX A
ANDROID LINUX KERNEL MODIFICATIONS FOR BINDER IPC LOGGING
The patch below contains a change that adds kernel logging of Binder IPC transactions.
The log lines are appending to a ring buffer which is accessible at the path /proc/kmsg.
1 diff --git a/drivers/staging/android/binder.c b/drivers/staging/android/binder.c
2 index e13b4c48340..b94502d3f2e 1006443 --- a/drivers/staging/android/binder.c4 +++ b/drivers/staging/android/binder.c5 @@ -357,6 +357,89 @@ struct binder_transaction {6 uid_t sender_euid;7 };89 +char lookup_table[] =
{’0’,’1’,’2’,’3’,’4’,’5’,’6’,’7’,’8’,’9’,’A’,’B’,’C’,’D’,’E’,’F’};
10 +11 +void append_to_logfile(struct binder_transaction* t)
{12 + if (t->buffer == NULL) {13 + printk(KERN_WARNING14 + "%d: %p from %d:%d to %d:%d code %x
flags %x pri %ld r%d buffer free\n",15 + t->debug_id, t,16 + t->from ? t->from->proc->pid : 0,17 + t->from ? t->from->pid : 0,18 + t->to_proc ? t->to_proc->pid : 0,19 + t->to_thread ? t->to_thread->pid : 0,20 + t->code, t->flags, t->priority, t->
need_reply);21 + } else{22 +// const int len=t->buffer->data_size<65?t->
buffer->data_size+1:65;23 +// int x, x2, val;24 +// char data_str[len];
107

25 +// x=0;26 +// for(x2=0; x2<len-1; x2+=2){27 +// data_str[x+1]=lookup_table[0x000f & t
->buffer->data[x]];28 +// data_str[x]=lookup_table[0x000f & (t->
buffer->data[x] >> 4)];29 +// x++;30 +// }31 +// data_str[len-1]=0;32 + int str_len = t->buffer->data_size >= t->
buffer->offsets_size+12?*((const uint32_t*)(t->buffer->data+4)):0;
33 + const uint16_t *unicode = (const uint16_t*)(t->buffer->data+t->buffer->offsets_size+8);
34 + int num_unicode=0, x, ind;35 + if(str_len){36 + int offset = ((str_len+1) << 1)+t->
buffer->offsets_size+8;37 + if(t->buffer->data_size<(offset) || t->
buffer->data[offset-1]!=0 ||38 + t->buffer->data[offset-2]!=0){39 + str_len=0;40 + }41 + for (x = 0; x < str_len; x++) {42 + if(unicode[x]>(uint16_t)0x00ff){43 + num_unicode++;44 + }45 + }46 + }47 + const int len = str_len+1+num_unicode*5;48 + char data_str[len];49 + ind=0;50 + for(x = 0; x < str_len; x++) {51 + if(unicode[x]>(uint16_t)0x00ff){52 + data_str[ind ]=’\\’;53 + data_str[ind+1]=’u’;54 + data_str[ind+2]=lookup_table[0x000f
& (unicode[x] >> 12)];55 + data_str[ind+3]=lookup_table[0x000f
& (unicode[x] >> 8)];56 + data_str[ind+4]=lookup_table[0x000f
& (unicode[x] >> 4)];
108

57 + data_str[ind+5]=lookup_table[0x000f& (unicode[x])];
58 + ind+=6;59 + } else {60 + data_str[ind] = (char)(unicode[x]);61 + ind++;62 + }63 + }64 + data_str[len-1] = 0;65 + if (t->buffer->target_node){66 + printk(KERN_WARNING67 + "%d: %p from %d:%d to %d:%d code %x
flags %x pri %ld r%d node %d size %zd:%zd data (%s)\n",
68 + t->debug_id, t,69 + t->from ? t->from->proc->pid : 0,70 + t->from ? t->from->pid : 0,71 + t->to_proc ? t->to_proc->pid : 0,72 + t->to_thread ? t->to_thread->pid :
0,73 + t->code, t->flags, t->priority, t->
need_reply,74 + t->buffer->target_node->debug_id,75 + t->buffer->data_size, t->buffer->
offsets_size,76 + data_str/*t->buffer->data*/);77 + } else {78 + printk(KERN_WARNING79 + "%d: %p from %d:%d to %d:%d code %x
flags %x pri %ld r%d size %zd:%zd data (%s)\n",80 + t->debug_id, t,81 + t->from ? t->from->proc->pid : 0,82 + t->from ? t->from->pid : 0,83 + t->to_proc ? t->to_proc->pid : 0,84 + t->to_thread ? t->to_thread->pid :
0,85 + t->code, t->flags, t->priority, t->
need_reply,86 + t->buffer->data_size, t->buffer->
offsets_size,87 + data_str/*t->buffer->data*/);88 + }
109

89 + }90 +}91 +92 static void93 binder_defer_work(struct binder_proc *proc, enum
binder_deferred_state defer);9495 @@ -1736,6 +1819,9 @@ static void binder_transaction(
struct binder_proc *proc,96 list_add_tail(&t->work.entry, target_list);97 tcomplete->type =
BINDER_WORK_TRANSACTION_COMPLETE;98 list_add_tail(&tcomplete->entry, &thread->todo);99 +
100 + append_to_logfile(t);101 +102 if (target_wait)103 wake_up_interruptible(target_wait);104 return;105 @@ -1763,7 +1849,8 @@ err_bad_call_stack:106 err_empty_call_stack:107 err_dead_binder:108 err_invalid_target_handle:109 -err_no_context_mgr_node:110 +err_no_context_mgr_node:111 + append_to_logfile(t);112 binder_debug(BINDER_DEBUG_FAILED_TRANSACTION,113 "binder: %d:%d transaction failed %d,
size %zd-%zd\n",114 proc->pid, thread->pid, return_error,
Source Code A.1: “android-x86-ics-kernel.patch”
110

APPENDIX B
CODE FOR CREATING A DATABASE OF BINDER TRANSACTION CODES
The first two source files are perquisites and the third source file does the work if
populating a database with the Android binder transaction codes.
1 #!/usr/bin/python2 #sudo pip install --upgrade sqlalchemy sqlalchemy-ext34 import os56 from sqlalchemy import create_engine, MetaData,
Column, ForeignKey, Integer, String7 from sqlalchemy.ext.declarative import
declarative_base8 from sqlalchemy.orm import backref, relationship,
sessionmaker9
10 from xml.sax.saxutils import escape1112 android=’ics’13 android_src_path=’../android-x86-ics’141516 aidl_filename_list=os.path.join(os.path.dirname(
__file__),android,’aidl-list.txt’)17 cpp_filename_list=os.path.join(os.path.dirname(
__file__),android,’aidl-cpp-list.txt’)18 java_filename_list=os.path.join(os.path.dirname(
__file__),android,’aidl-java-list.txt’)1920 # engine = create_engine(’sqlite:///:memory:’, echo=
False)2122 engine = create_engine(’sqlite:///%s/aidl.db’ % (os.
path.join(os.path.dirname(__file__),android)))23 Base = declarative_base()
111

2425 class AndroidInterface(Base):26 __tablename__ = ’aidl_files’2728 id = Column(Integer, primary_key=True)29 name = Column(String)30 filepath = Column(String)31 functions = relationship("InterfaceFunction",
order_by=’InterfaceFunction.code’,32 backref=’function’)3334 def __repr__(self):35 contents = ["<AndroidInterface id=’%s’ name=’%s’
filepath=’%s’>" % (36 str(self.id), escape(self.name), escape(self.
filepath))]37 for function in self.functions:38 contents.append(’ ’+function.__repr__())39 contents.append("</AndroidInterface>")40 return ’\n’.join(contents)4142 class InterfaceFunction(Base):43 __tablename__ = ’function’4445 id = Column(Integer, primary_key=True)46 code = Column(Integer)47 name = Column(String)4849 interface_id = Column(Integer, ForeignKey(’
aidl_files.id’))50 interface = relationship("AndroidInterface",
backref=backref(’function’, order_by=code))5152 def __repr__(self):53 return "<InterfaceFunction id=’%s’ code=’%x’ name
=’%s’ interface=’%s’ />" % (54 str(self.id), self.code, escape(self.name), str
(self.interface_id) )5556 def reset_database():57 meta = MetaData(engine)58 meta.reflect()
112
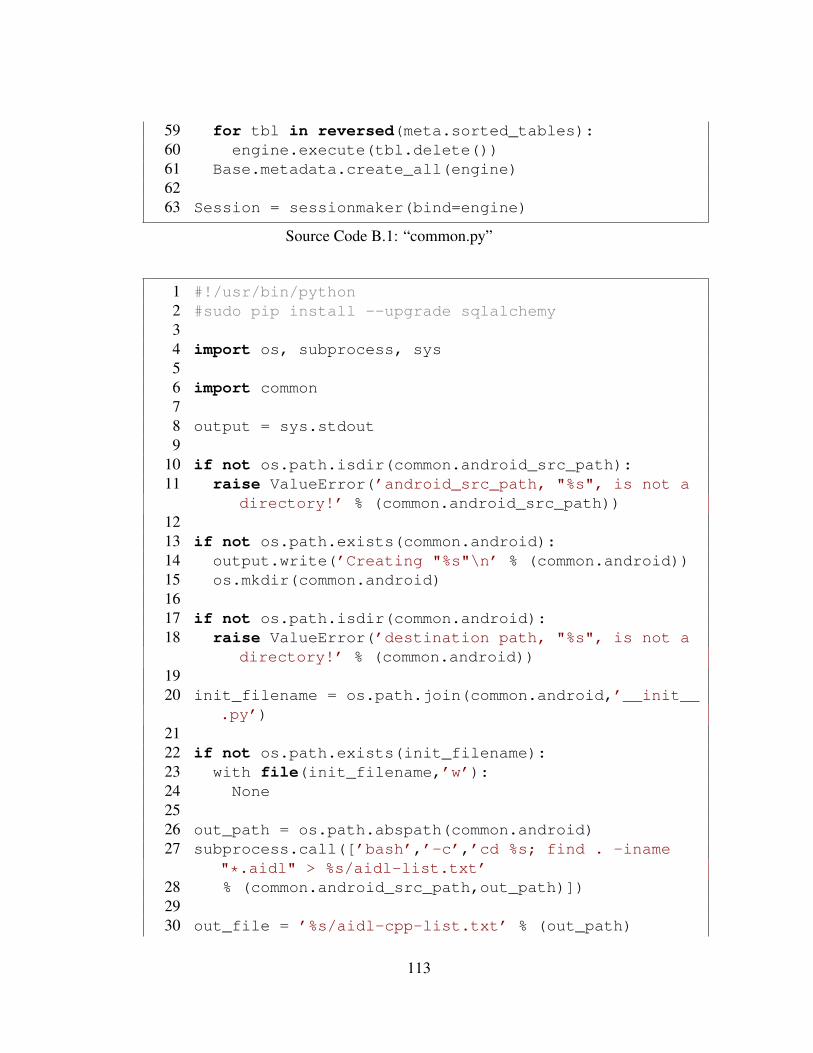
59 for tbl in reversed(meta.sorted_tables):60 engine.execute(tbl.delete())61 Base.metadata.create_all(engine)6263 Session = sessionmaker(bind=engine)
Source Code B.1: “common.py”
1 #!/usr/bin/python2 #sudo pip install --upgrade sqlalchemy34 import os, subprocess, sys56 import common78 output = sys.stdout9
10 if not os.path.isdir(common.android_src_path):11 raise ValueError(’android_src_path, "%s", is not a
directory!’ % (common.android_src_path))1213 if not os.path.exists(common.android):14 output.write(’Creating "%s"\n’ % (common.android))15 os.mkdir(common.android)1617 if not os.path.isdir(common.android):18 raise ValueError(’destination path, "%s", is not a
directory!’ % (common.android))1920 init_filename = os.path.join(common.android,’__init__
.py’)2122 if not os.path.exists(init_filename):23 with file(init_filename,’w’):24 None2526 out_path = os.path.abspath(common.android)27 subprocess.call([’bash’,’-c’,’cd %s; find . -iname
"*.aidl" > %s/aidl-list.txt’28 % (common.android_src_path,out_path)])2930 out_file = ’%s/aidl-cpp-list.txt’ % (out_path)
113

31 if os.path.isfile(out_file):32 os.unlink(out_file)33 subprocess.call([’bash’,’-c’,’cd %s; find . -iname
"*.cpp" -print0 | xargs -0 -n1 -P8 grep -l "IBinder::FIRST_CALL_TRANSACTION" >> %s’
34 % (common.android_src_path,out_file)])3536 out_file = ’%s/aidl-java-list.txt’ % (out_path)37 if os.path.isfile(out_file):38 os.unlink(out_file)39 subprocess.call([’bash’,’-c’,’cd %s; find . -iname
"*.java" -not -path "./out/*" -print0 | xargs -0 -n1 -P8 grep -l "IBinder.FIRST_CALL_TRANSACTION" >>%s’
40 % (common.android_src_path,out_file)])4142 import generate_add_custom_file43 with open(os.path.join(out_path,’custom.py’),’w’) as
out_file:44 generate_add_custom_file.output = out_file45 generate_add_custom_file.generate_add_custom_file()
Source Code B.2: “do_setup.py”
1 #!/usr/bin/python2 #sudo pip install --upgrade sqlalchemy34 import importlib, os, re, sys56 import common7 custom = importlib.import_module(’%s.custom’ % (
common.android))89 #setup filename lists
10 aidl_filenames=[]1112 with open(common.aidl_filename_list) as f:13 aidl_filenames = f.readlines()1415 #regular expressions16 whitespace = re.compile(’\\s+’,re.MULTILINE)
114
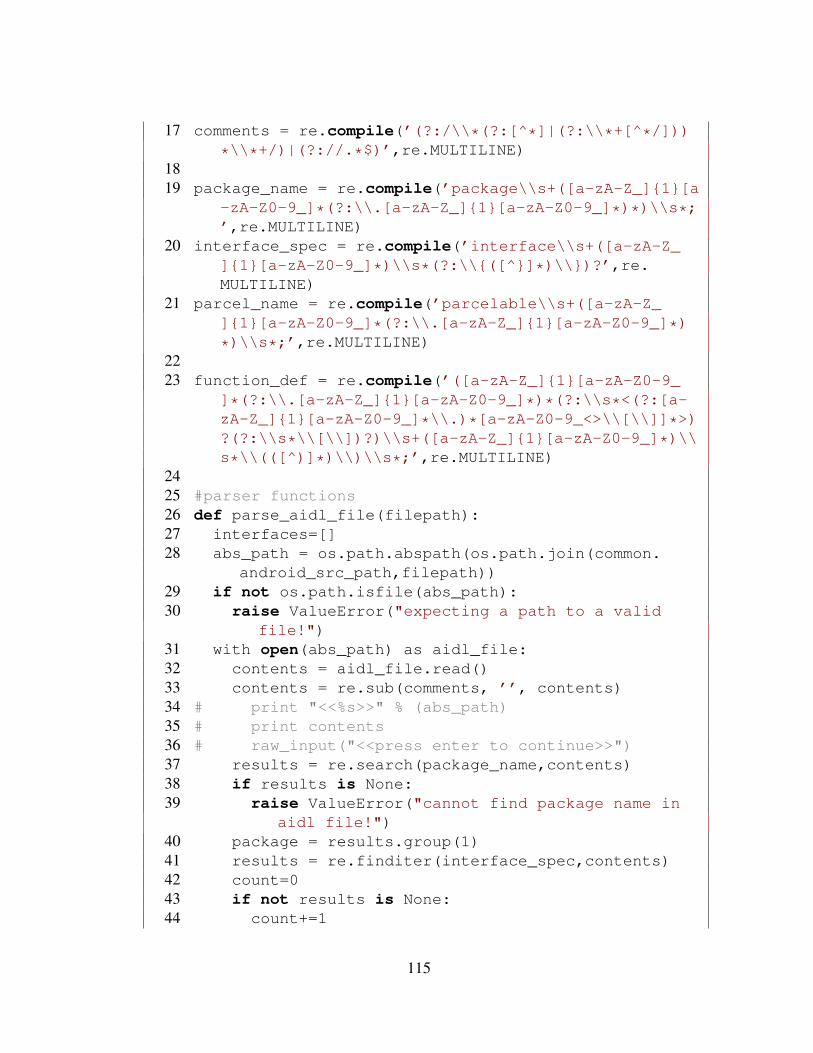
17 comments = re.compile(’(?:/\\*(?:[^*]|(?:\\*+[^*/]))
*\\*+/)|(?://.*$)’,re.MULTILINE)1819 package_name = re.compile(’package\\s+([a-zA-Z_]{1}[a
-zA-Z0-9_]*(?:\\.[a-zA-Z_]{1}[a-zA-Z0-9_]*)*)\\s*;’,re.MULTILINE)
20 interface_spec = re.compile(’interface\\s+([a-zA-Z_]{1}[a-zA-Z0-9_]*)\\s*(?:\\{([^}]*)\\})?’,re.MULTILINE)
21 parcel_name = re.compile(’parcelable\\s+([a-zA-Z_]{1}[a-zA-Z0-9_]*(?:\\.[a-zA-Z_]{1}[a-zA-Z0-9_]*)
*)\\s*;’,re.MULTILINE)2223 function_def = re.compile(’([a-zA-Z_]{1}[a-zA-Z0-9_
]*(?:\\.[a-zA-Z_]{1}[a-zA-Z0-9_]*)*(?:\\s*<(?:[a-zA-Z_]{1}[a-zA-Z0-9_]*\\.)*[a-zA-Z0-9_<>\\[\\]]*>)?(?:\\s*\\[\\])?)\\s+([a-zA-Z_]{1}[a-zA-Z0-9_]*)\\s*\\(([^)]*)\\)\\s*;’,re.MULTILINE)
2425 #parser functions26 def parse_aidl_file(filepath):27 interfaces=[]28 abs_path = os.path.abspath(os.path.join(common.
android_src_path,filepath))29 if not os.path.isfile(abs_path):30 raise ValueError("expecting a path to a valid
file!")31 with open(abs_path) as aidl_file:32 contents = aidl_file.read()33 contents = re.sub(comments, ’’, contents)34 # print "<<%s>>" % (abs_path)35 # print contents36 # raw_input("<<press enter to continue>>")37 results = re.search(package_name,contents)38 if results is None:39 raise ValueError("cannot find package name in
aidl file!")40 package = results.group(1)41 results = re.finditer(interface_spec,contents)42 count=043 if not results is None:44 count+=1
115

45 for result in results:46 name = result.group(1)47 interface_dbo = common.AndroidInterface(name=
"%s.%s" % (package,name),filepath=filepath)
48 num_sresults=049 if not result.group(2) is None:50 sub_results = re.finditer(function_def,
result.group(2))51 if not sub_results is None:52 for sub_result in sub_results:53 num_sresults+=154 interface_dbo.functions.append(common.
InterfaceFunction(name=re.sub(whitespace,’ ’,sub_result.group(0)),code=num_sresults))
55 # print " %s" % (sub_result.group(0))56 num_scolon=result.group(2).count(’;’)57 if num_sresults!=num_scolon:58 print "Warning: %d functions found, but %
d semicolons in interface definition."% (num_sresults,num_scolon)
59 print " in: %s interface %s" % (abs_path,name)
60 # print result.group(2)61 else:62 print "Warning interface %s.%s empty!" % (
package, name)63 print "%s.%s (%d)" % (package, name,
num_sresults)64 # print "<<%s>>" % (abs_path)65 # print result.group(2)66 # raw_input("<<press enter to continue>>")67 interfaces.append(interface_dbo)68 results = re.finditer(parcel_name,contents)69 if not results is None:70 count+=171 for result in results:72 name = result.group(1)73 print "%s.%s (parcelable)" % (package, name)
116

74 interfaces.append(common.AndroidInterface(name="%s.%s" % (package,name),filepath=filepath))
75 if count==0:76 print "Warning didn’t find any interfaces in: "
+ abs_path77 return interfaces7879 common.reset_database()80 custom.addCustom(common)81 for aidl_file in aidl_filenames:82 try:83 session = common.Session()84 interfaces = parse_aidl_file(aidl_file.strip())85 for interface in interfaces:86 session.add(interface)87 # print interface88 session.commit()89 except ValueError as ve:90 print "%s: %s" % (aidl_file.strip(),ve.message)
Source Code B.3: “populate_database.py”
117