addressing risk factors for noncommunicable diseases among
TRANSCRIPT

I N F O R M | E M P O W E R | A D VA N C E | w w w. p r b . o r g
Addressing Risk Factors for Noncommunicable Diseases Among Young People in Africa: Key To Prevention and Sustainable Development
P O P U L A T I O N R E F E R E N C E B U R E A U

© 2015 Population Reference Bureau See notes on page 11 NONCOMMUNICABLE DISEASES AMONG YOUNG PEOPLE IN AFRICA 2
Less than 25%25% to 34%35% to 49%50% to 74%*75% or moreData not available
The POPULATION REFERENCE BUREAU informs people around the
world about population, health, and the environment, and empowers them to
use that information to advance the well-being of current and future generations.
INFORMPRB informs people around the world and in the United States about issues related to population, health, and the environment. To do this, we transform technical data and research into accurate, easy-to-understand information.
EMPOWERPRB empowers people—researchers, journalists, policymakers, and educators—to use information about population, health, and the environment to encourage action.
ADVANCEPRB works to advance the well-being of current and future generations. Toward that end, we analyze data and research, disseminate information, and empower people to use that information in order to inform policymaking.
Note: This data sheet accompanies the policy brief entitled Noncommunicable Diseases in Africa: Youth Are Key to Curbing the Epidemic and Achieving Sustainable Development. The data sheet is accompanied by a data appendix that provides all available country-specifi c data and data sources on four key noncommunicable (NCD) risk factors among young people in Africa since 2004. These publications extend an earlier publication, Noncommunicable Diseases Risk Factors Among Young People in Africa: Data Availability and Sources. All are available at www.prb.org/Publications/Datasheets/2015/ncd-risk-youth-africa.aspx.
Technical Notes
This data sheet lists all countries in North and sub-Saharan Africa with populations of 150,000 or more and all members of the UN. Countries with unavailable data for most indicators are, however, excluded.
NCD Risks. The data sheet focuses on four specifi c behaviors—tobacco use, harmful use of alcohol, physical inactivity, and unhealthy diet—identifi ed by the World Health Organization to be key NCD risk factors. Data availability on these risk factors among young people is limited in Africa. Available data are typically not directly comparable across a large number of countries. They may measure the levels of risk using different indicators, at different geographic levels (national, regional), for different age groups, and from different settings (all youth, youth in schools). To facilitate the cross-country comparison of risk levels and to focus attention on the broader picture, the risk levels are presented here as high (red), medium (yellow), or low (green).
Risk levels are assessed by fi rst identifying the core indicator for each risk factor that is suitable and for which data are consistently available for the largest number of countries. For countries with data on the core indicators, both risk levels and data points are presented. For countries without data on the core indicators, only risk levels are presented. These levels are based on alternative indicators or data that are otherwise not directly comparable (such as different
age groups, indicator defi nitions) but that still enable assessment of risk levels using similar standards. All data points underlying risk levels and the data sources are available for each risk factor per country in the data appendix accessible at www.prb.org/Publications/Datasheets/2015/ncd-risk-youth-africa.aspx.
The risk levels are assessed using the standards described below under each risk factor. Due to the lack of preexisting standards to assess population-level risks for these behaviors, cut-offs were developed for each risk factor based on a review of previous literature (see www.prb.org/Publications/Reports/2014/ncd-risk-youth-africa.aspx). The standards were adjusted up or down to determine the risk levels when the indicator differed from the ones specifi ed here. Data on any age groups between ages 10 and 24 from 2004 or later are considered in the coding. Data points rounded to their nearest integers are used for coding risk levels. Because well-documented sex differences exist for the prevalence for all risk factors, the risk levels are coded by sex when possible.
Tobacco Use. The core indicators are the percent reporting use in the past 30 days of each of the following: cigarettes, other tobacco products, and any tobacco products among 13-to-15-year-old students available in Global Youth Tobacco Survey (World Health Organization (WHO) and U.S. Centers for Disease Control and Prevention (CDC)) and Global School-Based Student Health Survey (GSHS) (WHO and CDC). The standard used for coding is high ≥ 16%; medium = 7%-15%; and low < 7%.
Alcohol Use. The core indicator is the percent reporting any alcohol use in the past 30 days among 13-to-15-year-old students available in GSHS (WHO and CDC). The standard used for coding is high ≥ 40%; medium = 20%-39%; and low < 20%. We use any amount of alcohol use instead of harmful use, since any amount of drinking presents risk among youth both because of the greater health impact of alcohol on young people and the link between the age of onset and likelihood of lifetime alcohol dependency.
Physical Inactivity. The core indicator is the per-cent reporting not engaging in any type of physical activity for at least 60 minutes a day for fi ve days in the past seven days among 13-to-15-year-old students available from GSHS (WHO and CDC). The standard used for coding is high ≥ 70%; medium = 50%-69%; and low < 50%. Surveys usually report physical activity levels rather than inactivity levels, so data used and presented here are 100 percent minus the percent reported to be physically active. In some countries, the measure pertains to the activity level in seven out of the past seven days. For those countries, the standards used to code risk levels were adjusted.
Overweight/Obesity (Unhealthy Diet). The core indicator is the percent reporting overweight or obese among 15-to-19-year-olds available in Demographic and Health Surveys. The standard used for coding is high ≥ 20%; medium = 10%–19%; and low < 10%. The overweight/obesity measure is used as a proxy for unhealthy diet due to the scarcity of comparable data on dietary intake to assess nutrition levels across countries. Overweight/obesity is a physiological change resulting from high caloric consumption and physical inactivity and is assessed with the Body Mass Index (BMI), a measure of weight relative to height. The BMI levels used to classify overweight/obese status vary somewhat across surveys and are specifi ed in the data appendix.
Data Sources
Population and Youth
Carl Haub and Toshiko Kaneda, 2014 World Population Data Sheet (Washington, DC: Population Reference Bureau, 2014).
UN Population Division, World Population Prospects: The 2012 Revision (New York: UN, 2013).
UNESCO Institute for Statistics, online database, accessed at www.uis.unesco.org/Pages/default.aspx.
World Bank, “World Development Indicators,” online database, accessed at http://data.worldbank.org/data-catalog/world-development-indicators.
NCD Mortality
World Health Organization (WHO), World Health Statistics 2014 (Geneva: WHO, 2014).
WHO, Noncommunicable Diseases Country Profi les 2014 (Geneva: WHO, 2014).
NCD Risk Factor Among Youth
WHO and U.S. Centers for Disease Control and Prevention (CDC), Global School-Based Student Health Surveys, accessed at www.who.int/chp/gshs/en/.
WHO and CDC, Global Youth Tobacco Surveys, accessed at http://nccd.cdc.gov/GTSSData/Ancillary/DataReports.aspx?CAID=1.
ICF International, Demographic and Health Surveys, accessed at www.dhsprogram.com.
WHO, STEPwise Approach to Chronic Disease Risk Factor Surveillance (STEPS), accessed at www.who.int/chp/steps/en/.
Various other country-specifi c surveys (see the data appendix for a list of full citations).
Noncommunicable Diseases Are Becoming Leading Cause of Death Throughout Africa
In most countries in North Africa, noncommunicable diseases (NCDs) are already responsible for more than three-quarters of all deaths. In sub-Saharan Africa, where communicable diseases and other health challenges still predominate, NCDs account for more than 25 percent of deaths in 80 percent of the countries. By 2030, NCDs will be the leading cause of death even in sub-Saharan Africa. In low- and middle-income countries a greater share of NCD deaths occur prematurely among people ages 30-70 who are often at the peak of their economic productivity (see “Probability of Premature Death From NCDs Between Ages 30-70, 2012” in the data table). The growing NCD epidemic represents a signifi cant socioeconomic cost to society, due in large part to declines in productivity and increases in health care expenses.
Sources: World Health Organization (WHO), Noncommunicable Diseases Country Profi les 2014 (Geneva: WHO, 2014); and WHO, Global Status Report on Noncommunicable Diseases 2010 (Geneva: WHO, 2010).
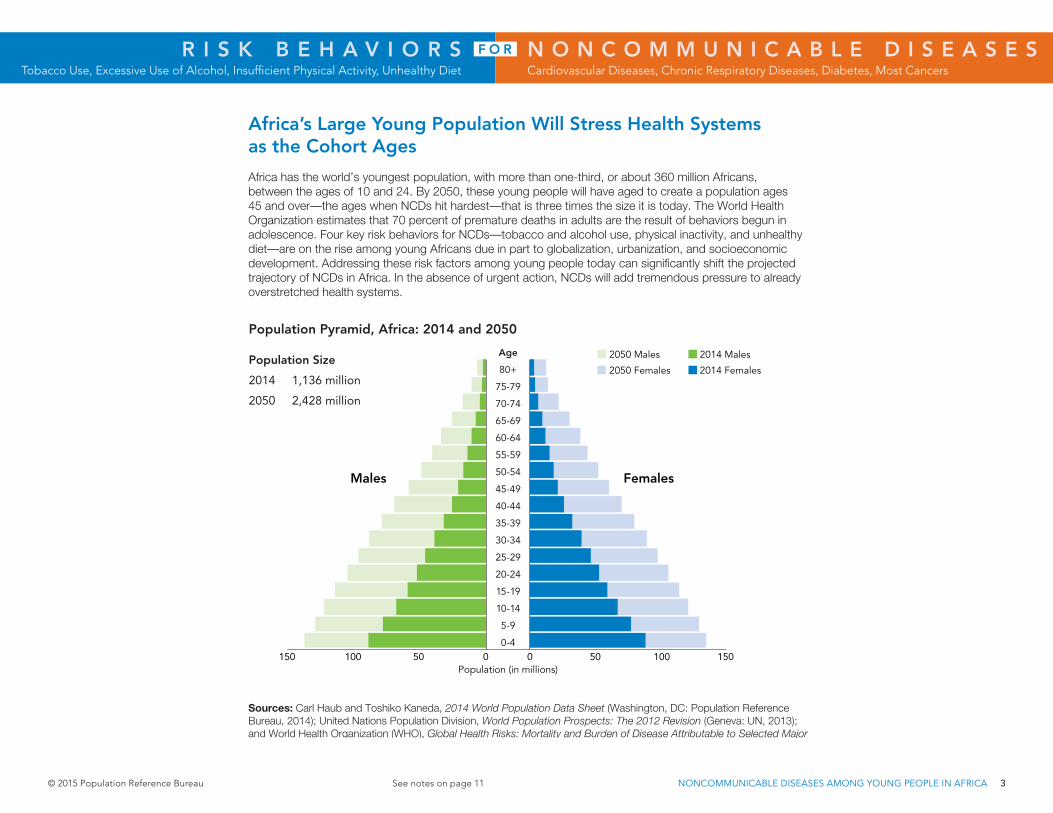
Africa’s Large Young Population Will Stress Health Systems as the Cohort Ages
Africa has the world’s youngest population, with more than one-third, or about 360 million Africans, between the ages of 10 and 24. By 2050, these young people will have aged to create a population ages 45 and over—the ages when NCDs hit hardest—that is three times the size it is today. The World Health Organization estimates that 70 percent of premature deaths in adults are the result of behaviors begun in adolescence. Four key risk behaviors for NCDs—tobacco and alcohol use, physical inactivity, and unhealthy diet—are on the rise among young Africans due in part to globalization, urbanization, and socioeconomic development. Addressing these risk factors among young people today can signifi cantly shift the projected trajectory of NCDs in Africa. In the absence of urgent action, NCDs will add tremendous pressure to already overstretched health systems.
Tobacco Use Varies Across Africa, But Sex Difference NarrowingTobacco use is the single most preventable cause of disease, disability, and death in the world. More than 40 million people smoke in Africa. Africans are using more tobacco and are starting to smoke at younger ages, increasing their exposure to and risk for NCDs. About one in 10 adolescents in Africa smokes cigarettes and the same proportion uses other tobacco products (chewing tobacco, snuff, pipes). However, substantial variation exists across countries in levels and types of tobacco products used. For example, cigarettes dominate overall tobacco use in Côte d’Ivoire, South Africa, and Tunisia, while in Zambia, Uganda, and Morocco, the vast majority of overall use comes from products other than cigarettes. About a quarter of 13-to-15-year-old boys in Côte d’Ivoire, Zambia (also girls), and South Africa are regular tobacco users (used any tobacco products in the past 30 days). Tobacco use also tends to coexist with alcohol use, another key risk factor for NCDs. Tobacco use has been typically higher among young men in Africa, but in many countries, young women are catching up.
Sources: World Health Organization and Centers for Disease Control and Prevention, Global Youth Tobacco Survey, accessed at http://nccd.cdc.gov/gtssdata/Ancillary/DataReports.aspx?CAID=1; and Patricio Marquez and Jill Farrington, The Challenge of Non-Communicable Diseases and Road Traffi c Injuries in Sub-Saharan Africa: An Overview (Washington, DC: The World Bank, 2013).
Sources: Carl Haub and Toshiko Kaneda, 2014 World Population Data Sheet (Washington, DC: Population Reference Bureau, 2014); United Nations Population Division, World Population Prospects: The 2012 Revision (Geneva: UN, 2013); and World Health Organization (WHO), Global Health Risks: Mortality and Burden of Disease Attributable to Selected Major Risks (Geneva: WHO, 2009).
I N F O R M | E M P O W E R | A D VA N C E | w w w. p r b . o r g
POPULATION REFERENCE BUREAU
Percent of Deaths Due To Noncommunicable Diseases by Country, 2012
1875 Connecticut Ave., NW, Washington, DC 20009 USA
tel. 202-483-1100 | fax [email protected] | www.prb.org
PRB on: @PRBdata
ACKNOWLEDGMENTSThis data sheet was produced by Toshiko Kaneda, Ph.D., senior research associate at the Population Reference Bureau (PRB) and Reshma Naik, Dr.P.H., senior policy analyst at PRB. Wendy Baldwin, independent consultant, contributed to the preliminary work on this data sheet. Special thanks to Jeffrey Jordan, Susan Rich, and Carl Haub at PRB; Derek Yach at the Vitality Institute; and Francisco Sierra and Sarah Shillito at AstraZeneca Young Health Programme for their insightful review and helpful comments. The authors also thank interns Marisha Wickremsinhe, Sharee Pearson, Adaeze Exeofor, Heather Zaccaro, and Adrianna Zinn for their assistance with data.© 2015 Population Reference Bureau. All rights reserved.Photo credit, cover: © Sean Sprague / Alamy
Tobacco Use, Excessive Use of Alcohol, Insuffi cient Physical Activity, Unhealthy Diet
N O N C O M M U N I C A B L E D I S E A S E SR I S K B E H A V I O R SCardiovascular Diseases, Chronic Respiratory Diseases, Diabetes, Most Cancers
F O R
Males Females
Population (in millions)150 100 50 0 0 50 100 150
Age
80+
75-79
70-74
65-69
60-64
55-59
50-54
45-49
40-44
35-39
30-34
25-29
20-24
15-19
10-14
5-9
0-4
2050 Males
2050 Females
2014 Males
2014 Females
21
6 6 6
1511 12
2 5 5 3 2
5
5
19 20
9
8 8
2
14 11
8
5
M F M F M F M F M F M F
Côte d’Ivoire(2009)
Zambia(2011)
South Africa(2011)
Tunisia (2010)
Uganda(2011)
Morocco(2010)
Use of other tobacco products (no cigarettes)
Cigarette smoking (possibly with use of other tobacco products)
26
11
4
19
16
11
7
2019
242625
Population and Youth NCD Mortality NCD Risk Factors Among Youth
Mid-Year Population (millions)
Youth Ages 10-24,
Percent of Population,
2014
Percent Enrolled in Secondary School
(Gross Enrollment Ratio), 2005/2014
Percent of Total
Population Living
in Urban Areas, 2014
GNI per Capita, PPP
(Current International $),
2013
Age-Standardized Death Rate
for All NCDs (per 100,000),
2012
Percent of Total Deaths
due to NCDs, 2012
Probability of Premature
Death From NCDs
Between Ages 30-70,
2012
Current Tobacco Use
Current Alcohol Use Physical Inactivity Overweight or Obese10Cigarettes Other Products Any Products
2014 2050 Male Female Male Female Male Female Male Female Year Male Female Year Male Female Year Male Female Year
NORTHERN AFRICA NORTHERN AFRICA
Algeria 39.1 60.3 25 96 100 70 13,070 710 77 22 18 1 9 1 21 2 2011 - - -† 69 89 2011 2011 Algeria
Egypt 87.9 146.0 28 87 85 43 10,790 782 85 25 6 1 6 2 9 3 2011 2005 77 90 2011 2011 Egypt
Libya 6.3 8.4 26 96 113 78 - 550 78 18 6 2 8 4 11 5 2010 - - -† - - - 2007 Libya
Morocco 33.3 41.4 27 74 63 60 7,000 708 75 23 3 2 11 6 11 7 2010 - - -† 79 87 2010 2010 Morocco
Sudan 38.8 77.1 32 43 39 34 3,230 551 34 17 9 4 7 5 13 8 2012 - - -† 89 89 2012 2012 Sudan
Tunisia 11.0 13.1 23 89 93 67 10,610 509 82 17 12 2 12 3 20 4 2010 - - -† 74 89 200814 2005 Tunisia
WESTERN AFRICA WESTERN AFRICA
Benin 10.3 21.5 32 65 43 44 1,780 761 36 22 3 2 5 2 5 2 2009 18 13 2009 67 75 2009 - 12 2011-2012 Benin
Burkina Faso 17.9 46.6 33 31 26 29 1,440 784 32 24 14 2 9 5 20 7 2006* - - - - - - - 5 2010 Burkina Faso
Cape Verde 0.5 0.7 32 86 100 65 6,210 482 69 15 4 3 12 9 15 12 2007 - - - - - - - - - Cape Verde
Côte d’Ivoire 20.8 42.3 32 46 32 53 3,090 794 31 23 21 6 10 7 26 11 2009 - - - 2005 - 10 2011-2012 Côte d’Ivoire
The Gambia 1.9 4.9 32 59 56 59 1,610 630 32 19 13 9 30 34 34 37 2008* - - - - - - - - - The Gambia
Ghana 27.0 52.6 31 69 65 53 3,900 670 42 20 9 7 - - - - 2012 18 13 2012 84 84 2012 2012 Ghana
Guinea 11.6 23.9 32 47 29 37 1,160 681 31 21 12 2 23 19 31 20 2008 - - - - - - - 8 2012 Guinea
Guinea-Bissau 1.7 3.5 32 - - 49 1,410 765 28 22 7 3 5 8 12 10 2008* - - - - - - - - - Guinea-Bissau
Liberia 4.4 9.4 32 42 33 49 790 657 34 21 2 1 - - 14 12 2008* - - - - - - 10 7 2013 Liberia
Mali 15.9 45.6 32 50 40 39 1,540 866 31 26 17 3 11 7 23 9 2008 - - - - - - - 7 2012-2013 Mali
Mauritania 4.0 7.9 31 30 29 59 2,850 555 32 16 17 17 19 17 25 23 2010 - - -† 79 89 2010 2010 Mauritania
Niger 18.2 68.0 31 19 13 18 890 649 25 20 12 1 6 7 15 8 2006 2007 2007 - 5 2012 Niger
Nigeria 177.5 396.5 31 46 41 47 5,360 674 24 20 6 1 17 11 19 11 2008* (2013)5 (2010)8 - 6 2013 Nigeria
Senegal 13.9 35.1 32 43 39 43 2,210 558 34 17 12 3 12 8 20 10 2007 4 2 2005 85 94 2005 0 7 2010-2011 Senegal
Sierra Leone 6.3 10.5 32 48 42 40 1,690 964 26 27 7 5 17 22 20 24 20081 - - - - - - 3 8 2013 Sierra Leone
Togo 7.0 14.5 32 58 30 39 1,180 679 30 20 9 2 12 7 18 8 2007 2010# 2010# 2010 Togo
EASTERN AFRICA EASTERN AFRICA
Burundi 10.5 26.7 31 37 29 12 770 729 28 24 6 3 17 14 21 17 2008 - - - - - - - 6 2010 Burundi
Comoros 0.7 1.3 30 63 65 28 1,490 695 37 23 14 7 13 10 22 15 2007 - - - - - - - 14 2012 Comoros
Djibouti 0.9 1.2 30 53 43 77 - 631 36 19 4 3 11 6 13 7 2007 - - -† 81 91 2007 2007 Djibouti
Eritrea 6.5 14.3 31 - - 22 1,180 672 37 24 2 1 6 4 8 5 2006 2004 - - - 2004 Eritrea
Ethiopia 95.9 165.1 35 35 22 19 1,380 476 30 15 - - - - 20102,# 20102,# 20129,# 0 2 2011 Ethiopia
Kenya 43.2 81.3 32 69 65 25 2,780 515 27 18 2012# 2012# (2014)* - 9 2008-2009 Kenya
Madagascar 22.4 52.8 33 39 38 34 1,370 649 39 23 31 10 9 6 33 14 2008 (2013)6 - - - - 1 2008-2009 Madagascar
Malawi 16.8 41.2 33 38 35 16 750 655 28 19 6 4 8 5 10 6 2009 5 3 2009 - - - - 7 2010 Malawi
Mauritius 1.3 1.2 23 94 98 40 17,220 577 85 24 23 9 12 5 25 10 2011 28 22 2011 59 76 2011 2011 Mauritius
Mozambique 25.1 63.5 33 27 25 32 1,100 594 23 17 5 1 10 7 13 7 2007* - - - - - - - 7 2011 Mozambique
Rwanda 11.1 21.0 33 31 34 28 1,450 585 36 19 3 1 12 9 13 10 2008 - - - - - - 0 11 2010 Rwanda
Seychelles 0.1 0.1 22 79 80 54 23,730 - - - 23 20 11 9 27 25 2007 62 61 2007 76 86 200714 2007 Seychelles
Somalia 10.8 27.1 33 10 5 39 - 551 19 19 9 15 15 15 19 22 2004 - - - - - - - - - Somalia
South Sudan 11.7 39.3 33 - - 19 1,860 623 - - - - - - - - - - - - - - - - - - South Sudan
Tanzania 50.8 129.4 32 34 32 31 1,760 570 31 16 5 1 6 5 10 5 20083 7 5 20063 69 80 20063 - 9 2010 Tanzania
Uganda 38.8 104.1 34 29 25 16 1,470 664 27 21 5 5 18 14 19 16 2011 - - - - - - 1 12 2011 Uganda
Zambia 15.1 49.2 33 - - 40 3,810 587 23 18 6 6 24 24 25 26 2011 39 45 2004 90 90 2004 - 8 2007 Zambia
Zimbabwe 14.7 30.2 34 48 47 33 1,690 599 31 19 5 2 11 8 15 8 2008* - - - - - - 1 13 2010-2011 Zimbabwe
MIDDLE AFRICA MIDDLE AFRICA
Angola 22.4 60.8 33 38 25 43 7,000 768 24 24 - - - - - - - - - - - - - - - - Angola
Cameroon 22.8 54.3 33 54 46 54 2,770 675 31 20 9 3 12 7 17 10 20084 - - - - - - - 16 2011 Cameroon
Central African Republic 4.8 9.7 33 24 12 40 600 551 20 18 10 4 24 31 30 35 2008* - - - - - - - - - Central African Republic
Chad 13.3 37.4 33 31 14 22 2,010 713 21 23 8 4 17 12 21 14 2008 - - - - - - - 4 2004 Chad
Congo 4.6 10.6 31 57 50 65 4,600 632 30 20 15 8 16 18 26 22 2006 - - - - - - - 6 2011-2012 Congo
Congo, Dem. Rep. 71.2 193.6 33 54 32 42 740 724 23 24 12 4 29 28 37 29 2008* 2004-20067 2005 - 8 2013-2014 Congo, Dem. Rep.
Equatorial Guinea 0.8 1.6 30 33 24 40 23,270 729 31 23 10 3 20 15 25 17 2008 - - - - - - 5 17 2011 Equatorial Guinea
Gabon 1.7 3.3 31 - - 87 17,230 505 36 15 - - - - 2009 - - - - - - - 16 2012 Gabon
Sao Tome and Principe 0.2 0.4 31 76 85 65 2,950 - - - 6 3 30 22 31 23 2010 - - - - - - - 13 2008-2009 Sao Tome and Principe
SOUTHERN AFRICA SOUTHERN AFRICA
Botswana 2.0 2.8 33 79 84 57 15,640 612 37 21 13 5 16 14 23 16 2008 23 19 2005 87 90 2005 - - - Botswana
Lesotho 1.9 2.7 35 45 62 27 3,160 672 27 24 12 8 20 18 26 22 2008 - - - - - - 1 20 2009 Lesotho
Namibia 2.3 3.7 33 60 70 46 9,490 580 43 20 10 6 - - 14 9 2013 26 21 2013 85 86 2013 2013 Namibia
South Africa 53.7 64.1 27 107 114 64 12,240 711 43 27 15 11 14 13 24 19 2011 2011 2008 2011 South Africa
Swaziland 1.3 1.8 35 61 60 21 6,060 702 28 21 9 3 9 7 15 9 2005 - - - - - - 2013 Swaziland
This data sheet was funded by the AstraZeneca Young Health Programme (YHP). YHP is a partnership among AstraZeneca, Johns Hopkins Bloomberg School of Public Health, and Plan International, with local NGO partners also implementing YHP programs on the ground. The YHP mission is to positively impact the health of adolescents in marginalized communities worldwide through research, advocacy, and on-the-ground programs focused on NCD prevention.
www.younghealthprogrammeyhp.com
Many Countries Face the Double Burden of Overnutrition and Undernutrition Sub-Saharan Africa is undergoing a nutrition transition, with overweight and obesity emerging as critical public health issues even in some countries where undernutrition is still a big problem. Among 15-to-19-year-old girls in Benin, Rwanda, Uganda, and Zimbabwe, approximately one in eight girls are overweight or obese, whereas about one in seven girls are underweight. Girls are often more likely than boys to be overweight or obese. Urbanization and globalization have led to more sedentary lifestyles and to high-calorie diets fi lled with highly processed foods that are low in fruits and vegetables, and high in saturated fat, sodium, and sugar. These shifts in diet and exercise patterns are leading to a rise in NCDs such as type 2 diabetes, cardiovascular disease, stroke, and certain cancers.
Source: ICF International, Demographic and Health Surveys, accessed at www.dhsprogram.com.
Overweight or obese Underweight
13
14
13
14
17
10
12
11
12
12
13
16
16
20
Rwanda (2010)
Uganda (2011)
Benin (2011-2012)
Zimbabwe (2010-2011)
Gabon (2012)
Cameroon (2011)
Lesotho (2009) 32
26
33
27
25
26
24
Percent of Women 15-19 Years Old Who Are Overweight/Obese or Underweight, Select CountriesPopulation Pyramid, Africa: 2014 and 2050
Population Size
2014 1,136 million
2050 2,428 million
Percent of Boys and Girls 13-15 Years Old in Secondary Schools Who Used Tobacco Products in the Past 30 Days, Select Countries
Addressing Risk Factors for Noncommunicable Diseases Among Young People in Africa: Key To Prevention and Sustainable Development
*Includes only Cape Verde, 69 percent.
Current Tobacco UsePercent using cigarettes/other tobacco products/any products in the past 30 days among 13-15-year-old
secondary school students11
16% or Above 7% to 15% Below 7%
Current Alcohol UsePercent having any drinks with alcohol in the past 30 days
among 13-15-year-old secondary school students12
40% or Above 20% to 39% Below 20%
Physical InactivityPercent not engaging in physical activity for at least 60 min/day on fi ve out of the last seven days among
13-15-year-old secondary school students12
70% or Above 50% to 69% Below 50%
Overweight or ObesePercent who are overweight or obese
among 15-19-year-olds13
20% or Above 10% to 19% Below 10%
Definition of Risk Levels
High Risk Medium Risk Low Risk
Notes:Data points for the risk factors appear for countries with comparable data available from the following surveys: Global Youth Tobacco Survey and Global School-Based Student Health Survey for tobacco use, Global School-Based Student Health Survey for both alcohol use and physical inactivity, and Demographic and Health Surveys for overweight status. For the countries without data from these surveys, data from other sources were used whenever possible to assess risk levels. Only the colors showing risk levels are displayed for these countries. Data points underlying all risk levels are available in the data appendix at http://www.prb.org/Publications/Datasheets/2015/ncd-risk-youth-africa.aspx.
Data in italics are based on samples from the following cities/regions and are not nationally representative.
* National capital1 Western Area2 Harar Town3 Dar es Salaam4 Central District5 Ibadan6 Six largest urban cities7 All provincial capital cities8 Abeokuta9 Hawassa City
10 Proxy for unhealthy diet11 Based on the Global Youth Tobacco Survey and the Global
School-Based Student Health Survey12 Based on the Global School-Based Student Health Survey13 Based on the Demographic and Health Survey14 Risk level for male was coded as yellow instead of red because
the measure pertains to physical inactivity level in seven out of the last seven days in this country
† Countries where Global School-Based Student Health Survey has been conducted but did not collect data on alcohol use
# Data are not available by sex when the columns are not divided(-) Indicates data unavailable or inapplicable
Year in brackets indicates publication year for the data where data year is missing
Less than 25%25% to 34%35% to 49%50% to 74%*75% or moreData not available
The POPULATION REFERENCE BUREAU informs people around the
world about population, health, and the environment, and empowers them to
use that information to advance the well-being of current and future generations.
INFORMPRB informs people around the world and in the United States about issues related to population, health, and the environment. To do this, we transform technical data and research into accurate, easy-to-understand information.
EMPOWERPRB empowers people—researchers, journalists, policymakers, and educators—to use information about population, health, and the environment to encourage action.
ADVANCEPRB works to advance the well-being of current and future generations. Toward that end, we analyze data and research, disseminate information, and empower people to use that information in order to inform policymaking.
Note: This data sheet accompanies the policy brief entitled Noncommunicable Diseases in Africa: Youth Are Key to Curbing the Epidemic and Achieving Sustainable Development. The data sheet is accompanied by a data appendix that provides all available country-specifi c data and data sources on four key noncommunicable (NCD) risk factors among young people in Africa since 2004. These publications extend an earlier publication, Noncommunicable Diseases Risk Factors Among Young People in Africa: Data Availability and Sources. All are available at www.prb.org/Publications/Datasheets/2015/ncd-risk-youth-africa.aspx.
Technical Notes
This data sheet lists all countries in North and sub-Saharan Africa with populations of 150,000 or more and all members of the UN. Countries with unavailable data for most indicators are, however, excluded.
NCD Risks. The data sheet focuses on four specifi c behaviors—tobacco use, harmful use of alcohol, physical inactivity, and unhealthy diet—identifi ed by the World Health Organization to be key NCD risk factors. Data availability on these risk factors among young people is limited in Africa. Available data are typically not directly comparable across a large number of countries. They may measure the levels of risk using different indicators, at different geographic levels (national, regional), for different age groups, and from different settings (all youth, youth in schools). To facilitate the cross-country comparison of risk levels and to focus attention on the broader picture, the risk levels are presented here as high (red), medium (yellow), or low (green).
Risk levels are assessed by fi rst identifying the core indicator for each risk factor that is suitable and for which data are consistently available for the largest number of countries. For countries with data on the core indicators, both risk levels and data points are presented. For countries without data on the core indicators, only risk levels are presented. These levels are based on alternative indicators or data that are otherwise not directly comparable (such as different
age groups, indicator defi nitions) but that still enable assessment of risk levels using similar standards. All data points underlying risk levels and the data sources are available for each risk factor per country in the data appendix accessible at www.prb.org/Publications/Datasheets/2015/ncd-risk-youth-africa.aspx.
The risk levels are assessed using the standards described below under each risk factor. Due to the lack of preexisting standards to assess population-level risks for these behaviors, cut-offs were developed for each risk factor based on a review of previous literature (see www.prb.org/Publications/Reports/2014/ncd-risk-youth-africa.aspx). The standards were adjusted up or down to determine the risk levels when the indicator differed from the ones specifi ed here. Data on any age groups between ages 10 and 24 from 2004 or later are considered in the coding. Data points rounded to their nearest integers are used for coding risk levels. Because well-documented sex differences exist for the prevalence for all risk factors, the risk levels are coded by sex when possible.
Tobacco Use. The core indicators are the percent reporting use in the past 30 days of each of the following: cigarettes, other tobacco products, and any tobacco products among 13-to-15-year-old students available in Global Youth Tobacco Survey (World Health Organization (WHO) and U.S. Centers for Disease Control and Prevention (CDC)) and Global School-Based Student Health Survey (GSHS) (WHO and CDC). The standard used for coding is high ≥ 16%; medium = 7%-15%; and low < 7%.
Alcohol Use. The core indicator is the percent reporting any alcohol use in the past 30 days among 13-to-15-year-old students available in GSHS (WHO and CDC). The standard used for coding is high ≥ 40%; medium = 20%-39%; and low < 20%. We use any amount of alcohol use instead of harmful use, since any amount of drinking presents risk among youth both because of the greater health impact of alcohol on young people and the link between the age of onset and likelihood of lifetime alcohol dependency.
Physical Inactivity. The core indicator is the per-cent reporting not engaging in any type of physical activity for at least 60 minutes a day for fi ve days in the past seven days among 13-to-15-year-old students available from GSHS (WHO and CDC). The standard used for coding is high ≥ 70%; medium = 50%-69%; and low < 50%. Surveys usually report physical activity levels rather than inactivity levels, so data used and presented here are 100 percent minus the percent reported to be physically active. In some countries, the measure pertains to the activity level in seven out of the past seven days. For those countries, the standards used to code risk levels were adjusted.
Overweight/Obesity (Unhealthy Diet). The core indicator is the percent reporting overweight or obese among 15-to-19-year-olds available in Demographic and Health Surveys. The standard used for coding is high ≥ 20%; medium = 10%–19%; and low < 10%. The overweight/obesity measure is used as a proxy for unhealthy diet due to the scarcity of comparable data on dietary intake to assess nutrition levels across countries. Overweight/obesity is a physiological change resulting from high caloric consumption and physical inactivity and is assessed with the Body Mass Index (BMI), a measure of weight relative to height. The BMI levels used to classify overweight/obese status vary somewhat across surveys and are specifi ed in the data appendix.
Data Sources
Population and Youth
Carl Haub and Toshiko Kaneda, 2014 World Population Data Sheet (Washington, DC: Population Reference Bureau, 2014).
UN Population Division, World Population Prospects: The 2012 Revision (New York: UN, 2013).
UNESCO Institute for Statistics, online database, accessed at www.uis.unesco.org/Pages/default.aspx.
World Bank, “World Development Indicators,” online database, accessed at http://data.worldbank.org/data-catalog/world-development-indicators.
NCD Mortality
World Health Organization (WHO), World Health Statistics 2014 (Geneva: WHO, 2014).
WHO, Noncommunicable Diseases Country Profi les 2014 (Geneva: WHO, 2014).
NCD Risk Factor Among Youth
WHO and U.S. Centers for Disease Control and Prevention (CDC), Global School-Based Student Health Surveys, accessed at www.who.int/chp/gshs/en/.
WHO and CDC, Global Youth Tobacco Surveys, accessed at http://nccd.cdc.gov/GTSSData/Ancillary/DataReports.aspx?CAID=1.
ICF International, Demographic and Health Surveys, accessed at www.dhsprogram.com.
WHO, STEPwise Approach to Chronic Disease Risk Factor Surveillance (STEPS), accessed at www.who.int/chp/steps/en/.
Various other country-specifi c surveys (see the data appendix for a list of full citations).
Noncommunicable Diseases Are Becoming Leading Cause of Death Throughout Africa
In most countries in North Africa, noncommunicable diseases (NCDs) are already responsible for more than three-quarters of all deaths. In sub-Saharan Africa, where communicable diseases and other health challenges still predominate, NCDs account for more than 25 percent of deaths in 80 percent of the countries. By 2030, NCDs will be the leading cause of death even in sub-Saharan Africa. In low- and middle-income countries a greater share of NCD deaths occur prematurely among people ages 30-70 who are often at the peak of their economic productivity (see “Probability of Premature Death From NCDs Between Ages 30-70, 2012” in the data table). The growing NCD epidemic represents a signifi cant socioeconomic cost to society, due in large part to declines in productivity and increases in health care expenses.
Sources: World Health Organization (WHO), Noncommunicable Diseases Country Profi les 2014 (Geneva: WHO, 2014); and WHO, Global Status Report on Noncommunicable Diseases 2010 (Geneva: WHO, 2010).
Africa’s Large Young Population Will Stress Health Systems as the Cohort Ages
Africa has the world’s youngest population, with more than one-third, or about 360 million Africans, between the ages of 10 and 24. By 2050, these young people will have aged to create a population ages 45 and over—the ages when NCDs hit hardest—that is three times the size it is today. The World Health Organization estimates that 70 percent of premature deaths in adults are the result of behaviors begun in adolescence. Four key risk behaviors for NCDs—tobacco and alcohol use, physical inactivity, and unhealthy diet—are on the rise among young Africans due in part to globalization, urbanization, and socioeconomic development. Addressing these risk factors among young people today can signifi cantly shift the projected trajectory of NCDs in Africa. In the absence of urgent action, NCDs will add tremendous pressure to already overstretched health systems.
Tobacco Use Varies Across Africa, But Sex Difference NarrowingTobacco use is the single most preventable cause of disease, disability, and death in the world. More than 40 million people smoke in Africa. Africans are using more tobacco and are starting to smoke at younger ages, increasing their exposure to and risk for NCDs. About one in 10 adolescents in Africa smokes cigarettes and the same proportion uses other tobacco products (chewing tobacco, snuff, pipes). However, substantial variation exists across countries in levels and types of tobacco products used. For example, cigarettes dominate overall tobacco use in Côte d’Ivoire, South Africa, and Tunisia, while in Zambia, Uganda, and Morocco, the vast majority of overall use comes from products other than cigarettes. About a quarter of 13-to-15-year-old boys in Côte d’Ivoire, Zambia (also girls), and South Africa are regular tobacco users (used any tobacco products in the past 30 days). Tobacco use also tends to coexist with alcohol use, another key risk factor for NCDs. Tobacco use has been typically higher among young men in Africa, but in many countries, young women are catching up.
Sources: World Health Organization and Centers for Disease Control and Prevention, Global Youth Tobacco Survey, accessed at http://nccd.cdc.gov/gtssdata/Ancillary/DataReports.aspx?CAID=1; and Patricio Marquez and Jill Farrington, The Challenge of Non-Communicable Diseases and Road Traffi c Injuries in Sub-Saharan Africa: An Overview (Washington, DC: The World Bank, 2013).
Sources: Carl Haub and Toshiko Kaneda, 2014 World Population Data Sheet (Washington, DC: Population Reference Bureau, 2014); United Nations Population Division, World Population Prospects: The 2012 Revision (Geneva: UN, 2013); and World Health Organization (WHO), Global Health Risks: Mortality and Burden of Disease Attributable to Selected Major Risks (Geneva: WHO, 2009).
I N F O R M | E M P O W E R | A D VA N C E | w w w. p r b . o r g
POPULATION REFERENCE BUREAU
Percent of Deaths Due To Noncommunicable Diseases by Country, 2012
1875 Connecticut Ave., NW, Washington, DC 20009 USA
tel. 202-483-1100 | fax [email protected] | www.prb.org
PRB on: @PRBdata
ACKNOWLEDGMENTSThis data sheet was produced by Toshiko Kaneda, Ph.D., senior research associate at the Population Reference Bureau (PRB) and Reshma Naik, Dr.P.H., senior policy analyst at PRB. Wendy Baldwin, independent consultant, contributed to the preliminary work on this data sheet. Special thanks to Jeffrey Jordan, Susan Rich, and Carl Haub at PRB; Derek Yach at the Vitality Institute; and Francisco Sierra and Sarah Shillito at AstraZeneca Young Health Programme for their insightful review and helpful comments. The authors also thank interns Marisha Wickremsinhe, Sharee Pearson, Adaeze Exeofor, Heather Zaccaro, and Adrianna Zinn for their assistance with data.© 2015 Population Reference Bureau. All rights reserved.Photo credit, cover: © Sean Sprague / Alamy
Tobacco Use, Excessive Use of Alcohol, Insuffi cient Physical Activity, Unhealthy Diet
N O N C O M M U N I C A B L E D I S E A S E SR I S K B E H A V I O R SCardiovascular Diseases, Chronic Respiratory Diseases, Diabetes, Most Cancers
F O R
Males Females
Population (in millions)150 100 50 0 0 50 100 150
Age
80+
75-79
70-74
65-69
60-64
55-59
50-54
45-49
40-44
35-39
30-34
25-29
20-24
15-19
10-14
5-9
0-4
2050 Males
2050 Females
2014 Males
2014 Females
21
6 6 6
1511 12
2 5 5 3 2
5
5
19 20
9
8 8
2
14 11
8
5
M F M F M F M F M F M F
Côte d’Ivoire(2009)
Zambia(2011)
South Africa(2011)
Tunisia (2010)
Uganda(2011)
Morocco(2010)
Use of other tobacco products (no cigarettes)
Cigarette smoking (possibly with use of other tobacco products)
26
11
4
19
16
11
7
2019
242625
Population and Youth NCD Mortality NCD Risk Factors Among Youth
Mid-Year Population (millions)
Youth Ages 10-24,
Percent of Population,
2014
Percent Enrolled in Secondary School
(Gross Enrollment Ratio), 2005/2014
Percent of Total
Population Living
in Urban Areas, 2014
GNI per Capita, PPP
(Current International $),
2013
Age-Standardized Death Rate
for All NCDs (per 100,000),
2012
Percent of Total Deaths
due to NCDs, 2012
Probability of Premature
Death From NCDs
Between Ages 30-70,
2012
Current Tobacco Use
Current Alcohol Use Physical Inactivity Overweight or Obese10Cigarettes Other Products Any Products
2014 2050 Male Female Male Female Male Female Male Female Year Male Female Year Male Female Year Male Female Year
NORTHERN AFRICA NORTHERN AFRICA
Algeria 39.1 60.3 25 96 100 70 13,070 710 77 22 18 1 9 1 21 2 2011 - - -† 69 89 2011 2011 Algeria
Egypt 87.9 146.0 28 87 85 43 10,790 782 85 25 6 1 6 2 9 3 2011 2005 77 90 2011 2011 Egypt
Libya 6.3 8.4 26 96 113 78 - 550 78 18 6 2 8 4 11 5 2010 - - -† - - - 2007 Libya
Morocco 33.3 41.4 27 74 63 60 7,000 708 75 23 3 2 11 6 11 7 2010 - - -† 79 87 2010 2010 Morocco
Sudan 38.8 77.1 32 43 39 34 3,230 551 34 17 9 4 7 5 13 8 2012 - - -† 89 89 2012 2012 Sudan
Tunisia 11.0 13.1 23 89 93 67 10,610 509 82 17 12 2 12 3 20 4 2010 - - -† 74 89 200814 2005 Tunisia
WESTERN AFRICA WESTERN AFRICA
Benin 10.3 21.5 32 65 43 44 1,780 761 36 22 3 2 5 2 5 2 2009 18 13 2009 67 75 2009 - 12 2011-2012 Benin
Burkina Faso 17.9 46.6 33 31 26 29 1,440 784 32 24 14 2 9 5 20 7 2006* - - - - - - - 5 2010 Burkina Faso
Cape Verde 0.5 0.7 32 86 100 65 6,210 482 69 15 4 3 12 9 15 12 2007 - - - - - - - - - Cape Verde
Côte d’Ivoire 20.8 42.3 32 46 32 53 3,090 794 31 23 21 6 10 7 26 11 2009 - - - 2005 - 10 2011-2012 Côte d’Ivoire
The Gambia 1.9 4.9 32 59 56 59 1,610 630 32 19 13 9 30 34 34 37 2008* - - - - - - - - - The Gambia
Ghana 27.0 52.6 31 69 65 53 3,900 670 42 20 9 7 - - - - 2012 18 13 2012 84 84 2012 2012 Ghana
Guinea 11.6 23.9 32 47 29 37 1,160 681 31 21 12 2 23 19 31 20 2008 - - - - - - - 8 2012 Guinea
Guinea-Bissau 1.7 3.5 32 - - 49 1,410 765 28 22 7 3 5 8 12 10 2008* - - - - - - - - - Guinea-Bissau
Liberia 4.4 9.4 32 42 33 49 790 657 34 21 2 1 - - 14 12 2008* - - - - - - 10 7 2013 Liberia
Mali 15.9 45.6 32 50 40 39 1,540 866 31 26 17 3 11 7 23 9 2008 - - - - - - - 7 2012-2013 Mali
Mauritania 4.0 7.9 31 30 29 59 2,850 555 32 16 17 17 19 17 25 23 2010 - - -† 79 89 2010 2010 Mauritania
Niger 18.2 68.0 31 19 13 18 890 649 25 20 12 1 6 7 15 8 2006 2007 2007 - 5 2012 Niger
Nigeria 177.5 396.5 31 46 41 47 5,360 674 24 20 6 1 17 11 19 11 2008* (2013)5 (2010)8 - 6 2013 Nigeria
Senegal 13.9 35.1 32 43 39 43 2,210 558 34 17 12 3 12 8 20 10 2007 4 2 2005 85 94 2005 0 7 2010-2011 Senegal
Sierra Leone 6.3 10.5 32 48 42 40 1,690 964 26 27 7 5 17 22 20 24 20081 - - - - - - 3 8 2013 Sierra Leone
Togo 7.0 14.5 32 58 30 39 1,180 679 30 20 9 2 12 7 18 8 2007 2010# 2010# 2010 Togo
EASTERN AFRICA EASTERN AFRICA
Burundi 10.5 26.7 31 37 29 12 770 729 28 24 6 3 17 14 21 17 2008 - - - - - - - 6 2010 Burundi
Comoros 0.7 1.3 30 63 65 28 1,490 695 37 23 14 7 13 10 22 15 2007 - - - - - - - 14 2012 Comoros
Djibouti 0.9 1.2 30 53 43 77 - 631 36 19 4 3 11 6 13 7 2007 - - -† 81 91 2007 2007 Djibouti
Eritrea 6.5 14.3 31 - - 22 1,180 672 37 24 2 1 6 4 8 5 2006 2004 - - - 2004 Eritrea
Ethiopia 95.9 165.1 35 35 22 19 1,380 476 30 15 - - - - 20102,# 20102,# 20129,# 0 2 2011 Ethiopia
Kenya 43.2 81.3 32 69 65 25 2,780 515 27 18 2012# 2012# (2014)* - 9 2008-2009 Kenya
Madagascar 22.4 52.8 33 39 38 34 1,370 649 39 23 31 10 9 6 33 14 2008 (2013)6 - - - - 1 2008-2009 Madagascar
Malawi 16.8 41.2 33 38 35 16 750 655 28 19 6 4 8 5 10 6 2009 5 3 2009 - - - - 7 2010 Malawi
Mauritius 1.3 1.2 23 94 98 40 17,220 577 85 24 23 9 12 5 25 10 2011 28 22 2011 59 76 2011 2011 Mauritius
Mozambique 25.1 63.5 33 27 25 32 1,100 594 23 17 5 1 10 7 13 7 2007* - - - - - - - 7 2011 Mozambique
Rwanda 11.1 21.0 33 31 34 28 1,450 585 36 19 3 1 12 9 13 10 2008 - - - - - - 0 11 2010 Rwanda
Seychelles 0.1 0.1 22 79 80 54 23,730 - - - 23 20 11 9 27 25 2007 62 61 2007 76 86 200714 2007 Seychelles
Somalia 10.8 27.1 33 10 5 39 - 551 19 19 9 15 15 15 19 22 2004 - - - - - - - - - Somalia
South Sudan 11.7 39.3 33 - - 19 1,860 623 - - - - - - - - - - - - - - - - - - South Sudan
Tanzania 50.8 129.4 32 34 32 31 1,760 570 31 16 5 1 6 5 10 5 20083 7 5 20063 69 80 20063 - 9 2010 Tanzania
Uganda 38.8 104.1 34 29 25 16 1,470 664 27 21 5 5 18 14 19 16 2011 - - - - - - 1 12 2011 Uganda
Zambia 15.1 49.2 33 - - 40 3,810 587 23 18 6 6 24 24 25 26 2011 39 45 2004 90 90 2004 - 8 2007 Zambia
Zimbabwe 14.7 30.2 34 48 47 33 1,690 599 31 19 5 2 11 8 15 8 2008* - - - - - - 1 13 2010-2011 Zimbabwe
MIDDLE AFRICA MIDDLE AFRICA
Angola 22.4 60.8 33 38 25 43 7,000 768 24 24 - - - - - - - - - - - - - - - - Angola
Cameroon 22.8 54.3 33 54 46 54 2,770 675 31 20 9 3 12 7 17 10 20084 - - - - - - - 16 2011 Cameroon
Central African Republic 4.8 9.7 33 24 12 40 600 551 20 18 10 4 24 31 30 35 2008* - - - - - - - - - Central African Republic
Chad 13.3 37.4 33 31 14 22 2,010 713 21 23 8 4 17 12 21 14 2008 - - - - - - - 4 2004 Chad
Congo 4.6 10.6 31 57 50 65 4,600 632 30 20 15 8 16 18 26 22 2006 - - - - - - - 6 2011-2012 Congo
Congo, Dem. Rep. 71.2 193.6 33 54 32 42 740 724 23 24 12 4 29 28 37 29 2008* 2004-20067 2005 - 8 2013-2014 Congo, Dem. Rep.
Equatorial Guinea 0.8 1.6 30 33 24 40 23,270 729 31 23 10 3 20 15 25 17 2008 - - - - - - 5 17 2011 Equatorial Guinea
Gabon 1.7 3.3 31 - - 87 17,230 505 36 15 - - - - 2009 - - - - - - - 16 2012 Gabon
Sao Tome and Principe 0.2 0.4 31 76 85 65 2,950 - - - 6 3 30 22 31 23 2010 - - - - - - - 13 2008-2009 Sao Tome and Principe
SOUTHERN AFRICA SOUTHERN AFRICA
Botswana 2.0 2.8 33 79 84 57 15,640 612 37 21 13 5 16 14 23 16 2008 23 19 2005 87 90 2005 - - - Botswana
Lesotho 1.9 2.7 35 45 62 27 3,160 672 27 24 12 8 20 18 26 22 2008 - - - - - - 1 20 2009 Lesotho
Namibia 2.3 3.7 33 60 70 46 9,490 580 43 20 10 6 - - 14 9 2013 26 21 2013 85 86 2013 2013 Namibia
South Africa 53.7 64.1 27 107 114 64 12,240 711 43 27 15 11 14 13 24 19 2011 2011 2008 2011 South Africa
Swaziland 1.3 1.8 35 61 60 21 6,060 702 28 21 9 3 9 7 15 9 2005 - - - - - - 2013 Swaziland
This data sheet was funded by the AstraZeneca Young Health Programme (YHP). YHP is a partnership among AstraZeneca, Johns Hopkins Bloomberg School of Public Health, and Plan International, with local NGO partners also implementing YHP programs on the ground. The YHP mission is to positively impact the health of adolescents in marginalized communities worldwide through research, advocacy, and on-the-ground programs focused on NCD prevention.
www.younghealthprogrammeyhp.com
Many Countries Face the Double Burden of Overnutrition and Undernutrition Sub-Saharan Africa is undergoing a nutrition transition, with overweight and obesity emerging as critical public health issues even in some countries where undernutrition is still a big problem. Among 15-to-19-year-old girls in Benin, Rwanda, Uganda, and Zimbabwe, approximately one in eight girls are overweight or obese, whereas about one in seven girls are underweight. Girls are often more likely than boys to be overweight or obese. Urbanization and globalization have led to more sedentary lifestyles and to high-calorie diets fi lled with highly processed foods that are low in fruits and vegetables, and high in saturated fat, sodium, and sugar. These shifts in diet and exercise patterns are leading to a rise in NCDs such as type 2 diabetes, cardiovascular disease, stroke, and certain cancers.
Source: ICF International, Demographic and Health Surveys, accessed at www.dhsprogram.com.
Overweight or obese Underweight
13
14
13
14
17
10
12
11
12
12
13
16
16
20
Rwanda (2010)
Uganda (2011)
Benin (2011-2012)
Zimbabwe (2010-2011)
Gabon (2012)
Cameroon (2011)
Lesotho (2009) 32
26
33
27
25
26
24
Percent of Women 15-19 Years Old Who Are Overweight/Obese or Underweight, Select CountriesPopulation Pyramid, Africa: 2014 and 2050
Population Size
2014 1,136 million
2050 2,428 million
Percent of Boys and Girls 13-15 Years Old in Secondary Schools Who Used Tobacco Products in the Past 30 Days, Select Countries
Addressing Risk Factors for Noncommunicable Diseases Among Young People in Africa: Key To Prevention and Sustainable Development
*Includes only Cape Verde, 69 percent.
Current Tobacco UsePercent using cigarettes/other tobacco products/any products in the past 30 days among 13-15-year-old
secondary school students11
16% or Above 7% to 15% Below 7%
Current Alcohol UsePercent having any drinks with alcohol in the past 30 days
among 13-15-year-old secondary school students12
40% or Above 20% to 39% Below 20%
Physical InactivityPercent not engaging in physical activity for at least 60 min/day on fi ve out of the last seven days among
13-15-year-old secondary school students12
70% or Above 50% to 69% Below 50%
Overweight or ObesePercent who are overweight or obese
among 15-19-year-olds13
20% or Above 10% to 19% Below 10%
Definition of Risk Levels
High Risk Medium Risk Low Risk
Notes:Data points for the risk factors appear for countries with comparable data available from the following surveys: Global Youth Tobacco Survey and Global School-Based Student Health Survey for tobacco use, Global School-Based Student Health Survey for both alcohol use and physical inactivity, and Demographic and Health Surveys for overweight status. For the countries without data from these surveys, data from other sources were used whenever possible to assess risk levels. Only the colors showing risk levels are displayed for these countries. Data points underlying all risk levels are available in the data appendix at http://www.prb.org/Publications/Datasheets/2015/ncd-risk-youth-africa.aspx.
Data in italics are based on samples from the following cities/regions and are not nationally representative.
* National capital1 Western Area2 Harar Town3 Dar es Salaam4 Central District5 Ibadan6 Six largest urban cities7 All provincial capital cities8 Abeokuta9 Hawassa City
10 Proxy for unhealthy diet11 Based on the Global Youth Tobacco Survey and the Global
School-Based Student Health Survey12 Based on the Global School-Based Student Health Survey13 Based on the Demographic and Health Survey14 Risk level for male was coded as yellow instead of red because
the measure pertains to physical inactivity level in seven out of the last seven days in this country
† Countries where Global School-Based Student Health Survey has been conducted but did not collect data on alcohol use
# Data are not available by sex when the columns are not divided(-) Indicates data unavailable or inapplicable
Year in brackets indicates publication year for the data where data year is missing
© 2015 Population Reference Bureau See notes on page 11 NONCOMMUNICABLE DISEASES AMONG YOUNG PEOPLE IN AFRICA 3
Less than 25%25% to 34%35% to 49%50% to 74%*75% or moreData not available
The POPULATION REFERENCE BUREAU informs people around the
world about population, health, and the environment, and empowers them to
use that information to advance the well-being of current and future generations.
INFORMPRB informs people around the world and in the United States about issues related to population, health, and the environment. To do this, we transform technical data and research into accurate, easy-to-understand information.
EMPOWERPRB empowers people—researchers, journalists, policymakers, and educators—to use information about population, health, and the environment to encourage action.
ADVANCEPRB works to advance the well-being of current and future generations. Toward that end, we analyze data and research, disseminate information, and empower people to use that information in order to inform policymaking.
Note: This data sheet accompanies the policy brief entitled Noncommunicable Diseases in Africa: Youth Are Key to Curbing the Epidemic and Achieving Sustainable Development. The data sheet is accompanied by a data appendix that provides all available country-specifi c data and data sources on four key noncommunicable (NCD) risk factors among young people in Africa since 2004. These publications extend an earlier publication, Noncommunicable Diseases Risk Factors Among Young People in Africa: Data Availability and Sources. All are available at www.prb.org/Publications/Datasheets/2015/ncd-risk-youth-africa.aspx.
Technical Notes
This data sheet lists all countries in North and sub-Saharan Africa with populations of 150,000 or more and all members of the UN. Countries with unavailable data for most indicators are, however, excluded.
NCD Risks. The data sheet focuses on four specifi c behaviors—tobacco use, harmful use of alcohol, physical inactivity, and unhealthy diet—identifi ed by the World Health Organization to be key NCD risk factors. Data availability on these risk factors among young people is limited in Africa. Available data are typically not directly comparable across a large number of countries. They may measure the levels of risk using different indicators, at different geographic levels (national, regional), for different age groups, and from different settings (all youth, youth in schools). To facilitate the cross-country comparison of risk levels and to focus attention on the broader picture, the risk levels are presented here as high (red), medium (yellow), or low (green).
Risk levels are assessed by fi rst identifying the core indicator for each risk factor that is suitable and for which data are consistently available for the largest number of countries. For countries with data on the core indicators, both risk levels and data points are presented. For countries without data on the core indicators, only risk levels are presented. These levels are based on alternative indicators or data that are otherwise not directly comparable (such as different
age groups, indicator defi nitions) but that still enable assessment of risk levels using similar standards. All data points underlying risk levels and the data sources are available for each risk factor per country in the data appendix accessible at www.prb.org/Publications/Datasheets/2015/ncd-risk-youth-africa.aspx.
The risk levels are assessed using the standards described below under each risk factor. Due to the lack of preexisting standards to assess population-level risks for these behaviors, cut-offs were developed for each risk factor based on a review of previous literature (see www.prb.org/Publications/Reports/2014/ncd-risk-youth-africa.aspx). The standards were adjusted up or down to determine the risk levels when the indicator differed from the ones specifi ed here. Data on any age groups between ages 10 and 24 from 2004 or later are considered in the coding. Data points rounded to their nearest integers are used for coding risk levels. Because well-documented sex differences exist for the prevalence for all risk factors, the risk levels are coded by sex when possible.
Tobacco Use. The core indicators are the percent reporting use in the past 30 days of each of the following: cigarettes, other tobacco products, and any tobacco products among 13-to-15-year-old students available in Global Youth Tobacco Survey (World Health Organization (WHO) and U.S. Centers for Disease Control and Prevention (CDC)) and Global School-Based Student Health Survey (GSHS) (WHO and CDC). The standard used for coding is high ≥ 16%; medium = 7%-15%; and low < 7%.
Alcohol Use. The core indicator is the percent reporting any alcohol use in the past 30 days among 13-to-15-year-old students available in GSHS (WHO and CDC). The standard used for coding is high ≥ 40%; medium = 20%-39%; and low < 20%. We use any amount of alcohol use instead of harmful use, since any amount of drinking presents risk among youth both because of the greater health impact of alcohol on young people and the link between the age of onset and likelihood of lifetime alcohol dependency.
Physical Inactivity. The core indicator is the per-cent reporting not engaging in any type of physical activity for at least 60 minutes a day for fi ve days in the past seven days among 13-to-15-year-old students available from GSHS (WHO and CDC). The standard used for coding is high ≥ 70%; medium = 50%-69%; and low < 50%. Surveys usually report physical activity levels rather than inactivity levels, so data used and presented here are 100 percent minus the percent reported to be physically active. In some countries, the measure pertains to the activity level in seven out of the past seven days. For those countries, the standards used to code risk levels were adjusted.
Overweight/Obesity (Unhealthy Diet). The core indicator is the percent reporting overweight or obese among 15-to-19-year-olds available in Demographic and Health Surveys. The standard used for coding is high ≥ 20%; medium = 10%–19%; and low < 10%. The overweight/obesity measure is used as a proxy for unhealthy diet due to the scarcity of comparable data on dietary intake to assess nutrition levels across countries. Overweight/obesity is a physiological change resulting from high caloric consumption and physical inactivity and is assessed with the Body Mass Index (BMI), a measure of weight relative to height. The BMI levels used to classify overweight/obese status vary somewhat across surveys and are specifi ed in the data appendix.
Data Sources
Population and Youth
Carl Haub and Toshiko Kaneda, 2014 World Population Data Sheet (Washington, DC: Population Reference Bureau, 2014).
UN Population Division, World Population Prospects: The 2012 Revision (New York: UN, 2013).
UNESCO Institute for Statistics, online database, accessed at www.uis.unesco.org/Pages/default.aspx.
World Bank, “World Development Indicators,” online database, accessed at http://data.worldbank.org/data-catalog/world-development-indicators.
NCD Mortality
World Health Organization (WHO), World Health Statistics 2014 (Geneva: WHO, 2014).
WHO, Noncommunicable Diseases Country Profi les 2014 (Geneva: WHO, 2014).
NCD Risk Factor Among Youth
WHO and U.S. Centers for Disease Control and Prevention (CDC), Global School-Based Student Health Surveys, accessed at www.who.int/chp/gshs/en/.
WHO and CDC, Global Youth Tobacco Surveys, accessed at http://nccd.cdc.gov/GTSSData/Ancillary/DataReports.aspx?CAID=1.
ICF International, Demographic and Health Surveys, accessed at www.dhsprogram.com.
WHO, STEPwise Approach to Chronic Disease Risk Factor Surveillance (STEPS), accessed at www.who.int/chp/steps/en/.
Various other country-specifi c surveys (see the data appendix for a list of full citations).
Noncommunicable Diseases Are Becoming Leading Cause of Death Throughout Africa
In most countries in North Africa, noncommunicable diseases (NCDs) are already responsible for more than three-quarters of all deaths. In sub-Saharan Africa, where communicable diseases and other health challenges still predominate, NCDs account for more than 25 percent of deaths in 80 percent of the countries. By 2030, NCDs will be the leading cause of death even in sub-Saharan Africa. In low- and middle-income countries a greater share of NCD deaths occur prematurely among people ages 30-70 who are often at the peak of their economic productivity (see “Probability of Premature Death From NCDs Between Ages 30-70, 2012” in the data table). The growing NCD epidemic represents a signifi cant socioeconomic cost to society, due in large part to declines in productivity and increases in health care expenses.
Sources: World Health Organization (WHO), Noncommunicable Diseases Country Profi les 2014 (Geneva: WHO, 2014); and WHO, Global Status Report on Noncommunicable Diseases 2010 (Geneva: WHO, 2010).
Africa’s Large Young Population Will Stress Health Systems as the Cohort Ages
Africa has the world’s youngest population, with more than one-third, or about 360 million Africans, between the ages of 10 and 24. By 2050, these young people will have aged to create a population ages 45 and over—the ages when NCDs hit hardest—that is three times the size it is today. The World Health Organization estimates that 70 percent of premature deaths in adults are the result of behaviors begun in adolescence. Four key risk behaviors for NCDs—tobacco and alcohol use, physical inactivity, and unhealthy diet—are on the rise among young Africans due in part to globalization, urbanization, and socioeconomic development. Addressing these risk factors among young people today can signifi cantly shift the projected trajectory of NCDs in Africa. In the absence of urgent action, NCDs will add tremendous pressure to already overstretched health systems.
Tobacco Use Varies Across Africa, But Sex Difference NarrowingTobacco use is the single most preventable cause of disease, disability, and death in the world. More than 40 million people smoke in Africa. Africans are using more tobacco and are starting to smoke at younger ages, increasing their exposure to and risk for NCDs. About one in 10 adolescents in Africa smokes cigarettes and the same proportion uses other tobacco products (chewing tobacco, snuff, pipes). However, substantial variation exists across countries in levels and types of tobacco products used. For example, cigarettes dominate overall tobacco use in Côte d’Ivoire, South Africa, and Tunisia, while in Zambia, Uganda, and Morocco, the vast majority of overall use comes from products other than cigarettes. About a quarter of 13-to-15-year-old boys in Côte d’Ivoire, Zambia (also girls), and South Africa are regular tobacco users (used any tobacco products in the past 30 days). Tobacco use also tends to coexist with alcohol use, another key risk factor for NCDs. Tobacco use has been typically higher among young men in Africa, but in many countries, young women are catching up.
Sources: World Health Organization and Centers for Disease Control and Prevention, Global Youth Tobacco Survey, accessed at http://nccd.cdc.gov/gtssdata/Ancillary/DataReports.aspx?CAID=1; and Patricio Marquez and Jill Farrington, The Challenge of Non-Communicable Diseases and Road Traffi c Injuries in Sub-Saharan Africa: An Overview (Washington, DC: The World Bank, 2013).
Sources: Carl Haub and Toshiko Kaneda, 2014 World Population Data Sheet (Washington, DC: Population Reference Bureau, 2014); United Nations Population Division, World Population Prospects: The 2012 Revision (Geneva: UN, 2013); and World Health Organization (WHO), Global Health Risks: Mortality and Burden of Disease Attributable to Selected Major Risks (Geneva: WHO, 2009).
I N F O R M | E M P O W E R | A D VA N C E | w w w. p r b . o r g
POPULATION REFERENCE BUREAU
Percent of Deaths Due To Noncommunicable Diseases by Country, 2012
1875 Connecticut Ave., NW, Washington, DC 20009 USA
tel. 202-483-1100 | fax [email protected] | www.prb.org
PRB on: @PRBdata
ACKNOWLEDGMENTSThis data sheet was produced by Toshiko Kaneda, Ph.D., senior research associate at the Population Reference Bureau (PRB) and Reshma Naik, Dr.P.H., senior policy analyst at PRB. Wendy Baldwin, independent consultant, contributed to the preliminary work on this data sheet. Special thanks to Jeffrey Jordan, Susan Rich, and Carl Haub at PRB; Derek Yach at the Vitality Institute; and Francisco Sierra and Sarah Shillito at AstraZeneca Young Health Programme for their insightful review and helpful comments. The authors also thank interns Marisha Wickremsinhe, Sharee Pearson, Adaeze Exeofor, Heather Zaccaro, and Adrianna Zinn for their assistance with data.© 2015 Population Reference Bureau. All rights reserved.Photo credit, cover: © Sean Sprague / Alamy
Tobacco Use, Excessive Use of Alcohol, Insuffi cient Physical Activity, Unhealthy Diet
N O N C O M M U N I C A B L E D I S E A S E SR I S K B E H A V I O R SCardiovascular Diseases, Chronic Respiratory Diseases, Diabetes, Most Cancers
F O R
Males Females
Population (in millions)150 100 50 0 0 50 100 150
Age
80+
75-79
70-74
65-69
60-64
55-59
50-54
45-49
40-44
35-39
30-34
25-29
20-24
15-19
10-14
5-9
0-4
2050 Males
2050 Females
2014 Males
2014 Females
21
6 6 6
1511 12
2 5 5 3 2
5
5
19 20
9
8 8
2
14 11
8
5
M F M F M F M F M F M F
Côte d’Ivoire(2009)
Zambia(2011)
South Africa(2011)
Tunisia (2010)
Uganda(2011)
Morocco(2010)
Use of other tobacco products (no cigarettes)
Cigarette smoking (possibly with use of other tobacco products)
26
11
4
19
16
11
7
2019
242625
Population and Youth NCD Mortality NCD Risk Factors Among Youth
Mid-Year Population (millions)
Youth Ages 10-24,
Percent of Population,
2014
Percent Enrolled in Secondary School
(Gross Enrollment Ratio), 2005/2014
Percent of Total
Population Living
in Urban Areas, 2014
GNI per Capita, PPP
(Current International $),
2013
Age-Standardized Death Rate
for All NCDs (per 100,000),
2012
Percent of Total Deaths
due to NCDs, 2012
Probability of Premature
Death From NCDs
Between Ages 30-70,
2012
Current Tobacco Use
Current Alcohol Use Physical Inactivity Overweight or Obese10Cigarettes Other Products Any Products
2014 2050 Male Female Male Female Male Female Male Female Year Male Female Year Male Female Year Male Female Year
NORTHERN AFRICA NORTHERN AFRICA
Algeria 39.1 60.3 25 96 100 70 13,070 710 77 22 18 1 9 1 21 2 2011 - - -† 69 89 2011 2011 Algeria
Egypt 87.9 146.0 28 87 85 43 10,790 782 85 25 6 1 6 2 9 3 2011 2005 77 90 2011 2011 Egypt
Libya 6.3 8.4 26 96 113 78 - 550 78 18 6 2 8 4 11 5 2010 - - -† - - - 2007 Libya
Morocco 33.3 41.4 27 74 63 60 7,000 708 75 23 3 2 11 6 11 7 2010 - - -† 79 87 2010 2010 Morocco
Sudan 38.8 77.1 32 43 39 34 3,230 551 34 17 9 4 7 5 13 8 2012 - - -† 89 89 2012 2012 Sudan
Tunisia 11.0 13.1 23 89 93 67 10,610 509 82 17 12 2 12 3 20 4 2010 - - -† 74 89 200814 2005 Tunisia
WESTERN AFRICA WESTERN AFRICA
Benin 10.3 21.5 32 65 43 44 1,780 761 36 22 3 2 5 2 5 2 2009 18 13 2009 67 75 2009 - 12 2011-2012 Benin
Burkina Faso 17.9 46.6 33 31 26 29 1,440 784 32 24 14 2 9 5 20 7 2006* - - - - - - - 5 2010 Burkina Faso
Cape Verde 0.5 0.7 32 86 100 65 6,210 482 69 15 4 3 12 9 15 12 2007 - - - - - - - - - Cape Verde
Côte d’Ivoire 20.8 42.3 32 46 32 53 3,090 794 31 23 21 6 10 7 26 11 2009 - - - 2005 - 10 2011-2012 Côte d’Ivoire
The Gambia 1.9 4.9 32 59 56 59 1,610 630 32 19 13 9 30 34 34 37 2008* - - - - - - - - - The Gambia
Ghana 27.0 52.6 31 69 65 53 3,900 670 42 20 9 7 - - - - 2012 18 13 2012 84 84 2012 2012 Ghana
Guinea 11.6 23.9 32 47 29 37 1,160 681 31 21 12 2 23 19 31 20 2008 - - - - - - - 8 2012 Guinea
Guinea-Bissau 1.7 3.5 32 - - 49 1,410 765 28 22 7 3 5 8 12 10 2008* - - - - - - - - - Guinea-Bissau
Liberia 4.4 9.4 32 42 33 49 790 657 34 21 2 1 - - 14 12 2008* - - - - - - 10 7 2013 Liberia
Mali 15.9 45.6 32 50 40 39 1,540 866 31 26 17 3 11 7 23 9 2008 - - - - - - - 7 2012-2013 Mali
Mauritania 4.0 7.9 31 30 29 59 2,850 555 32 16 17 17 19 17 25 23 2010 - - -† 79 89 2010 2010 Mauritania
Niger 18.2 68.0 31 19 13 18 890 649 25 20 12 1 6 7 15 8 2006 2007 2007 - 5 2012 Niger
Nigeria 177.5 396.5 31 46 41 47 5,360 674 24 20 6 1 17 11 19 11 2008* (2013)5 (2010)8 - 6 2013 Nigeria
Senegal 13.9 35.1 32 43 39 43 2,210 558 34 17 12 3 12 8 20 10 2007 4 2 2005 85 94 2005 0 7 2010-2011 Senegal
Sierra Leone 6.3 10.5 32 48 42 40 1,690 964 26 27 7 5 17 22 20 24 20081 - - - - - - 3 8 2013 Sierra Leone
Togo 7.0 14.5 32 58 30 39 1,180 679 30 20 9 2 12 7 18 8 2007 2010# 2010# 2010 Togo
EASTERN AFRICA EASTERN AFRICA
Burundi 10.5 26.7 31 37 29 12 770 729 28 24 6 3 17 14 21 17 2008 - - - - - - - 6 2010 Burundi
Comoros 0.7 1.3 30 63 65 28 1,490 695 37 23 14 7 13 10 22 15 2007 - - - - - - - 14 2012 Comoros
Djibouti 0.9 1.2 30 53 43 77 - 631 36 19 4 3 11 6 13 7 2007 - - -† 81 91 2007 2007 Djibouti
Eritrea 6.5 14.3 31 - - 22 1,180 672 37 24 2 1 6 4 8 5 2006 2004 - - - 2004 Eritrea
Ethiopia 95.9 165.1 35 35 22 19 1,380 476 30 15 - - - - 20102,# 20102,# 20129,# 0 2 2011 Ethiopia
Kenya 43.2 81.3 32 69 65 25 2,780 515 27 18 2012# 2012# (2014)* - 9 2008-2009 Kenya
Madagascar 22.4 52.8 33 39 38 34 1,370 649 39 23 31 10 9 6 33 14 2008 (2013)6 - - - - 1 2008-2009 Madagascar
Malawi 16.8 41.2 33 38 35 16 750 655 28 19 6 4 8 5 10 6 2009 5 3 2009 - - - - 7 2010 Malawi
Mauritius 1.3 1.2 23 94 98 40 17,220 577 85 24 23 9 12 5 25 10 2011 28 22 2011 59 76 2011 2011 Mauritius
Mozambique 25.1 63.5 33 27 25 32 1,100 594 23 17 5 1 10 7 13 7 2007* - - - - - - - 7 2011 Mozambique
Rwanda 11.1 21.0 33 31 34 28 1,450 585 36 19 3 1 12 9 13 10 2008 - - - - - - 0 11 2010 Rwanda
Seychelles 0.1 0.1 22 79 80 54 23,730 - - - 23 20 11 9 27 25 2007 62 61 2007 76 86 200714 2007 Seychelles
Somalia 10.8 27.1 33 10 5 39 - 551 19 19 9 15 15 15 19 22 2004 - - - - - - - - - Somalia
South Sudan 11.7 39.3 33 - - 19 1,860 623 - - - - - - - - - - - - - - - - - - South Sudan
Tanzania 50.8 129.4 32 34 32 31 1,760 570 31 16 5 1 6 5 10 5 20083 7 5 20063 69 80 20063 - 9 2010 Tanzania
Uganda 38.8 104.1 34 29 25 16 1,470 664 27 21 5 5 18 14 19 16 2011 - - - - - - 1 12 2011 Uganda
Zambia 15.1 49.2 33 - - 40 3,810 587 23 18 6 6 24 24 25 26 2011 39 45 2004 90 90 2004 - 8 2007 Zambia
Zimbabwe 14.7 30.2 34 48 47 33 1,690 599 31 19 5 2 11 8 15 8 2008* - - - - - - 1 13 2010-2011 Zimbabwe
MIDDLE AFRICA MIDDLE AFRICA
Angola 22.4 60.8 33 38 25 43 7,000 768 24 24 - - - - - - - - - - - - - - - - Angola
Cameroon 22.8 54.3 33 54 46 54 2,770 675 31 20 9 3 12 7 17 10 20084 - - - - - - - 16 2011 Cameroon
Central African Republic 4.8 9.7 33 24 12 40 600 551 20 18 10 4 24 31 30 35 2008* - - - - - - - - - Central African Republic
Chad 13.3 37.4 33 31 14 22 2,010 713 21 23 8 4 17 12 21 14 2008 - - - - - - - 4 2004 Chad
Congo 4.6 10.6 31 57 50 65 4,600 632 30 20 15 8 16 18 26 22 2006 - - - - - - - 6 2011-2012 Congo
Congo, Dem. Rep. 71.2 193.6 33 54 32 42 740 724 23 24 12 4 29 28 37 29 2008* 2004-20067 2005 - 8 2013-2014 Congo, Dem. Rep.
Equatorial Guinea 0.8 1.6 30 33 24 40 23,270 729 31 23 10 3 20 15 25 17 2008 - - - - - - 5 17 2011 Equatorial Guinea
Gabon 1.7 3.3 31 - - 87 17,230 505 36 15 - - - - 2009 - - - - - - - 16 2012 Gabon
Sao Tome and Principe 0.2 0.4 31 76 85 65 2,950 - - - 6 3 30 22 31 23 2010 - - - - - - - 13 2008-2009 Sao Tome and Principe
SOUTHERN AFRICA SOUTHERN AFRICA
Botswana 2.0 2.8 33 79 84 57 15,640 612 37 21 13 5 16 14 23 16 2008 23 19 2005 87 90 2005 - - - Botswana
Lesotho 1.9 2.7 35 45 62 27 3,160 672 27 24 12 8 20 18 26 22 2008 - - - - - - 1 20 2009 Lesotho
Namibia 2.3 3.7 33 60 70 46 9,490 580 43 20 10 6 - - 14 9 2013 26 21 2013 85 86 2013 2013 Namibia
South Africa 53.7 64.1 27 107 114 64 12,240 711 43 27 15 11 14 13 24 19 2011 2011 2008 2011 South Africa
Swaziland 1.3 1.8 35 61 60 21 6,060 702 28 21 9 3 9 7 15 9 2005 - - - - - - 2013 Swaziland
This data sheet was funded by the AstraZeneca Young Health Programme (YHP). YHP is a partnership among AstraZeneca, Johns Hopkins Bloomberg School of Public Health, and Plan International, with local NGO partners also implementing YHP programs on the ground. The YHP mission is to positively impact the health of adolescents in marginalized communities worldwide through research, advocacy, and on-the-ground programs focused on NCD prevention.
www.younghealthprogrammeyhp.com
Many Countries Face the Double Burden of Overnutrition and Undernutrition Sub-Saharan Africa is undergoing a nutrition transition, with overweight and obesity emerging as critical public health issues even in some countries where undernutrition is still a big problem. Among 15-to-19-year-old girls in Benin, Rwanda, Uganda, and Zimbabwe, approximately one in eight girls are overweight or obese, whereas about one in seven girls are underweight. Girls are often more likely than boys to be overweight or obese. Urbanization and globalization have led to more sedentary lifestyles and to high-calorie diets fi lled with highly processed foods that are low in fruits and vegetables, and high in saturated fat, sodium, and sugar. These shifts in diet and exercise patterns are leading to a rise in NCDs such as type 2 diabetes, cardiovascular disease, stroke, and certain cancers.
Source: ICF International, Demographic and Health Surveys, accessed at www.dhsprogram.com.
Overweight or obese Underweight
13
14
13
14
17
10
12
11
12
12
13
16
16
20
Rwanda (2010)
Uganda (2011)
Benin (2011-2012)
Zimbabwe (2010-2011)
Gabon (2012)
Cameroon (2011)
Lesotho (2009) 32
26
33
27
25
26
24
Percent of Women 15-19 Years Old Who Are Overweight/Obese or Underweight, Select CountriesPopulation Pyramid, Africa: 2014 and 2050
Population Size
2014 1,136 million
2050 2,428 million
Percent of Boys and Girls 13-15 Years Old in Secondary Schools Who Used Tobacco Products in the Past 30 Days, Select Countries
Addressing Risk Factors for Noncommunicable Diseases Among Young People in Africa: Key To Prevention and Sustainable Development
*Includes only Cape Verde, 69 percent.
Current Tobacco UsePercent using cigarettes/other tobacco products/any products in the past 30 days among 13-15-year-old
secondary school students11
16% or Above 7% to 15% Below 7%
Current Alcohol UsePercent having any drinks with alcohol in the past 30 days
among 13-15-year-old secondary school students12
40% or Above 20% to 39% Below 20%
Physical InactivityPercent not engaging in physical activity for at least 60 min/day on fi ve out of the last seven days among
13-15-year-old secondary school students12
70% or Above 50% to 69% Below 50%
Overweight or ObesePercent who are overweight or obese
among 15-19-year-olds13
20% or Above 10% to 19% Below 10%
Definition of Risk Levels
High Risk Medium Risk Low Risk
Notes:Data points for the risk factors appear for countries with comparable data available from the following surveys: Global Youth Tobacco Survey and Global School-Based Student Health Survey for tobacco use, Global School-Based Student Health Survey for both alcohol use and physical inactivity, and Demographic and Health Surveys for overweight status. For the countries without data from these surveys, data from other sources were used whenever possible to assess risk levels. Only the colors showing risk levels are displayed for these countries. Data points underlying all risk levels are available in the data appendix at http://www.prb.org/Publications/Datasheets/2015/ncd-risk-youth-africa.aspx.
Data in italics are based on samples from the following cities/regions and are not nationally representative.
* National capital1 Western Area2 Harar Town3 Dar es Salaam4 Central District5 Ibadan6 Six largest urban cities7 All provincial capital cities8 Abeokuta9 Hawassa City
10 Proxy for unhealthy diet11 Based on the Global Youth Tobacco Survey and the Global
School-Based Student Health Survey12 Based on the Global School-Based Student Health Survey13 Based on the Demographic and Health Survey14 Risk level for male was coded as yellow instead of red because
the measure pertains to physical inactivity level in seven out of the last seven days in this country
† Countries where Global School-Based Student Health Survey has been conducted but did not collect data on alcohol use
# Data are not available by sex when the columns are not divided(-) Indicates data unavailable or inapplicable
Year in brackets indicates publication year for the data where data year is missing

© 2015 Population Reference Bureau See notes on page 11 NONCOMMUNICABLE DISEASES AMONG YOUNG PEOPLE IN AFRICA 4
Less than 25%25% to 34%35% to 49%50% to 74%*75% or moreData not available
The POPULATION REFERENCE BUREAU informs people around the
world about population, health, and the environment, and empowers them to
use that information to advance the well-being of current and future generations.
INFORMPRB informs people around the world and in the United States about issues related to population, health, and the environment. To do this, we transform technical data and research into accurate, easy-to-understand information.
EMPOWERPRB empowers people—researchers, journalists, policymakers, and educators—to use information about population, health, and the environment to encourage action.
ADVANCEPRB works to advance the well-being of current and future generations. Toward that end, we analyze data and research, disseminate information, and empower people to use that information in order to inform policymaking.
Note: This data sheet accompanies the policy brief entitled Noncommunicable Diseases in Africa: Youth Are Key to Curbing the Epidemic and Achieving Sustainable Development. The data sheet is accompanied by a data appendix that provides all available country-specifi c data and data sources on four key noncommunicable (NCD) risk factors among young people in Africa since 2004. These publications extend an earlier publication, Noncommunicable Diseases Risk Factors Among Young People in Africa: Data Availability and Sources. All are available at www.prb.org/Publications/Datasheets/2015/ncd-risk-youth-africa.aspx.
Technical Notes
This data sheet lists all countries in North and sub-Saharan Africa with populations of 150,000 or more and all members of the UN. Countries with unavailable data for most indicators are, however, excluded.
NCD Risks. The data sheet focuses on four specifi c behaviors—tobacco use, harmful use of alcohol, physical inactivity, and unhealthy diet—identifi ed by the World Health Organization to be key NCD risk factors. Data availability on these risk factors among young people is limited in Africa. Available data are typically not directly comparable across a large number of countries. They may measure the levels of risk using different indicators, at different geographic levels (national, regional), for different age groups, and from different settings (all youth, youth in schools). To facilitate the cross-country comparison of risk levels and to focus attention on the broader picture, the risk levels are presented here as high (red), medium (yellow), or low (green).
Risk levels are assessed by fi rst identifying the core indicator for each risk factor that is suitable and for which data are consistently available for the largest number of countries. For countries with data on the core indicators, both risk levels and data points are presented. For countries without data on the core indicators, only risk levels are presented. These levels are based on alternative indicators or data that are otherwise not directly comparable (such as different
age groups, indicator defi nitions) but that still enable assessment of risk levels using similar standards. All data points underlying risk levels and the data sources are available for each risk factor per country in the data appendix accessible at www.prb.org/Publications/Datasheets/2015/ncd-risk-youth-africa.aspx.
The risk levels are assessed using the standards described below under each risk factor. Due to the lack of preexisting standards to assess population-level risks for these behaviors, cut-offs were developed for each risk factor based on a review of previous literature (see www.prb.org/Publications/Reports/2014/ncd-risk-youth-africa.aspx). The standards were adjusted up or down to determine the risk levels when the indicator differed from the ones specifi ed here. Data on any age groups between ages 10 and 24 from 2004 or later are considered in the coding. Data points rounded to their nearest integers are used for coding risk levels. Because well-documented sex differences exist for the prevalence for all risk factors, the risk levels are coded by sex when possible.
Tobacco Use. The core indicators are the percent reporting use in the past 30 days of each of the following: cigarettes, other tobacco products, and any tobacco products among 13-to-15-year-old students available in Global Youth Tobacco Survey (World Health Organization (WHO) and U.S. Centers for Disease Control and Prevention (CDC)) and Global School-Based Student Health Survey (GSHS) (WHO and CDC). The standard used for coding is high ≥ 16%; medium = 7%-15%; and low < 7%.
Alcohol Use. The core indicator is the percent reporting any alcohol use in the past 30 days among 13-to-15-year-old students available in GSHS (WHO and CDC). The standard used for coding is high ≥ 40%; medium = 20%-39%; and low < 20%. We use any amount of alcohol use instead of harmful use, since any amount of drinking presents risk among youth both because of the greater health impact of alcohol on young people and the link between the age of onset and likelihood of lifetime alcohol dependency.
Physical Inactivity. The core indicator is the per-cent reporting not engaging in any type of physical activity for at least 60 minutes a day for fi ve days in the past seven days among 13-to-15-year-old students available from GSHS (WHO and CDC). The standard used for coding is high ≥ 70%; medium = 50%-69%; and low < 50%. Surveys usually report physical activity levels rather than inactivity levels, so data used and presented here are 100 percent minus the percent reported to be physically active. In some countries, the measure pertains to the activity level in seven out of the past seven days. For those countries, the standards used to code risk levels were adjusted.
Overweight/Obesity (Unhealthy Diet). The core indicator is the percent reporting overweight or obese among 15-to-19-year-olds available in Demographic and Health Surveys. The standard used for coding is high ≥ 20%; medium = 10%–19%; and low < 10%. The overweight/obesity measure is used as a proxy for unhealthy diet due to the scarcity of comparable data on dietary intake to assess nutrition levels across countries. Overweight/obesity is a physiological change resulting from high caloric consumption and physical inactivity and is assessed with the Body Mass Index (BMI), a measure of weight relative to height. The BMI levels used to classify overweight/obese status vary somewhat across surveys and are specifi ed in the data appendix.
Data Sources
Population and Youth
Carl Haub and Toshiko Kaneda, 2014 World Population Data Sheet (Washington, DC: Population Reference Bureau, 2014).
UN Population Division, World Population Prospects: The 2012 Revision (New York: UN, 2013).
UNESCO Institute for Statistics, online database, accessed at www.uis.unesco.org/Pages/default.aspx.
World Bank, “World Development Indicators,” online database, accessed at http://data.worldbank.org/data-catalog/world-development-indicators.
NCD Mortality
World Health Organization (WHO), World Health Statistics 2014 (Geneva: WHO, 2014).
WHO, Noncommunicable Diseases Country Profi les 2014 (Geneva: WHO, 2014).
NCD Risk Factor Among Youth
WHO and U.S. Centers for Disease Control and Prevention (CDC), Global School-Based Student Health Surveys, accessed at www.who.int/chp/gshs/en/.
WHO and CDC, Global Youth Tobacco Surveys, accessed at http://nccd.cdc.gov/GTSSData/Ancillary/DataReports.aspx?CAID=1.
ICF International, Demographic and Health Surveys, accessed at www.dhsprogram.com.
WHO, STEPwise Approach to Chronic Disease Risk Factor Surveillance (STEPS), accessed at www.who.int/chp/steps/en/.
Various other country-specifi c surveys (see the data appendix for a list of full citations).
Noncommunicable Diseases Are Becoming Leading Cause of Death Throughout Africa
In most countries in North Africa, noncommunicable diseases (NCDs) are already responsible for more than three-quarters of all deaths. In sub-Saharan Africa, where communicable diseases and other health challenges still predominate, NCDs account for more than 25 percent of deaths in 80 percent of the countries. By 2030, NCDs will be the leading cause of death even in sub-Saharan Africa. In low- and middle-income countries a greater share of NCD deaths occur prematurely among people ages 30-70 who are often at the peak of their economic productivity (see “Probability of Premature Death From NCDs Between Ages 30-70, 2012” in the data table). The growing NCD epidemic represents a signifi cant socioeconomic cost to society, due in large part to declines in productivity and increases in health care expenses.
Sources: World Health Organization (WHO), Noncommunicable Diseases Country Profi les 2014 (Geneva: WHO, 2014); and WHO, Global Status Report on Noncommunicable Diseases 2010 (Geneva: WHO, 2010).
Africa’s Large Young Population Will Stress Health Systems as the Cohort Ages
Africa has the world’s youngest population, with more than one-third, or about 360 million Africans, between the ages of 10 and 24. By 2050, these young people will have aged to create a population ages 45 and over—the ages when NCDs hit hardest—that is three times the size it is today. The World Health Organization estimates that 70 percent of premature deaths in adults are the result of behaviors begun in adolescence. Four key risk behaviors for NCDs—tobacco and alcohol use, physical inactivity, and unhealthy diet—are on the rise among young Africans due in part to globalization, urbanization, and socioeconomic development. Addressing these risk factors among young people today can signifi cantly shift the projected trajectory of NCDs in Africa. In the absence of urgent action, NCDs will add tremendous pressure to already overstretched health systems.
Tobacco Use Varies Across Africa, But Sex Difference NarrowingTobacco use is the single most preventable cause of disease, disability, and death in the world. More than 40 million people smoke in Africa. Africans are using more tobacco and are starting to smoke at younger ages, increasing their exposure to and risk for NCDs. About one in 10 adolescents in Africa smokes cigarettes and the same proportion uses other tobacco products (chewing tobacco, snuff, pipes). However, substantial variation exists across countries in levels and types of tobacco products used. For example, cigarettes dominate overall tobacco use in Côte d’Ivoire, South Africa, and Tunisia, while in Zambia, Uganda, and Morocco, the vast majority of overall use comes from products other than cigarettes. About a quarter of 13-to-15-year-old boys in Côte d’Ivoire, Zambia (also girls), and South Africa are regular tobacco users (used any tobacco products in the past 30 days). Tobacco use also tends to coexist with alcohol use, another key risk factor for NCDs. Tobacco use has been typically higher among young men in Africa, but in many countries, young women are catching up.
Sources: World Health Organization and Centers for Disease Control and Prevention, Global Youth Tobacco Survey, accessed at http://nccd.cdc.gov/gtssdata/Ancillary/DataReports.aspx?CAID=1; and Patricio Marquez and Jill Farrington, The Challenge of Non-Communicable Diseases and Road Traffi c Injuries in Sub-Saharan Africa: An Overview (Washington, DC: The World Bank, 2013).
Sources: Carl Haub and Toshiko Kaneda, 2014 World Population Data Sheet (Washington, DC: Population Reference Bureau, 2014); United Nations Population Division, World Population Prospects: The 2012 Revision (Geneva: UN, 2013); and World Health Organization (WHO), Global Health Risks: Mortality and Burden of Disease Attributable to Selected Major Risks (Geneva: WHO, 2009).
I N F O R M | E M P O W E R | A D VA N C E | w w w. p r b . o r g
POPULATION REFERENCE BUREAU
Percent of Deaths Due To Noncommunicable Diseases by Country, 2012
1875 Connecticut Ave., NW, Washington, DC 20009 USA
tel. 202-483-1100 | fax [email protected] | www.prb.org
PRB on: @PRBdata
ACKNOWLEDGMENTSThis data sheet was produced by Toshiko Kaneda, Ph.D., senior research associate at the Population Reference Bureau (PRB) and Reshma Naik, Dr.P.H., senior policy analyst at PRB. Wendy Baldwin, independent consultant, contributed to the preliminary work on this data sheet. Special thanks to Jeffrey Jordan, Susan Rich, and Carl Haub at PRB; Derek Yach at the Vitality Institute; and Francisco Sierra and Sarah Shillito at AstraZeneca Young Health Programme for their insightful review and helpful comments. The authors also thank interns Marisha Wickremsinhe, Sharee Pearson, Adaeze Exeofor, Heather Zaccaro, and Adrianna Zinn for their assistance with data.© 2015 Population Reference Bureau. All rights reserved.Photo credit, cover: © Sean Sprague / Alamy
Tobacco Use, Excessive Use of Alcohol, Insuffi cient Physical Activity, Unhealthy Diet
N O N C O M M U N I C A B L E D I S E A S E SR I S K B E H A V I O R SCardiovascular Diseases, Chronic Respiratory Diseases, Diabetes, Most Cancers
F O R
Males Females
Population (in millions)150 100 50 0 0 50 100 150
Age
80+
75-79
70-74
65-69
60-64
55-59
50-54
45-49
40-44
35-39
30-34
25-29
20-24
15-19
10-14
5-9
0-4
2050 Males
2050 Females
2014 Males
2014 Females
21
6 6 6
1511 12
2 5 5 3 2
5
5
19 20
9
8 8
2
14 11
8
5
M F M F M F M F M F M F
Côte d’Ivoire(2009)
Zambia(2011)
South Africa(2011)
Tunisia (2010)
Uganda(2011)
Morocco(2010)
Use of other tobacco products (no cigarettes)
Cigarette smoking (possibly with use of other tobacco products)
26
11
4
19
16
11
7
2019
242625
Population and Youth NCD Mortality NCD Risk Factors Among Youth
Mid-Year Population (millions)
Youth Ages 10-24,
Percent of Population,
2014
Percent Enrolled in Secondary School
(Gross Enrollment Ratio), 2005/2014
Percent of Total
Population Living
in Urban Areas, 2014
GNI per Capita, PPP
(Current International $),
2013
Age-Standardized Death Rate
for All NCDs (per 100,000),
2012
Percent of Total Deaths
due to NCDs, 2012
Probability of Premature
Death From NCDs
Between Ages 30-70,
2012
Current Tobacco Use
Current Alcohol Use Physical Inactivity Overweight or Obese10Cigarettes Other Products Any Products
2014 2050 Male Female Male Female Male Female Male Female Year Male Female Year Male Female Year Male Female Year
NORTHERN AFRICA NORTHERN AFRICA
Algeria 39.1 60.3 25 96 100 70 13,070 710 77 22 18 1 9 1 21 2 2011 - - -† 69 89 2011 2011 Algeria
Egypt 87.9 146.0 28 87 85 43 10,790 782 85 25 6 1 6 2 9 3 2011 2005 77 90 2011 2011 Egypt
Libya 6.3 8.4 26 96 113 78 - 550 78 18 6 2 8 4 11 5 2010 - - -† - - - 2007 Libya
Morocco 33.3 41.4 27 74 63 60 7,000 708 75 23 3 2 11 6 11 7 2010 - - -† 79 87 2010 2010 Morocco
Sudan 38.8 77.1 32 43 39 34 3,230 551 34 17 9 4 7 5 13 8 2012 - - -† 89 89 2012 2012 Sudan
Tunisia 11.0 13.1 23 89 93 67 10,610 509 82 17 12 2 12 3 20 4 2010 - - -† 74 89 200814 2005 Tunisia
WESTERN AFRICA WESTERN AFRICA
Benin 10.3 21.5 32 65 43 44 1,780 761 36 22 3 2 5 2 5 2 2009 18 13 2009 67 75 2009 - 12 2011-2012 Benin
Burkina Faso 17.9 46.6 33 31 26 29 1,440 784 32 24 14 2 9 5 20 7 2006* - - - - - - - 5 2010 Burkina Faso
Cape Verde 0.5 0.7 32 86 100 65 6,210 482 69 15 4 3 12 9 15 12 2007 - - - - - - - - - Cape Verde
Côte d’Ivoire 20.8 42.3 32 46 32 53 3,090 794 31 23 21 6 10 7 26 11 2009 - - - 2005 - 10 2011-2012 Côte d’Ivoire
The Gambia 1.9 4.9 32 59 56 59 1,610 630 32 19 13 9 30 34 34 37 2008* - - - - - - - - - The Gambia
Ghana 27.0 52.6 31 69 65 53 3,900 670 42 20 9 7 - - - - 2012 18 13 2012 84 84 2012 2012 Ghana
Guinea 11.6 23.9 32 47 29 37 1,160 681 31 21 12 2 23 19 31 20 2008 - - - - - - - 8 2012 Guinea
Guinea-Bissau 1.7 3.5 32 - - 49 1,410 765 28 22 7 3 5 8 12 10 2008* - - - - - - - - - Guinea-Bissau
Liberia 4.4 9.4 32 42 33 49 790 657 34 21 2 1 - - 14 12 2008* - - - - - - 10 7 2013 Liberia
Mali 15.9 45.6 32 50 40 39 1,540 866 31 26 17 3 11 7 23 9 2008 - - - - - - - 7 2012-2013 Mali
Mauritania 4.0 7.9 31 30 29 59 2,850 555 32 16 17 17 19 17 25 23 2010 - - -† 79 89 2010 2010 Mauritania
Niger 18.2 68.0 31 19 13 18 890 649 25 20 12 1 6 7 15 8 2006 2007 2007 - 5 2012 Niger
Nigeria 177.5 396.5 31 46 41 47 5,360 674 24 20 6 1 17 11 19 11 2008* (2013)5 (2010)8 - 6 2013 Nigeria
Senegal 13.9 35.1 32 43 39 43 2,210 558 34 17 12 3 12 8 20 10 2007 4 2 2005 85 94 2005 0 7 2010-2011 Senegal
Sierra Leone 6.3 10.5 32 48 42 40 1,690 964 26 27 7 5 17 22 20 24 20081 - - - - - - 3 8 2013 Sierra Leone
Togo 7.0 14.5 32 58 30 39 1,180 679 30 20 9 2 12 7 18 8 2007 2010# 2010# 2010 Togo
EASTERN AFRICA EASTERN AFRICA
Burundi 10.5 26.7 31 37 29 12 770 729 28 24 6 3 17 14 21 17 2008 - - - - - - - 6 2010 Burundi
Comoros 0.7 1.3 30 63 65 28 1,490 695 37 23 14 7 13 10 22 15 2007 - - - - - - - 14 2012 Comoros
Djibouti 0.9 1.2 30 53 43 77 - 631 36 19 4 3 11 6 13 7 2007 - - -† 81 91 2007 2007 Djibouti
Eritrea 6.5 14.3 31 - - 22 1,180 672 37 24 2 1 6 4 8 5 2006 2004 - - - 2004 Eritrea
Ethiopia 95.9 165.1 35 35 22 19 1,380 476 30 15 - - - - 20102,# 20102,# 20129,# 0 2 2011 Ethiopia
Kenya 43.2 81.3 32 69 65 25 2,780 515 27 18 2012# 2012# (2014)* - 9 2008-2009 Kenya
Madagascar 22.4 52.8 33 39 38 34 1,370 649 39 23 31 10 9 6 33 14 2008 (2013)6 - - - - 1 2008-2009 Madagascar
Malawi 16.8 41.2 33 38 35 16 750 655 28 19 6 4 8 5 10 6 2009 5 3 2009 - - - - 7 2010 Malawi
Mauritius 1.3 1.2 23 94 98 40 17,220 577 85 24 23 9 12 5 25 10 2011 28 22 2011 59 76 2011 2011 Mauritius
Mozambique 25.1 63.5 33 27 25 32 1,100 594 23 17 5 1 10 7 13 7 2007* - - - - - - - 7 2011 Mozambique
Rwanda 11.1 21.0 33 31 34 28 1,450 585 36 19 3 1 12 9 13 10 2008 - - - - - - 0 11 2010 Rwanda
Seychelles 0.1 0.1 22 79 80 54 23,730 - - - 23 20 11 9 27 25 2007 62 61 2007 76 86 200714 2007 Seychelles
Somalia 10.8 27.1 33 10 5 39 - 551 19 19 9 15 15 15 19 22 2004 - - - - - - - - - Somalia
South Sudan 11.7 39.3 33 - - 19 1,860 623 - - - - - - - - - - - - - - - - - - South Sudan
Tanzania 50.8 129.4 32 34 32 31 1,760 570 31 16 5 1 6 5 10 5 20083 7 5 20063 69 80 20063 - 9 2010 Tanzania
Uganda 38.8 104.1 34 29 25 16 1,470 664 27 21 5 5 18 14 19 16 2011 - - - - - - 1 12 2011 Uganda
Zambia 15.1 49.2 33 - - 40 3,810 587 23 18 6 6 24 24 25 26 2011 39 45 2004 90 90 2004 - 8 2007 Zambia
Zimbabwe 14.7 30.2 34 48 47 33 1,690 599 31 19 5 2 11 8 15 8 2008* - - - - - - 1 13 2010-2011 Zimbabwe
MIDDLE AFRICA MIDDLE AFRICA
Angola 22.4 60.8 33 38 25 43 7,000 768 24 24 - - - - - - - - - - - - - - - - Angola
Cameroon 22.8 54.3 33 54 46 54 2,770 675 31 20 9 3 12 7 17 10 20084 - - - - - - - 16 2011 Cameroon
Central African Republic 4.8 9.7 33 24 12 40 600 551 20 18 10 4 24 31 30 35 2008* - - - - - - - - - Central African Republic
Chad 13.3 37.4 33 31 14 22 2,010 713 21 23 8 4 17 12 21 14 2008 - - - - - - - 4 2004 Chad
Congo 4.6 10.6 31 57 50 65 4,600 632 30 20 15 8 16 18 26 22 2006 - - - - - - - 6 2011-2012 Congo
Congo, Dem. Rep. 71.2 193.6 33 54 32 42 740 724 23 24 12 4 29 28 37 29 2008* 2004-20067 2005 - 8 2013-2014 Congo, Dem. Rep.
Equatorial Guinea 0.8 1.6 30 33 24 40 23,270 729 31 23 10 3 20 15 25 17 2008 - - - - - - 5 17 2011 Equatorial Guinea
Gabon 1.7 3.3 31 - - 87 17,230 505 36 15 - - - - 2009 - - - - - - - 16 2012 Gabon
Sao Tome and Principe 0.2 0.4 31 76 85 65 2,950 - - - 6 3 30 22 31 23 2010 - - - - - - - 13 2008-2009 Sao Tome and Principe
SOUTHERN AFRICA SOUTHERN AFRICA
Botswana 2.0 2.8 33 79 84 57 15,640 612 37 21 13 5 16 14 23 16 2008 23 19 2005 87 90 2005 - - - Botswana
Lesotho 1.9 2.7 35 45 62 27 3,160 672 27 24 12 8 20 18 26 22 2008 - - - - - - 1 20 2009 Lesotho
Namibia 2.3 3.7 33 60 70 46 9,490 580 43 20 10 6 - - 14 9 2013 26 21 2013 85 86 2013 2013 Namibia
South Africa 53.7 64.1 27 107 114 64 12,240 711 43 27 15 11 14 13 24 19 2011 2011 2008 2011 South Africa
Swaziland 1.3 1.8 35 61 60 21 6,060 702 28 21 9 3 9 7 15 9 2005 - - - - - - 2013 Swaziland
This data sheet was funded by the AstraZeneca Young Health Programme (YHP). YHP is a partnership among AstraZeneca, Johns Hopkins Bloomberg School of Public Health, and Plan International, with local NGO partners also implementing YHP programs on the ground. The YHP mission is to positively impact the health of adolescents in marginalized communities worldwide through research, advocacy, and on-the-ground programs focused on NCD prevention.
www.younghealthprogrammeyhp.com
Many Countries Face the Double Burden of Overnutrition and Undernutrition Sub-Saharan Africa is undergoing a nutrition transition, with overweight and obesity emerging as critical public health issues even in some countries where undernutrition is still a big problem. Among 15-to-19-year-old girls in Benin, Rwanda, Uganda, and Zimbabwe, approximately one in eight girls are overweight or obese, whereas about one in seven girls are underweight. Girls are often more likely than boys to be overweight or obese. Urbanization and globalization have led to more sedentary lifestyles and to high-calorie diets fi lled with highly processed foods that are low in fruits and vegetables, and high in saturated fat, sodium, and sugar. These shifts in diet and exercise patterns are leading to a rise in NCDs such as type 2 diabetes, cardiovascular disease, stroke, and certain cancers.
Source: ICF International, Demographic and Health Surveys, accessed at www.dhsprogram.com.
Overweight or obese Underweight
13
14
13
14
17
10
12
11
12
12
13
16
16
20
Rwanda (2010)
Uganda (2011)
Benin (2011-2012)
Zimbabwe (2010-2011)
Gabon (2012)
Cameroon (2011)
Lesotho (2009) 32
26
33
27
25
26
24
Percent of Women 15-19 Years Old Who Are Overweight/Obese or Underweight, Select CountriesPopulation Pyramid, Africa: 2014 and 2050
Population Size
2014 1,136 million
2050 2,428 million
Percent of Boys and Girls 13-15 Years Old in Secondary Schools Who Used Tobacco Products in the Past 30 Days, Select Countries
Addressing Risk Factors for Noncommunicable Diseases Among Young People in Africa: Key To Prevention and Sustainable Development
*Includes only Cape Verde, 69 percent.
Current Tobacco UsePercent using cigarettes/other tobacco products/any products in the past 30 days among 13-15-year-old
secondary school students11
16% or Above 7% to 15% Below 7%
Current Alcohol UsePercent having any drinks with alcohol in the past 30 days
among 13-15-year-old secondary school students12
40% or Above 20% to 39% Below 20%
Physical InactivityPercent not engaging in physical activity for at least 60 min/day on fi ve out of the last seven days among
13-15-year-old secondary school students12
70% or Above 50% to 69% Below 50%
Overweight or ObesePercent who are overweight or obese
among 15-19-year-olds13
20% or Above 10% to 19% Below 10%
Definition of Risk Levels
High Risk Medium Risk Low Risk
Notes:Data points for the risk factors appear for countries with comparable data available from the following surveys: Global Youth Tobacco Survey and Global School-Based Student Health Survey for tobacco use, Global School-Based Student Health Survey for both alcohol use and physical inactivity, and Demographic and Health Surveys for overweight status. For the countries without data from these surveys, data from other sources were used whenever possible to assess risk levels. Only the colors showing risk levels are displayed for these countries. Data points underlying all risk levels are available in the data appendix at http://www.prb.org/Publications/Datasheets/2015/ncd-risk-youth-africa.aspx.
Data in italics are based on samples from the following cities/regions and are not nationally representative.
* National capital1 Western Area2 Harar Town3 Dar es Salaam4 Central District5 Ibadan6 Six largest urban cities7 All provincial capital cities8 Abeokuta9 Hawassa City
10 Proxy for unhealthy diet11 Based on the Global Youth Tobacco Survey and the Global
School-Based Student Health Survey12 Based on the Global School-Based Student Health Survey13 Based on the Demographic and Health Survey14 Risk level for male was coded as yellow instead of red because
the measure pertains to physical inactivity level in seven out of the last seven days in this country
† Countries where Global School-Based Student Health Survey has been conducted but did not collect data on alcohol use
# Data are not available by sex when the columns are not divided(-) Indicates data unavailable or inapplicable
Year in brackets indicates publication year for the data where data year is missing

© 2015 Population Reference Bureau See notes on page 11 NONCOMMUNICABLE DISEASES AMONG YOUNG PEOPLE IN AFRICA 5
Less than 25%25% to 34%35% to 49%50% to 74%*75% or moreData not available
The POPULATION REFERENCE BUREAU informs people around the
world about population, health, and the environment, and empowers them to
use that information to advance the well-being of current and future generations.
INFORMPRB informs people around the world and in the United States about issues related to population, health, and the environment. To do this, we transform technical data and research into accurate, easy-to-understand information.
EMPOWERPRB empowers people—researchers, journalists, policymakers, and educators—to use information about population, health, and the environment to encourage action.
ADVANCEPRB works to advance the well-being of current and future generations. Toward that end, we analyze data and research, disseminate information, and empower people to use that information in order to inform policymaking.
Note: This data sheet accompanies the policy brief entitled Noncommunicable Diseases in Africa: Youth Are Key to Curbing the Epidemic and Achieving Sustainable Development. The data sheet is accompanied by a data appendix that provides all available country-specifi c data and data sources on four key noncommunicable (NCD) risk factors among young people in Africa since 2004. These publications extend an earlier publication, Noncommunicable Diseases Risk Factors Among Young People in Africa: Data Availability and Sources. All are available at www.prb.org/Publications/Datasheets/2015/ncd-risk-youth-africa.aspx.
Technical Notes
This data sheet lists all countries in North and sub-Saharan Africa with populations of 150,000 or more and all members of the UN. Countries with unavailable data for most indicators are, however, excluded.
NCD Risks. The data sheet focuses on four specifi c behaviors—tobacco use, harmful use of alcohol, physical inactivity, and unhealthy diet—identifi ed by the World Health Organization to be key NCD risk factors. Data availability on these risk factors among young people is limited in Africa. Available data are typically not directly comparable across a large number of countries. They may measure the levels of risk using different indicators, at different geographic levels (national, regional), for different age groups, and from different settings (all youth, youth in schools). To facilitate the cross-country comparison of risk levels and to focus attention on the broader picture, the risk levels are presented here as high (red), medium (yellow), or low (green).
Risk levels are assessed by fi rst identifying the core indicator for each risk factor that is suitable and for which data are consistently available for the largest number of countries. For countries with data on the core indicators, both risk levels and data points are presented. For countries without data on the core indicators, only risk levels are presented. These levels are based on alternative indicators or data that are otherwise not directly comparable (such as different
age groups, indicator defi nitions) but that still enable assessment of risk levels using similar standards. All data points underlying risk levels and the data sources are available for each risk factor per country in the data appendix accessible at www.prb.org/Publications/Datasheets/2015/ncd-risk-youth-africa.aspx.
The risk levels are assessed using the standards described below under each risk factor. Due to the lack of preexisting standards to assess population-level risks for these behaviors, cut-offs were developed for each risk factor based on a review of previous literature (see www.prb.org/Publications/Reports/2014/ncd-risk-youth-africa.aspx). The standards were adjusted up or down to determine the risk levels when the indicator differed from the ones specifi ed here. Data on any age groups between ages 10 and 24 from 2004 or later are considered in the coding. Data points rounded to their nearest integers are used for coding risk levels. Because well-documented sex differences exist for the prevalence for all risk factors, the risk levels are coded by sex when possible.
Tobacco Use. The core indicators are the percent reporting use in the past 30 days of each of the following: cigarettes, other tobacco products, and any tobacco products among 13-to-15-year-old students available in Global Youth Tobacco Survey (World Health Organization (WHO) and U.S. Centers for Disease Control and Prevention (CDC)) and Global School-Based Student Health Survey (GSHS) (WHO and CDC). The standard used for coding is high ≥ 16%; medium = 7%-15%; and low < 7%.
Alcohol Use. The core indicator is the percent reporting any alcohol use in the past 30 days among 13-to-15-year-old students available in GSHS (WHO and CDC). The standard used for coding is high ≥ 40%; medium = 20%-39%; and low < 20%. We use any amount of alcohol use instead of harmful use, since any amount of drinking presents risk among youth both because of the greater health impact of alcohol on young people and the link between the age of onset and likelihood of lifetime alcohol dependency.
Physical Inactivity. The core indicator is the per-cent reporting not engaging in any type of physical activity for at least 60 minutes a day for fi ve days in the past seven days among 13-to-15-year-old students available from GSHS (WHO and CDC). The standard used for coding is high ≥ 70%; medium = 50%-69%; and low < 50%. Surveys usually report physical activity levels rather than inactivity levels, so data used and presented here are 100 percent minus the percent reported to be physically active. In some countries, the measure pertains to the activity level in seven out of the past seven days. For those countries, the standards used to code risk levels were adjusted.
Overweight/Obesity (Unhealthy Diet). The core indicator is the percent reporting overweight or obese among 15-to-19-year-olds available in Demographic and Health Surveys. The standard used for coding is high ≥ 20%; medium = 10%–19%; and low < 10%. The overweight/obesity measure is used as a proxy for unhealthy diet due to the scarcity of comparable data on dietary intake to assess nutrition levels across countries. Overweight/obesity is a physiological change resulting from high caloric consumption and physical inactivity and is assessed with the Body Mass Index (BMI), a measure of weight relative to height. The BMI levels used to classify overweight/obese status vary somewhat across surveys and are specifi ed in the data appendix.
Data Sources
Population and Youth
Carl Haub and Toshiko Kaneda, 2014 World Population Data Sheet (Washington, DC: Population Reference Bureau, 2014).
UN Population Division, World Population Prospects: The 2012 Revision (New York: UN, 2013).
UNESCO Institute for Statistics, online database, accessed at www.uis.unesco.org/Pages/default.aspx.
World Bank, “World Development Indicators,” online database, accessed at http://data.worldbank.org/data-catalog/world-development-indicators.
NCD Mortality
World Health Organization (WHO), World Health Statistics 2014 (Geneva: WHO, 2014).
WHO, Noncommunicable Diseases Country Profi les 2014 (Geneva: WHO, 2014).
NCD Risk Factor Among Youth
WHO and U.S. Centers for Disease Control and Prevention (CDC), Global School-Based Student Health Surveys, accessed at www.who.int/chp/gshs/en/.
WHO and CDC, Global Youth Tobacco Surveys, accessed at http://nccd.cdc.gov/GTSSData/Ancillary/DataReports.aspx?CAID=1.
ICF International, Demographic and Health Surveys, accessed at www.dhsprogram.com.
WHO, STEPwise Approach to Chronic Disease Risk Factor Surveillance (STEPS), accessed at www.who.int/chp/steps/en/.
Various other country-specifi c surveys (see the data appendix for a list of full citations).
Noncommunicable Diseases Are Becoming Leading Cause of Death Throughout Africa
In most countries in North Africa, noncommunicable diseases (NCDs) are already responsible for more than three-quarters of all deaths. In sub-Saharan Africa, where communicable diseases and other health challenges still predominate, NCDs account for more than 25 percent of deaths in 80 percent of the countries. By 2030, NCDs will be the leading cause of death even in sub-Saharan Africa. In low- and middle-income countries a greater share of NCD deaths occur prematurely among people ages 30-70 who are often at the peak of their economic productivity (see “Probability of Premature Death From NCDs Between Ages 30-70, 2012” in the data table). The growing NCD epidemic represents a signifi cant socioeconomic cost to society, due in large part to declines in productivity and increases in health care expenses.
Sources: World Health Organization (WHO), Noncommunicable Diseases Country Profi les 2014 (Geneva: WHO, 2014); and WHO, Global Status Report on Noncommunicable Diseases 2010 (Geneva: WHO, 2010).
Africa’s Large Young Population Will Stress Health Systems as the Cohort Ages
Africa has the world’s youngest population, with more than one-third, or about 360 million Africans, between the ages of 10 and 24. By 2050, these young people will have aged to create a population ages 45 and over—the ages when NCDs hit hardest—that is three times the size it is today. The World Health Organization estimates that 70 percent of premature deaths in adults are the result of behaviors begun in adolescence. Four key risk behaviors for NCDs—tobacco and alcohol use, physical inactivity, and unhealthy diet—are on the rise among young Africans due in part to globalization, urbanization, and socioeconomic development. Addressing these risk factors among young people today can signifi cantly shift the projected trajectory of NCDs in Africa. In the absence of urgent action, NCDs will add tremendous pressure to already overstretched health systems.
Tobacco Use Varies Across Africa, But Sex Difference NarrowingTobacco use is the single most preventable cause of disease, disability, and death in the world. More than 40 million people smoke in Africa. Africans are using more tobacco and are starting to smoke at younger ages, increasing their exposure to and risk for NCDs. About one in 10 adolescents in Africa smokes cigarettes and the same proportion uses other tobacco products (chewing tobacco, snuff, pipes). However, substantial variation exists across countries in levels and types of tobacco products used. For example, cigarettes dominate overall tobacco use in Côte d’Ivoire, South Africa, and Tunisia, while in Zambia, Uganda, and Morocco, the vast majority of overall use comes from products other than cigarettes. About a quarter of 13-to-15-year-old boys in Côte d’Ivoire, Zambia (also girls), and South Africa are regular tobacco users (used any tobacco products in the past 30 days). Tobacco use also tends to coexist with alcohol use, another key risk factor for NCDs. Tobacco use has been typically higher among young men in Africa, but in many countries, young women are catching up.
Sources: World Health Organization and Centers for Disease Control and Prevention, Global Youth Tobacco Survey, accessed at http://nccd.cdc.gov/gtssdata/Ancillary/DataReports.aspx?CAID=1; and Patricio Marquez and Jill Farrington, The Challenge of Non-Communicable Diseases and Road Traffi c Injuries in Sub-Saharan Africa: An Overview (Washington, DC: The World Bank, 2013).
Sources: Carl Haub and Toshiko Kaneda, 2014 World Population Data Sheet (Washington, DC: Population Reference Bureau, 2014); United Nations Population Division, World Population Prospects: The 2012 Revision (Geneva: UN, 2013); and World Health Organization (WHO), Global Health Risks: Mortality and Burden of Disease Attributable to Selected Major Risks (Geneva: WHO, 2009).
I N F O R M | E M P O W E R | A D VA N C E | w w w. p r b . o r g
POPULATION REFERENCE BUREAU
Percent of Deaths Due To Noncommunicable Diseases by Country, 2012
1875 Connecticut Ave., NW, Washington, DC 20009 USA
tel. 202-483-1100 | fax [email protected] | www.prb.org
PRB on: @PRBdata
ACKNOWLEDGMENTSThis data sheet was produced by Toshiko Kaneda, Ph.D., senior research associate at the Population Reference Bureau (PRB) and Reshma Naik, Dr.P.H., senior policy analyst at PRB. Wendy Baldwin, independent consultant, contributed to the preliminary work on this data sheet. Special thanks to Jeffrey Jordan, Susan Rich, and Carl Haub at PRB; Derek Yach at the Vitality Institute; and Francisco Sierra and Sarah Shillito at AstraZeneca Young Health Programme for their insightful review and helpful comments. The authors also thank interns Marisha Wickremsinhe, Sharee Pearson, Adaeze Exeofor, Heather Zaccaro, and Adrianna Zinn for their assistance with data.© 2015 Population Reference Bureau. All rights reserved.Photo credit, cover: © Sean Sprague / Alamy
Tobacco Use, Excessive Use of Alcohol, Insuffi cient Physical Activity, Unhealthy Diet
N O N C O M M U N I C A B L E D I S E A S E SR I S K B E H A V I O R SCardiovascular Diseases, Chronic Respiratory Diseases, Diabetes, Most Cancers
F O R
Males Females
Population (in millions)150 100 50 0 0 50 100 150
Age
80+
75-79
70-74
65-69
60-64
55-59
50-54
45-49
40-44
35-39
30-34
25-29
20-24
15-19
10-14
5-9
0-4
2050 Males
2050 Females
2014 Males
2014 Females
21
6 6 6
1511 12
2 5 5 3 2
5
5
19 20
9
8 8
2
14 11
8
5
M F M F M F M F M F M F
Côte d’Ivoire(2009)
Zambia(2011)
South Africa(2011)
Tunisia (2010)
Uganda(2011)
Morocco(2010)
Use of other tobacco products (no cigarettes)
Cigarette smoking (possibly with use of other tobacco products)
26
11
4
19
16
11
7
2019
242625
Population and Youth NCD Mortality NCD Risk Factors Among Youth
Mid-Year Population (millions)
Youth Ages 10-24,
Percent of Population,
2014
Percent Enrolled in Secondary School
(Gross Enrollment Ratio), 2005/2014
Percent of Total
Population Living
in Urban Areas, 2014
GNI per Capita, PPP
(Current International $),
2013
Age-Standardized Death Rate
for All NCDs (per 100,000),
2012
Percent of Total Deaths
due to NCDs, 2012
Probability of Premature
Death From NCDs
Between Ages 30-70,
2012
Current Tobacco Use
Current Alcohol Use Physical Inactivity Overweight or Obese10Cigarettes Other Products Any Products
2014 2050 Male Female Male Female Male Female Male Female Year Male Female Year Male Female Year Male Female Year
NORTHERN AFRICA NORTHERN AFRICA
Algeria 39.1 60.3 25 96 100 70 13,070 710 77 22 18 1 9 1 21 2 2011 - - -† 69 89 2011 2011 Algeria
Egypt 87.9 146.0 28 87 85 43 10,790 782 85 25 6 1 6 2 9 3 2011 2005 77 90 2011 2011 Egypt
Libya 6.3 8.4 26 96 113 78 - 550 78 18 6 2 8 4 11 5 2010 - - -† - - - 2007 Libya
Morocco 33.3 41.4 27 74 63 60 7,000 708 75 23 3 2 11 6 11 7 2010 - - -† 79 87 2010 2010 Morocco
Sudan 38.8 77.1 32 43 39 34 3,230 551 34 17 9 4 7 5 13 8 2012 - - -† 89 89 2012 2012 Sudan
Tunisia 11.0 13.1 23 89 93 67 10,610 509 82 17 12 2 12 3 20 4 2010 - - -† 74 89 200814 2005 Tunisia
WESTERN AFRICA WESTERN AFRICA
Benin 10.3 21.5 32 65 43 44 1,780 761 36 22 3 2 5 2 5 2 2009 18 13 2009 67 75 2009 - 12 2011-2012 Benin
Burkina Faso 17.9 46.6 33 31 26 29 1,440 784 32 24 14 2 9 5 20 7 2006* - - - - - - - 5 2010 Burkina Faso
Cape Verde 0.5 0.7 32 86 100 65 6,210 482 69 15 4 3 12 9 15 12 2007 - - - - - - - - - Cape Verde
Côte d’Ivoire 20.8 42.3 32 46 32 53 3,090 794 31 23 21 6 10 7 26 11 2009 - - - 2005 - 10 2011-2012 Côte d’Ivoire
The Gambia 1.9 4.9 32 59 56 59 1,610 630 32 19 13 9 30 34 34 37 2008* - - - - - - - - - The Gambia
Ghana 27.0 52.6 31 69 65 53 3,900 670 42 20 9 7 - - - - 2012 18 13 2012 84 84 2012 2012 Ghana
Guinea 11.6 23.9 32 47 29 37 1,160 681 31 21 12 2 23 19 31 20 2008 - - - - - - - 8 2012 Guinea
Guinea-Bissau 1.7 3.5 32 - - 49 1,410 765 28 22 7 3 5 8 12 10 2008* - - - - - - - - - Guinea-Bissau
Liberia 4.4 9.4 32 42 33 49 790 657 34 21 2 1 - - 14 12 2008* - - - - - - 10 7 2013 Liberia
Mali 15.9 45.6 32 50 40 39 1,540 866 31 26 17 3 11 7 23 9 2008 - - - - - - - 7 2012-2013 Mali
Mauritania 4.0 7.9 31 30 29 59 2,850 555 32 16 17 17 19 17 25 23 2010 - - -† 79 89 2010 2010 Mauritania
Niger 18.2 68.0 31 19 13 18 890 649 25 20 12 1 6 7 15 8 2006 2007 2007 - 5 2012 Niger
Nigeria 177.5 396.5 31 46 41 47 5,360 674 24 20 6 1 17 11 19 11 2008* (2013)5 (2010)8 - 6 2013 Nigeria
Senegal 13.9 35.1 32 43 39 43 2,210 558 34 17 12 3 12 8 20 10 2007 4 2 2005 85 94 2005 0 7 2010-2011 Senegal
Sierra Leone 6.3 10.5 32 48 42 40 1,690 964 26 27 7 5 17 22 20 24 20081 - - - - - - 3 8 2013 Sierra Leone
Togo 7.0 14.5 32 58 30 39 1,180 679 30 20 9 2 12 7 18 8 2007 2010# 2010# 2010 Togo
EASTERN AFRICA EASTERN AFRICA
Burundi 10.5 26.7 31 37 29 12 770 729 28 24 6 3 17 14 21 17 2008 - - - - - - - 6 2010 Burundi
Comoros 0.7 1.3 30 63 65 28 1,490 695 37 23 14 7 13 10 22 15 2007 - - - - - - - 14 2012 Comoros
Djibouti 0.9 1.2 30 53 43 77 - 631 36 19 4 3 11 6 13 7 2007 - - -† 81 91 2007 2007 Djibouti
Eritrea 6.5 14.3 31 - - 22 1,180 672 37 24 2 1 6 4 8 5 2006 2004 - - - 2004 Eritrea
Ethiopia 95.9 165.1 35 35 22 19 1,380 476 30 15 - - - - 20102,# 20102,# 20129,# 0 2 2011 Ethiopia
Kenya 43.2 81.3 32 69 65 25 2,780 515 27 18 2012# 2012# (2014)* - 9 2008-2009 Kenya
Madagascar 22.4 52.8 33 39 38 34 1,370 649 39 23 31 10 9 6 33 14 2008 (2013)6 - - - - 1 2008-2009 Madagascar
Malawi 16.8 41.2 33 38 35 16 750 655 28 19 6 4 8 5 10 6 2009 5 3 2009 - - - - 7 2010 Malawi
Mauritius 1.3 1.2 23 94 98 40 17,220 577 85 24 23 9 12 5 25 10 2011 28 22 2011 59 76 2011 2011 Mauritius
Mozambique 25.1 63.5 33 27 25 32 1,100 594 23 17 5 1 10 7 13 7 2007* - - - - - - - 7 2011 Mozambique
Rwanda 11.1 21.0 33 31 34 28 1,450 585 36 19 3 1 12 9 13 10 2008 - - - - - - 0 11 2010 Rwanda
Seychelles 0.1 0.1 22 79 80 54 23,730 - - - 23 20 11 9 27 25 2007 62 61 2007 76 86 200714 2007 Seychelles
Somalia 10.8 27.1 33 10 5 39 - 551 19 19 9 15 15 15 19 22 2004 - - - - - - - - - Somalia
South Sudan 11.7 39.3 33 - - 19 1,860 623 - - - - - - - - - - - - - - - - - - South Sudan
Tanzania 50.8 129.4 32 34 32 31 1,760 570 31 16 5 1 6 5 10 5 20083 7 5 20063 69 80 20063 - 9 2010 Tanzania
Uganda 38.8 104.1 34 29 25 16 1,470 664 27 21 5 5 18 14 19 16 2011 - - - - - - 1 12 2011 Uganda
Zambia 15.1 49.2 33 - - 40 3,810 587 23 18 6 6 24 24 25 26 2011 39 45 2004 90 90 2004 - 8 2007 Zambia
Zimbabwe 14.7 30.2 34 48 47 33 1,690 599 31 19 5 2 11 8 15 8 2008* - - - - - - 1 13 2010-2011 Zimbabwe
MIDDLE AFRICA MIDDLE AFRICA
Angola 22.4 60.8 33 38 25 43 7,000 768 24 24 - - - - - - - - - - - - - - - - Angola
Cameroon 22.8 54.3 33 54 46 54 2,770 675 31 20 9 3 12 7 17 10 20084 - - - - - - - 16 2011 Cameroon
Central African Republic 4.8 9.7 33 24 12 40 600 551 20 18 10 4 24 31 30 35 2008* - - - - - - - - - Central African Republic
Chad 13.3 37.4 33 31 14 22 2,010 713 21 23 8 4 17 12 21 14 2008 - - - - - - - 4 2004 Chad
Congo 4.6 10.6 31 57 50 65 4,600 632 30 20 15 8 16 18 26 22 2006 - - - - - - - 6 2011-2012 Congo
Congo, Dem. Rep. 71.2 193.6 33 54 32 42 740 724 23 24 12 4 29 28 37 29 2008* 2004-20067 2005 - 8 2013-2014 Congo, Dem. Rep.
Equatorial Guinea 0.8 1.6 30 33 24 40 23,270 729 31 23 10 3 20 15 25 17 2008 - - - - - - 5 17 2011 Equatorial Guinea
Gabon 1.7 3.3 31 - - 87 17,230 505 36 15 - - - - 2009 - - - - - - - 16 2012 Gabon
Sao Tome and Principe 0.2 0.4 31 76 85 65 2,950 - - - 6 3 30 22 31 23 2010 - - - - - - - 13 2008-2009 Sao Tome and Principe
SOUTHERN AFRICA SOUTHERN AFRICA
Botswana 2.0 2.8 33 79 84 57 15,640 612 37 21 13 5 16 14 23 16 2008 23 19 2005 87 90 2005 - - - Botswana
Lesotho 1.9 2.7 35 45 62 27 3,160 672 27 24 12 8 20 18 26 22 2008 - - - - - - 1 20 2009 Lesotho
Namibia 2.3 3.7 33 60 70 46 9,490 580 43 20 10 6 - - 14 9 2013 26 21 2013 85 86 2013 2013 Namibia
South Africa 53.7 64.1 27 107 114 64 12,240 711 43 27 15 11 14 13 24 19 2011 2011 2008 2011 South Africa
Swaziland 1.3 1.8 35 61 60 21 6,060 702 28 21 9 3 9 7 15 9 2005 - - - - - - 2013 Swaziland
This data sheet was funded by the AstraZeneca Young Health Programme (YHP). YHP is a partnership among AstraZeneca, Johns Hopkins Bloomberg School of Public Health, and Plan International, with local NGO partners also implementing YHP programs on the ground. The YHP mission is to positively impact the health of adolescents in marginalized communities worldwide through research, advocacy, and on-the-ground programs focused on NCD prevention.
www.younghealthprogrammeyhp.com
Many Countries Face the Double Burden of Overnutrition and Undernutrition Sub-Saharan Africa is undergoing a nutrition transition, with overweight and obesity emerging as critical public health issues even in some countries where undernutrition is still a big problem. Among 15-to-19-year-old girls in Benin, Rwanda, Uganda, and Zimbabwe, approximately one in eight girls are overweight or obese, whereas about one in seven girls are underweight. Girls are often more likely than boys to be overweight or obese. Urbanization and globalization have led to more sedentary lifestyles and to high-calorie diets fi lled with highly processed foods that are low in fruits and vegetables, and high in saturated fat, sodium, and sugar. These shifts in diet and exercise patterns are leading to a rise in NCDs such as type 2 diabetes, cardiovascular disease, stroke, and certain cancers.
Source: ICF International, Demographic and Health Surveys, accessed at www.dhsprogram.com.
Overweight or obese Underweight
13
14
13
14
17
10
12
11
12
12
13
16
16
20
Rwanda (2010)
Uganda (2011)
Benin (2011-2012)
Zimbabwe (2010-2011)
Gabon (2012)
Cameroon (2011)
Lesotho (2009) 32
26
33
27
25
26
24
Percent of Women 15-19 Years Old Who Are Overweight/Obese or Underweight, Select CountriesPopulation Pyramid, Africa: 2014 and 2050
Population Size
2014 1,136 million
2050 2,428 million
Percent of Boys and Girls 13-15 Years Old in Secondary Schools Who Used Tobacco Products in the Past 30 Days, Select Countries
Addressing Risk Factors for Noncommunicable Diseases Among Young People in Africa: Key To Prevention and Sustainable Development
*Includes only Cape Verde, 69 percent.
Current Tobacco UsePercent using cigarettes/other tobacco products/any products in the past 30 days among 13-15-year-old
secondary school students11
16% or Above 7% to 15% Below 7%
Current Alcohol UsePercent having any drinks with alcohol in the past 30 days
among 13-15-year-old secondary school students12
40% or Above 20% to 39% Below 20%
Physical InactivityPercent not engaging in physical activity for at least 60 min/day on fi ve out of the last seven days among
13-15-year-old secondary school students12
70% or Above 50% to 69% Below 50%
Overweight or ObesePercent who are overweight or obese
among 15-19-year-olds13
20% or Above 10% to 19% Below 10%
Definition of Risk Levels
High Risk Medium Risk Low Risk
Notes:Data points for the risk factors appear for countries with comparable data available from the following surveys: Global Youth Tobacco Survey and Global School-Based Student Health Survey for tobacco use, Global School-Based Student Health Survey for both alcohol use and physical inactivity, and Demographic and Health Surveys for overweight status. For the countries without data from these surveys, data from other sources were used whenever possible to assess risk levels. Only the colors showing risk levels are displayed for these countries. Data points underlying all risk levels are available in the data appendix at http://www.prb.org/Publications/Datasheets/2015/ncd-risk-youth-africa.aspx.
Data in italics are based on samples from the following cities/regions and are not nationally representative.
* National capital1 Western Area2 Harar Town3 Dar es Salaam4 Central District5 Ibadan6 Six largest urban cities7 All provincial capital cities8 Abeokuta9 Hawassa City
10 Proxy for unhealthy diet11 Based on the Global Youth Tobacco Survey and the Global
School-Based Student Health Survey12 Based on the Global School-Based Student Health Survey13 Based on the Demographic and Health Survey14 Risk level for male was coded as yellow instead of red because
the measure pertains to physical inactivity level in seven out of the last seven days in this country
† Countries where Global School-Based Student Health Survey has been conducted but did not collect data on alcohol use
# Data are not available by sex when the columns are not divided(-) Indicates data unavailable or inapplicable
Year in brackets indicates publication year for the data where data year is missing
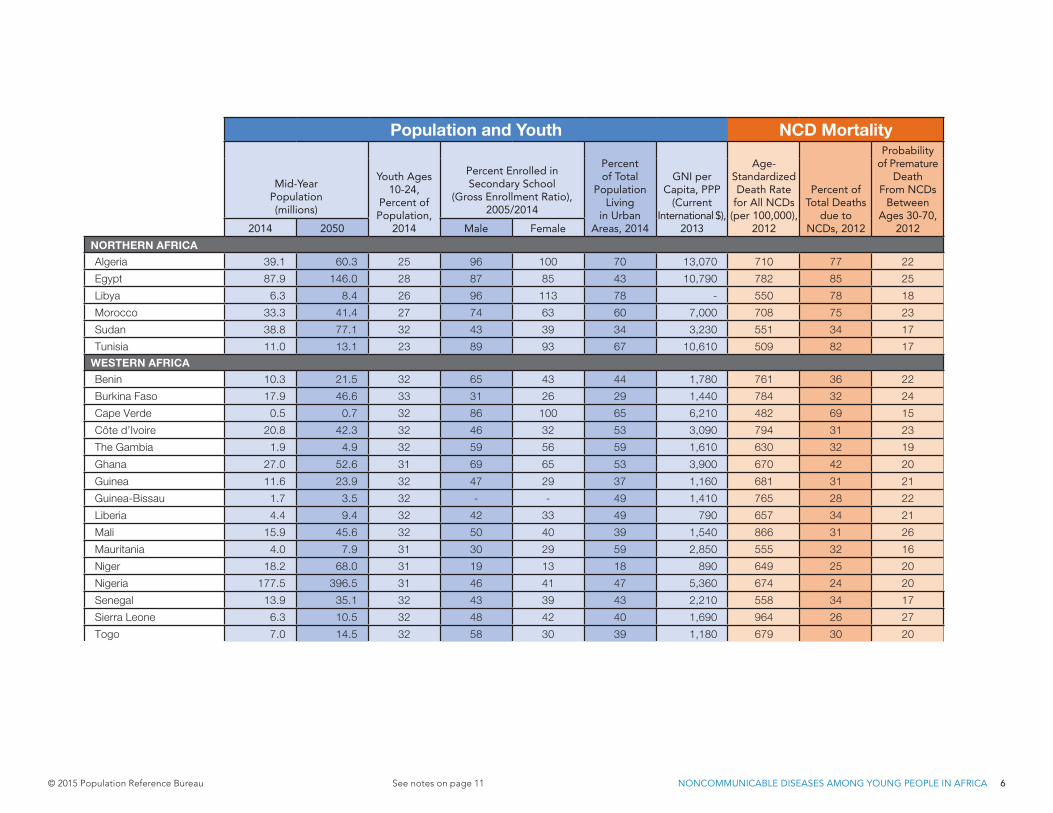
© 2015 Population Reference Bureau See notes on page 11 NONCOMMUNICABLE DISEASES AMONG YOUNG PEOPLE IN AFRICA 6
Less than 25%25% to 34%35% to 49%50% to 74%*75% or moreData not available
The POPULATION REFERENCE BUREAU informs people around the
world about population, health, and the environment, and empowers them to
use that information to advance the well-being of current and future generations.
INFORMPRB informs people around the world and in the United States about issues related to population, health, and the environment. To do this, we transform technical data and research into accurate, easy-to-understand information.
EMPOWERPRB empowers people—researchers, journalists, policymakers, and educators—to use information about population, health, and the environment to encourage action.
ADVANCEPRB works to advance the well-being of current and future generations. Toward that end, we analyze data and research, disseminate information, and empower people to use that information in order to inform policymaking.
Note: This data sheet accompanies the policy brief entitled Noncommunicable Diseases in Africa: Youth Are Key to Curbing the Epidemic and Achieving Sustainable Development. The data sheet is accompanied by a data appendix that provides all available country-specifi c data and data sources on four key noncommunicable (NCD) risk factors among young people in Africa since 2004. These publications extend an earlier publication, Noncommunicable Diseases Risk Factors Among Young People in Africa: Data Availability and Sources. All are available at www.prb.org/Publications/Datasheets/2015/ncd-risk-youth-africa.aspx.
Technical Notes
This data sheet lists all countries in North and sub-Saharan Africa with populations of 150,000 or more and all members of the UN. Countries with unavailable data for most indicators are, however, excluded.
NCD Risks. The data sheet focuses on four specifi c behaviors—tobacco use, harmful use of alcohol, physical inactivity, and unhealthy diet—identifi ed by the World Health Organization to be key NCD risk factors. Data availability on these risk factors among young people is limited in Africa. Available data are typically not directly comparable across a large number of countries. They may measure the levels of risk using different indicators, at different geographic levels (national, regional), for different age groups, and from different settings (all youth, youth in schools). To facilitate the cross-country comparison of risk levels and to focus attention on the broader picture, the risk levels are presented here as high (red), medium (yellow), or low (green).
Risk levels are assessed by fi rst identifying the core indicator for each risk factor that is suitable and for which data are consistently available for the largest number of countries. For countries with data on the core indicators, both risk levels and data points are presented. For countries without data on the core indicators, only risk levels are presented. These levels are based on alternative indicators or data that are otherwise not directly comparable (such as different
age groups, indicator defi nitions) but that still enable assessment of risk levels using similar standards. All data points underlying risk levels and the data sources are available for each risk factor per country in the data appendix accessible at www.prb.org/Publications/Datasheets/2015/ncd-risk-youth-africa.aspx.
The risk levels are assessed using the standards described below under each risk factor. Due to the lack of preexisting standards to assess population-level risks for these behaviors, cut-offs were developed for each risk factor based on a review of previous literature (see www.prb.org/Publications/Reports/2014/ncd-risk-youth-africa.aspx). The standards were adjusted up or down to determine the risk levels when the indicator differed from the ones specifi ed here. Data on any age groups between ages 10 and 24 from 2004 or later are considered in the coding. Data points rounded to their nearest integers are used for coding risk levels. Because well-documented sex differences exist for the prevalence for all risk factors, the risk levels are coded by sex when possible.
Tobacco Use. The core indicators are the percent reporting use in the past 30 days of each of the following: cigarettes, other tobacco products, and any tobacco products among 13-to-15-year-old students available in Global Youth Tobacco Survey (World Health Organization (WHO) and U.S. Centers for Disease Control and Prevention (CDC)) and Global School-Based Student Health Survey (GSHS) (WHO and CDC). The standard used for coding is high ≥ 16%; medium = 7%-15%; and low < 7%.
Alcohol Use. The core indicator is the percent reporting any alcohol use in the past 30 days among 13-to-15-year-old students available in GSHS (WHO and CDC). The standard used for coding is high ≥ 40%; medium = 20%-39%; and low < 20%. We use any amount of alcohol use instead of harmful use, since any amount of drinking presents risk among youth both because of the greater health impact of alcohol on young people and the link between the age of onset and likelihood of lifetime alcohol dependency.
Physical Inactivity. The core indicator is the per-cent reporting not engaging in any type of physical activity for at least 60 minutes a day for fi ve days in the past seven days among 13-to-15-year-old students available from GSHS (WHO and CDC). The standard used for coding is high ≥ 70%; medium = 50%-69%; and low < 50%. Surveys usually report physical activity levels rather than inactivity levels, so data used and presented here are 100 percent minus the percent reported to be physically active. In some countries, the measure pertains to the activity level in seven out of the past seven days. For those countries, the standards used to code risk levels were adjusted.
Overweight/Obesity (Unhealthy Diet). The core indicator is the percent reporting overweight or obese among 15-to-19-year-olds available in Demographic and Health Surveys. The standard used for coding is high ≥ 20%; medium = 10%–19%; and low < 10%. The overweight/obesity measure is used as a proxy for unhealthy diet due to the scarcity of comparable data on dietary intake to assess nutrition levels across countries. Overweight/obesity is a physiological change resulting from high caloric consumption and physical inactivity and is assessed with the Body Mass Index (BMI), a measure of weight relative to height. The BMI levels used to classify overweight/obese status vary somewhat across surveys and are specifi ed in the data appendix.
Data Sources
Population and Youth
Carl Haub and Toshiko Kaneda, 2014 World Population Data Sheet (Washington, DC: Population Reference Bureau, 2014).
UN Population Division, World Population Prospects: The 2012 Revision (New York: UN, 2013).
UNESCO Institute for Statistics, online database, accessed at www.uis.unesco.org/Pages/default.aspx.
World Bank, “World Development Indicators,” online database, accessed at http://data.worldbank.org/data-catalog/world-development-indicators.
NCD Mortality
World Health Organization (WHO), World Health Statistics 2014 (Geneva: WHO, 2014).
WHO, Noncommunicable Diseases Country Profi les 2014 (Geneva: WHO, 2014).
NCD Risk Factor Among Youth
WHO and U.S. Centers for Disease Control and Prevention (CDC), Global School-Based Student Health Surveys, accessed at www.who.int/chp/gshs/en/.
WHO and CDC, Global Youth Tobacco Surveys, accessed at http://nccd.cdc.gov/GTSSData/Ancillary/DataReports.aspx?CAID=1.
ICF International, Demographic and Health Surveys, accessed at www.dhsprogram.com.
WHO, STEPwise Approach to Chronic Disease Risk Factor Surveillance (STEPS), accessed at www.who.int/chp/steps/en/.
Various other country-specifi c surveys (see the data appendix for a list of full citations).
Noncommunicable Diseases Are Becoming Leading Cause of Death Throughout Africa
In most countries in North Africa, noncommunicable diseases (NCDs) are already responsible for more than three-quarters of all deaths. In sub-Saharan Africa, where communicable diseases and other health challenges still predominate, NCDs account for more than 25 percent of deaths in 80 percent of the countries. By 2030, NCDs will be the leading cause of death even in sub-Saharan Africa. In low- and middle-income countries a greater share of NCD deaths occur prematurely among people ages 30-70 who are often at the peak of their economic productivity (see “Probability of Premature Death From NCDs Between Ages 30-70, 2012” in the data table). The growing NCD epidemic represents a signifi cant socioeconomic cost to society, due in large part to declines in productivity and increases in health care expenses.
Sources: World Health Organization (WHO), Noncommunicable Diseases Country Profi les 2014 (Geneva: WHO, 2014); and WHO, Global Status Report on Noncommunicable Diseases 2010 (Geneva: WHO, 2010).
Africa’s Large Young Population Will Stress Health Systems as the Cohort Ages
Africa has the world’s youngest population, with more than one-third, or about 360 million Africans, between the ages of 10 and 24. By 2050, these young people will have aged to create a population ages 45 and over—the ages when NCDs hit hardest—that is three times the size it is today. The World Health Organization estimates that 70 percent of premature deaths in adults are the result of behaviors begun in adolescence. Four key risk behaviors for NCDs—tobacco and alcohol use, physical inactivity, and unhealthy diet—are on the rise among young Africans due in part to globalization, urbanization, and socioeconomic development. Addressing these risk factors among young people today can signifi cantly shift the projected trajectory of NCDs in Africa. In the absence of urgent action, NCDs will add tremendous pressure to already overstretched health systems.
Tobacco Use Varies Across Africa, But Sex Difference NarrowingTobacco use is the single most preventable cause of disease, disability, and death in the world. More than 40 million people smoke in Africa. Africans are using more tobacco and are starting to smoke at younger ages, increasing their exposure to and risk for NCDs. About one in 10 adolescents in Africa smokes cigarettes and the same proportion uses other tobacco products (chewing tobacco, snuff, pipes). However, substantial variation exists across countries in levels and types of tobacco products used. For example, cigarettes dominate overall tobacco use in Côte d’Ivoire, South Africa, and Tunisia, while in Zambia, Uganda, and Morocco, the vast majority of overall use comes from products other than cigarettes. About a quarter of 13-to-15-year-old boys in Côte d’Ivoire, Zambia (also girls), and South Africa are regular tobacco users (used any tobacco products in the past 30 days). Tobacco use also tends to coexist with alcohol use, another key risk factor for NCDs. Tobacco use has been typically higher among young men in Africa, but in many countries, young women are catching up.
Sources: World Health Organization and Centers for Disease Control and Prevention, Global Youth Tobacco Survey, accessed at http://nccd.cdc.gov/gtssdata/Ancillary/DataReports.aspx?CAID=1; and Patricio Marquez and Jill Farrington, The Challenge of Non-Communicable Diseases and Road Traffi c Injuries in Sub-Saharan Africa: An Overview (Washington, DC: The World Bank, 2013).
Sources: Carl Haub and Toshiko Kaneda, 2014 World Population Data Sheet (Washington, DC: Population Reference Bureau, 2014); United Nations Population Division, World Population Prospects: The 2012 Revision (Geneva: UN, 2013); and World Health Organization (WHO), Global Health Risks: Mortality and Burden of Disease Attributable to Selected Major Risks (Geneva: WHO, 2009).
I N F O R M | E M P O W E R | A D VA N C E | w w w. p r b . o r g
POPULATION REFERENCE BUREAU
Percent of Deaths Due To Noncommunicable Diseases by Country, 2012
1875 Connecticut Ave., NW, Washington, DC 20009 USA
tel. 202-483-1100 | fax [email protected] | www.prb.org
PRB on: @PRBdata
ACKNOWLEDGMENTSThis data sheet was produced by Toshiko Kaneda, Ph.D., senior research associate at the Population Reference Bureau (PRB) and Reshma Naik, Dr.P.H., senior policy analyst at PRB. Wendy Baldwin, independent consultant, contributed to the preliminary work on this data sheet. Special thanks to Jeffrey Jordan, Susan Rich, and Carl Haub at PRB; Derek Yach at the Vitality Institute; and Francisco Sierra and Sarah Shillito at AstraZeneca Young Health Programme for their insightful review and helpful comments. The authors also thank interns Marisha Wickremsinhe, Sharee Pearson, Adaeze Exeofor, Heather Zaccaro, and Adrianna Zinn for their assistance with data.© 2015 Population Reference Bureau. All rights reserved.Photo credit, cover: © Sean Sprague / Alamy
Tobacco Use, Excessive Use of Alcohol, Insuffi cient Physical Activity, Unhealthy Diet
N O N C O M M U N I C A B L E D I S E A S E SR I S K B E H A V I O R SCardiovascular Diseases, Chronic Respiratory Diseases, Diabetes, Most Cancers
F O R
Males Females
Population (in millions)150 100 50 0 0 50 100 150
Age
80+
75-79
70-74
65-69
60-64
55-59
50-54
45-49
40-44
35-39
30-34
25-29
20-24
15-19
10-14
5-9
0-4
2050 Males
2050 Females
2014 Males
2014 Females
21
6 6 6
1511 12
2 5 5 3 2
5
5
19 20
9
8 8
2
14 11
8
5
M F M F M F M F M F M F
Côte d’Ivoire(2009)
Zambia(2011)
South Africa(2011)
Tunisia (2010)
Uganda(2011)
Morocco(2010)
Use of other tobacco products (no cigarettes)
Cigarette smoking (possibly with use of other tobacco products)
26
11
4
19
16
11
7
2019
242625
Population and Youth NCD Mortality NCD Risk Factors Among Youth
Mid-Year Population (millions)
Youth Ages 10-24,
Percent of Population,
2014
Percent Enrolled in Secondary School
(Gross Enrollment Ratio), 2005/2014
Percent of Total
Population Living
in Urban Areas, 2014
GNI per Capita, PPP
(Current International $),
2013
Age-Standardized Death Rate
for All NCDs (per 100,000),
2012
Percent of Total Deaths
due to NCDs, 2012
Probability of Premature
Death From NCDs
Between Ages 30-70,
2012
Current Tobacco Use
Current Alcohol Use Physical Inactivity Overweight or Obese10Cigarettes Other Products Any Products
2014 2050 Male Female Male Female Male Female Male Female Year Male Female Year Male Female Year Male Female Year
NORTHERN AFRICA NORTHERN AFRICA
Algeria 39.1 60.3 25 96 100 70 13,070 710 77 22 18 1 9 1 21 2 2011 - - -† 69 89 2011 2011 Algeria
Egypt 87.9 146.0 28 87 85 43 10,790 782 85 25 6 1 6 2 9 3 2011 2005 77 90 2011 2011 Egypt
Libya 6.3 8.4 26 96 113 78 - 550 78 18 6 2 8 4 11 5 2010 - - -† - - - 2007 Libya
Morocco 33.3 41.4 27 74 63 60 7,000 708 75 23 3 2 11 6 11 7 2010 - - -† 79 87 2010 2010 Morocco
Sudan 38.8 77.1 32 43 39 34 3,230 551 34 17 9 4 7 5 13 8 2012 - - -† 89 89 2012 2012 Sudan
Tunisia 11.0 13.1 23 89 93 67 10,610 509 82 17 12 2 12 3 20 4 2010 - - -† 74 89 200814 2005 Tunisia
WESTERN AFRICA WESTERN AFRICA
Benin 10.3 21.5 32 65 43 44 1,780 761 36 22 3 2 5 2 5 2 2009 18 13 2009 67 75 2009 - 12 2011-2012 Benin
Burkina Faso 17.9 46.6 33 31 26 29 1,440 784 32 24 14 2 9 5 20 7 2006* - - - - - - - 5 2010 Burkina Faso
Cape Verde 0.5 0.7 32 86 100 65 6,210 482 69 15 4 3 12 9 15 12 2007 - - - - - - - - - Cape Verde
Côte d’Ivoire 20.8 42.3 32 46 32 53 3,090 794 31 23 21 6 10 7 26 11 2009 - - - 2005 - 10 2011-2012 Côte d’Ivoire
The Gambia 1.9 4.9 32 59 56 59 1,610 630 32 19 13 9 30 34 34 37 2008* - - - - - - - - - The Gambia
Ghana 27.0 52.6 31 69 65 53 3,900 670 42 20 9 7 - - - - 2012 18 13 2012 84 84 2012 2012 Ghana
Guinea 11.6 23.9 32 47 29 37 1,160 681 31 21 12 2 23 19 31 20 2008 - - - - - - - 8 2012 Guinea
Guinea-Bissau 1.7 3.5 32 - - 49 1,410 765 28 22 7 3 5 8 12 10 2008* - - - - - - - - - Guinea-Bissau
Liberia 4.4 9.4 32 42 33 49 790 657 34 21 2 1 - - 14 12 2008* - - - - - - 10 7 2013 Liberia
Mali 15.9 45.6 32 50 40 39 1,540 866 31 26 17 3 11 7 23 9 2008 - - - - - - - 7 2012-2013 Mali
Mauritania 4.0 7.9 31 30 29 59 2,850 555 32 16 17 17 19 17 25 23 2010 - - -† 79 89 2010 2010 Mauritania
Niger 18.2 68.0 31 19 13 18 890 649 25 20 12 1 6 7 15 8 2006 2007 2007 - 5 2012 Niger
Nigeria 177.5 396.5 31 46 41 47 5,360 674 24 20 6 1 17 11 19 11 2008* (2013)5 (2010)8 - 6 2013 Nigeria
Senegal 13.9 35.1 32 43 39 43 2,210 558 34 17 12 3 12 8 20 10 2007 4 2 2005 85 94 2005 0 7 2010-2011 Senegal
Sierra Leone 6.3 10.5 32 48 42 40 1,690 964 26 27 7 5 17 22 20 24 20081 - - - - - - 3 8 2013 Sierra Leone
Togo 7.0 14.5 32 58 30 39 1,180 679 30 20 9 2 12 7 18 8 2007 2010# 2010# 2010 Togo
EASTERN AFRICA EASTERN AFRICA
Burundi 10.5 26.7 31 37 29 12 770 729 28 24 6 3 17 14 21 17 2008 - - - - - - - 6 2010 Burundi
Comoros 0.7 1.3 30 63 65 28 1,490 695 37 23 14 7 13 10 22 15 2007 - - - - - - - 14 2012 Comoros
Djibouti 0.9 1.2 30 53 43 77 - 631 36 19 4 3 11 6 13 7 2007 - - -† 81 91 2007 2007 Djibouti
Eritrea 6.5 14.3 31 - - 22 1,180 672 37 24 2 1 6 4 8 5 2006 2004 - - - 2004 Eritrea
Ethiopia 95.9 165.1 35 35 22 19 1,380 476 30 15 - - - - 20102,# 20102,# 20129,# 0 2 2011 Ethiopia
Kenya 43.2 81.3 32 69 65 25 2,780 515 27 18 2012# 2012# (2014)* - 9 2008-2009 Kenya
Madagascar 22.4 52.8 33 39 38 34 1,370 649 39 23 31 10 9 6 33 14 2008 (2013)6 - - - - 1 2008-2009 Madagascar
Malawi 16.8 41.2 33 38 35 16 750 655 28 19 6 4 8 5 10 6 2009 5 3 2009 - - - - 7 2010 Malawi
Mauritius 1.3 1.2 23 94 98 40 17,220 577 85 24 23 9 12 5 25 10 2011 28 22 2011 59 76 2011 2011 Mauritius
Mozambique 25.1 63.5 33 27 25 32 1,100 594 23 17 5 1 10 7 13 7 2007* - - - - - - - 7 2011 Mozambique
Rwanda 11.1 21.0 33 31 34 28 1,450 585 36 19 3 1 12 9 13 10 2008 - - - - - - 0 11 2010 Rwanda
Seychelles 0.1 0.1 22 79 80 54 23,730 - - - 23 20 11 9 27 25 2007 62 61 2007 76 86 200714 2007 Seychelles
Somalia 10.8 27.1 33 10 5 39 - 551 19 19 9 15 15 15 19 22 2004 - - - - - - - - - Somalia
South Sudan 11.7 39.3 33 - - 19 1,860 623 - - - - - - - - - - - - - - - - - - South Sudan
Tanzania 50.8 129.4 32 34 32 31 1,760 570 31 16 5 1 6 5 10 5 20083 7 5 20063 69 80 20063 - 9 2010 Tanzania
Uganda 38.8 104.1 34 29 25 16 1,470 664 27 21 5 5 18 14 19 16 2011 - - - - - - 1 12 2011 Uganda
Zambia 15.1 49.2 33 - - 40 3,810 587 23 18 6 6 24 24 25 26 2011 39 45 2004 90 90 2004 - 8 2007 Zambia
Zimbabwe 14.7 30.2 34 48 47 33 1,690 599 31 19 5 2 11 8 15 8 2008* - - - - - - 1 13 2010-2011 Zimbabwe
MIDDLE AFRICA MIDDLE AFRICA
Angola 22.4 60.8 33 38 25 43 7,000 768 24 24 - - - - - - - - - - - - - - - - Angola
Cameroon 22.8 54.3 33 54 46 54 2,770 675 31 20 9 3 12 7 17 10 20084 - - - - - - - 16 2011 Cameroon
Central African Republic 4.8 9.7 33 24 12 40 600 551 20 18 10 4 24 31 30 35 2008* - - - - - - - - - Central African Republic
Chad 13.3 37.4 33 31 14 22 2,010 713 21 23 8 4 17 12 21 14 2008 - - - - - - - 4 2004 Chad
Congo 4.6 10.6 31 57 50 65 4,600 632 30 20 15 8 16 18 26 22 2006 - - - - - - - 6 2011-2012 Congo
Congo, Dem. Rep. 71.2 193.6 33 54 32 42 740 724 23 24 12 4 29 28 37 29 2008* 2004-20067 2005 - 8 2013-2014 Congo, Dem. Rep.
Equatorial Guinea 0.8 1.6 30 33 24 40 23,270 729 31 23 10 3 20 15 25 17 2008 - - - - - - 5 17 2011 Equatorial Guinea
Gabon 1.7 3.3 31 - - 87 17,230 505 36 15 - - - - 2009 - - - - - - - 16 2012 Gabon
Sao Tome and Principe 0.2 0.4 31 76 85 65 2,950 - - - 6 3 30 22 31 23 2010 - - - - - - - 13 2008-2009 Sao Tome and Principe
SOUTHERN AFRICA SOUTHERN AFRICA
Botswana 2.0 2.8 33 79 84 57 15,640 612 37 21 13 5 16 14 23 16 2008 23 19 2005 87 90 2005 - - - Botswana
Lesotho 1.9 2.7 35 45 62 27 3,160 672 27 24 12 8 20 18 26 22 2008 - - - - - - 1 20 2009 Lesotho
Namibia 2.3 3.7 33 60 70 46 9,490 580 43 20 10 6 - - 14 9 2013 26 21 2013 85 86 2013 2013 Namibia
South Africa 53.7 64.1 27 107 114 64 12,240 711 43 27 15 11 14 13 24 19 2011 2011 2008 2011 South Africa
Swaziland 1.3 1.8 35 61 60 21 6,060 702 28 21 9 3 9 7 15 9 2005 - - - - - - 2013 Swaziland
This data sheet was funded by the AstraZeneca Young Health Programme (YHP). YHP is a partnership among AstraZeneca, Johns Hopkins Bloomberg School of Public Health, and Plan International, with local NGO partners also implementing YHP programs on the ground. The YHP mission is to positively impact the health of adolescents in marginalized communities worldwide through research, advocacy, and on-the-ground programs focused on NCD prevention.
www.younghealthprogrammeyhp.com
Many Countries Face the Double Burden of Overnutrition and Undernutrition Sub-Saharan Africa is undergoing a nutrition transition, with overweight and obesity emerging as critical public health issues even in some countries where undernutrition is still a big problem. Among 15-to-19-year-old girls in Benin, Rwanda, Uganda, and Zimbabwe, approximately one in eight girls are overweight or obese, whereas about one in seven girls are underweight. Girls are often more likely than boys to be overweight or obese. Urbanization and globalization have led to more sedentary lifestyles and to high-calorie diets fi lled with highly processed foods that are low in fruits and vegetables, and high in saturated fat, sodium, and sugar. These shifts in diet and exercise patterns are leading to a rise in NCDs such as type 2 diabetes, cardiovascular disease, stroke, and certain cancers.
Source: ICF International, Demographic and Health Surveys, accessed at www.dhsprogram.com.
Overweight or obese Underweight
13
14
13
14
17
10
12
11
12
12
13
16
16
20
Rwanda (2010)
Uganda (2011)
Benin (2011-2012)
Zimbabwe (2010-2011)
Gabon (2012)
Cameroon (2011)
Lesotho (2009) 32
26
33
27
25
26
24
Percent of Women 15-19 Years Old Who Are Overweight/Obese or Underweight, Select CountriesPopulation Pyramid, Africa: 2014 and 2050
Population Size
2014 1,136 million
2050 2,428 million
Percent of Boys and Girls 13-15 Years Old in Secondary Schools Who Used Tobacco Products in the Past 30 Days, Select Countries
Addressing Risk Factors for Noncommunicable Diseases Among Young People in Africa: Key To Prevention and Sustainable Development
*Includes only Cape Verde, 69 percent.
Current Tobacco UsePercent using cigarettes/other tobacco products/any products in the past 30 days among 13-15-year-old
secondary school students11
16% or Above 7% to 15% Below 7%
Current Alcohol UsePercent having any drinks with alcohol in the past 30 days
among 13-15-year-old secondary school students12
40% or Above 20% to 39% Below 20%
Physical InactivityPercent not engaging in physical activity for at least 60 min/day on fi ve out of the last seven days among
13-15-year-old secondary school students12
70% or Above 50% to 69% Below 50%
Overweight or ObesePercent who are overweight or obese
among 15-19-year-olds13
20% or Above 10% to 19% Below 10%
Definition of Risk Levels
High Risk Medium Risk Low Risk
Notes:Data points for the risk factors appear for countries with comparable data available from the following surveys: Global Youth Tobacco Survey and Global School-Based Student Health Survey for tobacco use, Global School-Based Student Health Survey for both alcohol use and physical inactivity, and Demographic and Health Surveys for overweight status. For the countries without data from these surveys, data from other sources were used whenever possible to assess risk levels. Only the colors showing risk levels are displayed for these countries. Data points underlying all risk levels are available in the data appendix at http://www.prb.org/Publications/Datasheets/2015/ncd-risk-youth-africa.aspx.
Data in italics are based on samples from the following cities/regions and are not nationally representative.
* National capital1 Western Area2 Harar Town3 Dar es Salaam4 Central District5 Ibadan6 Six largest urban cities7 All provincial capital cities8 Abeokuta9 Hawassa City
10 Proxy for unhealthy diet11 Based on the Global Youth Tobacco Survey and the Global
School-Based Student Health Survey12 Based on the Global School-Based Student Health Survey13 Based on the Demographic and Health Survey14 Risk level for male was coded as yellow instead of red because
the measure pertains to physical inactivity level in seven out of the last seven days in this country
† Countries where Global School-Based Student Health Survey has been conducted but did not collect data on alcohol use
# Data are not available by sex when the columns are not divided(-) Indicates data unavailable or inapplicable
Year in brackets indicates publication year for the data where data year is missing

© 2015 Population Reference Bureau See notes on page 11 NONCOMMUNICABLE DISEASES AMONG YOUNG PEOPLE IN AFRICA 7
Less than 25%25% to 34%35% to 49%50% to 74%*75% or moreData not available
The POPULATION REFERENCE BUREAU informs people around the
world about population, health, and the environment, and empowers them to
use that information to advance the well-being of current and future generations.
INFORMPRB informs people around the world and in the United States about issues related to population, health, and the environment. To do this, we transform technical data and research into accurate, easy-to-understand information.
EMPOWERPRB empowers people—researchers, journalists, policymakers, and educators—to use information about population, health, and the environment to encourage action.
ADVANCEPRB works to advance the well-being of current and future generations. Toward that end, we analyze data and research, disseminate information, and empower people to use that information in order to inform policymaking.
Note: This data sheet accompanies the policy brief entitled Noncommunicable Diseases in Africa: Youth Are Key to Curbing the Epidemic and Achieving Sustainable Development. The data sheet is accompanied by a data appendix that provides all available country-specifi c data and data sources on four key noncommunicable (NCD) risk factors among young people in Africa since 2004. These publications extend an earlier publication, Noncommunicable Diseases Risk Factors Among Young People in Africa: Data Availability and Sources. All are available at www.prb.org/Publications/Datasheets/2015/ncd-risk-youth-africa.aspx.
Technical Notes
This data sheet lists all countries in North and sub-Saharan Africa with populations of 150,000 or more and all members of the UN. Countries with unavailable data for most indicators are, however, excluded.
NCD Risks. The data sheet focuses on four specifi c behaviors—tobacco use, harmful use of alcohol, physical inactivity, and unhealthy diet—identifi ed by the World Health Organization to be key NCD risk factors. Data availability on these risk factors among young people is limited in Africa. Available data are typically not directly comparable across a large number of countries. They may measure the levels of risk using different indicators, at different geographic levels (national, regional), for different age groups, and from different settings (all youth, youth in schools). To facilitate the cross-country comparison of risk levels and to focus attention on the broader picture, the risk levels are presented here as high (red), medium (yellow), or low (green).
Risk levels are assessed by fi rst identifying the core indicator for each risk factor that is suitable and for which data are consistently available for the largest number of countries. For countries with data on the core indicators, both risk levels and data points are presented. For countries without data on the core indicators, only risk levels are presented. These levels are based on alternative indicators or data that are otherwise not directly comparable (such as different
age groups, indicator defi nitions) but that still enable assessment of risk levels using similar standards. All data points underlying risk levels and the data sources are available for each risk factor per country in the data appendix accessible at www.prb.org/Publications/Datasheets/2015/ncd-risk-youth-africa.aspx.
The risk levels are assessed using the standards described below under each risk factor. Due to the lack of preexisting standards to assess population-level risks for these behaviors, cut-offs were developed for each risk factor based on a review of previous literature (see www.prb.org/Publications/Reports/2014/ncd-risk-youth-africa.aspx). The standards were adjusted up or down to determine the risk levels when the indicator differed from the ones specifi ed here. Data on any age groups between ages 10 and 24 from 2004 or later are considered in the coding. Data points rounded to their nearest integers are used for coding risk levels. Because well-documented sex differences exist for the prevalence for all risk factors, the risk levels are coded by sex when possible.
Tobacco Use. The core indicators are the percent reporting use in the past 30 days of each of the following: cigarettes, other tobacco products, and any tobacco products among 13-to-15-year-old students available in Global Youth Tobacco Survey (World Health Organization (WHO) and U.S. Centers for Disease Control and Prevention (CDC)) and Global School-Based Student Health Survey (GSHS) (WHO and CDC). The standard used for coding is high ≥ 16%; medium = 7%-15%; and low < 7%.
Alcohol Use. The core indicator is the percent reporting any alcohol use in the past 30 days among 13-to-15-year-old students available in GSHS (WHO and CDC). The standard used for coding is high ≥ 40%; medium = 20%-39%; and low < 20%. We use any amount of alcohol use instead of harmful use, since any amount of drinking presents risk among youth both because of the greater health impact of alcohol on young people and the link between the age of onset and likelihood of lifetime alcohol dependency.
Physical Inactivity. The core indicator is the per-cent reporting not engaging in any type of physical activity for at least 60 minutes a day for fi ve days in the past seven days among 13-to-15-year-old students available from GSHS (WHO and CDC). The standard used for coding is high ≥ 70%; medium = 50%-69%; and low < 50%. Surveys usually report physical activity levels rather than inactivity levels, so data used and presented here are 100 percent minus the percent reported to be physically active. In some countries, the measure pertains to the activity level in seven out of the past seven days. For those countries, the standards used to code risk levels were adjusted.
Overweight/Obesity (Unhealthy Diet). The core indicator is the percent reporting overweight or obese among 15-to-19-year-olds available in Demographic and Health Surveys. The standard used for coding is high ≥ 20%; medium = 10%–19%; and low < 10%. The overweight/obesity measure is used as a proxy for unhealthy diet due to the scarcity of comparable data on dietary intake to assess nutrition levels across countries. Overweight/obesity is a physiological change resulting from high caloric consumption and physical inactivity and is assessed with the Body Mass Index (BMI), a measure of weight relative to height. The BMI levels used to classify overweight/obese status vary somewhat across surveys and are specifi ed in the data appendix.
Data Sources
Population and Youth
Carl Haub and Toshiko Kaneda, 2014 World Population Data Sheet (Washington, DC: Population Reference Bureau, 2014).
UN Population Division, World Population Prospects: The 2012 Revision (New York: UN, 2013).
UNESCO Institute for Statistics, online database, accessed at www.uis.unesco.org/Pages/default.aspx.
World Bank, “World Development Indicators,” online database, accessed at http://data.worldbank.org/data-catalog/world-development-indicators.
NCD Mortality
World Health Organization (WHO), World Health Statistics 2014 (Geneva: WHO, 2014).
WHO, Noncommunicable Diseases Country Profi les 2014 (Geneva: WHO, 2014).
NCD Risk Factor Among Youth
WHO and U.S. Centers for Disease Control and Prevention (CDC), Global School-Based Student Health Surveys, accessed at www.who.int/chp/gshs/en/.
WHO and CDC, Global Youth Tobacco Surveys, accessed at http://nccd.cdc.gov/GTSSData/Ancillary/DataReports.aspx?CAID=1.
ICF International, Demographic and Health Surveys, accessed at www.dhsprogram.com.
WHO, STEPwise Approach to Chronic Disease Risk Factor Surveillance (STEPS), accessed at www.who.int/chp/steps/en/.
Various other country-specifi c surveys (see the data appendix for a list of full citations).
Noncommunicable Diseases Are Becoming Leading Cause of Death Throughout Africa
In most countries in North Africa, noncommunicable diseases (NCDs) are already responsible for more than three-quarters of all deaths. In sub-Saharan Africa, where communicable diseases and other health challenges still predominate, NCDs account for more than 25 percent of deaths in 80 percent of the countries. By 2030, NCDs will be the leading cause of death even in sub-Saharan Africa. In low- and middle-income countries a greater share of NCD deaths occur prematurely among people ages 30-70 who are often at the peak of their economic productivity (see “Probability of Premature Death From NCDs Between Ages 30-70, 2012” in the data table). The growing NCD epidemic represents a signifi cant socioeconomic cost to society, due in large part to declines in productivity and increases in health care expenses.
Sources: World Health Organization (WHO), Noncommunicable Diseases Country Profi les 2014 (Geneva: WHO, 2014); and WHO, Global Status Report on Noncommunicable Diseases 2010 (Geneva: WHO, 2010).
Africa’s Large Young Population Will Stress Health Systems as the Cohort Ages
Africa has the world’s youngest population, with more than one-third, or about 360 million Africans, between the ages of 10 and 24. By 2050, these young people will have aged to create a population ages 45 and over—the ages when NCDs hit hardest—that is three times the size it is today. The World Health Organization estimates that 70 percent of premature deaths in adults are the result of behaviors begun in adolescence. Four key risk behaviors for NCDs—tobacco and alcohol use, physical inactivity, and unhealthy diet—are on the rise among young Africans due in part to globalization, urbanization, and socioeconomic development. Addressing these risk factors among young people today can signifi cantly shift the projected trajectory of NCDs in Africa. In the absence of urgent action, NCDs will add tremendous pressure to already overstretched health systems.
Tobacco Use Varies Across Africa, But Sex Difference NarrowingTobacco use is the single most preventable cause of disease, disability, and death in the world. More than 40 million people smoke in Africa. Africans are using more tobacco and are starting to smoke at younger ages, increasing their exposure to and risk for NCDs. About one in 10 adolescents in Africa smokes cigarettes and the same proportion uses other tobacco products (chewing tobacco, snuff, pipes). However, substantial variation exists across countries in levels and types of tobacco products used. For example, cigarettes dominate overall tobacco use in Côte d’Ivoire, South Africa, and Tunisia, while in Zambia, Uganda, and Morocco, the vast majority of overall use comes from products other than cigarettes. About a quarter of 13-to-15-year-old boys in Côte d’Ivoire, Zambia (also girls), and South Africa are regular tobacco users (used any tobacco products in the past 30 days). Tobacco use also tends to coexist with alcohol use, another key risk factor for NCDs. Tobacco use has been typically higher among young men in Africa, but in many countries, young women are catching up.
Sources: World Health Organization and Centers for Disease Control and Prevention, Global Youth Tobacco Survey, accessed at http://nccd.cdc.gov/gtssdata/Ancillary/DataReports.aspx?CAID=1; and Patricio Marquez and Jill Farrington, The Challenge of Non-Communicable Diseases and Road Traffi c Injuries in Sub-Saharan Africa: An Overview (Washington, DC: The World Bank, 2013).
Sources: Carl Haub and Toshiko Kaneda, 2014 World Population Data Sheet (Washington, DC: Population Reference Bureau, 2014); United Nations Population Division, World Population Prospects: The 2012 Revision (Geneva: UN, 2013); and World Health Organization (WHO), Global Health Risks: Mortality and Burden of Disease Attributable to Selected Major Risks (Geneva: WHO, 2009).
I N F O R M | E M P O W E R | A D VA N C E | w w w. p r b . o r g
POPULATION REFERENCE BUREAU
Percent of Deaths Due To Noncommunicable Diseases by Country, 2012
1875 Connecticut Ave., NW, Washington, DC 20009 USA
tel. 202-483-1100 | fax [email protected] | www.prb.org
PRB on: @PRBdata
ACKNOWLEDGMENTSThis data sheet was produced by Toshiko Kaneda, Ph.D., senior research associate at the Population Reference Bureau (PRB) and Reshma Naik, Dr.P.H., senior policy analyst at PRB. Wendy Baldwin, independent consultant, contributed to the preliminary work on this data sheet. Special thanks to Jeffrey Jordan, Susan Rich, and Carl Haub at PRB; Derek Yach at the Vitality Institute; and Francisco Sierra and Sarah Shillito at AstraZeneca Young Health Programme for their insightful review and helpful comments. The authors also thank interns Marisha Wickremsinhe, Sharee Pearson, Adaeze Exeofor, Heather Zaccaro, and Adrianna Zinn for their assistance with data.© 2015 Population Reference Bureau. All rights reserved.Photo credit, cover: © Sean Sprague / Alamy
Tobacco Use, Excessive Use of Alcohol, Insuffi cient Physical Activity, Unhealthy Diet
N O N C O M M U N I C A B L E D I S E A S E SR I S K B E H A V I O R SCardiovascular Diseases, Chronic Respiratory Diseases, Diabetes, Most Cancers
F O R
Males Females
Population (in millions)150 100 50 0 0 50 100 150
Age
80+
75-79
70-74
65-69
60-64
55-59
50-54
45-49
40-44
35-39
30-34
25-29
20-24
15-19
10-14
5-9
0-4
2050 Males
2050 Females
2014 Males
2014 Females
21
6 6 6
1511 12
2 5 5 3 2
5
5
19 20
9
8 8
2
14 11
8
5
M F M F M F M F M F M F
Côte d’Ivoire(2009)
Zambia(2011)
South Africa(2011)
Tunisia (2010)
Uganda(2011)
Morocco(2010)
Use of other tobacco products (no cigarettes)
Cigarette smoking (possibly with use of other tobacco products)
26
11
4
19
16
11
7
2019
242625
Population and Youth NCD Mortality NCD Risk Factors Among Youth
Mid-Year Population (millions)
Youth Ages 10-24,
Percent of Population,
2014
Percent Enrolled in Secondary School
(Gross Enrollment Ratio), 2005/2014
Percent of Total
Population Living
in Urban Areas, 2014
GNI per Capita, PPP
(Current International $),
2013
Age-Standardized Death Rate
for All NCDs (per 100,000),
2012
Percent of Total Deaths
due to NCDs, 2012
Probability of Premature
Death From NCDs
Between Ages 30-70,
2012
Current Tobacco Use
Current Alcohol Use Physical Inactivity Overweight or Obese10Cigarettes Other Products Any Products
2014 2050 Male Female Male Female Male Female Male Female Year Male Female Year Male Female Year Male Female Year
NORTHERN AFRICA NORTHERN AFRICA
Algeria 39.1 60.3 25 96 100 70 13,070 710 77 22 18 1 9 1 21 2 2011 - - -† 69 89 2011 2011 Algeria
Egypt 87.9 146.0 28 87 85 43 10,790 782 85 25 6 1 6 2 9 3 2011 2005 77 90 2011 2011 Egypt
Libya 6.3 8.4 26 96 113 78 - 550 78 18 6 2 8 4 11 5 2010 - - -† - - - 2007 Libya
Morocco 33.3 41.4 27 74 63 60 7,000 708 75 23 3 2 11 6 11 7 2010 - - -† 79 87 2010 2010 Morocco
Sudan 38.8 77.1 32 43 39 34 3,230 551 34 17 9 4 7 5 13 8 2012 - - -† 89 89 2012 2012 Sudan
Tunisia 11.0 13.1 23 89 93 67 10,610 509 82 17 12 2 12 3 20 4 2010 - - -† 74 89 200814 2005 Tunisia
WESTERN AFRICA WESTERN AFRICA
Benin 10.3 21.5 32 65 43 44 1,780 761 36 22 3 2 5 2 5 2 2009 18 13 2009 67 75 2009 - 12 2011-2012 Benin
Burkina Faso 17.9 46.6 33 31 26 29 1,440 784 32 24 14 2 9 5 20 7 2006* - - - - - - - 5 2010 Burkina Faso
Cape Verde 0.5 0.7 32 86 100 65 6,210 482 69 15 4 3 12 9 15 12 2007 - - - - - - - - - Cape Verde
Côte d’Ivoire 20.8 42.3 32 46 32 53 3,090 794 31 23 21 6 10 7 26 11 2009 - - - 2005 - 10 2011-2012 Côte d’Ivoire
The Gambia 1.9 4.9 32 59 56 59 1,610 630 32 19 13 9 30 34 34 37 2008* - - - - - - - - - The Gambia
Ghana 27.0 52.6 31 69 65 53 3,900 670 42 20 9 7 - - - - 2012 18 13 2012 84 84 2012 2012 Ghana
Guinea 11.6 23.9 32 47 29 37 1,160 681 31 21 12 2 23 19 31 20 2008 - - - - - - - 8 2012 Guinea
Guinea-Bissau 1.7 3.5 32 - - 49 1,410 765 28 22 7 3 5 8 12 10 2008* - - - - - - - - - Guinea-Bissau
Liberia 4.4 9.4 32 42 33 49 790 657 34 21 2 1 - - 14 12 2008* - - - - - - 10 7 2013 Liberia
Mali 15.9 45.6 32 50 40 39 1,540 866 31 26 17 3 11 7 23 9 2008 - - - - - - - 7 2012-2013 Mali
Mauritania 4.0 7.9 31 30 29 59 2,850 555 32 16 17 17 19 17 25 23 2010 - - -† 79 89 2010 2010 Mauritania
Niger 18.2 68.0 31 19 13 18 890 649 25 20 12 1 6 7 15 8 2006 2007 2007 - 5 2012 Niger
Nigeria 177.5 396.5 31 46 41 47 5,360 674 24 20 6 1 17 11 19 11 2008* (2013)5 (2010)8 - 6 2013 Nigeria
Senegal 13.9 35.1 32 43 39 43 2,210 558 34 17 12 3 12 8 20 10 2007 4 2 2005 85 94 2005 0 7 2010-2011 Senegal
Sierra Leone 6.3 10.5 32 48 42 40 1,690 964 26 27 7 5 17 22 20 24 20081 - - - - - - 3 8 2013 Sierra Leone
Togo 7.0 14.5 32 58 30 39 1,180 679 30 20 9 2 12 7 18 8 2007 2010# 2010# 2010 Togo
EASTERN AFRICA EASTERN AFRICA
Burundi 10.5 26.7 31 37 29 12 770 729 28 24 6 3 17 14 21 17 2008 - - - - - - - 6 2010 Burundi
Comoros 0.7 1.3 30 63 65 28 1,490 695 37 23 14 7 13 10 22 15 2007 - - - - - - - 14 2012 Comoros
Djibouti 0.9 1.2 30 53 43 77 - 631 36 19 4 3 11 6 13 7 2007 - - -† 81 91 2007 2007 Djibouti
Eritrea 6.5 14.3 31 - - 22 1,180 672 37 24 2 1 6 4 8 5 2006 2004 - - - 2004 Eritrea
Ethiopia 95.9 165.1 35 35 22 19 1,380 476 30 15 - - - - 20102,# 20102,# 20129,# 0 2 2011 Ethiopia
Kenya 43.2 81.3 32 69 65 25 2,780 515 27 18 2012# 2012# (2014)* - 9 2008-2009 Kenya
Madagascar 22.4 52.8 33 39 38 34 1,370 649 39 23 31 10 9 6 33 14 2008 (2013)6 - - - - 1 2008-2009 Madagascar
Malawi 16.8 41.2 33 38 35 16 750 655 28 19 6 4 8 5 10 6 2009 5 3 2009 - - - - 7 2010 Malawi
Mauritius 1.3 1.2 23 94 98 40 17,220 577 85 24 23 9 12 5 25 10 2011 28 22 2011 59 76 2011 2011 Mauritius
Mozambique 25.1 63.5 33 27 25 32 1,100 594 23 17 5 1 10 7 13 7 2007* - - - - - - - 7 2011 Mozambique
Rwanda 11.1 21.0 33 31 34 28 1,450 585 36 19 3 1 12 9 13 10 2008 - - - - - - 0 11 2010 Rwanda
Seychelles 0.1 0.1 22 79 80 54 23,730 - - - 23 20 11 9 27 25 2007 62 61 2007 76 86 200714 2007 Seychelles
Somalia 10.8 27.1 33 10 5 39 - 551 19 19 9 15 15 15 19 22 2004 - - - - - - - - - Somalia
South Sudan 11.7 39.3 33 - - 19 1,860 623 - - - - - - - - - - - - - - - - - - South Sudan
Tanzania 50.8 129.4 32 34 32 31 1,760 570 31 16 5 1 6 5 10 5 20083 7 5 20063 69 80 20063 - 9 2010 Tanzania
Uganda 38.8 104.1 34 29 25 16 1,470 664 27 21 5 5 18 14 19 16 2011 - - - - - - 1 12 2011 Uganda
Zambia 15.1 49.2 33 - - 40 3,810 587 23 18 6 6 24 24 25 26 2011 39 45 2004 90 90 2004 - 8 2007 Zambia
Zimbabwe 14.7 30.2 34 48 47 33 1,690 599 31 19 5 2 11 8 15 8 2008* - - - - - - 1 13 2010-2011 Zimbabwe
MIDDLE AFRICA MIDDLE AFRICA
Angola 22.4 60.8 33 38 25 43 7,000 768 24 24 - - - - - - - - - - - - - - - - Angola
Cameroon 22.8 54.3 33 54 46 54 2,770 675 31 20 9 3 12 7 17 10 20084 - - - - - - - 16 2011 Cameroon
Central African Republic 4.8 9.7 33 24 12 40 600 551 20 18 10 4 24 31 30 35 2008* - - - - - - - - - Central African Republic
Chad 13.3 37.4 33 31 14 22 2,010 713 21 23 8 4 17 12 21 14 2008 - - - - - - - 4 2004 Chad
Congo 4.6 10.6 31 57 50 65 4,600 632 30 20 15 8 16 18 26 22 2006 - - - - - - - 6 2011-2012 Congo
Congo, Dem. Rep. 71.2 193.6 33 54 32 42 740 724 23 24 12 4 29 28 37 29 2008* 2004-20067 2005 - 8 2013-2014 Congo, Dem. Rep.
Equatorial Guinea 0.8 1.6 30 33 24 40 23,270 729 31 23 10 3 20 15 25 17 2008 - - - - - - 5 17 2011 Equatorial Guinea
Gabon 1.7 3.3 31 - - 87 17,230 505 36 15 - - - - 2009 - - - - - - - 16 2012 Gabon
Sao Tome and Principe 0.2 0.4 31 76 85 65 2,950 - - - 6 3 30 22 31 23 2010 - - - - - - - 13 2008-2009 Sao Tome and Principe
SOUTHERN AFRICA SOUTHERN AFRICA
Botswana 2.0 2.8 33 79 84 57 15,640 612 37 21 13 5 16 14 23 16 2008 23 19 2005 87 90 2005 - - - Botswana
Lesotho 1.9 2.7 35 45 62 27 3,160 672 27 24 12 8 20 18 26 22 2008 - - - - - - 1 20 2009 Lesotho
Namibia 2.3 3.7 33 60 70 46 9,490 580 43 20 10 6 - - 14 9 2013 26 21 2013 85 86 2013 2013 Namibia
South Africa 53.7 64.1 27 107 114 64 12,240 711 43 27 15 11 14 13 24 19 2011 2011 2008 2011 South Africa
Swaziland 1.3 1.8 35 61 60 21 6,060 702 28 21 9 3 9 7 15 9 2005 - - - - - - 2013 Swaziland
This data sheet was funded by the AstraZeneca Young Health Programme (YHP). YHP is a partnership among AstraZeneca, Johns Hopkins Bloomberg School of Public Health, and Plan International, with local NGO partners also implementing YHP programs on the ground. The YHP mission is to positively impact the health of adolescents in marginalized communities worldwide through research, advocacy, and on-the-ground programs focused on NCD prevention.
www.younghealthprogrammeyhp.com
Many Countries Face the Double Burden of Overnutrition and Undernutrition Sub-Saharan Africa is undergoing a nutrition transition, with overweight and obesity emerging as critical public health issues even in some countries where undernutrition is still a big problem. Among 15-to-19-year-old girls in Benin, Rwanda, Uganda, and Zimbabwe, approximately one in eight girls are overweight or obese, whereas about one in seven girls are underweight. Girls are often more likely than boys to be overweight or obese. Urbanization and globalization have led to more sedentary lifestyles and to high-calorie diets fi lled with highly processed foods that are low in fruits and vegetables, and high in saturated fat, sodium, and sugar. These shifts in diet and exercise patterns are leading to a rise in NCDs such as type 2 diabetes, cardiovascular disease, stroke, and certain cancers.
Source: ICF International, Demographic and Health Surveys, accessed at www.dhsprogram.com.
Overweight or obese Underweight
13
14
13
14
17
10
12
11
12
12
13
16
16
20
Rwanda (2010)
Uganda (2011)
Benin (2011-2012)
Zimbabwe (2010-2011)
Gabon (2012)
Cameroon (2011)
Lesotho (2009) 32
26
33
27
25
26
24
Percent of Women 15-19 Years Old Who Are Overweight/Obese or Underweight, Select CountriesPopulation Pyramid, Africa: 2014 and 2050
Population Size
2014 1,136 million
2050 2,428 million
Percent of Boys and Girls 13-15 Years Old in Secondary Schools Who Used Tobacco Products in the Past 30 Days, Select Countries
Addressing Risk Factors for Noncommunicable Diseases Among Young People in Africa: Key To Prevention and Sustainable Development
*Includes only Cape Verde, 69 percent.
Current Tobacco UsePercent using cigarettes/other tobacco products/any products in the past 30 days among 13-15-year-old
secondary school students11
16% or Above 7% to 15% Below 7%
Current Alcohol UsePercent having any drinks with alcohol in the past 30 days
among 13-15-year-old secondary school students12
40% or Above 20% to 39% Below 20%
Physical InactivityPercent not engaging in physical activity for at least 60 min/day on fi ve out of the last seven days among
13-15-year-old secondary school students12
70% or Above 50% to 69% Below 50%
Overweight or ObesePercent who are overweight or obese
among 15-19-year-olds13
20% or Above 10% to 19% Below 10%
Definition of Risk Levels
High Risk Medium Risk Low Risk
Notes:Data points for the risk factors appear for countries with comparable data available from the following surveys: Global Youth Tobacco Survey and Global School-Based Student Health Survey for tobacco use, Global School-Based Student Health Survey for both alcohol use and physical inactivity, and Demographic and Health Surveys for overweight status. For the countries without data from these surveys, data from other sources were used whenever possible to assess risk levels. Only the colors showing risk levels are displayed for these countries. Data points underlying all risk levels are available in the data appendix at http://www.prb.org/Publications/Datasheets/2015/ncd-risk-youth-africa.aspx.
Data in italics are based on samples from the following cities/regions and are not nationally representative.
* National capital1 Western Area2 Harar Town3 Dar es Salaam4 Central District5 Ibadan6 Six largest urban cities7 All provincial capital cities8 Abeokuta9 Hawassa City
10 Proxy for unhealthy diet11 Based on the Global Youth Tobacco Survey and the Global
School-Based Student Health Survey12 Based on the Global School-Based Student Health Survey13 Based on the Demographic and Health Survey14 Risk level for male was coded as yellow instead of red because
the measure pertains to physical inactivity level in seven out of the last seven days in this country
† Countries where Global School-Based Student Health Survey has been conducted but did not collect data on alcohol use
# Data are not available by sex when the columns are not divided(-) Indicates data unavailable or inapplicable
Year in brackets indicates publication year for the data where data year is missing

© 2015 Population Reference Bureau See notes on page 11 NONCOMMUNICABLE DISEASES AMONG YOUNG PEOPLE IN AFRICA 8
Less than 25%25% to 34%35% to 49%50% to 74%*75% or moreData not available
The POPULATION REFERENCE BUREAU informs people around the
world about population, health, and the environment, and empowers them to
use that information to advance the well-being of current and future generations.
INFORMPRB informs people around the world and in the United States about issues related to population, health, and the environment. To do this, we transform technical data and research into accurate, easy-to-understand information.
EMPOWERPRB empowers people—researchers, journalists, policymakers, and educators—to use information about population, health, and the environment to encourage action.
ADVANCEPRB works to advance the well-being of current and future generations. Toward that end, we analyze data and research, disseminate information, and empower people to use that information in order to inform policymaking.
Note: This data sheet accompanies the policy brief entitled Noncommunicable Diseases in Africa: Youth Are Key to Curbing the Epidemic and Achieving Sustainable Development. The data sheet is accompanied by a data appendix that provides all available country-specifi c data and data sources on four key noncommunicable (NCD) risk factors among young people in Africa since 2004. These publications extend an earlier publication, Noncommunicable Diseases Risk Factors Among Young People in Africa: Data Availability and Sources. All are available at www.prb.org/Publications/Datasheets/2015/ncd-risk-youth-africa.aspx.
Technical Notes
This data sheet lists all countries in North and sub-Saharan Africa with populations of 150,000 or more and all members of the UN. Countries with unavailable data for most indicators are, however, excluded.
NCD Risks. The data sheet focuses on four specifi c behaviors—tobacco use, harmful use of alcohol, physical inactivity, and unhealthy diet—identifi ed by the World Health Organization to be key NCD risk factors. Data availability on these risk factors among young people is limited in Africa. Available data are typically not directly comparable across a large number of countries. They may measure the levels of risk using different indicators, at different geographic levels (national, regional), for different age groups, and from different settings (all youth, youth in schools). To facilitate the cross-country comparison of risk levels and to focus attention on the broader picture, the risk levels are presented here as high (red), medium (yellow), or low (green).
Risk levels are assessed by fi rst identifying the core indicator for each risk factor that is suitable and for which data are consistently available for the largest number of countries. For countries with data on the core indicators, both risk levels and data points are presented. For countries without data on the core indicators, only risk levels are presented. These levels are based on alternative indicators or data that are otherwise not directly comparable (such as different
age groups, indicator defi nitions) but that still enable assessment of risk levels using similar standards. All data points underlying risk levels and the data sources are available for each risk factor per country in the data appendix accessible at www.prb.org/Publications/Datasheets/2015/ncd-risk-youth-africa.aspx.
The risk levels are assessed using the standards described below under each risk factor. Due to the lack of preexisting standards to assess population-level risks for these behaviors, cut-offs were developed for each risk factor based on a review of previous literature (see www.prb.org/Publications/Reports/2014/ncd-risk-youth-africa.aspx). The standards were adjusted up or down to determine the risk levels when the indicator differed from the ones specifi ed here. Data on any age groups between ages 10 and 24 from 2004 or later are considered in the coding. Data points rounded to their nearest integers are used for coding risk levels. Because well-documented sex differences exist for the prevalence for all risk factors, the risk levels are coded by sex when possible.
Tobacco Use. The core indicators are the percent reporting use in the past 30 days of each of the following: cigarettes, other tobacco products, and any tobacco products among 13-to-15-year-old students available in Global Youth Tobacco Survey (World Health Organization (WHO) and U.S. Centers for Disease Control and Prevention (CDC)) and Global School-Based Student Health Survey (GSHS) (WHO and CDC). The standard used for coding is high ≥ 16%; medium = 7%-15%; and low < 7%.
Alcohol Use. The core indicator is the percent reporting any alcohol use in the past 30 days among 13-to-15-year-old students available in GSHS (WHO and CDC). The standard used for coding is high ≥ 40%; medium = 20%-39%; and low < 20%. We use any amount of alcohol use instead of harmful use, since any amount of drinking presents risk among youth both because of the greater health impact of alcohol on young people and the link between the age of onset and likelihood of lifetime alcohol dependency.
Physical Inactivity. The core indicator is the per-cent reporting not engaging in any type of physical activity for at least 60 minutes a day for fi ve days in the past seven days among 13-to-15-year-old students available from GSHS (WHO and CDC). The standard used for coding is high ≥ 70%; medium = 50%-69%; and low < 50%. Surveys usually report physical activity levels rather than inactivity levels, so data used and presented here are 100 percent minus the percent reported to be physically active. In some countries, the measure pertains to the activity level in seven out of the past seven days. For those countries, the standards used to code risk levels were adjusted.
Overweight/Obesity (Unhealthy Diet). The core indicator is the percent reporting overweight or obese among 15-to-19-year-olds available in Demographic and Health Surveys. The standard used for coding is high ≥ 20%; medium = 10%–19%; and low < 10%. The overweight/obesity measure is used as a proxy for unhealthy diet due to the scarcity of comparable data on dietary intake to assess nutrition levels across countries. Overweight/obesity is a physiological change resulting from high caloric consumption and physical inactivity and is assessed with the Body Mass Index (BMI), a measure of weight relative to height. The BMI levels used to classify overweight/obese status vary somewhat across surveys and are specifi ed in the data appendix.
Data Sources
Population and Youth
Carl Haub and Toshiko Kaneda, 2014 World Population Data Sheet (Washington, DC: Population Reference Bureau, 2014).
UN Population Division, World Population Prospects: The 2012 Revision (New York: UN, 2013).
UNESCO Institute for Statistics, online database, accessed at www.uis.unesco.org/Pages/default.aspx.
World Bank, “World Development Indicators,” online database, accessed at http://data.worldbank.org/data-catalog/world-development-indicators.
NCD Mortality
World Health Organization (WHO), World Health Statistics 2014 (Geneva: WHO, 2014).
WHO, Noncommunicable Diseases Country Profi les 2014 (Geneva: WHO, 2014).
NCD Risk Factor Among Youth
WHO and U.S. Centers for Disease Control and Prevention (CDC), Global School-Based Student Health Surveys, accessed at www.who.int/chp/gshs/en/.
WHO and CDC, Global Youth Tobacco Surveys, accessed at http://nccd.cdc.gov/GTSSData/Ancillary/DataReports.aspx?CAID=1.
ICF International, Demographic and Health Surveys, accessed at www.dhsprogram.com.
WHO, STEPwise Approach to Chronic Disease Risk Factor Surveillance (STEPS), accessed at www.who.int/chp/steps/en/.
Various other country-specifi c surveys (see the data appendix for a list of full citations).
Noncommunicable Diseases Are Becoming Leading Cause of Death Throughout Africa
In most countries in North Africa, noncommunicable diseases (NCDs) are already responsible for more than three-quarters of all deaths. In sub-Saharan Africa, where communicable diseases and other health challenges still predominate, NCDs account for more than 25 percent of deaths in 80 percent of the countries. By 2030, NCDs will be the leading cause of death even in sub-Saharan Africa. In low- and middle-income countries a greater share of NCD deaths occur prematurely among people ages 30-70 who are often at the peak of their economic productivity (see “Probability of Premature Death From NCDs Between Ages 30-70, 2012” in the data table). The growing NCD epidemic represents a signifi cant socioeconomic cost to society, due in large part to declines in productivity and increases in health care expenses.
Sources: World Health Organization (WHO), Noncommunicable Diseases Country Profi les 2014 (Geneva: WHO, 2014); and WHO, Global Status Report on Noncommunicable Diseases 2010 (Geneva: WHO, 2010).
Africa’s Large Young Population Will Stress Health Systems as the Cohort Ages
Africa has the world’s youngest population, with more than one-third, or about 360 million Africans, between the ages of 10 and 24. By 2050, these young people will have aged to create a population ages 45 and over—the ages when NCDs hit hardest—that is three times the size it is today. The World Health Organization estimates that 70 percent of premature deaths in adults are the result of behaviors begun in adolescence. Four key risk behaviors for NCDs—tobacco and alcohol use, physical inactivity, and unhealthy diet—are on the rise among young Africans due in part to globalization, urbanization, and socioeconomic development. Addressing these risk factors among young people today can signifi cantly shift the projected trajectory of NCDs in Africa. In the absence of urgent action, NCDs will add tremendous pressure to already overstretched health systems.
Tobacco Use Varies Across Africa, But Sex Difference NarrowingTobacco use is the single most preventable cause of disease, disability, and death in the world. More than 40 million people smoke in Africa. Africans are using more tobacco and are starting to smoke at younger ages, increasing their exposure to and risk for NCDs. About one in 10 adolescents in Africa smokes cigarettes and the same proportion uses other tobacco products (chewing tobacco, snuff, pipes). However, substantial variation exists across countries in levels and types of tobacco products used. For example, cigarettes dominate overall tobacco use in Côte d’Ivoire, South Africa, and Tunisia, while in Zambia, Uganda, and Morocco, the vast majority of overall use comes from products other than cigarettes. About a quarter of 13-to-15-year-old boys in Côte d’Ivoire, Zambia (also girls), and South Africa are regular tobacco users (used any tobacco products in the past 30 days). Tobacco use also tends to coexist with alcohol use, another key risk factor for NCDs. Tobacco use has been typically higher among young men in Africa, but in many countries, young women are catching up.
Sources: World Health Organization and Centers for Disease Control and Prevention, Global Youth Tobacco Survey, accessed at http://nccd.cdc.gov/gtssdata/Ancillary/DataReports.aspx?CAID=1; and Patricio Marquez and Jill Farrington, The Challenge of Non-Communicable Diseases and Road Traffi c Injuries in Sub-Saharan Africa: An Overview (Washington, DC: The World Bank, 2013).
Sources: Carl Haub and Toshiko Kaneda, 2014 World Population Data Sheet (Washington, DC: Population Reference Bureau, 2014); United Nations Population Division, World Population Prospects: The 2012 Revision (Geneva: UN, 2013); and World Health Organization (WHO), Global Health Risks: Mortality and Burden of Disease Attributable to Selected Major Risks (Geneva: WHO, 2009).
I N F O R M | E M P O W E R | A D VA N C E | w w w. p r b . o r g
POPULATION REFERENCE BUREAU
Percent of Deaths Due To Noncommunicable Diseases by Country, 2012
1875 Connecticut Ave., NW, Washington, DC 20009 USA
tel. 202-483-1100 | fax [email protected] | www.prb.org
PRB on: @PRBdata
ACKNOWLEDGMENTSThis data sheet was produced by Toshiko Kaneda, Ph.D., senior research associate at the Population Reference Bureau (PRB) and Reshma Naik, Dr.P.H., senior policy analyst at PRB. Wendy Baldwin, independent consultant, contributed to the preliminary work on this data sheet. Special thanks to Jeffrey Jordan, Susan Rich, and Carl Haub at PRB; Derek Yach at the Vitality Institute; and Francisco Sierra and Sarah Shillito at AstraZeneca Young Health Programme for their insightful review and helpful comments. The authors also thank interns Marisha Wickremsinhe, Sharee Pearson, Adaeze Exeofor, Heather Zaccaro, and Adrianna Zinn for their assistance with data.© 2015 Population Reference Bureau. All rights reserved.Photo credit, cover: © Sean Sprague / Alamy
Tobacco Use, Excessive Use of Alcohol, Insuffi cient Physical Activity, Unhealthy Diet
N O N C O M M U N I C A B L E D I S E A S E SR I S K B E H A V I O R SCardiovascular Diseases, Chronic Respiratory Diseases, Diabetes, Most Cancers
F O R
Males Females
Population (in millions)150 100 50 0 0 50 100 150
Age
80+
75-79
70-74
65-69
60-64
55-59
50-54
45-49
40-44
35-39
30-34
25-29
20-24
15-19
10-14
5-9
0-4
2050 Males
2050 Females
2014 Males
2014 Females
21
6 6 6
1511 12
2 5 5 3 2
5
5
19 20
9
8 8
2
14 11
8
5
M F M F M F M F M F M F
Côte d’Ivoire(2009)
Zambia(2011)
South Africa(2011)
Tunisia (2010)
Uganda(2011)
Morocco(2010)
Use of other tobacco products (no cigarettes)
Cigarette smoking (possibly with use of other tobacco products)
26
11
4
19
16
11
7
2019
242625
Population and Youth NCD Mortality NCD Risk Factors Among Youth
Mid-Year Population (millions)
Youth Ages 10-24,
Percent of Population,
2014
Percent Enrolled in Secondary School
(Gross Enrollment Ratio), 2005/2014
Percent of Total
Population Living
in Urban Areas, 2014
GNI per Capita, PPP
(Current International $),
2013
Age-Standardized Death Rate
for All NCDs (per 100,000),
2012
Percent of Total Deaths
due to NCDs, 2012
Probability of Premature
Death From NCDs
Between Ages 30-70,
2012
Current Tobacco Use
Current Alcohol Use Physical Inactivity Overweight or Obese10Cigarettes Other Products Any Products
2014 2050 Male Female Male Female Male Female Male Female Year Male Female Year Male Female Year Male Female Year
NORTHERN AFRICA NORTHERN AFRICA
Algeria 39.1 60.3 25 96 100 70 13,070 710 77 22 18 1 9 1 21 2 2011 - - -† 69 89 2011 2011 Algeria
Egypt 87.9 146.0 28 87 85 43 10,790 782 85 25 6 1 6 2 9 3 2011 2005 77 90 2011 2011 Egypt
Libya 6.3 8.4 26 96 113 78 - 550 78 18 6 2 8 4 11 5 2010 - - -† - - - 2007 Libya
Morocco 33.3 41.4 27 74 63 60 7,000 708 75 23 3 2 11 6 11 7 2010 - - -† 79 87 2010 2010 Morocco
Sudan 38.8 77.1 32 43 39 34 3,230 551 34 17 9 4 7 5 13 8 2012 - - -† 89 89 2012 2012 Sudan
Tunisia 11.0 13.1 23 89 93 67 10,610 509 82 17 12 2 12 3 20 4 2010 - - -† 74 89 200814 2005 Tunisia
WESTERN AFRICA WESTERN AFRICA
Benin 10.3 21.5 32 65 43 44 1,780 761 36 22 3 2 5 2 5 2 2009 18 13 2009 67 75 2009 - 12 2011-2012 Benin
Burkina Faso 17.9 46.6 33 31 26 29 1,440 784 32 24 14 2 9 5 20 7 2006* - - - - - - - 5 2010 Burkina Faso
Cape Verde 0.5 0.7 32 86 100 65 6,210 482 69 15 4 3 12 9 15 12 2007 - - - - - - - - - Cape Verde
Côte d’Ivoire 20.8 42.3 32 46 32 53 3,090 794 31 23 21 6 10 7 26 11 2009 - - - 2005 - 10 2011-2012 Côte d’Ivoire
The Gambia 1.9 4.9 32 59 56 59 1,610 630 32 19 13 9 30 34 34 37 2008* - - - - - - - - - The Gambia
Ghana 27.0 52.6 31 69 65 53 3,900 670 42 20 9 7 - - - - 2012 18 13 2012 84 84 2012 2012 Ghana
Guinea 11.6 23.9 32 47 29 37 1,160 681 31 21 12 2 23 19 31 20 2008 - - - - - - - 8 2012 Guinea
Guinea-Bissau 1.7 3.5 32 - - 49 1,410 765 28 22 7 3 5 8 12 10 2008* - - - - - - - - - Guinea-Bissau
Liberia 4.4 9.4 32 42 33 49 790 657 34 21 2 1 - - 14 12 2008* - - - - - - 10 7 2013 Liberia
Mali 15.9 45.6 32 50 40 39 1,540 866 31 26 17 3 11 7 23 9 2008 - - - - - - - 7 2012-2013 Mali
Mauritania 4.0 7.9 31 30 29 59 2,850 555 32 16 17 17 19 17 25 23 2010 - - -† 79 89 2010 2010 Mauritania
Niger 18.2 68.0 31 19 13 18 890 649 25 20 12 1 6 7 15 8 2006 2007 2007 - 5 2012 Niger
Nigeria 177.5 396.5 31 46 41 47 5,360 674 24 20 6 1 17 11 19 11 2008* (2013)5 (2010)8 - 6 2013 Nigeria
Senegal 13.9 35.1 32 43 39 43 2,210 558 34 17 12 3 12 8 20 10 2007 4 2 2005 85 94 2005 0 7 2010-2011 Senegal
Sierra Leone 6.3 10.5 32 48 42 40 1,690 964 26 27 7 5 17 22 20 24 20081 - - - - - - 3 8 2013 Sierra Leone
Togo 7.0 14.5 32 58 30 39 1,180 679 30 20 9 2 12 7 18 8 2007 2010# 2010# 2010 Togo
EASTERN AFRICA EASTERN AFRICA
Burundi 10.5 26.7 31 37 29 12 770 729 28 24 6 3 17 14 21 17 2008 - - - - - - - 6 2010 Burundi
Comoros 0.7 1.3 30 63 65 28 1,490 695 37 23 14 7 13 10 22 15 2007 - - - - - - - 14 2012 Comoros
Djibouti 0.9 1.2 30 53 43 77 - 631 36 19 4 3 11 6 13 7 2007 - - -† 81 91 2007 2007 Djibouti
Eritrea 6.5 14.3 31 - - 22 1,180 672 37 24 2 1 6 4 8 5 2006 2004 - - - 2004 Eritrea
Ethiopia 95.9 165.1 35 35 22 19 1,380 476 30 15 - - - - 20102,# 20102,# 20129,# 0 2 2011 Ethiopia
Kenya 43.2 81.3 32 69 65 25 2,780 515 27 18 2012# 2012# (2014)* - 9 2008-2009 Kenya
Madagascar 22.4 52.8 33 39 38 34 1,370 649 39 23 31 10 9 6 33 14 2008 (2013)6 - - - - 1 2008-2009 Madagascar
Malawi 16.8 41.2 33 38 35 16 750 655 28 19 6 4 8 5 10 6 2009 5 3 2009 - - - - 7 2010 Malawi
Mauritius 1.3 1.2 23 94 98 40 17,220 577 85 24 23 9 12 5 25 10 2011 28 22 2011 59 76 2011 2011 Mauritius
Mozambique 25.1 63.5 33 27 25 32 1,100 594 23 17 5 1 10 7 13 7 2007* - - - - - - - 7 2011 Mozambique
Rwanda 11.1 21.0 33 31 34 28 1,450 585 36 19 3 1 12 9 13 10 2008 - - - - - - 0 11 2010 Rwanda
Seychelles 0.1 0.1 22 79 80 54 23,730 - - - 23 20 11 9 27 25 2007 62 61 2007 76 86 200714 2007 Seychelles
Somalia 10.8 27.1 33 10 5 39 - 551 19 19 9 15 15 15 19 22 2004 - - - - - - - - - Somalia
South Sudan 11.7 39.3 33 - - 19 1,860 623 - - - - - - - - - - - - - - - - - - South Sudan
Tanzania 50.8 129.4 32 34 32 31 1,760 570 31 16 5 1 6 5 10 5 20083 7 5 20063 69 80 20063 - 9 2010 Tanzania
Uganda 38.8 104.1 34 29 25 16 1,470 664 27 21 5 5 18 14 19 16 2011 - - - - - - 1 12 2011 Uganda
Zambia 15.1 49.2 33 - - 40 3,810 587 23 18 6 6 24 24 25 26 2011 39 45 2004 90 90 2004 - 8 2007 Zambia
Zimbabwe 14.7 30.2 34 48 47 33 1,690 599 31 19 5 2 11 8 15 8 2008* - - - - - - 1 13 2010-2011 Zimbabwe
MIDDLE AFRICA MIDDLE AFRICA
Angola 22.4 60.8 33 38 25 43 7,000 768 24 24 - - - - - - - - - - - - - - - - Angola
Cameroon 22.8 54.3 33 54 46 54 2,770 675 31 20 9 3 12 7 17 10 20084 - - - - - - - 16 2011 Cameroon
Central African Republic 4.8 9.7 33 24 12 40 600 551 20 18 10 4 24 31 30 35 2008* - - - - - - - - - Central African Republic
Chad 13.3 37.4 33 31 14 22 2,010 713 21 23 8 4 17 12 21 14 2008 - - - - - - - 4 2004 Chad
Congo 4.6 10.6 31 57 50 65 4,600 632 30 20 15 8 16 18 26 22 2006 - - - - - - - 6 2011-2012 Congo
Congo, Dem. Rep. 71.2 193.6 33 54 32 42 740 724 23 24 12 4 29 28 37 29 2008* 2004-20067 2005 - 8 2013-2014 Congo, Dem. Rep.
Equatorial Guinea 0.8 1.6 30 33 24 40 23,270 729 31 23 10 3 20 15 25 17 2008 - - - - - - 5 17 2011 Equatorial Guinea
Gabon 1.7 3.3 31 - - 87 17,230 505 36 15 - - - - 2009 - - - - - - - 16 2012 Gabon
Sao Tome and Principe 0.2 0.4 31 76 85 65 2,950 - - - 6 3 30 22 31 23 2010 - - - - - - - 13 2008-2009 Sao Tome and Principe
SOUTHERN AFRICA SOUTHERN AFRICA
Botswana 2.0 2.8 33 79 84 57 15,640 612 37 21 13 5 16 14 23 16 2008 23 19 2005 87 90 2005 - - - Botswana
Lesotho 1.9 2.7 35 45 62 27 3,160 672 27 24 12 8 20 18 26 22 2008 - - - - - - 1 20 2009 Lesotho
Namibia 2.3 3.7 33 60 70 46 9,490 580 43 20 10 6 - - 14 9 2013 26 21 2013 85 86 2013 2013 Namibia
South Africa 53.7 64.1 27 107 114 64 12,240 711 43 27 15 11 14 13 24 19 2011 2011 2008 2011 South Africa
Swaziland 1.3 1.8 35 61 60 21 6,060 702 28 21 9 3 9 7 15 9 2005 - - - - - - 2013 Swaziland
This data sheet was funded by the AstraZeneca Young Health Programme (YHP). YHP is a partnership among AstraZeneca, Johns Hopkins Bloomberg School of Public Health, and Plan International, with local NGO partners also implementing YHP programs on the ground. The YHP mission is to positively impact the health of adolescents in marginalized communities worldwide through research, advocacy, and on-the-ground programs focused on NCD prevention.
www.younghealthprogrammeyhp.com
Many Countries Face the Double Burden of Overnutrition and Undernutrition Sub-Saharan Africa is undergoing a nutrition transition, with overweight and obesity emerging as critical public health issues even in some countries where undernutrition is still a big problem. Among 15-to-19-year-old girls in Benin, Rwanda, Uganda, and Zimbabwe, approximately one in eight girls are overweight or obese, whereas about one in seven girls are underweight. Girls are often more likely than boys to be overweight or obese. Urbanization and globalization have led to more sedentary lifestyles and to high-calorie diets fi lled with highly processed foods that are low in fruits and vegetables, and high in saturated fat, sodium, and sugar. These shifts in diet and exercise patterns are leading to a rise in NCDs such as type 2 diabetes, cardiovascular disease, stroke, and certain cancers.
Source: ICF International, Demographic and Health Surveys, accessed at www.dhsprogram.com.
Overweight or obese Underweight
13
14
13
14
17
10
12
11
12
12
13
16
16
20
Rwanda (2010)
Uganda (2011)
Benin (2011-2012)
Zimbabwe (2010-2011)
Gabon (2012)
Cameroon (2011)
Lesotho (2009) 32
26
33
27
25
26
24
Percent of Women 15-19 Years Old Who Are Overweight/Obese or Underweight, Select CountriesPopulation Pyramid, Africa: 2014 and 2050
Population Size
2014 1,136 million
2050 2,428 million
Percent of Boys and Girls 13-15 Years Old in Secondary Schools Who Used Tobacco Products in the Past 30 Days, Select Countries
Addressing Risk Factors for Noncommunicable Diseases Among Young People in Africa: Key To Prevention and Sustainable Development
*Includes only Cape Verde, 69 percent.
Current Tobacco UsePercent using cigarettes/other tobacco products/any products in the past 30 days among 13-15-year-old
secondary school students11
16% or Above 7% to 15% Below 7%
Current Alcohol UsePercent having any drinks with alcohol in the past 30 days
among 13-15-year-old secondary school students12
40% or Above 20% to 39% Below 20%
Physical InactivityPercent not engaging in physical activity for at least 60 min/day on fi ve out of the last seven days among
13-15-year-old secondary school students12
70% or Above 50% to 69% Below 50%
Overweight or ObesePercent who are overweight or obese
among 15-19-year-olds13
20% or Above 10% to 19% Below 10%
Definition of Risk Levels
High Risk Medium Risk Low Risk
Notes:Data points for the risk factors appear for countries with comparable data available from the following surveys: Global Youth Tobacco Survey and Global School-Based Student Health Survey for tobacco use, Global School-Based Student Health Survey for both alcohol use and physical inactivity, and Demographic and Health Surveys for overweight status. For the countries without data from these surveys, data from other sources were used whenever possible to assess risk levels. Only the colors showing risk levels are displayed for these countries. Data points underlying all risk levels are available in the data appendix at http://www.prb.org/Publications/Datasheets/2015/ncd-risk-youth-africa.aspx.
Data in italics are based on samples from the following cities/regions and are not nationally representative.
* National capital1 Western Area2 Harar Town3 Dar es Salaam4 Central District5 Ibadan6 Six largest urban cities7 All provincial capital cities8 Abeokuta9 Hawassa City
10 Proxy for unhealthy diet11 Based on the Global Youth Tobacco Survey and the Global
School-Based Student Health Survey12 Based on the Global School-Based Student Health Survey13 Based on the Demographic and Health Survey14 Risk level for male was coded as yellow instead of red because
the measure pertains to physical inactivity level in seven out of the last seven days in this country
† Countries where Global School-Based Student Health Survey has been conducted but did not collect data on alcohol use
# Data are not available by sex when the columns are not divided(-) Indicates data unavailable or inapplicable
Year in brackets indicates publication year for the data where data year is missing
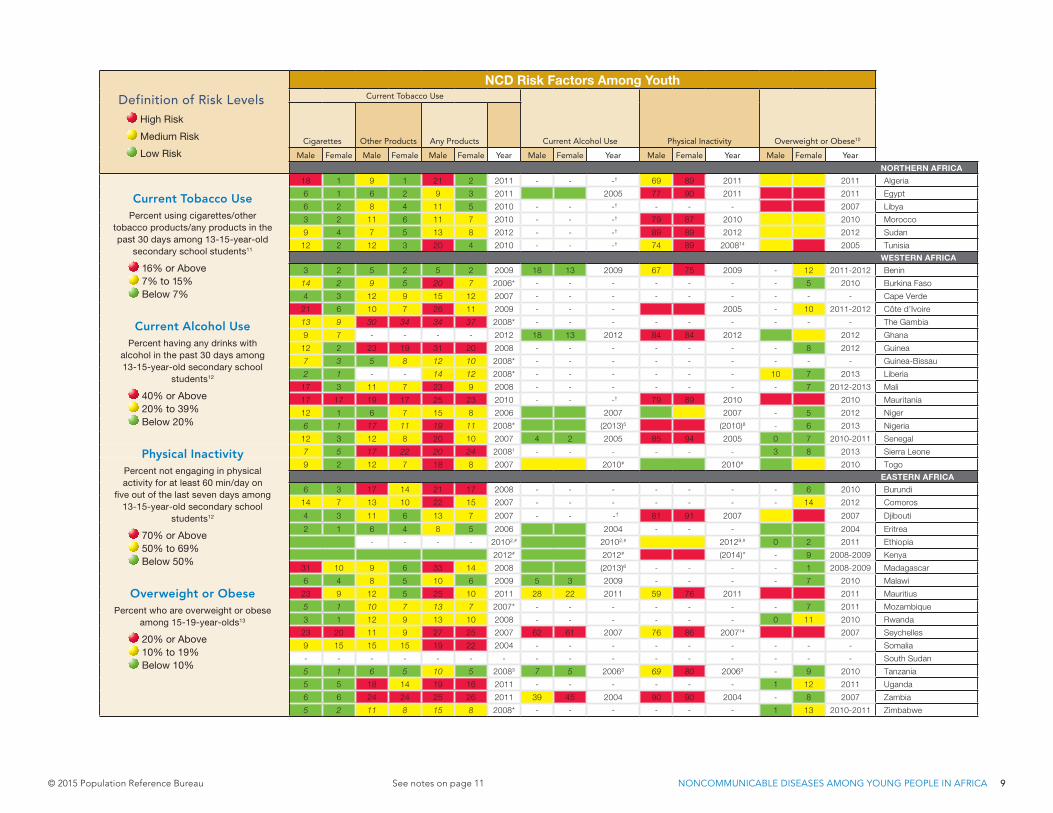
© 2015 Population Reference Bureau See notes on page 11 NONCOMMUNICABLE DISEASES AMONG YOUNG PEOPLE IN AFRICA 9
Population and Youth NCD Mortality NCD Risk Factors Among Youth
Mid-Year Population (millions)
Youth Ages 10-24,
Percent of Population,
2014
Percent Enrolled in Secondary School
(Gross Enrollment Ratio), 2005/2014
Percent of Total
Population Living
in Urban Areas, 2014
GNI per Capita, PPP
(Current International $),
2013
Age-Standardized Death Rate
for All NCDs (per 100,000),
2012
Percent of Total Deaths
due to NCDs, 2012
Probability of Premature
Death From NCDs
Between Ages 30-70,
2012
Current Tobacco Use
Current Alcohol Use Physical Inactivity Overweight or Obese10Cigarettes Other Products Any Products
2014 2050 Male Female Male Female Male Female Male Female Year Male Female Year Male Female Year Male Female Year
NORTHERN AFRICA NORTHERN AFRICA
Algeria 39.1 60.3 25 96 100 70 13,070 710 77 22 18 1 9 1 21 2 2011 - - -† 69 89 2011 2011 Algeria
Egypt 87.9 146.0 28 87 85 43 10,790 782 85 25 6 1 6 2 9 3 2011 2005 77 90 2011 2011 Egypt
Libya 6.3 8.4 26 96 113 78 - 550 78 18 6 2 8 4 11 5 2010 - - -† - - - 2007 Libya
Morocco 33.3 41.4 27 74 63 60 7,000 708 75 23 3 2 11 6 11 7 2010 - - -† 79 87 2010 2010 Morocco
Sudan 38.8 77.1 32 43 39 34 3,230 551 34 17 9 4 7 5 13 8 2012 - - -† 89 89 2012 2012 Sudan
Tunisia 11.0 13.1 23 89 93 67 10,610 509 82 17 12 2 12 3 20 4 2010 - - -† 74 89 200814 2005 Tunisia
WESTERN AFRICA WESTERN AFRICA
Benin 10.3 21.5 32 65 43 44 1,780 761 36 22 3 2 5 2 5 2 2009 18 13 2009 67 75 2009 - 12 2011-2012 Benin
Burkina Faso 17.9 46.6 33 31 26 29 1,440 784 32 24 14 2 9 5 20 7 2006* - - - - - - - 5 2010 Burkina Faso
Cape Verde 0.5 0.7 32 86 100 65 6,210 482 69 15 4 3 12 9 15 12 2007 - - - - - - - - - Cape Verde
Côte d’Ivoire 20.8 42.3 32 46 32 53 3,090 794 31 23 21 6 10 7 26 11 2009 - - - 2005 - 10 2011-2012 Côte d’Ivoire
The Gambia 1.9 4.9 32 59 56 59 1,610 630 32 19 13 9 30 34 34 37 2008* - - - - - - - - - The Gambia
Ghana 27.0 52.6 31 69 65 53 3,900 670 42 20 9 7 - - - - 2012 18 13 2012 84 84 2012 2012 Ghana
Guinea 11.6 23.9 32 47 29 37 1,160 681 31 21 12 2 23 19 31 20 2008 - - - - - - - 8 2012 Guinea
Guinea-Bissau 1.7 3.5 32 - - 49 1,410 765 28 22 7 3 5 8 12 10 2008* - - - - - - - - - Guinea-Bissau
Liberia 4.4 9.4 32 42 33 49 790 657 34 21 2 1 - - 14 12 2008* - - - - - - 10 7 2013 Liberia
Mali 15.9 45.6 32 50 40 39 1,540 866 31 26 17 3 11 7 23 9 2008 - - - - - - - 7 2012-2013 Mali
Mauritania 4.0 7.9 31 30 29 59 2,850 555 32 16 17 17 19 17 25 23 2010 - - -† 79 89 2010 2010 Mauritania
Niger 18.2 68.0 31 19 13 18 890 649 25 20 12 1 6 7 15 8 2006 2007 2007 - 5 2012 Niger
Nigeria 177.5 396.5 31 46 41 47 5,360 674 24 20 6 1 17 11 19 11 2008* (2013)5 (2010)8 - 6 2013 Nigeria
Senegal 13.9 35.1 32 43 39 43 2,210 558 34 17 12 3 12 8 20 10 2007 4 2 2005 85 94 2005 0 7 2010-2011 Senegal
Sierra Leone 6.3 10.5 32 48 42 40 1,690 964 26 27 7 5 17 22 20 24 20081 - - - - - - 3 8 2013 Sierra Leone
Togo 7.0 14.5 32 58 30 39 1,180 679 30 20 9 2 12 7 18 8 2007 2010# 2010# 2010 Togo
EASTERN AFRICA EASTERN AFRICA
Burundi 10.5 26.7 31 37 29 12 770 729 28 24 6 3 17 14 21 17 2008 - - - - - - - 6 2010 Burundi
Comoros 0.7 1.3 30 63 65 28 1,490 695 37 23 14 7 13 10 22 15 2007 - - - - - - - 14 2012 Comoros
Djibouti 0.9 1.2 30 53 43 77 - 631 36 19 4 3 11 6 13 7 2007 - - -† 81 91 2007 2007 Djibouti
Eritrea 6.5 14.3 31 - - 22 1,180 672 37 24 2 1 6 4 8 5 2006 2004 - - - 2004 Eritrea
Ethiopia 95.9 165.1 35 35 22 19 1,380 476 30 15 - - - - 20102,# 20102,# 20129,# 0 2 2011 Ethiopia
Kenya 43.2 81.3 32 69 65 25 2,780 515 27 18 2012# 2012# (2014)* - 9 2008-2009 Kenya
Madagascar 22.4 52.8 33 39 38 34 1,370 649 39 23 31 10 9 6 33 14 2008 (2013)6 - - - - 1 2008-2009 Madagascar
Malawi 16.8 41.2 33 38 35 16 750 655 28 19 6 4 8 5 10 6 2009 5 3 2009 - - - - 7 2010 Malawi
Mauritius 1.3 1.2 23 94 98 40 17,220 577 85 24 23 9 12 5 25 10 2011 28 22 2011 59 76 2011 2011 Mauritius
Mozambique 25.1 63.5 33 27 25 32 1,100 594 23 17 5 1 10 7 13 7 2007* - - - - - - - 7 2011 Mozambique
Rwanda 11.1 21.0 33 31 34 28 1,450 585 36 19 3 1 12 9 13 10 2008 - - - - - - 0 11 2010 Rwanda
Seychelles 0.1 0.1 22 79 80 54 23,730 - - - 23 20 11 9 27 25 2007 62 61 2007 76 86 200714 2007 Seychelles
Somalia 10.8 27.1 33 10 5 39 - 551 19 19 9 15 15 15 19 22 2004 - - - - - - - - - Somalia
South Sudan 11.7 39.3 33 - - 19 1,860 623 - - - - - - - - - - - - - - - - - - South Sudan
Tanzania 50.8 129.4 32 34 32 31 1,760 570 31 16 5 1 6 5 10 5 20083 7 5 20063 69 80 20063 - 9 2010 Tanzania
Uganda 38.8 104.1 34 29 25 16 1,470 664 27 21 5 5 18 14 19 16 2011 - - - - - - 1 12 2011 Uganda
Zambia 15.1 49.2 33 - - 40 3,810 587 23 18 6 6 24 24 25 26 2011 39 45 2004 90 90 2004 - 8 2007 Zambia
Zimbabwe 14.7 30.2 34 48 47 33 1,690 599 31 19 5 2 11 8 15 8 2008* - - - - - - 1 13 2010-2011 Zimbabwe
MIDDLE AFRICA MIDDLE AFRICA
Angola 22.4 60.8 33 38 25 43 7,000 768 24 24 - - - - - - - - - - - - - - - - Angola
Cameroon 22.8 54.3 33 54 46 54 2,770 675 31 20 9 3 12 7 17 10 20084 - - - - - - - 16 2011 Cameroon
Central African Republic 4.8 9.7 33 24 12 40 600 551 20 18 10 4 24 31 30 35 2008* - - - - - - - - - Central African Republic
Chad 13.3 37.4 33 31 14 22 2,010 713 21 23 8 4 17 12 21 14 2008 - - - - - - - 4 2004 Chad
Congo 4.6 10.6 31 57 50 65 4,600 632 30 20 15 8 16 18 26 22 2006 - - - - - - - 6 2011-2012 Congo
Congo, Dem. Rep. 71.2 193.6 33 54 32 42 740 724 23 24 12 4 29 28 37 29 2008* 2004-20067 2005 - 8 2013-2014 Congo, Dem. Rep.
Equatorial Guinea 0.8 1.6 30 33 24 40 23,270 729 31 23 10 3 20 15 25 17 2008 - - - - - - 5 17 2011 Equatorial Guinea
Gabon 1.7 3.3 31 - - 87 17,230 505 36 15 - - - - 2009 - - - - - - - 16 2012 Gabon
Sao Tome and Principe 0.2 0.4 31 76 85 65 2,950 - - - 6 3 30 22 31 23 2010 - - - - - - - 13 2008-2009 Sao Tome and Principe
SOUTHERN AFRICA SOUTHERN AFRICA
Botswana 2.0 2.8 33 79 84 57 15,640 612 37 21 13 5 16 14 23 16 2008 23 19 2005 87 90 2005 - - - Botswana
Lesotho 1.9 2.7 35 45 62 27 3,160 672 27 24 12 8 20 18 26 22 2008 - - - - - - 1 20 2009 Lesotho
Namibia 2.3 3.7 33 60 70 46 9,490 580 43 20 10 6 - - 14 9 2013 26 21 2013 85 86 2013 2013 Namibia
South Africa 53.7 64.1 27 107 114 64 12,240 711 43 27 15 11 14 13 24 19 2011 2011 2008 2011 South Africa
Swaziland 1.3 1.8 35 61 60 21 6,060 702 28 21 9 3 9 7 15 9 2005 - - - - - - 2013 Swaziland
Current Tobacco UsePercent using cigarettes/other
tobacco products/any products in the past 30 days among 13-15-year-old
secondary school students11
16% or Above 7% to 15% Below 7%
Current Alcohol UsePercent having any drinks with
alcohol in the past 30 days among 13-15-year-old secondary school
students12
40% or Above 20% to 39% Below 20%
Physical InactivityPercent not engaging in physical activity for at least 60 min/day on
fi ve out of the last seven days among 13-15-year-old secondary school
students12
70% or Above 50% to 69% Below 50%
Overweight or ObesePercent who are overweight or obese
among 15-19-year-olds13
20% or Above 10% to 19% Below 10%
Definition of Risk Levels High Risk
Medium Risk
Low Risk
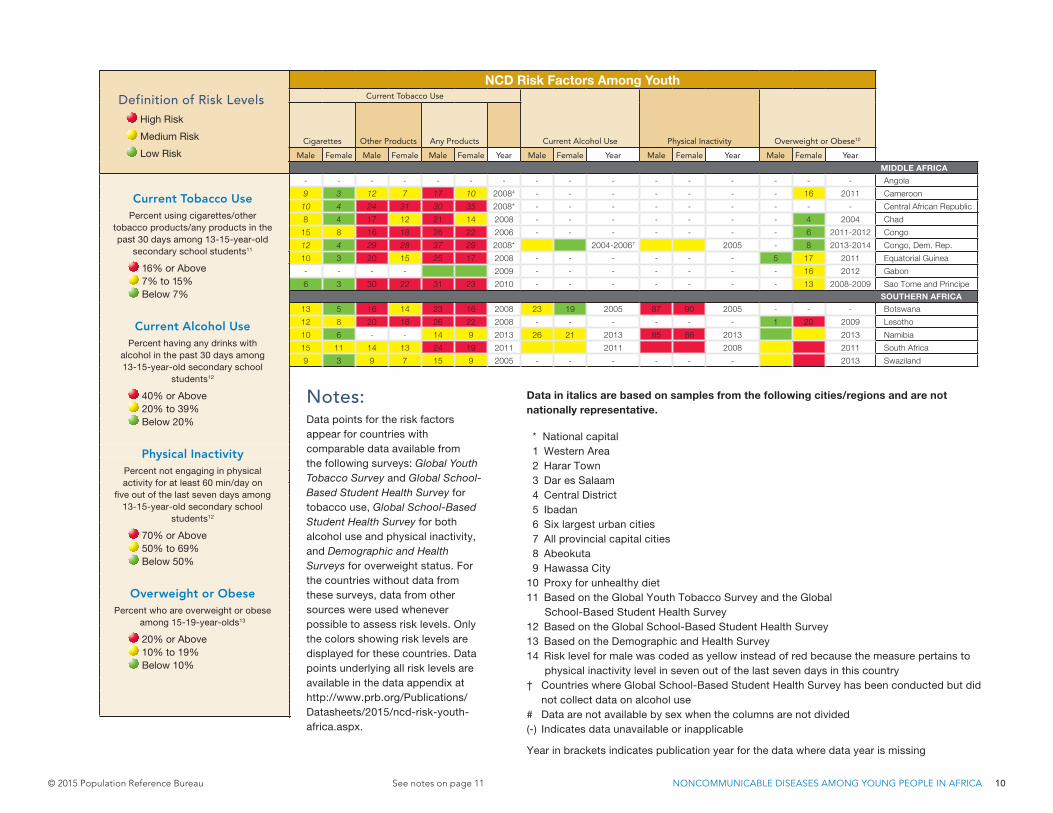
© 2015 Population Reference Bureau See notes on page 11 NONCOMMUNICABLE DISEASES AMONG YOUNG PEOPLE IN AFRICA 10
Population and Youth NCD Mortality NCD Risk Factors Among Youth
Mid-Year Population (millions)
Youth Ages 10-24,
Percent of Population,
2014
Percent Enrolled in Secondary School
(Gross Enrollment Ratio), 2005/2014
Percent of Total
Population Living
in Urban Areas, 2014
GNI per Capita, PPP
(Current International $),
2013
Age-Standardized Death Rate
for All NCDs (per 100,000),
2012
Percent of Total Deaths
due to NCDs, 2012
Probability of Premature
Death From NCDs
Between Ages 30-70,
2012
Current Tobacco Use
Current Alcohol Use Physical Inactivity Overweight or Obese10Cigarettes Other Products Any Products
2014 2050 Male Female Male Female Male Female Male Female Year Male Female Year Male Female Year Male Female Year
NORTHERN AFRICA NORTHERN AFRICA
Algeria 39.1 60.3 25 96 100 70 13,070 710 77 22 18 1 9 1 21 2 2011 - - -† 69 89 2011 2011 Algeria
Egypt 87.9 146.0 28 87 85 43 10,790 782 85 25 6 1 6 2 9 3 2011 2005 77 90 2011 2011 Egypt
Libya 6.3 8.4 26 96 113 78 - 550 78 18 6 2 8 4 11 5 2010 - - -† - - - 2007 Libya
Morocco 33.3 41.4 27 74 63 60 7,000 708 75 23 3 2 11 6 11 7 2010 - - -† 79 87 2010 2010 Morocco
Sudan 38.8 77.1 32 43 39 34 3,230 551 34 17 9 4 7 5 13 8 2012 - - -† 89 89 2012 2012 Sudan
Tunisia 11.0 13.1 23 89 93 67 10,610 509 82 17 12 2 12 3 20 4 2010 - - -† 74 89 200814 2005 Tunisia
WESTERN AFRICA WESTERN AFRICA
Benin 10.3 21.5 32 65 43 44 1,780 761 36 22 3 2 5 2 5 2 2009 18 13 2009 67 75 2009 - 12 2011-2012 Benin
Burkina Faso 17.9 46.6 33 31 26 29 1,440 784 32 24 14 2 9 5 20 7 2006* - - - - - - - 5 2010 Burkina Faso
Cape Verde 0.5 0.7 32 86 100 65 6,210 482 69 15 4 3 12 9 15 12 2007 - - - - - - - - - Cape Verde
Côte d’Ivoire 20.8 42.3 32 46 32 53 3,090 794 31 23 21 6 10 7 26 11 2009 - - - 2005 - 10 2011-2012 Côte d’Ivoire
The Gambia 1.9 4.9 32 59 56 59 1,610 630 32 19 13 9 30 34 34 37 2008* - - - - - - - - - The Gambia
Ghana 27.0 52.6 31 69 65 53 3,900 670 42 20 9 7 - - - - 2012 18 13 2012 84 84 2012 2012 Ghana
Guinea 11.6 23.9 32 47 29 37 1,160 681 31 21 12 2 23 19 31 20 2008 - - - - - - - 8 2012 Guinea
Guinea-Bissau 1.7 3.5 32 - - 49 1,410 765 28 22 7 3 5 8 12 10 2008* - - - - - - - - - Guinea-Bissau
Liberia 4.4 9.4 32 42 33 49 790 657 34 21 2 1 - - 14 12 2008* - - - - - - 10 7 2013 Liberia
Mali 15.9 45.6 32 50 40 39 1,540 866 31 26 17 3 11 7 23 9 2008 - - - - - - - 7 2012-2013 Mali
Mauritania 4.0 7.9 31 30 29 59 2,850 555 32 16 17 17 19 17 25 23 2010 - - -† 79 89 2010 2010 Mauritania
Niger 18.2 68.0 31 19 13 18 890 649 25 20 12 1 6 7 15 8 2006 2007 2007 - 5 2012 Niger
Nigeria 177.5 396.5 31 46 41 47 5,360 674 24 20 6 1 17 11 19 11 2008* (2013)5 (2010)8 - 6 2013 Nigeria
Senegal 13.9 35.1 32 43 39 43 2,210 558 34 17 12 3 12 8 20 10 2007 4 2 2005 85 94 2005 0 7 2010-2011 Senegal
Sierra Leone 6.3 10.5 32 48 42 40 1,690 964 26 27 7 5 17 22 20 24 20081 - - - - - - 3 8 2013 Sierra Leone
Togo 7.0 14.5 32 58 30 39 1,180 679 30 20 9 2 12 7 18 8 2007 2010# 2010# 2010 Togo
EASTERN AFRICA EASTERN AFRICA
Burundi 10.5 26.7 31 37 29 12 770 729 28 24 6 3 17 14 21 17 2008 - - - - - - - 6 2010 Burundi
Comoros 0.7 1.3 30 63 65 28 1,490 695 37 23 14 7 13 10 22 15 2007 - - - - - - - 14 2012 Comoros
Djibouti 0.9 1.2 30 53 43 77 - 631 36 19 4 3 11 6 13 7 2007 - - -† 81 91 2007 2007 Djibouti
Eritrea 6.5 14.3 31 - - 22 1,180 672 37 24 2 1 6 4 8 5 2006 2004 - - - 2004 Eritrea
Ethiopia 95.9 165.1 35 35 22 19 1,380 476 30 15 - - - - 20102,# 20102,# 20129,# 0 2 2011 Ethiopia
Kenya 43.2 81.3 32 69 65 25 2,780 515 27 18 2012# 2012# (2014)* - 9 2008-2009 Kenya
Madagascar 22.4 52.8 33 39 38 34 1,370 649 39 23 31 10 9 6 33 14 2008 (2013)6 - - - - 1 2008-2009 Madagascar
Malawi 16.8 41.2 33 38 35 16 750 655 28 19 6 4 8 5 10 6 2009 5 3 2009 - - - - 7 2010 Malawi
Mauritius 1.3 1.2 23 94 98 40 17,220 577 85 24 23 9 12 5 25 10 2011 28 22 2011 59 76 2011 2011 Mauritius
Mozambique 25.1 63.5 33 27 25 32 1,100 594 23 17 5 1 10 7 13 7 2007* - - - - - - - 7 2011 Mozambique
Rwanda 11.1 21.0 33 31 34 28 1,450 585 36 19 3 1 12 9 13 10 2008 - - - - - - 0 11 2010 Rwanda
Seychelles 0.1 0.1 22 79 80 54 23,730 - - - 23 20 11 9 27 25 2007 62 61 2007 76 86 200714 2007 Seychelles
Somalia 10.8 27.1 33 10 5 39 - 551 19 19 9 15 15 15 19 22 2004 - - - - - - - - - Somalia
South Sudan 11.7 39.3 33 - - 19 1,860 623 - - - - - - - - - - - - - - - - - - South Sudan
Tanzania 50.8 129.4 32 34 32 31 1,760 570 31 16 5 1 6 5 10 5 20083 7 5 20063 69 80 20063 - 9 2010 Tanzania
Uganda 38.8 104.1 34 29 25 16 1,470 664 27 21 5 5 18 14 19 16 2011 - - - - - - 1 12 2011 Uganda
Zambia 15.1 49.2 33 - - 40 3,810 587 23 18 6 6 24 24 25 26 2011 39 45 2004 90 90 2004 - 8 2007 Zambia
Zimbabwe 14.7 30.2 34 48 47 33 1,690 599 31 19 5 2 11 8 15 8 2008* - - - - - - 1 13 2010-2011 Zimbabwe
MIDDLE AFRICA MIDDLE AFRICA
Angola 22.4 60.8 33 38 25 43 7,000 768 24 24 - - - - - - - - - - - - - - - - Angola
Cameroon 22.8 54.3 33 54 46 54 2,770 675 31 20 9 3 12 7 17 10 20084 - - - - - - - 16 2011 Cameroon
Central African Republic 4.8 9.7 33 24 12 40 600 551 20 18 10 4 24 31 30 35 2008* - - - - - - - - - Central African Republic
Chad 13.3 37.4 33 31 14 22 2,010 713 21 23 8 4 17 12 21 14 2008 - - - - - - - 4 2004 Chad
Congo 4.6 10.6 31 57 50 65 4,600 632 30 20 15 8 16 18 26 22 2006 - - - - - - - 6 2011-2012 Congo
Congo, Dem. Rep. 71.2 193.6 33 54 32 42 740 724 23 24 12 4 29 28 37 29 2008* 2004-20067 2005 - 8 2013-2014 Congo, Dem. Rep.
Equatorial Guinea 0.8 1.6 30 33 24 40 23,270 729 31 23 10 3 20 15 25 17 2008 - - - - - - 5 17 2011 Equatorial Guinea
Gabon 1.7 3.3 31 - - 87 17,230 505 36 15 - - - - 2009 - - - - - - - 16 2012 Gabon
Sao Tome and Principe 0.2 0.4 31 76 85 65 2,950 - - - 6 3 30 22 31 23 2010 - - - - - - - 13 2008-2009 Sao Tome and Principe
SOUTHERN AFRICA SOUTHERN AFRICA
Botswana 2.0 2.8 33 79 84 57 15,640 612 37 21 13 5 16 14 23 16 2008 23 19 2005 87 90 2005 - - - Botswana
Lesotho 1.9 2.7 35 45 62 27 3,160 672 27 24 12 8 20 18 26 22 2008 - - - - - - 1 20 2009 Lesotho
Namibia 2.3 3.7 33 60 70 46 9,490 580 43 20 10 6 - - 14 9 2013 26 21 2013 85 86 2013 2013 Namibia
South Africa 53.7 64.1 27 107 114 64 12,240 711 43 27 15 11 14 13 24 19 2011 2011 2008 2011 South Africa
Swaziland 1.3 1.8 35 61 60 21 6,060 702 28 21 9 3 9 7 15 9 2005 - - - - - - 2013 Swaziland
Current Tobacco UsePercent using cigarettes/other
tobacco products/any products in the past 30 days among 13-15-year-old
secondary school students11
16% or Above 7% to 15% Below 7%
Current Alcohol UsePercent having any drinks with
alcohol in the past 30 days among 13-15-year-old secondary school
students12
40% or Above 20% to 39% Below 20%
Physical InactivityPercent not engaging in physical activity for at least 60 min/day on
fi ve out of the last seven days among 13-15-year-old secondary school
students12
70% or Above 50% to 69% Below 50%
Overweight or ObesePercent who are overweight or obese
among 15-19-year-olds13
20% or Above 10% to 19% Below 10%
Definition of Risk Levels High Risk
Medium Risk
Low Risk
Data in italics are based on samples from the following cities/regions and are not nationally representative.
* National capital1 Western Area2 Harar Town3 Dar es Salaam4 Central District5 Ibadan6 Six largest urban cities7 All provincial capital cities8 Abeokuta9 Hawassa City
10 Proxy for unhealthy diet11 Based on the Global Youth Tobacco Survey and the Global
School-Based Student Health Survey12 Based on the Global School-Based Student Health Survey13 Based on the Demographic and Health Survey14 Risk level for male was coded as yellow instead of red because the measure pertains to
physical inactivity level in seven out of the last seven days in this country† Countries where Global School-Based Student Health Survey has been conducted but did
not collect data on alcohol use# Data are not available by sex when the columns are not divided(-) Indicates data unavailable or inapplicable
Year in brackets indicates publication year for the data where data year is missing
Notes:Data points for the risk factors appear for countries with comparable data available from the following surveys: Global Youth Tobacco Survey and Global School-Based Student Health Survey for tobacco use, Global School-Based Student Health Survey for both alcohol use and physical inactivity, and Demographic and Health Surveys for overweight status. For the countries without data from these surveys, data from other sources were used whenever possible to assess risk levels. Only the colors showing risk levels are displayed for these countries. Data points underlying all risk levels are available in the data appendix at http://www.prb.org/Publications/Datasheets/2015/ncd-risk-youth-africa.aspx.

© 2015 Population Reference Bureau See notes on page 11 NONCOMMUNICABLE DISEASES AMONG YOUNG PEOPLE IN AFRICA 11
Note: This data sheet accompanies the policy brief entitled Noncommunicable Diseases in Africa: Youth Are Key to Curbing the Epidemic and Achieving Sustainable Development. The data sheet is accompanied by a data appendix that provides all available country-specific data and data sources on four key noncommunicable (NCD) risk factors among young people in Africa since 2004. These publications extend an earlier publication, Noncommunicable Diseases Risk Factors Among Young People in Africa: Data Availability and Sources. All are available at www.prb.org/Publications/Datasheets/2015/ncd-risk-youth-africa.aspx.
Technical Notes
This data sheet lists all countries in North and sub-Saharan Africa with populations of 150,000 or more and all members of the UN. Countries with unavailable data for most indicators are, however, excluded.
NCD Risks. The data sheet focuses on four specific behaviors—tobacco use, harmful use of alcohol, physical inactivity, and unhealthy diet—identified by the World Health Organization to be key NCD risk factors. Data availability on these risk factors among young people is limited in Africa. Available data are typically not directly comparable across a large number of countries. They may measure the levels of risk using different indicators, at different geographic levels (national, regional), for different age groups, and from different settings (all youth, youth in schools). To facilitate the cross-country comparison of risk levels and to focus attention on the broader picture, the risk levels are presented here as high (red), medium (yellow), or low (green).
Risk levels are assessed by first identifying the core indicator for each risk factor that is suitable and for which data are consistently available for the largest number of countries. For countries with data on the core indicators, both risk levels and data points are presented. For countries without data on the core indicators, only risk levels are presented. These levels are based on alternative indicators or data that are otherwise not directly comparable (such as different
age groups, indicator definitions) but that still enable assessment of risk levels using similar standards. All data points underlying risk levels and the data sources are available for each risk factor per country in the data appendix accessible at www.prb.org/Publications/Datasheets/2015/ncd-risk-youth-africa.aspx.
The risk levels are assessed using the standards described below under each risk factor. Due to the lack of preexisting standards to assess population-level risks for these behaviors, cut-offs were developed for each risk factor based on a review of previous literature (see www.prb.org/Publications/Reports/2014/ncd-risk-youth-africa.aspx). The standards were adjusted up or down to determine the risk levels when the indicator differed from the ones specified here. Data on any age groups between ages 10 and 24 from 2004 or later are considered in the coding. Data points rounded to their nearest integers are used for coding risk levels. Because well-documented sex differences exist for the prevalence for all risk factors, the risk levels are coded by sex when possible.
Tobacco Use. The core indicators are the percent reporting use in the past 30 days of each of the following: cigarettes, other tobacco products, and any tobacco products among 13-to-15-year-old students available in Global Youth Tobacco Survey (World Health Organization (WHO) and U.S. Centers for Disease Control and Prevention (CDC)) and Global School-Based Student Health Survey (GSHS) (WHO and CDC). The standard used for coding is high ≥ 16%; medium = 7%-15%; and low < 7%.
Alcohol Use. The core indicator is the percent reporting any alcohol use in the past 30 days among 13-to-15-year-old students available in GSHS (WHO and CDC). The standard used for coding is high ≥ 40%; medium = 20%-39%; and low < 20%. We use any amount of alcohol use instead of harmful use, since any amount of drinking presents risk among youth both because of the greater health impact of alcohol on young people and the link between the age of onset and likelihood of lifetime alcohol dependency.
Physical Inactivity. The core indicator is the per-cent reporting not engaging in any type of physical activity for at least 60 minutes a day for five days in the past seven days among 13-to-15-year-old students available from GSHS (WHO and CDC). The standard used for coding is high ≥ 70%; medium = 50%-69%; and low < 50%. Surveys usually report physical activity levels rather than inactivity levels, so data used and presented here are 100 percent minus the percent reported to be physically active. In some countries, the measure pertains to the activity level in seven out of the past seven days. For those countries, the standards used to code risk levels were adjusted.
Overweight/Obesity (Unhealthy Diet). The core indicator is the percent reporting overweight or obese among 15-to-19-year-olds available in Demographic and Health Surveys. The standard used for coding is high ≥ 20%; medium = 10%–19%; and low < 10%. The overweight/obesity measure is used as a proxy for unhealthy diet due to the scarcity of comparable data on dietary intake to assess nutrition levels across countries. Overweight/obesity is a physiological change resulting from high caloric consumption and physical inactivity and is assessed with the Body Mass Index (BMI), a measure of weight relative to height. The BMI levels used to classify overweight/obese status vary somewhat across surveys and are specified in the data appendix.
Data Sources
Population and Youth
Carl Haub and Toshiko Kaneda, 2014 World Population Data Sheet (Washington, DC: Population Reference Bureau, 2014).
UN Population Division, World Population Prospects: The 2012 Revision (New York: UN, 2013).
UNESCO Institute for Statistics, online database, accessed at www.uis.unesco.org/Pages/default.aspx.
World Bank, “World Development Indicators,” online database, accessed at http://data.worldbank.org/data-catalog/world-development-indicators.
NCD Mortality
World Health Organization (WHO), World Health Statistics 2014 (Geneva: WHO, 2014).
WHO, Noncommunicable Diseases Country Profiles 2014 (Geneva: WHO, 2014).
NCD Risk Factor Among Youth
WHO and U.S. Centers for Disease Control and Prevention (CDC), Global School-Based Student Health Surveys, accessed at www.who.int/chp/gshs/en/.
WHO and CDC, Global Youth Tobacco Surveys, accessed at http://nccd.cdc.gov/GTSSData/Ancillary/DataReports.aspx?CAID=1.
ICF International, Demographic and Health Surveys, accessed at www.dhsprogram.com.
WHO, STEPwise Approach to Chronic Disease Risk Factor Surveillance (STEPS), accessed at www.who.int/chp/steps/en/.
Various other country-specific surveys (see the data appendix for a list of full citations).
ACKNOWLEDGMENTSThis data sheet was produced by Toshiko Kaneda, Ph.D., senior research associate at the Population Reference Bureau (PRB) and Reshma Naik, Dr.P.H., senior policy analyst at PRB. Wendy Baldwin, independent consultant, contributed to the preliminary work on this data sheet. Special thanks to Jeffrey Jordan, Susan Rich, and Carl Haub at PRB; Derek Yach at the Vitality Institute; and Francisco Sierra and Sarah Shillito at AstraZeneca Young Health Programme for their insightful review and helpful comments. The authors also thank interns Marisha Wick-remsinhe, Sharee Pearson, Adaeze Exeofor, Heather Zaccaro, and Adrianna Zinn for their assistance with data.© 2015 Population Reference Bureau. All rights reserved.Photo credit, cover: © Sean Sprague / Alamy

© 2015 Population Reference Bureau See notes on page 11 NONCOMMUNICABLE DISEASES AMONG YOUNG PEOPLE IN AFRICA 12
1875 Connecticut Ave., NW, Washington, DC 20009 USA
tel. 202-483-1100 | fax 202-328-3937 [email protected] | www.prb.org
PRB on: @PRBdata
This data sheet was funded by the AstraZeneca Young Health Programme (YHP). YHP is a partnership among AstraZeneca, Johns Hopkins Bloomberg School of Public Health, and Plan International, with local NGO partners also implementing YHP programs on the ground. The YHP mission is to positively impact the health of adolescents in marginalized communities worldwide through research, advocacy, and on-the-ground programs focused on NCD prevention.
www.younghealthprogrammeyhp.com
The POPULATION REFERENCE BUREAU informs people around the
world about population, health, and the environment, and empowers them to
use that information to advance the well-being of current and future generations.
INFORMPRB informs people around the world and in the United States about issues related to population, health, and the environment. To do this, we transform technical data and research into accurate, easy-to-understand information.
EMPOWERPRB empowers people—researchers, journalists, policymakers, and educators— to use information about population, health, and the environment to encourage action.
ADVANCEPRB works to advance the well-being of current and future generations. Toward that end, we analyze data and research, disseminate information, and empower people to use that information in order to inform policymaking.