addressing the role of nutrition education and health literacy in
TRANSCRIPT

Rebecca Pratt Gregory, MS, RD, CDE and Kerri Cavanaugh, MD, MHS
Addressing The Role of Nutrition Education and Health Literacy in Diabetes Care
2
Learning Objectives
• Review of impact of CDEs and medical nutrition therapy (MNT) on diabetes outcomes
• Review health literacy & numeracy in diabetes self-care
• Describe design of new randomized controlled trial to:– Examine the value of CDE in diabetes care– Examine the role of different approaches to MNT
• Learn about study results, interpretation and applications to clinical practice

3
Role of CDEs in Medical Nutrition Therapy in Diabetes Care• Diabetes self-management education (DSME) can improve
patient knowledge, behavior, and glycemic control– Medical Nutrition Therapy is an essential part of DSME
• Addressing carbohydrates as a nutritional strategy is endorsed by the ADA and the AADE
– Clinical trials have shown that MNT can improve A1C by 1-2%– No studies have compared carbohydrate counting and plate method
• Facilitating positive behavior as well as transferring knowledge is a priority, but little research in this area exists

4
Components of Literacy
Literacy
Cultural and Conceptual Knowledge
Speaking Reading NumeracyListening Writing
Print LiteracyOral Literacy
IOM, Health Literacy, 2004
Defining Health Literacy
5
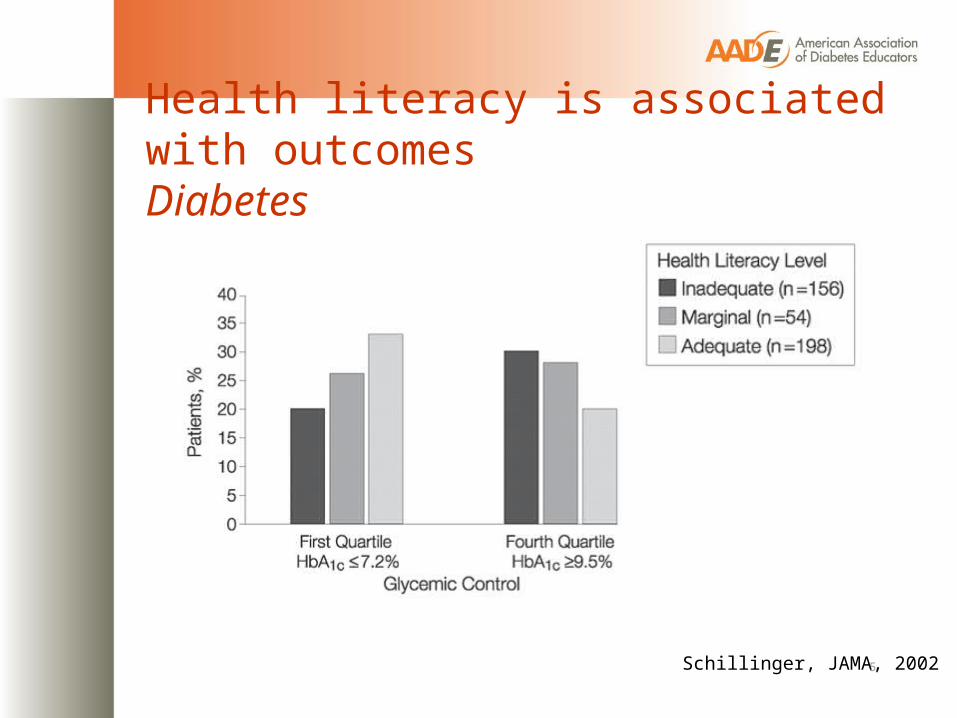
Health literacy is associated with outcomesDiabetes
Schillinger, JAMA, 2002

6
Components of Literacy
Literacy
Cultural and Conceptual Knowledge
Speaking Reading NumeracyListening Writing
Print LiteracyOral Literacy
IOM, Health Literacy, 2004
7
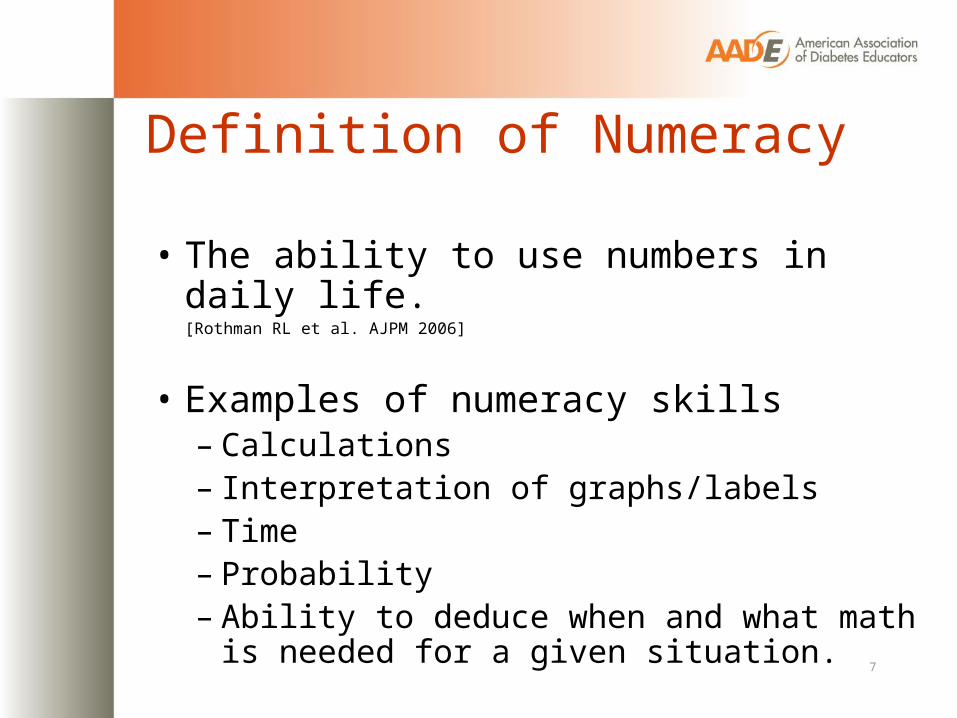
Definition of Numeracy
• The ability to use numbers in daily life. [Rothman RL et al. AJPM 2006]
• Examples of numeracy skills– Calculations– Interpretation of graphs/labels– Time– Probability– Ability to deduce when and what math is
needed for a given situation.
8
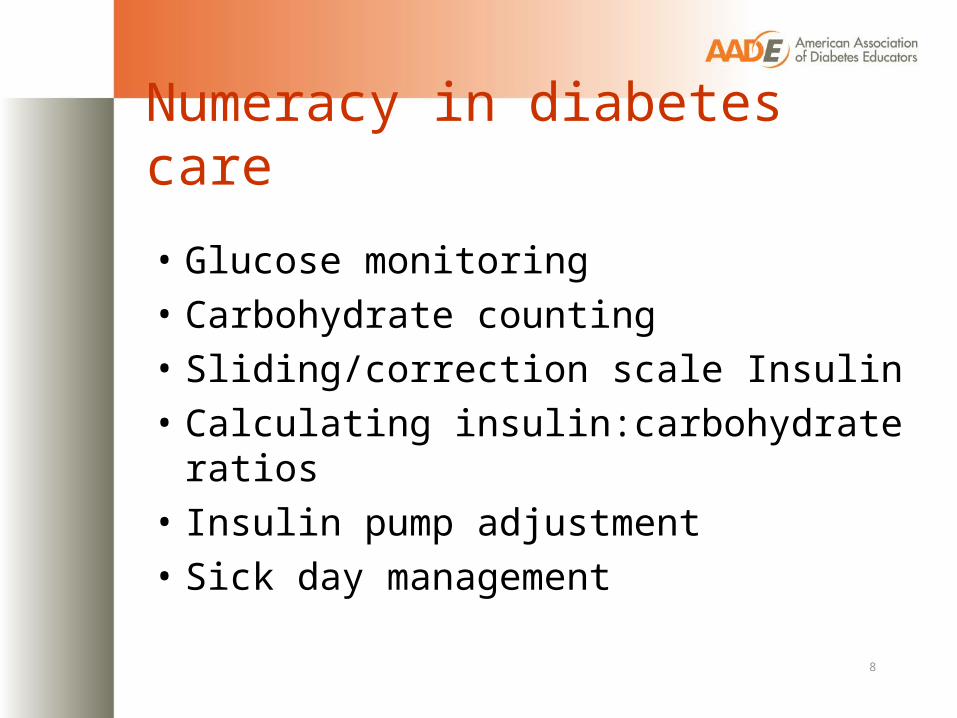
Numeracy in diabetes care
• Glucose monitoring• Carbohydrate counting • Sliding/correction scale Insulin• Calculating insulin:carbohydrate ratios• Insulin pump adjustment• Sick day management
9
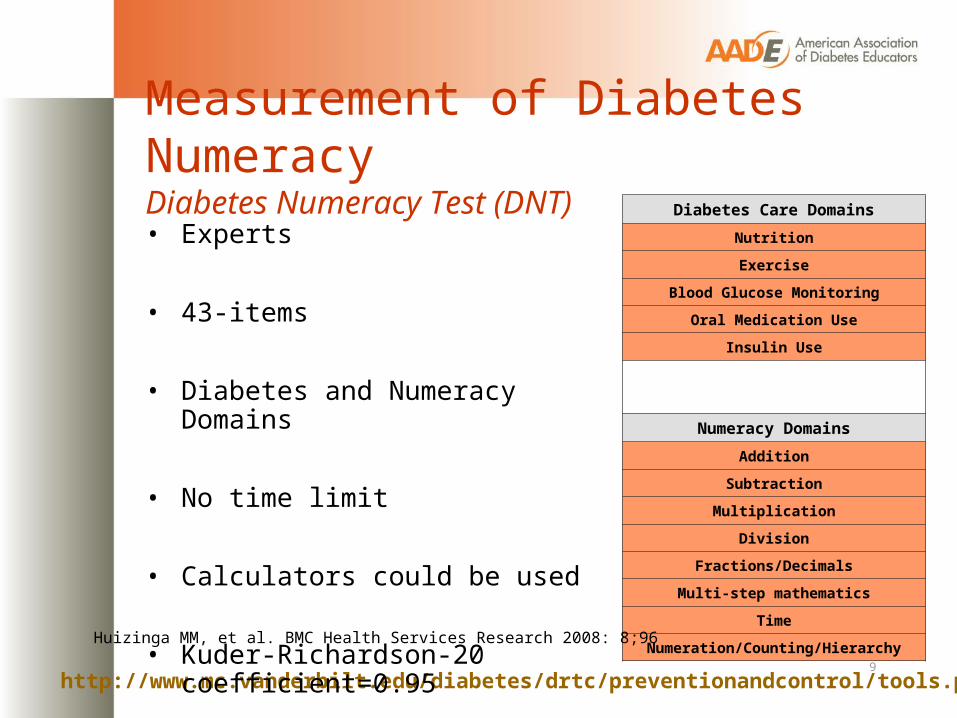
Measurement of Diabetes NumeracyDiabetes Numeracy Test (DNT)
http://www.mc.vanderbilt.edu/diabetes/drtc/preventionandcontrol/tools.php
• Experts
• 43-items
• Diabetes and Numeracy Domains
• No time limit
• Calculators could be used
• Kuder-Richardson-20 coefficient=0.95
Diabetes Care DomainsNutritionExercise
Blood Glucose MonitoringOral Medication Use
Insulin Use
Numeracy DomainsAddition
SubtractionMultiplication
DivisionFractions/Decimals
Multi-step mathematicsTime
Numeration/Counting/HierarchyHuizinga MM, et al. BMC Health Services Research 2008: 8;96
10
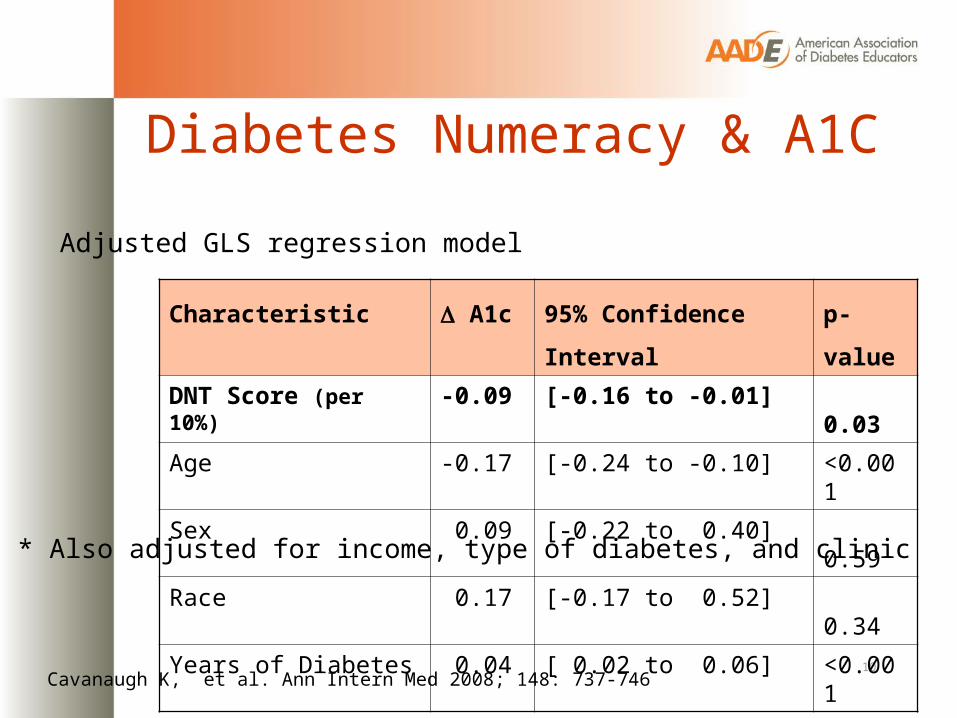
Diabetes Numeracy & A1C
Characteristic A1c 95% Confidence Interval p-value
DNT Score (per 10%) -0.09 [-0.16 to -0.01] 0.03Age -0.17 [-0.24 to -0.10] <0.001
Sex 0.09 [-0.22 to 0.40] 0.59
Race 0.17 [-0.17 to 0.52] 0.34
Years of Diabetes 0.04 [ 0.02 to 0.06] <0.001
* Also adjusted for income, type of diabetes, and clinic
Adjusted GLS regression model
Cavanaugh K, et al. Ann Intern Med 2008; 148: 737-746

Diabetes Literacy & Numeracy Education Toolkit(DLNET): A RCT
12
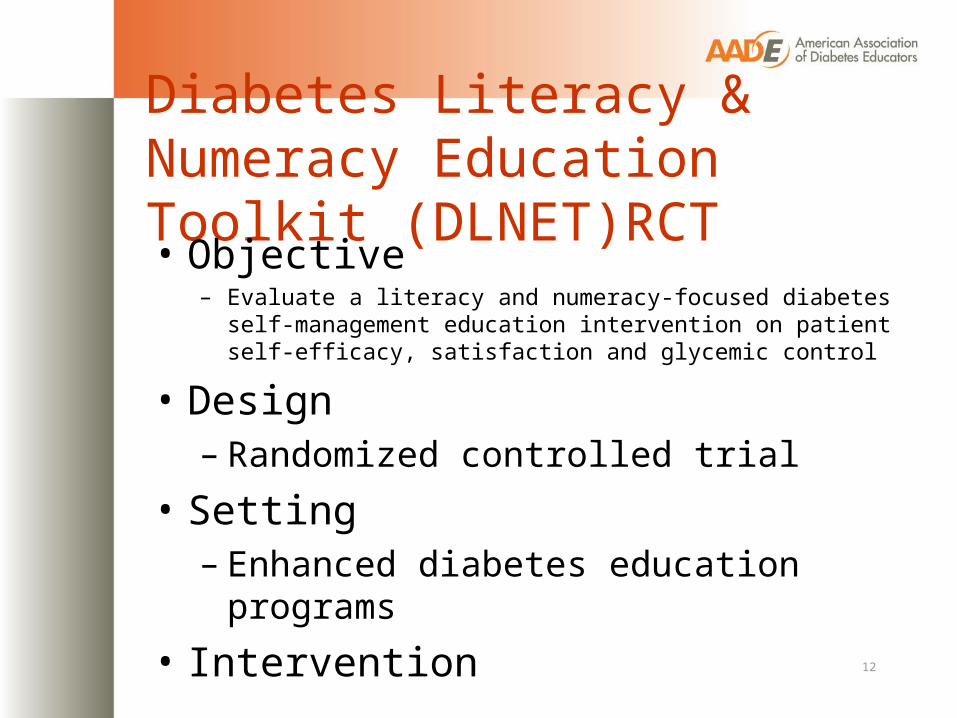
Diabetes Literacy & Numeracy Education Toolkit (DLNET)RCT• Objective
– Evaluate a literacy and numeracy-focused diabetes self-management education intervention on patient self-efficacy, satisfaction and glycemic control
• Design– Randomized controlled trial
• Setting– Enhanced diabetes education programs
• Intervention
13
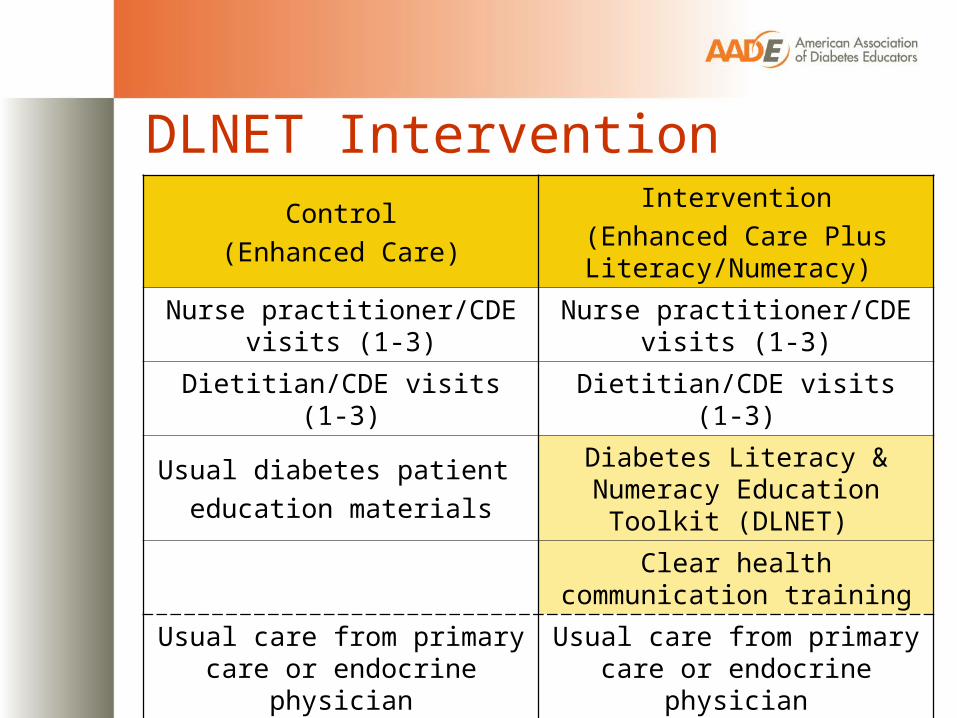
DLNET Intervention Control
(Enhanced Care)
Intervention(Enhanced Care Plus Literacy/Numeracy)
Nurse practitioner/CDE visits (1-3) Nurse practitioner/CDE visits (1-3)
Dietitian/CDE visits (1-3) Dietitian/CDE visits (1-3)
Usual diabetes patient education materials
Diabetes Literacy & Numeracy Education Toolkit (DLNET)
Clear health communication training
Usual care from primary care or endocrine physician
Usual care from primary care or endocrine physician

14
DLNET Toolkit
Wolff K et al. The Diab Educ 2009
Goals• Facilitate diabetes education and self-management
• Type 1 or Type 2 diabetes mellitus
• Oral medications or insulin
• Individual modules to customize for each patient• Blood Glucose Monitoring
• Exercise planning
• Foot care
• Nutritional management
• Carbohydrates
• Medications
• Logbooks/worksheetsAvailable at:www.mc.vanderbilt.edu/diabetes/drtc/preventionandcontrol/tools.php

15
DLNET Toolkit
Wolff K et al. The Diab Educ 2009
• Text at 5th grade reading level
• Color coding
• Pictures for key concepts
• Step-by-step instructions
• Simplified medication instructions
• Practice skills worksheets

16
DLNET Study Results
Cavanaugh KL et al. Diabetes Care 2009
Mean [95% bootstrap Confidence Interval]*Adjusting for age, gender, race, type of diabetes, income level, site of intervention and baseline DNT score and Hba1c levels
A1c 3-months Adjusted p-value [Intervention vs. Control]*
6-months Adjusted p-value [Intervention vs. Control]*
Intervention -1.63 [ -2.03 , -1.23] 0.03 -1.11 [ -1.54,-0.65] 0.437
Control -0.97 [-1.37 , -0.53 ] -1.17 [-1.61,-0.71]
Diabetes NutritionEducationStudy (DINES): A Randomized Controlled Trial
18
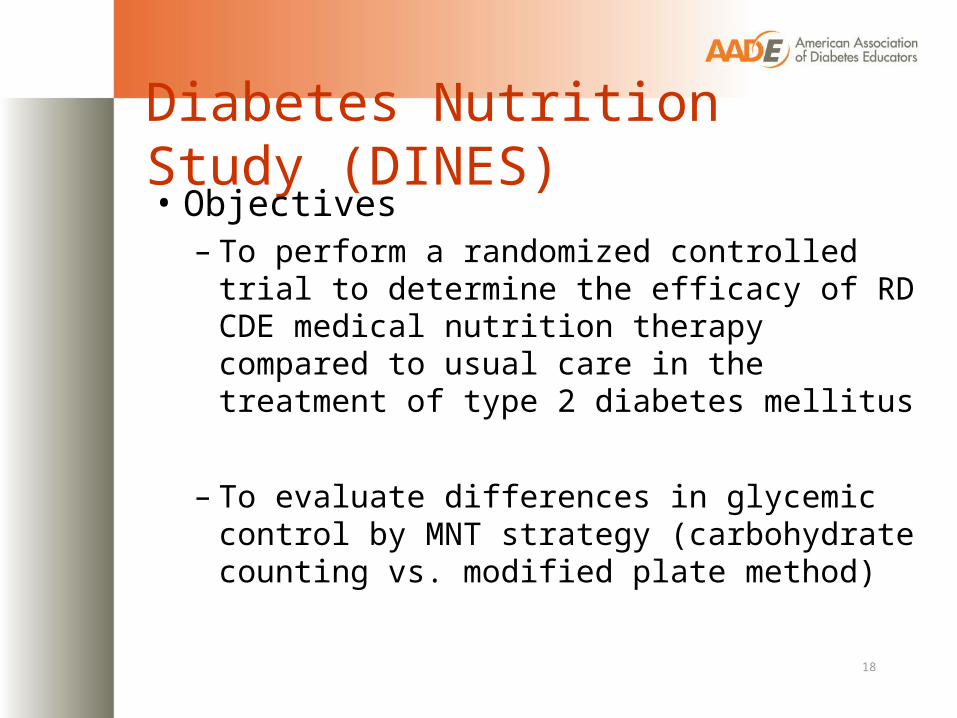
Diabetes Nutrition Study (DINES)• Objectives
– To perform a randomized controlled trial to determine the efficacy of RD CDE medical nutrition therapy compared to usual care in the treatment of type 2 diabetes mellitus
– To evaluate differences in glycemic control by MNT strategy (carbohydrate counting vs. modified plate method)
19
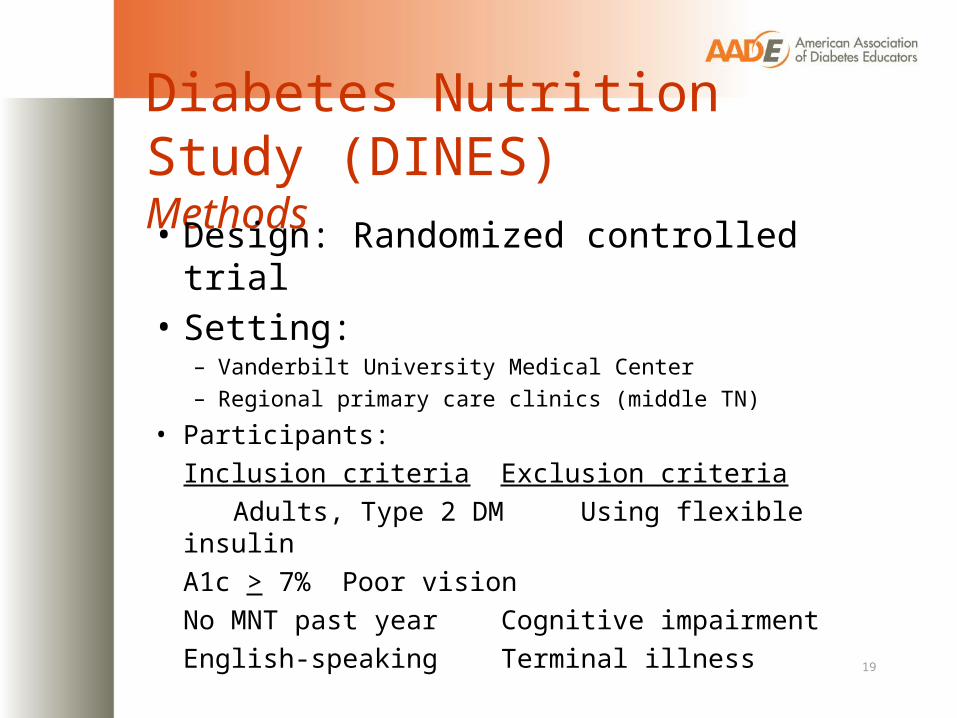
Diabetes Nutrition Study (DINES)Methods• Design: Randomized controlled trial• Setting:
– Vanderbilt University Medical Center – Regional primary care clinics (middle TN)
• Participants: Inclusion criteria Exclusion criteria Adults, Type 2 DM Using flexible insulin
A1c > 7% Poor visionNo MNT past year Cognitive impairmentEnglish-speaking Terminal illness

20
Diabetes Nutrition Study (DINES)• Nutrition Education Intervention
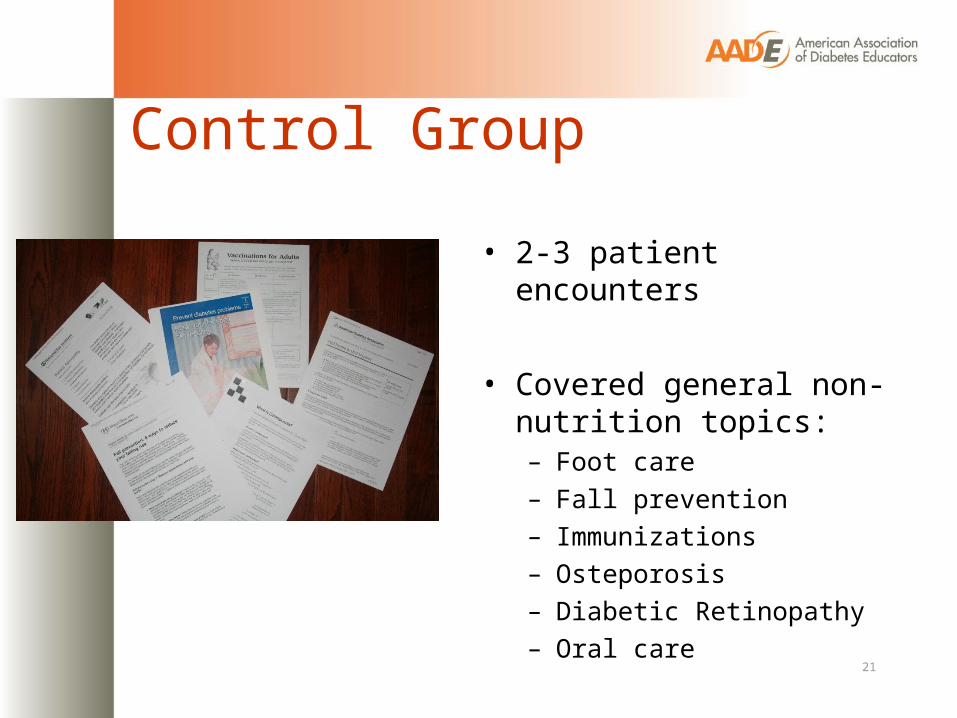
Control Group
• 2-3 patient encounters
• Covered general non- nutrition topics:– Foot care– Fall prevention– Immunizations– Osteporosis– Diabetic Retinopathy– Oral care
21
22
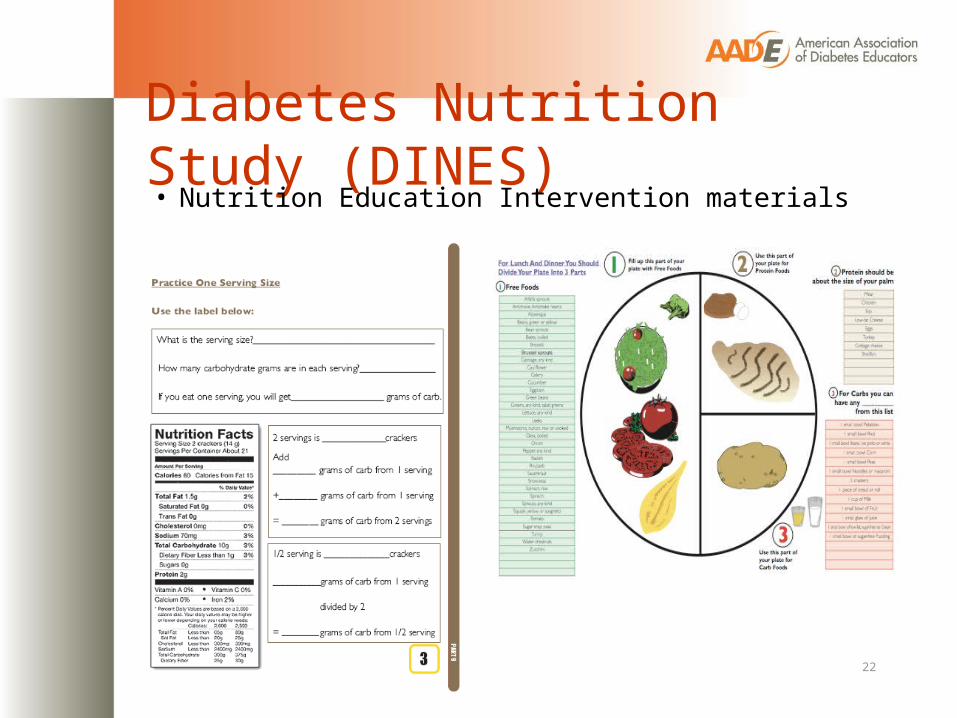
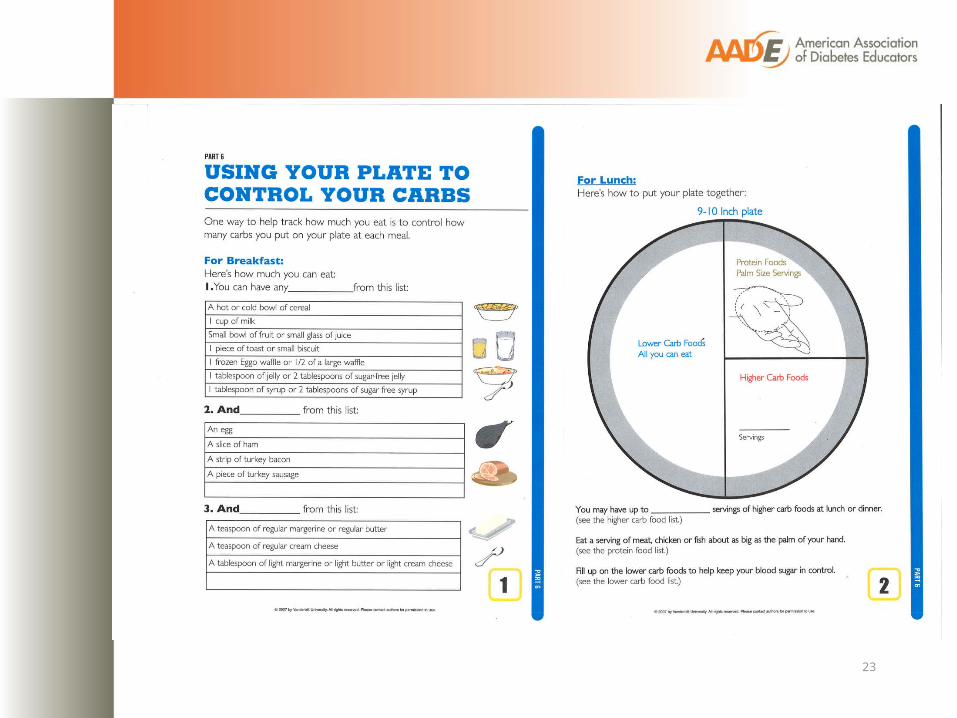
Diabetes Nutrition Study (DINES)• Nutrition Education Intervention materials
23

Modified Plate Method
• Number of carb portions defined
• Based on glucose response to meals
• Higher carb foods listed with amounts per carb serving
24

25
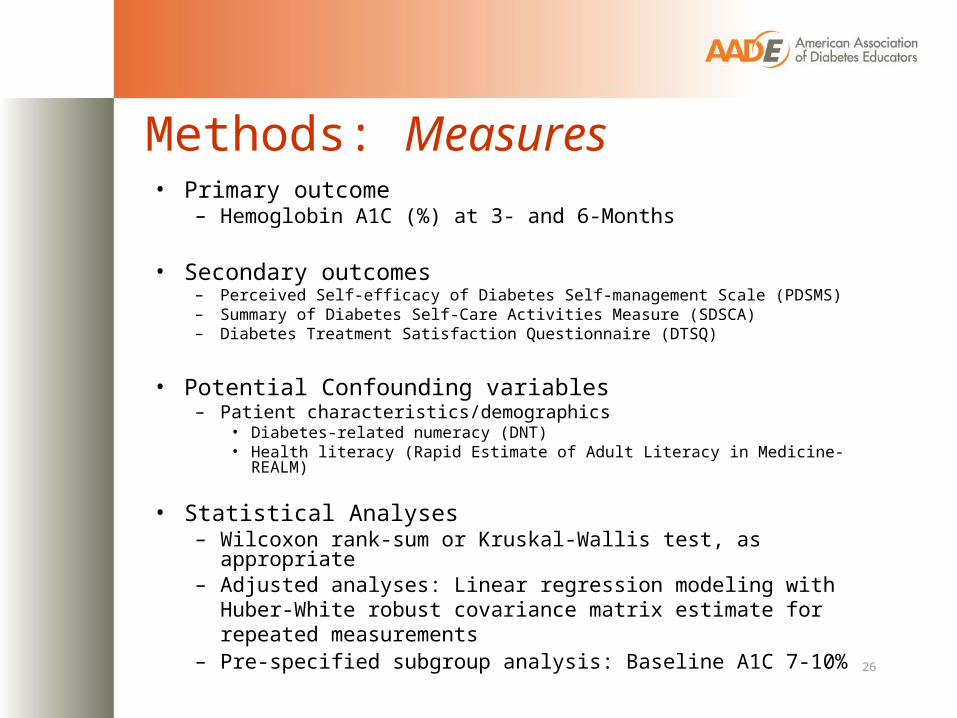
Methods: Measures
26
• Primary outcome– Hemoglobin A1C (%) at 3- and 6-Months
• Secondary outcomes– Perceived Self-efficacy of Diabetes Self-management Scale (PDSMS)– Summary of Diabetes Self-Care Activities Measure (SDSCA)– Diabetes Treatment Satisfaction Questionnaire (DTSQ)
• Potential Confounding variables– Patient characteristics/demographics
• Diabetes-related numeracy (DNT)• Health literacy (Rapid Estimate of Adult Literacy in Medicine-REALM)
• Statistical Analyses– Wilcoxon rank-sum or Kruskal-Wallis test, as appropriate– Adjusted analyses: Linear regression modeling with Huber-White
robust covariance matrix estimate for repeated measurements – Pre-specified subgroup analysis: Baseline A1C 7-10%
27
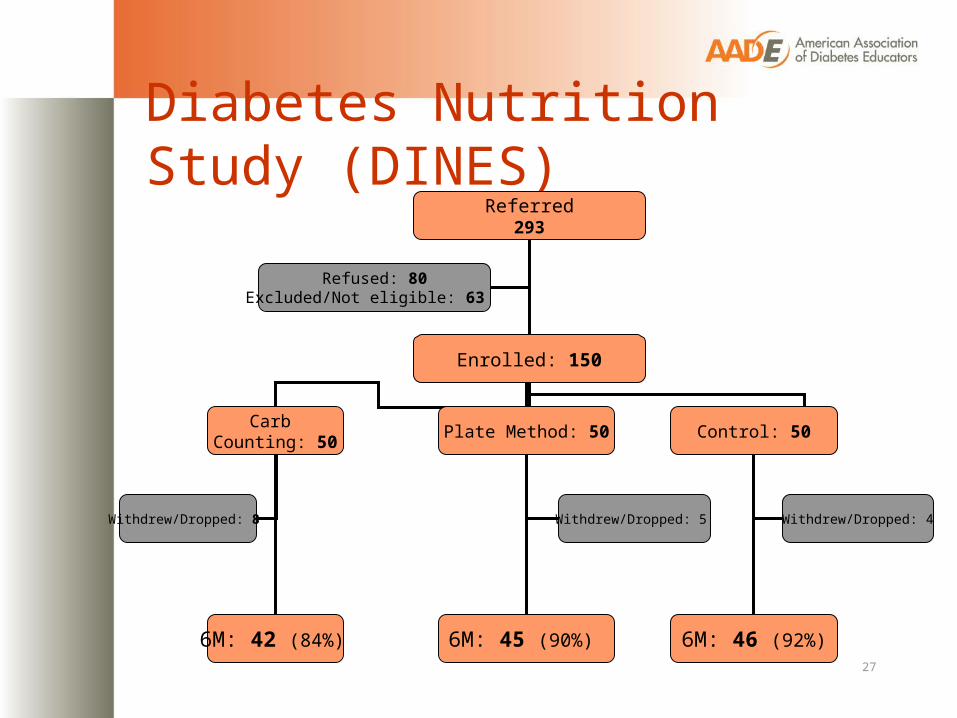
Diabetes Nutrition Study (DINES)Referred
293
Enrolled: 150
Refused: 80Excluded/Not eligible: 63
Carb Counting: 50 Control: 50
Withdrew/Dropped: 8 Withdrew/Dropped: 4
Plate Method: 50
6M: 42 (84%) 6M: 45 (90%)
Withdrew/Dropped: 5
6M: 46 (92%)

28
Diabetes Nutrition Study (DINES)Participant Characteristics
Characteristic Carb Countingn=50
Plate Methodn=50
Controln=50
Age (yrs) 54 (47, 68) 55 (45, 60) 57 (48, 62)
% Male 38% 54% 48%
% White 58% 73% 66%
Education (yrs) 14 (13, 16) 14 (12, 16) 14 (13, 16)
% Income <$20k/yr 22% 26% 22%
% Smoke 14% 22% 10%
Diabetes Duration (yrs) 8 (4, 10) 7 (3, 10) 8 (3, 13)
% Insulin 28% 42% 34%
% Prior DM education 52% 54% 68%
Body mass index (kg/m2) 34 (30, 37) 34 (30, 39) 34 (30, 39)
% Literacy <9th grade 8% 14% 10%
DNT Score (0-100%) 73 (40, 93) 67 (40, 85) 67 (47, 80)Median (Interquartile Range)

29
Diabetes Nutrition Study (DINES)Participant Characteristics Baseline
Characteristic Carb Countingn=50
Plate Methodn=50
Controln=50
Hemoglobin A1C (%) 8.4 (7.6, 9.7) 8.3 (7.5, 10.4) 8.0 (7.5, 9.7)
Weight (lbs) 218 (190, 252) 224 (189, 259) 216 (180, 243)
Self-efficacy: PDSMS [8-40] 24 (18, 29) 24 (21, 27) 24 (21, 29)
Self-management: SDSCA [0-7]
General Diet 3.5 (1.5, 5) 4.0 (2.5, 5) 3.5 (2.5, 5.5)
Specific Diet 3.5 (2, 4.5) 3.0 (2, 4.4) 3.2 (2, 4.5)
Exercise 1.5 (0.1, 3.4) 2.5 (0.5, 3.9) 2.0 (0.5, 3.9)
Blood glucose monitoring 3.5 (1.1, 5.9) 6.0 (2.1, 7) 5.0 (0.6, 7)
Foot care 3.5 (1.5, 5.9) 3.5 (1.1, 5.9) 3.5 (2, 6.5)
Medications 7.0 (5.2, 7) 7.0 (7, 7) 7.0 (7, 7)
Satisfaction: DTSQ [0-48] 24 (17, 30) 22 (17, 29) 26 (19, 31)Median (Interquartile Range)
30
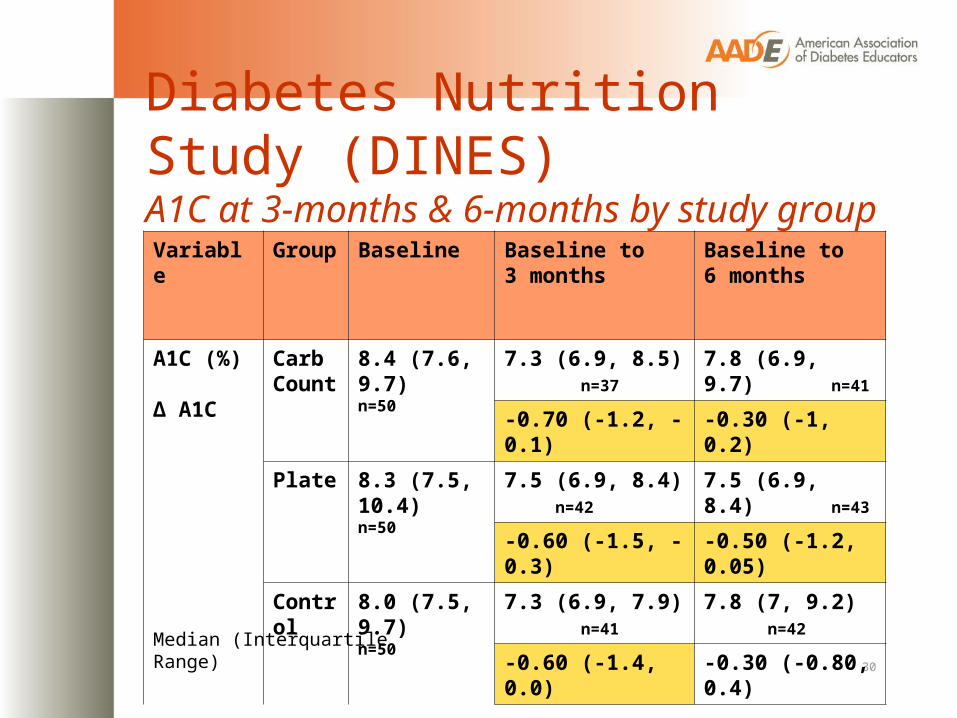
Diabetes Nutrition Study (DINES)A1C at 3-months & 6-months by study group
Variable Group Baseline Baseline to 3 months
Baseline to 6 months
A1C (%)
∆ A1C
CarbCount
8.4 (7.6, 9.7)n=50
7.3 (6.9, 8.5) n=37 7.8 (6.9, 9.7) n=41
-0.70 (-1.2, -0.1) -0.30 (-1, 0.2)
Plate 8.3 (7.5, 10.4)n=50
7.5 (6.9, 8.4) n=42 7.5 (6.9, 8.4) n=43
-0.60 (-1.5, -0.3) -0.50 (-1.2, 0.05)
Control 8.0 (7.5, 9.7)n=50
7.3 (6.9, 7.9) n=41 7.8 (7, 9.2) n=42
-0.60 (-1.4, 0.0) -0.30 (-0.80, 0.4)
Median (Interquartile Range)

31
Diabetes Nutrition Study (DINES)A1C at 3-months & 6-months by study group
7
7.2
7.4
7.6
7.8
8
8.2
8.4
8.6
Baseline 3-Month 6-Month
A1C
(%) Carb
Plate
Control
32
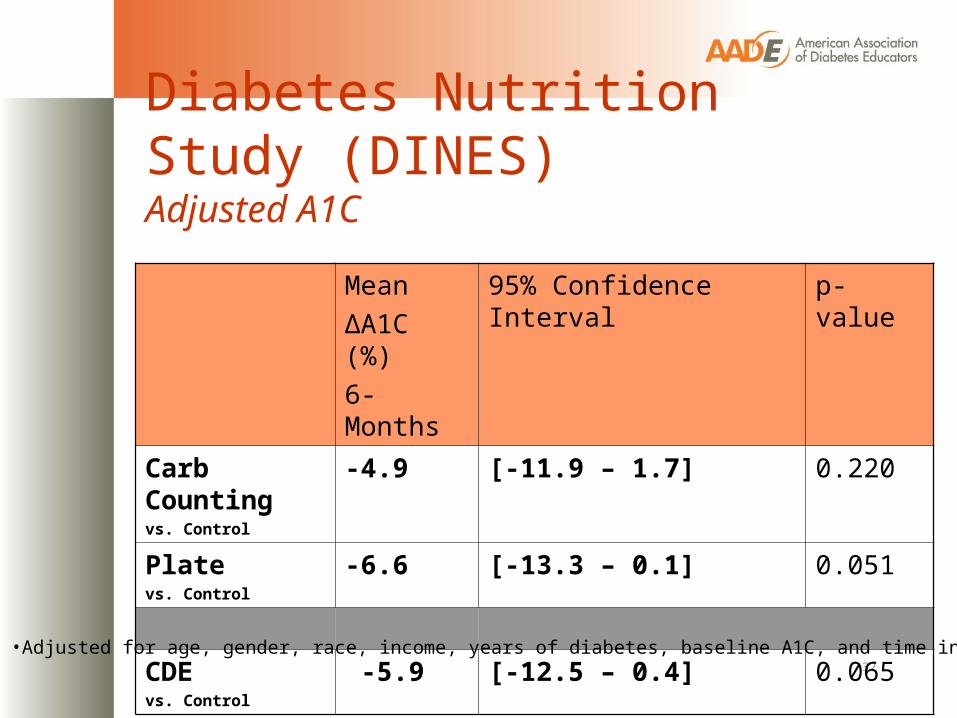
Diabetes Nutrition Study (DINES)Adjusted A1C
MeanΔA1C (%)6-Months
95% Confidence Interval p-value
Carb Countingvs. Control
-4.9 [-11.9 – 1.7] 0.220
Platevs. Control
-6.6 [-13.3 – 0.1] 0.051
CDEvs. Control
-5.9 [-12.5 – 0.4] 0.065
•Adjusted for age, gender, race, income, years of diabetes, baseline A1C, and time interval
33
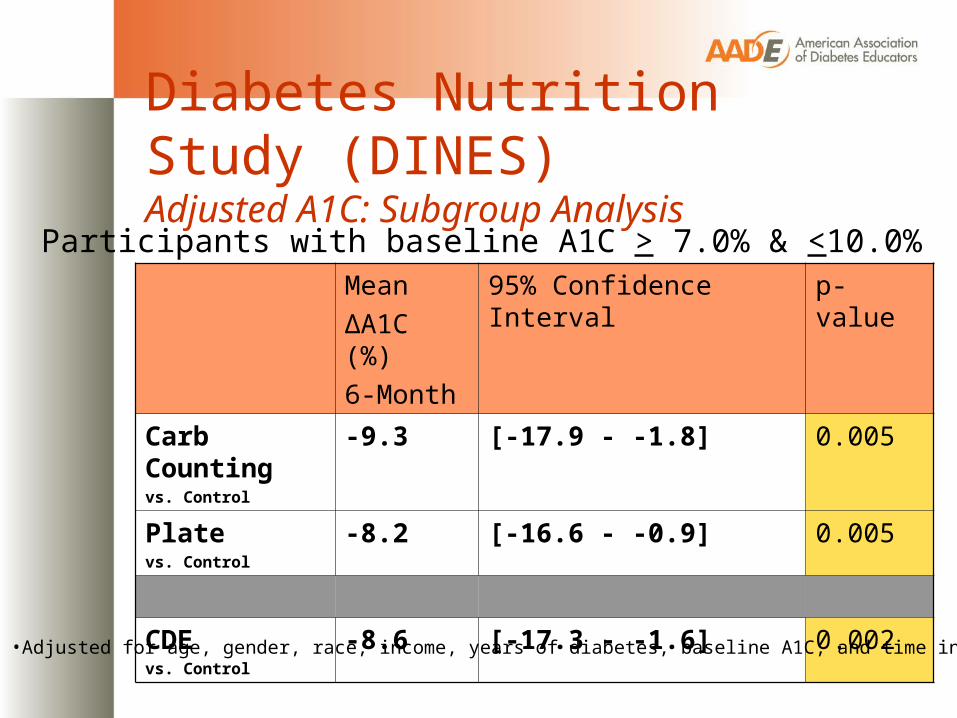
Diabetes Nutrition Study (DINES)Adjusted A1C: Subgroup Analysis
MeanΔA1C (%)6-Month
95% Confidence Interval p-value
Carb Countingvs. Control
-9.3 [-17.9 - -1.8] 0.005
Platevs. Control
-8.2 [-16.6 - -0.9] 0.005
CDEvs. Control
-8.6 [-17.3 - -1.6] 0.002
Participants with baseline A1C > 7.0% & <10.0%
•Adjusted for age, gender, race, income, years of diabetes, baseline A1C, and time interval

34
Diabetes Nutrition Study (DINES)Secondary outcomes at 3- & 6-months Variable Treatment
ArmBaseline Baseline to
3 monthsBaseline to 6 months
Weight, lbs Carb 218 (189, 253) -1 (-5.3, 0.3) -1.8 (-6.5, 1)
Plate 224 (189, 259) -1 (-3.5, 0) -1.0 (-10, 5)
Control 216 (180, 243) 0 (-2, 2.6) 0 (-4, 5.8)
Treatment Satisfaction (range 6-36)
Carb 24 (17, 30) 3 (0.3, 8.5) 4 (-1, 9)
Plate 22.5 (17, 29) 7 (0.5, 11) 7 (1, 13)
Control 26 (19, 31) 2 (-1, 5) 3 (-2, 9)
Self-Efficacy(range 8-40)
Carb 23.5 (18, 29) 2 (0, 9) 2 (0, 9)
Plate 24 (21, 27) 4 (-1, 10) 5 (-2, 8)
Control 24 (21, 29) 3 (-2, 7) 2.5 (0, 8)
Median (Interquartile Range)•Adjusted for age, gender, race, income, years of diabetes, baseline A1C, and time interval

35
Diabetes Nutrition Study (DINES)Secondary outcomes at 3- & 6-months Variable Treatment
ArmBaseline Baseline to
3 monthsBaseline to 6 months
Weight, lbs CDE 220 (189, 258) -1 (-5, 0) -1.7 (-10, 4.2)
Control 216 (180, 243) 0 (-2, 2.6) 0 (-4, 5.8)
Treatment Satisfaction (range 6-36)
CDE 23 (17, 29) 6 (0, 11) 6 (0, 12)
Control 26 (19, 31) 2 (-1, 5) 3 (-2, 9)
Self-Efficacy(range 8-40)
CDE 24 (20, 28) 3 (-1, 9) 4 (-1, 8.8)
Control 24 (21, 29) 3 (-2, 7) 2.5 (0, 8)
Median (Interquartile Range)
•Adjusted for age, gender, race, income, years of diabetes, baseline A1C, and time interval

36
Diabetes Nutrition Study (DINES)Secondary outcomes change: Subgroup Analysis
Variable Treatment Arm
Baseline Baseline to 3 months
Baseline to 6 months
Weight, lbs CDE 216 (187, 249) -1 (-5, 0) -2 (-10, 2.8)
Control 200 (180, 234) 0 (-2, 4.5) 0 (-4, 3.0)
Treatment Satisfaction (range 6-36)
CDE 23 (17, 29) 5 (-0.5, 11) 7 (0, 12)
Control 26 (19, 31) 0 (-2, 4) 2 (-2, 7)
Self-Efficacy(range 8-40)
CDE 24 (20, 28) 3 (-1, 8) 4 (0, 8)
Control 24 (21, 29) 4 (-2, 8) 2 (0, 8)
Median (Interquartile Range)
Participants with baseline A1C > 7.0% & <10.0%
•Adjusted for age, gender, race, income, years of diabetes, baseline A1C, and time interval
37
Summary• At 3- and 6-months the A1C of intervention and control groups
significantly improved from baseline
• At 6-months there was a trend for greater improvement in A1C for both intervention groups compared to control
• In subgroups analyses for participants with baseline A1C 7-10%, both plate and carb counting resulted in significant improvement in glycemic control
• CDE delivered MNT resulted in greater reduction in weight and improvement in patient satisfaction scores compared to control
38
Limitations• Minimal prevalence of low health literacy subjects limited
ability to evaluate literacy intervention effect on A1C
• Highly motivated group as shown by significant improvement in glycemic control in control arm
• Pts self-initiated changes within meal planning group– Some went from plate to carb gram counting;– Some in carb group didn’t count carbs
• Losses to follow-up/ missing data
• Short duration of follow-up limits examination of persistence of MNT skills in intervention arms
39
Lessons Learned:Applications to clinical practice
• Diabetes MNT must be tailored to the individual:
- no pre-determined meal planning strategy
- no pre-set calorie/carb levels - nutrition intervention needs to be based
on assessment
Lessons Learned
• The tool is only as good as the user
• Carb portioning regardless of method is beneficial
40
41
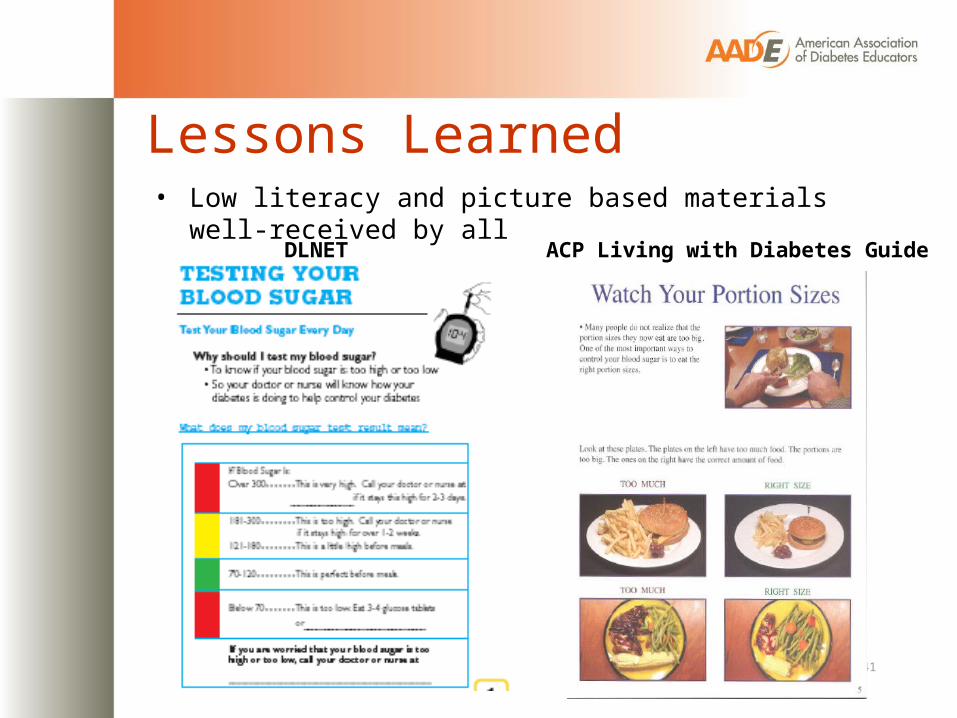
Lessons Learned• Low literacy and picture based materials well-received by all
ACP Living with Diabetes GuideDLNET
42
Conclusions• CDE delivered MNT is an important
component of comprehensive diabetes care and all methods improve glycemic control
• Tailored education may benefit patients, but larger studies are needed
AcknowledgementsVanderbilt Program on Effective
Health Communication
• Russell Rothman, MD, MPP• Kerri Cavanaugh MD MPH• Dianne Davis RD CDE• Becky Gregory RD CDE• Kathleen Wolff, • Ken Wallston PhD• Duff Green BA MDiv• Tom Elasy MD MPH• Robert Dittus MD MPH• Ayumi Shintani PhD• Svetlana Eden, MS• Matt Kennon• Shari Barto
• Funding– American
Association of Diabetes Educators
– NIH/NIDDK• K23DK080952
(Cavanaugh)• K23DK065294
(Rothman)• 5P60DK020593
(VUMC DRTC)

• Extra slides

45
Health literacy is associated with outcomes
• Design: RCT• Setting: Primary Care• Intervention ► Diabetes Education ► Evidence-based medication
algorithms► Database to track and manage
patient outcomes► Diabetes Care Coordinator► Addressed health literacy
– Individualized verbal education – Materials– Clear communication– “Teach back” techniques
Diabetes intervention study
46
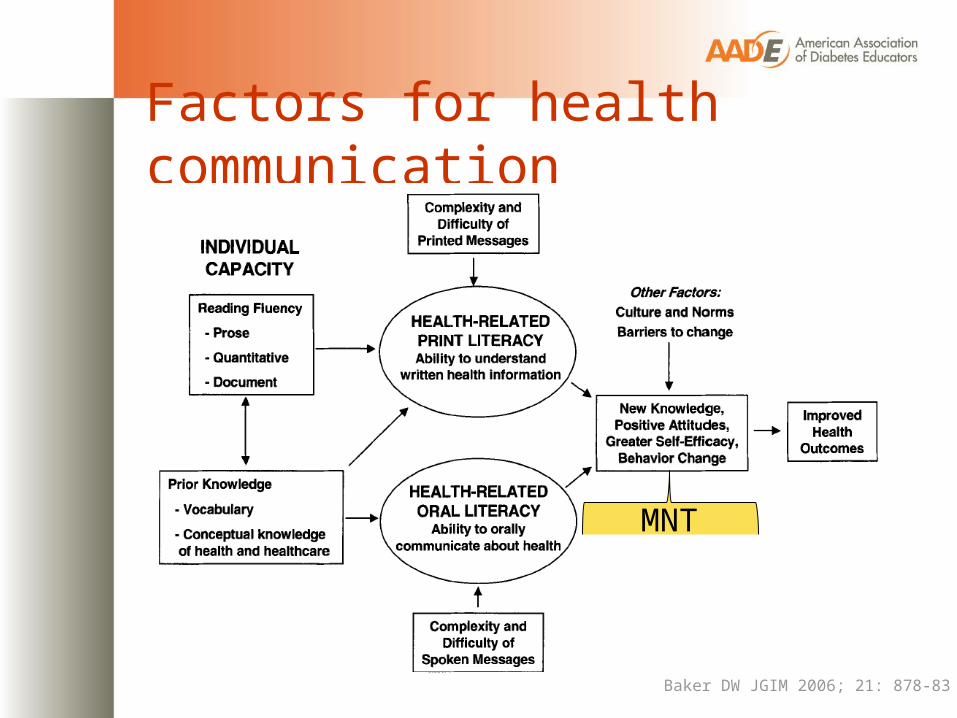
Factors for health communication
Baker DW JGIM 2006; 21: 878-83
MNT
47
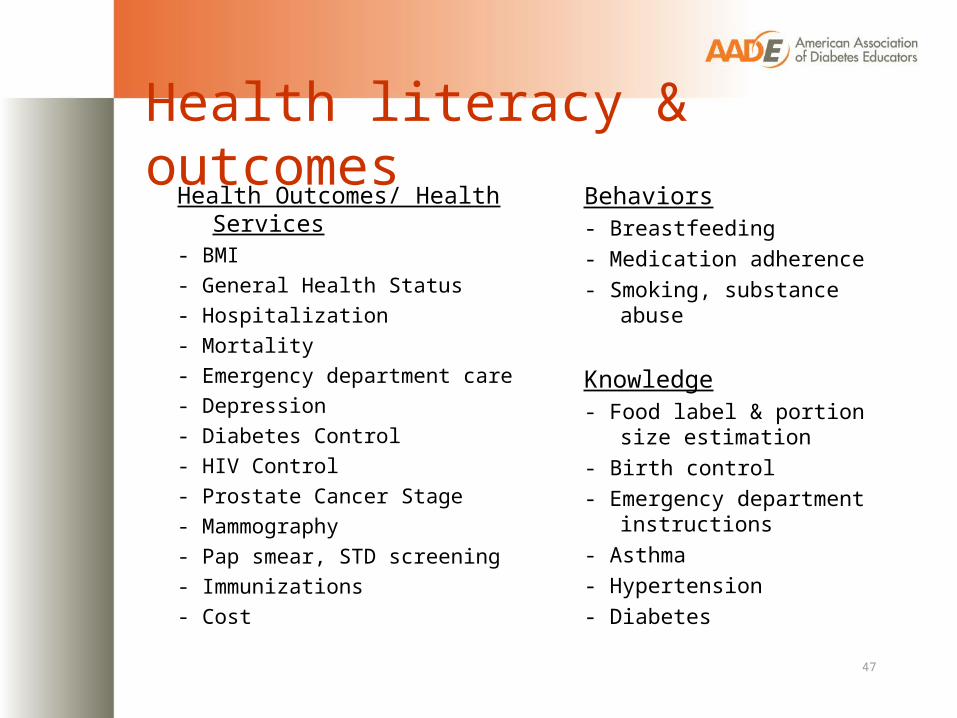
Health literacy & outcomesHealth Outcomes/ Health Services- BMI- General Health Status- Hospitalization- Mortality- Emergency department care- Depression- Diabetes Control- HIV Control- Prostate Cancer Stage- Mammography- Pap smear, STD screening- Immunizations- Cost
Behaviors- Breastfeeding- Medication adherence- Smoking, substance abuse
Knowledge- Food label & portion size estimation- Birth control - Emergency department instructions- Asthma- Hypertension- Diabetes

48
DNT Example Items Your target blood sugar is
between 60 and 120. Circle the values below that are in the
target range (circle all that apply): 55 145 118
Correct Response: Circle 118 only Percent Correct: 74%
Correct Response: 63 gCorrect: 44%
If you ate the entire bag of chips, how many total grams of carbohydrate would you eat?Nutrition FactsServing Size 1oz. (28g/About 10 chips)Servings Per Container 3.5
Amount Per Serving
Calories 140 Calories from Fat 60
% Daily Value*
Total Fat 6g 10%
Saturated Fat 0.5g 4%
Cholesterol 0mg 0%
Sodium 150 mg 7%
Total Carbohydrate 18g 6%
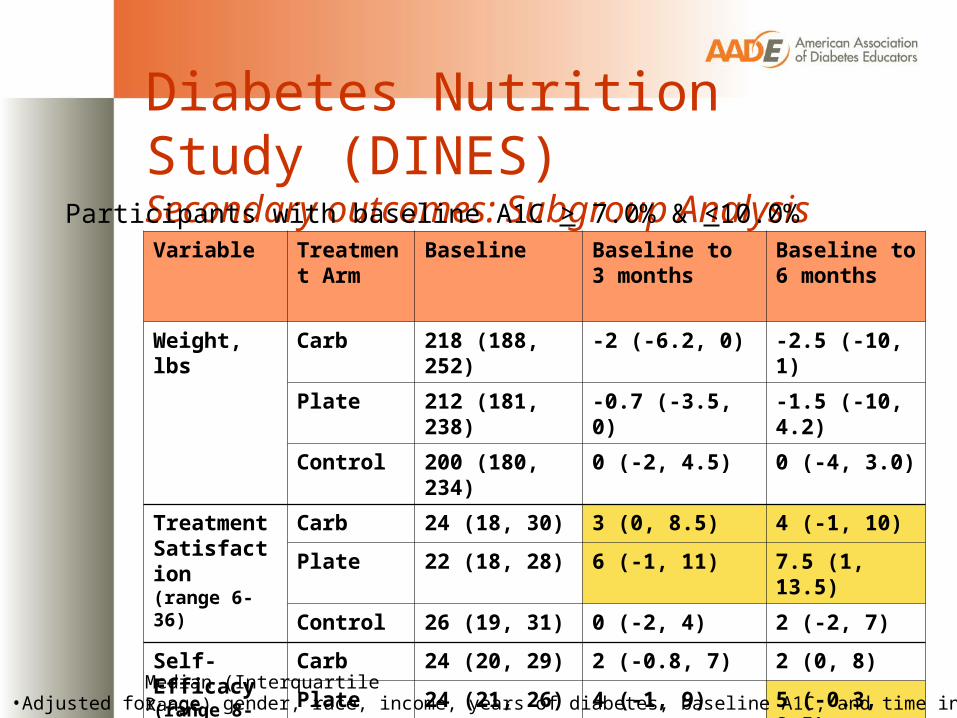
Diabetes Nutrition Study (DINES)Secondary outcomes: Subgroup Analysis
Variable Treatment Arm
Baseline Baseline to 3 months
Baseline to 6 months
Weight, lbs Carb 218 (188, 252) -2 (-6.2, 0) -2.5 (-10, 1)
Plate 212 (181, 238) -0.7 (-3.5, 0) -1.5 (-10, 4.2)
Control 200 (180, 234) 0 (-2, 4.5) 0 (-4, 3.0)
Treatment Satisfaction (range 6-36)
Carb 24 (18, 30) 3 (0, 8.5) 4 (-1, 10)
Plate 22 (18, 28) 6 (-1, 11) 7.5 (1, 13.5)
Control 26 (19, 31) 0 (-2, 4) 2 (-2, 7)
Self-Efficacy(range 8-40)
Carb 24 (20, 29) 2 (-0.8, 7) 2 (0, 8)
Plate 24 (21, 26) 4 (-1, 9) 5 (-0.3, 8.5)
Control 23 (20, 29) 4 (-2, 8) 2 (0, 8)Median (Interquartile Range)
Participants with baseline A1C > 7.0% & <10.0%
•Adjusted for age, gender, race, income, years of diabetes, baseline A1C, and time interval