addressingequity!in!sustainability!assessment:!...
TRANSCRIPT

Doctoral School in Environmental Engineering
Addressing equity in sustainability assessment:
A theoretical framework with applications
in the Oil & Gas sector
Lydia Lamorgese
2014


Doctoral School in Environmental Engineering
Addressing equity in sustainability assessment:
A theoretical framework with applications
in the Oil & Gas sector
Lydia Lamorgese
2014

ii
Doctoral thesis in Environmental Engineering, XXVI cycle
Department of Civil, Environmental and Mechanical Engineering, University of Trento
Academic year 2012/2013
Supervisor: Dr. Davide Geneletti, University of Trento
Cover photo: Oil rig in Val d’Agri, Basilicata.
(Photograph by Angelo Antolino, National Geographic Italia, October 2010. Available at: http://www.nationalgeographic.it /italia/2010/10/27/foto/fotogalleria_texas_basilicata-‐129236/1/).
University of Trento
Trento, Italy
2014
This doctoral thesis is licensed under a Creative Commons Attribution-‐NonCommercial-‐ShareAlike 4.0
International License.

iii
“Al pellegrino che s’affaccia ai suoi valichi, a chi scende per la stretta degli Alburni o fa il cammino delle pecore lungo le coste della Serra, al nibbio che rompe il filo dell’orizzonte con un rettile negli artigli, all’emigrante, al soldato, a chi torna dai santuari o dall’esilio, a chi dorme negli ovili, al pastore, al mezzadro, al mercante la Lucania apre le sue lande, le sue valli dove i fiumi scorrono lenti come fiumi di polvere.”
(Leonardo Sinisgalli, Nuovi Campi Elisi, 1947)


v
Acknowledgements
I would like to gratefully acknowledge my supervisor Dr. Davide Geneletti for his guidance and support in undertaking this research, and being a role model of brightness and assertiveness. His suggestions and methodological insights have helped me explore the ideas in this thesis in more detail and express them with greater clarity. Thank you, Davide, for pushing me to try to be interesting and not trivial, and helping me to strengthen my critical thinking. It goes beyond a purely academic teaching. I am deeply grateful to Prof. Bob Gibson for providing me with great encouragement and very useful comments during the earlier stage of this research. I would also like to acknowledge Prof. Maria Partidário for inspiring discussions on SEA and decision making during my three-‐month research period at the Technical University of Lisbon. I am grateful for the chance to be hosted in her Strategic Approaches to Environment and Sustainability (SENSU) research group. I would like to express my particular gratitude to Prof. Angus Morrison-‐Saunders and Dr. Jenny Pope for providing me with extremely helpful comments and constructive suggestions on sustainability assessment. A special thank you to them for their friendship. I also like to thank all my colleagues within DICAM, particularly those involved in my group of research for ideas shared; Elena for helpful input on ecological economics; and all my friends in the Environmental Engineering and the SMART doctoral schools. A special thank you to my “408 roommate” friends, JP, Marco, Simone, Sepideh, Umesh, Tesfaye, and to Cri and Karina for all the time spent together. To my family for always backing me up.

vii
Contents
1. Introduction 1
1.1 Objectives of the study 2
1.2 Research context 2
1.2.1 Equity and Sustainability 2
1.2.2 Sustainability assessment and strategic actions 5
1.2.3 Sustainability challenges in the Oil & Gas sector 8
1.3 Research approach and outline of the thesis 9
2. Sustainability principles for strategic decisions 17
2.1 Introduction 17
2.2 Construction of the review framework 18
2.3 Application to SEA of spatial planning 24
2.4 Results 27
2.5 Discussion 29
2.5.1 Consideration of the different principles 32
2.6 Conclusions 36
Part I – Theoretical framework
3. Proposing criteria to assess inter-‐ and intra-‐generational equity in strategic decisions 39
3.1 Introduction 39
3.2 Reviewing equity perspectives in sustainability 41
3.3 Selecting equity perspectives 46
3.4 Describing intra-‐ and inter-‐generational equity in the four perspectives 51
3.5 Defining a set of intra-‐ and inter-‐generational equity criteria 54
3.6 Discussion and conclusion 58
4. Reviewing sustainability assessments of Oil & Gas developments 65
4.1 Introduction 65
4.2 Sustainability Assessment for the Oil & Gas sector 66
4.3 A framework for reviewing SEA practice 69
4.4 Review of practice 73
4.5 Results and discussion 74
4.6 Conclusion 83
5. Critical decision factors for Oil & Gas developments 85
5.1 Introduction 85
5.2 The critical decision factors (CDFs) approach 86
5.3 Identification of critical decision factors 87
5.4 Testing practice against CDFs 91
5.5 Recommendations to improve practice 98
5.6 Conclusion 100

viii
Part II – Case study review and applications in the Oil & Gas sector
6. “Val d’Agri Oil fields”: developing future scenarios 103
6.1 Oil & Gas Development in Basilicata 103
6.2 Developing plausible future scenarios 112
6.2.1 Identification and analysis of key elements 114
6.2.2 Identification of spatial and temporal boundaries 116
6.2.3 Scenario generation 117
6.3 Discussion and conclusion 121
7. “Val d’Agri Oil fields”: Testing the equity criteria set 123
7.1 Selecting context-‐specific equity criteria 123
7.2 From equity criteria to indicators 126
7.3 Assessing scenarios using the proposed criteria and indicators 128
7.4 Comparing scenarios 136
7.5 Discussion and conclusion 142
8. Conclusions 147
8.1 Summary of main findings 147
8.2 Strengths and weaknesses of the theoretical framework 150
8.3 Strengths and weaknesses of the case study application 152
8.4 Recommendations for future research 153
References 157
Appendix 171

ix
List of Figures
Fig. 1.1 – Flowchart of the thesis 13
Fig. 2.1 – Overall rate of questions addressed by the ERs, broken down by the seven sustainability principles. 28
Fig. 2.2 – Cross-‐cutting findings of the review of the ERs. 28
Fig. 3.1 – A selection of compatible equity perspectives to be addressed for operationalizing intra-‐ and inter-‐generational equity 51
Fig. 4.1 – Map of country case studies. 73
Fig. 4.2 – Performance under the assessments parameters broken down by SEA reports. 75
Fig. 4.3 – Performance of the SEAs under the proposed categories that illustrate substantive questions. 78
Fig. 4.4 – Performance of the SEAs under the proposed categories that illustrate procedural questions. 78
Fig. 5.1 – Case-‐study contribution to CDFs. 92
Fig. 6.1 – Study area. 104
Fig. 6.2 – Map of Protected Areas: Parks and Natural Reserves (source: Regione Basilicata, Rete Natura 2000 website). 105
Fig. 6.3 – Map of Protected Areas: Sites of Community Importance (source: Regione Basilicata, Rete Natura 2000 website). 105
Fig. 6.4 – Map of environmental sensitivity areas to desertification (source: Regione Basilicata, 2004). 106
Fig. 6.5 – Map of the District area. 109
Fig. 6.6 – Map of the Upper Val d’Agri area. 111
Fig. 6.7 – Key variables for scenario narrative generation (adapted and modified from Rotmans et al. 2000). 117
Fig. 6.8 – Scenario axes for constructing possible future storylines. 118
Fig. 7.1 – Scenario aggregated equity scores at Site scale. 137
Fig. 7.2 – Scenario aggregated equity scores at District scale. 138
Fig. 7.3 – Scenarios aggregated equity scores at Region scale. 138
Fig. 7.4 – Scenario performances over time at Site scale. 139
Fig. 7.5 – Scenario performances over time at District scale. 139
Fig. 7.6 – Scenario performances over time at Region scale. 140
Fig. 7.7 – Equity perspectives comparison at short term scenarios. 141
Fig. 7.8 – Equity perspectives comparison at medium-‐long term scenarios. 141


xi
List of Tables
Tab. 2.1 – Criteria and questions proposed for Principle 1 (precaution and adaptation). 19 Tab. 2.2 – Criteria and questions proposed for Principle 2 (inter-‐generational Equity). 20 Tab. 2.3 – Criteria and questions proposed for Principle 3 (ecological integrity and biological
diversity). 21 Tab. 2.4 – Criteria and questions proposed for Principle 4 (equity and quality of life). 22 Tab. 2.5 – Criteria and questions proposed for Principle 5 (Efficiency). 23 Tab. 2.6 – Criteria and questions proposed for Principle 6 (democracy and governance). 23 Tab. 2.7 – Criteria and questions proposed for Principle 7: immediate and long-‐term integration. 24 Tab. 2.8 – Overview of the selected environmental reports. 25 Tab. 2.9 – Example of the approach adopted to review the environmental reports. 26 Tab. 2.10 – Summary of the questions addressed by the 15 environmental reports. 31 Tab. 2.11 – Rate of questions addressed, broken down by sustainability principles and
environmental reports. 35 Tab. 3.1 – A conceptual framework for identifying equity perspectives vis-‐à-‐vis sustainability:
Economic Approaches 42 Tab. 3.2 – A conceptual framework for analysing equity vis-‐à-‐vis sustainability: Environmental
Approaches. 43 Tab. 3.3 – A conceptual framework for analysing equity vis-‐à-‐vis sustainability: Social Approaches.
44 Tab. 3.4 – A conceptual framework for analysing equity vis-‐à-‐vis sustainability: Integrated
Approaches. 46 Tab. 3.5 – Equity perspective selected. 51 Tab. 3.6 – Opportunity Key Points. 55 Tab. 3.7 – Distributional fairness key points. 56 Tab. 3.8 – Distributional fairness across generations’ key points. 57 Tab. 3.9 – Justice for an imperfect world key points. 58 Tab. 4.1 – Framework for reviewing SEA practice (adapted and integrated from Partidário et al.,
2009). 71 Tab. 4.2 – Selected SEA reports. 74 Tab. 4.3 – Summary of results. 76 Tab. 5.1 – CDFs and the associated potential contribution of SEA. 90 Tab. 5.2 – Number of elements potentially contributing to sustainability-‐based SEA, broken down
by CDFs and case studies. 92 Tab. 6.1 – Overview of key socio-‐economic characteristics. 107 Tab. 6.2 – Main characteristics of the two existing and potential Oil & Gas development. 112 Tab. 6.3 – A SWOT Analysis for Basilicata’s regional development (adapted from Regione
Basilicata, 2007; Boschma et al., 2013). 115 Tab. 6.4 – Scenario assumptions. 119 Tab. 6.5 – Scenario storylines. 120 Tab. 7.1 – Equity criteria identified for the case study. 125 Tab. 7.2 – Equity indicators for the case study. 127 Tab. 7.3 – Indicators metrics and source of baseline data. 130 Tab. 7.4 – Decision matrix: Scenario A scores for short and medium-‐long term. 133 Tab. 7.5 – Decision matrix: Scenario B scores for short and medium-‐long term. 134 Tab. 7.6 – Decision matrix: Scenario D scores for short and medium-‐long term. 135 Tab. 7.7 – Scenario C scores for short and medium-‐long term. 136


xiii
Abstract
This thesis explores the concept of equity and proposes methods to make it operational in
decision-‐making focused on promoting sustainability. The conceptual approach developed in
the research draws on the recognition that the two notions of equity and sustainability are
tightly intertwined in the sustainable development debate. As George (1999) claimed,
sustainable development is founded on and fully embodied by intra-‐generational and inter-‐
generational equity, which might be described as transactions of rights between and across
generations, respectively. In spite of this, the implications on equity are still poorly addressed
in strategic decisions.
This led to the identification of the three main objectives of this research.
The first objective is to understand the extent to which sustainability issues are addressed in
current practice, focusing on Strategic Environmental Assessment (SEA) experiences of spatial
planning and Oil & Gas development. To this purpose, a framework is developed to analyse
the degree of consideration of sustainability principles in SEA, and demonstrate its application
to a sample of SEA of Italian urban plans. This framework links Gibson's (2006) sustainability
principles to a number of guidance criteria and eventually to review questions, giving
particular emphasis to the key concepts of intra-‐ and inter-‐generational equity. The
framework was applied to review the Environmental Report of a sample of urban plans of
major Italian cities. The results of this review shows that, even if sustainability is commonly
considered as a pivotal concept, there is still work to be done in order to effectively integrate
sustainability principles into SEA. Regarding the proposed framework, the review confirms the
significance of clarifying equity concerns in the light of sustainability in view of
operationalizing intra-‐ and inter-‐generational equity in decision-‐making.
The second objective is to identify criteria and indicators to measure intra-‐ and inter-‐
generational equity, against which present state and future trends can be assessed. A
conceptual framework for identifying the different implications related to the use of different
values and perceptions on equity is built. Subsequently, a set of equity perspectives to guide
the assessment of strategic actions through the lens of intra-‐ and inter-‐generational equity is

xiv
proposed and discussed. This set includes four equity perspectives, compatible with each
other with covered significant sustainability issues, and minimizing conflict, namely
opportunity, distributional fairness, distributional fairness across generations and justice for an
imperfect world.
The review of equity perspectives allows identifying a set of equity criteria that might be
useful in focusing assessment on crucial and integrative sustainability issues. These criteria are
reasonably inclusive of essential general intra-‐ and inter-‐generational equity considerations
that account for sustainability over space and time.
However, criteria need to be specific to the context of analysis. This is addressed in this study
by selecting a specific sector of investigation that offered significant insights for dealing with
sustainability in decision-‐making. The attention was directed to the Oil & Gas sector for the
scope of challenges and positive chances posed to sustainability. For this purpose, the
research work specifically fleshes out how current SEA of Oil & Gas sector practice addresses
sustainability.
A framework for reviewing SEA practice helped to explore to what extent current SEA for the
Oil & Gas sector contributes, procedurally and substantively, to sustainability oriented
decisions. 11 case studies related to both off-‐shore and on-‐shore Oil & Gas developments are
reviewed against this framework. The results show that case studies were more oriented to
analyse opportunities derived from Oil & Gas development without fleshing out other
potential developmental alternatives. Additionally, even if the SEA reports claim to pursuit a
common strategic intent to equally share benefit derived from Oil & Gas development, they
do not generally provide a means to tackle this aspect. This part of the investigation allowed
also to support the identification and selection of aspects, elements, suggestions and best
practise that would assist in defining contest-‐specific equity criteria and indicators for
decision-‐making in the Oil & Gas sector.
This leads to the third objective of the thesis: testing the applicability of the proposed
methods to a case study, dealing with complex decisions at strategic level. A case study on Oil
& Gas development in the Basilicata region (Southern Italy) was selected: the Val d’Agri oil
field, Western Europe’s biggest onshore oil field. Scenario storylines, representing interactions
among environmental, social and economic concerns, are constructed and applied against the
framework. Specifically, short-‐term and medium-‐long term scenarios are developed by

xv
varying geographical scopes, ranging from the regional scale to two nested local areas
surrounding the Oil & Gas activities.
Scenarios are then assessed against the set of intra-‐ and inter-‐generational criteria identified
by selecting appropriate indicators adapted to context and available data. Indicators are
valued according to a quali-‐quantitative analysis that assisted in examining and comparing
trade-‐off between human and environmental systems under the different scenarios. The
results helped to identify opportunity and risk of different scenarios at strategic level. None of
the scenarios provided “the best solution” in term of aggregated equity scores or perfect win-‐
win solutions for each equity perspective. In the long-‐term, none of the territorial levels (local
and regional) seemed to acquire significant increase in equity benefits, not even one at
expenses of each other. According to the assumptions, this might suggest that incremental
benefits of Oil & Gas development are concentrated outside the three level considered.
Nevertheless, the case study shows that approaching to decision with more attention to a
sustainable management of the environment and involving institutions at different levels
might be a key role in achieving more wide-‐spread and long-‐term positive results.
However, scenarios presented possible significant trends in equity criteria, which were
affected by restraints in data collected, as well as, simplifications and approximations in
analysis. In this exercise, it was assumed that all equity criteria within each temporal
dimension receive equal weights and that all three geographical levels were equally weighted
too. Introducing participatory mechanisms might be useful for supporting interpretations of
implications potentially affecting generations at different temporal and territorial scale,
satisfying possible needs of other equity criteria, and establishing priorities in perspectives on
equity adopted. In this sense, the equity framework proposed might be a suitable tool for
supporting and guiding deliberative processes. Analogously, the spatio-‐temporal decision
matrix, framed through the lens of equity for assessing scenarios against equity criteria, might
represent a simple yet flexible framework for analysing and discussing concurrently temporal
and spatial implications of plausible storylines.


Chapter 1
1. Introduction
A sustainable and desirable future is one that respects biophysical boundaries, distributes
resources and responsibilities fairly, and adequately values and balances built, human, social
and natural capital assets (Costanza, 2012). The two notions of equity and sustainability are
tightly intertwined in the sustainable development debate. Sustainable development could be
fully conceptualized by the notion of inter-‐generational and intra-‐generational equity (George,
1999). Inter-‐generational equity refers to a transaction of rights across generations, while
intra-‐generational equity refers to a transaction of rights between people of the same
generation.
Thus, the links between sustainability and equity are multi-‐dimensional and mutually
reinforcing, demanding for in depth examination of dynamics between human systems and
environmental systems under conditions of uncertainty. These interactions are complex and
multi-‐scale, and involve multiple feedbacks and trade-‐offs that affect both conditions of the
environment and its capacity to provide services that contribute to human wellbeing (Clark,
2010).
Correlated complications concern how to evaluate equity in distribution of effects of decisions
on present as well as future generations. This requires us to explain better which uses of the
natural environment can generate sufficiently large, wide-‐spread and long term benefits to
human well-‐being (Partidário et al. 2010; Clark, 2010; Kauffman, 2009). But it is not easy to
put this combined challenge into practice, since there are numerous and complex
relationships involving society, the economy and the environment, involving direct and
indirect dependencies, a variety of different interests and beliefs, and various sometimes
diverse goals (Munier, 2005). Thus, despite the stated importance of equity, there is still a lack
of formal theory for addressing it in planning literature and decision-‐making processes (Fisher,
2007; Halpern et al., 2013).

CHAPTER 1
2
1.1 Objectives of the study
This research aims to provide a means of integrating the concept of intra-‐ and inter-‐
generational equity, focusing on strategic decisions related to the environment, through
Strategic environmental assessment (SEA) and sustainability assessment. More specifically,
the objectives of this study are:
• to understand the extent to which sustainability issues are addressed in current practice,
focusing on SEA experiences of spatial planning and Oil & Gas development;
• to identify criteria and indicators to measure intra-‐ and inter-‐generational equity, against
which present state and future trends could be assessed;
• to test the applicability of the proposed methods to a case study, dealing with complex
decisions at strategic level. The selected case study deals with Oil & Gas development in
ecologically sensitive and biodiversity rich areas.
1.2 Research context
In this section, it is provided a brief outline of the research topics to orientate the reader to
better follow the discussion pursued in this thesis. Three points are briefly discussed. The first
is over the nexus between sustainability and equity. The second concerns the linkages
between strategic actions and sustainability assessment. The last gives a short overview of a
specific context for dealing with strategic decision-‐making.
1.2.1 Equity and Sustainability
The two notions of equity and sustainability are tightly intertwined in the sustainable
development debate. Sustainability itself means justice to future generations. In fact, equity is
intrinsic and central to the original concept of sustainable development -‐ development that
meets the needs of current generations without compromising the ability of future generations
to meet their needs (WCED, 1987). George (1999) recognizes that sustainable development is
founded on and fully embodied by two equity principles, namely inter-‐generational and intra-‐
generational equity.

INTRODUCTION
3
Inter-‐generational equity refers to the need for a fair distribution of gains and losses across
generations, while intra-‐generational equity refers to equity between people of the same
generation. In fact, as George (1999) points out, the first principle resembles the above
mentioned definition of sustainability, while the second is a necessary condition for
development that equitably meet developmental and environmental needs between
generations according to the Rio Declaration (United Nations, 1992). Thus, George (1999)
argues that inter-‐ and intra-‐generational equity principles provide a complete definition of the
sustainable development concept according to the Stockholm Conference on the Human
Environment (UNEP, 1972), where the conflicts between environment and development were
first acknowledged (Kates et al., 2005).
Anand and Sen (2000) claim that it is difficult to conceive a situation where a case is made for
inter-‐generational equity while underplaying intra-‐generational equity. For immediate and
long-‐term integration of sustainable development purposes, Gibson (2006) observes that it is
essential that the two equity principles are developed in ways that are at least compatible and
preferably mutually reinforcing. Also George (1999) worries about a sustainable development
that respect the environment’s carrying capacity limits, without being intra-‐generationally
equitable, simply by restricting the numbers of people who benefit from it. As claimed by
Padilla (2002), the search for sustainable development is closely linked to the solution of
problems of inequity that could endanger sustainability and are against the same concept of
development.
Equity for future generations – Inter-‐generational equity
The principle of inter-‐generational equity embodies a basic belief that the well-‐being of future
generations is as important as the well-‐being of present generation (Roemer and Suzumura,
2007). Morrison-‐Saunders and Pope (2013) noted that: 'Favouring current generations or
short-‐term benefits at the expense of future stakeholders and interests is one type of trade-‐
off that can result during sustainability assessment decision-‐making'. Inter-‐generational
equity, would then be assumed as a transaction of rights between generations, and the
legitimacy of taking only into account the preferences of present generations should be
questioned when considering actions that can seriously affect several generations.

CHAPTER 1
4
For example, as Roemer and Suzumura (2007) point out, it is very clear that global climate
change poses a unique externality problem in which many of those who will be most severely
affected have not yet been born. Importantly, Beder (2000) notes that it is unfair to presume
that technological and research advancements will enable latter generations to solve the
problems left them by former generations. The challenge with inter-‐generational equity
though is that future generations cannot be directly represented in assessment processes.
George (1999) noted that an important distinction must be made between conserving capital
(i.e. for the benefit of future generations) and valuing as the necessary value judgments fall to
the present generation to make. Clearly there is a fundamental tension here.
In order to ensure a fair treatment to future generations, an assessment process should
recognize and protect their right to enjoy at least the same capacity of economic and
ecological resources that present generations enjoy (Padilla, 2002) or as George (1999, p180)
puts it, inter-‐generational equity can be restated as 'the principle of conservation of capital'.
Gibson et al. (2005) go further to argue that inter-‐generational equity should not only refer to
the ability to favour options most likely to preserve, but also to enhance opportunities for
future generations.
Equity within present generations – Intra-‐generational equity
Where inter-‐generational equity is characterised by the maintenance of capital over time, the
principle of intra-‐generational equity is focused on the distribution of, or access to, capital
within present generations such that everyone receives a fair share. To deliver on this will
require attention be given to both process and substantive elements. While a development
that maintains overall capital might be considered to be substantively sustainable (and George
1999 notes that this can be delivered simply by respecting the carrying capacity of the
environment), it would fail the principle of intra-‐generational equity if the distribution of costs
and benefits is skewed to favour and/or disadvantage certain groups or individuals within
society.
This introduces the key role played by considerations of sociological factors identified by
Haughton (1998) such as race, ethnicity, class, culture, and political power in decision-‐making,
whereby minorities and other groups may be systematically disadvantaged. There is also a
spatial element and Haughton (1998) points out that it is important to emphasize that intra-‐

INTRODUCTION
5
generational equity also covers social inequities across communities, regions and nations
within one generation. Gibson et al. (2005) conceive of intra-‐generational equity as the ability
to ensure equity of sufficiency and opportunity for all people of the same generations.
The concept is thus inherently tied up with quality of life. While easily defined, how to deliver
intra-‐generational equity is contested. For example, divergent positions coexist in the
literature on how the various dimensions of equity should be interpreted. It leads to intensely
moral and potentially endless discussions of equity concerns such as needs, rights,
responsibilities, and choice (Gibson, 2006; Haughton, 1998). This research endorses the
approach of combining inter-‐ and intra-‐generational equity principles in order to fully
conceptualize the sustainable development notion.
1.2.2 Sustainability assessment and strategic actions
Strategic actions embrace a huge range of decisions and are generally referred to policies,
plans or programme (PPP). According to the most cited definition of these terms, a policy is
the inspiration and guidance for action, a plan is a set of coordinated and timed objectives for
the implementation of the policy, and a programme set of projects in a particular area (Wood
and Djeddour, 1992). Thus, strategic decisions taken in policies, planning and programming
processes, are defined as frameworks for action. They seek to anticipate new trends,
discontinuities, and surprises, enhancing ways of taking advantage of opportunities (Albrechts,
2004). Examples of strategic action include (Therivel, 2010):
• Policy: legislation, policy statements, economic policies, e.g. a national energy policy;
• Spatial plans and programmes, e.g. national, regional, urban;
• Sectoral plans and programmes, e.g. for agriculture, transport, waste.
• Policies, plans or programmes to achieve environmental or social ends, e.g. poverty
reduction strategies, policies for improving air quality.
Decisions in planning are considered neither rational nor linear, nor are value-‐free and only
technical (Nelson, 2011). In this context, Fisher (2007) also observes two critical aspects.
Firstly, he reaffirms that non-‐material, cultural and ethical tend to be underrepresented due
to utilitarian and economistic views prevailing in planning as claimed more than 20 years
earlier by Ortolano (1984). Secondly, he notices that there are still indications that long-‐term
visions of sustainable development and associate and objectives, with time horizons of

CHAPTER 1
6
between 20 to 30 years, are not consistently followed through PPP making practice. Gibson
(2006) recognises that tensions between economy and environment remain unsolved in
conventional PPP practice, which seek to balance development with the need to protect the
environment. He claims that the genius of the sustainability concept lies in recognizing that
social, economic and biophysical objectives must be treated as interdependent factors.
Sustainability cannot be achieved by balancing economic, social and ecological ends, but
reversing invidious trends in the economic, social and ecological realms together.
However, over the past decade it has been largely recognized that planning for sustainability
requires different methods and a changed paradigm from traditional planning (Rotmans et al.
2000). A more strategic-‐based idea of planning is therefore needed, which is based on new
tools as well as rethinking and combining existent approaches in planning, such as the use of
scenarios, foresight studies, public participation or debates about sustainability (Martens,
2006; Sheate et al., 2008; Pope and Dalal-‐Clayton, 2011; Bond and Morrison-‐Saunders, 2011).
The stress on sustainable development has therefore led to the promotion of sustainability-‐
led frameworks to support strategic planning. Integrated methodologies are considered highly
suitable for this purpose (Martens, 2006; Gibson, 2006; Morrison-‐Saunders and Therivel,
2006; Morrison-‐Saunders et al., 2013). Various observers have express support for a broader
assessment process of this kind that explores the impact of human actions on sustainable
development issues (Jones et al., 2005).
There is therefore a need for approaches that aid to understand in an integrative way the
environmental, economic and societal impacts that strategic decisions can have on
sustainability. Highlighting the range of complexities that need to be taken, many authors
believe that holistic systems principles can effectively guide the methods, process and context
of integrated appraisals. They also recognize that integrated, sustainability-‐led assessments
might facilitate continued or even renewed neglect of traditionally under valued
considerations, especially the protection of ecological systems and functions. This problem
needs to be addressed thoughtfully in judgements about how integration is to be done. More
integrated assessment procedures that can assist in strategic decision-‐making include tools
such as sustainability assessment and strategic environmental assessment.
Sustainability Assessment (SA) is a decision-‐making tool intended to anticipate the
sustainability implications of proposed actions (Pope et al. 2004). SA is considered a strategic

INTRODUCTION
7
form of assessment that not only aims to evaluate the social, environment and economic
implications of actions, but also the interrelations between and among these parameters
(Gibson, 2005). Close to SA but more globally widespread, Strategic Environmental
Assessment (SEA) is often interpreted as having sustainability goals too (Bond and Morrison-‐
Saunders, 2011). SEA is “a systematic decision support process, aiming to ensure that
environmental aspects are considered effectively in PPP making” (Fisher 2007). A typical SEA
would include the description of proposal under consideration (scoping), considerations of
alternatives, including the no action option, evaluations of impact, proposed mitigation and,
enhancement in sustainability-‐based versions, measures, stakeholder involvement and
transparency through consultation and dissemination, communication of decisions, with
explanation and justification, proposals for implementation, monitoring and evaluation
(Therivel, 2010).
Over the past two decades the substantive purpose and values of SEA has gradually evolved
arising a crucial debate related to the possible shift of SEA towards sustainability assessment
(Bina et al., 2011). Several scholars claim that, even if SEA deals primarily with the biophysical
environment, it provides a useful example for understanding the relationships between
strategic tools and decision-‐making, also addressing economic and social parameters (Dalal-‐
Clayton and Sadler, 2005; Sheate, 2008). It is also necessary to notice that some observers
show a sharp contrast with the opportunity of shifting SEA towards sustainability assessment
believing in the centrality of biophysical issues (Sheate et al., 2003; Kidd and Fischer, 2007).
They mainly argue that SEA has to remain focused on environmental considerations
rebalancing the predominance of economic and social issues in decision-‐making. By the
contrary, it is also important to consider that keeping environmental arguments separate
avoids the risk that unsustainable environmental consequences are not detected.
Thus, it has progressively agreed that SEA works as an advocate tool, which is supposed to
reorient strategic planning processes towards achieving more environmentally sound and
sustainable decisions (Fisher, 2007). Moreover, SEA has the potential to become a much
stronger tool for challenging the links between quality of life and economic growth (Partidário,
2010). To this purpose, two priority aspects should be considered. Firstly, it demands for
shedding light on the nature of the socio-‐economic, biophysical and ecological systems, their
response to human interventions, and the possible implications of proposed new activities
(Martens, 2006; Kajikawa, 2008; Ostrom, 2009).
CHAPTER 1
8
Secondly, it is necessary to redefine decision objectives and criteria that focus attention on
the interrelations among the economic, social and environmental dimensions rather than on
the three conventional categories separately.
However, in practice, even if we can consider the three pillars relatively separable, they
interact to produce outcomes, which in turn feedback and affect one another at different
scales in space and time (Ostrom, 2009). In this vision, a strategic action could be sustainable
if it is at least acceptable socially, environmentally and economically and without causing
significant trade-‐offs (Gibson, 2006). Such mechanism includes the concept of “net
conservation benefits’” or “environmental offsets”. Offsets can be considered as a special kind
of trade-‐off, made within a pillar rather than between pillars (Pope and Dalal-‐Clayton, 2010).
This research addresses such approaches, with emphasis on the strategic level of decision-‐
making.
1.2.3 Sustainability challenges in the Oil & Gas sector
The exploitation of Oil & Gas resources poses several challenges to intra-‐ and inter-‐
generational equity. First of all, although it represents a significant business opportunity,
economic gains are often distributed unevenly and unwisely, providing short-‐term gains to
selected beneficiaries, at the expenses of a more sustainable economic growth and
improvement of social conditions (Norwegian Ministry of Environment, 2009). Secondly, the
impacts of Oil & Gas operations are interrelated and largely context-‐dependent, hence
difficult to foresee and be estimated by simply looking at previous experiences (E&P
Forum/UNEP, 1997).
Interrelationships across environmental, economic and societal concerns are complex and
multiscaled: environmental impacts (e.g. loss of biodiversity) may cause socioeconomic
effects on economic activities (e.g. tourism) and on the wellbeing of local communities (e.g.
health issues, resettlements). Moreover, there are issues related to the high costs of cleaning-‐
up (e.g. in the case of accidents), and to the long-‐term consequences of environmental
degradation (e.g. climate change). Even if these reflections apparently can be said for any
resource development sector, what gives rise to particular attention is the magnitude of the
challenges posed by Oil & Gas development.

INTRODUCTION
9
With regard to sustainability and equity discourse, exploring Oil & Gas development should
help in making more evident and glaring obstacles and drawbacks in achieving sustainability.
According to the World Bank (http://www.worldbank.org/en/topic/extractiveindustries, last
accessed, December 2013) about 3.5 billion people live in countries rich in oil, gas or minerals.
Socio-‐economic and environmental concerns are sensibly amplified. To give an immediate
example, impressive and striking disparities are caused by unfair distribution of economic
benefits between oil companies and local people.
However, due to the relevance of the business, Oil & Gas sector represents an important
source for domestic economy that can potentially support the implementation of
development strategies at local and regional level. These strategies could promote balanced
development and attract investment, while at the same time enabling regional and local
actors to participate in the development of region-‐specific solutions to development problems
(Bachtler and Yuill, 2001). With good governance and transparent management, Oil & Gas
sector can have a pivotal and transformational role in reducing poverty and boosting shared
prosperity, while respecting community needs and the environment (The World Bank, 2010).
Thus, Oil & Gas development represents a sector for which is particularly important to identify
widespread and long-‐term sustainability goals and objectives and to ensure that a strategic-‐
based assessment is integrated into decision processes from early stages. This requires that
decisions related to the management of Oil & Gas activities are taken by involving all
stakeholders in assessing this complex network of interrelationships between existing
resources, emerging opportunities and constraints in a long-‐run prospective.
1.3 Research approach and outline of the thesis
I approached the research objectives by structured investigations into two main parts. The
first, presented in chapters 2 and 3, regards the development of a theoretical framework for
dealing with intra-‐ and inter-‐generational equity issues. The second, from chapter to 4 to 7, is
related to the application of the proposed framework to a case study.
I began this research by reflecting on the potential of SEA in addressing sustainability concerns
during policies, plans and programmes, focusing primarily on spatial planning. To this purpose,
CHAPTER 1
10
I explored an extensive literature concerning sustainability issues, theory and assessment, and
following the example of several approaches for operationalizing sustainability principles, I
developed a conceptual framework for linking the Gibson's (2006) sustainability principles to a
number of guidance criteria and eventually to review questions gathered from literature.
The purpose of this was to identify and select key themes, principles and criteria can aid in
interpreting sustainability implications for decision-‐making. Successively, I adopted the
proposed framework for analysing the degree of consideration of sustainability principles in
Strategic environmental assessment (SEA). Chapter 2 presents the proposed framework, and
demonstrates its application to a sample of SEA of Italian urban plans.
In view of formalizing a practical approach for integrating intra-‐ and inter-‐generational equity
criteria in strategic actions, I completed the theoretical investigation by gathering more
understanding on how to deal with the presence in the literature of a variety of positions on
how the various dimensions of equity should be interpreted. Thereafter, I fleshed out the
multifaceted concept of equity. In particular, I examined in more detail the nexus between a
plurality of approaches to sustainability and values and perceptions on equity.
Thus, I framed a conceptual framework for linking the most diffuse interpretations of the
sustainability paradigm to equity perspectives and relating general principles that might be
considered in strategic decisions. Drawing on the conceptual underpinnings of each equity
perspectives, I discussed the possibility to infer a sub-‐set of equity perspectives to guide the
assessment of strategic actions through the lens of intra-‐ and inter-‐generational equity. The
set includes perspectives compatible each other with covers significant sustainability issues,
and minimizing conflict.
I concluded this stage by listing a set of criteria for addressing concurrently intra-‐ and inter-‐
generational according to set of equity perspectives selected. I suggested the list as
reasonably comprehensive of important general intra-‐ and inter-‐generational equity
considerations that account for sustainability over space and time. Chapter 3 presents the
conceptual framework for clarifying the nexus between equity and sustainability, and the
steps undertaken for developing a set of general criteria for addressing intra-‐ and inter-‐
generational equity in strategic decisions.
In the second part of my research, I sought to provide and test an approach that helps in
explicitly assessing equity consequences of decisions over space and time dealing with

INTRODUCTION
11
complex decisions, based on the equity approach of Chapter 3. Firstly, I dealt with the fact
that although generic criteria might be useful for orienting assessment, they need to be
rearranged in relation to the context under examination. In view of testing the applicability of
the proposed methods to a case study, I decided to focus on strategic decisions related to Oil
& Gas development. I selected this sector according essentially to three insights.
Firstly, this is an emblematic example of complex strategic decision-‐making. In fact, it may
generate important development opportunities as well as critical risks for sustainability.
Secondly, there is a growing international awareness about the imperative need to shift
planning and impact assessment processes related to Oil & Gas activity towards more
strategic and sustainability-‐based model. Finally, the possibility to apply the equity approach
developed in this research to a case study in Italy, which is related to an area, considered the
most promising for on-‐shore oil exploitations in Western Europe.
Thus, I undertook an analysis and comparison of SEA processes applied to Oil & Gas activities
in order to gather a wider understanding of the extent to which sustainability issues are
addressed in current practice, focusing specifically to the context of Oil & Gas sector.
Firstly, I explored to what extent current SEA practice for the Oil & Gas sector contributes,
procedurally and substantively, to more strategic and sustainability-‐oriented decisions
(Chapter 4). To this purpose, I adopted a framework for reviewing SEA practise, based on the
strategic model for SEA developed by Partidário et al. (2009), and I applied it to 11 case
studies related to both off-‐shore and on-‐shore Oil & Gas developments. Secondly, I tested
against these case studies a more integrative approach based on Critical Decision Factors
(CDFs), presented and discussed in Chapter 5. CDFs are key integrated factors that act as the
windows of observation to focus attention on those environmental and sustainability issues
that should matter for decision Partidário (2012). The purpose of these investigations was also
to support the identification and selection of factors, elements, suggestions and best practise
that would assist in better explicating contest-‐specific equity criteria and indicators for
decision-‐making in the Oil & Gas sector.
Finally, I applied the proposed equity approach to a case study, namely “Val d’Agri Oil fields”
in Basilicata (Southern Italy). The Basilicata region, an area relevant in terms of environmental
value and landscape attractiveness, presents the largest onshore reserves on Western Europe
considered to be Europe's most promising onshore development area. The purpose of this
case study was twofold: to test the equity approach proposed; and to shed light on how

CHAPTER 1
12
different development decisions can affect intra-‐ and inter-‐generational equity issues.
Thus, drawing from the examination I conducted on SEA of Oil & Gas development and desk
research for the case-‐study characteristics, I identified and specified equity criteria indicators
to respect the context involved in the analysis. I therefore adopted scenario analysis approach
for constructing plausible future scenario storylines, representing composite example of
interactions among environmental, social and economic concerns.
Then, I examined the hypothesised scenarios against the set of equity criteria identified by
selecting appropriate indicators adapted to data disposability. I adopted a quali-‐quantitative
analysis for valuing indicators. The purpose of this was to use a suitable way to examinee and
compare trade-‐off between human and environmental systems under the different scenarios.
Chapters 6 and 7 are over the case study application, namely Val d’Agri Oil fields. The first
describes the case study related to Oil & Gas sector and the construction of possible future
storylines for the study area. The second is devoted to testing the theoretical approach
proposed. This presents an empirical approach for assessing plausible scenarios against the
proposed equity framework and evaluating trade-‐offs across present and future generations.
In the last section (Chapter 8), the most important results of the research are summarized,
and the final conclusions are drawn. Possible directions for future investigations are therefore
proposed. Figure 1.1 displays the flowchart of the thesis.

INTRODUCTION
13
Fig. 1.1 – Flowchart of the thesis
Introduction (Chapter 1)
Part I Theoretical Framework (Chapters 2 and 3)
SUSTAINABILITY ASSESSEMENT AND
STRATEGIC DECISIONS
UNDERSTANDING HOW STRATEGIC ENVIRONMENTAL ASSESSMENT PRACTICE ADDRESSES SUSTAINABILITY PRINCIPLES
COSTRUCTION OF A REVIEW
FRAMEWORK
CLARIFYING EQUITY CONCERNS IN THE LIGHT
OF SUSTAINABILITY
REVIEWING AND SELECTING
EQUITY PERSPECTVES
DESCRIBING INTER- AND INTRA- GENERATIONAL EQUITY IN SELECTED
PERSPECTIVES
REVIEW OF SEA REPORTS IN URBAN
PLANNING
PROPOSING A SET OF INTRA- AND INTER-
GENERATIONAL EQUITY CRITERIA
TESTING THE EQUITY CRITERIA SET TO THE VAL
D’AGRI OIL FIELDS REVIEWING OF SEA OF
OIL & GAS PRACTICE
IDENTIFY CONTEXT-SPECIFIC CRITERIA AND INDICATORS
STUDY AREA
COMPARING EQUITY INDICATORS AGAINST SCENARIOS
DRAWING CONCLUSIONS AND SUGGESTIONS
EQUITY AND SUSTAINABILITY
ISSUES AND PRINCIPLES
��������������������������� ������������ ��� ��������� ����������������������������
CRITICAL DECISIONS FACTORS
�� ������ ������������
DEVELOPING FUTURE SCENARIOS
EVALUATING SCENARIO TRADE-OFFS


Part I
Theoretical framework


Chapter 2
2. Sustainability principles for strategic decisions1
2.1 Introduction
A strategic action can be considered sustainable if it is at least acceptable socially,
environmentally and economically, without causing significant trade-‐offs (Gibson, 2006). This
concept calls for approaches to assess in an integrative way the environmental, economic and
societal impacts of decisions, focusing on the interrelations among the economic, social and
environmental dimensions, rather than on the three categories separately.
In this regard, a growing interest has been drawn to sustainability assessment (SA) literature
in the past decade (Bond et al., 2012). The common pathway followed seemingly is to view
'sustainability assessment' as the third generation of impact assessment (Bond and Morrison-‐
Saunders, 2011). Pope and Sadler (2011) defines sustainability assessment as an ex ante
process that seeks to identify the future consequences of a proposed action in a manner that
directs planning and decision-‐making towards sustainability.
Chapter 1 has analogously documented the debate on the shifts of SEA towards sustainability
agenda. SEA is often seen as inherently having sustainability goals (Bond and Morrison-‐
Saunders, 2011). A point of distinction between SA and SEA is that SA may be applied at any
level of decision-‐making, from project-‐specific to strategic level.
Therefore, the extent to which SEA and SA may be considered analogous depends upon the
extent to which an SEA process embeds the concept of sustainability (Pope and Sadler, 2011).
Thus, the level of PPP making might be the most interesting and suitable for gathering a wider
understanding on how to deal with the sustainability concept in a more integrated, strategic
and comprehensive ways. In fact, in my research I will essentially refer to SEA literature and
practice.
1 This chapter is based on: Lamorgese, L., Geneletti, D. Sustainability principles in strategic environmental assessment: A framework for analysis and examples from Italian urban planning. Environmental Impact Assessment Review 2013;42:116–126.

CHAPTER 2
18
The objective of this chapter is to explore to what extent sustainability principles are
addressed in SEA. To do this, I will present a framework for analysing the degree of
consideration of sustainability principles in strategic decisions. The framework seeks to
provide a guidance to convert widely accepted principles (Gibson et al., 2005) into operative
questions, with the purpose of assessing tangible contribution of SEA to sustainability.
Then, I will demonstrate its application to a sample of SEA of Italian urban plans. In this
chapter, I will focus on SEA of urban planning moving from the basic and consolidated idea
that cities are privileged contexts for providing solutions for sustainability. As Taylor (2012)
claims, they possess the three major attributes necessary for successful sustainability:
financial capital, human capital, and social capital. In particular, urban sustainability has meant
to various scholars a strictly social dimension, incorporating notions of equity, empowerment,
accessibility, and participation (e.g. Brandon and Lombardi 2010; Basiago, 1999).
Finally, I will describe and discuss results drawing out implications and insights for
sustainability as well as equity agenda. In the debate on sustainability, crucial issues are
related to equity considerations in the evaluations of likely outcomes on present and future
generations (George, 1999). For this reason, the framework gives emphasis on the inclusion of
key concepts, such as intra-‐generational and inter-‐generational equity, and on the associated
analysis of trade-‐offs through time and space.
2.2 Construction of the review framework
The concept of sustainability derives from the well-‐known notion of sustainable development,
the “development that meets the needs of current generations without compromising the
ability of future generations to meet their needs” (World Commission on Environment and
Development, 1987). However, there is no unanimous consensus on how this definition
should be put into practice. Due to the elusiveness of the definition, many theoretical
formulations of the concept of sustainability have been proposed, and consequently many
versions of sustainability-‐based decision principles and criteria have been proposed.
Following the example of several approaches for operationalizing sustainability principles, a
framework was developed in order to evaluate policy-‐making and planning against
sustainability criteria. The framework adapted Morrison-‐Saunders and Hodgson's approach
(2009), which in turn converted the sustainability principles proposed by Gibson (2006) into

SUSTAINABILITY PRINCIPLES FOR STRATEGIC DECISIONS
19
guidance statements. The original structure proposed by these authors has been partly
modified, and largely integrated with other relevant criteria and questions gathered from an
extensive literature review. Criteria and questions have a wide-‐ranging nature to allow the
application of the framework to different SEA contexts.
The framework is based on the following seven principles, described in detail in Tables 2.1 to
2.7:
• socio-‐ecological system integrity;
• intra-‐generational equity;
• inter-‐generational equity;
• cost-‐effectiveness, efficiency and resource maintenance;
• prudence and precaution;
• democratic governance; and
• immediate and long-‐term integration issues.
In these tables, the first column reports Gibson's principles, the second shows the criteria that
interpret them, and the last contains questions that allow evaluating systematically to what
extent sustainability principles are addressed in policy-‐making and planning. The number of
questions attached to each principle varies from 5 to 20. The total number of questions is 71.
Tab. 2.1 – Criteria and questions proposed for Principle 1 (precaution and adaptation).
PRINCIPLE a CRITERIA QUESTIONS
1 – Precaution and adaptation Respect uncertainty, avoid even poorly understood risks of serious or irreversible damage to the foundations for sustainability, plan to learn, design for surprise and manage for adaptation.
! err on the side of caution in
contentious or uncertain aspects of development proposals; b, f, g, h, i
! seriously consider ‘not proceeding’ as an option where there is too much scientific uncertainty about particular aspects of a proposal or where the negative consequences of the proposal outweigh the benefits; b, f
! clearly demonstrated how negative impacts of a proposed development would be managed. b
Does the proposal: ! err on the side of caution in contentious or uncertain aspects of development proposals? b, f, g, h, i
! seriously consider ‘not proceeding’ as an option where there is too much scientific uncertainty about particular aspects of a proposal or where the negative consequences of the proposal outweigh the benefits? b, f, i
! clearly demonstrate how negative impacts of a proposed development would be managed? b
Does the development scheme for the area take into account the maintenance of available capital of non-‐renewable resources in the long term? c, d, f, g, h, i Are environmental standards or limits defined? e [also targets or ranges]
a) Gibson (2006). b) Morrison-‐Saunders and Hodgson (2009). c) Brandon and Lombardi (2010). d) George (1999). e) Therivel et al. (2009). f) Howarth (1995). g) Padilla (2002). h) Daly (1990). i) Clarke (2002).

CHAPTER 2
20
Tab. 2.2 – Criteria and questions proposed for Principle 2 (inter-‐generational Equity).
PRINCIPLE a
CRITERIA
QUESTIONS
2 – Inter-‐generational equity Favour present options and actions that are most likely to preserve or enhance the opportunities and capabilities of future generations to live sustainably.
! demonstrate enduring value for future generations; b
! clearly outline the future negative impacts (local, regional and cumulative) of the proposal and how they will be managed, and by whom, and how future liability will be managed; b
! hold proponents accountable for commitments (for example through mechanisms such as development bonds); b
! demonstrate that the proposal will not impact on the long-‐term performance of existing significant local or regional land use activities. b
! Does the proposal demonstrate enduring value for future generations? b
! Does the proposal clearly outline the future negative impacts (local, regional and cumulative) of the proposal and how they will be managed, and by whom, and how future liability will be managed? b
! Is it demonstrated that the proposal will not impact on the long-‐term performance of existing significant local or regional land use activities? b
! Will a particular development be economically viable in the future? b
! Who will have responsibility for managing negative impacts of a development in the future? b
! Will commitments by proponents be acted upon in the future? b
! adopt a strong sustainability perspective, demonstrating how the proposal biases decisions in favour of not decreasing the level of natural capital passed onto future generations c and combines environment, social and economic consideration in a more objective way. d
! Does the proposal adopt a strong sustainability perspective, demonstrating how the proposal biases decisions in favour of not decreasing the level of natural capital passed onto future generations c and combines environment, social and economic consideration in a more objective way d
! Does the proposal identify positive and negative effects and the duration of effects? e
! Does the proposal identify who is affected by the impacts and when? f
! demonstrate how the proposal biases decisions against irreversible choices. h
! How does the proposal undertake climate change adaptation and mitigation measures? d, f, g
a) Gibson (2006). b) Morrison-‐Saunders and Hodgson (2009). c) Beder (2000). d) Eales and Sheate (2011). e) Therivel et al., (2009). f) European Commission (2009a). g) Brandon and Lombardi (2010). h) Connelly and Richardson (2005).
SUSTAINABILITY PRINCIPLES FOR STRATEGIC DECISIONS
21
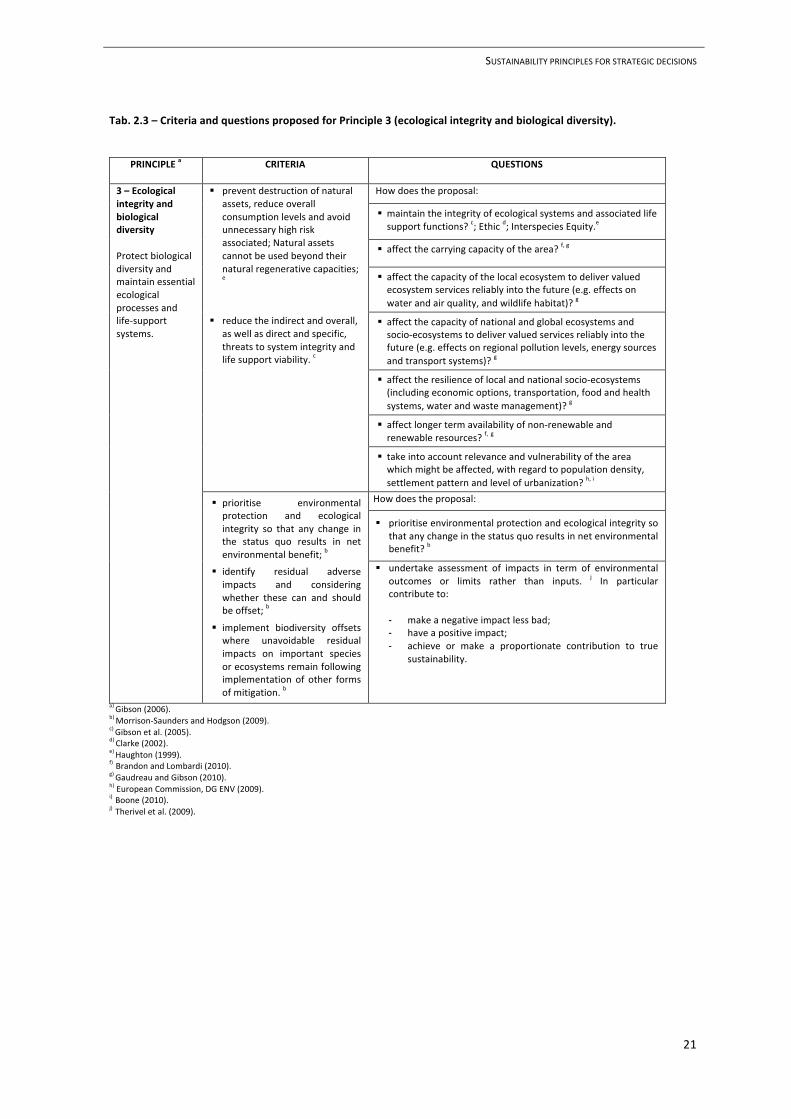
Tab. 2.3 – Criteria and questions proposed for Principle 3 (ecological integrity and biological diversity).
PRINCIPLE a CRITERIA
QUESTIONS
3 – Ecological integrity and biological diversity Protect biological diversity and maintain essential ecological processes and life-‐support systems.
! prevent destruction of natural assets, reduce overall consumption levels and avoid unnecessary high risk associated; Natural assets cannot be used beyond their natural regenerative capacities; e
! reduce the indirect and overall,
as well as direct and specific, threats to system integrity and life support viability. c
How does the proposal:
! maintain the integrity of ecological systems and associated life support functions? c; Ethic d; Interspecies Equity.e
! affect the carrying capacity of the area? f, g
! affect the capacity of the local ecosystem to deliver valued ecosystem services reliably into the future (e.g. effects on water and air quality, and wildlife habitat)? g
! affect the capacity of national and global ecosystems and socio-‐ecosystems to deliver valued services reliably into the future (e.g. effects on regional pollution levels, energy sources and transport systems)? g
! affect the resilience of local and national socio-‐ecosystems (including economic options, transportation, food and health systems, water and waste management)? g
! affect longer term availability of non-‐renewable and renewable resources? f, g
! take into account relevance and vulnerability of the area which might be affected, with regard to population density, settlement pattern and level of urbanization? h, i
! prioritise environmental protection and ecological integrity so that any change in the status quo results in net environmental benefit; b
! identify residual adverse impacts and considering whether these can and should be offset; b
! implement biodiversity offsets where unavoidable residual impacts on important species or ecosystems remain following implementation of other forms of mitigation. b
How does the proposal:
! prioritise environmental protection and ecological integrity so that any change in the status quo results in net environmental benefit? b
! undertake assessment of impacts in term of environmental outcomes or limits rather than inputs. j In particular contribute to:
- make a negative impact less bad; - have a positive impact; - achieve or make a proportionate contribution to true
sustainability.
a) Gibson (2006). b) Morrison-‐Saunders and Hodgson (2009). c) Gibson et al. (2005). d) Clarke (2002). e) Haughton (1999). f) Brandon and Lombardi (2010). g) Gaudreau and Gibson (2010). h) European Commission, DG ENV (2009). i) Boone (2010). j) Therivel et al. (2009).

CHAPTER 2
22
Tab. 2.4 – Criteria and questions proposed for Principle 4 (equity and quality of life).
PRINCIPLE a
CRITERIA
QUESTIONS
4 – Intra-‐generational Equity Ensure equity of opportunity for everyone, particularly the poorest and most vulnerable members of the community and seek to create a good quality of life for everyone.
! provide a range of community amenities and services available to all in the community; b
! ensure that any affordable housing initiatives are provided and protected into the future.b
! does the proposal provide a range of community amenities and services available to all in the community? b
! are proponents held responsible for commitments in the area? b
! how the proposal will create a cohesive community, based on issues such as b: -‐ the social implications of high-‐rise developments, likely transport use patterns, and facilities provided for communities
! reduce ecological footprint while improving quality of life; c
! demonstrate fairness in the distribution of gains and losses; d (equity implies fairness no equality)
! assure environmental justice. d, e, f
How does the proposal:
! assure acceptable quality and standard of living? d
! assure equivalent living conditions? d
! narrow the gap between the most deprived areas and the rest of the city so that no-‐one is seriously disadvantaged by where they live? g
! identify all groups or individuals affected by the plan? h
! demonstrate how needs, values and expectations of stakeholders are taken into account? i
! operate without ignoring external impacts of decisions? (from the neighbourhood level to the global) Geographical Equity i
! build up community and regions, ‘sense of place’ and heritage protection? c
! promote social inclusion? j
! explicitly assess distributional consequences? k, l, m
! guarantee access to transport and services and other facilities? (accessibility and mobility) n
! assure no resettlement of local population? n
! assure no permanent disruption to the livelihood of the local population? n
! reduce the need to travel?
! guarantee open space /access to natural greenspace? n
! demonstrate fairness in the distribution of gains and losses? d (equity implies fairness no equality)
! guarantee proportionate distribution of environmental goods and bads? d, f
• equity of exposure, which requires the presence of a level playing field to allow groups an equal chance of being targeted for significant environmental change. e
• avoid iniquities in the distribution of exposition to health risk. d
• equity of impact, in which groups should experience a proportionate share of the costs and benefits of such change after it occurs. e
• avoid inequities in the impacts of environmental policies, differences in regulatory enforcement (e.g. sectors of communities who are imposed additional costs; increasing the price of certain goods. d, k
! biases decisions in favour of offering special protection to those who are especially vulnerable to our actions and choices? k, m
! take into account human exposure to harm and the differential sensitivity of social group to harm and differences in adaptive capacities to respond or “bounce back” after the harm occurs? m
a) Gibson (2006). b) Morrison-‐Saunders and Hodgson (2009). c) Pope et al. (2004). d) Beder (2000). e) Maschewsky (2005). f) Agyeman et al. (2002) g) Mitchell and Dorling (2003). h) Walker (2010). i) Haughton (1999). j) European Commission (2009a). k) Connelly and Richardson (2005). l) Walker (2007). m) Cutter, 2003 in Boone (2010). n) ODPM (2005).

SUSTAINABILITY PRINCIPLES FOR STRATEGIC DECISIONS
23
Tab. 2.5 – Criteria and questions proposed for Principle 5 (Efficiency).
PRINCIPLE a CRITERIA b QUESTIONS c, d, e, f, g, h
5 – Efficiency Reduce overall material and energy demands on social and ecological systems.
! demonstrate how the proposal is based on energy efficient design;
! demonstrate how the proposal will promote local employment and mixed use (i.e. creating sustainable social environments that avoid or minimise the need for people to travel long distances to meet their needs);
! demonstrate how the proposal will realistically incorporate renewable energy generation and other sustainable resources;
! demonstrate that all reasonable and practicable measures have been taken to minimise the generation of waste and its discharge into the environment.
How does the proposal contribute to:
! minimise environmental footprint?
! zero discharge of oil/chemicals to land, surface water or groundwater?
! minimise emissions?
! minimise energy and resource use?
! minimise production of waste?
! maximise re-‐use of displaced materials?
! no net loss of sensitive habitat?
! restoration of habitats and hydrological regimes?
a) Gibson (2006). b) Morrison-‐Saunders and Hodgson (2009). c) European Commission (2009a). d) Page (1997). e) York et al. (2003). f) Rees (1992). g) Newman (2006). h) Agyeman and Evans (2003).
Tab. 2.6 – Criteria and questions proposed for Principle 6 (democracy and governance).
PRINCIPLE a
CRITERIA b
QUESTIONS
6 – Democracy and governance Ensure that proposals are developed through active public participation in transparent decision-‐making processes.
! genuinely engage the affected community (local, regional or national as appropriate) in the future vision, planning and development of the proposal area;
! undertake an independent community engagement process, rather than a process solely conducted by the proponent;
! honour the results of previously conducted consultation processes.
How does the proposal contribute to:
! assure social acceptability applying fair-‐share principles? c
! avoid inequities in people’s ability to influence decisions affecting their environment? d
! promote direct representation of the interests of disadvantaged groups? e, f
! undertake rights of access to information and participation into public decision-‐making processes? g
! engage with stakeholders in the assessment procedure? g, h
! guarantee that the SEA/SA report is publish and made readily available to all members of the public? f
! assure that all members of the public have the opportunity to comment on the proposals, and having their views be taken into account before a decision is made? f, h
a) Gibson (2006). b) Morrison-‐Saunders and Hodgson (2009). c) Agyeman et al. (2002). d) Beder (2000). e) Connelly and Richardson (2005). f) George (1999). g) Haughton (1999). h) Johnson (1999).

CHAPTER 2
24
Tab. 2.7 – Criteria and questions proposed for Principle 7: immediate and long-‐term integration.
PRINCIPLE a
CRITERIA b
QUESTIONS
7 – Immediate and long-‐term integration Decision-‐making processes should reflect the equal importance of each principle of sustainability, and mutually supportive benefits should be sought without compromising any individual principle.
! demonstrate that all of the
principles of sustainability are being met and that there will be a net benefit.
Does the proposal:
! clearly identify the core strategy duration? c
! find solutions which results in a more just solution of environmental goods or bads rather than to accepting tradeoffs between social goods and environmental, or viceversa? d
! biases decisions against causing harm, as distinct from merely foregoing benefits? d
! bias decisions in favour of sustainable rather than one-‐off benefits? d
! where proponents are
proposing trade-‐offs, they should:
• avoid significant adverse
effects; • maximise net gains; and • explicitly justify all
proposed trade-‐offs through an open process.
Does the proposal consider sustainability decision-‐making trade-‐off rules? such as e:
• Maximum net gains -‐ any acceptable trade-‐off must favour achievement of the most positive feasible overall result, while avoiding significant adverse effects.
• Burden of argument on trade-‐off proponent -‐ the burden of justification falls on the proponent of the trade-‐off.
• Avoidance of significant adverse effects -‐ a significant adverse effect on any sustainability requirement area cannot be justified unless the alternative is acceptance of an even more significant adverse effect.
• Protection of the future -‐ avoid displacement of a significant adverse effect from the present to the future.
• Explicit justification -‐ all trade-‐offs must be accompanied by an explicit justification based on openly identified, context specific priorities as well as the sustainability decision criteria and the general trade-‐off rules.
• Open process -‐ proposed compromises and trade-‐offs must be addressed and justified through processes that include open and effective involvement of all stakeholders.
a) Gibson (2006). b) Morrison-‐Saunders and Hodgson (2009). c) Bond and Morrison-‐Saunders (2011). d) Connelly and Richardson (2005). e) Gibson et al. (2005).
2.3 Application to SEA of spatial planning
The developed framework was applied to analyse how sustainability principles are addressed
in Italian SEA practice for urban planning. Italian spatial planning is based on a tiered system,
which consists of national Acts, regional and provincial spatial coordination plans, and urban
plans at the municipality level (Bragagnolo et al., 2012 and Geneletti et al., 2007). The latter
plans contain detailed provisions concerning land uses, zoning, building regulations, etc. We
focused on this level because its content goes beyond general statements and objectives, and
allow understanding the actual considerations of sustainability issues in decisions.

SUSTAINABILITY PRINCIPLES FOR STRATEGIC DECISIONS
25
Transposition of Directive 2001/42/EC occurred in Italy only in 2006, even if the law was
amended several times and actually implemented only at the beginning of 2008. However,
provisions to perform SEA had been introduced earlier by several regional governments
(Diamantini and Geneletti, 2004). 15 environmental reports (ERs) of urban plans were
selected, by using the following criteria:
• Representativeness of different regions across Italy;
• Preference accorded to (in this order): regional capital cities, provincial capital cities,
largest cities (minimum population: 50,000)
• ER and planning documents available on the web.
The selection of ERs covers a broad range of geographical areas, socio-‐economic conditions
and environmental characteristics. Specifically, four cases refer to regional capitals, nine to
provincial capitals and two to municipalities with more than 50,000 inhabitants, as shown in
Table 2.8. The ERs were prepared between 2006 and 2011.
Tab. 2.8 – Overview of the selected environmental reports.
ID CITY STATUS INHABITANTS YEAR
BO Bologna Regional capital 380.000 2008
FI Florence Regional capital 400.000 2010
GR Grosseto Provincial capital 82.000
2011
MAN Manfredonia Municipality 57.000 2011
MI Milan Regional capital 1.300.000 2009
NU Nuoro Provincial capital 37.000 2009
RE Reggio-Emilia Provincial capital 165.000 2009
RN Rimini Provincial capital 140.000 2011
SA Salerno Provincial capital 150.000 2006
SV Savona Provincial capital 65.000 2009
SCA Scafati Municipality 51.000 2011
TS Trieste Regional capital 205.000 2009
UD Udine Provincial capital 100.000 2011
VC Vercelli Provincial capital 48.000 2007
VR Verona Provincial capital 250.000 2007

CHAPTER 2
26
The ERs were reviewed by checking whether or not they present at least an element that can
be connected to each of the proposed questions. If such elements were found, a description
was included in the framework, else the relevant cells were left blank. Table 2.9 shows an
example of how the documents of the 15 ERs were analysed against the proposed framework.
Tab. 2.9 – Example of the approach adopted to review the environmental reports.
ID
PRINCIPLE 1 – Precaution and adaptation Question: Are environmental standards or limits defined? Therivel et al. (2009). [also targets or ranges]
BO
The proposal imposes specific targets for the airport regulatory plan. Solutions for the enlargement of the airport infrastructures are allowed only if they assure to slash greenhouse gas emissions by 20% of 1990 levels.
Precautionary interventions for human health: passive protections of potential receptors from sources of pollution are considered.
e.g. New infrastructures for residential, school and health scopes are allowed provided that at least minimum distances from motorways and local viability are respectively 150 and 100 metres.
The maximum allowed increase in housing (8000) and areas for not residential uses (765.000 square metres) are fixed.
FI
Climate change: Adherence to Covenant of Mayors, aiming to meet and exceed the EU 20% CO2 reduction objective by 2020. The proposal promotes cogeneration power plants at district level, access to incentives for building energy efficiency, use of renewable energy (solar panels)
GR Imposed restrictions for allowing transformations: respect of permeability index (40% of total surface); CO2 balance control (Carbon sink)
MAN -‐
MI
Climate change: Adherence to Covenant of Mayors, Climate Plan adoption, involvement in Sustainable Energy and Climate Protection Campaigns at European level
20% reduction of CO2 emissions by 2020
20% of energy demand covered with renewable resources by 2020
20% reduction energy consumptions adopting efficient energy actions and solutions
15% for the share of cycling in the modal split of trips for the year 2020 (Charter of Bruxelles commitments)
NU -‐
RE -‐
RN
Precautionary interventions for human health: passive protections of potential receptors from sources of pollution are considered.
e.g. New infrastructures for residential, school and health scopes are not allowed provided that at least minimum distances from motorways and local viability are respectively 200 and 100 metres. An environmental belt is also required between the residential area and the road network
The maximum allowed increase in housing (5000) is fixed. 20% of energy consumes of new public housing assured with renewable sources
SA -‐
SV -‐
SCA -‐
TS -‐
UD
Climate change: Adherence to Covenant of Mayors, Climate Plan adoption, involvement in Sustainable Energy and Climate Protection Campaigns at European level
20% reduction of CO2 emissions by 2020
20% of energy demand covered with renewable resources by 2020
20% reduction energy consumptions adopting efficient energy actions and solutions
VC -‐
VR -‐

SUSTAINABILITY PRINCIPLES FOR STRATEGIC DECISIONS
27
Subsequently, the findings have been re-‐organized and expressed by percentage as shown in
Tables 2.10‒2.11 and Figures 2.1‒2.2. The purpose of these figures is to distinguish questions not addressed at all from questions that are addressed at least to some extent. The nature of
the information gathered from the review is explained in Section 2.5.1, by illustrating
exemplary cases.
Additionally, the information extracted from the documents was used to answer five cross-‐
cutting questions:
1. Are sustainability principles explicitly mentioned? 2. Are critical issues identified? 3. Are environmental indicators used? 4. Are environmental standards, target thresholds or ranges defined? 5. Are “not proceeding” options seriously considered?
These aspects were selected according to their tangible role that they may play in putting in
practice sustainability. In particular, with reference to question four, environmental
thresholds refer to “tipping points” beyond which ecological discontinuities with socially,
economically and environmentally unacceptable and possibly irreversible consequences are
likely to occur (European Commission, 2009b). Ranges represent a“danger zone” outside the
safe operating zone, which indicate a high probability and subsequently a high risk to reach
the threshold levels (Ecologic Institute and SERI, 2010). Finally, environmental standards are
limits that must be respected in order to achieve or maintain the desirable environmental
state.
2.4 Results
Table 2.10 provides a summary of the results, showing the questions for which relevant
information was found in the ERs. Figure 2.1 presents the results broken down by the seven
sustainability principles, whereas Table 2.11 shows the percentages of questions addressed by
the different case studies.

CHAPTER 2
28
Fig. 2.1 – Overall rate of questions addressed by the ERs, broken down by the seven sustainability principles.
Fig. 2.2 – Cross-‐cutting findings of the review of the ERs.
In more than 85% of the ERs it was possible to find elements that addressed at least 40% of
the questions, while just one case addressed 60% of them. The worst case corresponds to 28
out of 71 questions filled. In 14 out of 15 ERs, sustainability principles are explicitly
mentioned.

SUSTAINABILITY PRINCIPLES FOR STRATEGIC DECISIONS
29
In all cases there is a broadly identification of critical issues, whereas only 7% of ERs consider
“not proceeding” as an option, where there is too much scientific uncertainty about particular
aspects of a proposal or where the negative consequences of the proposal outweigh the
benefits.
Concerning the methodology adopted, 80% of ERs are based on the use of indicators, but only
five ERs present examples of environmental standards, limits target or ranges defined. In all
ERs, mobility and open space are treated in detail with respect to quality of life, social
cohesion and reducing impacts on the environment. Figure 2.2 presents the percentages of
ERs that address the five cross-‐ cutting issues described in Section 2.3. The review showed
that more specific questions, such as the ones concerning carrying capacity in the long term,
net environmental benefits and trade-‐offs rules were rarely considered. The analysis also
revealed that concerns on intra-‐ and inter-‐generational equity are barely present, as discussed
in the following section.
2.5 Discussion
As shown in Table 2.10, in several cases the ERs contain at least a feature referable to the
questions proposed in the framework, but that does not necessarily imply exhaustiveness and
completeness in addressing the relevant sustainability principles. Hence, the figures displayed
in Table 2.10 and Table 2.11 and Figure 2.1 are not illustrative of how adequate ERs are in
addressing the sustainability questions proposed.
The study showed that sustainability is often stated as the pivotal concept that guided the
assessment. However, for example, even if in all cases there is a broad identification of critical
issues, the ERs do not seriously consider ‘not proceeding’ as an option where there is too
much scientific uncertainty about particular aspects of a proposal or where the negative
consequences of the proposal outweigh the benefits.
Thus, mitigation and compensation are broadly considered. As a consequence, in more than
half of the cases, the ERs show approaches that aim at minimising the negative effects of
proposed choices.

CHAPTER 2
30
Studies are generally based on the use of indicators, but few examples of environmental
standards or limits were found in larger municipalities, which are involved in Sustainable
Energy and Climate Protection Campaigns at European level (Adherence to Covenant of
Mayors, Charter of Aalborg, Aalborg Commitments) or cities that have identified thresholds to
control soil sealing.
In the sub-‐sections that follow, the findings of the review are discussed for each principle. The
purpose is to present and discuss the actions connected to sustainability that were detected in
the SEA reports, as well as to highlight the main gaps that emerged from the analysis.
Examples of how the findings were reconnected to the seven principles of sustainability are
also included.

SUSTAINABILITY PRINCIPLES FOR STRATEGIC DECISIONS
31
Tab. 2.10 – Summary of the questions addressed in the 15 environmental reports.
Questionsns
BO FI GR MAN MI NU RE RN SA SV SCA TS UD VC VR
PRIN
CIP
LE 1
–
Prec
autio
n an
d ad
apta
tion
1 " " " " " " " " " " " " " " " 2 " " " " " " " " " " " " " " " 3 " " " " " " " " " " " " " " " 4 " " " " "
5 " " " " " " " " " " " " " " "
PRIN
CIP
LE 2
– In
ter-
gene
ratio
nal e
quity
1 " " "
" " " " " " " " 2 " " " " " " " " " " " " " " 3 4 " " " 5 " " " " " " " " " " " " " " " 6 " " " " " " " " " " " " " 7 " " 8 " " " " " " " " " " " " " " 9 " " " " " " " " " " " " "
10 " " " " " " " " " " " " " "
PR
INC
IPLE
3 –
Ec
olog
ical
inte
grity
and
bio
logi
cal
dive
rsity
1 " " " " " " " " " " " " " " " 2 " " " " " " " " " " 3 " " " " " " 4 5 6 " 7 " " " " " " " " "
" 8
" "
9 " " " " " " " " " " " " " " "
PRIN
CIP
LE 4
– E
quity
and
qua
lity
of li
fe (I
NTR
A)
1 " " " " " " " " 2
3 " 4 " " " " " " " " " " " " " 5 " " " " " " " 6 " " " " " 7 " " " " " " 8 " " " " " 9 " "
" " " "
10 " " " " 11 " " " " " " " " 12 " " " " " " " 13 " " " " " " " " " " " 14 " 15 " 16 " " " " " " " 17 " " " " " " " " " " " 18 " 19 " 20 " " " " " 21 " " "
PRIN
CIP
LE 5
– E
ffici
ency
1 2 " " 3 " " " " " " " " " " " " " " " 4 " " " " " " " " " " " " " " 5 " " " " " " 6
7 " "
8 " " " " " " " " "
PRIN
CIP
LE 6
–
Dem
ocra
cy a
nd
gove
rnan
ce
1 "
2
3 " "
4 " " " " " " " " " .
" " " 5 " " " " " " " " " " " " " " " 6 " " " " " " " " " " " " " " " 7 " " " " " " " " " " "
PRIN
CIP
LE 7
– Im
med
iate
and
long
-term
in
tegr
atio
n
1 " " " " " " " " " " " " " 2 " " " " " " " " " " " " 3 " 4 " " " 5 " " " " " " " " " " " " " " 6 " 7 " " 8 9 " " " "
10 " " " " " " " 11 " " " " " " " "
Key " = Questions addressed in the ERs

CHAPTER 2
32
2.5.1 Consideration of the different principles Principle 1 – precaution and adaptation
Despite the differences in urban and demographic contexts, the urban plans are in favour of
improving the built city, rather than expanding it, through renovation, remediation, reuse and
substitutions of existing urban areas. One common and widely recognized objective concerns
the reduction of land take. Thus, it emerges a substantial awareness that avoiding land take
contributes to preserve space for ecosystems regulating water balance and protection against
floods. In particular, three ERs set explicit restrictions to limit soil sealing, by imposing a
minimum percentage of permeable surface to be maintained. However, even if the plans
promote the reduction of urban sprawl and land take, their actual actions often include the
expansion of residential areas and associated services and infrastructures.
As noted earlier, ERs broadly identified critical issues, and showed how negative impacts of a
proposed development would be managed, but they do not seriously consider ‘not
proceeding’ as an option. Thus, measures of mitigation and compensation are commonly
envisaged. Common measures include the enhancement of rainwater reuse, extension of
sewage systems in rural areas, application of energy saving certification, specific plan for
enhancing remote heating systems, tree plantations and enhancement of wooden areas for
greenhouse gas sequestration.
Principle 2 – inter-‐generational equity
The purpose of preserving environmental assets for future generations is commonly stated by
ERs, by referring to sustainability objectives as well as the adherence to international
declarations and charts (e.g. Aalborg Commitments). These forethoughts should be taken into
account as suitable contribution in view of achieving sustainable development, even if they do
not assure that the choices are coherent with the sustainability objectives. In fact, despite the
intentions, the temporal dimension is rarely explicitly mentioned in the ERs.
Long-‐term implications of actions are generally disregarded. ERs identify positive and negative
effects, without analysing the duration of effects. In addition all ERs define sustainability
concerns only considering the local scale.

SUSTAINABILITY PRINCIPLES FOR STRATEGIC DECISIONS
33
Three ERs out of nine address impacts caused on neighbouring regions, outside the planning
area. Remarkably, they are in favour of share decisions with surrounding areas rather than
merely exploiting resources from them. 60% of ERs include scenario analysis.
The issues analysed are case-‐specific, but in more than 50% of ERs scenario analyses concern
mobility, air quality and demographic growth. Only one ER includes a comprehensive analysis
of alternative scenarios, and only one includes qualitative considerations on the probability
that the proposed actions are actually implemented. The lack of consideration of different
alternatives in different future settings that characterise the reviewed ERs, limits the
understanding of how the actions proposed in the plans will affect the quality of life of future
generations.
Principle 3 – ecological integrity and biological diversity
All ERs address better management of greenfields, area of natural habitats and rural areas.
Most ERs considered biodiversity conservation as a goal of primary importance. In 60% of the
reports interventions were planned, such as designing ecological networks at local level,
creating greenways and ecological corridors by connecting parks and open space.
Moreover, interventions for preserving ecological integrity are not restricted to urban areas
but also include rural areas (e.g. farming practices for the maintenance of ecological integrity
and the scenic value of landscapes). 80% of ERs include interventions of mitigation.
Actions are mainly related to restoring fluvial processes, hydrogeological risk control, and
greenspace protection through constraints and regulations. The management of rural areas,
with the aim of enhancing agricultural best practices, was considered in more than 70% of
cases.
Principle 4 – equity and quality of life
The intra-‐generational equity principle is emerged as the most challenging one. While the
review shows that inter-‐generational equity is present, even though the temporal dimension
is often ignored, information on intra-‐generational equity is very limited. Although the social
dimension is addressed in general terms, ERs do not assess planning decisions by exploring
their implications for different social groups. Broadly speaking, the social concerns are
distinguished on the basis of districts and areas of interventions.

CHAPTER 2
34
Only in 40% of the documents elements were found referring to equity issues, and only in
terms of specific actions (e.g. reducing needs to travel, increasing services and facilities at
district level to address the needs of old people, and expanding social housing).
However, in seven documents some actions are explicitly planned for vulnerable areas, such
as the creation of buffer zones to screen schools, hospitals and residential areas from air and
noise pollutions. Only two cases explicitly identified different groups of people affected by
planning decisions. Environmental equity is never addressed explicitly, as none of the ERs
include considerations on the distribution of environmental costs and benefits.
Principle 5 – efficiency
Urban plans share the common objective to promote efficiency, reducing overall material and
energy demands on social and ecological systems. All ERs illustrate a range of measures to
minimise the impacts on the physical environment. Common actions are related to minimise
emissions, energy consumptions and resource use, in particular land take.
In almost 90% of the cases, improvement of public transportation network and enhancement
of cycling facilities are considered crucial measures of sustainability for reducing impacts on
the environment. Promotion of energy efficiency in buildings, as well as the application of
sustainable architecture criteria, is also very common.
Principle 6 – democracy and governance
Two different approaches were distinguished for this principle: the involvement of the public
and stakeholders, following a legal requirement, and the promotion of initiatives to foster a
more active engagement of the public in decision-‐making (e.g. hearings, dedicated meeting
and focus groups, web sites and on-‐line discussion forum, questionnaires). These initiatives
(included by 60% of ERs) are to enhance “procedural equity” (Haughton, 1999), by promoting
access to information, effective participation, and transparency.
Principle 7 – immediate and long-‐term integration
All ERs attempt to show efforts taken to reduce environmental impacts, through actions such
as improvement of public transport, creation and restoration of parks, reduction of water
consumption, and rain water reuse. Concerning long-‐term effects, 60% of ERs discuss long-‐
term implications, even though only 40% explicitly refer to a time horizon.

SUSTAINABILITY PRINCIPLES FOR STRATEGIC DECISIONS
35
However, such time horizons refer to specific interventions only, rather than to a general
strategy. For example, targets for air emissions and green buildings both represent purposeful
contributions towards sustainability in the long run. However, the first action includes a time
horizon (typically 2020), whereas the second one is more nuanced in the ERs since in most
cases it is deprived of a clear reference to time.
Moreover very few cases go further, for instance, discussing how alternative possible future
developments may contribute to reducing CO2 emissions. However, none clearly
demonstrates that all of the principles of sustainability are being met and that there will be a
net benefit. Two third of ERs take care of avoiding significant adverse effects rather than
maximise net gains. In any case trade-‐offs for the main negative effects are justified. As
mentioned before, mitigation and compensation measures are in general broadly addressed.
In particular, these actions are especially contemplated to justify interventions in areas at
hydrogeological risk. 10 ERs provide explicit justifications for trade-‐off based on context
specific priorities. In addition, four documents openly observe that some negative impacts will
remain without compensation. One of these also pointed out that the proposed sustainability
measures are not enough unless a constant monitoring of their effective implementation is
assured. Moreover, only 20% of the ERs clearly define rules and action for assuring that the
burden of justification falls on the proponent of the trade-‐off.
Tab. 2.11 – Rate of questions addressed, broken down by sustainability principles and environmental reports.
ER
Principle
Number
of
questions
Percentage of questions addressed by the ERs
BO FI GR MAN MI NU RE RN SA SV SCA TS UD VC VR
1 – Precaution and
adaptation 5 100 80 100 100 80 80 80 80 80 100 80 80 100 80 80
2 – Inter-generational
equity 10 80 70 70 50 70 80 70 70 70 60 60 60 50 70 60
3 – Ecological integrity
and biological diversity 9 67 44 44 44 44 44 44 44 33 67 56 22 44 44 22
4 – Equity and quality of
life 21 43 29 43 14 52 52 24 19 62 33 38 14 29 29 52
5 – Efficiency 8 50 38 50 50 38 38 25 38 38 38 38 38 50 38 38
6 – Democracy and
governance 7 71 57 57 57 57 43 43 43 57 43 43 43 57 43 57
7 – Immediate and long-
term integration 11 64 36 45 55 55 36 27 36 27 36 45 18 55 36 27
All Principles 71 62 45 54 44 55 52 39 41 52 48 48 32 48 44 46

CHAPTER 2
36
2.6 Conclusions
By developing a set of criteria for each principle, and a set of questions, the proposed
framework can provide a contribution to make the broad principles of sustainability operable
on the ground. Tools such as the framework developed here provide guidance for improving
(and checking) the sustainability outcomes of decisions, and help overcome the gap between
the stated intentions and the actual strategies. The review of SEA practices showed that
several sustainability issues are clearly identified and considered in urban planning at the level
of principles and objectives, but then disregarded when it comes to actions and decisions.
The review concluded that, even if actions that can contribute to operationalize sustainability
are found in ERs, they are far away from exhaustively addressing the seven principles of
sustainability. Specifically, issues related to intra-‐generational and inter-‐generational equity
are mostly disregarded. In particular, it is difficult to capture elements related to the
distributional consequences on different social groups of proposed actions. Moreover, ERs
seldom address the issue of trade-‐offs.
This gap represents also a significant limit for the implementation of the democracy and
governance principle. In this respect, the review showed that the attention is more focused on
assuring rights of access to information and transparency in procedures, rather than openly
discuss options and consequences with the involvement of all stakeholders. In the ERs,
attention is paid to promote efficiency in particular by proposing measures to minimise
resource use and waste production.
Nevertheless, due to the fact that in general strong emphasis is given to mitigation and
compensation, the focus is more on how to minimise the negative effects of proposed choices
rather than on the attainment of sustainability. Therefore, we conclude that there is still room
to enhance the potential for integrating sustainability principles into SEA, and that current
practice does not promote sustainability as an organizing concept, according to the set of
criteria and questions proposed here.
The findings of this chapter provide several insights for future work. Concerning the review of
ERs, it would be interesting to flesh out the discussion by focusing on how they address
sustainability in terms of effectiveness of outcomes, and corresponding implications for
decision making. In addition, the proposed review framework represents a first step to

SUSTAINABILITY PRINCIPLES FOR STRATEGIC DECISIONS
37
identify intra-‐generational and inter-‐generational equity metrics that should be explicitly
included in strategic environmental and integrative approaches for decision making. In this
context, further research is required to clarify equity concerns in the light of the plurality of
approaches to sustainability and to frame suitable indicators for operationalizing intra-‐ and
inter-‐generational equity in decision-‐making.
In the chapter that follows, a set of equity criteria for assessing inter-‐ and intra-‐generational
equity are proposed and discussed.


Chapter 3
3. Proposing criteria to assess inter-‐ and intra-‐ generational equity in strategic decisions
3.1 Introduction
Broadly speaking, the two notions of intra-‐ and inter-‐generational equity can be assumed,
respectively, as transactions of rights between people of the same generation and across
generations. Equity in the distribution of the expected effects of decisions on present and
future generations plays a key role in the sustainability debate. Sustainability demands to find
development paths that meet “fundamental human needs while preserving the life-‐support
systems of planet Earth” (Kates et al., 2001). These complex and multi-‐scale interactions
involve multiple feedbacks and trade-‐offs that affect both conditions of the environment and
its capacity to provide services that contribute to human wellbeing. They should be
undertaken enhancing ways of taking advantage of widespread and long-‐term opportunities
and reversing the undesirable trends in the economic, social and ecological domains together.
George (1999) recognizes that such multiscaled and interrelated concerns should be address
by reformulating sustainability concerns in term of intra-‐ and inter-‐generational equity. Anand
and Sen (2000) claim that it is difficult to conceive a situation where a case is made for inter-‐
generational equity while underplaying intra-‐generational equity. Also George (1999) worries
about a sustainable development that respect the environment’s carrying capacity limits in
the log run, without being intra-‐generationally equitable, simply by restricting the numbers of
people who benefit from access to natural resources. Thus, sustainable development can be
conceptualised as the attempt to accomplish intra-‐generational justice under the condition of
inter-‐generational justice (Christen and Schmidt, 2011). As claimed by Padilla (2002), the
search for sustainable development is closely linked to the solution of problems of inequity
that could endanger sustainability and are against the same concept of development.

CHAPTER 3
40
However, Halpern et al. (2013) recognize that even if, in many planning processes, there is a
strong consciousness of equity issues, rarely is equity incorporated into assessment in a
formal way. There are at least two central concerns in framing equity.
The first is essentially related to the fact that the concept of equity is not univocal but reflects
a multifaceted variety of ethical beliefs, which affect interpretations of justice as well.
Distinguishing between the related concept of equity and justice may in general be
problematic, and I do not attempt to make extensive distinctions. In general sense, justice is
related to recognition and respect for the rights of others, while equity is the place where to
find a proportion between the common good and the individual rights, acting with absolute
impartiality (Glasser, 1999). However, Sen (2009) argues that it is not possible achieving a
result univocally fair, because we can judge following several principles, all defensible on the
base of impartiality, but that conduct to different expressions of fairness. There is no way that
can help us resolve this dispute in a universally accepted just manner. Nevertheless, whatever
this constitutive idea is declined, as argued by the author, three elements are essential:
always considering the centrality of avoiding distortions in our evaluations, taking into
account interests of others, and avoiding the influence of personal priorities or prejudices.
The second concerns how to practically formalize in assessment the nexus between equity
and sustainability bringing together equity implications along with environmental, societal and
economic concerns. Singh et al. (2009) recognize that the most often cited measures of
sustainability tend not to include distributional, or other commonplace indicators of equity.
Interrelated to this, the third is over how to interpret intra-‐ and inter-‐generational equity
notions and provide a means for addressing them concurrently. Consequently, another critical
point is how to achieve a viable way for operationalizing sustainability through intra-‐ and
inter-‐generational equity.
Based on these considerations, the objectives of the present chapter are twofold. The first is
to clarify the multifaceted notion of equity in relation to the sustainability paradigm. While,
the second is to develop a set of criteria for making intra-‐ and inter-‐generational equity
operable on the ground. My exploration of these questions begins from a briefly overview of
the principal approaches to sustainability. Then, I will flash out the nexus between
sustainability and equity by classifying the most common and accepted perspectives in equity
according to the sustainability approaches reviewed. To this purpose, I will present a

PROPOSING CRITERIA TO ASSESS INTER-‐ AND INTRA-‐GENERATIONAL EQUITY IN STRATEGIC DECISIONS
41
conceptual framework for identifying equity perspectives vis-‐à-‐vis sustainability. Thereafter, I
will consider some reasons for focusing on a selection of equity perspectives.
In section 3.5, I will describe a proposal for operationalizing the concept of intra-‐ and inter-‐
generational equity. To this purpose, firstly I will flash out notions of intra-‐ and inter-‐
generational equity that synthetize the equity perspectives selected in section 3.3.
Subsequently, I will propose a set of general criteria as metric for measuring intra-‐ and inter-‐
generational equity in decision-‐making. Finally, I will conclude the chapter with a discussion of
advantages, limitations and possible application of the equity criteria suggested.
3.2 Reviewing equity perspectives in sustainability
Interpretations of sustainability requirements and commitments to present and future
generations are significantly influenced by diversity of perceptions and values on equity.
In order to gain a wider understanding of how differentiations, variants and subtle points on
equity affect sustainability, some theoretical bases of approaches to sustainability were
reviewed and a conceptual framework for identifying the different implications related to the
use of different values and perceptions on equity vis-‐à-‐vis sustainability was framed. The
conceptual framework aims to systematize the approaches to sustainability gathered from
literature according to the equity perspectives that underlie them. Tables 3.1 to 3.4 display
the equity perspectives associated according to each of the four dimensions of sustainability
considered.
Economic approaches
Economic approaches, moving from welfare economics to environmental economics, stress on
the human welfare and well-‐being maximization within different form of restrictions, shifting
from constraints of existing capital stock and technologies to natural capital. Different degree
of impositions and constraints are mainly related to the weak versus strong sustainability
debate. Economists tend to be “weak sustainabilists”. They are generally more inclined to
think that the current generation can leave the future any combination of different capitals as
long as the total value of the capital passed on is non-‐declining (Pearce and Turner, 1990).
Given the use of a model where there is a single commodity, this is equivalent to sustainability
as maintaining productive potential through time (Perman et al., 1999).

CHAPTER 3
42
Tab. 3.1 – A conceptual framework for identifying equity perspectives vis-‐à-‐vis sustainability: Economic Approaches
EQUITY PERSPECTIVES
DESCRIPTIONS EQUITY PRINCIPLES
Utilitarian terms
Utilitarianism does not attribute intrinsic value to social and economic equity.
Consider discounting as a concept of inter-‐generational efficiency (Page, 1997).
The goodness of equity is judged on the basis of its contribution to an increase in total utility (Tacconi and Bennett, 1995).
Keep intact the resource base, as a whole, over generational time, indefinitely, to assure that each generation is treated equally (Page, 1997).
Consequentiality ethical doctrines
A consequentialist ethical doctrine judges the goodness of policies solely on the basis of the effects that are expected to do (Glasser, 1999).
If the product resulting from the overall growth is equally distributed then marginal need satisfaction is cancelled because no one can improve their position against others.
Adoption of an intertemporal social welfare function, the maximisation of which leads to a sustainable outcome (Perman et al., 1999).
Taken into account expanded income measures accounted not only for the returns to labor and physical capital but also changes in natural resource (Arrow et al., 2004).
It is necessary a comprehensive measure of wealth that could be a way to measure well-‐being and is the shadow value off all capital assets (Dasgupta, 2009; 2011).
Application of weak sustainability, considering that development is sustainable if and only adjusted net saving is positive (World Bank, 2006). To achieve Sustainable Development, genuine savings rates must not be persistently negative (Pearce et al., 1996).
Deontological ethics
A deontological (or "Kantian") approach to inter-‐generational fairness suggests that sustainability criteria should be imposed as prior constraints on the maximization of social preferences concerning the distribution of welfare between present and future generations (Howarth, 1995).
This moral rule implies a bias against actions that generate present benefits but impose the risk of irreversible future losses if the preservation of options would allow for improved decisions as new information became available (Howarth, 1995).
Imposition of one or more constraints that ensure that a (constrained) maximum of the intertemporal social welfare function will yield a sustainable outcome (Perman et al., 1999).
There is a limit to the growth of total capital stock due to the absolute scarcity and the unsustainable marginal costs associate to the maintenance of matter-‐energy throughput (Daly, 1990).
Incorporating environmental values into decision making will not in itself guarantee sustainability values unless each generation is committed to transferring to the next sufficient reproducible and natural capital to make development sustainable (Perman, 1999).
A limit to physical economic growth does not necessarily imply a limit to improvements in human welfare or quality of life, which is generated by the fulfilment of a variety of different human needs (Costanza et al., 2007).
However, several ecological economists sustain strong sustainability. They believe that a
minimum amount of a number of different types of capital (economic, ecological, social)
should be independently maintained, in real physical/biological terms. The major motivation
for this insistence is due to the recognition that natural resources are essential inputs in
economic production, consumption or welfare that cannot be substituted for by physical or
human capital (Norgaard, 2005).
More strong sustainabilists therefore recognize that there is a limit to the growth of total
capital stock due to the absolute scarcity and the unsustainable marginal costs associate to
the maintenance of matter-‐energy throughput (Costanza and Daly, 1992). As growth in the
physical dimensions of the human economy pushes beyond the optimal scale relative to
biosphere, it becomes in truth uneconomic growth, impoverishing rather than enriching (Daly,
1991).

PROPOSING CRITERIA TO ASSESS INTER-‐ AND INTRA-‐GENERATIONAL EQUITY IN STRATEGIC DECISIONS
43
Environmental approaches
With different degree of obligation towards the environment, environmental approaches put
emphasis on the respect of the integrity of ecological subsystems. Ecologists bias in favour of
focusing on the properties of the biophysical environment, such as resilience, than on human
welfare. Nevertheless, several scholars claim that these approaches are anthropocentric and
at the level of general objectives should be interpreted as complementary rather than
competitive with economics.
On the contrary, more strong ecological positions attribute to nature itself a moral status.
Thus, the moral significance of non-‐humans entities draws on the belief that they possess
qualities also possessed by humans and not all instrumental values in nature are
anthropocentric (Glasser, 1999; Hargrove, 1989). In light of this standpoint, the land ethic
stresses the conception that “a thing is right when it tends to preserve the integrity, stability,
and beauty of the biotic community, while it is wrong when it tends otherwise” (Leopold,
1949). This perspective implies that human-‐beings should consider land as a community of
which they are citizens. Thus, the land-‐community deserves respect for each fellow-‐members
and for the community as such (Leopold, 2010). However, it remains an open question how to
establish an absolute hierarchy of values between environmental and non-‐environmental
goods and services.
Tab. 3.2 – A conceptual framework for analysing equity vis-‐à-‐vis sustainability: Environmental Approaches.
EQUITY PERSPECTIVES
DESCRIPTION EQUITY PRINCIPLES
Anthropocentric (Humanism)
Nature itself has no independent moral status. However humans depend on the deeply interconnected web of biodiversity for their own survival, and we must protect other species to protect ourselves (Farley, 2012).
Preserve ecosystem integrity and maintain biodiversity (Haughton, 1999) Prevent destruction of natural assets beyond their regenerative capacities by reducing overall consumption levels and to avoid unnecessary high risks associated with some untested technological solutions (Haughton, 1999). The equity between generations needs the respect of ecological critical levels that, if surpassed, may cause instabilities and chain reaction with unpredictable effects (Padilla, 2002).
Interspecies (Land Ethic, Ecocentrism)
The belief that the continued existence and flourishing of ecosystems, species and individual non-‐humans, by themselves, constitute a significant good in the world (Glasser, 1999). Humans have a moral responsibility to protect non-‐antropocentric instrumental values (Leopold, 1949)
Employ the perspective of the donor (ecosystem) during the valuation of the different sustainability issues (Gasparatos et al., 2008). Understand the distribution of harms to environment itself (Gandy, 2011). Do not simply have a duty to use nature efficiently, but have obligations to use it with respect, restraint and as eye toward nurturing its capacity for self-‐healing (Padilla, 2002). Have responsibilities to protect nature even when these efforts can conflict with human wants and even if they create a significant utility loss (Glasser, 1999).

CHAPTER 3
44
Social approaches
Social approaches are centred on people's overall quality of life, standard of living and
wellbeing and focus on distributional consequences of decisions that affect individuals, target
groups and communities. The core of the notion of social sustainability is linked to two central
concepts: social equity and the ‘sustainability of community’.
The former is linked to the notion of social justice, which urges the fair distribution of
resources in society in order to allow fair access to jobs, housing and local services. The
second dimension is concerned with the continuing viability and functioning of society as a
collective entity (Bramley and Dempsey, 2006). Social justice demands attention to social
relations, redistribution of rights and resources and discrimination (Colantonio and Lane,
2007). Several schools of thought claim that social sustainability should focus on intra-‐
generational inequality as an important negative influence on well-‐being (Vercelli and
Borghesi, 2005; Pezzey and Toman, 2002). Moreover, Haughton (1999) argues that social
justice is intrinsically connected to environmental justice. Agyeman et al. (2002) also claim
that environmental despoilation and degradation are almost always linked to questions of
social justice, equity, rights and people’s quality of life in its widest sense.
Tab. 3.3 – A conceptual framework for analysing equity vis-‐à-‐vis sustainability: Social Approaches.
EQUITY PERSPECTIVES
DESCRIPTION EQUITY PRINCIPLES
Opportunity (Libertarian ethics)
Guarantee the same set of initial options and different outcomes on the base of merit (Chichilnisky, 1997; Vercelli, 2005).
The entitlement of everyone to an acceptable quality and standard of living.
Equity of opportunity for everyone, particularly the poorest and most vulnerable (Gibson, 2005).
Distributional fairness
It takes the form of making the worst-‐off members of the society as well off as possible (Rawls’ Theory of justice Vantage for the disadvantages, 1971).
Ensure a fair share or proportionate distribution of benefits and dis-‐benefits (Maschewsky, 2005).
Condition Equalities not only in the opportunity but also in the results.
Assuring that people not only have the same starting points but also fair outcomes.
Procedural Fairness of the processes whereby outcomes are allocated.
This principle holds that regulatory and participatory systems should be devised and applied to ensure that all people are treated openly and fairly (Haughton, 1999).
Geographical Equity
It is related to the notion of territorial social justice that address equity issues both within and beyond their own territorial boundaries (Haughton, 1998).
Embrace considerations of how structural geographical inequities are constructed, including the use of national political boundaries and bounded legal systems to restrict legitimacy to those outside these boundaries (Haughton, 1998).
Capability Equalities not only in the opportunity but also in the right of freedom of choice (Sen, 2009).
The focus of the capability approach is thus not just on what a person actually ends up doing, but also on what he/she is in fact able to do, whether or not they choose to make use of that opportunity (Sen, 2009).

PROPOSING CRITERIA TO ASSESS INTER-‐ AND INTRA-‐GENERATIONAL EQUITY IN STRATEGIC DECISIONS
45
At least three elements characterize the notion of environmental justice. The first concerns
the distributional equity, which means that no social group, especially if already deprived in
other socio-‐economic respects, should suffer a disproportionate burden of negative
environmental impacts (Maschewsky, 2005). The second is over the procedural equity, which
refers to the need that regulatory and participatory systems should be devised and applied to
ensure that all people are treated openly and fairly (Haughton, 1999). The third is related to
the concept of geographical equity, which is about how environmental disamenities are
distributed without ignoring potential external impacts of decisions from neighbourhood level
to the global (Haughton, 1999).
Integrated approaches
Integrated approaches stress on the need to take into account interconnections and
interdependencies among the three dimensions, and include transdisciplinarity and holism. To
this purpose, it is not only important to evaluate the social, environment and economic
implications of actions, but also the interrelations between these parameters promoting at
least compatible and preferably mutually reinforcing outcomes (Gibson, 2005). Thus, the key
in addressing any sustainability issues is to maximize multiple, mutually reinforcing, fairly
distributed, adaptable and lasting contributions to sustainability while avoiding significant
adverse effects. While we will surely face trade-‐offs, the aim is to find ways around or over
them wherever possible (Gibson, 2006).
Transdisciplinary and holistic approaches take the integration of disciplines a stage further the
interdisciplinary work, where not only does one transcend the boundaries of the disciplines in
seeking understanding, but actually generates new concepts and mental structures which
subsume and extend the approaches of even an interdisciplinary approach (Proops, 1999;
Clark, 2010). There are at least three examples of these approaches such as resilience
thinking, adaptive management and ecosystem stewardship. With some degree of
differentiations, these approaches address social-‐ecological sustainability recognizing that
people are integral components of social-‐ecological systems and that people affect and
respond to ecosystem processes. Thus, efforts that fail to deal with the synergies and trade-‐

CHAPTER 3
46
offs between ecological and societal well-‐being are unlikely to be successful (Chapin et al.,
2010).
Tab. 3.4 – A conceptual framework for analysing equity vis-‐à-‐vis sustainability: Integrated Approaches.
EQUITY
PERSPECTIVES
DESCRIPTION EQUITY PRINCIPLES
Distributional fairness across generations (Deontological ethics)
The legitimacy of taking only into account the preferences of present generations should be questioned in order to assure the commitment to equity between generations that sustainability represents (Padilla, 2002).
Access to and value derived from the use of natural resources should be equitable in both space and time (Kuik and Gilbert, 1999).
Justice for an imperfect world
Concentrating on how to make society more just, rather than speculating about the nature and the demands of ‘the perfectly just society’ (Sen, 2009).
Have critical scrutiny and comparative approach in assessment for identifying the major synergies, conflicts or trade-‐offs (OECD, 2008; Sen, 2009). Knowledge of the limitations and assumptions of the adopted sustainability assessment tools and a conscious attempt to bring together different ways of knowing through methodological pluralism (Norgaard, 1989; Ravetz, 2006). Efforts that fail to address the synergies and trade-‐offs between ecological and societal well-‐being are unlikely to be successful (Chapin et al., 2010).
The implications of this interpretation include changing the focus from seeking optimal states
and the determinants of maximum sustainable yield to adaptive resource management, and
adaptive governance (Walker et al., 2004).
Literature reveals definitions, themes and descriptions of sustainability reflecting emphasis
alternative given to the social, the environmental and the economic dimensions or attempts
to take into account interdependences between and across dimensions. The construction of
the framework assisted in putting deeply attention on sustainability and equity phrases in
view of clarifying intertwined connections between sustainability interpretations and main
values and perceptions of equity, disclosing similarities and divergences. These aspects are
discussed in detail in the following section.
3.3 Selecting equity perspectives
The analysis of the conceptual framework, shown in section 3.2, guided to focus on a selection
of equity perspectives concurrently matched to different approaches to sustainability. This
choice was underpinned by several insights.
PROPOSING CRITERIA TO ASSESS INTER-‐ AND INTRA-‐GENERATIONAL EQUITY IN STRATEGIC DECISIONS
47
First of all, it was possible to note that different perspectives do not always conflict each
other. Secondly, those perspectives are not mutually exclusive and largely entail others
interpretations that can be seen as particular case of the perspectives chosen. In particular,
more bonds were found between approaches to sustainability that could be related to
deontological theories. They hold that rightness or wrongness depends solely upon the nature
of an action (Glasser, 1999). Deontological beliefs are usually opposed to consequentialism.
According to consequentialism, the ‘rightness’ of actions, including rules, acts and policies,
should be judged entirely by the goodness of the consequent outcome (Tacconi and Bennett,
1995).
The most important and common belief could be synthetized with the first principle of Rawl’s
theory of justice, which claims that each person is to have an equal right to the most extensive
total system of equal basic liberties compatible with a similar system of liberty for all (Rawls,
1971, p. 250). It means to ensure primary goods, which is goods everybody needs to their
plan of life, independent of what the plan is (Rose and Kvernd, 1999). Those primary goods
are: liberty, opportunity, material welfare, income and the basis of self-‐respect (Hermans and
Knippenberg, 2006).
This perspective is also consistent with deontological ethics. In this perspective, acts
themselves can take on moral significance. Thus, some actions are simply not right regardless
of whatever consequences are expected to flow. In intra-‐generational terms, deontological
considerations demand to take into account equity of processes in addition to equity of
consequences (Osmani, 2010). Deontological perspective entails remarkably equity of
condition and distributional fairness as well. That infers an interrelated basic foundation:
pursuing equalities in condition, in other words equity based on fairly results, embraces to not
ignore differences in the outcomes likely to be experienced by different segments of the
population (Gandy, 2011).
As a consequence, having ensured primary goods, and fair equality of basic needs opportunity
for all, social and economic inequalities are to be arranged so that they are to the greatest
benefit of the least advantaged (Rawls, 1971). According to these considerations, procedural
equity and geographical equity might be seen as specific branches of the distributional
fairness perspective.

CHAPTER 3
48
Analogously, deontological positions also demand for distributional fairness across
generations. In fact, in inter-‐generational terms, a deontological or "Kantian" ethical reasoning
implies a strong bias against actions that generate present benefits but impose the risk of
irreversible future losses when scientific research would permit the effective resolution of
uncertainty over generational time. In particular, one may plausibly assert that each
successive generation holds a moral duty to ensure that the expected welfare of its children is
no less than its own perceived well-‐being (Howarth, 1995).
Looking at interspecies equity, anthropocentric foundations for environmental concerns do
not necessarily compete with ecocentrism. As Glasser (1999) claims humans can choose to
recognise biogeophysical systems value and accord them significance in decision-‐making
procedures. Thus, interspecies equity requires both distributional fairness across generations
and justice for an imperfect world perspectives if it is taken the view that a very significant
level of environmental protection can be secured solely on the basis of humanistic
environmental concerns.
This approach will implicitly need to adopt a deontological perspective as well. It is also
related to Leopold’s land ethic approach. However, this deontological perspective could be
also compatible with a more extensive interpretation of consequentialism as proposed by Sen
(1987, p. 76) “to say that action should be chosen over action y is not statement as that the
state of affairs resulting from action x, including action x done, is superior to the state of
affairs resulting from action y, including y done”. Glasser (1999) helps in understanding this
vision, explaining that the two crucial insights stressed by Sen are the importance of context
and the need to carefully consider how the character of a decision can vary as the boundaries
that define the set of “net” consequences are drawn.
Similarly, the acceptance of a deontological standard does not imply a general rejection of the
importance of taking consequences into account (Glasser, 1999). A noteworthy evidence that
deontological and consequentialist perspectives disclose some interconnections and might be
reconciled is provided in relation to ecosystem services. Farley (2012) considers that from the
consequentialist perspective, allocation decisions should give greater weight to the
preferences of those who depend the most upon ecosystem services, which will generally be
the poor, who cannot afford substitutes. This point view also accommodates distributional
fairness perspective, whose intent is to ensure vantages for the disadvantages as well.

PROPOSING CRITERIA TO ASSESS INTER-‐ AND INTRA-‐GENERATIONAL EQUITY IN STRATEGIC DECISIONS
49
These reflections might be also recognized into foundations of more integrated approaches
that seek to reconcile deontological priorities, such as non-‐compensatory values, and
consequentialism needs. Justice for an imperfect world and comparative judgement
perspectives try to resolve conflicts between compensatory and non-‐compensatory values
especially in relation to environmental and social concerns. These perspectives accept the
need of models that lie on the realm of feasibility. Given that the impossibility of defining a
perfectly just society, a theory of justice for an imperfect world aims at judging whether a
certain act or a change contribute to move from a more unjust to a less unjust state (Sen,
2009).
In this perspective, it is not deny that the irreducible plurality of values and reasoning may not
always make possible a complete agreement on the relative justness of alternative decisions
(Osmani, 2010). But, it is provided a way of acting. What is essential is to operate within a
democratic environment and compare between alternatives that differ in their degree of
justness with a critical and impartial scrutiny. Sen (2009) claims that the comparative
judgement of alternative realizations must be carried out in the framework of ‘public
reasoning’. In fact, greater access to information and broader scope for public reasoning may
reduce the range of incompleteness in judgement. This is anchored to the conviction that
arguments if appropriately motivated and justified to others on grounds could not reasonably
reject (Scanlon, 1998). Equivalently, an act is wrong if and only if it would be disallowed by any
principle that people (motivated by critical scrutiny) could not reasonably reject (Scanlon,
1998).
Two main perspectives were excluded. The first is over utilitarianism. Utilitarianism does not
attribute intrinsic value to social and economic equity (Harsanyi, 1985). The goodness of
equity is judged on the basis of its contribution to maximise the total utility of members of
society. Thus, the main critic is related to the fact that this perspective has no attention for
individual rights. In relation to intra-‐generational equity, Tacconi and Bennett (1995) consider
that if it is assumed that all people have the same utility function, which is increasing and
concave in income, total utility would be maximised by an exactly equal distribution. However,
they also recognise that this case is only hypothetical given the differences that exist in
people's preferences.

CHAPTER 3
50
Sen (1982, chapter 16) notes that individual preferences differ and a utilitarian approach
would attribute less income to a person A who receives less utility at any income level than
another person B. This distribution would maximise total utility, but A would be worse off
than B, because A receives less income than B, and further, obtains less utility from that level
of income when compared with B. In this regard, Rose and Kvernd (1999) cite even more
immediate as well as brutal example.
Theoretically, from a utilitarianism perspective, killing a healthy person and using his/her
organs for save other people may increase the total utility for society even if it represents a
violation of individual rights.
Secondly, the capability perspective was excluded for several implementation-‐based reasons:
diffuse critics, recognized also by Sen (2009) who is a strong supporter of the capability
approach, hard reconcilability with the other perspectives, recognized difficulties to deal with
capability to choose between different achievements and managing trade-‐offs (Dasgupta,
2013; Qizilbash, 2007).
In relation to sustainability, the analysis led to select four perspectives whose conceptual
underpinnings might be fully cover sustainability requirements and commitments for present
and future generations. They are accommodated as opportunity, distributional fairness, and
distributional fairness across generations, and justice for an imperfect world perspectives.
This approach provides an implementable translation of equity and sustainability, targeting
key aspects for use in decision-‐making.
Figure 3.1 and Table 3.5 show the equity perspectives selected and general principles
associated for decision-‐making.
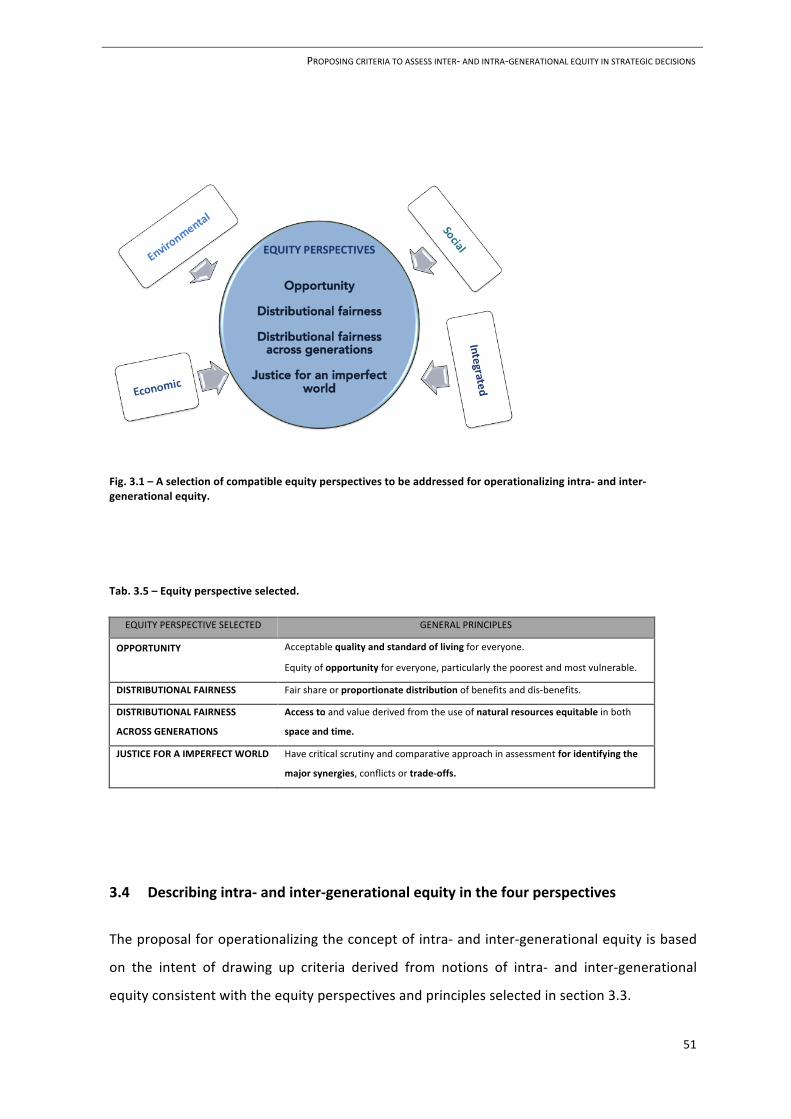
PROPOSING CRITERIA TO ASSESS INTER-‐ AND INTRA-‐GENERATIONAL EQUITY IN STRATEGIC DECISIONS
51
Fig. 3.1 – A selection of compatible equity perspectives to be addressed for operationalizing intra-‐ and inter-‐ generational equity.
Tab. 3.5 – Equity perspective selected.
EQUITY PERSPECTIVE SELECTED GENERAL PRINCIPLES
OPPORTUNITY Acceptable quality and standard of living for everyone.
Equity of opportunity for everyone, particularly the poorest and most vulnerable.
DISTRIBUTIONAL FAIRNESS Fair share or proportionate distribution of benefits and dis-‐benefits.
DISTRIBUTIONAL FAIRNESS
ACROSS GENERATIONS
Access to and value derived from the use of natural resources equitable in both
space and time.
JUSTICE FOR A IMPERFECT WORLD Have critical scrutiny and comparative approach in assessment for identifying the
major synergies, conflicts or trade-‐offs.
3.4 Describing intra-‐ and inter-‐generational equity in the four perspectives
The proposal for operationalizing the concept of intra-‐ and inter-‐generational equity is based
on the intent of drawing up criteria derived from notions of intra-‐ and inter-‐generational
equity consistent with the equity perspectives and principles selected in section 3.3.
CHAPTER 3
52
To this purpose, this section presents an overview of conceptions of intra-‐ and inter-‐
generational equity consistent with the select perspectives. Then, Section 3.5 defines a set of
intra-‐ and inter-‐generational equity criteria applicable in decision-‐making.
The considerations and the derived selection of equity perspectives made in sections 3.2 and
3.3 put attention on the importance of the nexus between intra-‐ and inter-‐generational
equity. As synthetized by Goodland (1999), it is hard to think that inter-‐generational equity
would be achieved sometime in the future without moving towards intra-‐generational equity
in the present.
This emphasis, therefore, upon greater equity as a desirable and just social goal, is intimately
linked to a recognition that, unless society strives for a greater level of social and economic
equity, both within and between regions, the long-‐term objective of a more sustainable world
is unlikely to be secured (Agyeman et al., 2002). In fact, although equity towards future
generations implies sustainability, it does not necessarily cater for fairness between people of
the same generation. It means that it is necessary for observers to consider relevant
outcomes, or impacts on the quality of life that accompany differential access to resources
(e.g. goods and services), experiences, and relationships (Gandy, 2011).
Nevertheless, fairness in the distribution of gains and losses should not disregard the
entitlement of everyone to an acceptable quality and standard of living and to equivalent
living conditions. This idea of equity derives from a concept of social justice applicable to
present and future generations: people within the same generation should have equal rights
to benefit from the use of natural resources and from the enjoyment of a clean and healthy
environment. Thus, it emerges the need that access to and value derived from the use of
natural resources should be equitable in both space and time (Kuik and Gilbert, 1999), by
adopting measures to prevent environmental degradation, as well as, avoid iniquities in the
distribution of exposition to health risk (Beder, 2000). Agyeman et al. (2002) claims that a
truly sustainable society is one where wider questions of social needs and welfare, and
economic opportunity, are integrally related to environmental limits imposed by supporting
ecosystems.
As asserted by George (1999), environmental conservation even more strongly than carrying
capacity should be preserved. Thus, when carrying capacity cannot be defined readily or is in
no immediate danger of being exceeded, the environment should be conserved anyway, to

PROPOSING CRITERIA TO ASSESS INTER-‐ AND INTRA-‐GENERATIONAL EQUITY IN STRATEGIC DECISIONS
53
the extent that future generations will want it to be conserved. It is also implicit that available
capital of non-‐renewable resources should be maintained in the long term (Brandon and
Lombardi, 2010; Clarke, 2002; Padilla, 2002; George, 1999; Howarth, 1995; Daly, 1990).
Moreover, intra-‐generational equity demands attention to inequities and discrimination (e.g.
factors such as race, age, gender, locations, income, health status, vulnerability, religion etc.).
This awareness, therefore, encompass the notion of environmental justice (EJ). EJ focus on the
fact that actions, including planning policies and practice, affecting the environment should
primarily bring attention to people who were both poor, and racial or ethnic minorities
(Gandy, 2010; Walker, 2010; Cutter, 1995). Environmental, societal and economic trade-‐offs
cannot simply be ignored in assessments because it is difficult to remedy inequalities
(Mitchell, 2003). It might infer the need for transformation of social relations, redistribution of
rights and resources, and policy approaches, which address social inequities.
Decisions are equitable if they support, promote and transmit from one generation to the
next the system of cultural and social heritage acquired (McKenzie, 2004). However, Sen
(2009) highlights that even if people is not deliberately callous about future generation’
interests, they still fail to take adequate care of the environment and the sustainability of the
requirements of good life. Thus, to prevent the negative effects, it is indispensable to have
critical scrutiny and comparative approach in assessment concentrating on how to make
society more just, rather than speculating about the nature and the demands of ‘the perfectly
just society ’ (Sen, 2009).
The comparative judgement of alternatives that differ in their degree of justness should be
realized through informed and impartial public reasoning in which critical thinking and free
exchange of information and ideas among all individuals can flourish (Osmani, 2010).
Moreover, such form of strong democracy disperses power, redistributing it downward so
that governance is less susceptible to dominance by special interests (Prugh et al., 2000). An
equitably harmonization of the interests of succeeding generations across time would also
depend on the success of the planning and transition measures to enhance and protect the
legacy left to future generations (Gibson, 2011).
Nevertheless, a net positive contribution towards intra-‐ and inter-‐generational equity would
depend on the preparedness of governments and other institutions to complement
monitoring undertaking anticipatory planning, adaptive management and enforcement
CHAPTER 3
54
(Gibson, 2011; Joint Review Panel, 2009). This is also related to the recognition that
knowledge limitations and uncertainties should be overcome by creating opportunities for
self-‐organization, strengthening of local and regional institutions and building cross-‐scale
linkages and problem-‐solving networks and bridging future development opportunities (e.g.
Slootweg and Jones, 2011; Grace, 2010; Berkes, 2007). It is therefore important to notice that
follow-‐up and monitoring are integral to dynamic and continuous focus on environmental and
socioeconomic sustainability in the view of achieving adaptive management (Slootweg and
Jones, 2011; Walker, 2010).
As mention before, the research endorses the approach of combining inter-‐ and intra-‐
generational equity in order to fully conceptualize the sustainable development notion and,
therefore, of finding a metric for operationalizing the two concepts of intra-‐ and inter-‐
generational equity. Thus, having clarified equity concerns in the light of the plurality of
approaches to sustainability, a last step forward has been taken for reconnecting intra-‐
generational and inter-‐generational equity to the equity perspectives selected.
3.5 Defining a set of intra-‐ and inter-‐generational equity criteria
The literature review on intra-‐ and inter-‐generational equity helped in converted intra-‐ and
inter-‐ generational equity concepts into criteria that accomplish the four equity perspectives
selected. Thus, compatible and consistent criteria gathered from an extensive literature were
matched with the equity perspectives selected. They seek to assists in evaluating equity in
distribution of the expected effects of decisions on present and future generations by
addressing the significant equity perspectives identified and minimizing conflict.
Criteria have a wide-‐ranging nature to allow the application to different decision contexts.
Tables from 3.6 to 3.9 present an outline of these general equity criteria by focusing on
suitable key points drawn up from them.
In regard to opportunity, essential points are to provide a clean and healthy environment and
guarantee access to basic goods (eg. water, decent house, etc.) and to transport and services
and other facilities (Hermans and Knippenberg, 2006; ODPM, 2005). In view of ensuring
fairness in accessing to and benefiting from the use of natural resources, it is therefore critical

PROPOSING CRITERIA TO ASSESS INTER-‐ AND INTRA-‐GENERATIONAL EQUITY IN STRATEGIC DECISIONS
55
to provide a range of community amenities and services available to all in the community
(Morrison-‐Saunders and Hodgson, 2009). Moreover, it is necessary to address the concept of
community and collective values (Turner, 1999) as well as to promote social inclusion by
contributing to access to proposal related opportunities for women, people in small and
remote communities (Gibson, 2011; EC, 2009).
In addition, it is important to contribute to deliver valuable and lasting overall benefits
(Gibson, 2011), making decisions in favour of achieving net gains that improve quality of life
(Morrison-‐Saunders and Pope, 2013; Gibson 2006; Therivel et al., 2009).
Tab. 3.6 – Opportunity Key Points.
GENERAL CRITERIA FOR ADDRESSING INTRA-‐ AND INTER-‐GENERATIONAL EQUITY ISSUES
OPPORTUNITY KEY POINTS
• Provide a clean and healthy environment. • Access to basic goods (e.g. water, decent house, etc.) for all. • Access to transport, services and other facilities for all. • Provide a range of community amenities and services available to all in the community. • Contribute to guarantee opportunities for women, people in small and remote communities. • Address the concept of community and collective values. • Promote social inclusion. • Making decisions in favour of achieving net gains that improve quality of life.
In relation to distributional fairness, for guarantying proportionate distribution of
environmental goods and bads (Agyeman 2002; Beder, 2000), it is important to ensure equity
of exposure, which requires the presence of a level playing field to allow groups an equal
chance of being targeted for significant environmental change, as well as, equity of impact, in
which groups should experience a proportionate share of the costs and benefits of such
change after it occurs (Maschewsky, 2005). It also implies to avoid inequities in the impacts of
environmental policies, differences in regulatory enforcement -‐ e.g. sectors of communities
who are imposed additional costs; increasing the price of certain goods (Connelly and
Richardson, 2005; Beder, 2000).
Another related point is to avoid iniquities in the distribution of exposition to health risk
(Beder, 2000), taking into account human exposure to harm and the differential sensitivity of
social group to harm and differences in adaptive capacities to respond or “bounce back” after
the harm occurs (Cutter, 2003 in Boone, 2010).

CHAPTER 3
56
Tab. 3.7 – Distributional fairness key points.
GENERAL CRITERIA FOR ADDRESSING INTRA-‐ AND INTER-‐GENERATIONAL EQUITY ISSUES
DISTRIBUTIONAL FAIRNESS KEY POINTS
• Guarantee proportionate distribution of gains and losses. • Operate without ignoring external impacts of decisions-‐from the neighbourhood level to the global. • Guarantee an equal chance of being targeted for significant environmental change and proportionate share of the
costs and benefits of such change after it occurs. • Avoid iniquities in the distribution of exposition to health risk, taking into account human exposure to harm and
the differential sensitivity of social group. • Assure social acceptability. • Avoid inequities in the impacts of environmental policies, and differences in regulatory enforcement. • Avoiding inequities in people’s ability to influence decisions affecting their environment. • Promote direct representation of the interests of disadvantaged groups. • Narrow the gap between the most deprived areas and the rest.
In order to assure social acceptability of decision-‐making (Agyeman et al., 2002), it is required
to avoiding inequities in people’s ability to influence decisions affecting their environment
(Beder, 2000) by promoting direct representation of the interests of disadvantaged groups
(Connelly and Richardson, 2005; George, 1999). It is therefore crucial to narrow the gap
between the most deprived areas and the rest so that no-‐one is seriously disadvantaged by
where they live (Brigthon & Hove City Council, 2010). Thus, it is fundamental to operate
without ignoring external impacts of decisions -‐ from the neighbourhood level to the global
(Haughton, 1999).
Focusing on distributional fairness across generations, it is needed to assess environmental,
social and economic effects and their duration (Therivel et al., 2009; Morrison-‐Saunders and
Arts, 2004) so as to preserve the integrity of ecological systems and associated life support
functions (Gibson, 2005; Clarke, 2002; Haughton, 1999), and maintain and enhance the
resilience of socio-‐ecological systems (e.g. Walker and Salt, 2006; Gibson et al., 2005). In order
to take into account the maintenance of available capital of non-‐renewable resources in the
long term (Brandon and Lombardi, 2010; George, 1999), it is therefore critical to prioritise
environmental protection and ecological integrity so that any change in the status quo results
in net environmental benefit (Morrison-‐Saunders and Hodgson, 2009). Thus, it implies to
adopt measures that minimise energy and resource use, minimise emissions and production
of waste, and maximise the re-‐use of displaced materials (EC, 2009; Page 1997; Gibson 2006).

PROPOSING CRITERIA TO ASSESS INTER-‐ AND INTRA-‐GENERATIONAL EQUITY IN STRATEGIC DECISIONS
57
Tab. 3.8 – Distributional fairness across generations’ key points.
GENERAL CRITERIA FOR ADDRESSING INTRA-‐ AND INTER-‐GENERATIONAL EQUITY ISSUES
DISTRIBUTIONAL FAIRNESS ACROSS GENERATIONS KEY POINTS
• Take into account the maintenance of available capital of non-‐renewable resources in the long term. • Preserve the integrity of ecological systems and associated life support functions. • Maintain and enhance the resilience of socio-‐ecological systems. • Assess environmental, social and economic effects and their duration. • Prioritising environmental protection and ecological integrity so that any change in the status quo results in net
environmental benefit. • Seriously consider ‘not proceeding’ as an option where there is too much scientific uncertainty about particular aspects
of a proposal or where the negative consequences of the proposal outweigh the benefits. • Adopt measures that minimise energy and resource use, minimise emissions and production of waste, and maximise
the re-‐use of displaced materials. • Adopt the precautionary principle to prevent any group, whether defined spatially, social or over time (i.e. a specific
generation), from assuming an unfair and unnecessary burden of environmental change. • Adopt a strong sustainability perspective, avoiding decisions that entail decrease in the level of natural capital passed
onto future generations. • Combines environment, social and economic consideration in a more objective way.
Moreover, to seriously consider ‘not proceeding’ as an option where there is too much
scientific uncertainty about particular aspects of a proposal or where the negative
consequences of the proposal outweigh the benefits (Morrison-‐Saunders and Hodgson, 2009).
In relation to this point, it is also important to assure equity of change, which requires the
application of the precautionary principle to prevent any group, whether defined spatially,
social or over time (i.e. a specific generation), from assuming an unfair and unnecessary
burden of environmental change (Maschewsky, 2005). Thus, a strong sustainability
perspective is needed to avoid decisions that entail decrease in the level of natural capital
passed onto future generations (Beder, 2000; George, 1999) and combines environment,
social and economic consideration in a more objective way (Eales and Sheate, 2011).
Concerning Justice for an imperfect world, fundamental point is to establish thresholds that
demarcate acceptable from unacceptable impacts for managing trade-‐offs and appropriate
processes for justifying and accounting for trade-‐offs (Gibson, 2006; Seto et al. 2012;
Morrison-‐Saunders and Pope, 2013). Moreover, to undertake climate change adaptation and
mitigation measures (Eales and Sheate, 2011; Brandon and Lombardi, 2010; EC, 2009).

CHAPTER 3
58
Finally, it is crucial to avoid “cognitive dissonance” where there is a mismatch between beliefs
and behaviour (Bond and Morrison-‐Saunders, 2011, citing Rein and Schön, 1993) by building
up community and regions, ‘sense of place’ and heritage protection (Pope et al., 2004), and
increasing trust in each other and common sense of responsibility (Wilkinson, 2012).
Tab. 3.9 – Justice for an imperfect world key points.
GENERAL CRITERIA FOR ADDRESSING INTRA-‐ AND INTER-‐GENERATIONAL EQUITY ISSUES
JUSTICE FOR AN IMPERFECT WORLD KEY POINTS
• Establish thresholds that demarcate acceptable from unacceptable impacts. • Justifying and accounting for trade-‐offs. • Undertake adaptation and mitigation measures. • Avoid “cognitive dissonance” where there is a mismatch between beliefs and behaviour • Build up community and regions, ‘sense of place’ and heritage protection • Increase trust in each other and common sense of responsibility. • Build a more diverse economic base and manage the pace and scale of development • Contribute to enhance living conditions for future generations.
3.6 Discussion and conclusion
This chapter aimed at offering a set of generally applicable criteria that could be used to
operationalizing intra-‐ and inter-‐generational equity issues in decision-‐making. To this
purpose, following the idea that intra-‐ and inter-‐generational equity could fully conceptualize
sustainability, the chapter sought to deal with two crucial demands. The first was over how
sustainability is interrelated to equity within the sustainability literature. The second
concerned the idea to identify a consistent and compatible selection of equity perspectives
and principles adopted in the sustainability debate, along which criteria for addressing intra-‐
and inter-‐generational equity issues might be developed.
The proposed approach led to capture four metrics of equity providing a means to make
equity concerns more explicit over space and time. Four positive aspects about the approach
adopted deserve attention. Firstly, it sought to provide a way for approaching the tightly
intertwined notions of equity and sustainability. In fact, the examination of equity
perspectives supported in clarifying main aspects related to the distribution of the expected
effects of decisions on present and future generations on which sustainability should be

PROPOSING CRITERIA TO ASSESS INTER-‐ AND INTRA-‐GENERATIONAL EQUITY IN STRATEGIC DECISIONS
59
founded. Secondly, the approach helped in revealing synergies and similarity of
interpretations of sustainability under the lens of equity, as well as, in focusing on general
principles according to which it is possible to prioritise analysis and assessment in decision-‐
making. The third point concerns the widespread recognition that criteria need to be specified
to respect the context involved in the analysis (Gibson, 2005). In regard to this point, the
general criteria gathered from the review of equity perspectives and sustainability might play
a role of guidance statements for specializing criteria according to context-‐placed and place-‐
based issues.
Another key advantage of using this approach is that it makes possible to undertake
assessment by taking into considerations conditions of inter-‐ and intra-‐generational equity
concurrently. It is stressed that both conditions should be simultaneously intrinsically part of
the process design, rather than a separate consideration in its own right. Thus, the proposed
key to interpreting equity in relation to sustainability might represent a streamlined way for
addressing over space and time the social, economic, and ecological dimensions of
sustainability. In this regard, for instance, a practical and interesting application of the
proposed approach might be possible in strategic planning.
Strategic decisions taken in policies, planning and programming processes, are defined as
frameworks for action. Decisions in planning are considered neither rational nor linear, nor
are value-‐free and only technical (Nelson, 2011). They seek to anticipate new trends,
discontinuities, and surprises, enhancing ways of taking advantage of opportunities
(Albrechts, 2004). Strategic decisions about the environment are undertaken with the aim of
producing a more rational organization of activities in space, including the linkages between
them; and to balance development with the need to protect the environment (CEC, 1997).
In accordance to this view, the proposed approach might offer a valid support in tackling
sustainability issues recognizing that social, economic and biophysical objectives must be
treated as interdependent factors (Gibson, 2006). In fact, over the past decade it has been
largely recognized that planning for sustainability requires different methods and a changed
paradigm from traditional planning (Rotmans et al., 2000).
A pivotal effort of strategic planning is identifying and analysing crucial and contextual factors
that might be influence the widespread and long-‐term success of current decisions (Shearer et
al. 2006; van der Heijden, 1996).

CHAPTER 3
60
The proposed approach might be seen as a first attempt to answer the demand of formal
models that link environmental assessments with economic analysis and attention to equity
issues. It is recognized that such approaches can play a crucial role on the interface between
the short-‐term and the long-‐term, the objective and value-‐laden, the quantitative and
qualitative, and the certain and uncertain (Rotmans et al, 2000).
However, there are at least two closely critical aspects of the proposed approach that need to
be acknowledged. Firstly, although the four equity perspectives considered are commonly
agreed, different points of view evidently exist. It is a matter of personal perceptions.
It is clear that univocal and absolute answer is not possible. Nevertheless, having discussed
and reached an agreement on perspectives to be adopted in assessment, the proposed equity
framework might be useful for formalizing shared equity perspectives in decision-‐making by
incorporating quantifiable and feasible related criteria.
A second interrelated aspect refers to the selection of general equity criteria. Being aware of
the vast interdisciplinary area that links concepts of sustainability and intra-‐ and inter-‐
generational equity, no claims were made to being comprehensive in translating the chosen
equity perspectives into general criteria. It is important to point out that this study lays some
methodological foundations on how to address equity in strategic assessment, but they might
be refined and enriched by other substantive insights. For instance, the most important area
of more investigation is over how to establish suitable criteria for better covering social
distributional implications across generations.
These findings provide several insights for future research. However, a prior starting point for
further work should be to test the applicability of the equity criteria approach designed to a
case study. It should be a useful way for verifying limitations and constraints of the method on
the ground. In light of the insights emerged from this chapter and the focus of the research,
two essential aspects needed to be examined in view of applying the method.
The first concerned the choice of a specific area of investigation. The second was over the
need of flashing out this area in view of providing all the elements required for contextualizing
the equity criteria.
The attention was directed to the Oil & Gas sector for the challenge posed to sustainability
and, consequently, for the efforts required for making decisions at strategic level.

PROPOSING CRITERIA TO ASSESS INTER-‐ AND INTRA-‐GENERATIONAL EQUITY IN STRATEGIC DECISIONS
61
Next chapters will be devoted to describe and discuss the work undertaken for testing the
equity criteria method against a case study in the Oil & Gas sector. Specifically, Chapters 4 and
5 will flesh out sustainability in relation to SEA of Oil & Gas practice, while Chapters 6 and 7
will be devoted to on-‐shore Oil & Gas application to the “Val d’Agri Oil fields” (Southern
Basilicata, Italy).
As a note of terminology, from now on, I will use “equity” interchangeable with “inter-‐ and
inter-‐ generational equity”, given that the set of equity criteria presented in this chapter are
suggested for addressing inter-‐ and inter-‐ generational equity concurrently.


Part II
Case study review and applications in the Oil & Gas sector

Chapter 4
4. Reviewing sustainability assessments of Oil & Gas developments2
4.1 Introduction
Oil & Gas development is a controversial source of opportunities and challenges. Given the
expected revenues, Oil & Gas developments represent a potentially substantial source of
revenue to promote local and regional development. However, unacceptable environmental
and societal trade-‐offs may also be triggered, such as an unfair distribution of economic
benefits and environmental burdens. The expansion of Oil & Gas exploitations is hardly
sustainable in the long-‐run, given that these resource are non renewable and their availability
is limited (Government of Saskatchewan, 2007).
Oil & Gas production, transport and use can also raise deep environmental and social
concerns, which need to be assessed and strategically managed. Potential negative
consequences include damage to habitats and biodiversity, water and soil contamination,
greenhouse gas emissions, regional air pollution (and connected problems, such as forest
degradation and acid rain), and local air pollution, which pose a threat to human health
(NORAD and World bank group, 2009). Additionally, the potential environmental implications
stemming from Oil & Gas activities can, in turn, generate dangerous ripple effects on other
socio-‐economic sectors.
An emblematic case is offshore oil-‐spills damaging local activities such as fisheries, tourism
and agricultural practice (Norwegian Ministry of Environment, 2009). Moreover, it is generally
recognised that locals hardly benefit from the large revenues generated by Oil & Gas
activities.
2 This chapter is based on: Lamorgese, L, Geneletti, D, Partidário, MR. Sustainability principles in strategic environmental assessment: A framework for analysis and examples from Italian urban planning (currently under review).

CHAPTER 4
66
As a result, environmental assessment in the Oil & Gas sector has attracted increasing
attention from governments, oil companies, and the general public (The World Bank, 2010).
Thus, in the light of a growing international debate about the risks and benefits of Oil & Gas
activity, the imperative need to shift planning and impact assessment processes towards more
strategic and sustainability-‐based models is strongly emphasized (Fidler and Noble, 2012;
Norwegian Ministry of Environment, 2009).
The reasons above lead to reflect on suitable tools to deal with this complex mix of
sustainability challenges. As mention in Chapter 1 and 2, this research recognises and follows
the idea that SEA is an important instrument to promote sustainability-‐driven decision-‐
making. In fact, provided the strategic thinking it enables, and when asking strategic-‐level
questions and concerns in a participatory context, SEA can enhance opportunities for fully
integrated and more sustainable decision-‐making processes and outcomes (Pope and Dalal-‐
Clayton, 2011; Partidário, 2007b; Morrison-‐Saunders and Therivel, 2006).
This chapter aims at exploring to what extent current SEA for the Oil & Gas sector contributes,
procedurally and substantively, to more strategic and sustainability-‐oriented decisions. To this
purpose, I will use a framework for reviewing SEA practise based on the strategic thinking
model for SEA developed by Partidário (2012, 2007b) and a review framework proposed by
Partidário et al. (2009), and apply it to 11 case studies related to both off-‐shore and on-‐shore
Oil & Gas developments. In Section 4.2 I will flesh out on relevant issues in SEA of Oil & Gas
sector. Then, I will present the review framework and the selection of case studies (Section
4.3 and 4.4). Results are illustrated and discussed in Section 4.5. Finally, Section 4.6 provides
some conclusions.
4.2 Sustainability Assessment for the Oil & Gas sector
It has been increasingly recognized that SEA has the potential to address sustainability
concerns during policies, plans and programmes making (e.g. Pope and Dalal-‐Clayton, 2011;
Partidário, 2007b; Morrison-‐Saunders and Therivel, 2006). The contribution of SEA to
sustainability can be linked to two intertwined questions: substantively, to what extent SEA is
sustainability-‐oriented by addressing mutually beneficial outcomes, using an integrative
approach across the classic environmental, social and economic pillars (Gibson, 2006) and,

REVIEWING SUSTAINABILITY ASSESSMENTS OF OIL & GAS DEVELOPMENTS
67
procedurally, to what extent SEA is strategic in defining the means useful for pursuing these
outcomes (Gardner, 1989).
Concerning the first question, SEA should shift towards a holistic and integrated assessment
that aims at maximizing net gains, while avoiding trade-‐offs that would cause unacceptable
impacts (Gibson, 2006, Morrison-‐Saunders and Pope, 2013). As to the second question,
Partidário (2007b) argues that SEA should strive for strategic thinking rather than technical
assessment that simply satisfies an assessment process. Strategic-‐based SEA puts a lot more
emphasis on policy contexts, integration and long-‐term perspectives, strategic options,
participation, communication, guidelines for implementation and monitoring (Partidário et al.,
2009). For this purpose, a strategic thinking model for SEA should entail technical, process and
communication components tailor made to, and well articulated with, the processes of
decision-‐making (Partidário, 2012; 2007b). Acknowledging the two aspects present significant
overlaps, it is broadly accepted that sustainability relies on a mixture of substantive and
process-‐oriented assessment (e.g. Morrison-‐Saunders and Pope, 2013; Partidário, 2007a;
Gibson, 2006; Gardner, 1989).
The regulatory framework for SEA in the Oil & Gas sector varies largely across different
contexts. In some cases, the general SEA regulations and legislation apply (e.g. countries with
consolidated environmental and SEA rules, such as European Union and Australia), whereas
others countries developed specific requirements (e.g., Bolivia: Ministerio de Hidrocarburos y
Energia, 2011, and Brazil: Teixeria, 2008). At the international level, the World Bank and the
Netherlands Commission for Environmental Assessment (NCEA) provided assistance in
developing tailor-‐made Term of References for SEA of Oil & Gas, particularly in Africa and
America Latina (Foluke, 2012; NCEA, 2012; 2009).
Other countries, such as Ghana and Mauritania, have developed ToR for SEA of Oil & Gas
processes with a view of strengthening their national environmental impact assessment
legislation. In fact, specifically for the Oil & Gas sector, SEA is expected to play a central role in
dealing with sectoral concerns and regional-‐scale resource management issues of interest to
all stakeholders (Fidler and Noble, 2012; Johnson et al., 2011; CCME, 2009; Harriman and
Noble, 2008; Horvath et al., 2004).
CHAPTER 4
68
By considering the difficulty of evaluating all the elements potentially affected by Oil & Gas
development, it is necessary to focus on those aspects that can act as indicators of
environmental and societal change, such as Valued Ecosystem Components (VECs) (see
Ekanlands and Duinker, 1983) or Critical Decision Factors (CDFs) (see Partidário, 2012; 2007b).
Horvath et al. (2004) stress the need to take into adequate consideration cumulative
environmental effects of potential full-‐scale offshore Oil & Gas development over time (e.g.
exploration and eventual development in the event that a significant discovery is made) as
well as adequate public input into scoping and decision-‐making.
Analogously, Noble (2008) underlines the limits of practices concentrated on describing the
current state of the environment or modelling past and present stressors and responses,
rather than helping in projecting trends and discerning desirable future in a long-‐term
perspective. The identification and comparison of alternatives represent a key element to
support the discussion of possible future scenarios and the identification of key environmental
goals and objectives (Fidler and Noble, 2012; Gunn and Noble, 2011; Fisher, 2007).
SEA of Oil & Gas is also seen as a way to promote the integration of social issues related to Oil
& Gas development, in terms of both potential impacts and stakeholder involvement. This is
stressed in some of the available guidance documents (e.g. TNEM, 2012; RIM and World Bank,
2011). Assessments for offshore and onshore Oil & Gas development should give strong
attention to the expectations of populations, focusing on concrete results in terms of
transparency, equitable sharing of the benefits, and compensation for the population
negatively affected from an environmental and social perspective (RIM and World Bank,
2011).
Consideration of the effects on indigenous societies is required by several SEA approaches
(Ministerio de Hidrocarburos y Energia of Bolivia, 2011; Government of Québec, 2011;
Department of State Development Government of Western Australia, 2010). Following the
strategic-‐based model developed by Partidário (2007b), a Brazilian proposal for SEA in Oil &
Gas sector (Teixeira, 2008) claims that beyond facilitating transparent and participative
processes, a more integrated SEA of Oil & Gas should engender better understanding of
environmental constraints and more social control on decisions on Oil & Gas development, as
well as reducing potential conflicts in management and use of environmental resources
related to Oil & Gas development.

REVIEWING SUSTAINABILITY ASSESSMENTS OF OIL & GAS DEVELOPMENTS
69
4.3 A framework for reviewing SEA practice
The study adopted, and adapted, a framework used for reviewing SEA practice in Portugal
(Partidário et al., 2009), based on an innovative strategic-‐based model for SEA (Partidário,
2012; 2007). The framework criteria cover focal elements for enhancing SEA practice:
adoption of a strategic reference framework, including environmental and sustainability;
framework objectives; proactive integration and long-‐term scope (as opposed to reactive
effects-‐based); clear identification and assessment of alternative strategic options; strong
linkage and interactivity of the SEA and planning processes; early community and stakeholders
engagement throughout the process; good communication and capacity to influence decision-‐
making; guidelines for implementation rather than mitigation of expected effect; and
monitoring and evaluation programme, enabling learning processes.
These criteria are translated in eight assessment parameters (object of assessment, entry
point, interactivity, scope of assessment, strategic reference framework, process,
participation, proposal for follow-‐up), some of which divided into sub-‐parameters, and
corresponding key questions.
With respect to the original framework, what we propose here adds one more assessment
parameter (findings/outcomes), expands the contents of the process parameter, and
integrates the key-‐questions with other relevant elements coming from the literature review
of SEA of Oil & Gas activities: consideration of cumulative effects and uncertainty, long-‐term
perspective, environmental integrity and socio-‐economic effects, analysis of trade-‐offs (Table
4.1).
For each question, a set of pre-‐defined categories has been identified. Each of these
categories, with the exception of the parameter techniques, is then classified using a four-‐
level scale: high, good, moderate and poor achievement.
The last column of Table 4.1 shows the distribution and ranking of these categories. “High”
indicates that category represents the most significant contribution to more strategic and
sustainability-‐oriented assessment. “Good” indicates categories significant but less than the
formers, representing actions and examples that go beyond legal requirements. For instance,
category “others” was ranked as good. Categories ranked “moderate” denote modest
contribution towards sustainability (e.g. actions in accordance to strict legal fulfilment). Those

CHAPTER 4
70
ranked “poor” indicate low or no contribution to more strategic requirements in the
assessment.
Below there are two illustrative examples of how categories were ranked. For the question
“How land use implications were addressed?”, the four possible categories -‐ restriction in use,
others (e.g. application of best practise for dealing with waste, wastewater discharges, action
that can support precautionary approaches), adoption of mitigation and compensation
measures, no -‐ were respectively ranked: high, good, moderate, and poor achievement.
Similarly, for the question “How were alternatives considered?”, the five not necessarily
mutually exclusive categories -‐ alternatives in terms of other development options for the
area, alternatives in degree of exploitation/intensity of Oil & Gas activities, alternatives in
location, “zero alternative”, no alternatives considered -‐ were respectively ranked: high, good,
good, moderate, and poor.

REVIEWING SUSTAINABILITY ASSESSMENTS OF OIL & GAS DEVELOPMENTS
71
Tab. 4.1 – Framework for reviewing SEA practice (adapted and integrated from Partidário et al., 2009). ASSESSMENT PARAMETER
SUBPARAMETER KEY QUESTIONS CATEGORIES LEVEL OF ACHIEVEMENT
1-‐ Object of assessment
What were the motivations?
Explicitly addressing sustainability High Mainly economic and social with a firm focus on environmental concerns
Good
Mainly economic and social Moderate Predominantly economic Poor
2 -‐ Entry point At what stage of planning did SEA start?
At start-‐off High Model Good Diagnosis Moderate Development proposals Poor
3 -‐ Interactivity What was the degree of integration and feedback between assessment and planning activities?
High High
Medium Good
Low Moderate
Not verifiable Poor
4 -‐ Scope of assessment
What was the scope of assessment?
Holistic and integrated High Social+biophysic+economic+political Good Physical and territorial Moderate
5 -‐ Strategic Reference Framework
How was the Strategic Reference Framework defined and used?
A broad set of macro-‐policies relevant for the assessment settled (including also sustainable development strategies, biodiversity strategies, land-‐use planning policies, energy policies, climate change related strategies, etc.)
High
Mainly focused on energy policies and licensing aspects (to prospect, explore and produce hydrocarbons)
Moderate
Ignored Poor 6 -‐ Process Objective What was the purpose of
assessment? Beyond legal requirements Good Strict legal fulfilment Moderate
Consideration of alternatives (in space and time)
How were alternatives considered?
Alternatives in terms of other development options for the area
High
Alternatives in degree of exploitation /intensity of oil & gas activities
Good
Alternatives in location Good “zero alternative” Moderate No alternatives considered Poor
Environmental issues
How the protection of biological diversity and the maintenance of essential ecological processes and life-‐support systems were ensured?
Restriction in use and protection of area with presence of higher-‐valued species
High
Adoption of environmental thresholds High Evidence of environmental net benefits High Others Good Adoption of mitigation and compensation measures
Moderate
How land use implications were addressed?
Restriction in use High Others Good Adoption of mitigation and compensation measures
Moderate
No Poor Socio-‐economic effects
Were there demonstrated net benefits for local communities?
Yes High
Partially addressed Moderate
No Poor
Was there expressed how needs, values and expectations of stakeholders were taken into account? (Haughton, 1999)
Yes High
Partially addressed Moderate No Poor
Was there an explicitly consideration of health issues?
Yes High
Partially addressed Moderate
No Poor
Analysis of trade-‐offs
Was there an explicitly treatment of sustainability trade-‐offs?
Yes High
Partially addressed Moderate
No Poor

CHAPTER 4
72
Tab. 4.1 – Framework for reviewing SEA practice (continued). ASSESSMENT PARAMETER
SUBPARAMETER KEY QUESTIONS CATEGORIES LEVEL OF ACHIEVEMENT
6 -‐ Process Distributional analysis
Was there any assessment of consequences on identified groups or individuals affected by the plan?
Yes High
Partially addressed Moderate
No Poor
Long-‐term perspective
Were there explicitly analysed benefits and constraints in the long run?
> 25 years High
10 – 25 years Good
<10 years Moderate
Without a temporal scale Moderate No Poor
Consideration of cumulative effects
Was there an analysis of cumulative effects?
Quantitative analysis High Qualitative analysis High Partially addressed Moderate No Poor
Techniques What diagnosis and assessment techniques were used?
Analysis of risks and opportunities Cost-‐benefit analysis Analysis of alternatives Analysis of scenarios Analysis of impacts/effects Use of Indicators Analysis of current situation and trends Others
Uncertainty Was the treatment of uncertainty ensured?
Dealing with uncertainty High Disclosing only gaps Moderate No Poor
Compatibility Was there an analysis of compatibility between strategic objectives?
Yes High
No Poor
Weighting Was there any kind of weighting in the assessment?
Yes High
No Poor
7-‐ Participation
What kind of stakeholder engagement was assured?
Extensive community consultation process along all phases of the assessment procedure
High
Extensive communication strategy Good Strict legal fulfilment Moderate No participation Poor
Was the position of less powerful groups taken into account?
Yes High No Poor
8 -‐ Findings/ outcomes
Were outcomes in line with declared strategic vision and objectives?
Complete overlap High Partially addressed Moderate No Poor
9 -‐ Proposal for follow-‐up
Governance framework
Is there a governance framework to ensure responsibility in SEA follow-‐up?
Yes High Partially addressed Moderate No Poor
Guidelines for planning and management
Are there guidelines for follow-‐up?
Yes High
No Poor
Monitoring Is there a monitoring plan?
Yes High No but it is recommended/required Moderate No Poor

REVIEWING SUSTAINABILITY ASSESSMENTS OF OIL & GAS DEVELOPMENTS
73
4.4 Review of practice
Case studies were identified through Internet searches of accessible SEA reports in the Oil &
Gas sector carried out during the period June/July 2012. SEA reports were searched by using
key words such as “SEA” and “Oil & Gas”, “SEA and Petroleum”, “SEA and Hydrocarbons”, “SEA
offshore, SEA onshore”, as well as by looking at useful websites identified from literature
articles and reports. The search resulted in miscellanea of articles, reports, and papers in the
field. Despite this, a limited number of full SEA reports were reviewed. The selection was
restricted to documents available in English and covering different geographical areas and
economic conditions (e.g. developed/developing countries), as well as including both offshore
and onshore experiences. Eventually, this search resulted in 11 case studies concerning
assessments at national or regional levels, at different stages of development of Oil & Gas
activities (first exploration activities, expansion of Oil & Gas development, realization of
production facilities), and related to inland or sea activities (offshore, onshore, or both).
They reflect examples of the broad range of SEA procedures, including also Strategic
Environmental and Social Assessment (SESA), Social Impact Assessment (SIA), Strategic
Environmental Impact Assessment (SEIA), strategic-‐based SEA and Regional EA, EIA-‐based as
well as strategic model based SEA.
Fig. 4.1 – Map of country case studies.

CHAPTER 4
74
The set of case studies resulting from this search was considered adequate for testing the
framework and inferring substantive and essential reflections. Table 4.2 provides the list of
the 11 SEA reports and the general purpose of proposals to which the SEAs relate.
Their geographical distribution is shown in Figure 4.1.
Tab. 4.2 – Selected SEA reports.
ID Country Year SEA Case Study AU AUSTRALIA 2010 Strategic assessment of the Browse Basin liquefied natural gas precinct.
BO BOLIVIA 2011 Propuesta de Guia de Evaluacion Ambiental Estrategica del Sector Hidrocarburos. (A Proposal for SEA guidance in Oil & Gas Sector)
CA1 CANADA 2003 Strategic Environmental Assessment of Laurentian Subbasin.
CA2 CANADA 2007 The Great Sand Hills Regional Environmental Study: Final Report.
CA3 CANADA 2011 Strategic Environmental Assessment of Oil and Natural Gas Exploration and Development in the Anticosti, Madeleine and Baie des Chaleurs Basins (SEA2).
CI CIPRO 2008 Strategic Environmental Assessment concerning Hydrocarbon Activities within the Exclusive Economic Zone of the Republic of Cyprus.
GL GREENLAND 2011 Eastern Baffin Bay -‐ A strategic environmental impact assessment of hydrocarbon activities. Prepared by the Danish Centre for Environment and Energy and the Greenland Institute of Natural Resources.
IL ICELAND 2007 Oil exploration in the Dreki area on the Jan Mayen Ridge. Proposal for a plan to offer exclusive exploration and production licences for Oil & Gas in the Dreki area (Dragon area) on the Jan Mayen Ridge, northeast of Iceland and a Strategic Environmental Assessment (SEA) of the proposed plan.
MA MAURITANIA 2011 Strategic Environmental and Social Assessment of Oil & Gas Development in Mauritania.
UK1 UNITED KINGDOM
2009 Strategic Environmental Assessment Future Leasing for Offshore Wind Farms and Licensing for Offshore Oil & Gas and Gas Storage -‐ Environmental Report.
UK2 UNITED KINGDOM
2010 Strategic Environmental Assessment for a 14th – and subsequent –onshore Oil & Gas licensing round.
4.5 Results and discussion The results, broken down by questions, are presented in Table 4.3. Figure 4.2 summarises the
results broken down by SEA reports, by presenting the percentage of high, medium, moderate
and poor levels globally achieved for each case study. Figures 4.3 and 4.4 summarise the
performance of the SEA reports under the proposed categories to illustrate substantive and
procedural key questions, such as environmental issues, socio-‐economic effects, participation,
long-‐term perspective and findings/outcomes of assessment.

REVIEWING SUSTAINABILITY ASSESSMENTS OF OIL & GAS DEVELOPMENTS
75
Fig. 4.2 – Performance under the assessments parameters broken down by SEA reports.
In general, the report at least partially addressed the strategic vision and declared objectives.
Partial fulfilments are more evident in case studies that pose a firm focus on environmental
concerns rather than explicitly include sustainability implications. This may be explained by
the fact that addressing sustainability imposes a greater range of cross-‐cutting considerations
that need to be contemplated in comparison with cases that have a firm focus on
environmental concerns. A detailed discussion of the results broken down by groups of
assessment parameters follows.

CHAPTER 4
76
Tab. 4.3 – Summary of results.
ASSESSMENT PARAMETERS
KEY QUESTIONS CATEGORIES LEVEL OF ACHIEVEMENT
AU
BO
CA1
CA2
CA3
CI
GL
IL
MA
UK1
UK2
1 What were the motivations?
Explicitly addressing sustainability High √ √ √ √ Mainly economic and social with a firm focus on environmental concerns
Good √ √ √ √ √ √ √
Mainly economic and social Moderate √ Predominantly economic Poor √ √ √ √ √ √
2 At what stage of planning did SEA start?
At start-‐off High √ Model Good Diagnosis Moderate √ √ √ √ Development proposals Poor √ √ √ √ √ √
3 What was the degree of integration and feedback between assessment and planning activities?
High High √ √ √ √
Medium Good √
Low Moderate √ √ √ √
Not verifiable Poor √ √
4 What was the scope of assessment?
Holistic and integrated High √ √ √ √ Social+biophysic+economic+political Good √ √ √ √ Physical and territorial Moderate √ √ √
5 How was the Strategic Reference Framework defined and used?
A broad set of macro-‐policies relevant for the assessment settled (including also sustainable development strategies, biodiversity strategies, land-‐use planning policies, energy policies, climate change related strategies, etc.)
High √ √ √ √ √ √ √ √ √
Mainly focused on energy policies and licensing aspects (to prospect, explore and produce hydrocarbons)
Moderate √ √
Ignored Poor 6 What was the purpose of
assessment? Beyond legal requirements Good √ √ √ √ √ Strict legal fulfilment Moderate √ √ √ √ √ √
How were alternatives considered?
Alternatives in terms of other development options for the area
High √
Alternatives in degree of exploitation /intensity of oil & gas activities
Good √ √ √ √ √ √
Alternatives in location Good √ √ √ √ √ √ √ √
“zero alternative” Moderate √ √ √
No alternatives considered Poor √ √
How the protection of biological diversity and the maintenance of essential ecological processes and life-‐support systems were ensured?
Restriction in use and protection of area with presence of higher-‐valued species
High √ √ √ √ √ √ √
Adoption of environmental thresholds High √ Evidence of environmental net benefits High √ √ √ Others Good √ √ √ √ √ √ √ √ √ Adoption of mitigation and compensation measures
Moderate √ √ √ √ √ √ √ √
How land use implications were addressed?
Restriction in use HIgh √ √ √ √ √ √ √ Others Good √ √ √ √ √ √ √ √ √ √ Adoption of mitigation and compensation measures
Moderate √ √ √ √ √ √ √ √ √
No Poor Were there demonstrated net benefits for local communities?
Yes High √ √
Partially addressed Moderate √ √ √
No Poor √ √ √ √ √ √
Was there expressed how needs, values and expectations of stakeholders were taken into account? (Haughton, 1999)
Yes High √ √ √
Partially addressed Moderate √ √ √
No Poor √ √ √ √ √
Was there an explicitly consideration of health issues?
Yes High √ √
Partially addressed Moderate √ √ √
No Poor √ √ √ √ √ √
Was there an explicitly treatment of sustainability trade-‐offs?
Yes High √ √ √ √ Partially addressed Moderate √ √ √
No Poor √ √ √ √ Was there any assessment of consequences on identified groups or individuals affected by the plan?
Yes High √ √
Partially addressed Moderate √ √ √
No Poor √ √ √ √ √ √
Were there explicitly analysed benefits and constraints in the long run?
> 25 years High √ √ √ √ √ 10 – 25 years Good √ √ √ √
<10 years Moderate √ √ √ √ √ √
Without a temporal scale Moderate √ √
No Poor √

REVIEWING SUSTAINABILITY ASSESSMENTS OF OIL & GAS DEVELOPMENTS
77
Tab. 4.3 – Summary of results (continued). ASSESSMENT PARAMETERS
KEY QUESTIONS CATEGORIES LEVEL OF ACHIEVEMENT
AU
BO
CA1
CA2
CA3
CI
GL
IL
MA
UK1
UK2
6 Was there an analysis of cumulative effects?
Quantitative analysis High Qualitative analysis High √ √ √ Partially addressed Moderate √ √ √ √ √ √ √ √ √ No Poor √
What diagnosis and assessment techniques were used?
Analysis of risks and opportunities √ √ √ √ √ √ Cost-‐benefit analysis Analysis of alternatives √ √ √ √ Analysis of scenarios
√ √ √ √ √ √
Analysis of impacts/effects √ √ √ √ √ √ √ √ √ √ √ Use of Indicators √ √ √ √ √ √ √ √ Analysis of current situation and trends
√ √ √ √ √ √ √ √ √ √ √
Others √ √ Was the treatment of uncertainty ensured?
Dealing with uncertainty High √ √ √ √ √ √ √ √ √ √ Disclosing only gaps Moderate No Poor √
Was there an analysis of compatibility between strategic objectives?
Yes
High √ √ √ √
No Poor √ √ √ √ √ √ √
Was there any kind of weighting in the assessment?
Yes
High √ √ √ √ √ √ √
No Poor √ √ √ √
7
What kind of stakeholder engagement was assured?
Extensive community consultation process along all phases of the assessment procedure
High √ √ √ √
Extensive communication strategy Good √ √ √ √ √ Strict legal fulfilment
Moderate √ √ √ √ √ √
No participation Poor √ Was the position of less powerful groups taken into account?
Yes High √ √ √ √ √ No Poor √ √ √ √ √ √
8 Were outcomes in line with declared strategic vision and objectives?
Complete overlap High √ √ √ √ Partially addressed Moderate √ √ √ √ √ √ √ No Poor
9 Is there a governance framework to ensure responsibility in SEA follow-‐up?
Yes High √ √ √ √ √ √ Partially addressed Moderate √ √ No
Poor √ √ √
Are there guidelines for follow-‐up?
Yes High √ √ √ √ √ √ √
No Poor √ √ √ √
Is there a monitoring plan? Yes High No but it is recommended/required Moderate √ √ √ √ √ √ √ √ √ √ √ No Poor/No

CHAPTER 4
78
Fig. 4.3 – Performance of the SEAs under the proposed categories that illustrate substantive questions.
Fig. 4.4 – Performance of the SEAs under the proposed categories that illustrate procedural questions.

REVIEWING SUSTAINABILITY ASSESSMENTS OF OIL & GAS DEVELOPMENTS
79
Motivations, scope of assessment and interactivity
With respect to motivations, the case studies can be divided into two groups: those that lean
towards a predominantly economic justification for the assessment, showing also a firm focus
on environmental concerns, and those that explicitly address sustainability.
As shown in Table 4.3, the first group (7 cases) focuses on how to assist competent authorities
in determining to what extent hydrocarbons licenses, depending on the specific case for
prospecting, exploration or exploitation activities, should be offered in whole or in part for the
areas of interest, without compromising biodiversity and ecosystem function, material assets
and other users. The second group (4 cases) shows more articulated and integrated goals. The
purpose is to provide strategic recommendations to guide activities so that the long-‐term
ecological integrity of the area is maintained, while a corresponding level of environmental,
socio-‐cultural, and economic benefits are realized.
Concerning the scope of the assessment, two different integrated approaches emerge. The
first one (e.g. CA2, CA3) is based on the selection of VECs that include not only crucial aspects
of the physical and biological environment, but also of the human environment. The second is
based on the identification of Critical Decision Factors (MA). The main difference is that the
first approach defines the focus of the integrated assessment on the basis of baseline data
(especially environmental data), and literature review on hydrocarbons environmental
impacts, guidelines and regulations for the sector, while the second approach integrates a
broad range of social, environmental and economic issues and embarked on extensive
engagement with stakeholders. Even though VECs and CDFs are selected for specific case
studies, it is possible to identify common concerns related to biodiversity (marine and
terrestrial), water, air emissions, governance, safety and risk management of oil spills.
However concerns with, for example, social benefits and community livelihoods is more
evident in the CDF approach.
It is interesting to note that, even in cases guided by sustainability motivations, SEA typically
starts at the stage of diagnosis or development of proposals. This is mainly the case for SEA of
Oil & Gas activities required as part of the permit conversion process, and in anticipation of
interest in the area. On the contrary, a direct connection between sustainability motivations
and high level of interaction during the procedures cannot be detected. High degree of

CHAPTER 4
80
integration and feedback between assessment and planning activities is shown in case studies
that aim at ensuring a consistent approval process and facilitating the implementation of SEA
findings into a coherent policy (e.g. organizations of meetings among the institutions involved,
such as committee on oil exploration affairs, editorial committee, and specific working group
involving expert on specialized areas). Remarkably, in a specific case (CA3), the relevance of
the indications provided by the preliminary SEA report promptly led to adopt an act to
prohibit Oil & Gas activities in a portion of the area under examination.
Strategic reference frameworks
The review showed that, irrespective of assessment motivations, a broad set of macro-‐policies
relevant for the assessment were generally referred to. These include:
• country energy policies (especially in terms of security of energy supply) and Oil & Gas
licensing and control policies;
• environmental protection policies, at national as well as international level (e.g.
environmental protection act, international nature protection conventions, biodiversity,
climate change and land-‐use planning strategies, international conventions and
protocols for marine protection).
Specific guidance for environmental management in Oil & Gas exploration and production are
also mentioned. However, reports related to developing countries (MA, BO) also highlight a
lack of consolidated legal frameworks and the need to elaborate clear methodologies for the
whole hydrocarbons sector.
Process and Participation
Moving to process aspects, the review showed a mixture of examples that follow legal
requirements and that seek to achieve more integrated assessment. Generally, analyses of
alternatives are carried out in terms of location and degree of exploitation/intensity of Oil &
Gas activities. Two interesting cases provide examples of more strategic-‐based approaches.
The first one (CA2) considers alternatives in terms of other possible development options for
the area beyond the Oil & Gas activities, focusing on limitations and opportunities for the

REVIEWING SUSTAINABILITY ASSESSMENTS OF OIL & GAS DEVELOPMENTS
81
coexistence of other activities (e.g. agricultural practice, including farming and ranching,
recreation).
The second one (AU) describes an articulated site selection process preliminary conducted for
selecting the potential best site for the project facilities, based on an extensive consultation
process that involved the local community, traditional owners, non-‐government
organisations, and relevant institutions. However, even if participatory aspects are generally
taken into considerable account, needs, values and expectations of stakeholders are often
only partially addressed or not at all taken into account.
Health issues are mostly missed or partially addressed. In the European examples, existing
environmental regulatory controls would be considered quite sufficient to minimise potential
effects on human health and communities. AU and CA3 propose specific health impact
management strategies, such as informing the general public about risks at all management
levels, improving health and social services in the areas interested by the proposal, and
environmental monitoring plans targeted at health risk assessment.
Peculiar participatory experiences (AU, MA) include public comments asked at stage of
definition of Terms of Reference for the strategic assessment and wide consultation of all
stakeholders during the definition of the strategic vision for the exploitation of the
hydrocarbons resources. In some cases the public have been involved in scoping exercise
focusing on existing biophysical and socio-‐economic issues. In one experience (MA) training
activities on the SEA process have been offered by involving institutions in the process (e.g.
brainstorming, group exercises and workshops during the all main stages of the procedure).
A common action for maximizing the benefits of consultation procedures is to set up steering
Committees enlarged with representatives of institutions, organizations, NGOs, civil society
and community. However, enhancing the involvement of less powerful groups in decision is
only related to contexts in which Oil & Gas activities interfere with habits, traditions, customs
of indigenous people and traditional owners (e.g. AU, BO, CA3).
Outcomes, uncertainty and governance
The case studies, with different degree of confidence, display some limitations and constraints
in fully addressing the strategic vision and objective declared. Generally, the SEAs focus on key
factors and analyse potential interactions on the basis of existing knowledge regarding the

CHAPTER 4
82
potential effects of offshore and onshore activities. Just in few cases some evidences of
environmental net benefits are made explicit. For example, as proposed in AU, adopting a
single infrastructure for processing Oil & Gas reserves, instead of multiple developments,
could help in minimizing the environmental footprint of Oil & Gas processing in the long-‐run.
CA2 also includes a cost opportunity analysis that show how opting for expansion of land area
protected, excluded by Oil & Gas future development, could not determine drastic loss of
revenues.
All environmental reports disclose gaps of knowledge and the impossibility to anticipate all
possible effects on the delicate ecosystems that are often involved in the Oil & Gas activities.
Thus, mitigation measures and applicable compliance standards are broadly considered.
Recommendations associated with implementation of proposals also include provisions of in-‐
depth analysis. However, some cases, such as CI and IL, provide for more detailed studies to
be conducted only at the project-‐stage, while others, such as AU, CA2 and GL, set up
prescriptive requirements, consistently with the precautionary principle (e.g. to subordinate
proposals to the effective demonstration of their compatibility).
Management actions that limit disturbing activities usually connected to Oil & Gas activities
are considered essential. The SEAs, such as AU and CA2, that seek to deal more effectively
with lack of information and uncertainty, recognize that it is not sufficient to adopt best
management practices in Oil & Gas activities. The precautionary principle should also be
applied to maintain the ecological integrity of the affected areas.
The case studies show different degree of details in providing recommendations of what
should be included in monitoring plans behind operative measurements for controlling Oil &
Gas operations. For example, AU, MA, CA3 and GL propose a more articulated management
framework that requires integrated and coordinated interaction between authorities at
different levels. MA, UK1 and IL underline the importance to establish a dedicated spatial
information system to assist in the integrated planning of Oil & Gas activities.
REVIEWING SUSTAINABILITY ASSESSMENTS OF OIL & GAS DEVELOPMENTS
83
4.6 Conclusion The framework for reviewing SEA practice has assisted in identifying several significant
strengths and weaknesses in term of assessment effectiveness.
A key outcome of this review concerns the fact that in most cases outcomes of SEA studies are
partially in line with declared strategic vision and objectives posed. When the motivations are
in favour of merely matching economic reasons and environmental protection, much of the
emphasis of the SEA procedures appears to be directed toward approval of Oil & Gas
proposals rather than reflecting on the environmental and social implications and
uncertainties that such activities could determine, especially in the long-‐run.
On the contrary, more comprehensive and strategic approaches pay attention to a broader
variety of implications that can arise from Oil & Gas activities and affect local communities,
and give emphasis to participatory processes.
The review provides evidences of SEA aspects that play a crucial role in order to recognize
more targeted and strategic information on which analysis should be based, as well as, to
assist in a better designing of more sustainable-‐oriented outcomes dealing with Oil & Gas
activities. In particular a means of fundamental helping is provided by involvement of
stakeholders from early stage of the procedures; identification of key environmental, social
and economic factors; analysis of cumulative and synergistic effects in the long-‐run; fact-‐
based provisions and recommendations for more integrated mitigation and monitoring
management strategies for follow up.
However, as disclosed by Figures 4.3 and 4.4, it is important to note that more efforts should
be made for enhancing and increasing the adoption of these best practices in SEA processes.
In addition, two important substantive and procedural concerns emerge from this chapter.
Firstly, SEA practice often disregards the assessment of environmental and social effects
outside the area directly affected by the project activities, which reveals a reduced to absent
strategic perspective. In fact actual strategic assessments could play an essential role for
ensuring that benefits and constraints associated to Oil & Gas activities were fairly allocated in
space and time, and would raise long-‐range benefits.

CHAPTER 4
84
In this respect, worthy points might be to ensure direct representation of needs and interests
of neighbourhood groups in the assessment and include them in a wider analysis of
implications and consequences of proposals in the short and long run. Secondly and more
broadly, it should be particularly beneficial to conduct ex post assessments, especially, of
those processes more sustainability-‐oriented. In fact, it could give tangible evidences of how
and to what extend their provisions and recommendations contribute to operationalize
sustainability.
Next chapter will seek to go further in the discourse about sustainability and SEA by focusing
in more detail on the first substantive and procedural concern drawn up from this chapter. To
this purpose, a sample of SEA in the Oil & Gas sector will be reviewed by using an approach
based on the concept of “critical decision factors”.

Chapter 5
5. Critical decision factors for Oil & Gas developments3
5.1 Introduction The perspective of SEA as a proactive tool to integrate sustainability concerns into strategic
decision-‐making emphasises the need of a strategic thinking approach to facilitate decision-‐
making by involving key actors, enabling dialogues towards mutual understanding, and
addressing long-‐term and large scale perspectives (Partidário, 2012; 2007b).
As stated in Chapters 1 and 4, Oil & Gas development is a controversial source of
opportunities and challenges, representing a sector for which such an approach in SEA would
be strongly advisable. It is particularly important to identify long-‐term sustainability goals and
objectives and to ensure that a strategic-‐based assessment is integrated into decision
processes from early stages.
This chapter aims at contributing to this discussion by exploring to what extent current SEA
practices in the Oil & Gas sector address sustainability concerns. To this purpose, I will refer to
the strategic and sustainability-‐oriented SEA approach proposed by Partidário (2012; 2007b),
based on the concept of “critical decision factors” (CDFs, described in Section 5.2) defined by
the author as the “windows of observation” defined to ensure a strong focus on
“environmental and sustainability success factors of a strategic decision, rather than a vague
notion on effects over a large environmental broadband” (Partidário, 2012). First, I will
propose the identification of key CDFs for Oil & Gas developments based on the review of
literature presented in chapter 4, and I will describe how the CDF can be addressed (Section
5.3). Then, I will review the sample of SEA reports listed in Table 4.2, to analyse if and how the
CDF were addressed and discuss their contribution to sustainability-‐oriented SEA (Section 5.4).
Finally, recommendations for best practice and conclusions are drawn (Section 5.5).
3 This chapter is based on: Lamorgese, L, Partidário, MR, Geneletti, D. Critical decision factors in SEA for Oil & Gas developments (currently under review).

CHAPTER 5
86
5.2 The critical decision factors (CDFs) approach
According to Partidário (2007a, 2012), a key condition for SEA to act strategically is to keep a
strategic focus on very few, but critical, themes that intertwine relevant biophysical, social,
institutional and economic issues. At the core of her proposed strategic-‐thinking model for
SEA the author identifies Critical Decision Factors (CDF) as key integrated factors that act as
the windows of observation to focus attention on those environmental and sustainability
issues that should matter for decision, and which consequently should be assessed. Founded
on the concept of success factors in business strategy, originally advanced by Ronald Daniel in
1961, Partidário (2007a) suggested the use of this form of device – the CDF -‐ to express critical
uncertainties and ensure a strategic focus in the assessment of strategic development
decisions.
According to the author CDF are determined by priority setting, involving technical
interpretation but especially dialogues with relevant stakeholders, to consider multiple points
of view and issues of concern. In guidance produced to assist the application of the strategic-‐
thinking model Partidário (2012) recommends the “diamond” approach as a method for CDF
identification, represented in Figure 5.1. It departs from a collective dialogue on a vision,
linked to future goals and strategic objectives, followed by the consideration of major
problems and potentials. The cross-‐analysis of problems and potentials in face of intended
vision and strategic objectives will enable the establishment of priorities that can determine
success factors. These are then expressed as CDF, or those factors that will enable the strategy
to be successful from environmental and sustainability perspectives.
Partidário (2012) suggests a synthesis effort must be done when identifying CDF in order to
limit in number -‐ between three and five, and never more than seven, is recommended -‐ to
ensure strategic focus. CDF should be easy to communicate, therefore should be named using
simple keyword that are easy to capture and enough to express its integrated meaning
(Partidário, 2012).
As an example, in the SEA of the Portuguese Electricity Transport Network Development and
Investment Plan (Partidário, 2012), three CDFs were selected: Energy, Fauna and Spatial
Planning. These CDFs proved to be enough to address the major strategic issues that
mattered: increasing renewable energy sources and the efficiency in energy transportation;

CRITICAL DECISION FACTORS FOR OIL & GAS DEVELOPMENTS
87
reducing the interference with nature conservation areas, and enhancing electricity
distribution, while avoiding conflicts with density populated areas and other natural or
human-‐made obstacles. This way the CDF establish the focus of the SEA, the assessment
framework and identify the technical studies for trend analysis to be considered in the
assessment of opportunities and risks (Partidário, 2012).
5.3 Identification of critical decision factors
In order to identify CDFs for Oil & Gas development we have followed the diamond approach
suggested in Partidário (2012). We have used the available Oil & Gas development literature
to explore how we could identify a possible vision, or at least strategic objectives, as well as
major issues that could be addressed as problems and opportunities of Oil & Gas development
in order to identify what could be success factors in any Oil & Gas development strategy. The
following paragraphs describe the findings of the literature and cases review.
It appears from the current literature discourse on Oil & Gas development that possible
objectives are to ensure the ecological integrity of the area under concern, while meeting the
socio-‐cultural and economic needs of local community, yet recognizing both existing and new
activities that might differently influence land-‐uses in the short and long run (TNEM, 2012;
Gibson, 2011; EPA Ghana, n.a.). In order to pursue such strategic objectives there is a need to
evaluate to what extent Oil & Gas activities may ensure environmental integrity, by identifying
the potential interaction between these activities, as well as their potential impact on
ecological and social components within time and space (RIM and World Bank, 2011; IFC,
2007).
Firstly, particular emphasis should be given to ensuring that development maintains a desired
level of environmental quality, by considering both biophysical and socioeconomic aspects,
rather than focusing on mitigation of adverse effects only (Harriman and Noble, 2008; Noble,
2008). This requires that the expectations of local communities are taken into account, for
example by preserving the environmental and cultural heritage features (e.g. Gobierno de
Chile, 2011; RIM (Islamic Republic of Mauritania) and World Bank, 2011; Department of State
Development Government of Western Australia, 2010). This is particularly challenging in

CHAPTER 5
88
offshore developments, due to the complex interactions between physical and biological
environments, different sensitiveness of marine areas (e.g. costal zones, open sea), but also
for the higher negative implications associated to accidental oils spills (Mosbech et al., 2007).
Secondly, the potential benefits stemming from Oil & Gas development are strictly associated
with long-‐term socio-‐economic prosperity for the areas and the community involved. A
holistic long-‐term approach should underpin the development of resource management
schemes that ensure a strategic vision in view of future Oil & Gas approvals or other potential
development derived from Oil & Gas proposals (Norwegian Ministry of Environment, 2009).
To this purpose, assessment of cumulative effects related to past, present and future foreseen
development activities need to play a crucial role (CCME, 2009; Johnson et al., 2011).
Elvin and Fraser (2012) point out the difficulties in dealing with cumulative effects due to the
complex analysis required to overcome unknowns in particular with respect to offshore
environments. In this regard, increasing the knowledge about the nature of cumulative
effects, identifying limits, targets, and indicators are considered essential requisites to deal
with uncertainty and effective assessment in the long-‐run (Gunn and Noble, 2011).
A relevant outcome of this review shows that good governance plays a crucial role in
achieving successful Oil & Gas developments and in preserving the integrity of the natural,
social and cultural environments (E&P Forum/UNEP, 1997). It is argued that particularly at
local level, sound environmental, social and economic policies, together with established
democratic institutions that are responsive to the needs of people, and an enabling
environment for investment, are essential underlying factors for a sustainable development
(e.g. Norwegian Ministry of Environment, 2009; NORAD and World Bank Group, 2009; Joint
Review Panel for the Mackenzie Gas Project, 2009; Ministry of Industry of Iceland; 2007).
In order to take into account this integrated perspective, the expectations of communities
affected by Oil & Gas development should be addressed by protecting values as well as
ensuring transparent and participative approval processes, in view of equitable sharing of
benefits and adequate compensation for negatively affected populations (Foluke, A., 2012;
NCEA, 2012, 2009; Joint Review Panel for the Mackenzie Gas Project 2009). Thus, due to the
complexity of Oil & Gas implications, follow-‐up mechanisms tailor made to, and well
articulated with, the processes of decision-‐making are considered essential in SEA of Oil & Gas
(Teixeira, 2008).

CRITICAL DECISION FACTORS FOR OIL & GAS DEVELOPMENTS
89
Based on the above-‐described issues, apparently stemming out of the existing literature as
priorities in the Oil & Gas sector, it is possible to cluster them in four major themes that
integrate, through cross-‐relationship, major environmental and sustainability issues: Heritage
Values, Community Benefits, Timescale, and Governance. These are our suggestion of four
CDFs that, in our understanding, capture four transdisciplinary and sustainability oriented
themes of primary concern for Oil & Gas development.
Heritage Values encapsulates the need to protect high-‐natural and cultural heritage values as
a whole, and ensure both ecological integrity and the preservation of environmental and
social features. This CDF aims at helping Oil & Gas developments to focus on ensuring the
preservation, and preferably the enhancement of local or regional ecological and socio-‐
cultural features that are highly relevant as heritage values in local contexts. The SEA will pay
particular attention to the intended planning and policy measures by Oil & Gas sector
activities that will avoid destruction of such values, and likewise the measures that will be
undertaken to reinforce the historical identity.
Community benefits relate to the significant potentiality of Oil & Gas sector to act as a
powerful leverage for socio-‐economic development of local communities, and to ensure that
in development processes benefits resulting from the exploration of natural resources are
shared with the community. The equitable sharing of benefits and adequate compensation for
negatively affected populations is one of the most frequent aspects mentioned in the
literature. With this CDF the SEA will focus attention to how the Oil & Gas sector activities will
develop their business plans to ensure that local communities expectations will be positively
addressed, that opportunities will be created so that the local community will be better-‐off
during and after the exploration and production of Oil & Gas, and that there will be a positive
legacy for local communities.
Timescale embodies complex and multi-‐scaled aspects related to potentially negative, but
also positive, consequences in the long-‐run. Long-‐term implications of adverse impacts
assume a critical relevance, particularly, in the case of Oil & Gas development, due to the
scope and interconnections of environmental, social and economic concerns that could flow
from it. With this CDF the SEA will focus attention to how the Oil & Gas sector activities will
address the long-‐term socio-‐economic prosperity for the area and for the community

CHAPTER 5
90
involved, which is another of the most frequent aspects mentioned in the literature. On the
other hand, despite recognized in the literature as being difficult, cumulative effects
associated to Oil & Gas development will also be captured by this CDF, to ensure Oil & Gas will
establish follow-‐up mechanisms that may increase the knowledge about the nature of
cumulative effects, identifying limits, targets, and indicators considered essential to deal with
uncertainty and effective assessment in the long-‐run.
Governance encapsulates the demand for more responsive systems of decision-‐making and
adaptive management in the Oil & Gas development that are able to integrate multi-‐
objectives and multi-‐levels institutional arrangements and involvements of stakeholders. It is
recognized in the literature that sound environmental, social and economic policies that are
well established through democratic institutions are critical to create an enabling
environment for investment, as well as to respond to the needs of people. Through this CDF
the SEA will focus on these essential underlying factors for a sustainable development, which
can be considered strategic to preserve the integrity of the natural, social and cultural
environments.
Table 5.1 describes the potential contribution of SEA associated to each CDF. These
descriptions are used as a reference to review the selected case studies presented in Chapter
4, as described in the next Section.
Tab. 5.1 – CDFs and the associated potential contribution of SEA.
CDF Potential contribution of SEA
Heritage Values
Ensuring that Oil & Gas activities do not compromise, and will possibly enhance ecological integrity and natural and cultural heritage values, as well as the preservation of environmental and social features.
Community Benefits
Ensuring that Oil & Gas activities generate broadly shared and long-‐term benefits to local communities.
Timescale Ensuring that limits and uncertainties related to the assessment of possible future negative implications, and cumulative effects, are properly accounted for in the long-‐run.
Governance Ensuring that Oil & Gas decision-‐making is carried out by enhancing institutional capacity, stakeholder involvement, systems management and follow-‐up.

CRITICAL DECISION FACTORS FOR OIL & GAS DEVELOPMENTS
91
5.4 Testing practice against CDFs
I review the extent to which the selected case studies have considered, and assessed, the
issues described by the four CDFs (Table 5.1). For this study, CDFs were used in an “ex-‐post”
fashion to review current practice, rather than to proactively frame the SEA, as suggested in
the original approach by Partidário (2012). The review was directed to identify elements, both
substantive and procedural, which can potentially contribute to a more sustainability-‐oriented
assessment, by looking specifically at the four CDFs.
Particular attention was given to aspects of specific concern for the Oil & Gas sector gathered
from literature, such as:
• protection of biological diversity and the maintenance of essential ecological processes –
e.g. approach for identifying and safeguarding valuable environmental components, degree
of involvement of stakeholders in the analysis (mainly relevant for CDF “Heritage Values”);
• implications for land-‐use – e.g. actions and provisions for preventing pollution and dealing
with risk of oil spills (mainly relevant for CDF “Heritage Values”);
• implications for people involved – e.g. analysis and provisions for taking into account
needs, values and expectations of stakeholders and affected people (mainly relevant for
CDF “Heritage Values”);
• net benefits for local communities – e.g. distributional analysis of losses and gains,
considerations or actions oriented towards fair share of benefits in the long-‐run, treatment
of economic, environmental and social trade-‐offs (mainly relevant for CDF “Community
Benefits”);
• explicit consideration of health issues – e.g. analysis and/or provisions for dealing with
possible health consequences (mainly relevant for CDF “Community Benefits”);
• treatment of uncertainty – e.g. management of unknown, analysis of cumulative effects,
application of precautionary approaches (mainly relevant for CDF “Timescale”);
• stakeholder engagement and follow-‐up mechanisms – e.g. provisions and requirements for
enhancing monitoring effectiveness (mainly relevant for CDF “Governance”).
Table 5.2 summarises the number of references to issues found in each case study that relate
to the different CDF. Figure 5.1 presents the results clustered in four categories, according to
the number of findings. As it can be seen, more than 60% of the cases contain at least two

CHAPTER 5
92
findings illustrative of sustainability–based assessment for each of the four CDFs. A detailed
description of issues per CDF follows.
Tab. 5.2 – Number of elements potentially contributing to sustainability-‐based SEA, broken down by CDFs and case studies.
CDF CASE STUDIES
AU
BO
CA1
CA2
CA3
CI
GL
IL
MA
UK1
UK2
Heritage Values
5 2 2 5 7 1 1 1 4 3 1
Community Benefit
5 0 1 7 3 1 2 4 5 3 5
Timescale 2 0 2 2 3 2 3 2 1 2 3
Governance 5 2 1 5 5 0 0 1 4 2 2
Fig. 5.1 – Case-‐study contribution to CDFs.

CRITICAL DECISION FACTORS FOR OIL & GAS DEVELOPMENTS
93
Heritage Values In terms of Heritage Values, the review shows that it is possible to involve stakeholders at the
stage of development of a proposal, for example, by activating site selection procedures for
screening plausible and shared locations for Oil & Gas activities, such as in AU. In this example,
the site selection procedures involved the general community, traditional owners, non-‐
government organisations, and relevant institutions. According to significant concerns raised
with all participants, stakeholders shared the decision of focusing the strategic assessment on
an area relatively close to existing infrastructure but remote from the existent wilderness
tourist destinations.
This approach provides evidence of the effort of balancing existent ecological, socio/cultural
and economic interests with the desire for economic development before irreversible
decisions are taken. Commonly, case studies underline that Oil & Gas activities can have
significant impacts on the environment and especially on the traditional communities, which
live near the perimeters of exploration. A strategic focus is recognisable in SEA reports where
approaches are adopted for identifying those components and potential interactions that are
of primary concern. Several cases adopt the Valued Ecosystem Components (VECs) approach,
such as AU, IL, CA3, GL, while MA implements a CDFs approach. VECs include important flora
and fauna, habitats and processes that have a national or international profile, can act as
indicators of environmental change, or can be the focus of management or other
administrative efforts (see Beanlands and Duinker, 1983).
Similarly to CDFs, VECs approaches equally emphasise that the identification of these valuable
components constructively emerges from consultations with key stakeholders. However, in
case studies using VECs, discussion are undertaken in relation to specific studies that help in
understanding environmental vulnerabilities, especially physical and biophysical (e.g.
literature review on environmental impacts of Oil & Gas, previous environmental assessments
conducted in relation to other Oil & Gas related projects, studies on existent issues provided
by institutions and responsible authorities, etc.). In the example adopting CDFs there is a
much greater integrative approach in identifying issues. It is particularly emphasized in the
CDF approach that meetings are also organized for understanding the perceptions of
stakeholders on environmental quality, community identity and sense of place, quality of life,
heritage values, etc. as determined by Oil & Gas activities and other activities.

CHAPTER 5
94
Even if critical aspects are case-‐specific, some central issues are commonly considered in the
SEA reports, such as the protection of biodiversity (e.g. sensitive habitats, high value species),
noise, mainly of seismic origin; solid and liquid discharges; airborne emissions, the presence of
the facilities, risk of accidental spills and the management of such risk; employment; potential
conflict with tourism industry; royalties; problems in social acceptability of oil activities from
indigenous people; in particular for offshore cases, the protection of the fishing industry. For
example, more strategic approaches ensure protection of higher-‐valued species by imposing
restriction in use, creation of buffer area, designation of core biodiversity areas, identification
of sensitive areas (e.g. AU, CA2) as well as areas that could present specific physical or
technical constraints (e.g. CA3, IL). In addition, for the marine environment, some case studies
consider fundamental to impose temporal restrictions in sensitive periods to avoid operations
when they can create high disturbance to marine bird and mammals (e.g. migration routes,
breeding periods etc.). This reveals that a CDF on Heritage Values may well be quite relevant
for general Oil & Gas sector development activities.
Community Benefit In general, case studies are more oriented to analyse opportunities derived from Oil & Gas
development without fleshing out other potential developmental alternatives. Some
approaches consider alternatives only in terms of degree of exploitation and intensity of Oil &
Gas activities, as usual in project’s EIA. In a few cases, consultations of local communities, in
the form of meetings, training sessions, workshops and interviews, are promoted in view of
discussing alternative sustainable future scenarios and key environmental goals and objectives
for the area which is intended by the Oil & Gas activities. From an operative point of view,
several case studies consider scenario analysis and analysis of cumulative effects for
understanding implications in the log-‐run.
In most cases, scenario analysis are conducted in the view of understanding the possible
economic scope of Oil & Gas activities and their potential temporal development in the short
and long run. It is particular evident in cases in which Oil & Gas prospectiveness is not very
well known, such as in CI, CL. However, CA2 shows an example of an analysis, conducted at
the strategic level, which examines a range of potential development scenarios over a time
period of 30 years, looking at the potential increase of regional economic resilience offered by
introducing Oil & Gas facilities in the area. It takes into account the social changes related to

CRITICAL DECISION FACTORS FOR OIL & GAS DEVELOPMENTS
95
the proposal, such as increase of population, demand for land and housing, potential impacts
and opportunities on social aspects (e.g. services, health facilities, recreation etc.).
Again the review has shown the usefulness of using VECs for assessing cumulative and
synergistic effects of Oil & Gas exploration activities and other activities that can concurrently
take place. For instance, CA3 considers such analysis particularly important in relation to
assure a strategic approach for future approvals of projects directly connected to Oil & Gas
development, such as new exploring licenses, construction of services facilities, pipelines, that
would implicate land use changes over a long period of time. Even if it does not clearly emerge
from the case studies, it should be noted the role that analysis of alternatives, scenario
analysis, and cumulative effects could play in disclosing trade-‐off and eventually
environmental net benefits related to possible future scenarios in Oil & Gas activities.
This also reveals that there is a strong linkage between VECs and CDF, since both act as
devices for strong focus on aspects that really matter and upon which attention and efforts
need to be concentrated. In addition it is possible to highlight SEA case studies that integrates
social impact assessment in dealing with implications on affected groups. Although the focus
is mostly on indigenous people, some more general features can be stemmed from these case
studies; for example, providing for compensation for damage and loss of income, creating
new economic opportunities, creating land owner controlled funds for economic
development, housing, education and cultural preservation, inform communities and users of
exploration and extraction activities (places and dates) and benefits generated by the
resources from the Oil & Gas sector as well; involving local people in monitoring activities. On
the contrary, even if the SEA reports claim to pursuit a common strategic intent to equally
share benefit derived from Oil & Gas development, they do not generally provide a means to
tackle this aspect.
However, some studies include analysis of distributional impacts due to Oil & Gas activities on
other activities (e.g. tourism, fishing industry, agriculture) and infrastructure settlements. It is
therefore recommended to define plans and funds for compensation of land-‐owners of the
affected land and loss of income due to decrease of other land and marine activities (e.g.
fisheries, agriculture, hunting). For instance, CA2 evaluates how the economic spin-‐offs
offered by Oil & Gas development lead to an increase in income for individuals and the
government, by favouring job creation and regional and industrial development. In this

CHAPTER 5
96
regard, according to AU, designing a strategic social impact management plan represents
potentially a beneficial tool for including and managing measures to enhance opportunities
and mitigate and manage impacts identified. Despite these relevant social and economic
aspects, aspects connected to environmental equity are not discussed at all which reveals the
imitation of this case in terms of sustainability approach.
Timescale Regarding timescale, the potential of SEA in dealing with uncertainty in the long-‐run have
emerged from the review. Some differences in nature and intentions of actions proposed
should be noted. While recognising uncertainties related to Oil & Gas activities, especially in
the marine environment, some SEA documents (e.g. CI, CA1) deal with uncertainty by only
recommending mitigation and compensation measurements to be defined at project design
levels. Whereas others deal with inevitable gaps of knowledge often referred to ecological
effects on Oil & Gas activities in the long-‐run, by stressing on two central and more strategic
expectations. Firstly, core sensitive areas need to be excluded from possible site location of Oil
& Gas activities (eg. CA2, CA3, AU).
Secondly, mitigation, management and monitoring strategies need to be designed and
implemented for managing impacts (e.g. UK1, UK2, IL, CA1). Frequently, strict Health, Safety
and Environment (HSE) procedures, application of the Precautionary Principle in combination
with Best Environmental Practice (BEP), Best Available Technique (BAT) and international
standards are supposed to do much for reducing environmental impacts.
In particular for the marine environment, almost all case studies recognises that the discharge
policy, as applied in the Barents Sea, represents an essential contribution to significantly
reduce impacts. Behind adoption of best practice in environmental, health and safety
management, some case studies recognise that other key planning considerations should be
taken into account to effectively reduce or avoid the identified environmental issues and
interactions.
In high sensitive contexts, limiting disturbing activities, through the establishment of new
conservation areas and expansion of existing ones, and the assurance of best management
practices, are imposed as provisions for conserving biological resources and maintaining
ecological integrity facing uncertainties according to adaptive management.

CRITICAL DECISION FACTORS FOR OIL & GAS DEVELOPMENTS
97
For instance, CA3 contemplates an articulated management strategy for identifying
cumulative effects; it requires the definition of: management targets, which correspond to the
objectives regarding the cumulative effects that the activities studied might have on VECs;
management thresholds, which are guidelines or minimal standards that should not be
exceeded in the day-‐to-‐day management of activities so that the VECs considered are
sufficiently protected; management measures which are the means recommended to ensure
the achievement of targets and avoid exceeding the required thresholds.
Therefore a monitoring strategy plays a crucial role for assessing effects in the long-‐run as well
as dealing with uncertainties. Contexts with current existing monitoring activity are better
equipped to understand the evolution of baseline conditions in respect of contamination,
biological and human health effects across the interested areas (e.g. UK1, UK2). However, in
order to efficiently assist the management of monitoring Oil & Gas activities, some SEA
reports also require dedicated Spatial Information System to be designed and implement (e.g.
CA2, CA3).
Governance According to the positive examples gathered by the review, SEA can give an important
contribution to dealing with governance issues and instruments of sustainability concern
related to Oil & Gas development. Aspects related to enhancing institutional capacity and
stakeholder involvement as well as systems management and follow-‐up are generally
contemplated in the case studies. The need for reinforcing institutional capacity in dealing
with Oil & Gas issues is particularly pointed out in development countries reports, which use
SEA analysis also for understanding how to fill gaps, such as lack of environmental legislations
and environmental institutions, need of coordination between institutions and training for
public stakeholders.
Concerning stakeholder involvement, there are also examples of strategic consultations of
local communities undertaken at very early stage of SEA procedures (e.g. MA). However, it
should be noticed that some failures were reported in the effective involvement of less
powerful groups, such as indigenous people (e.g. BO, AU). Moreover, a remarkable example is
provided by CA3, where plan information campaigns for local communities and tourists are
required to highlight existing impacts of Oil & Gas development activities on the environment.

CHAPTER 5
98
In addition, upfront approaches detail systems management and follow up in the view of
enhancing institutional systems management and extend stakeholder participation at the
stage of Oil & Gas planning implementation and follow up. As mentioned before, case studies
that aim at integrating sustainability into governance, promote better coordination across the
authorities and stakeholders involved at different levels in the Oil & Gas development.
To build and maintain environmental monitoring, SEA reports recommend partnerships
between involved users (e.g. institutions, Oil & Gas industry and other industry, agriculture,
NGOs) and sources of monitoring expertise (e.g. environmental institutions, centre of
research, etc.), and also funding programme for tailor made research and studies on effects of
Oil & Gas development. In this regard, an interesting example is the governance model,
proposed by CA3, based on the establishment of a devoted advisory committee and a
coordination office. The first institution has the responsibility to collaborate in putting in
action the recommended activities as well as to foster citizen involvement in the management
activities, while the second plays the role of centralizing scientific information related to the
industry’s activities in order to facilitate access to data essential for decision-‐making
integrating (e.g. study research and company studies relevant for the sector).
More strategic options are also recognizable in social oriented approaches (e.g. AU, BO, MA)
that emphasize the need to involve traditional owners and indigenous people in the
management of plans and monitoring activities. In addition, a remarkable example for
strengthening follow up procedures is provided by AU, which requires the application of
specific guidelines for determining significance of residual impacts. This is a crucial aspect to
take into account in decision-‐making towards sustainability.
5.5 Recommendations to improve practice
The results presented in the previous section as well as our reflections from the analysis of
case studies, against the literature reviewed, enable us to advance some recommendations
that may help to enhance SEA practice for Oil & Gas activities. They are introduced below,
structured by CDF.

CRITICAL DECISION FACTORS FOR OIL & GAS DEVELOPMENTS
99
Heritage Value
• Improve focus on valuable strategic components of the assessment, which extend beyond
environmental issues to include community identity, sense of place and stakeholders
perceptions;
• Define articulated management strategies that encompasses restriction and mitigation
measures and monitoring requirements for maintaining the ecological integrity and
sustainability of the area;
• Define management targets and thresholds according to valuable strategic components
identified that may enhance heritage values.
Community Benefit
• Incorporate social considerations and shared discussions in terms of equity issues;
• Better focus on the implications for groups or individuals affected by the proposal,
particularly on less powerful groups.
• Discuss alternative future scenarios and key environmental goals and objectives also in
terms of other development options for the area that may generate community benefits;
• Identify management measures for maximising economic spin-‐offs for local communities;
• Undertake comprehensive analysis that makes risks-‐opportunities and trade-‐offs for local
communities explicit, taking account of the significance of residual impacts.
Timescale
• Demonstrate clear links between ecosystem protection, sustainable economic
development and social benefit for local communities in the short-‐medium as well as the
long term;
• Undertake comprehensive analyses in the long-‐term, and consider cumulative and
synergistic effects of multiple Oil & Gas activities and others possible concurrently activities
across the interested areas;
• Provide recommendations and guidelines for designing dedicated Spatial Information
Systems to assist in the management of monitoring Oil & Gas activities.

CHAPTER 5
100
Governance
• Define a shared strategic vision and objectives to consider as a referential in the
assessment, by involving extensive community consultation;
• Assure consistent and transparent approval processes in recognition of the environmental
and social values identified;
• Provide recommendations and guidelines that help in implementing effective SEAs and
environmental governance systems by clearly identifying tasks and responsibilities, and
assure feedback to assist in impact prediction for future SEAs or projects EIAs concerning
Oil & Gas development and other activities in the area of interest;
• Identify procedures for dealing with the proposal after its approval that:
⇒ assure permanent link between involved institutions at different levels (e.g. Follow-‐
up Coordination Committee (CSC) for developing relations between stakeholders
and their capacity for managing environmental and social issues;
⇒ support systematic communication mechanisms for disseminating environmental
and social information relating to proposed Oil & Gas projects;
⇒ include active participation of local communities in particular in monitoring
activities;
⇒ promote funding programme for tailor-‐made research and studies on effects of Oil
& Gas development;
⇒ evaluate the human and financial resources needed for effective environmental
governance.
5.6 Conclusion
The review confirmed that aspects related to the selected four CDFs: Heritage Values,
Community Benefits, Timescale and Governance represent common requisites for SEA
practice in the Oil & Gas sector, even where SEA cases may reveal different degrees of
integration. That shows that the aspects to which the CDF relate as recognized as relevant.
Moreover, by reviewing the case studies against the proposed CDF assessment framework, it
was possible to suggest suitable recommendations in view of enhancing potential strategic
contributions of SEA towards more sustainable outcomes in Oil & Gas developments, in terms

CRITICAL DECISION FACTORS FOR OIL & GAS DEVELOPMENTS
101
of protection of natural, social and cultural values, contribution to local development,
management of uncertainty and improved decision-‐making processes.
It is central to notice that the considered CDFs focus on integrated concerns of primary
relevance at local and regional scale. Of course this is not to say that these CDF should always
structure all the strategic assessments of Oil & Gas developments in any part of the world. It is
important that any SEA should be tailor-‐made to the particular context-‐specific aspects, which
will need to be reflected in the selected CDF for focused assessment.
It is equally important to underline that CDFs must include cross-‐scale issues, such as potential
conflict between national and local interests in dealing with Oil & Gas development, impacts
outside the area directly affected by the activities or dynamics related to Oil & Gas production
(e.g. increase in oil supply, implications for oil price, investments in developing technologies,
current policy debate about how to effectively limit or reduce oil consumption and
greenhouse gas emissions).
More research is needed to categorize convenient CDFs that can be able to synthetize cross-‐
level issues and, consequently, propose a wider picture of SEA potential contribution to
sustainability in space and in time. It would be of particularly importance to carry out more
specialized and context-‐specific analysis during early stages of SEA processes.
Consequently, for guiding more sustainability-‐based assessment, it may help to explicit the
contribution towards sustainability expected from SEA assessments, and make that reflect on
the set of CDFs to be established for strategic-‐thinking assessment, for example following the
approach we proposed in our framework. In fact, this method may represent a promising
attempt in view of designing a streamlined way for fully integrative-‐based SEA assessments. It
proved to be quite useful in helping to keep the focus in our review of the eleven case studies.

Chapter 6
6. “Val d’Agri Oil fields”: developing future scenarios
The process of investigations for the case study consisted of three principal steps: (1) the
construction of a set of scenarios that simulated possible future alternatives related to Oil &
Gas development for the study area; (2) the proposal of a set of context-‐specific and place-‐
based criteria and metrics for the study area derived from the set of equity criteria proposed;
(3) the assessment of the scenarios narrative implications against the equity criteria by an
empirical analysis based on quali-‐quantitative data. This chapter is over the first point, while
Chapter 7 will examine the other two steps.
6.1 Oil & Gas Development in Basilicata
In order to assess implications over space and time to Oil & Gas development, the case
application focused on a study area that includes regional and local scales. The regional scale
of investigation regarded the entire Basilicata. Two nested areas, including and surrounding
existent and/or potential new Oil & Gas activities, were considered at local scale. The first
local area, namely the Upper Val d’Agri, refers to the oldest and most important oil field (the
Val d’Agri concession), while the wider area, namely the Val d’Agri, Melandro, Sauro,
Camastra District (Comprensorio Val d’Agri, Melandro, Sauro, Camastra) includes the Tempa
Rossa oil field (Gorgoglione Concession), which is expected to coming onstream in 2016. In
this research the Val d’Agri and Tempa Rossa fields are identified as the “Val d’Agri Oil Fields”
(Figure 6.1).
Basilicata is a region in the south of Italy, which covers about 10,000 km2 (47% mountains),
divided into provinces of Potenza and Matera, and including 131 municipalities. The total
population is of 578.036 (ISTAT, 2013).

CHAPTER 6
104
The Basilicata represents the second less density region in Italy with a population density of
57,8 inhabitants to Km2.
Fig. 6.1 – Study area.
The Basilicata Region presents a natural environment rich of ecologically sensitive and
biodiversity-‐rich areas. It contains a large number of protected areas, which are characterised
by exceptional floral and faunal communities. Parks and natural reserves cover about 24% of
the region. There are two National Parks: Parco del Pollino, the largest in Italy of about 1926
km2, located between the Basilicata and Calabria regions, and Parco della Val d'Agri
Lagonegrese of about 676 km2, close to and partially including existent oil rings (Val d’Agri Oil
field). There are also two regional parks: Parco delle Chiese Rupestri, an archaeological,
historical and natural heritage natural park, and Parco di Gallipoli Cognato-‐Piccole Dolomiti
Lucane, close to existent oil rings (Tempa Rossa Oil field). Another regional park, Parco
Naturale Regionale del Vulture, will be instituted in the Northern part of the region. There are
also eight state and six regional reserves.
In Basilicata, the Natura 2000 Network, established according to the Council Directive
92/43/EEC on the conservation of natural habitats and of wild fauna and flora, includes 50
Sites of Community Importance (SCIs), and 17 Special Protection Areas (SPAs), covering
�
�����������������������������������������������
���� ���� �������
�
�
����
���������� �������

“VAL D’AGRI OIL FIELDS”: DEVELOPING FUTURE SCENARIOS
105
17,1% of the regional territory. Figures 6.2 and 6.3 display distribution of parks and
natural reserves, and SCIs.
Fig. 6.2 – Map of Protected Areas: Parks and Natural Reserves (source: Regione Basilicata, Rete Natura 2000 website).
Fig. 6.3 – Map of Protected Areas: Sites of Community Importance (source: Regione Basilicata, Rete Natura 2000 website).

CHAPTER 6
106
The region is largely devoted to agricultural practises, but is affected by land degradation
processes such as diffuse desertification, accelerated soil deterioration and long-‐term
decreases in biological productivity, due principally to inappropriate land management
under both cultivated and uncultivated areas and frequent periods of droughts (Basso et
al., 2010; Ferrara et al., 2005). Figure 6.4 displays environmental sensitivity to
desertification broken down into 8 levels, from not affected to higher critical sensitivity
(Regione Basilicata, 2004).
Fig. 6.4 – Map of environmental sensitivity areas to desertification (source: Regione Basilicata, 2004).
In term of socio-‐economic aspects, Basilicata has been recognized as one of the least favoured
areas of Europe and supported by the Regional policy of the European Union for avoiding
regional disparities across the Europe. Nevertheless, as Basilicata gross domestic product
(GDP) per capita rose above the 75% EU-‐average, in the current 2007–2013 EU funding
period, the Region is phasing out eligibility under Convergence objectives and will receive a
transitional "phasing out" support from the EU until 2013. However, according to the index of
regional competitiveness (RCI)4, which shows the strengths and weaknesses of each of the EU
4 The RCI covers a wide range of issues related to territorial competitiveness including innovation, quality of institutions, infrastructure (including digital networks) and measures of health and human capital (see Annoni and Dijkstra, 2013).

“VAL D’AGRI OIL FIELDS”: DEVELOPING FUTURE SCENARIOS
107
NUTS 2 regions, the Basilicata RCI performed very low in 2012, with a score of 227 out 262
European regional territories in 2012, in other words, solely 35 regional territories performed
worse (Annoni and Dijkstra, 2013).
Tab. 6.1 – Overview of key socio-‐economic characteristics. Basic Statistics (sources ISTAT, 2013; 2013a; 2013b; Regione Basilicata et al., 2012).
Population
Since 1991 a downward trend in residential population.
In the period 2001-‐2011 the region recorded an average annual drop of 3.4 ‰, while at the national level is detected an increase of 4.4 ‰.
Income 14.279 euro per capita in 2011 (about 21% less the national average).
-‐0,8% percentage point compared to 2008.
Employment rate 47,6% of employed persons aged between 15-‐64 on the total population in the corresponding age group in 2011 (56,9% in Italy).
Poverty 25,8% of population living in households below the poverty line in 2011 (13,6% in Italy).
Deprivation
24% of population affected by severe material deprivation in 2011 (11,1% in Italy). (e.g. people that can’t afford a washing machine, can’t afford to pay unexpected required expenses, inability to keep home adequately warm, inability to have a proper meal every two days).
A critical attention on this region is due to the presence of several Oil & Gas extractions, the
existence of numerous protected areas and the recent creation of a second national Park
(Decree of the president of the Italian Republic 8 December 2007), which covers the upper
areas of the Agri valley, to protect the wild flora and fauna and manage the use of natural
resources over the long term, combined with existent agricultural activities.
The social context of the region is characterised by a close bond of the population with its
territory and by a widespread awareness and knowledge of environmental issues. The
explorations in Basilicata started with gas concessions conferred in the eastern part of the
region and along the Ionian coast in the 60’s and extended far into the 90’s. These
concessions are partially in phasing out5.
Currently existing 21 production concessions, of which 12 productive, covering about 21% of
Basilicata territorial surface (2.071 km2 out of about 10,000 km2). Within the regional territory,
there are 128 oil & gas wells, of which 47 productive, 79 potential productive, destined to
5 source Osservatorio Ambientale Val d’Agri, http://www.osservatoriovaldagri.it, last accessed November, 2013.

CHAPTER 6
108
storage or other uses, two in mining closure. Moreover, it is required to add the 11 licences
for explorations and 17 requests for prospections and explorations6.
Moreover, the new Italian energy strategy pins its hopes on developing Italian onshore and
offshore oil fields, especially in the southern regions, with particular attention to Basilicata
(MISE, 2012). Due to the high production potential, Basilicata has all the requirements to
become the "Italian oil hub” for the next 20-‐30 with a potential perspective of doubling the
actual production. In 2011, it was signed a memorandum agreement between the National
government and the Basilicata Region for enhancing the regional development through
infrastructural and investments policies related to fossil fuel research and exploitations (Stato
Italiano and Regione Basilicata, 2011).
However, recently objections have been strongly raised against possible new regional Oil &
Gas prospections and explorations (onshore and offshore) from the regional government as
well as groups of local populations. In April 2012, the Regional government signed a
moratorium against new requests of prospections and explorations within the Basilicata
territory and seacoast (Regional Law 16-‐2012), which was declared unconstitutional in 2013
(Corte Costituzionale, Sentence n° 117-‐2013).
Moreover, several municipalities that neighbour the upper Val d'Agri valley as well as in the
northeastern part of the region have expressed their firm disapproval of requests of
prospections in their territory. In fact, it remains that Oil & Gas activities are perceived as a
relevant source of environmental damage rather than a driving force for growth and
development for local communities.
The Val d’Agri, Melandro, Sauro, Camastra District (Comprensorio Val d’Agri, Melandro,
Sauro, Camastra) is an internal area in the Southern Apennines, representing about 10% of
Basilicata territory (Figure 6.5). It presents a large number of protected areas characterised by
exceptional floral and faunal communities and it is also devoted to agricultural practises,
including 20 SCIs.
The District includes 35 municipalities and a total population of about 73.000 inhabitants. It is
also considered a homogenous area according to the Operative Programme Val d’Agri -‐ PO Val
6 source Ministero dello Sviluppo Economico (MISE), http://www.sviluppoeconomico.gov.it, last accessed March, 2013.

“VAL D’AGRI OIL FIELDS”: DEVELOPING FUTURE SCENARIOS
109
d’Agri, established within the European Regional Development Fund programme for the
period 2007-‐2013 (Regione Basilicata, 2007).
DISTRICT
Scale 1 : 800.000
Fig. 6.5 – Map of the District area. According to the PO Val d’Agri analysis7, the basic characteristics of the area can therefore be summarized as follows:
• small size of settlements, consisting of micro-‐communalities, affected by depopulation
(out-‐migration) for economic reasons (particularly acute in the south and in the north of
the district);
• socio-‐economically marginalized, sparsely distributed population; increasingly an ageing
population; significant deficiencies in social welfare and health services;
• poor quality of internal interconnections and infrastructural deficiencies in transport
network;
• high incidence of the inactive population;
• small and very small productive settlements, concentrated in traditional sectors
(construction and supply industry, traditional crafts), and agriculture combined.
Moreover Oil & Gas sector under development. Agriculture and animal husbandry also
7 (source Operative Programme Val d’Agri website, www.povaldagri.basilicata.it, last accessed November, 2013 ).

CHAPTER 6
110
generate high-‐quality and niche production (bean, oil, wine, cheese and other dairy
products) that can provide development opportunities for competitive local farms;
• abandonment of marginal land; cultivated area affected by desertification
• presence of significant ecological, archaeological, landscape, cultural resources (the area
contains relevant parks and protected area);
• areas classified at high seismic risk;
• high tourism potential but tourism development is still in their infancy due to limitations
and deficiencies in tourism-‐related services and transport systems.
Specifically, this District also includes the most important regional Oil & Gas concessions,
namely the Val d'Agri and Tempa Rossa fields. The two concessions are neighbouring, the first
lies in the Upper Val d’Agri, the second in the Sauro River Valley. The Sauro river is the most
important tributary of the Agri River. While the Tempa Rossa Oil & Gas field is expected to
coming onstream in next future (expected by 2016), the Val d’Agri Oil field currently covers
over 80% of crude oil Italian production corresponding to 6% of the national energy need
(Stato Italiano and Regione Basilicata, 2011). It is considered to be Europe's most promising
on-‐shore development area. Moreover, it is expected that Italy’s oil production will increase
nearly 40% with the Tempa Rossa production.
The upper Val d’Agri area lies in the north of the district, which is characterized by rural and
semi natural habitats with a landscape rich in biodiversity. It embraces 10 communalities and
less than 30.000 inhabitants. The Upper region of the valley covers an area of just under 600
km2 and is dominated by a valley-‐floor plain above an artificial lake (Lago del Pertusillo),
classified as wetland area and included in a sites of community importance area closed to the
Oil & Gas activities (Figure 6.6). There are relevant naturalistic, landscape, archaeological and
cultural resources. It partly lies in the National Park of Val d'Agri and Lagonegrese and includes
12 Sites of Community Importance (SCIs), 2 Special Protection Areas (SPAs) and an Important
Area for Birds (IBA) partially overlapping the national park.

“VAL D’AGRI OIL FIELDS”: DEVELOPING FUTURE SCENARIOS
111
Fig. 6.6– Map of the Upper Val d’Agri area.
Currently, the most of Val d’Agri concession oil rings and related services infrastructures lies in
the upper Val d’Agri. In particular, the Val d’Agri Oil & Gas reserves are estimated at around
600 million barrels of oil equivalent (including oil and associated natural gas), representing the
Western Europe’s biggest onshore oil field. Table 6.2 gives an overview of the main
characteristics of the two existent and potential Oil & Gas developments.
As a note of terminology, in the subsequent sections Region, District and Site stand for
Basilicata, the Val d’Agri, Melandro, Sauro, Camastra District, and the Upper Val d’Agri
respectively.
�
�����
�� ��������� ����������
�
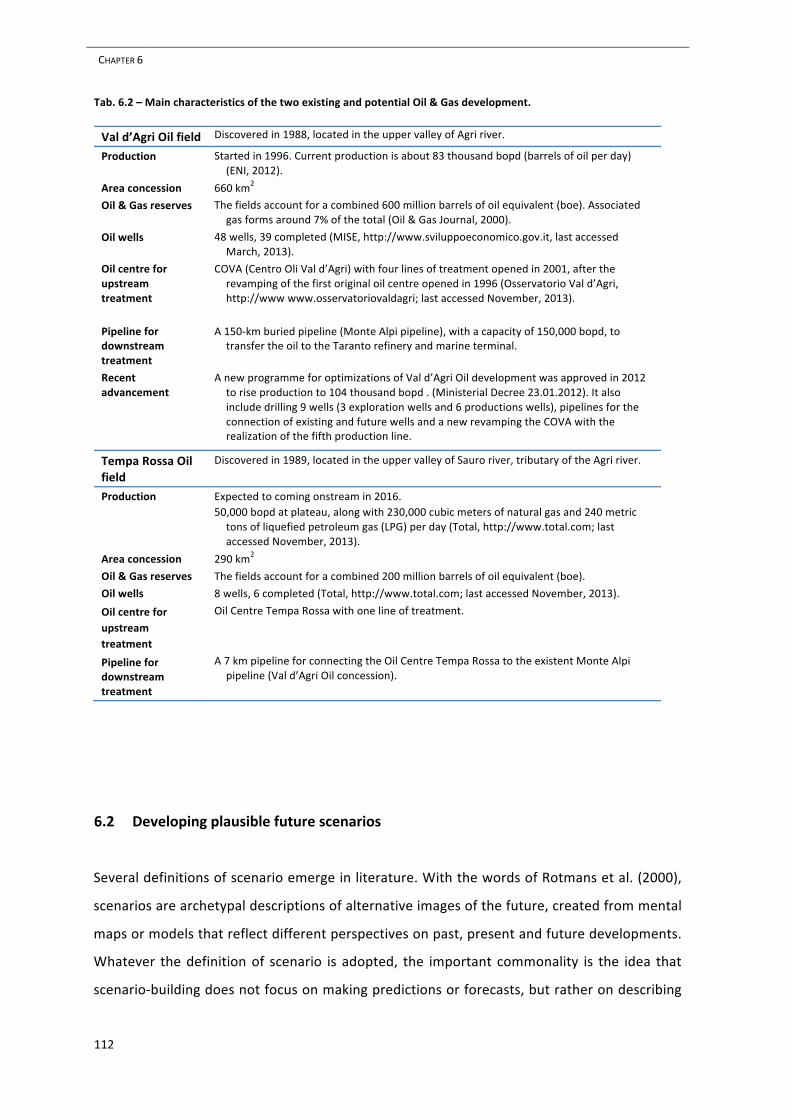
CHAPTER 6
112
Tab. 6.2 – Main characteristics of the two existing and potential Oil & Gas development.
Val d’Agri Oil field Discovered in 1988, located in the upper valley of Agri river.
Production Started in 1996. Current production is about 83 thousand bopd (barrels of oil per day) (ENI, 2012).
Area concession 660 km2
Oil & Gas reserves The fields account for a combined 600 million barrels of oil equivalent (boe). Associated gas forms around 7% of the total (Oil & Gas Journal, 2000).
Oil wells 48 wells, 39 completed (MISE, http://www.sviluppoeconomico.gov.it, last accessed March, 2013).
Oil centre for upstream treatment
COVA (Centro Oli Val d’Agri) with four lines of treatment opened in 2001, after the revamping of the first original oil centre opened in 1996 (Osservatorio Val d’Agri, http://www www.osservatoriovaldagri; last accessed November, 2013).
Pipeline for downstream treatment
A 150-‐km buried pipeline (Monte Alpi pipeline), with a capacity of 150,000 bopd, to transfer the oil to the Taranto refinery and marine terminal.
Recent advancement
A new programme for optimizations of Val d’Agri Oil development was approved in 2012 to rise production to 104 thousand bopd . (Ministerial Decree 23.01.2012). It also include drilling 9 wells (3 exploration wells and 6 productions wells), pipelines for the connection of existing and future wells and a new revamping the COVA with the realization of the fifth production line.
Tempa Rossa Oil field
Discovered in 1989, located in the upper valley of Sauro river, tributary of the Agri river.
Production Expected to coming onstream in 2016. 50,000 bopd at plateau, along with 230,000 cubic meters of natural gas and 240 metric tons of liquefied petroleum gas (LPG) per day (Total, http://www.total.com; last accessed November, 2013).
Area concession 290 km2
Oil & Gas reserves The fields account for a combined 200 million barrels of oil equivalent (boe).
Oil wells 8 wells, 6 completed (Total, http://www.total.com; last accessed November, 2013).
Oil centre for upstream treatment
Oil Centre Tempa Rossa with one line of treatment.
Pipeline for downstream treatment
A 7 km pipeline for connecting the Oil Centre Tempa Rossa to the existent Monte Alpi pipeline (Val d’Agri Oil concession).
6.2 Developing plausible future scenarios
Several definitions of scenario emerge in literature. With the words of Rotmans et al. (2000),
scenarios are archetypal descriptions of alternative images of the future, created from mental
maps or models that reflect different perspectives on past, present and future developments.
Whatever the definition of scenario is adopted, the important commonality is the idea that
scenario-‐building does not focus on making predictions or forecasts, but rather on describing

“VAL D’AGRI OIL FIELDS”: DEVELOPING FUTURE SCENARIOS
113
images of the future that challenge current assumptions and broaden perspectives (Duinker
and Greig, 2007).
Scenarios are commonly clustered into two main categories:
• normative answering the question -‐ How can a specific target be reached? ; and
• explorative answering the question -‐ What can happen?
Normative scenarios are anticipatory scenarios that start with a prescribed vision of the future
(either optimistic, pessimistic, or neutral) and then work backwards in time to visualise how
this future could emerge (Alcamo and Henrichs, 2008).
Explorative scenarios start in the present (i.e. with an initial situation) on the base of a set of
assumptions of policies, measures and key driving forces (Alcamo et al., 2008). Explorative
scenarios are thus explorations of what might happen in the future, regardless of beliefs of
what is likely to happen or opinions of what is desirable.
Essentially explorative scenarios consist of states, driving forces, events, consequences and
actions which are causally related (Rotmans et al., 2000). Each stories describes a plausible,
but not necessarily, path of key variable such as population, economic activity and energy use
(de Vries, 2013).
This category is further divided into external and strategic scenarios (Börjeson et al., 2006):
! external scenarios respond to the user’s question: What can happen to the development of external factors?
! strategic scenarios respond to the question: What can happen if we act in a certain way?
For the purposes of this research, strategic scenarios were of particular interest. Strategic
scenarios focus on internal factors (i.e. factors it is possible to affect), and take external
aspects into account. The aim of strategic scenarios is to describe a range of possible
consequences of strategic decisions. They incorporate policy measures at the hand of the
intended scenario user to cope with the issue at stake. In these scenarios, the goals are not
absolute but targets are defined.
Different policies are typically tested and their impact on the target variables is studied
(Börjeson et al., 2006). These scenarios may be suitable to use not only for reacting but also
for acting (Finnveden et al., 2003). It is a way to assess new options for the future and identify

CHAPTER 6
114
ignored trade-‐offs (de Vries, 2013). Thus, it is important to notice that such approach could
contribute to implement adaptive management schemes, which are increasingly considered
as key and pragmatic strategies towards sustainability (e.g. Levin, 2012).
The methodology followed for developing scenarios was clustered into three main steps
(modified from Kosow and Gaßner, 2008):
• Identification and analysis of key elements; • Identification of spatial and temporal boundaries; and • Scenario generation.
6.2.1 Identification and analysis of key elements
In order to establish a sound theoretical foundation for developing scenarios, a preliminary
empirical and theoretical analysis in the form of desk research was carried out. As asserted by
de Vries (2013), it represents a crucial step for allowing that required information about key
elements could be fed into the scenario process. Particular attention was given to issues and
concerns emerged from analysis of state of art, recent regional policies and trend analysis and
documents relevant for potential Oil & Gas Development as well as consultation of dedicate
institutional and dedicated website. Specifically, Oil & Gas activities state of art in Basilicata
was essentially gathered from dedicated websites8. Moreover, significant policy documents,
such as Basilicata Regional policies for sustainable development strategy and related studies
(Boschma et al., 2013; Regione Basilicata, 2007), Italian energy strategy (MISE, 2012; MAP,
2005), Oil & Gas agreement between the Italian Government and the Basilicata Region (Stato
Italiano and Regione Basilicata, 2011), and related regional policy measures (Regional Law 16-‐
2012) were reviewed.9
Ecological, social and economic aspects and characteristics were gathered from reports
undertook by authorities at different level, from European to regional scale (see Annoni and
Dijkstra, 2013; Banca d’Italia, 2013; ISTAT, 2013; 2013a; 2013b; ISTAT and CNEL, 2013; MISE,
2013; Regione Basilicata et al., 2012; SVIMEZ, 2012; Annoni and Kozovska, 2010). Potential
discontent on Oil & Gas activities in Basilicata was broadly evaluated by considering news
8 Regione Basilicata, http://www.regione.basilicata.it; Osservatorio Val d’Agri, http://www.osservatoriovaldagri; MISE, http://www.sviluppoeconomico.gov.it; ENI, http://www.eni.com.it; TOTAL, http://www.total.com. 9 sources: Boschma, 2013; Regione Basilicata, 2007; ISTAT, 2013a; 2013b; Banca d’Italia; Annoni and Dijkstra, 2013; Regione Basilicata et al. 2012; Stato Italiano and Regione Basilicata; 2011; Regione Basilicata, 2007).
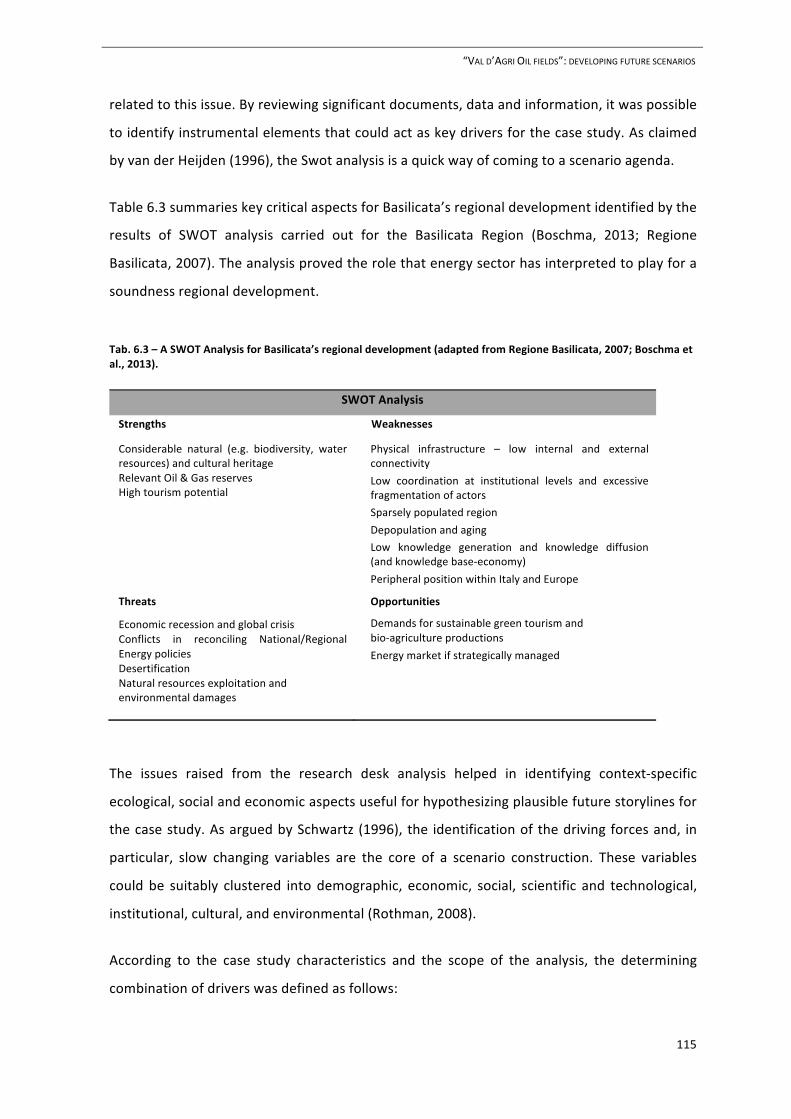
“VAL D’AGRI OIL FIELDS”: DEVELOPING FUTURE SCENARIOS
115
related to this issue. By reviewing significant documents, data and information, it was possible
to identify instrumental elements that could act as key drivers for the case study. As claimed
by van der Heijden (1996), the Swot analysis is a quick way of coming to a scenario agenda.
Table 6.3 summaries key critical aspects for Basilicata’s regional development identified by the
results of SWOT analysis carried out for the Basilicata Region (Boschma, 2013; Regione
Basilicata, 2007). The analysis proved the role that energy sector has interpreted to play for a
soundness regional development.
Tab. 6.3 – A SWOT Analysis for Basilicata’s regional development (adapted from Regione Basilicata, 2007; Boschma et al., 2013).
SWOT Analysis
Strengths
Considerable natural (e.g. biodiversity, water resources) and cultural heritage Relevant Oil & Gas reserves High tourism potential
Weaknesses
Physical infrastructure – low internal and external connectivity
Low coordination at institutional levels and excessive fragmentation of actors
Sparsely populated region
Depopulation and aging
Low knowledge generation and knowledge diffusion (and knowledge base-‐economy)
Peripheral position within Italy and Europe
Threats
Economic recession and global crisis Conflicts in reconciling National/Regional Energy policies Desertification Natural resources exploitation and environmental damages
Opportunities
Demands for sustainable green tourism and bio-‐agriculture productions
Energy market if strategically managed
The issues raised from the research desk analysis helped in identifying context-‐specific
ecological, social and economic aspects useful for hypothesizing plausible future storylines for
the case study. As argued by Schwartz (1996), the identification of the driving forces and, in
particular, slow changing variables are the core of a scenario construction. These variables
could be suitably clustered into demographic, economic, social, scientific and technological,
institutional, cultural, and environmental (Rothman, 2008).
According to the case study characteristics and the scope of the analysis, the determining
combination of drivers was defined as follows:

CHAPTER 6
116
• Governance: political driving forces (e.g. cooperation/conflicts in National/Regional policies
and strategies); • Demographic aspects: strong population decreasing/depopulation/emigration (assumed as
exogenous variable); • Technological and infrastructural aspects: potential advancement in Oil & Gas
technologies, investments and incentives in transport infrastructures and related services; • Economic aspects: increase of demand for Oil & Gas, needs of ensuring affordable energy
reducing the dependence on imported fossil fuel; demands for green tourism and biological productions;
• Environmental aspects: preserving biodiversity and ecosystem function and contrasting rising emergencies (e.g. desertification, air and water pollutions increasing, nature and heritage conservation, contributing to the achievement of carbon emission reductions and security of energy supply);
• Social aspects: increasing/decreasing acceptability (opposition from interest groups, such as farming and tourism environmentalist organization); increase in human health diseases (e.g. cancer diseases).
Subsequently, following a consolidated integrated scenario methodology (see Rotmans et al.
2000), the significant variables were grouped into a selective number of factors, sectors and
actors around which to centre each scenario (Figure 6.7).
6.2.2 Identification of spatial and temporal boundaries
Scenarios can be developed varying geographical scopes, ranging from the global scale to
supranational areas, to national, to sub-‐national or regional areas, and finally to local areas
(Greeuw et al., 2000; Van Notten, 2003). According to the purpose of this study, geographical
scale levels were chosen considering primarily two main geographical points of reference for
case-‐study scenarios: local (site and district, the Upper Val d’Agri and the Val d’Agri,
Melandro, Sauro, Camastra District) and regional (Basilicata) levels.
Following Rotmans et al. (2000), the integrations of different levels were supposed to be
achieved by observing the two levels in parallel and also including bottom-‐up and top-‐down
integration across them. In addition the scenario construction took into account potential
influences derived from and exerted on national trends affecting and being affected by sub-‐
national and local levels according to the issue-‐based analysis, primarily the National energy

“VAL D’AGRI OIL FIELDS”: DEVELOPING FUTURE SCENARIOS
117
strategy (Figure 6.7).
Two temporal scales were considered as focal scales for quali-‐quantitative estimations of the
equity criteria against scenarios: a shorter time horizon (a few years) and a medium-‐long time
horizon of about 20 years (focus is through 2030). This choice took also into consideration
available information of total proven reserves related to current Oil & Gas exploitations.10
Fig. 6.7 – Key variables for scenario narrative generation (adapted and modified from Rotmans et al. 2000).
Figure 6.7 synthetises the variables chosen and the geographical scale levels of interest
considered for constructing case study narrative scenarios. The analysis focused on local and
regional scenarios taking into account the external influences due to national governance in
the energy sector.
6.2.3 Scenario generation
The design of possible composite scenarios of interactions among environmental, social and
economic aspects for this study was descriptive. Possible futures were based on qualitative
scenario storylines (narratives) and trends of the most important drivers (Alcamo et al. 2008, 10 sources: MISE, http://www.sviluppoeconomico.gov.it; Regione Basilicata, http://www.regione.basilicata.it; Osservatorio Val d’Agri, http://www www.osservatoriovaldagri.
!!!
REGIONAL SCENARIO
LOCAL SCENARIO
Factors:
• Employment • Environmental • Governance • Demography • Technology
Actors: • Oil & Gas Companies • Govermental Bodies • Regional Authorities • Local Authorities • Local population • Interest groups • NGOs
Sectors: • agriculture • tourism • energy
NATIONAL SCENARIO

CHAPTER 6
118
Schwartz, 1996). Given that the specific drivers identified, the process to develop scenarios for
the case study was based on identifying key relationships by which those drivers might
interact. Questions related to pending land use and environmental decisions related to Oil &
Gas development framed the examination of possible futures.
To this purpose, following similar approaches adopted in consolidated scenario exercises (e.g.
Special Report on Emissions Scenarios (SRES), see Morita et al., 2001; Millennium Ecosystem
Assessment, see MA, 2003), the scenario-‐axes technique was used to facilitated the process of
generate scenarios and rendering them into plausible futures (see Eickhout et al., 2007; Van’t
Klooster and van Asselt, 2006).
Fig. 6.8 – Scenario axes for constructing possible future storylines.
Two dimensions were used, along which future alternatives might be constructed, which
represent two critical uncertain drivers influencing most or all of the others: strong-‐economic
agenda versus strong-‐environmental agenda and localism/regionalisation against
nationalization. One axis characterizes a context that is focused on economic values (strong-‐
Focus: economic values with local interests prevailing.
• Current environmental restrictions not increased but new expansion of Oil & Gas activities limited to the Val d’Agri area.
• Current Oil & Gas revenues used to promote other market activities and improve physical infrastructure and mobility.
Strong-environmental Agend a
1
Strong-economi c Agend a
Loc al le vel
2
National level
Focus: not exclusively economic, societal and environmental values taken under consideration.
• National and regional levels strongly cooperate among each other.
• Oil & Gas sector not further expanded • National and regional agreements on
environment, biodiversity, human health. safety, working conditions play an
Focus: economic values with national/market interests prevailing.
• Full potential related to Oil & Gas are taken under considerations.
• Current environmental restrictions not increased and expansion of Oil & Gas explorations in other areas of the Region accepted.
Focus: non-economic values and local positions against Oil & Gas activities prevail.
• Strong environmental protection and resource saving in regional policies.
• Current Oil & Gas revenues are used to promote green tourism and agriculture.
A
B
D
C

“VAL D’AGRI OIL FIELDS”: DEVELOPING FUTURE SCENARIOS
119
economic agenda) versus one that is focused on social and environmental values (strong-‐
environmental agenda). The other axis characterizes a context in which local prevails versus
national level of decision (Figure 6.8). The two axes define four quadrants, namely A, B, C, D,
along which scenarios might be hypothesized (Figure 6.8).
As described by Neville et al. (2010) by combining the extreme assumptions of each of the two
axes, four scenarios logics emerge that can be used to develop the main stories of the
scenarios.
Scenario assumptions and storylines Each of the four scenario quadrants, plotted using the scenario-‐axes technique, represented a
different perspective on how the future may unfold, that helps in taking into account critical
uncertainty. According to the scenario quadrants and taking into account the results of the
empirical and theoretical data analysis, it was firstly possible to distinguish specific
assumptions related to Oil & Gas development and degree of expansion of Oil & Gas activities
(Table 6.4) and, lastly, the related scenario storylines clustered into the key drivers identified
(Table 6.5).
Tab. 6.4 – Scenario assumptions.
SCENARIO QUADRANT
POSSIBLE ASSUMPTIONS DEGREE OF OIL & GAS EXPANSION SELECTED FOR THE ANALYSIS
A
1A: expansion limited to the upper Val d’Agri field plus Tempa Rossa field (under realization) according to existent approved concessions.
Increase of Oil & Gas extractions in the Upper Val d’Agri according to approved concession (from current 85.000 barrels/day up to about 104.000 barrels/day) plus the Tempa Rossa field (50.000 barrels/day).
B
2B: 1A plus new concessions in neighbouring areas (expansion within the Val d’Agri field and the Tempa rossa field areas).
Increase Oil & Gas extractions in the Val d’Agri field (up to about 130.000 barrels/day) plus the Tempa Rossa field (from 50.000 barrels/day up to 100.000. barrels/day).
C
3C: Current Oil & Gas production of Val d’Agri field plus the Tempa Rossa field development that is under realization.The focus is on both economic and non-‐economic values, but regional interests prevail.
The current Oil & Gas extractions in the Val d’Agri field (85.000 barrels/days) plus starting of the Tempa Rossa field (50.000 barrels/day).
D
4D: baseline scenario (only Val d’Agri field neither increase in Oil & Gas production nor further expansions in neighbouring areas or in other areas).
The current Val d’Agri field extractions (about 85.000 barrels/day).

CHAPTER 6
120
Tab. 6.5 – Scenario storylines. Scenario storylines Key drivers
A B C D
Econ
omic National economic strategies and
companies push for increasing exploitations, but there is a general opposition to allow new explorations and exploitations. Companies negotiate agreement with local authorities for achieving the maximum limit of production previously approved. “Local content” agreement between stakeholders (Regional and local authorities, trade unions and companies) for enhancing the regional occupation in the Oil & Gas sector. Revenues are used for socio-‐economic investments (e.g. infrastructures and facilities).
National economic strategies companies powerfully interested in increasing exploitations in Basilicata. Companies negotiate specific agreement with the Region and communalities for enhancing their economic development (e.g. mechanisms of compensation based on share of gas extracted given to the interested communalities rather than royalties). Oil & Gas revenues are used for socio-‐economic investments especially related to service infrastructures and facilities.
Even if companies are powerfully interested in increasing exploitations, national and regional economic strategies are direct to improve the current economic situations, focusing on diversification and enhancement of environmental and cultural heritage. Oil & Gas revenues are invested for supporting green tourism, agriculture, service and mobility infrastructures, protection of the environment, biodiversity, and human health safety.
Infrastructural investments for incentivising green tourism and biological productions, as well as, incentives to local farm productions (low intensity) and “bio productions” are promoted.
Gov
erna
nce Even if the authority to approve Oil &
Gas activities is exclusively national, the national government is conditioned by the positions of the regional and local authorities and territories. Regional government is in accord with local administrators and territories to exchange increasing explorations (according to the threshold previously approved) with valuable economic agreements with the national government and the Oil & Gas companies.
Having the exclusive authority to approve Oil & Gas activities, the national government is determined to implement the national strategy related to fossil fuel. Regional government is in accord with the national government for expanding Oil & Gas activities, and local administrators and territories follow the decision to increase explorations. Public institutions and regional authorities trust in Oil & Gas sector as a driving force for growth and development for local communities, by seeking to negotiate valuable economic agreements with the national government and companies.
Even if the authority to approve Oil & Gas activities is exclusively national, the national and regional levels cooperate among each other and with the local level. The national government is in accord with regional government, local administrators and territories that approved Oil & Gas activities are adequate for growth and development for local communities without increasing pressures on the environment.
Conflicts in national/regional policies and strategies. Regional government tries to curb the Oil & Gas activities, and local administrators and territories agree with the decision to put a stop to explorations. Although having the exclusive authority to Oil & Gas authorizations, the national government is forced to change strategies related to own productions of fossil fuel in Basilicata.
Social Low/progressive decrease in
acceptability of Oil & Gas activities. They are still perceived as a relevant source of environmental degradation and human health diseases. The opposition from interest groups (e.g. farming and tourism environmentalist organization) and common citizens especially in other areas interested by research permits coexist with positions of public institutions and regional authorities, which trust in Oil & Gas development, and social demands for facing poverty, deprivation and underdevelopment.
Low/progressive decrease in acceptability of Oil & Gas activities. They are still perceived as a relevant source of environmental degradation and human health diseases. The opposition from interest groups (e.g. farming and tourism environmentalist organization) and common citizens is weakened by the positions of public institutions and regional authorities that trust in Oil & Gas development for facing poverty, deprivation and underdevelopment.
Progressive acceptability of Oil & Gas activities. They are still perceived as a relevant source of environmental degradation and human health diseases, but a systematic program for transparency, consultation and public participations in decision and follow-‐up is supporting the resolution of conflicts. Active participation of citizens encourages the confidence that multi-‐level governance could powerfully help in facing poverty, deprivation and underdevelopment.
Strong decreasing acceptability of Oil & Gas activities (e.g. perceptions related to increase in human health diseases and environmental degradations). Strong opposition from interest groups, such as farming and tourism environmentalist organizations.
Environm
ental Current environmental restrictions are
not increased but expansion of explorations is allowed according to approved concessions in the area even if they could be closed to protected areas, natural parks and sensitive areas.
Current environmental restrictions are not increased and expansion of explorations is promoted even if they could be closed to protected areas, natural parks and sensitive areas included coastal areas.
More stringent environmental restrictions are imposed to existent and under realization activities. Cumulative monitoring programmes are established.
Preserving biodiversity and ecosystem function and contrasting rising emergencies (e.g. desertification, air and water pollutions increasing, nature and heritage conservation, etc.) become the priorities. Sustainable management of natural resources is promoted.
Dem
ograph
ic Strong population
decreasing/depopulation/ emigration
Strong population decreasing/depopulation/ emigration
Demographic aspects: Some signals of population decreasing/depopulation/ emigration reversion
Strong population decreasing/depopulation/emigration
Techno
logical/Infrastructural Oil & gas technologies maintain the
current level of efficiency and technological characteristics, but they need to be adequate to support the increase in barrels production; in particular new infrastructures and service facilities are under construction for the realization of the Tempa Rossa field.
Oil & Gas technologies maintain the current level of efficiency and technological characteristics; they need to be strongly adequate to support the increase in barrels production and new infrastructures and service facilities are realized.
Strong technological advancements are imposed to the Oil & Gas sector not expanded (excepted which are under realization).
The Oil & Gas technologies maintain the current level of efficiency and technological characteristics.

“VAL D’AGRI OIL FIELDS”: DEVELOPING FUTURE SCENARIOS
121
6.3 Discussion and conclusion
The impact of a strategic action, or the relative benefits and disbenefits of different options,
depends on variables outside the strategic action’s control (Therivel, 2010). Scenario approach
offers a power platform for envisioning future outcomes, by helping in recognizing key aspects
for future development and analysing the interconnections among them. The adoption of a
scenario matrix appears as a valuable visual and logical aid in view of developing scenario
qualitative narratives. In fact, after having broadly determined the four scenarios on the basis
of the two scenario dimensions defined in the matrix, it was more workable to structure
plausible and realistic storylines according to the key drivers identified for the case study.
However, in relation to scenario content characteristics, some reflections on limitations of the
study need to be made. It is important to observe that these characteristics essentially
accomplish the goal of testing the equity approach, rather than identifying and cope with
great uncertainty related to future. Thus, the scenario exercise proposed was more related to
conventional rather than alternative scenarios. According to van Notten et al. (2003), the first
typology has the aim to fine-‐tune current strategy and overlap between the scenarios are
possible, while the second describes future that differently from one another with the aim of
raising awareness and understanding about new or uncertain issues.
This choice was also conditioned by the method used for collecting information and
identifying key aspects and issues, namely, desk research rather than participatory approach.
In fact, participatory approaches, which draw on expert and stakeholder inputs (including in
particular local inhabitants), are considered crucial for widening the range of possible
alternatives and challenging new dynamics and uncertain issues (e.g. Helming and Pérez-‐soba,
2011; Zhixi et al., 2011; Morris, 2011; van Notten et al. 2003). Either way, undertaking
participative techniques, such as surveys, brainstorming workshops and Delphi methods, was
outside the scope of this research. Nevertheless, the scenario study tried to achieve a
consistent degree of interaction between variables and dynamics across time and spatial scale
in relation to equity issues.
In the chapter that follows, I will go into detail about the comparison and assessment of the
scenario storylines, developed in this chapter, against a set of equity criteria and indicators
identified for the case study according to the equity framework presented in Chapter 3.


Chapter 7
7. “Val d’Agri Oil fields”: Testing the equity criteria set In this chapter, I will test the equity approach suggested in Chapter 3, by investigating how
different decisions involving Oil & Gas development for the case study will affect the
distribution of benefits and disbenefits at intra-‐ and inter-‐generational level. To do this, I will
apply a quali-‐quantitative empirical approach. According to the equity perspectives and the
general criteria for addressing equity, previously identified (see Tables 3.6 to 3.9), combined
to crucial aspects emerged in Chapters 4 and 5, as well as, concerns gathered from the
analysis undertaken in Chapter 6, I will propose a set of context-‐ and place-‐ based equity
criteria and corresponding indicators appropriate for the case study. Then, I will apply this
metrics against the scenario storylines drawn in Chapter 6. Thereafter, I will examine and
compare trade-‐offs between human and environmental systems under the different
scenarios. Finally, suggestions will be provided on how to include in a more comprehensive
way equity considerations to support decision-‐making processes at strategic level.
7.1 Selecting context-‐specific equity criteria
In Chapter 3, four equity perspectives, and associated principles, were identified (see Table
3.5). As stated in Chapter 4, it is crucial to take into consideration that criteria need to be
specified to the context involved in the analysis (Gibson, 2006). Thus, a set of context-‐specific
equity criteria were derive from these perspectives in accordance to the general criteria, listed
in Table 3.6 to 3.9, and adapted and/or specified, where needed, for the case study
characteristics. Thus, the analysis conducted to identify 19 criteria, which:
• accomplish the general statements considered in Chapter 3; • are related to Oil & Gas development, and • find applicability for the case study in relation to place-‐based issues and data
convenience and availability.
CHAPTER 7
124
For instance, looking at the opportunity perspective, the general criterion of providing a clean
and healthy environment was confirmed by referring to the link between air quality and life
satisfaction (e.g. Ferreira et al, 2013). It was taken into consideration impact on air quality of
the central production facility, so called Oil & Gas center, which gathers and separates the
produced fluids (oil, gas and water), once the crude oil reaches the surface. Similarly, the
criterion potential for new occupation was related to direct and indirect possible new jobs
connected to construction and exercise of Oil & Gas upstream activities (e.g. drilling,
exploration, exploitation, crude oil treatments, pipeline maintenance, etc.).
Another specific criterion was over perceived change in standard of living, which focuses on
the position of local people about opportunity offered by Oil & Gas development, important
issues strongly emerged from SEA of Oil & Gas analysis, as well as, the case study empirical
analysis. Potential change in access to environmental assets criterion considers consumption
of resources that are withdrawn from other uses.
In terms of distributional fairness, migration from the areas interested by the Oil & Gas
activities captures aspects of the potential development that affect life and property and
potential change in historical territory vocation (e.g. potential progressive abandonment of
agricultural practice). Resource productivity attempts to interpret efficiency in the use of
resources by assessing the direct connection between resource use and environmental
degradation (e.g. Steinberger and Krausmann, 2010).
In relation to the distributional fairness across generation perspective, cumulative impact of
well pads and associated roads for servicing is a specific criterion that aim at overarching
concerns in relation to sustaining the ecological integrity, particularly in terms of the
implications for biodiversity, habitat fragmentation, and the spread of non-‐native species, due
to this significant disturbance associated to Oil & Gas development (e.g. Government of
Saskatchewan, 2007).
With regard to the justice for an imperfect world perspective, contribution to more lasting
future options criterion tries to capture aspects of the intertwined demand of recognizing
trade-‐offs as well as offering more beneficial solutions in the long-‐run, which is particularly
highlighted for Oil & gas development, as discussed in Chapter 4 and 5.
Potential for managing the pace and scale of development criterion reflects on the potential
contribution of Oil & Gas development in building a more diverse economic base and enabling
leverage effects in the long-‐run, as stressed by an important sustainability test applied to Oil &

“VAL D’AGRI OIL FIELDS”: TESTING THE EQUITY CRITERIA SET
125
Gas sector in Canada (see Gibson, 2011; Joint Review Panel for the Mackenzie Gas Project,
2009). Potential for managing conflict between communities considers efforts undertaken by
proponents of developmental initiatives to avoid conflicts due to inequitable distribution and
changes in territory development, such as contribution to cultural/recreational activities and
compensation measurements.
Table 7.1 presents the proposed set of context-‐specific equity criteria applicable to the case
study.
Tab. 7.1 – Equity criteria identified for the case study.
EQUITY PERSPECTIVE EQUITY CRITERIA
OPPORTUNITY
Potential for new occupation in the Oil & Gas Sector;
Clean and healthy environment;
Perceived change in standard of living;
Potential change in access to environmental assets;
Contribution to reduce the dependence on imported fuel.
DISTRIBUTIONAL FAIRNESS
Migration from the areas interested by the Oil & Gas activities;
Economic benefits;
Exposure to risk;
Acceptability of Oil & Gas activities;
Resource productivity.
DISTRIBUTIONAL FAIRNESS ACROSS GENERATIONS
Cumulative impact of well pads and associated roads for servicing infrastructure;
Resource impact;
Impact on protected areas;
Sustainable management of resources;
Detrimental effects on land consumptions.
JUSTICE FOR A IMPERFECT WORLD
Contribution to more lasting future options;
Potential for managing the pace and scale of development;
Potential for managing conflict between communities;
Undertaken adaptation and mitigation measures.

CHAPTER 7
126
7.2 From equity criteria to indicators
In order to allow a quali-‐quantitative comparison of the scenario narratives against the equity
criteria, the criteria proposed in Table 7.2 were applied and analysed in terms of possible
corresponding context-‐specific indicators tailor-‐made for the case study. Measurable equity
indicators were identified and subdivided into the four groups of equity criteria proposed.
Indicators were largely populated by quantitative data, some qualitative data were used for
measuring some of the justice for an imperfect world parameters. Thus, implications entailed
in the four hypothesised scenarios for intra-‐ and inter-‐generational equity were empirically
measured throughout the equity criteria and corresponding indicators and measures.
Table 7.2 summarises the equity indicators adopted.
The selection of indicators was closely linked to the equity criteria according to issue-‐based as
well as area-‐based elements derived from the preliminary empirical and theoretical analysis
undertaken in Chapter 6, as well as insights drawn from the investigations in Chapters 4 and 5.
The 23 indicators proposed were determined by considering the following benchmarks:
i) derived by existent list of sustainability indicators (e.g. MA, 2003; EEA website,
http://www.eea.europa.eu/data-‐and-‐maps/indicators; Sensor, 2008);
ii) sensitivity to scenarios in relation to Oil & Gas issues;
iii) data availability and operability.
Regarding methodological aspects, the proposed indicators needed to be adapted to data
availability. Thus, it was necessary to rethink some indicators originally hypothesized. For
example, the indicator “resettlements” preliminary chosen for the criteria “migration from the
areas interested by the Oil & Gas activities”, was transformed to the indicator “migration rate”
related to demographic statistics on changes of place of residence, since it was no possible to
draw information specifically related to migrations caused by the Oil & Gas activities. Either
way, undertaking a dedicated survey for such an issue was outside the scope of the research.

“VAL D’AGRI OIL FIELDS”: TESTING THE EQUITY CRITERIA SET
127
Tab. 7.2 – Equity indicators for the case study. EQUITY PERSPECTIVES
EQUITY CRITERIA ID INDICATOR DESCRIPTION
OPPORTUNITY Potential for new occupation in the Oil & Gas Sector
1 Employment opportunity for local workers
Number of local workers occupied in the Oil & Gas sector (directly and indirectly)
Clean and healthy environment 2 Emissions due to Oil & Gas activities
ton of S02
Perceived change in standard of living
3 Young people incidence on total population
Proportion of population aged 0-‐14 – percentage
Potential change in access to environmental assets
4 Water consumptions due to Oil & Gas activities
m3 of water
Contribution to reduce the dependence on imported fuel
5 Proportion of the national energy need provided: oil
Mtep provided / Mtep Oil & Gas Italian needs
6 Proportion of the national energy need provided: gas
DISTRIBUTIONAL FAIRNESS
Migration from the areas interested by the oil & gas activities
7 Migration rate Population cancelled due to change of place of residence / Total population cancelled from the population register – percentage
Economic benefits 8 Economic benefit between the regional and local territorial governments:
Revenue from Oil & Gas development – Meuro Hydrocarbon bonus benefit – Meuro 9 Direct economic benefit for
population Exposure to risk
10 Disturbance on sensitive social
group Number of schools within 5 km from areas interested by developmental activities / Total number within the territory
Acceptability of oil & gas activities
11 Municipalities protesting and opposed to current Oil & Gas activity management
Number municipalities protesting / Total municipalities – percentage
Resource productivity 12 Effective use of Oil & Gas resources
Value Added / yearly total crude Oil & Gas production * (Meuro /kBoe – percentage)
DISTRIBUTIONAL FAIRNESS ACROSS GENERATIONS
Cumulative impact of well pads and associated roads for servicing infrastructure
13 Anthropogenic surface disturbance of native habitat
Km / Km2 of roads and trails
Resource impact 14 Environmental damage and loss of environmental quality
Amount of water re-‐injected after Oil & Gas upstream treatment – m3
Impact on protected areas
15 Proximity of protected areas to areas interested by Oil & Gas activities
16 Change of core biodiversity
areas
Protected area in a buffer of 3000 m from oil & gas field / Territory –percentage Protected area in a buffer of 3000 m from oil & gas field / Protected area in territory – percentage
Sustainable management 17 Area of agricultural ecosystems under sustainable management
Land managed with organic method / Territory – percentage
Detrimental effects on land consumptions
18 Land area covered by Oil & Gas main activities
Land area affected by Oil & Gas activities / Territory – percentage
JUSTICE FOR AN IMPERFECT WORLD
Contribution to more lasting future options
19 Agreements and initiatives for lasting future options
Qualitative assessment**
Potential for managing the pace and scale of development
20 Investments into Research & Development
Value Added / Expenses in R&D -‐ percentage
Potential for managing conflict between community (a)
21 Oil & Gas companies contribution for local development (for activities, events, territory promotions)
Meuro
Potential for managing conflict between communities (b)
22 Other compensation measurements
Qualitative assessment**
Adaptation and mitigation measures
23 Actions related to system of monitoring and follow–up
Qualitative assessment **
* Value Added (VA) = the indicator is defined as the total gross value added per sector for agriculture, industry, constructions and services. In national/regional accounts used in macroeconomics, it refers to the contribution of the factors of production, i.e., capital (e.g., land and capital goods) and labor, to raising the value of a product and corresponds to the incomes received by the owners of these factors. The national/regional value added is shared between capital and labor (as the factors of production), and this sharing gives rise to issues of distribution. This indicator can make the economic impact of a policy more visible than Gross Domestic Product (GDP), especially at regional and local level (Bach et al., 2008).
** Qualitative assessments = in case of more actions and/or measurements, the total number was summed without assigning weights.

CHAPTER 7
128
Nevertheless, it is important to highlight that the review of equity perspectives and the
general criteria drawn up from Chapter 3 allowed recognizing suitable proxy indicators. For
instance, the criterion “perceived change in standard of living” was linked to the indicator
“young people incidence on total population”, taking into consideration that variations in this
indicator might reflect changing in well-‐being perceptions of local population, providing an
indirect sign of their propensity to have children and/or remain in their own towns.
7.3 Assessing scenarios using the proposed criteria and indicators
The scenarios were assessed against the equity criteria by measuring the corresponding
indicators at short, as well as, medium/long term. As mentioned in Section 6.3.2, the quali-‐
quantitative estimations of the equity criteria against scenarios encompassed a shorter time
horizon (a few years) and a medium-‐long time horizon of about 20 years (focus is through
2030).
In this regard, Table 7.3 summarises indicators metrics and source of baseline data. In
Appendix hypotheses and assumptions considered for populating indicators and deriving
measures for the four scenarios are detailed. In this regard, it is important to note that
Scenario D depicts a baseline status in short term, and business as usual conditions in
medium-‐long term, while Scenario A, B and C represent possible variations of this status at the
two temporal scales, according to hypothesized narrative assumption and storylines
presented in Chapter 6 (Tables 6.4 and 6.5).
The approach adopted was to compare results at the three nested geographical scales at short
as well as medium-‐term. Thus, where criteria were solely connected to site or/and district
values, regional values were coincided to site or district elaborations. An example of this
approach is estimations of emissions due to Oil & Gas activities. It is therefore important to
note that some criteria present same values at the different geographical scales, because it
was assumed that related implications and effects are equally shared at the different scales.
For example, due to interconnections in the Basilicata water supply system, water
consequences were considered independently of the source of impact.

“VAL D’AGRI OIL FIELDS”: TESTING THE EQUITY CRITERIA SET
129
Same approach was adopted for valuing impacts on groundwater resources. While criteria
include data at regional level, they were shared at site and district levels according to
corresponding population. For instance, I followed this method for sharing regional revenues
at site and district levels.
In this regard, it is essential to refer to the royalty regime. In Italy, Oil & Gas revenues
are based on production values and require national government to receive 10% (until 2009,
7%) for oil and about 4% for gas. The share of royalties available to the region is regulated by
an agreement between the Italian Government and the Basilicata region.
For oil, the Basilicata region receives 70% of the national royalties, of which 85% is devoted to
region for specific activities (such as the operative program Val d’Agri, financing University,
etc.) and 15% is directly allocated to interested municipalities. The municipalities are allocated
their share on the basis of the presence of infrastructures (extraction wells and oil centers).
For allocation of gas royalties, the region receives 100% of royalties (corresponding to about
4% of production values) that are directly managed by a public utility, set up to raise revenue
through gas auctions (Boschma et al. 2013). Moreover, from 2011 the National government
has allocated a 3% share of onshore Oil & Gas royalties globally paid in Italy, on a special fund
in favour of regions interested by Oil & Gas extractions and regasification activities. The Val
d’Agri field provides the majority of resources for this fund, namely “Bonus Idrocarburi”. For
this reason, Basilicata citizens with a driving licence can directly benefit of an annual discount
on purchasing fuel.
For the most part, baseline data referred to 2011 statistics. Medium-‐long term trends related
to population were esteemed according to statistical projections elaborated by ISTAT (2013)
at 2030, and Italian energy needs according to statistical projections provided by MISE (2005)
at 2030.
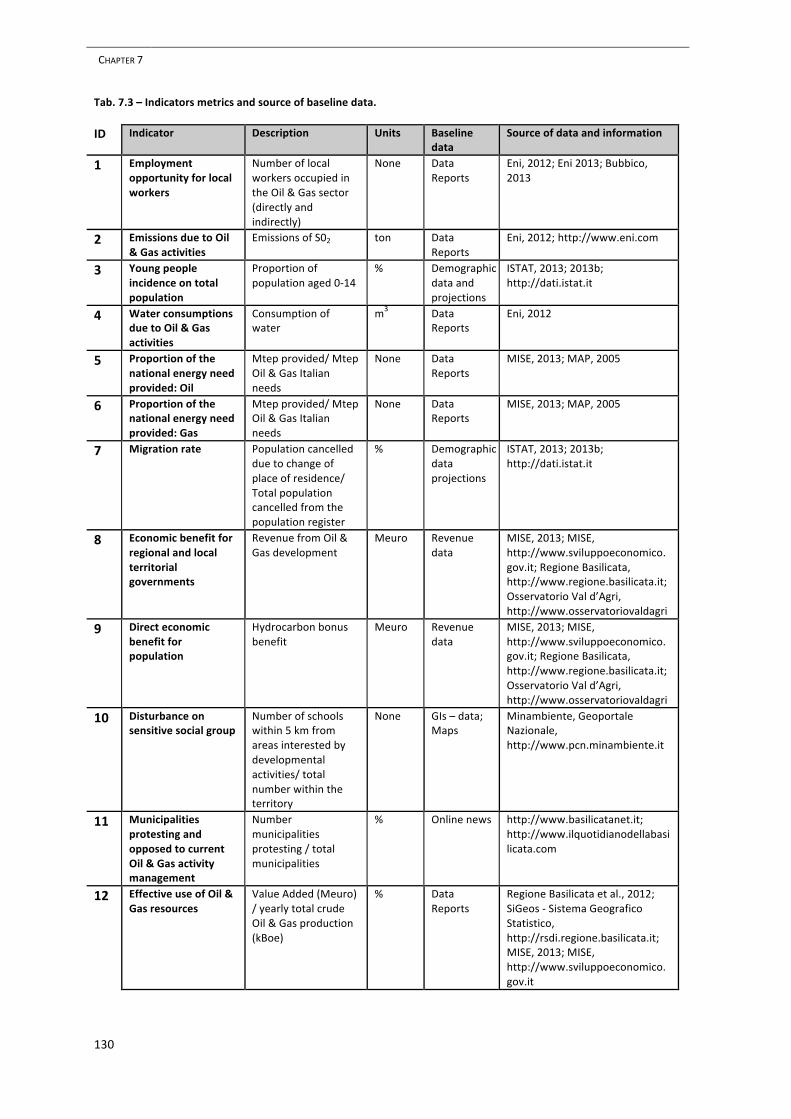
CHAPTER 7
130
Tab. 7.3 – Indicators metrics and source of baseline data.
ID Indicator Description Units Baseline data
Source of data and information
1 Employment opportunity for local workers
Number of local workers occupied in the Oil & Gas sector (directly and indirectly)
None Data Reports
Eni, 2012; Eni 2013; Bubbico, 2013
2 Emissions due to Oil & Gas activities
Emissions of S02 ton Data Reports
Eni, 2012; http://www.eni.com
3 Young people incidence on total population
Proportion of population aged 0-‐14
% Demographic data and projections
ISTAT, 2013; 2013b; http://dati.istat.it
4 Water consumptions due to Oil & Gas activities
Consumption of water
m3 Data Reports
Eni, 2012
5 Proportion of the national energy need provided: Oil
Mtep provided/ Mtep Oil & Gas Italian needs
None Data Reports
MISE, 2013; MAP, 2005
6 Proportion of the national energy need provided: Gas
Mtep provided/ Mtep Oil & Gas Italian needs
None Data Reports
MISE, 2013; MAP, 2005
7 Migration rate Population cancelled due to change of place of residence/ Total population cancelled from the population register
% Demographic data projections
ISTAT, 2013; 2013b; http://dati.istat.it
8 Economic benefit for regional and local territorial governments
Revenue from Oil & Gas development
Meuro Revenue data
MISE, 2013; MISE, http://www.sviluppoeconomico.gov.it; Regione Basilicata, http://www.regione.basilicata.it; Osservatorio Val d’Agri, http://www.osservatoriovaldagri
9 Direct economic benefit for population
Hydrocarbon bonus benefit
Meuro Revenue data
MISE, 2013; MISE, http://www.sviluppoeconomico.gov.it; Regione Basilicata, http://www.regione.basilicata.it; Osservatorio Val d’Agri, http://www.osservatoriovaldagri
10 Disturbance on sensitive social group
Number of schools within 5 km from areas interested by developmental activities/ total number within the territory
None GIs – data; Maps
Minambiente, Geoportale Nazionale, http://www.pcn.minambiente.it
11 Municipalities protesting and opposed to current Oil & Gas activity management
Number municipalities protesting / total municipalities
% Online news http://www.basilicatanet.it; http://www.ilquotidianodellabasilicata.com
12 Effective use of Oil & Gas resources
Value Added (Meuro) / yearly total crude Oil & Gas production (kBoe)
% Data Reports
Regione Basilicata et al., 2012; SiGeos -‐ Sistema Geografico Statistico, http://rsdi.regione.basilicata.it; MISE, 2013; MISE, http://www.sviluppoeconomico.gov.it

“VAL D’AGRI OIL FIELDS”: TESTING THE EQUITY CRITERIA SET
131
Tab. 7.3 – Indicators metrics and source of baseline data (continued).
ID Indicator Description Units Baseline
data Source of data and information
13 Anthropogenic surface disturbance of native habitat
km/km2 of roads and trails
km-‐1 Data Reports; GIs – data; Maps
Osservatorio Val d’Agri, http://www.osservatoriovaldagri;Minambiente, Geoportale Nazionale, http://www.pcn.minambiente.it; Regione Basilicata, Sistema Geografico Statistico (SiGeos), http://rsdi.regione.basilicata.it/
14 Environmental damage and loss of environmental quality
Amount of water re-‐injected after Oil & Gas upstream treatment
m3 Data Reports
Eni, 2012; http://www.eni.com
15 Proximity of protected areas to areas interested by Oil & Gas activities
Protected area in a buffer of 3000 m from oil & gas field / territory
% GIs – data; Maps
Minambiente, Geoportale Nazionale, http://www.pcn.minambiente.it; Regione Basilicata, Sistema Geografico Statistico (SiGeos), http://rsdi.regione.basilicata.it/
16 Change of core biodiversity areas
Protected area in a buffer of 3000m from oil & gas field / protected area in territory
% GIs – data; Maps
Minambiente, Geoportale Nazionale, http://www.pcn.minambiente.it; Regione Basilicata, Sistema Geografico Statistico (SiGeos), http://rsdi.regione.basilicata.it/
17 Area of agricultural ecosystems under sustainable management
Land managed with organic method/territory
% Statistic Report
ISTAT, 2013, http://dati.istat.it
18 Land area covered by Oil & Gas main activities
Land area affected by Oil & Gas activities/territory – percentage
% GIs – data; Maps
Minambiente, Geoportale Nazionale, http://www.pcn.minambiente.it; Regione Basilicata, Sistema Geografico Statistico (SiGeos), http://rsdi.regione.basilicata.it/
19 Agreements and initiatives for lasting future options
Number of actions None Reports Stato Italiano and Regione Basilicata, 2011; ENI 2012; 2013, http://www.eni.com.it; TOTAL, http://www.total.com
20 Investments into Research & Development (R&D)
Value Added / expenses in R&D
% Statistic Reports
Regione Basilicata et al. 2012, Sistema Geografico Statistico (SiGeos), http://rsdi.regione.basilicata.it
21 Oil & Gas companies contribution for local development (for activities, events, territory promotions)
Financial contribution
Meuro Reports ENI 2012; 2013, http://www.eni.com.it; TOTAL, http://www.total.com
22 Other compensation measurements
Number of actions
None Reports ENI 2012; 2013, http://www.eni.com.it; TOTAL, http://www.total.com
23 Actions related to system of monitoring and follow–up
Number of actions None Reports ENI 2012; 2013, http://www.eni.com.it; TOTAL, http://www.total.com

CHAPTER 7
132
Qualitative assessments regarded three of the just for an imperfect world criteria, namely,
agreements and initiatives for lasting future options (ID19), other compensation
measurements (ID22), and actions related to system of monitoring and follow–up (ID23).
The first took into account institutional policies and measures, while the second focused on
initiatives proposed by companies beyond legal requirements. The last concerned activities
related to monitoring and follow–up for enhancing transparency and accessibility to
information. These indicators were valued by summing the number of actions and/or
measurements, and, as well as for all the others, corresponding criteria were not weighted.
However, given that the main scope of the analysis was testing the feasibility of the equity
approach proposed, values hypothesized for all indicators provided broadly estimations of
equity criteria, which helped to understanding general trends and to recognize opportunity
and risk of different scenarios at strategic level.
To enable the subsequent analysis and scoring, a linear arithmetic normalization procedure
was employed using maximum values of the metrics. Value functions were applied to convert
scores to a common value range (0-‐1). Criteria and related indicators 1, 3, 5, 6, 8, 9, 12, 17, 19,
20, 21, 22, 23 were assumed as benefits, while criteria and related indicators 2, 4, 7, 10, 11,
13, 14, 15, 16, 18 were assumed as costs. The following are the formulas of the maximum
functions for benefits (b) and costs (c): (𝑏) = !"# !"#$%!"#$!%! !"#$%
; (𝑐) = 1 − !"# !"#$%!"#$!%! !"#$%
.
Table from 7.4 to 7.7 show the decision matrixes resulted from the examination of the
storylines against the equity criteria and related indicators considered. There are displayed
raw and corresponding normalized (norm.) values.

“VAL D’AGRI OIL FIELDS”: TESTING THE EQUITY CRITERIA SET
133
Tab. 7.4 – Decision matrix: Scenario A scores for short and medium-‐long term.
A" SITE" DISTRICT" REGION"
ID" Short"term"
"
Medium/Long"term"
Short"term"
"
Medium/Long"term"
Short"term"
"
Medium/Long"term"
raw" norm." raw" norm." raw" norm." raw" norm." raw" norm." raw" norm."
1" 380" 1,00" 249" 0,66" 1329" 1,00" 871" 0,66" 2215" 1,00" 1453" 0,66"
2" 54" 0,94" 865" 0,00" 76" 0,93" 1107" 0,00" 76" 0,93" 1107" 0,00"
3" 13,4" 1,00" 10,9" 0,81" 13,4" 1,00" 10,9" 0,81" 13,4" 1,00" 10,9" 0,81"
4" 977.986" 0,93" 14.235.666" 0,00" 977.986" 0,93" 14.235.666" 0,00" 977.986" 0,93" 14.235.666" 0,00"
5" 6,18" 1,00" 5,35" 0,87" 9,16" 1,00" 7,92" 0,86" 9,16" 1,00" 7,92" 0,86"
6" 1,88" 1,00" 1,34" 0,71" 2,11" 1,00" 1,39" 0,66" 2,11" 1,00" 1,39" 0,66"
7" 1,46" 0,00" 1,19" 0,18" 1,49" 0,00" 1,03" 0,31" 1,41" 0,00" 0,87" 0,38"
8" 29,0" 0,06" 463,7" 1,00" 48,2" 0,07" 700,5" 1,00" 324,7" 0,07" 4725,0" 1,00"
9" 3,2" 0,07" 46,2" 1,00" 7,9" 0,07" 114,4" 1,00" 62,2" 0,07" 905,3" 1,00"
10" 0,27" 0,02" 0,27" 0,00" 0,17" 0,00" 0,17" 0,00" 0,04" 0,00" 0,04" 0,00"
11" 60" 0,00" 0" 1,00" 49" 0,14" 31" 0,46" 33" 0,06" 27" 0,23"
12" 0,76" 0,42" 0,80" 0,45" 1,58" 0,42" 1,66" 0,45" 14,43" 0,42" 15,15" 0,44"
13" 0,34" 0,00" 0,34" 0,00" 0,34" 0,00" 0,33" 0,03" 0,34" 0,00" 0,33" 0,03"
14" 1.068.767" 0,94" 17.100.270" 0,00" 1.502.721" 0,93" 21.873.760" 0,00" 1.502.721" 0,93" 21.873.760" 0,00"
15" 38,34" 0,00" 38,34" 0,00" 12,36" 0,00" 12,36" 0,00" 2,90" 0,00" 2,90" 0,00"
16" 77,02" 0,00" 77,02" 0,00" 32,01" 0,00" 32,01" 0,00" 10,00" 0,00" 10,00" 0,00"
17" 1,02" 0,97" 0,74" 0,70" 3,54" 0,97" 2,55" 0,70" 7,52" 0,91" 8,29" 1,00"
18" 0,15" 0,00" 0,15" 0,00" 0,05" 0,29" 0,07" 0,00" 0,01" 0,50" 0,02" 0,00"
19" 0,4" 1,00" 0,4" 1,00" 0,4" 1,00" 0,4" 1,00" 0,4" 1,00" 0,4" 1,00"
20" 138,7" 0,99" 139,7" 1,00" 117,2" 0,97" 117,3" 0,97" 135,8" 1,00" 135,8" 1,00"
21" 10,6" 0,12" 85,4" 1,00" 13,1" 0,14" 96,2" 1,00" 24,1" 0,13" 188,6" 1,00"
22" 0" 0,00" 0,8" 1,00" 0" 0,00" 0,8" 1,00" 0" 0,00" 0,4" 1,00"
23" 0,2" 1,00" 0,2" 1,00" 0,4" 1,00" 0,2" 0,50" 0,4" 1,00" 0,2" 0,50"

CHAPTER 7
134
Tab. 7.5 – Decision matrix: Scenario B scores for short and medium-‐long term.
B" SITE" DISTRICT" REGION"
ID" Short"term"
"
Medium/Long"term"
Short"term"
"
Medium/Long"term"
Short"term"
"
Medium/Long"term"
raw" norm." raw" norm." raw" norm." raw" norm." raw" norm." raw" norm."
1" 380" 1,00" 152" 0,40" 1329" 1,00" 533" 0,40" 2215" 1,00" 888" 0,40"
2" 54" 0,94" 972" 0,00" 76" 0,94" 1323" 0,00" 76" 0,94" 1323" 0,00"
3" 13,4" 1,00" 10,5" 0,78" 13,4" 1,00" 10,5" 0,78" 13,4" 1,00" 10,5" 0,78"
4" 977.986" 0,95" 18.430.353" 0,00" 977.986" 0,95" 18.430.353" 0,00" 977.986" 0,95" 18.430.353" 0,00"
5" 6,18" 0,92" 6,69" 1,00" 9,16" 0,63" 14,64" 1,00" 9,16" 0,63" 14,64" 1,00"
6" 1,88" 1,00" 1,67" 0,89" 2,11" 1,00" 2,01" 0,95" 2,11" 1,00" 2,01" 0,95"
7" 1,46" 0,12" 1,65" 0,00" 1,49" 0,00" 1,33" 0,11" 1,41" 0,00" 0,85" 0,40"
8" 29,0" 0,06" 520,8" 1,00" 48,2" 0,06" 838,2" 1,00" 324,7" 0,06" 5648,9" 1,00"
9" 4,5" 0,08" 55,3" 1,00" 11,2" 0,08" 136,7" 1,00" 88,9" 0,08" 1082,2" 1,00"
10" 0,27" 0,00" 0,27" 0,00" 0,19" 0,06" 0,20" 0,00" 0,05" 0,00" 0,05" 0,00"
11" 60" 0,00" 60" 0,00" 49" 0,14" 49" 0,14" 33" 0,06" 33" 0,06"
12" 0,76" 0,42" 0,56" 0,31" 1,58" 0,42" 1,16" 0,31" 14,43" 0,42" 10,62" 0,31"
13" 0,34" 0,06" 0,36" 0,00" 0,34" 0,00" 0,31" 0,09" 0,34" 0,00" 0,31" 0,09"
14" 1.068.767" 0,94" 19.206.064" 0,00" 1.502.721" 0,94" 26.149.323" 0,00" 1.502.721" 0,94" 26.149.323" 0,00"
15" 38,34" 0,12" 43,40" 0,00" 12,36" 0,12" 14,10" 0,00" 2,90" 0,12" 3,31" 0,00"
16" 77,02" 0,12" 87,26" 0,00" 32,01" 0,12" 36,55" 0,00" 10,00" 0,12" 11,41" 0,00"
17" 1,02" 0,97" 0,42" 0,40" 3,54" 0,97" 1,46" 0,40" 7,52" 0,94" 8,03" 1,00"
18" 0,15" 0,17" 0,18" 0,00" 0,05" 0,38" 0,08" 0,00" 0,01" 0,50" 0,02" 0,00"
19" 0,4" 1,00" 0,4" 1,00" 0,4" 1,00" 0,4" 1,00" 0,4" 1,00" 0,4" 1,00"
20" 138,70" 1,00" 132,9" 0,96" 117,2" 0,97" 111,9" 0,93" 135,8" 1,00" 129,8" 0,96"
21" 10,60" 0,12" 85,4" 1,00" 13,1" 0,14" 96,2" 1,00" 24,1" 0,13" 188,6" 1,00"
22" 0" 0,00" 1" 1,00" 0" 0,00" 1" 1,00" 0" 0,00" 0,6" 1,00"
23" 0,2" 1,00" 0,2" 1,00" 0,2" 1,00" 0,2" 1,00" 0,2" 1,00" 0,2" 1,00"
!

“VAL D’AGRI OIL FIELDS”: TESTING THE EQUITY CRITERIA SET
135
Tab. 7.6 – Decision matrix: Scenario D scores for short and medium-‐long term.
D" SITE" DISTRICT" REGION"
ID" Short"term"
"
Medium/Long"term" Short"term"
"
Medium/Long"term" Short"term"
"
Medium/Long"term"
raw" norm." raw" norm." raw" norm." raw" norm." raw" norm." raw" norm."
1" 127" 1,00" 127" 1,00" 445" 1,00" 445" 1,00" 741" 1,00" 741" 1,00"
2" 39" 0,94" 624" 0,00" 39" 0,94" 624" 0,00" 39" 0,94" 624" 0,00"
3" 13,4" 1,00" 11,4" 0,85" 13,4" 1,00" 11,4" 0,85" 13,4" 1,00" 11,4" 0,85"
4" 501.638" 0,94" 8.026.208" 0,00" 501.638" 0,94" 8.026.208" 0,00" 501.638" 0,94" 8.026.208" 0,00"
5" 4,78" 1,00" 4,14" 0,87" 4,78" 1,00" 4,14" 0,87" 4,78" 1,00" 4,14" 0,87"
6" 1,52" 1,00" 1,08" 0,71" 1,52" 1,00" 1,08" 0,71" 1,52" 1,00" 1,08" 0,71"
7" 1,46" 0,00" 0,87" 0,40" 1,49" 0,00" 0,92" 0,38" 1,41" 0,00" 0,9" 0,36"
8" 20,9" 0,06" 334,5" 1,00" 24,6" 0,06" 393,5" 1,00" 166,49" 0,06" 2663,9" 1,00"
9" 1,6" 0,06" 26,1" 1,00" 4,0" 0,06" 64,5" 1,00" 31,9" 0,06" 510,4" 1,00"
10" 0,27" 0,00" 0,27" 0,00" 0,13" 0,00" 0,13" 0,00" 0,03" 0,00" 0,03" 0,00"
11" 60" 0,00" 0" 1,00" 57" 0,00" 0" 1,00" 35" 0,00" 0" 1,00"
12" 1,79" 0,98" 1,82" 1,00" 3,72" 0,94" 3,94" 1,00" 34,11" 0,99" 34,49" 1,00"
13" 0,34" 0,00" 0,34" 0,00" 0,34" 0,00" 0,34" 0,00" 0,34" 0,00" 0,34" 0,00"
14" 770.790" 0,94" 12.332.640" 0,00" 770.790" 0,94" 12.332.640" 0,00" 770.790" 0,94" 12.332.640" 0,00"
15" 38,34" 0,00" 38,34" 0,00" 9,67" 0,00" 9,67" 0,00" 2,27" 0,00" 2,27" 0,00"
16" 77,02" 0,00" 77,02" 0,00" 25,06" 0,00" 25,06" 0,00" 7,83" 0,00" 7,83" 0,00"
17" 1,05" 0,83" 1,26" 1,00" 3,65" 0,83" 4,38" 1,00" 7,54" 0,83" 9,05" 1,00"
18" 0,15" 0,00" 0,15" 0,00" 0,04" 0,00" 0,04" 0,00" 0,01" 0,00" 0,01" 0,00"
19" 0" 0,00" 0,2" 1,00" 0" 0,00" 0,2" 1,00" 0" 0,00" 0,2" 1,00"
20" 137,5" 1,00" 126,1" 0,92" 120,9" 1,00" 110,9" 0,92" 134,1" 1,00" 123,0" 0,92"
21" 5,00" 0,06" 80,00" 1,00" 0,00" 0,00" 0,00" 0,00" 0,00" 0,00" 0,00" 0,00"
22" 0" 0" 0" 0" 0" 0" 0" 0" 0" 0" 0" 0"
23" 0,2" 1,00" 0,2" 1,00" 0,2" 1,00" 0,2" 1,00" 0,2" 1,00" 0,2" 1,00"

CHAPTER 7
136
Tab. 7.7 – Scenario C scores for short and medium-‐long term.
7.4 Comparing scenarios
In order to compare the four scenarios against the equity criteria through the corresponding
indicators listed in Tables from 7.4 to 7.7, two aggregations of normalized measures were
undertaken for each scenario at the diverse geographical and temporal scales. The first was
based on the aggregation of all indicators. Thus, according to the linear normalization, the
sum of the 23 indicators ranges from 0 to 23. In addition, the second data elaboration focused
C" SITE" DISTRICT" REGION"
ID" Short"term"
"
Medium/Long"term"
Short"term"
"
Medium/Long"term" Short"term"
"
Medium/Long"term"
raw" norm." raw" norm." raw" norm." raw" norm." raw" norm." raw" norm."
1" 371" 1,00" 205" 0,55" 1298" 1,00" 719" 0,55" 2162" 1,00" 1198" 0,55"
2" 39" 0,94" 624" 0,00" 61" 0,93" 866" 0,00" 61" 0,93" 866" 0,00"
3" 13,4" 1,00" 11,4" 0,85" 13,4" 1,00" 11,4" 0,85" 13,4" 1,00" 11,4" 0,85"
4" 784.059" 0,93" 11.132.844" 0,00" 784.059" 0,93" 11.132.844" 0,00" 784.059" 0,93" 11.132.844" 0,00"
5" 4,78" 1,00" 4,14" 0,87" 7,75" 1,00" 6,71" 0,87" 7,75" 1,00" 6,71" 0,87"
6" 1,52" 1,00" 1,08" 0,71" 1,75" 1,00" 1,39" 0,79" 1,75" 1,00" 1,39" 0,79"
7" 1,46" 0,00" 0,70" 0,52" 1,49" 0,00" 0,71" 0,52" 1,41" 0,00" 0,90" 0,36"
8" 20,9" 0,06" 334,5" 1,00" 38,7" 0,07" 548,2" 1,00" 260,3" 0,07" 3695,0" 1,00"
9" 2,5" 0,07" 36,1" 1,00" 6,3" 0,07" 89,5" 1,00" 49,9" 0,07" 708,0" 1,00"
10" 0,27" 0,00" 0,27" 0,00" 0,17" 0,00" 0,17" 0,00" 0,04" 0,00" 0,04" 0,00"
11" 60" 0,00" 0" 1,00" 49" 0,14" 0" 1,00" 33" 0,06" 0" 1,00"
12" 0,95" 0,53" 0,99" 0,55" 1,97" 0,53" 2,06" 0,55" 18,05" 0,53" 18,81" 0,55"
13" 0,34" 0,00" 0,34" 0,00" 0,34" 0,00" 0,33" 0,03" 0,34" 0,00" 0,33" 0,03"
14" 770.790" 0,94" 12.332.640" 0,00" 1.204.744" 0,93" 17.106.130" 0,00" 1.204.744" 0,93" 17.106.130" 0,00"
15" 38,34" 0,00" 38,34" 0,00" 9,67" 0,22" 12,36" 0,00" 2,27" 0,22" 2,90" 0,00"
16" 77,02" 0,00" 77,02" 0,00" 25,06" 0,22" 32,01" 0,00" 7,83" 0,22" 10,00" 0,00"
17" 1,05" 0,91" 1,16" 1,00" 3,65" 0,91" 4,01" 1,00" 7,54" 0,81" 9,30" 1,00"
18" 0,15" 0,00" 0,15" 0,00" 0,05" 0,29" 0,07" 0,00" 0,01" 0,50" 0,02" 0,00"
19" 0,2" 0,33" 0,6" 1,00" 0,2" 0,33" 0,6" 1,00" 0,2" 0,50" 0,4" 1,00"
20" 138,9" 1,00" 120,8" 0,87" 117,3" 0,97" 102,2" 0,85" 136,2" 1,00" 118,3" 0,87"
21" 5,2" 0,06" 85,4" 1,00" 6,3" 0,07" 96,2" 1,00" 9,8" 0,05" 188,6" 1,00"
22" 0" 0,00" 0,2" 1,00" 0" 0,00" 0,6" 1,00" 0" 0,00" 0,2" 1,00"
23" 0,4" 1,00" 0,4" 1,00" 0,6" 1,00" 0,4" 0,67" 0,6" 1,00" 0,4" 0,67"

“VAL D’AGRI OIL FIELDS”: TESTING THE EQUITY CRITERIA SET
137
on the aggregation of indicators broken down for the four equity perspectives. Thus, for
opportunity, distributional fairness, and distributional fairness across generation perspectives,
each of which presents 6 indicators, the sum of corresponding equity scores ranges from 0 to
6; while for the perspective justice for an imperfect world, which presents 5 indicators, the
sum of corresponding equity scores ranges from 0 to 5. In spite of typical multi-‐criteria
assessment procedures, it is important to note that relative weights were not assigned to
equity criteria in this case. This choice was due to the fact that the case study application was
essentially direct to have a first evaluation of the equity criteria approach proposed without
going in depth of criteria comparison and prioritisation, which require a further step of
investigation.
Figures 7.1, 7.2, and 7.3 display the results at the three spatial scales chosen (Site, District and
Region), broken down by total aggregation of equity scores and by time. It is possible to notice
that trends for scenario C and B are quite similar at site level, while scenario C performs better
than the others in the long run at District and Region scale.
Fig. 7.1 – Scenario aggregated equity scores at Site scale.
8,00
9,00
10,00
11,00
12,00
13,00
14,00
15,00
now short-‐term long-‐term
Equity
Site
Scenario D Scenario C Scenario A Scenario B

CHAPTER 7
138
Fig. 7.2 – Scenario aggregated equity scores at District scale.
Fig. 7.3 – Scenarios aggregated equity scores at Region scale.
Figures 7.4, 7.5, and 7.6 display that, even if with different degree of equity scores, moving
from short to medium-‐long term at any level, there is an increase of aggregated equity score
for scenarios D and C, while a decrease for scenario B. Whereas it is apparent that Scenario A
and B perform differently at the different geographical scales.
8,00
9,00
10,00
11,00
12,00
13,00
14,00
15,00
now short-‐term long-‐term
Equity
District
Scenario D Scenario C Scenario A Scenario B
8,00
9,00
10,00
11,00
12,00
13,00
14,00
15,00
now short-‐term long-‐term
Equity
Region
Scenario D Scenario C Scenario A Scenario B

“VAL D’AGRI OIL FIELDS”: TESTING THE EQUITY CRITERIA SET
139
For Scenario A there is an increase of aggregated equity score in the lung run, while a
decrease at District and Regional level. Scenario B performs quite similar at Region level, while
shows a decrease in aggregated equity score at district and site level. Scenario B was by far
the most negative regarding meeting equity criteria in the log-‐run for all the geographical
scales.
Fig. 7.4 – Scenario performances over time at Site scale.
Fig. 7.5 – Scenario performances over time at District scale.
8,00
9,00
10,00
11,00
12,00
13,00
14,00
Scenario D Scenario C Scenario A Scenario B
Equity
Site
short-‐term long-‐term
8,00
9,00
10,00
11,00
12,00
13,00
14,00
Scenario D Scenario C Scenario A Scenario B
Equity
District
short-‐term long-‐term

CHAPTER 7
140
Fig. 7.6 – Scenario performances over time at Region scale.
Subsequently, the analysis was concentrated on the results broken down for the four equity
perspectives considered. The empirically-‐based values are deployed with the help of spider
models. In a spider model, scores on each factor chosen are mapped out on an axis starting
from the interior towards the outer boundary of the spider, in which the lowest scores are to
be found in the centre of the spider (Baycan-‐Levent et al., 2007).
This tool was useful for capturing strengths and weakness of different scenarios for the four
equity perspectives selected. For each perspective the values displayed represent the sum of
corresponding indicators’ scores. Figure 7.7 compares the spider models’ results broken down
by temporal and geographical scale.
8,00
9,00
10,00
11,00
12,00
13,00
14,00
Scenario D Scenario C Scenario A Scenario B
Equity
Region
short-‐term long-‐term
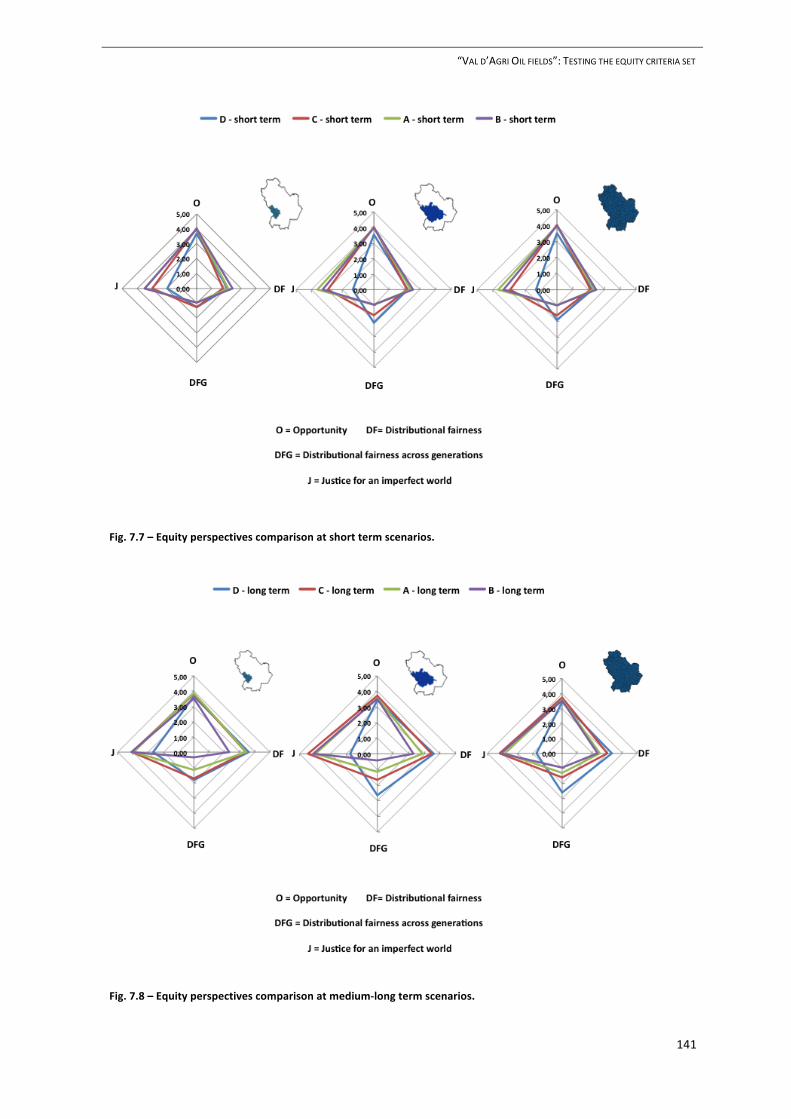
“VAL D’AGRI OIL FIELDS”: TESTING THE EQUITY CRITERIA SET
141
Fig. 7.7 – Equity perspectives comparison at short term scenarios.
Fig. 7.8 – Equity perspectives comparison at medium-‐long term scenarios.

CHAPTER 7
142
Opportunity
In term of Opportunity it is possible to notice similar performances across scenarios for short-‐
term as well as for medium-‐long term. In general there is a slight decrease in total scores
moving from short to medium-‐long term.
Distributional fairness
More evident changes in equity score are registered moving from short to medium-‐long-‐term
under the distributional fairness perspective. In general scenarios C, D provide increase in
scores in the long-‐run at each geographical scale, while scenario B produces decrease.
Distributional fairness across generation
In the long-‐term Scenario D offers more positive lasting effects in term of Distributional
fairness across generation, especially at District and Region level. At site scale, the
Distributional fairness across generation total score is lower than at the other two levels, and
scenarios C and D performed similarly under this perspective. Both district and site levels
present very low scores in the case of Scenario B.
Justice for an imperfect world
Scenarios A, B and C in the short as well as in medium-‐long run perform quite similarly under
the Justice for an imperfect world perspective. In fact it is apparent that there is also a
contextual quite increase in equity scores for the tree scenarios. On the contrary, Scenario D
performs quite worse on the others over space and time.
7.5 Discussion and conclusion
None of the scenarios provides “the best solution” in term of aggregated equity scores or
perfect win-‐win solutions for each equity perspective. But it is interesting to note that this
approach helps to make more explicit different trade-‐offs between equity objectives. For
instance, considering the aggregated equity with respect to time dimension, in general the
hypothesized developmental decisions would favour an increase in equity in the short future.
But having a more long-‐lasting perspective, scenarios show more clearly differences.

“VAL D’AGRI OIL FIELDS”: TESTING THE EQUITY CRITERIA SET
143
Scenario B displays an increasingly burden of negative impacts not adequately compensated
by benefits from strong Oil & Gas development, which is more intense at site level. Thus,
Scenario B is the worst in the long-‐term. Moreover, Scenario A helps to capture a trade-‐off
between geographical scales. Scenario A shows an inverted trend for site level in comparison
to district and regional level. In fact, positive increases of aggregated equity scores are
ensured at site level only.
A possible explanation of this is the fact that at site level Scenario A combines a more direct
control from local authorities of Oil & Gas economic benefits and compensation
measurements with a limited increase in exploitations compared to the current situation.
Whereas at district and regional level the accumulated amount of environmental burdens in
the long run overcomes the potential social and economic benefits.
In addition, with respect to this point, it is essential to explore how Scenario A performs in
relation to the single four equity perspectives. Thus, it is possible notice that what makes the
difference between site and district and regional levels is the distributional fairness
perspective rather than the others. In particular, Scenario A at site level provides a higher
equity score in term of direct and tangible benefits on local population.
These results helped to identify opportunity and risk of different scenarios at strategic level. A
first point of attention regards the comparative analysis of Scenario B in the long-‐term at the
different space scales. Despite that it runs strong Oil & Gas development, none of the levels
seems to acquire significant increase in equity benefits, not even one at expenses of each
other. According to the assumptions shaped, this might suggest that incremental benefits are
concentrated outside the three level considered.
A second observation concerns the equity trade-‐offs between Scenario B and D. While it is
quite obvious to explain the trade-‐offs between distributional fairness across generations and
justice for an imperfect world thinking that scenario D is more conservative and precautionary
performing better in regard to access to natural resource for future generations, whereas
Scenario B makes a greater reliance on compensatory tools, more insights are provided by
comparing distributional fairness scores between the two scenarios.
It emerges that Scenario D always offers appreciably higher scores more comparable with the
scores of scenarios A and C.

CHAPTER 7
144
The comparative analysis reveals that Scenario D offers little contribution in term of pace and
scale of development compared to Scenario B, but gives more equity contributions to
distributional fairness between and across generations. Thus, it could be an important
warning for decision makers. It confutes the quite dismissive assertion that strong Oil & Gas
development would favour present generation and ensure at least weak sustainability
counterweighed with compensation measurements and substitution of natural capital in the
long term.
On the contrary, it is a matter of political decisions to adopt a stronger environmental agenda,
which will favour distributional fairness between and across generation without relying on a
relevant support of justice for an imperfect world criteria, that potentially will affect absolute
results. Third; the analysis indicates that Scenario C seems to rebalance better equity concerns
at the different geographical scales. This analysis supports the idea that assuming decisions
involved institutions at different levels and approaching to decision with more attention to a
sustainable management of the environment might help in achieving more wide-‐spread and
long-‐term positive results. It also seems to confirm the role that shared and reflective
environmental governance should play in integrating the overall political economy of natural
resource with the socio-‐economic and environmental values in which local people recognize
themselves.
However, other points of reflections need to be stressed with regard to case study
methodological aspects. It is important to note that proposed scenarios presented possible
significant trends in equity criteria, which were affected by restraints in data collected and
indicators adopted, as well as, simplifications in analysis. Thus, it is therefore significant to
highlight that several elaborations, such as estimations of emissions, water consumptions etc.,
were made purely proportionally to oil equivalent barrels extracted (e.g. without considering
changing of hydrocarbons characteristics along time and between the two fields; differences
or changing in technologies).
Moreover, available data, which were reported to the Val d’Agri Oil field, were purely used as
a base for Tempa Rossa estimations as well. However, information gathered about potential
development of the two fields helped to orient hypotheses, and imagine increase in and
location of new wells. With respect to economic data, elaborations gave rough esteems of

“VAL D’AGRI OIL FIELDS”: TESTING THE EQUITY CRITERIA SET
145
potential improvements in income and variations in expenses (e.g. without accounting for
revaluations, inflations and other macroeconomic aspects).
It is important to underline that in this exercise it was assumed that all equity criteria within
each temporal dimension receive equal weights and that all three geographical levels were
equally weighted too. In this regard, further specific reflexions and considerations are
required for determining the relative weights of criteria using, for example, the method of
pairwise comparisons. This mathematical approach allows determining relative weights of
criteria by dividing the multi-‐criteria assessment into a set of one-‐on-‐one judgements
concerning the significance of each criterion relative to the others.
In depth criteria analysis will be fundamental for understanding a preference order on the
criteria and to determine the redundant and less important criteria in terms of discriminating
power on the alternatives (Ozelkan and Duckstein, 1996).
Moreover, it should be therefore essential to combine relative sensitive analysis for assessing
of the uncertainties in the analysis process. By acknowledging subjective nature related, for
example, to the selection of indicators, or if any weights attached to the indicators, sensitivity
analysis can determine whether the main results of a ranking system change substantially
when those assumptions are varied over a reasonable range of possibilities (e.g. Munda and
Saisana, 2011; Geneletti, 2007). The validity of the equity approach developed in this case
study should be assessed by starting to study its sensitivity to the main source of uncertainty
related to the number of indicators in the data set.


Chapter 8
8. Conclusions
This study was driven by three main objectives:
• to verify the degree of considerations of sustainability issues in current practice, focusing
on SEA experiences of spatial planning and Oil & Gas development;
• to identify criteria and indicators to measure intra-‐ and inter-‐generational equity, against
which present state and future trends could be assessed;
• to test the applicability of the proposed methods to a case study, dealing with complex
decisions at strategic level. The selected case study deals with Oil & Gas development in
ecologically sensitive and biodiversity rich areas.
In this chapter, I will recapitulated the main findings of the research, grouped by the three
specific objectives, and discussed strengths and weaknesses regarding the theoretical equity
framework and the case-‐study application proposing some recommendations for future
research.
8.1 Summary of main findings
Sustainability issues in current practice
In Chapter 2, a framework structured in 71 sustainability questions was developed, and
applied to review the Environmental Report of the urban plans of 15 major Italian cities. The
review showed that most of the attention was given to mitigation and compensation
measures, rather than to actual attempts to propose more sustainable planning decisions in
the first place. Moreover, the examination of the proposed framework put in evidence the
need of flashing out equity concerns, as well as, of identifying suitable indicators for
operationalizing the concepts of intra-‐ and inter-‐generational equity in decision-‐making.

CHAPTER 8
148
In Chapter 4, it was developed a framework for reviewing SEA practice structured into nine
assessment parameters (object of assessment, entry point, interactivity, scope of assessment,
strategic reference framework, process, participation, findings/outcomes, proposal for follow-‐
up), and corresponding key questions. This framework was used to review 11 case studies
related to both off-‐shore and on-‐shore Oil & Gas developments existing worldwide. This
review provided evidences that crucial aspects are: stakeholders involvement from early stage
of the procedures; identification of key environmental, social and economic factors; analysis
of cumulative and synergistic effects in the long-‐run; fact-‐based provisions and
recommendations for more integrated mitigation and monitoring management strategies for
follow up. However, more efforts need to be made for enhancing and increasing the adoption
of these best practices in current SEA processes.
In Chapter 5, it was examined to what extent these 11 case studies address sustainability
concerns by referring to a holistic sustainability-‐oriented SEA approach based on the
identification of “critical decision factors”, which aim to ensure a strong focus on success
aspects and dynamics of a strategic decision, rather than a vague notion on effects over a
large sustainability broadband. Four key CDFs were proposed for the Oil & Gas sector, namely
Heritage Values, Community Benefits, Timescale, and Governance. The review confirmed that
aspects related to the selected four CDFs represent common requisites for SEA practice in the
Oil & Gas sector, even where SEA cases may reveal different degrees of integration. Suitable
recommendations in view of enhancing potential strategic contributions of SEA towards more
sustainable outcomes were drawn up, in terms of protection of natural, social and cultural
values, contribution to local development, management of uncertainty and improved
decision-‐making processes.
It is interesting to notice that even if the practice, which was reviewed in urban planning and
Oil & Gas sector, concerned different levels of strategic actions and a composite variety of
contexts, they showed similar gaps in terms of intra-‐ and inter-‐generational equity. Critical
aspects mostly disregarded were distributional analysis of implications of decisions for
different groups and communities, taking into consideration competing values and interests,
as well as, assessment of alternatives that might enhance mutual benefits in the long run
rather than mitigate negative impacts. However, it clearly emerged that sustainability issues
are widespread recognized and several significant actions are already included in SEA

CONCLUSIONS
149
procedures towards sustainability. But, the key concern remains that these good actions
should be reconsidered and interrelated each other more effectively according to a more
organic and comprehensive scheme. Thus, the CDF approach apparently seemed as an
effective step for answering this question.
Equity criteria construction
In Chapter 3, a conceptual framework for identifying the different implications related to the
use of different values and perceptions on equity was framed. This framework identified the
most accepted points of view on equity classifying them in the light of predominant
sustainability conceptualizations. This framework helped in shedding light on the strongly
nexus between equity and sustainability. In fact it was possible to derive a range of
compatible equity perspectives along which to develop a set of equity criteria and general
principles for strategic decisions.
Four equity perspectives were derived, namely, opportunity, distributional fairness,
distributional fairness across generations and justice for an imperfect world. These four
perspectives were recommended as compatible and intertwined angles for exploring the role
played by the consideration of equity in distribution of the expected effects of decisions on
present and future generations.
In addition, a set of general equity criteria was stemmed from these selected perspectives and
suggested as metrics for measuring intra-‐ and inter-‐ generational equity in decision-‐making.
The review of equity perspectives, as well as, of intra-‐ and inter-‐generational equity
conceptualizations allowed identifying a consistent range of general equity criteria that might
be useful in centring assessment around crucial and integrative sustainability issues.
Case study application
In Chapters 6 and 7, the equity framework proposed in Chapter 3 was tested against the “Val
d’Agri Oil fields” case study. The case study concerned the most promising Western-‐Europe
on-‐shore oil fields located in Southern Italy, namely the “Val d’Agri Oil fields”. With the help of
a scenario matrix, four plausible scenarios were constructed and corresponding storylines,
related to key aspects drawn up from a theoretical and empirical analysis, were developed.

CHAPTER 8
150
A range of 19 equity criteria and corresponding 23 indicators, adapted to data disposability,
were designed for the case study. Indicators were therefore valued according to a quali-‐
quantitative analysis that assisted in examining and comparing trade-‐off between human and
environmental systems under the different scenarios. Comparisons were undertaken varying
geographical scopes, ranging from the regional scale to two different local areas, surrounding
the Oil & Gas activities (Site and District), and taking into consideration short and medium-‐
long term scales. In spite of orthodox multi-‐criteria analysis procedures, it was assumed that
all equity criteria within each temporal dimension received equal weights and that all three
geographical levels were equally weighted too. According to the scope of testing the feasibility
of the equity approach proposed, values hypothesized for all indicators provided broadly
estimations of equity criteria, which helped to understanding general trends and to recognize
opportunity and risk of different scenarios at strategic level.
The results showed that none of the scenarios provides “the best solution” in term of
aggregated equity scores or perfect win-‐win solutions for each equity perspective. However,
the analysis indicated that one scenario (C) seems to rebalance better equity concerns at the
different geographical and temporal scales. This result supports the idea that assuming
decisions involved institutions at different levels and approaching to decision with more
attention to a sustainable management of the environment might help in achieving more
wide-‐spread and long-‐term positive results. The results, broken down into the four
perspectives, appeared to confuse that strong Oil & Gas development would favour present
generation and ensure at least weak sustainability counterweighed with compensation
measurements and substitution of natural capital in the long term.
8.2 Strengths and weaknesses of the theoretical framework
The proposed theoretical framework seeks to capture four central metrics of equity providing
a means to make equity concerns more explicit in assessment. It represents a promising tool
for improving equity consideration in decision-‐making. In fact, it provides a means of framing
intra-‐ and inter-‐generational equity in terms of equity implications potentially affecting
generations at different temporal and territorial scale.

CONCLUSIONS
151
A key advantage of using this approach is that it makes possible to undertake assessment by
taking into considerations conditions of inter-‐ and intra-‐generational equity concurrently. This
point is central in view of conceptualizing sustainability in term of equity. Another related
positive implication is the possibility of incorporating sustainability concerns over time and
space more effectively. In fact, the differentiation between the four equity perspectives offers
a diverse key for reading how decisions might alternatively affect crucial and multiscaled
components of sustainability. Moreover, it is possible to underline other two significant
procedural and substantive aspects. Firstly, the equity framework implies a change of focus on
sustainability concerns that overcomes the traditional subdivisions in economic,
environmental and social spheres. Secondly, evaluating trade-‐offs among hypothetical
scenarios using this approach promptly assists in flashing out which uses of the natural
environment might generate more wide-‐spread and long-‐term benefits.
However, there are at least two closely critical aspects that need to be acknowledged. Firstly,
although the equity perspectives considered in the approach are the most common and
compatible each other, different points of view evidently exist. It is a matter of personal
perceptions. With regard to impact assessment, equity concerns might be stated as how
individuals and groups perceive the proportional availability of good and services or the
relative deprivation compared with others (Halpern et al., 2013). It is clear that univocal and
absolute answer is not possible. Nevertheless, having discussed and reached an agreement on
perspectives to be adopted in assessment, the proposed equity framework might be useful for
formalizing shared equity perspectives in decision-‐making by incorporating quantifiable and
feasible related criteria.
A second interrelated aspect refers to the selection of equity criteria that might help in
identifying indicators for making equity operable on the ground. Being aware of the vast
interdisciplinary area that links concepts of sustainability and intra-‐ and inter-‐generational
equity, I made no claims to being comprehensive in translating the chosen equity perspectives
into criteria. It is important to point out that this study lays some methodological foundations
on how to address equity in strategic assessment, but they might be refined and enriched by
other substantive insights. For instance, the most important area of further investigation is
over how to establish suitable criteria for better covering social distributional implications
across generations.

CHAPTER 8
152
8.3 Strengths and weaknesses of the case study application
Combining sustainable criteria indicators, tailor-‐made for intra-‐ and inter-‐generational equity
issues, with scenario analysis, this study sought to develop and testing a methodology for
comparing potential implications of different policy options over space and time. The
application of the equity approach to the case study showed that dealing with equity in the
context of sustainability is doable, even if shaping sustainability through the lens of equity
presents several critical aspects.
The four equity perspectives and related criteria helped to identify and focus on opportunity
and risk of different scenario options at strategic level. The approach to understanding
benefits and trade-‐offs provided a simple yet flexible framework for quali-‐quantitatively
assessing the implications of different potential futures. Firstly, the empirical analysis made
possible to easily describe and visualize a picture of overall consequences of scenario options
in term of aggregated equity score at the different geographical and temporal scales.
Secondly, it enabled to compare trade-‐offs across the four equity perspectives appraised
separately (e.g. Figure 7.7). Thirdly, it also helped to identify scenarios that favour more
equitable solutions both in space and time over others. Moreover, although the constructed
scenarios focused on assessing benefits and trade-‐offs at regional and local levels, this method
may be applied to different spatial scales, if appropriate knowledge about key aspects (actors,
factors and sectors), which may affect strategic actions, exists and is opportunely stated.
Nevertheless, it is not pointless to stress that the two main critical aspects about the
theoretical framework underlined in Section 8.3, coexistence of different points of view on
equity and possible need of considering other equity criteria, evidently constraint the results
and the interpretation of implications potentially affecting generations at different temporal
and territorial scale (local and regional). However, regarding the selection of equity criteria for
translating the four equity perspectives into operational criteria and indicators for the case-‐
study, I made efforts to anchor these perspectives to a restricted number of potential criteria
of particular concern for the case study. Moreover, another limitation concerns the fact that,
even if the case study focused on three geographical scales, it did not make distinction in
distribution of equity within each level of analysis. Thus, this research was a first step in
exploring distributive concerns resulting from developmental decisions by assessing
consequences not simply in aggregate but trying to distinguish at least by macro-‐areas.

CONCLUSIONS
153
Clearly, there is room for improvement in a number of aspects that need to be added to those
highlighted in Chapter 7. It is therefore important to critically evaluate the methodological
approach employed for operationalized equity in relation to the use of indicators. There are
important insights that deserve critical attention. Firstly, often indicators are not so neutral as
they seem (Potschin, 2009). The answers that they offer in assisting decision-‐making might be
influenced by considerations, priorities and expectations of those carrying out the analysis
(Paracchini et al., 2011). Equally, such subjective limitations are recognised in making
assessment by using scenarios (Helming and Pérez-‐soba, 2011). Thirdly, the assessment
methodology can substantially benefit from the identifications of target and thresholds for the
indicators.
Beyond providing a tool that aid in identifying equity trade-‐offs between scenarios, it is
fundamental understanding the degree to which scenario outcomes should be considered
acceptable. A consolidated way to tackle these issues could be to underpin the suggested
approach by introducing extensive participatory processes between decision-‐makers,
technicians and public. Thus, open deliberative comparisons could have the effects of
underpinning reliability as well as effectiveness of the proposed method in supporting
decision-‐making. However, an important aspect to be highlighted is that the review of equity
perspectives allowed identifying suitable proxy indicators. Thus, although it is not argued
completeness of the general statements about equity issues gathered from literature, they
offered a room for manoeuvre in shaping indicators according to contexts as well as restraints
in analysis. They helped in making more explicit the case specific equity issues and translating
them into a feasible set of indicators.
8.4 Recommendations for future research
Although explained as having being carried out in well-‐defined consecutive stages, my
research approach has rather been of an explorative nature, as learning from each stage
partially changed my insights of what I had learnt and concluded in previous ones. As a
consequence, my understanding of the topic of my research has progressively maturated,
resulting in my views having partially expanded over time. I have deepened that models
centred on equity could aid in evaluating the sustainability implications of decision-‐making

CHAPTER 8
154
answering to the need to be integrative. According to my attempt, optimizing approaches for
incorporate equity considerations in assessment should be highly beneficial for sustainability.
However, I am perfectly aware that my research is just a first effort in addressing the topic
identified and offers several insights (reflections) for future research. The approach proposed
need to be improved and refined in order to strengthen its robustness in addressing intra-‐ and
inter-‐generational equity issues in sustainability assessment. To do this, it would be important
to formulate different scenarios that simulate more alternative and contrasting future
storylines. It might help in revealing inconsistencies and conflicts in the adopted equity
criteria, especially with regard to the comparison of trade-‐offs across the four equity
perspectives. This should be of significance for verifying whether the method supports the
identification of future options that seek to optimize benefits among multiscaled and
potential more conflicting objectives. Thus, undertaking sustainability assessment through the
lens of equity will be of proved assistance in “maximizing multiple, mutually reinforcing, fairly
distributed, adaptable and lasting contributions to sustainability while avoiding significant
adverse effects”.
Similarly, it would be worthwhile to compare results by zooming on other geographical scales
around the study area. For example, investigating neighbouring areas outside the Region,
which would potentially amplify questions related to possible unfair distributions of gains and
loses, since these areas are excluded by direct economic benefits, but could be equally
affected by negative consequences, such as environmental detriments and damages.
Another area for improvement refers to the inclusion of participatory processes into the
model. Over the past decade, it has been strongly recognised that combining quantitative
modelling with qualitative participatory tools could remarkably increase the validity of
sustainability assessment tools. Specifically, It might be of crucial importance for bridging two
substantial gaps emerged from this study: fine-‐tuning equity criteria and identifying target
values for corresponding indicators. Firstly, participatory processes and stakeholder
engagements can help in refining equity criteria, in particular fleshing out concerns related to
social group equity (e.g. gender), which were excluded by this research for difficulties in
addressing them by using desk research.

CONCLUSIONS
155
Secondly, it can be fundamental for identifying target values for indicators. Definitions of
limits/thresholds, and their implications for strategic decisions have recently emerged as an
important focus of debate in the sustainability issues. Sustainability limits are defined as the
unacceptable damage of a pressure on a social, economic or environmental system based on
current knowledge (Pérez-‐Soba et al., 2008). In order to value sustainability of strategic
decisions according to the equity perspectives chosen, thresholds would provide a helpful way
to associate a minimum level for the equity criteria under which solutions should be
necessarily excluded by analysis.
Moreover, it is important to notice that using participatory approaches should be possible to
consolidate the equity approach, since values and perceptions, along which base the
definition of the set of equity criteria, would be legitimated by open comparison and
assessment. For instance, by involving stakeholders and experts, it might be undertaken
pairwise comparisons for determining the relative weights of each criterion, in order to take
advantages from full potentiality of multi-‐criteria analysis. In fact, it should be essential to
establish a preference order on the criteria and to determine the redundant and less
important criteria in terms of discriminating power on the alternatives.
In this sense, the equity framework proposed might be a suitable tool for supporting and
guiding this deliberative process. Similarly, suitable help could be expected from the simple
spatial-‐temporal matrix framed through the lens of equity for analysing and discussing
concurrently temporal and spatial implications of plausible future scenarios.


References
Agyeman J, Bullard R, Evans B. Exploring the Nexus: bringing together sustainability, environmental justice and equity. Space Policy 2002;6(1):77–90.
Agyeman J, Evans T. Toward just sustainability in urban communities: building equity rights with sustainable solutions. Ann Am Acad Pol Soc Sci 2003;590(1):35–53.
Albrechts L. Strategic ( spatial ) planning reexamined. Environ. Plan. 2004;31:743–58.
Alcamo J, Henrichs T. Towards guidelines for environmental scenario analysis. In Alcamo J, editor. Environmental Futures: The practice of environmental scenario analysis. Elsevier; 2008. Ch. 2, p. 13–35.
Alcamo J, Kok K, Busch G. Searching for the future of land: Scenarios from the local to global scale. Environmental Futures: The practice of environmental scenario analysis. Elsevier; 2008. Ch. 4, p. 67–103.
Anand S, Sen A. Human development and economic sustainability. World Development 2000;28(12):2029–2050.
Annoni P, Dijkstra L. EU Regional Competitiveness Index RCI 2013. Unit of Econometrics and Applied Statistics, DG JRC, Ispra; 2013. Available at: http://ec.europa.eu/regional_policy/sources/docgener/studies/pdf/6th_report/rci_2013_report_final.pdf
Annoni P, Kozovska K. EU Regional Competitiveness Index RCI 2010. European Commission. Joint Research Centre. Institute for the Protection and Security of the Citizen. Luxembourg: Publications Office of the European Union; 2010.
Arrow K, Daily G, Dasgupta P, Goulder L, Gretchen D, Ehrlich P, Heal G, et al. Are We Consuming Too Much? The Journal of Economic Perspectives 2004;18(3):147–172.
Bach H, Bakker M, Farrington J et al. Indicators – methodology and descriptions. In: Helming K, Wiggering H, editors, SENSOR Report Series 2008/7, Müncheberg (Germany): ZALF; 2009. Available at: http://www.sensor-‐ip.eu.
Bachtler J, Yuill, D. Policies and Strategies for Regional Development: A Shift in Paradigm? European Policies Research Centre University of Strathclyde Glasgow Regional and Industrial Policy Research Paper 46; 2001; p. 1–41. Available at: http://www.eprc.strath.ac.uk/eprc/Documents/PDF_files/R46PoliciesandStrategiesforRegionalDevelopment.pdf
Bäcklund AK. Impact assessment in the European Commission – a system with multiple objectives. Environ. Sci. Policy 2009;12(8):1077–87.
Banca d’Italia. Le Economie Regionali. L’economia della Basilicata. Numero n° 18. Banca d’Italia; 2013. Available at: http://www.bancaditalia.it.
Basiago A. Economic, social, and environmental sustainability in development theory and urban planning practice. The Environmentalist 1999;19:145–161.
Basso B, De Simone L, Ferrara A, Cammarano D, Cafiero G, Yeh M, et al. Analysis of Contributing Factors to Desertification and Mitigation Measures in Basilicata Region. Ital. J. Agron. / Riv. Agron 2010; 3 Suppl.:33–44.

REFERENCES
158
Baycan-‐Levent T, Bruinsma F, Nijkamp P. Urban spiders: A comparative framework for evaluation and scenario analysis. In Curwell SR, Deakin M, Symes M, editors, Sustainable Urban Development: The environmental assessment methods, New York: Routledge; 2007.
Beanlands GE, Duinker PN. An ecological framework for environmental impact assessment in Canada. Institute for Resource and Environmental Studies, Dalhousie University, Halifax and Federal Environmental Assessment Review Office, Hull, Quebec, Canada; 1983.
Beder S. Costing the Earth: Equity, Sustainable Development and Environmental Economics. New Zealand Journal of Environmental Law 2000;4:227–243.
Berkes F. Understanding uncertainty and reducing vulnerability: lessons from resilience thinking. Natural Hazards 2007;41(2):283–295.
Bina O, Wallington T, Thissen W. SEA theory and research: an analysis of the early discourse. In: Sadler B, Aschemann R, Dusik J, Fischer TB, Partidário MR, Verheem R, editors. Handbook of strategic environmental assessment. London: Earthscan; 2011. p. 445–71.
Blamey RS, Commin MS. Valuation and ethics inenvironmental economics. In Bergh JCJM van den, editor. Handbook of Environmental and Resource Economics; 1999. Ch. 56.
Bond A, Morrison-‐Saunders A, Pope J. Sustainability assessment: the state of the art. Impact Assessment and Project Appraisal 2012;30(1):53–62.
Bond A, Morrison-‐Saunders A. Re-‐evaluating sustainability assessment: aligning the vision and the practice. Environ Impact Assess Rev 2011;31(1):1–7.
Boone CG. Environmental justice, sustainability and vulnerability. International Journal of Urban Sustainable Development 2010;2(1-‐2):135–140.
Börjeson L, Höjer M, Dreborg KH, Ekvall T, Finnveden G. Scenario types and techniques: Towards a user’s guide. Futures 2006;38:723–739.
Boschma R, Crescenzi R, Esteves AM, Huber W, Percoco M, de Propris L, Thiene, M. Towards an Operational Regional Development Program Basilicata Region 2014-‐2020. Capacity Lab Pilot Project, Final report january 2013. Available at: http://www.pofesr.basilicata.it/11287.
Bragagnolo C, Geneletti D, Fischer TB. Cumulative effects in SEA of spatial plans—evidence from Italy and England. Impact Assess Proj Apprais 2012;30(2):100–10.
Bramley G, Dempsey N, Power S, Brown C. What is ‘Social Sustainability’ and How do our Existing Urban Forms Perform in Nurturing it? Paper presented at the ‘Sustainable Communities and Green Futures’ Conference, Bartlett School of Planning, University College London, London; 2006.
Brandon P, Lombardi P. Evaluating Sustainable Development in the Built Environment. John Wiley and Sons; 2010.
Brigthon & Hove City Council. Sustainability Appraisal of the Core Strategy. Brigthon & Hove City Council’s Local Development Framework. Brigthon & Hove City Council; 2010.
Canada-‐Newfoundland Offshore Petroleum Board (prepared for). Strategic Environmental Assessment Laurentian Subbasin. Prepared by Jacques Whitford Environment Limited; 2003.
CCME (Canadian Council of Ministers of the Environment). Regional Strategic Environmental Assessment in Canada: Principles and Guidance. Winnipeg, MB: Canadian Council of Ministers of the Environment; 2009.
CEC (Commission of the European Communities). The EU Compendium of Spatial Planning Systems and Policies Commission of the European Communities, Luxembourg: Office for the Official Publications of the European Communities; 1997.

REFERENCES
159
Chapin FS, Carpenter SR, Kofinas GP, Folke C, Abel N, Clark WC, et al. Ecosystem stewardship: sustainability strategies for a rapidly changing planet. Trends Ecol. Evol. 2010;25(4):241–9. Available at: http://www.ncbi.nlm.nih.gov/pubmed/19923035.
Chichilnisky G. What is sustainable development. Land Economics 1997;73(4):467–491.
Christen M, Schmidt S. A Formal Framework for Conceptions of Sustainability – a Theoretical Contribution to the Discourse in Sustainable Development. Sustainable Development 2011;19:n/a.
Clark WC (adapted by). Sustainable Development and Sustainability Science. In Clark WC and Levin SA. Toward a Science of Sustainability. Report from Toward a Science of Sustainability Conference Airlie Center. Warrenton, Virginia November 29, 2009 – December 2, 2009; 2010: p.80-‐100. Available at http://www.nsf.gov/mps/dms/documents/SustainabilityWorkshopReport.pdf.
Clarke AH. Understanding sustainable development in the context of other emergent environmental perspectives. Policy Sci 2002;35(1):69–90.
Colantonio A, Lane G. Measuring Social Sustainability: Best Practice from Urban Renewal in the EU 2007. EIBURS Working Paper Series. Renewal 2009;1–37.
Connelly S, Richardson T. Value-‐driven SEA: time for an environmental justice perspective? Environ Impact Assess Rev 2005;25(4):391–409.
Corte Costituzionale. Sentence n° 117 of June 3, 2013. Unconstitutionality of the Basilicata Regional Law n° 16 of August 8, 2012. Article 37.
Costanza R, Daly HE. Natural capital and sustainable development. Conserv. Biol. 1992;6:37–46.
Costanza R, Fisher B, Ali S, Beer B et al. Quality of life: an approach integrating opportunities, human needs, and subjective well-‐being. Ecological Economics 2007;61(2–3):267–276.
Costanza R. The Value of Natural and Social Capital in Our Current Full World and in a Sustainable and Desirable Future. In Weinstein MP and Turner RE, editors. Sustainability Science: The Emerging Paradigm and the Urban Environment. New York: Springer Science+Business Media, LLC; 2012; p. 99-‐110.
Cutter S. Race, class and environmetal justice. Progress in Human Geography 1995;19(1):111–122.
Dalal-‐Clayton B, Sadler B. Strategic environmental assessment: a sourcebook and reference guide to international experience. Trowbridge, UK, London: Earthscan; 2005.
Daly H. Commentary: toward some operational principles of sustainable development. Ecol Econ 1990;2:1–6.
Daly HE. Steady-‐State Economics, 2nd edn. Washington, DC: Island Press; 1991.
Dasgupta P. La vera ricchezza delle nazioni: per un pianeta sostenibile, una società giusta e un’economia in crescita. Lectio Magistralis. 14.02.2013. Trento: Euricse.
Dasgupta P. The Ethics of Intergenerational Distribution: Reply and Response to John E. Roemer. Environ Resource Econ 2011;50:475–493.
Dasgupta, P. The Place of Nature in Economic Development. In Rodrik D, and Mark Rosenzweig M, editors, Handbook of Development Economics. North-‐Holland: 2009. Vol. 5.
de Vries BJM. Sustainability Science. Outlook on Futures. Cambridge University Press; 2013. Ch. 15, p. 516–536.
DECC (Department of Energy and climate Change). Strategic Environmental Assessment for a 14th – and subsequent –onshore oil and gas licensing round. Department of Energy and climate
REFERENCES
160
Change; 2010. Available at: http://og.decc.gov.uk/en/olgs/cms/tech_papers/conf_papers/conf_papers.aspx.
DECC (Department of Energy and Climate Change). UK Offshore Energy Strategic Environmental Assessment Future Leasing for Offshore Wind Farms and Licensing for Offshore Oil & Gas and Gas Storage -‐ Environmental Report. Department of Energy and Climate Change; 2009.
Decree of the president of the Italian Republic 8 December 2007. Institution of the Val d’Agri – Lagonegrese (D.P.R. 8 Dicembre 2007. Istituzione del Parco della Val d’Agri Lagonegrese).
Department of State Development Government of Western Australia Strategic assessment of the Browse Basin liquefied natural gas precinct. Department of State Development Government of Western Australia; 2010. Available at: http://www.dsd.wa.gov.au/7909.aspx.
Diamantini C, Geneletti D. Reviewing the application of SEA to sectoral plans in Italy: the case of the mobility plan of an alpine region. Eur Environ 2004;14:123–33.
Directive 2001/42/EC of the European Parliament and of the Council on the assessment of the effects of certain plans and programmes on the environment. Available at: http://eur-‐lex.europa.eu.
Duinker PN, Greig LA. Scenario analysis in environmental impact assessment: Improving explorations of the future. Environmental Impact Assessment Review 2007;27:206–219.
E&P Forum/UNEP. Environmental Management in oil and gas exploration and production. An overview of issues and management approaches. Joint E&P Forum/UNEP Technical Publication; 1997.
Eales RP, Sheate WR. Effectiveness of policy level environmental and sustainability assessment: challenges and lessons from recent practice. J Environ Assess Policy Manage 2011;13(1):39–65.
Ecologic Institute. Establishing environmental sustainability thresholds and indicators. Final report to the European Commission's DG Environment; 2010. European Commission. Impact Assessment Guidelines. Available at: http://ec.europa.eu/governance/impact/commission_guidelines/docs/iag_2009_en.pdf 2009.
Eickhout, B., Meijl, H. Van, Tabeau, A., & Rheenen, T. Van. (2007). Economic and ecological consequences of four European land use scenarios. Land Use Policy 2007;24:562–575.
Ekins P, Vanner R. Sectoral Sustainability and Sustainability Assessment Methodologies: A Review of Methodology in light of collaboration with the UK Oil and Gas Sector. J Environ Plan Manage 2007; 50(1): 87–111.
Elvin, S. S., Fraser, G. S., 2012. Advancing a National Strategic Environmental Assessment for the Canadian Offshore Oil and Gas Industry With Special Emphasis on Cumulative Effects. Journal of Environmental Assessment Policy and Management 14(3):1–37.
ENI. Eni in Basilicata: Local Report – Synthesis 2013. Ente Nazionale Idrocarburi; 2013. Available at: https://www.eni.com.
Eni. Eni in Basilicata: Local Report 2012. Ente Nazionale Idrocarburi; 2012. Available at: http://www.eni.com/it_IT/attachments/sostenibilita/impegno-‐sostenibilita/eni-‐in-‐basilicata.pdf.
EPA Ghana. Guidelines for Environmental Assessment and Management in the Offshore Oil and Gas Development. An overview of Ghanaian Environmental Assessment procedure, oil and gas development issues and management approaches. Available from: http://www.www.epa.gov.gh.

REFERENCES
161
European Commission, DG ENV. Study concerning the report on the application and effectiveness of the SEA Directive (2001/42/EC). Final report April 2009. Available at: http://ec.europa.eu/environment/eia/pdf/study0309.pdf 2009.
European Commission. GDP and beyond: measuring progress in a changing world. COM(2009) 433 final. Brussels: European Commission; 2009b.
European Commission. GDP and beyond: measuring progress in a changing world. COM(2009) 433 final. Brussels: European Commission; 2009b.
European Commission. Impact Assessment Guidelines. 2009a. Available at: http://ec.europa.eu/governance/impact/commission_guidelines/docs/iag_2009_en.pdf.
Farley J. Ecosystem services: The economics debate. Ecosystem Services;2012;1:40–49.
Ferrara A, Bellotti A, Faretta S, Mancino G, Baffari P, D’Ottavio A, Trivigno V. Carta delle aree sensibili alla desertificazione della Regione Basilicata. Forest@ 2005;2(1):66-‐73. Available at: http://www.sisef.it.
Ferreira S, Akay A, Brereton F, Cuñado J, Martinsson P, Moro M, Ningal TF. Life satisfaction and air quality in Europe. Ecological Economics 2013;88:1-‐10.
Fidler C, Noble B. Advancing strategic environmental assessment in the offshore oil and gas sector: Lessons from Norway, Canada, and the United Kingdom. Environ Impact Assess Rev 2012;34:12–21.
Finnveden G, Nilsson M, Johansson J, Persson A, Moberg A, Carlsson T. Strategic environmental assessment methodologies: applications within the energy sector. Environ. Impact Assess. Rev. 2003;23:91–123.
Fisher TB. The Theory and Practice of Strategic Environmental Assessment. Towards a More Systematic Approach. London: Earthscan; 2007.
Foluke A. Strategic Environmental Assessment (Sea) for Oil and Gas Development Plans. Submitted to the Department of Environmental Science, Avans University of Applied Science, Breda, Netherlands; 2012. Available at: http://docs1.eia.nl/mer/diversen/foluke_finalassignment2.pdf.
Gandy OH. Wedging equity and environmental justice into the discourse on sustainability. For presentation to the Environment, Science and Risk Communication Working Group. IAMCR Istanbul, 2011.
Gardner JE. Decision making for sustainable development: Selected approaches to environmental assessment and management. Environ Impact Assess Rev 1989;9:337–366.
Gasparatos A, El-‐haram M, Horner M. A critical review of reductionist approaches for assessing the progress towards sustainability. Environmental Impact Assessment Review 2008;28:286 – 311.
Gaudreau K, Gibson RB. Illustrating integrated sustainability and resilience based assessments: a small-‐scale biodiesel project in Barbados. Impact Assess Proj Apprais 2010;28(3):233–43.
Geneletti D, Bagli S, Napolitano P, Pistocchi A. Spatial decision support for strategic environmental assessment of land use plans. A case study in southern Italy. Environ Impact Assess Rev 2007;27:408–23.
Geneletti D. An approach based on spatial multicriteria analysis to map the nature conservation value of agricultural land. J. Environ. Manage. 2007;83:228–35.
George C. Testing for sustainable development through environmetal assessment. Environmental Impact Assessment Review 1999;19:175–200.

REFERENCES
162
Gibson R. Beyond the pillars: sustainability assessment as a framework for effective integration of social, economic and ecological considerations in significant decision-‐making. J Environ Assess Policy Manage 2006;8(3):259–80.
Gibson RB, Holtz H, Tansey J, Whitelaw G, Hassan S. Sustainability assessment: criteria and processes. London: Earthscan; 2005.
Gibson RB. Application of a contribution to sustainability test by the Joint Review Panel for the Canadian Mackenzie Gas Project, Impact Assessment and Project Appraisal 2011;29(3):231-‐244.
Glasser H. Ethical perspectives and environmental policy analysis. In: Bergh JCJM van den, editor. Handbook of Environmental and Resource Economics. Chehenham, UK, Northampton, MA, USA: Edward Elgar; 1999. p. 981–1000.
Goodland R. The biophysical basis of environmental sustainability. In: Bergh JCJM van den, editor. Handbook of Environmental and Resource Economics. Chehenham, UK, Northampton, MA, USA: Edward Elgar; 1999. Ch. 48, p. 709–721.
Government of Québec (prepared for). Strategic Environmental Assessment of Oil and Natural Gas Exploration and Development in the Anticosti, Madeleine and Baie des Chaleurs Basins (SEA2): Genivar (prepared by); 2011. Available at: http://www.ees.gouv.qc.ca/english/publications.asp.
Government of Saskatchewan. The Great Sand Hills Regional Environmental Study: Final Report, 2007-‐104: Government of Saskatchewan; 2007. Available at: http://www.environment.gov.sk.ca/Default.aspx?DN=bc247d49-‐29a2-‐4685-‐98bced6cc4a3c7e0.
Govierno de Chile Guía para la Evaluación de Impacto Ambiental. Servicio de Evaluación Ambiental; 2011.
Grace W. Healthy and resilient socio-‐ecological systems: towards a common approach to sustainability assessment and management [Internet]. Paper presented at the 2010 Sustainability Assessment Symposium. Fremantle, Western Australia; 2010. Available from: http:// integral-‐sustainability.net/sas-‐2010-‐programme-‐updates/pa pers/bill-‐grace.
Greeuw SCH, van Asselt MBA, Grosskurth J, Storms CAMH, Rijkens-‐Klomp N, Rothman DS. Cloudy crystal balls: an assessment of recent European and global scenario studies and models. Environmental Issue Report, vol. 17. Copenhagen, Denmark: European Environment Agency; 2000. Available at: http://reports.eea.europa.eu/Environmental_issues_series_17/en.
Gunn J, Noble BF. Conceptual and methodological challenges to integrating SEA and cumulative effects assessment. Environ Impact Assess Rev 2011;31:154–160.
Halpern BS, Klein CJ, Brown CJ, Beger M, Grantham HS, Mangubhai S, et al. Achieving the triple bottom line in the face of inherent trade-‐offs among social equity, economic return, and conservation. Proc. Natl. Acad. Sci. 2013;110(15):6229–34.
Hargrove, EC. Foundations of Environmental Ethics. EnglewoodCliffs, N.J.: Prentice-‐Hall; 1989.
Harriman JAE, Noble BF. Characterizing project and strategic approaches to regional cumulative effects assessment in Canada. J Environ Assess Policy Manage 2008;10:25–50.
Harsanyi JC. Rule utilitarianism, equality, and justice. In: Paul EF, Miller FD, Paul J, editors. Ethics and Economics. Oxford: Basil Btackwell; 1985. p.115–127.
Haughton G. Environmental justice and the sustainable city. Journal of Planning Education and Research 1999;18(3):233–243.

REFERENCES
163
Haughton G. Geographical equity and regional resource management: water management in southern California. Environment and Planning B. Planning and design 1998;25:279–298.
Helming K, Pérez-‐soba M. Landscape Scenarios and Multifunctionality: Making Land Use Impact. Ecology and Society 2011;16(1): 50.
Hermans F, Knippenberg L. A Principle-‐Based Approach for the Evaluation of Sustainable Development. Journal of Environmental Assessment Policy and Management 2006;8(3):299–319.
Horvath CL, Barnes JL. Applying a regional strategic environmental assessment approach to the management of offshore oil and gas development. Jacques Whitford Environment Ltd; 2004. Available at: http://siteresources.worldbank.org/INTRANETENVIRONMENT/1705736-‐1127758054592/20686579/UK_Oil_and_Gas_SEA.pdf.
Howarth RB. Sustainability under Uncertainty: A Deontological Approach. Land Economics 1995;71(4):417– 427.
IFC. Environmental, Health, and Safety Guidelines for Onshore Oil and Gas Development. World Bank Group; 2007.
ISTAT and CNEL. Bes| 2013. Il benessere equo e sostenibile in Italia. Istituto nazionale di statistica e Consiglio Nazionale dell’Economia e del Lavoro; 2013.
ISTAT. Anni 1995-‐2011. Il reddito disponibile delle famiglie nelle regioni italiane. Istituto Nazionale di Statistica; 2013a. Available at: http://www.istat.it/it/files/2013/02/Report_RedditoDisponibile_Regionale.pdf?title=Reddito+disponibile+delle+famiglie+-‐+06%2Ffeb%2F2013+-‐+Testo+integrale.pdf.
ISTAT. L’Italia del censimento struttura demografica e processo di rilevazione Basilicata. Istituto Nazionale di Statistica; 2013b. Available at: http://www.istat.it/it/files/2013/01/Basilicata_Volume.pdf.
ISTAT. L’Italia del censimento. Struttura demografica e processo di rilevazione: Basilicata. 15° Censimento Generale delle popolazioni e delle abitazioni 2011. Istituto Nazionale di Statistica; 2013. Available at: http://www.istat.it.
Johnson BL. Introduction to the special feature: adaptive management — scientifically sound, socially challenged? Conserv Ecol 1999;3(1):10. Available at: www.consecol.org/vol3/iss1/art10/.
Johnson D, Lalonde K, McEachern M, Kenney J, Mendoza G, Buffin A, Rich K. Improving cumulative effects assessment in Alberta: Regional strategic assessment. Environ Impact Assess Rev 2011;31:481–483.
Joint Review Panel for the Mackenzie Gas Project. Foundation for a Sustainable Northern Future, December 2009. Available at http://www.ceaa-‐acee.gc.ca/default.asp?lang=En&n=155701 CE-‐1.
Jones C, Baker M, Carter J, Jay S, Short M, Wood C. Strategic environmental assessment and land use planning: an international evaluation. London: Earthscan; 2005.
Kajikawa Y. Research core and framework of sustainability science. Sustainability Science 2008;3(2):215-‐239.
Kates RW, Clark WC, Corell R, Hall JM et al. Sustainability science. Science 2001;292:641-‐642.
Kauffman J. Advancing sustainability science : report on the International Conference on Sustainability Science (ICSS) 2009; Sustain Sci 2009;4:233–42.

REFERENCES
164
Kidd S, Fischer TB. Towards sustainability: is integrated appraisal a step in the right direction? Environ Plan C Gov Policy 2007;25(2):233–49.
Kosow H, Gaßner R. Methods of future and scenario analysis. Overview, assessment, and selection criteria. German Development Institute (DIE) Research Project “Development Policy: Questions for the Future”. German Development Institute; 2008.
Kuik OJ, Gilbert AJ. Indicators of sustainable development. In: Bergh JCJM van den, editor. Handbook of Environmental and Resource Economics. Chehenham, UK, Northampton, MA, USA: Edward Elgar; 1999. Ch. 49.
Leopold A. A Sand County Almanac and Sketches Here and There. New York: Oxford University Press; 1949.
Leopold A. The Land Ethic. In: Keller DR, editor. Environmental Ethics: The Big Questions., Chichester,UK: John Wiley & Sons; 2010. Ch.23, p.194.
Levin SA. Epilogue: The challenge of sustainability: Lessons from an evolutionary perspective. In Weinstein M, Taylor RE, editors. Sustainability Science: The Emerging Paradigm and the Urban Environment. New York: Springer; 2012. p. 168–174.
MAP. Scenario tendenziale dei consumi e del fabbisogno al 2020. Ministero Attività Produttive, Direzione Generale Energia e Risorse Minerarie; 2005. Available at: http://dgerm.sviluppoeconomico.gov.it/dgerm/scenarioenergetico/scenario_energetico_tendenziale_al_2020_vers05_05.pdf.
Marshall JD, Toffel MW. Framing the elusive concept of sustainability: a sustainability hierarchy. Environ Sci Technol 2005;39(3):673–82.
Martens P. Sustainability: science or fiction? Sustain. 2006;2(1):36–41.
Maschewsky W. Environmental justice in Scotland: just words? A view from outside. Edinburgh: Friends of the Earth Scotland; 2005. Available at: www.foe-‐scotland.org.uk/Aviewfromoutside.
McKenzie S. Social Sustainability: towards some definitions. Hawke Research Institute Working Paper Series No 27. Magill, South Australia: Hawke Research Institute University of South Australia; 2004.
Millennium Ecosystem Assessment (MA), Ecosystems and HumanWell-‐being: A Framework for Assessment. Washington, DC: Island Press; 2003.
Ministerio de Hidrocarburos y Energia de Bolivia. Propuesta de Guia de Evaluacion Ambiental Estrategica del Sector Hidrocarburos. La Paz: Ministerio de Hidrocarburos y Energia de Bolivia; 2011.
Ministry of Commerce, Industry and Tourism of the Republic of Cyprus (prepared for). Strategic Environmental Assessment concerning Hydrocarbon Activities within the Exclusive Economic Zone of the Republic of Cyprus. Marine Communication Services, Inc. (MCI), Aeoliki Ltd., and CSA International, Inc. (CSA) in cooperation with the University of Cyprus Oceanographic Centre (prepared by); 2008.
Ministry of Industry of Iceland. Oil exploration in the Dreki area on the Jan Mayen Ridge. Proposal for a plan to offer exclusive exploration and production licences for oil and gas in the Dreki area (Dragon area) on the Jan Mayen Ridge, northeast of Iceland and a Strategic Environmental Assessment (SEA) of the proposed plan; 2007. Available at: http://eng.idnadarraduneyti.is/media/Rafraen_afgreidsla/Report_on_oil_exploration-‐KK.PDF.

REFERENCES
165
MISE. Annual report 2013. Ministero Sviluppo Economico; 2013. Available at: http://unmig.sviluppoeconomico.gov.it/unmig/stat/ra2013.pdf.
MISE. Strategia Energetica Nazionale: per un’energia più competitiva e sostenibile. 2012. Available at: http://www.sviluppoeconomico.gov.it.
Mitchell G, Dorling D. An environmental justice analysis of British air quality. Environment and Planning A 2003;35(5):909–29.
Morita T et al. Greenhouse Gas Emission Mitigation Scenarios and Implications. In: Metz B et al. editors, Climate Change 2001: Mitigation. Contribution of Working Group III to the Third Assessment Report of the Intergovernmental Panel on Climate Change. Cambridge, U.K., and New York, N.Y.: Cambridge University Press; 2001. Available at: http://www.ipcc.ch/publications_and_data/publications_and_data_reports.htm. Retrieved 2010-‐01-‐10.
Morris JB, Tassone V, de Groot R, Camilleri M, Moncada S. A Framework for Participatory Impact Assessment (FoPIA): involving stakeholders in European policy making, a case study of land use change in Malta. Ecology and Society 2011;16(1): 12.
Morrison-‐Saunders A, Arts J. Assessing Impact. Handbook of EIA and SEA Follow-‐up. London: Earthscan; 2004.
Morrison-‐Saunders A, Fisher TB. What is wrong with EIA and SEA anyway? A sceptic's perspective on sustainability assessment. J Environ Assess Policy Manage 2006;8(1):19–39.
Morrison-‐Saunders A, Hodgson N. Applying sustainability principles in practice: guidance for assessing individual proposals. Presented at: IAIA09 Impact Assessment and Human Well-‐Being, 29th Annual Conference of the International Association for Impact Assessment, 16–22 May 2009, Accra, Ghana; 2009. Available at: http://researchrepository.murdoch.edu.au/1707/1/Applying_Sustainability_Principles_2009.pdf.
Morrison-‐Saunders A, Pope J. Conceptualising and managing trade-‐offs in sustainability assessment. Environ. Impact Assess. Rev. 2013;38:54–63.
Morrison-‐Saunders A, Therivel R. Sustainability Integration and Assessment. Journal of Environmental Assessment Policy and Management 2006;8(03):281–298.
Mosbech A, Boertmann D, Jespersen M. Strategic Environmental Impact Assessment of hydrocarbon activities in the Disko West area. National Environmental Research Institute, NERI technical report no. 618, University of Aarhus; 2007.
Munda G., Saisana M. Methodological Considerations on Regional Sustainability Assessment Based on Multicriteria and Sensitivity Analysis. Reg. Stud. 2011;45(2):261–276.
Munier N. Introduction to Sustainability: Road to a Better Future. Dordrecht, The Netherlands: Springer; 2005. Ch.1.
NCEA (Netherland Commission for Environmental Assessment). Advice on Terms of Reference for SEA for Oil and Gas – Bolivia. Netherland Commission for Environmental Assessment; 2009. Available at: http:// www.eia.nl.
NCEA (Netherland Commission for Environmental Assessment). Review of SEA for Oil and Gas NCEA – Bolivia. Netherland Commission for Environmental Assessment; 2012. Available at: http://www.eia.nl.
Nelson P. SEA and Spatial Planning. In: Sadler B, Aschemann R, Dusik J, Fischer TB, Partidário MR, Verheem R, editors. Handbook of strategic environmental assessment. London: Earthscan; 2011. p. 310–334.

REFERENCES
166
Neville Ash, Blanco H, Brown C, Garcia K, Henrichs T etal. Ecosystems and Human Well-‐Being. UNEP, editor. ISLAND Press; 2010.
Newman P. The environmental impact of cities. Environ Urban 2006;18:275–95.
Noble B. Strategic approaches to regional cumulative effects assessment: a case study of the Great Sand Hills, Canada. Impact Assess Proj Apprais 2008;26(2):78–90.
NORAD (Norwegian Agency for Development Cooperation) and World Bank Group (prepared for). Environmental Governance in Petroleum Producing Countries -‐ Findings from a comprehensive survey; September 2009. Available at: http://siteresources.worldbank.org/EXTOGMC/Resources/Environmental_Governance.
Norgaard RB. The case for methodological pluralism. Ecological Economics 1989;1:37–57.
Norgaard RB. Vision and Methods of Ecological Economics. In: Sahu NC and Choudhury AK, editors. Dimensions of Environmental and Ecological Economics. Hyderabad, India: Universities Press; 2005. p. 19-‐29.
Norwegian Ministry of Environment. Environmental Manual for petroleum activities. The Oil for Development Programme, Norad Petrad. DRAFT January 21, 2009.
ODPM. A practical guide to the strategic environmental assessment directive. Northern Ireland: Office of the Deputy Prime Minister, Scottish Executive, Welsh Assembly Government and Department of the Environment; 2005. Available at: http://www.communities.gov.uk/publications/planningandbuilding/practicalguidesea.
OECD. Conducting Sustainability Assessment. Organisation for Economic Co-‐operation and Development; 2008.
Ortolano. Environmental planning and decision making. New York: Wiley; 1984.
Osmani SR. Theory of Justice for an Imperfect World: Exploring Amartya Sen’s Idea of Justice. J. Hum. Dev. Capab. 2010;11(4):599–607.
Ostrom E. A general framework for analysing sustainability of social–ecological systems. Science 2009;325:419–22.
Ozelkan EC, Duckstein L. Analysing water resources alternatives and handling criteria by multi criterion decision techniques. Journal of Environmental Management 1996;48:69-‐96.
Padilla E. Intergenerational equity and sustainability. Ecological Economics 2002;41:69–83.
Page T. On the Problem of Achieving Efficiency and Equity, Intergenerationally. Land Economics 1997;73(4):580–96.
Pahl-‐Wostl C. The implications of complexity for integrated resources management. Environ. Model. Softw. 2007;22(5):561–9.
Paracchini ML, Pacini, C, Jones, MLM, Pérez-‐Soba M. An aggregation framework to link indicators associated with multifunctional land use to the stakeholder evaluation of policy options, Ecological Indicators 2011;11(1):71-‐80.
Partidário MR, Augusto B, Vicente G., Lobos V. Learning the practice of strategic-‐based SEA. Presented at the 29th Annual Conference of the International Association for Impact Assessment IAIA09, Accra, 17-‐22 May, 2009. IAIA; 2009.
Partidário MR, Gomes RC. Ecosystem services inclusive strategic environmental assessment. Environmental Impact Assessment Review 2013;40:36–46.
Partidário MR, Vicente G, Belchior C. Can new perspective on sustainability drive lifestyles? Sustainability 2010;2:2849–72.

REFERENCES
167
Partidário MR. Scales and associated data – what is enough for SEA needs? Environmental Impact Assessment Review 2007a;27:460–478.
Partidário MR. Strategic Environmental Assessment: Good Practices Guide, Methodological Guidance, Portuguese Environment Agency; 2007b.
Partidário MR. Strategic Environmental Assessment: Good Practices Guide, Methodological Guidance, Portuguese Environment Agency and Redes Energética Nacionais (REN), SA; 2012.
Partidário MR. Strategic Environmental Assessment: Key issues emerging from recent practice, Environmental Impact Assessment Review 1996;16:31–55.
Partidário MR. Strategic-‐based model for SEA based on Critical Factors for Decision Making (CFD). Proceedings of the 28th Annual IAIA Conference. Perth, Australia; 2008.
Pearce D, Hamilton G, Atkinson GD. Measuring sustainable development: progress on indicators. Environment and Development Economics 1996;1:85–101.
Pearce DW, Turner RK. Economics of Natural Resources and the Environment. Hertfordshire, England: Harvester Wheatsheaf; 1990.
Perman R. et al. Natural Resource and Environmental Economics. 2nd edition. Longman; 1999.
Pezzey JCV, Toman MA. Progress and Problems in the Economics of Sustainability. Forthcoming in Tom Tietenberg and Henk Folmer, editors. International Yearbook of Environmental and Resource Economics 2002/2003. Cheltenham, UK: Edward Elgar; 2002.
Pope J, Annandale D, Morrison-‐Saunders A. Conceptualising sustainability assessment. Environ Impact Assess Rev 2004;24:595–616.
Pope J, Dalal-‐Clayton B. From SEA to sustainability assessment? In: Sadler B, Aschemann R, Dusik J, Fischer TB, Partidário MR, Verheem R, editors. Handbook of strategic environmental assessment. London: Earthscan; 2011. p. 547–65.
Potschin M. Land use and the state of the natural environment. Land Use Policy 2009;26(1):S170-‐S177.
Proops JLR. Integration and communication between environmental economics and other disciplines In: Bergh JCJM van den, editor. Handbook of Environmental and Resource Economics. Chehenham, UK, Northampton, MA, USA: Edward Elgar; 1999. Ch. 79.
Prugh T, Costanza R, Daly HE. The Local Politics of Global Sustainability. Washington, DC; Island Press; 2000.
Qizilbash M. On Ethics and the Economics of Development. The Journal of Philosophical Economics 2007;I:1,54–73.
Ravetz J. Post-‐normal science and the complexity of transitions towards sustainability. Ecological Complexity 2006;3:275–284.
Rawls J. A Theory of Justice. Oxford: Oxford University Press; 1971.
Rees W. Ecological footprint and appropriated carrying capacity: what urban economics leaves out. Environ Urban 1992;4(2):121–30.
Regional Law n° 16 of August 8, 2012. Article 37. Urgent provisions for land management and land take reduction.
Regione Basilicata, UnionCamere Basilicata, ISTAT, SISTAN. Annuario Statistico Regionale 2011 – Basilicata; 2012. Avaliable at: http://rsdi.regione.basilicata.it.
Regione Basilicata. Carta delle aree sensibili alla desertificazione in Basilicata; 2004. Available at: http://annuario.isprambiente.it/data/T15/2201/Ver_9/carta_basilicata.jpg.
REFERENCES
168
Regione Basilicata. Programma Operativo 2007-‐2013. Fondo Europeo di Sviluppo Regionale. IIIa versione; 2007. Available at: http://www.regione.basilicata.it/sportelloeuropa/default.cfm?fuseaction=linkdoc&doc=6270&link=6421.
Regione Basilicata. Report di sintesi sullo stato di attuazione del programma operativo Val d’Agri -‐ Melandro -‐ Sauro – Camastra aggiornato al 31 dicembre 2011. Regione Basilicata, Struttura di Progetto “ Val d’Agri”; 2013. Available at: www. povaldagri.basilicata.it.
Regione Basilicata. Rete Natura 2000. Available at: http://natura2000basilicata.it/la-‐rete-‐in-‐basilicata.
Reidsma P, König H, Feng S, Bezlepkina I, Nesheim I, Bonin M, et al. Methods and tools for integrated assessment of land use policies on sustainable development in developing countries. L. Use Policy 2011;28(3):604–17.
Rein M, Schön D. Reframing Policy Discourse. In: Fischer F, Forester J, editors. The Argumentative Turn in Policy Analysis and Planning. Durham: Duke University Press; 1993. p. 145–66.
RIM (Islamic Republic of Mauritania) and World Bank (prepared for). Strategic Environmental and Social Assessment of Oil and Gas Development in Mauritania. Integrated Environments Ltd and D’Appolonia S.p.A (prepared by); 2011.
Roemer J, Suzumura K, editors. Intergenerational Equity and Sustainability. Pag. xvi. Palgrave Publishers Ltd; 2007.
Rose A, Kvernd S. Equity in environmental policy with an application to global warming In Bergh JCJM van den, editor. Handbook of Environmental and Resource Economics; 1999: Ch. 24.
Rothman DS. 2008. A survey of Environmental Scenarios. In Alcamo J, editor. Environmental Futures: The practice of environmental scenario analysis. Elsevier; 2008. Ch. 3, p. 37–65.
Rotmans J, van Asselt M, Anastasi C, Greeuw S, Mellors J, Peters S, et al. Visions for a sustainable Europe. Futures. 2000;32(9-‐10):809–31.
Scanlon T. What We Owe to Each Other, Cambridge, MA: Harvard University Press; 1998.
Schwartz P. The Art of the Long View: Planning for the Future in an Uncertain World. New York: Doubleday; 1996.
Sen A. Choice, Welfare and Measurement. Oxford: Basil Blackwell; 1982.
Sen A. On Ethics and Economics, Oxford: Blackwell; 1987.
Sen A. The Idea of Justice. Cambridge, MA: The Belknap Press of Harvard University Press; 2009.
Seto KC, Reenberg A, Boone CG, Fragkias M, Haase D, Langanke T, Marcotullio P, Munroe DK, Olah B, Simon D. Urban land teleconnections and sustainability. PNAS 2012;109(20):7687–7692.
Shearer AW, Mouat DA, Bassett SD, Binford MW, Johnson CW, Saarinen JA. Examining development-‐related uncertainties for environmental management: Strategic planning scenarios in Southern California. Landsc. Urban Plan. 2006;77:359–81.
Sheate WR, Dagg S, Richardson J, Aschemann R, Palerm J, Steen U. Integrating the environment into strategic decision-‐making: conceptualizing policy SEA. European Environment 2003;13:1–18.
Sheate WR, Partidário MR, Byron H, Bina O, Dagg S. Sustainability assessment of future scenarios: methodology and application to mountain areas of Europe. Environ Manage 2008;41:282–99.

REFERENCES
169
Singh RK, Murty HT, Gupta SK, Dikshit AK. An overview of sustainability assessment methodologies. Ecological Indicators 2009;9:189–212.
Slootweg R, Jones M. Resilience thinking improves SEA: a discussion paper. Impact Assessment and Project Appraisal 2011;29(4):263-‐276.
Stato Italiano and Regione Basilicata. Memorandum di intesa Stato -‐ Regione Basilicata per la accelerazione dello sviluppo regionale attraverso politiche aggiuntive di sviluppo industriale, generatore di occupazione, di incremento della dotazione infrastrutturale, di investimenti in ricerca e innovazione, connesse alla ricerca e coltivazione delle fonti fossili in Basilicata. 2011. Available at: http://unmig.sviluppoeconomico.gov.it/unmig/norme/pdf/memorandum_intesa_basilicata_290411.pdf.
Steinberger JK, Krausmann, F. Material and Energy Productivity. Environmental Science & Technology 2010;45:1169-‐1176.
SVIMEZ. Rapporto Svimez 2012 sull’Economia del Mezzogiorno. Associazione per lo Sviluppo dell’Industria nel Mezzogiorno. Edizioni il Mulino; 2012.
Swart RJ, Raskin P, Robinson J. The problem of the future: sustainability science and scenario analysis. Sustainable Development 2004;14:137–46.
Tacconi L, Bennett J. Economic implications of intergenerational equity for biodiversity conservation Ecological Economics 1995;12:209-‐223.
Taylor RW. Urbanization, Local Government, and Planning for Sustainability. In Weinstein M, Taylor RE, editors. Sustainability Science: The Emerging Paradigm and the Urban Environment. New York: Springer; 2012. p. 293-‐313.
Teixeira IMV. O uso da Avaliação Ambiental Estratégica no planejamento da oferta de blocos de E&P de petróleo e gás natural: uma proposta. Doctoral Thesis Universidade Federal do Rio de Janeiro, COPPE; 2008.
The Bureau of Minerals and Petroleum of Greenland (prepared for). Eastern Baffin Bay -‐ A strategic environmental impact assessment of hydrocarbon activities. The Danish Centre for Environment and Energy and the Greenland Institute of Natural Resources (prepared by); 2011. Available at: http://www.dmu.au.dk.
The World Bank, 2010. Environmental Governance in Oil-‐Producing Developing Countries: Findings from a Survey of 32 Countries. Extractive Industries for Development Series #17. Available at: http://siteresources.worldbank.org/EXTOGMC/Resources/336929-‐1266963339030/eifd17_environmental_governance.pdf
Therivel R, Christian G, Craig C, Grinham R, Mackins D, Smith J, et al. Sustainability focused impact assessment: English experiences. Impact Assess Proj Apprais 2009;27(2):155–68.
Therivel R. Strategic Environmental Assessment in Action. Second Edition London: Earthscan; 2010.
TNEM (Tanzania National Environmental Management Council). Terms of reference (ToR) for Strategic Environmental & Social Impact Assessment (SESIA) for the oil & natural gas sub –sector. Through the Tanzania Energy Sector Capacity Assistance Project. (ESCAP). Funded by World Bank; 2012.
Turner RK. Environmnetal and ecological economics. In Bergh, J.CJ.M. van den, editor. Handbook of Environmental and Resource Economics. Edwars Elgar; 1999. p.1001–1033.
United Nations. Report of the United Nations Conference on Environment and Development. UNCED Report A/CONF.151/5/Rev.1 13; 1992.

REFERENCES
170
van der Heijden K. Scenarios: The Art of Strategic Conversation. New York: John Wiley and Sons; 1996.
van Notten PW, Rotmans J, van Asselt MB, Rothman DS. An updated scenario typology. Futures 2003;35(5):423–43.
Van’t Klooster SA, van Asselt MBA. Practicing the Scenario-‐Axes Technique. Futures 2006;38(1):15-‐30.
Vercelli A, Borghesi B. La sostenibilità dello sviluppo globale. Carocci editore; 2005.
Walker B, Holling CS, Carpenter SR, Kinzig A. Resilience, Adaptability and Transformability in Social – ecological Systems. Ecol. Soc. 2004;9(2): 5.
Walker B, Salt D. Resilience Thinking: Sustaining Ecosystems and People in a Changing World, London: Island Press; 2006.
Walker G. Environmental justice, impact assessment and the politics of knowledge: the implications of assessing the social distribution of environmental outcomes. Environ Impact Assess Rev 2010;30(5):312–8.
Walker GP. Environmental justice and the distributional deficit in policy appraisal in the UK. Environ Res Lett 2007;2:1–7.
WCED (World Commission on Environment and Development Our Common Future). Our common future. Oxford: Oxford University Press; 1987.
Wilkinson R. Societal Equality and Global Sustainability. International conference Planet under pressure, 26-‐29 March London. Available at: http://www.planetunderpressure2012.net.
Wood C, Djeddour M. Strategic Environmental Assessment: EA of policies, plans and programmes. Impact Assessment Bulletin 1992;10(1):3–22.
World Bank. World Development Report 2006. Equity and development. New york, USA: Oxford University Press; 2006. Available at: http://web.worldbank.org/.
York R, Rosa EA, Dietz T. Footprints on the Earth: the environmental consequences of modernity. Am Sociol Rev 2003;68(2):279–300.
Zhu Z, Bai H, Xu H, Zhu T. An inquiry into the potential of scenario analysis for dealing with uncertainty in strategic environmental assessment in China. Environ. Impact Assess. Rev. 2011;31(6):538–48.
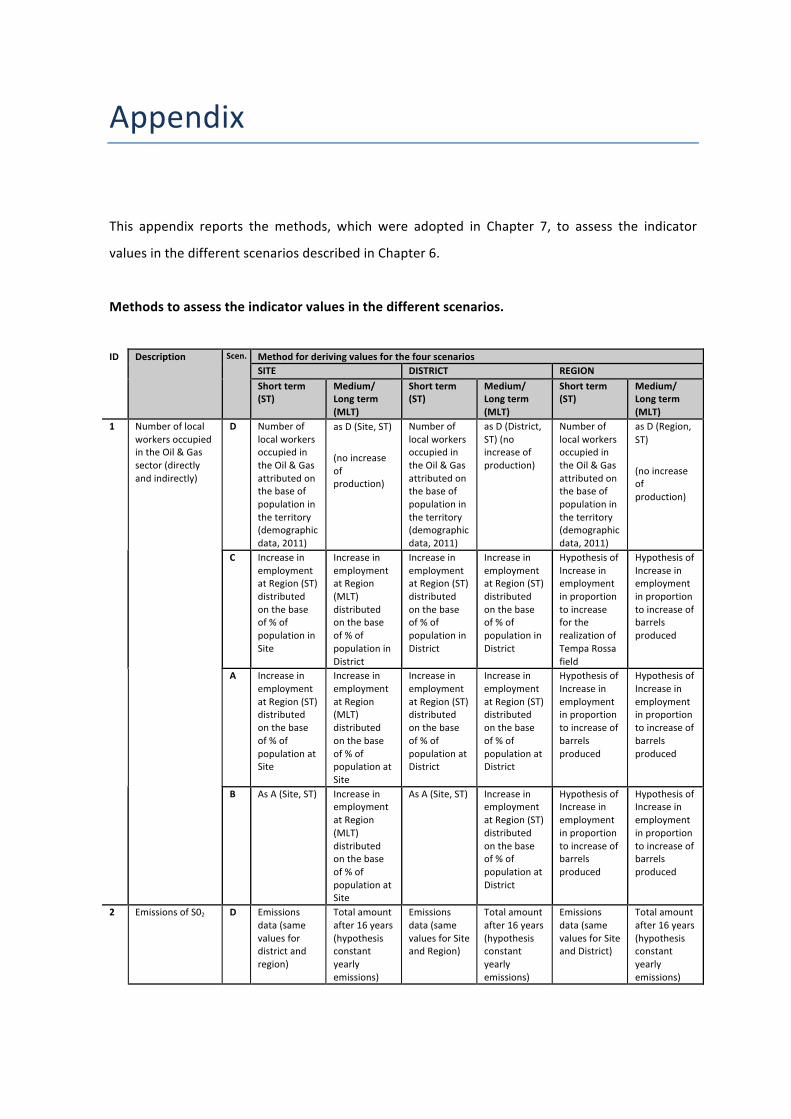
Appendix
This appendix reports the methods, which were adopted in Chapter 7, to assess the indicator
values in the different scenarios described in Chapter 6.
Methods to assess the indicator values in the different scenarios.
ID Description Scen. Method for deriving values for the four scenarios SITE DISTRICT REGION
Short term (ST)
Medium/ Long term (MLT)
Short term (ST)
Medium/ Long term (MLT)
Short term (ST)
Medium/ Long term (MLT)
1 Number of local workers occupied in the Oil & Gas sector (directly and indirectly)
D Number of local workers occupied in the Oil & Gas attributed on the base of population in the territory (demographic data, 2011)
as D (Site, ST)
(no increase of production)
Number of local workers occupied in the Oil & Gas attributed on the base of population in the territory (demographic data, 2011)
as D (District, ST) (no increase of production)
Number of local workers occupied in the Oil & Gas attributed on the base of population in the territory (demographic data, 2011)
as D (Region, ST)
(no increase of production)
C Increase in employment at Region (ST) distributed on the base of % of population in Site
Increase in employment at Region (MLT) distributed on the base of % of population in District
Increase in employment at Region (ST) distributed on the base of % of population in District
Increase in employment at Region (ST) distributed on the base of % of population in District
Hypothesis of Increase in employment in proportion to increase for the realization of Tempa Rossa field
Hypothesis of Increase in employment in proportion to increase of barrels produced
A Increase in employment at Region (ST) distributed on the base of % of population at Site
Increase in employment at Region (MLT) distributed on the base of % of population at Site
Increase in employment at Region (ST) distributed on the base of % of population at District
Increase in employment at Region (ST) distributed on the base of % of population at District
Hypothesis of Increase in employment in proportion to increase of barrels produced
Hypothesis of Increase in employment in proportion to increase of barrels produced
B As A (Site, ST) Increase in employment at Region (MLT) distributed on the base of % of population at Site
As A (Site, ST) Increase in employment at Region (ST) distributed on the base of % of population at District
Hypothesis of Increase in employment in proportion to increase of barrels produced
Hypothesis of Increase in employment in proportion to increase of barrels produced
2 Emissions of S02 D Emissions data (same values for district and region)
Total amount after 16 years (hypothesis constant yearly emissions)
Emissions data (same values for Site and Region)
Total amount after 16 years (hypothesis constant yearly emissions)
Emissions data (same values for Site and District)
Total amount after 16 years (hypothesis constant yearly emissions)

APPENDIX
172
ID Description Scen. Method for deriving values for the four scenarios SITE DISTRICT REGION Short term (ST)
Medium/ Long term (MLT)
Short term (ST)
Medium/ Long term (MLT)
Short term (ST)
Medium/ Long term (MLT)
C As D (ST) As D (MTL) Added increase in emissions due to Tempa rossa field calculated on the base of barrels produced
Added total amount of emissions after 11 years for Tempa Rossa (hypothesis constant yearly emissions)
As C (District, ST)
As C (District, MTL)
A Added increase in emissions due to VAD field calculated on the base of barrels produced
Added total amount of emissions for after 16 years for VAD field (hypothesis constant yearly emissions)
Added increase in emissions due to Tempa Rossa field calculated on the base of barrels produced
Added total amount of emissions after 11 years for Tempa Rossa (hypothesis constant yearly emissions)
As A (District, ST)
As A (District, MLT)
B As A (Site, ST)
As A (Site, MLT) plus total amount of emissions for 10 years due to further increase in production for VAD field (hypothesis constant yearly emissions)
As A (District, ST)
As A (District, MLT) plus total amount of emissions for due to further increase in production for 10 years (VAD field) and 5 years (Tempa Rossa field) (hypothesis of constant yearly emissions)
As B (District, ST)
As B (District, MLT)
3 Proportion of population aged 0 – 14
D High scenario projections (ISTAT dataset) (regional data disaggregated on the base of related projections of population in the territory)
High scenario projections (ISTAT dataset) (regional data disaggregated on the base of related projections of population in the territory)
High scenario projections (ISTAT dataset) (regional data disaggregated on the base of related projections of population in the territory)
High scenario projections (ISTAT dataset) (regional data disaggregated on the base of related projections of population in the territory)
High scenario projections (ISTAT dataset)
High scenario projections (ISTAT dataset)
C High scenario projections (ISTAT dataset) (regional data disaggregated on the base of related projections of population in the territory)
High scenario projections (ISTAT dataset) (regional data disaggregated on the base of related projections of population in the territory)
High scenario projections (ISTAT dataset) (regional data disaggregated on the base of related projections of population in the territory)
High scenario projections (ISTAT dataset) (regional data disaggregated on the base of related projections of population in the territory)
High scenario projections (ISTAT dataset)
High scenario projections (ISTAT dataset)
A Main scenario projections (ISTAT dataset) (regional data disaggregated
Main scenario projections (ISTAT dataset) (regional data disaggregated
Main scenario projections (ISTAT dataset) (regional data disaggregated
Main scenario projections (ISTAT dataset) (regional data disaggregated
Main scenario projections (ISTAT dataset)
Main scenario projections (ISTAT dataset)

METHODS TO ASSESS THE INDICATOR VALUES IN THE DIFFERENT SCENARIOS
173
ID Description Scen. Method for deriving values for the four scenarios SITE DISTRICT REGION Short term (ST)
Medium/ Long term (MLT)
Short term (ST)
Medium/ Long term (MLT)
Short term (ST)
Medium/ Long term (MLT)
on the base of related projections of population in the territory)
on the base of related projections of population in the territory)
on the base of related projections of population in the territory)
on the base of related projections of population in the territory)
B Low scenario projections (ISTAT, 2013) (regional data disaggregated on the base of related projections of population in the territory)
Low scenario projections (ISTAT, 2013 dataset) (regional data disaggregated on the base of related projections of population in the territory)
Low scenario projections (ISTAT, 2013) (regional data disaggregated on the base of related projections of population in the territory)
Low scenario projections (ISTAT, 2013) (regional data disaggregated on the base of related projections of population in the territory)
Low scenario projections (ISTAT, 2013)
Low scenario projections (ISTAT, 2013)
4 Consumption of water
D Consumption data (same values for district and region)
Total amount after 16 years (hypothesis constant yearly consumption)
Consumption data (same values for Site and Region)
Total amount after 16 years (hypothesis constant yearly consumption)
Consumption data (same values for Site and District)
Total amount after 16 years (hypothesis constant yearly consumption)
C As D (Site, ST) As D (Site, MTL)
Added increase in consumption due to Tempa Rossa field calculated on the base of barrels produced
Added total amount of consumption after 11 years for Tempa Rossa (hypothesis constant yearly consumption)
As C (District, ST)
As C (District, MTL)
A As D (Site, ST) + increase in consumption due to VAD field calculated on the base of barrels produced
As D (Site, MTL) +total amount of consumption for after 16 years for VAD field (hypothesis constant yearly consumption)
As D (District, ST) + increase in consumption due to Tempa Rossa field calculated on the base of barrels produced
As D (District, MTL) + total amount of consumption for 11 years for Tempa Rossa (hypothesis constant yearly consumption)
As A (District, ST)
As A (District, MLT)
B As A (Site, ST)
As A (Site, MLT) + total amount of emissions for 10 years due to further increase in production for VAD field (hypothesis constant yearly consumption)
As A (District, ST)
As A (District, MLT) + total amount of emissions due to further increase in production for 10 years (VAD field) and 5 years (Tempa Rossa field) (hypothesis of constant yearly consumption)
As B (District, ST)
As B (District, MLT)
5 Mtep provided/ Mtep Oil & Gas Italian needs
D Oil energy contribution data in Mtep (source: Mise, 2013)
Calculated on the base of barrels produced and projections of
Oil energy contribution data in Mtep (source: Mise, 2013)
Calculated on the base of barrels produced and projections of
Oil energy contribution data in Mtep (source Mise: 2013)
Calculated on the base of barrels produced and projections of

APPENDIX
174
ID Description Scen. Method for deriving values for the four scenarios SITE DISTRICT REGION Short term (ST)
Medium/ Long term (MLT)
Short term (ST)
Medium/ Long term (MLT)
Short term (ST)
Medium/ Long term (MLT)
(same values for District and Region)
Italian needs at 2030 (source: Mise, 2013) (same values for District and Region)
(same values for Site and Region)
Italian needs at 2030 (source: Mise, 2013) (same values for Site and Region)
(same values for Site and District)
Italian needs at 2030 (source: Mise, 2013) (same values for Site and District)
C As D (ST) As D (MTL) Added increase due to Tempa Rossa field calculated on the base of barrels produced
Added total amount of consumption for 11 years for Tempa Rossa (hypothesis constant yearly consumption)
As C (District, ST)
As C (District, MTL)
A Added increase in contribution due to VAD field calculated on the base of barrels produced
Added total contribution for 16 years (VAD field) (hypothesis constant yearly consumption)
Added increase in contribution due to Tempa Rossa field calculated on the base of barrels produced
Added total amount of contribution for 11 years (Tempa Rossa field) (hypothesis constant yearly consumption)
As A (District, ST)
As A (District, MLT)
B As A (Site, ST)
As A (Site, MLT) plus total contribution for 10 years due to further increase in production for VAD field (hypothesis constant yearly consumption)
As A (District, ST)
As A (District, MLT) plus total contribution due to further increase in production for 10 years (VAD field) and 5 years (Tempa Rossa field) (hypothesis of constant yearly consumption)
As B (District, ST)
As B (District, MLT)
6 Mtep provided/ Mtep Oil & Gas Italian needs
D Natural Gas energy contribution data in Mtep (source: Mise, 2013) (same values for district and region)
Calculated on the base of barrels produced and projections of Italian needs at 2030 (source:Mise, 2013) (same values for District and Region)
Natural Gas energy contribution data in Mtep (source Mise, 2013) (same values for site and region)
Calculated on the base of barrels produced and projections of Italian needs at 2030 (source: Mise, 2013) (same values for Site and Region)
Natural Gas energy contribution data in Mtep (source Mise: 2013) (same values for site and district)
Calculated on the base of barrels produced and projections of Italian needs at 2030 (source Mise: 2013) (same values for Site and District)
C As D (ST) As D (MTL) Added increase due to Tempa Rossa field calculated on the base of barrels produced
Added total amount of Mtep after 11 years for Tempa Rossa (hypothesis constant yearly
As C (District, ST)
As C (District, MTL)
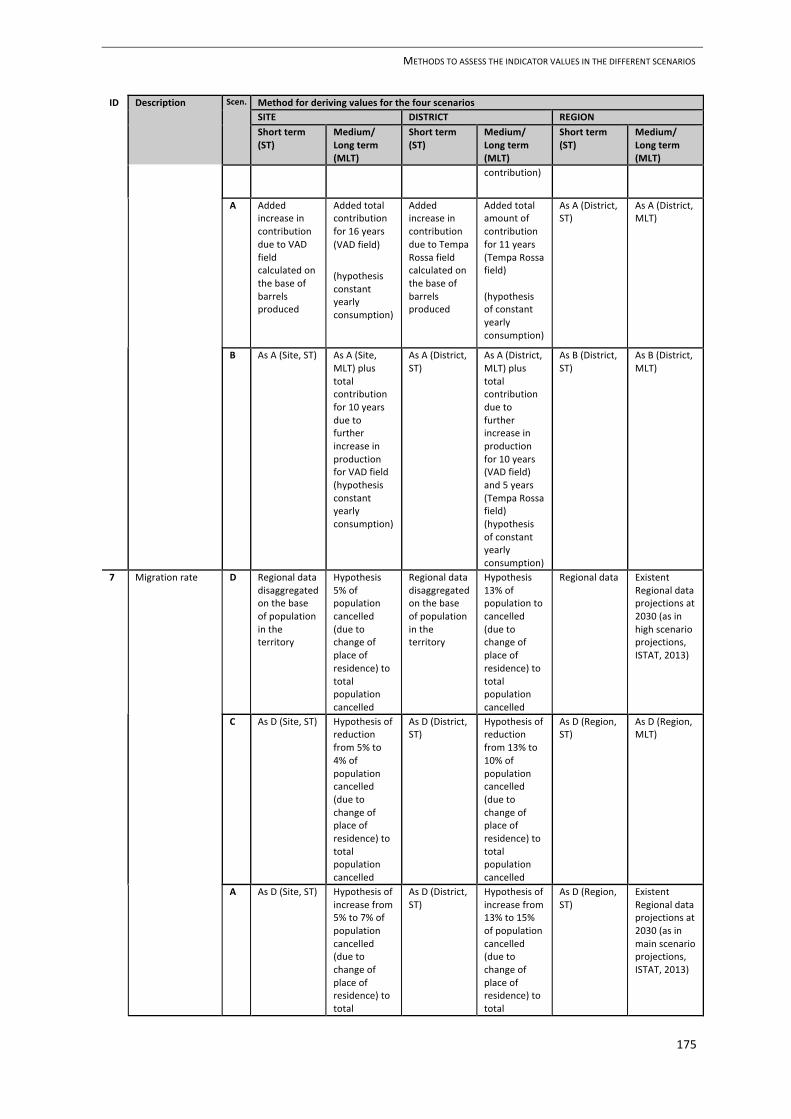
METHODS TO ASSESS THE INDICATOR VALUES IN THE DIFFERENT SCENARIOS
175
ID Description Scen. Method for deriving values for the four scenarios SITE DISTRICT REGION Short term (ST)
Medium/ Long term (MLT)
Short term (ST)
Medium/ Long term (MLT)
Short term (ST)
Medium/ Long term (MLT)
contribution)
A Added increase in contribution due to VAD field calculated on the base of barrels produced
Added total contribution for 16 years (VAD field)
(hypothesis constant yearly consumption)
Added increase in contribution due to Tempa Rossa field calculated on the base of barrels produced
Added total amount of contribution for 11 years (Tempa Rossa field) (hypothesis of constant yearly consumption)
As A (District, ST)
As A (District, MLT)
B As A (Site, ST)
As A (Site, MLT) plus total contribution for 10 years due to further increase in production for VAD field (hypothesis constant yearly consumption)
As A (District, ST)
As A (District, MLT) plus total contribution due to further increase in production for 10 years (VAD field) and 5 years (Tempa Rossa field) (hypothesis of constant yearly consumption)
As B (District, ST)
As B (District, MLT)
7 Migration rate D Regional data disaggregated on the base of population in the territory
Hypothesis 5% of population cancelled (due to change of place of residence) to total population cancelled
Regional data disaggregated on the base of population in the territory
Hypothesis 13% of population to cancelled (due to change of place of residence) to total population cancelled
Regional data Existent Regional data projections at 2030 (as in high scenario projections, ISTAT, 2013)
C As D (Site, ST)
Hypothesis of reduction from 5% to 4% of population cancelled (due to change of place of residence) to total population cancelled
As D (District, ST)
Hypothesis of reduction from 13% to 10% of population cancelled (due to change of place of residence) to total population cancelled
As D (Region, ST)
As D (Region, MLT)
A As D (Site, ST)
Hypothesis of increase from 5% to 7% of population cancelled (due to change of place of residence) to total
As D (District, ST)
Hypothesis of increase from 13% to 15% of population cancelled (due to change of place of residence) to total
As D (Region, ST)
Existent Regional data projections at 2030 (as in main scenario projections, ISTAT, 2013)

APPENDIX
176
ID Description Scen. Method for deriving values for the four scenarios SITE DISTRICT REGION Short term (ST)
Medium/ Long term (MLT)
Short term (ST)
Medium/ Long term (MLT)
Short term (ST)
Medium/ Long term (MLT)
population cancelled
population cancelled
B As D (Site, ST)
Hypothesis of increase from 5% to 10% of population cancelled (due to change of place of residence) to total population cancelled
As D (District, ST)
Hypothesis of increase from 13% to 20% of population cancelled (due to change of place of residence) to total population cancelled
As D (Region, ST)
Existent Regional data projections at 2030 (as in low scenario projections, ISTAT, 2013)
8 Revenue from Oil & Gas development
D Existent data of Site revenues and % of Regional revenues on the base of population in the territory (source: Mise, 2013)
Total amount Site revenues % of Regional revenues for 16 years (hypothesis of constant value per year)
As D (Site, ST) As D (Site, MLT)
Site and Regional revenues (source: Mise, 2013)
Total amount of Site and Regional revenues for 16 years (hypothesis of constant value per year)
C As D (Site, ST)
As D (Site, MLT)
As D (Site, ST) + increase according to barrel production for Tempa Rossa field + % of Regional revenues on the base of population in the territory
As D (Site, MLT) + increase according to barrel production for 11 years (Tempa Rossa field) + added % of Regional revenues on the base of population in the territory
(hypothesis of constant value per year)
As D (Region, ST) + increase according to barrel production (VAD and Tempa Rossa fields) (hypothesis of constant value per year)
As D (Region, MLT) + increase of regional revenues according to barrel production (for 16 years VAD and 11 years Tempa Rossa fields)
(hypothesis of constant value per year) added
A As D (Site, ST) + increase according to barrel production + % of Regional revenues on the base of population in the territory (hypothesis of constant value per year)
As D (Site, MLT) + increase according to barrel production for 16 years + % of Regional revenues on the base of population in the territory (hypothesis of constant value per year
As D (Site, ST) + increase according to barrel production (VAD and Tempa Rossa fields) + % of Regional revenues on the base of population in the territory (hypothesis of constant value per year)
As D (Site, MLT) + increase according to barrel production (for 16 years VAD and 11 years Tempa Rossa fields) + % of Regional revenues on the base of population in the territory (hypothesis of constant value per year)
As D (Region, ST) + increase according to barrel production (VAD and Tempa Rossa fields) (hypothesis of constant value per year)
As D (Region, MLT) + increase of regional revenues according to barrel production (for 16 years VAD and 11 years Tempa Rossa fields) (hypothesis of constant value per year) added
B As A (Site, ST) + increase
As A (Site, MLT) +
As A (Site, ST) + increase
As A (Site, MLT) +
As A (Region, ST) + increase
As A (Region, MLT) +

METHODS TO ASSESS THE INDICATOR VALUES IN THE DIFFERENT SCENARIOS
177
ID Description Scen. Method for deriving values for the four scenarios SITE DISTRICT REGION Short term (ST)
Medium/ Long term (MLT)
Short term (ST)
Medium/ Long term (MLT)
Short term (ST)
Medium/ Long term (MLT)
according to barrel production + % of Regional revenues on the base of population in the territory (hypothesis of constant value per year)
increase according to barrel production for 16 years + % of Regional revenues on the base of population in the territory (hypothesis of constant value per year)
according to barrel production (VAD and Tempa Rossa fields) + % of Regional revenues on the base of population in the territory (hypothesis of constant value per year)
increase according to barrel production (for 16 years VAD and 11 years Tempa Rossa fields) + % of Regional revenues on the base of population in the territory (hypothesis of constant value per year)
according to barrel production (VAD and Tempa Rossa fields) (hypothesis of constant value per year)
increase of regional revenues according to barrel production (for 16 years VAD and 11 years Tempa Rossa fields) (hypothesis of constant value per year) added
9 Hydrocarbon bonus benefit
D Existent data (source: Mise, 2013)
Total amount for 16 years (hypothesis of constant value per year)
Existent data (source: Mise, 2013)
Total amount for 16 years (hypothesis of constant value per year)
Existent data (source: Mise, 2013)
Total amount for 16 years (hypothesis of constant value per year)
C % of Regional revenues on the base of population in the territory (hypothesis of constant value per year)
% of Regional revenues on the base of population in the territory (hypothesis of constant value per year)
% of Regional revenues on the base of population in the territory (hypothesis of constant value per year)
% of Regional revenues on the base of population in the territory (hypothesis of constant value per year)
As D (Region, ST) + increase in regional revenues according to barrel production (VAD and Tempa Rossa fields) (hypothesis of constant value per year)
As D (Region, MLT) + in regional revenues according to barrel production (for 16 years VAD and 11 years Tempa Rossa fields) (hypothesis of constant value per year) added
A % of regional revenues on the base of population in the territory (hypothesis of constant value per year)
% of regional revenues on the base of population in the territory (hypothesis of constant value per year)
% of regional revenues on the base of population in the territory (hypothesis of constant value per year)
% of regional revenues on the base of population in the territory (hypothesis of constant value per year)
As C (Region, ST) + increase in regional revenues according to barrel production (VAD and Tempa Rossa fields) (hypothesis of constant value per year)
As C (Region, MLT) + increase in regional revenues according to barrel production (for 16 years VAD and 11 years Tempa Rossa fields) (hypothesis of constant value per year) added
B % of Regional revenues on the base of population in the territory (hypothesis of constant value per year)
% of Regional revenues on the base of population in the territory (hypothesis of constant value per year)
% of Regional revenues on the base of population in the territory (hypothesis of constant value per year)
% of Regional revenues on the base of population in the territory (hypothesis of constant value per year)
As A (Region, ST) + further increase in regional revenues according to barrel production (VAD and Tempa Rossa
As A (Region, MLT) + further increase in regional revenues according to barrel production (for 10 years

APPENDIX
178
ID Description Scen. Method for deriving values for the four scenarios SITE DISTRICT REGION Short term (ST)
Medium/ Long term (MLT)
Short term (ST)
Medium/ Long term (MLT)
Short term (ST)
Medium/ Long term (MLT)
fields) (hypothesis of constant value per year)
VAD and 5 years Tempa Rossa fields) (hypothesis of constant value per year) added
10 Number of schools within 5 km from areas interested by developmental activities/ total number within the territory
D Buffer around VAD field; Existent data for schools
Buffer around VAD field; Number of schools as D (Site, ST)
Buffer around VAD field; Existent data for schools
Buffer around VAD field; Number of schools as D (District, ST)
Buffer around VAD field; Existent data for schools
Buffer around VAD field; Number of schools as D (Region, ST)
C As D (Site, ST) As D (Site, MLT)
Buffer around VAD and Tempa Rossa fields (41+6)
Buffer around VAD and Tempa Rossa fields (41+6 wells)
Buffer around VAD and Tempa Rossa fields (41+ 6 wells)
Buffer around VAD and Tempa Rossa fields (41+6 wells)
A As D (Site, ST) No new wells but more production
No new wells but more production
No new wells but more production
No new wells but more production
No new wells but more production
B Increase of buffer for presence new wells (hypothesis 9 VAD field)
Increase of buffer for presence new wells (hypothesis 9 VAD field)
Increase of buffer for presence new wells (hypothesis 9 VAD + 15 Tempa Rossa fields)
Increase of buffer for presence new wells (hypothesis 9 VAD + 15 Tempa Rossa fields)
Increase of buffer for presence new wells (hypothesis 9 VAD + 15 Tempa Rossa fields)
Increase of buffer for presence new wells (hypothesis 9 VAD + 15 Tempa Rossa fields)
11 Number municipalities protesting / total municipalities
D Existent information Hypothesis 60% (6/10)
0 (due to the progressive dismission)
Existent information Hypothesis 57% (20/35)
0 (due to the progressive dismission)
Existent information Hypothesis 35% (46/131)
0 (due to the progressive dismission)
C As D (Site, short term)
As D (Site, short term)
Hypothesis 49% (17/35)
0 (due to the progressive dismission)
Hypothesis 33% (43/131)
0 (due to the progressive dismission)
A As D (Site,
short term)
As D (Site, short term)
Hypothesis 49% (17/35)
Hypothesis 31% (11/35) (due to agreements with local population in Upper VAD)
As C (Region, ST)
27% (35/131) (due to agreements with local population in Upper VAD)
B Hypothesis 60% (6/10)
Hypothesis 60% (6/10)
Hypothesis 49% (17/35)
Hypothesis 49% (17/35)
Hypothesis 33% (43/131)
Hypothesis 33% (43/131)
12 Value Added (Meuro) / yearly total crude Oil & Gas production (kBoe)
D Existent data for VA and productions (Oil & gas production same values for District and Region)
2% VA increase
Existent data for VA and productions (Oil & gas production same values for Site and Region)
2% VA increase
Existent data for VA and productions (Oil & gas production same values for Site and District)
2% VA increase
C Hypothesis increase in VA (%): agriculture 0,5; industry 0,5; constructions 1,0; services
Hypothesis increase in VA (%): agriculture 5; industry 8; constructions 10; services 4
Hypothesis increase in VA (%): agriculture 0,5; industry 0,5; constructions 1,0; services
Hypothesis increase in VA (%): agriculture 5; industry 8; constructions 10; services 4
Hypothesis increase in VA (%) as rest of Basilicata: agriculture 0,8; industry 0,5; constructions
Hypothesis increase in VA (%) as rest of Basilicata: agriculture 10; industry 5; constructions

METHODS TO ASSESS THE INDICATOR VALUES IN THE DIFFERENT SCENARIOS
179
ID Description Scen. Method for deriving values for the four scenarios SITE DISTRICT REGION Short term (ST)
Medium/ Long term (MLT)
Short term (ST)
Medium/ Long term (MLT)
Short term (ST)
Medium/ Long term (MLT)
0,5 0,5 1,0; services 0,7
10; services 4
A Hypothesis increase in VA (%): agriculture 0,3; industry 0,3; constructions 1,0; services 0,3
Hypothesis increase in VA (%): agriculture 4; industry 15; constructions 8; services 4
Hypothesis increase in VA (%): agriculture 0,3; industry 0,3; constructions 1,0; services 0,3
Hypothesis increase in VA (%): agriculture 4; industry 15; constructions 8; services 4
Hypothesis increase in VA (%) as rest of Basilicata: agriculture 0,7; industry 0,5; constructions 1,0; services 0,3
Hypothesis increase in VA (%) as rest of Basilicata: agriculture 10; industry 10; constructions 8; services 4
B As A (Site, ST) Hypothesis increase in VA (%): agriculture 2, industry 15, constructions 8, services 2
As A (District, ST)
Hypothesis increase in VA (%): agriculture 2, industry 15, constructions 8, services 2
As A (Region, ST)
Hypothesis increase in VA (%) as rest of Basilicata: agriculture 7, industry 12, constructions 8, services 4
13 km/km2 of roads and trails
D Sum of linear road and trails extension to a buffer of 3000 km (referred to the existent VAD field)
As D (Site, ST) As D (Site, ST) As D (Site, ST) As D (Site, ST) As D (District, ST)
C As D (Site, ST) As D (Site, ST) As D (Site, ST) Sum of linear road and trails extension to a buffer of 3000 km (referred to VAD and Tempa Rossa fields)
As D (Site, ST) As C (District, MLT)
A As C (Site, ST) As C (Site, MLT)
As C (District, ST)
As C (District, MLT)
As C (District, ST)
As C (District, MLT)
B As A (Site, ST) Sum of linear road and trails extension to a buffer of 3000 km (referred to increase due to new wells -‐ VAD rossa field)
As A (District, ST)
Sum of linear road and trails extension to a buffer of 3000 km (referred to increase due to new wells -‐ VAD and Tempa rossa fields)
As A (District, ST)
Sum of linear road and trails extension to a buffer of 3000 km (referred to increase due to new wells -‐ VAD and Tempa rossa fields)
14 Amount of water re-‐injected after Oil & Gas upstream treatment
D Existent data (source: ENI, 2012; 2013) (same values for District and Region)
Calculated on the base of barrels produced (same values for District and Region)
Existent data (source: ENI, 2012; 2013) (same values for District and Region)
Calculated on the base of barrels produced (same values for Site and Region)
Existent data (source: ENI, 2012; 2013) (same values for District and Region)
Calculated on the base of barrels produced (same values for Site and District)

APPENDIX
180
ID Description Scen. Method for deriving values for the four scenarios SITE DISTRICT REGION Short term (ST)
Medium/ Long term (MLT)
Short term (ST)
Medium/ Long term (MLT)
Short term (ST)
Medium/ Long term (MLT)
C As D (ST) As D (MTL) Added increase due to Tempa Rossa field calculated on the base of barrels produced
Added total amount for 11 years for Tempa Rossa (hypothesis constant yearly re-‐injection)
As C (District, ST)
As C (District, MTL)
A Added increase in contribution due to VAD field calculated on the base of barrels produced
Added total contribution for 16 years (VAD field) (hypothesis constant yearly re-‐injection)
Added increase in contribution due to Tempa Rossa field calculated on the base of barrels produced
Added total amount of contribution for 11 years (Tempa Rossa field) (hypothesis of constant yearly re-‐injection)
As A (District, ST)
As A (District, MLT)
B As A (Site, ST)
As A (Site, MLT) + total contribution for 10 years due to further increase in production for VAD field (hypothesis constant yearly re-‐injection)
As A (District, ST)
As A (District, MLT) + total contribution due to further increase in production for 10 years (VAD field) and 5 years (Tempa Rossa field) (hypothesis of constant yearly re-‐injection)
As B (District, ST)
As B (District, MLT)
15 Protected area in a buffer of 3000 m from oil & gas field/ territory
D Existent data
As D (Site, ST) Existent data
As D (District, ST)
Existent data
As D (Region, ST)
C As D (Site, ST) As D (Site, ST) As D (District, ST)
Added Tempa Rossa field
As D (Region, ST)
Added Tempa Rossa field
A As C (Site, ST) As C (Site, MLT)
According to buffer extension for increase in wells
According to buffer extension for increase in wells
According to buffer extension for increase in wells
According to buffer extension for increase in wells
B As C (Site, ST) According to buffer extension for increase in wells
According to buffer extension for increase in wells
According to buffer extension for increase in wells
According to buffer extension for increase in wells
According to buffer extension for increase in wells
16 Protected area in a buffer of 3000m from oil & gas field / protected area in territory
D Existent data
As D (Site, ST) Existent data
As D (District, ST)
Existent data
As D (Region, ST)
C As D (Site, ST) As D (Site, ST) As D (District, ST)
Added Tempa Rossa field
As D (Region, ST)
Added Tempa Rossa field
A As C (Site, ST) As C (Site, MLT)
According to buffer extension for increase in wells
According to buffer extension for increase in wells
According to buffer extension for increase in wells
According to buffer extension for increase in wells
B As C (Site, ST) According to buffer extension for
According to buffer extension for
According to buffer extension for
According to buffer extension for
According to buffer extension for

METHODS TO ASSESS THE INDICATOR VALUES IN THE DIFFERENT SCENARIOS
181
ID Description Scen. Method for deriving values for the four scenarios SITE DISTRICT REGION Short term (ST)
Medium/ Long term (MLT)
Short term (ST)
Medium/ Long term (MLT)
Short term (ST)
Medium/ Long term (MLT)
increase in wells
increase in wells
increase in wells
increase in wells
increase in wells
17 Land managed with organic method/territory
D Existent data Hypothesis of 20% increase
Existent data
Hypothesis of 20% increase
Existent data
Hypothesis of 20% increase
C Existent data Hypothesis of 10% increase
Existent data Hypothesis of 10% increase
Existent data Hypothesis of 25% increase
A Existent data Hypothesis of 30% increase
Existent data Hypothesis of 30% increase
Existent data Hypothesis of 15% increase
B Existent data Hypothesis of 60% decrease
Existent data Hypothesis of 60% decrease
Existent data Hypothesis of 15% decrease
18 Land area affected by Oil & Gas activities/territory – percentage
D Existent data
As D (Site, ST) Existent data As D (District, ST)
Existent data As D (Region, ST)
C As D (Site, ST) As D (Site, MLT)
According to new wells and more production
According to new wells and more production
According to new wells and more production
According to new wells and more production
A As C (Site, ST)
As C (Site, MLT) no new wells but more production
As C (District, ST)
As C (District, MLT) no new wells but more production
As C (Region, ST)
As C (Region, MLT)
B As A (Site, ST)
According to new wells and more production
As C (District, ST)
According to new wells and more production
As C (District, ST)
According to new wells and more production
19 Number of actions
D Qualitative assessment (existent information about regional policies for enhancing agriculture and tourism -‐values as for District and Region)
As D (Site, ST) Qualitative assessment (existent information about regional policies for enhancing agriculture and tourism -‐values as for Site and Region)
As D (District, ST)
Qualitative assessment (existent information about regional policies for enhancing agriculture and tourism -‐values as for Site and District)
As D (Region, ST)
C -‐ Subscription of agreement for promoting local occupation Strict consultation among decisional levels
-‐ Subscription of agreement for promoting local occupation Strict consultation among decisional levels
-‐ Subscription of agreement for promoting local occupation Strict consultation among decisional levels
A Subscription of a memorandum agreement “ Local content” for promoting activities in the Oil & Gas sector chain ensuring local occupation
As A (Site, ST) Subscription of a memorandum agreement “ Local content” for promoting activities in the Oil & Gas sector chain ensuring local occupation
As A (District, ST)
Subscription of a memorandum agreement “ Local content” for promoting activities in the Oil & Gas sector chain ensuring local occupation
As A (Region, ST)
B As A (Site, ST) As A (Site, MLT)
As A (District, ST)
As A (District, MLT)
As A (Region, ST)
As A (Region, MLT)

APPENDIX
182
ID Description Scen. Method for deriving values for the four scenarios SITE DISTRICT REGION Short term (ST)
Medium/ Long term (MLT)
Short term (ST)
Medium/ Long term (MLT)
Short term (ST)
Medium/ Long term (MLT)
20 Value Added / expenses in R&D (VA as in ID 12 for analogous scenarios)
D Existent data (expenses in R&D derived by distribution of the regional expenses for inhabitants)
Hypothesis of 20% increase for expenses in R&D
Existent data (expenses in R&D derived by distribution of the regional expenses for inhabitants)
Hypothesis of 20% increase for expenses in R&D
Existent data (expenses in R&D derived by distribution of the regional expenses for inhabitants)
Hypothesis of 20% increase for expenses in R&D + 2% increase in VA
C Expenses in R&D derived by distribution of the regional expenses for inhabitants as C (Region, ST)
Expenses in R&D derived by distribution of the regional expenses for inhabitants as C (Region, MLT)
Expenses in R&D derived by distribution of the regional expenses for inhabitants as A (Region, ST)
Expenses in R&D derived by distribution of the regional expenses for inhabitants as A (Region, MLT)
As D (Region, ST)
Hypothesis of 20% increase for expenses in R&D
A Expenses in R&D derived by distribution of the regional expenses for inhabitants as A (Region, ST)
Expenses in R&D derived by distribution of the regional expenses for inhabitants as A (Region, MLT)
Expenses in R&D derived by distribution of the regional expenses for inhabitants as A (Region, ST)
Expenses in R&D derived by distribution of the regional expenses for inhabitants as A (Region, MLT)
As D (Region, ST)
Hypothesis of 5% increase for expenses in R&D
B Expenses in R&D derived by distribution of the regional expenses for inhabitants as B (Region, ST)
Expenses in R&D derived by distribution of the regional expenses for inhabitants as B (Region, MLT)
Expenses in R&D derived by distribution of the regional expenses for inhabitants as B (Region, ST)
Expenses in R&D derived by distribution of the regional expenses for inhabitants as B (Region, MLT)
As D (Region, ST)
Hypothesis of 10% increase for expenses in R&D
21 Financial contribution
D Company contribution for local development (for activities, events, agreements, territory promotions) (Average on four year (2009-‐2012)
Total amount for 16 years
-‐ -‐ -‐ -‐
C Forfeit contribution (VAD field)
Financial contribution to Region calculated on the base of population in the territory (Tempa Rossa field) (hypothesis
Total amount for 16 years (VAD field)
Financial contribution to Region calculated on the base of population in the territory (Tempa Rossa field) + Forfeit contribution (VAD field) (hypothesis of constant
Total amount for 16 years VAD and 11 Tempa Rossa fields
Company contribution according to production (50 cent/barrel)
Total amount Company contribution according to production (50 cent/barrel)
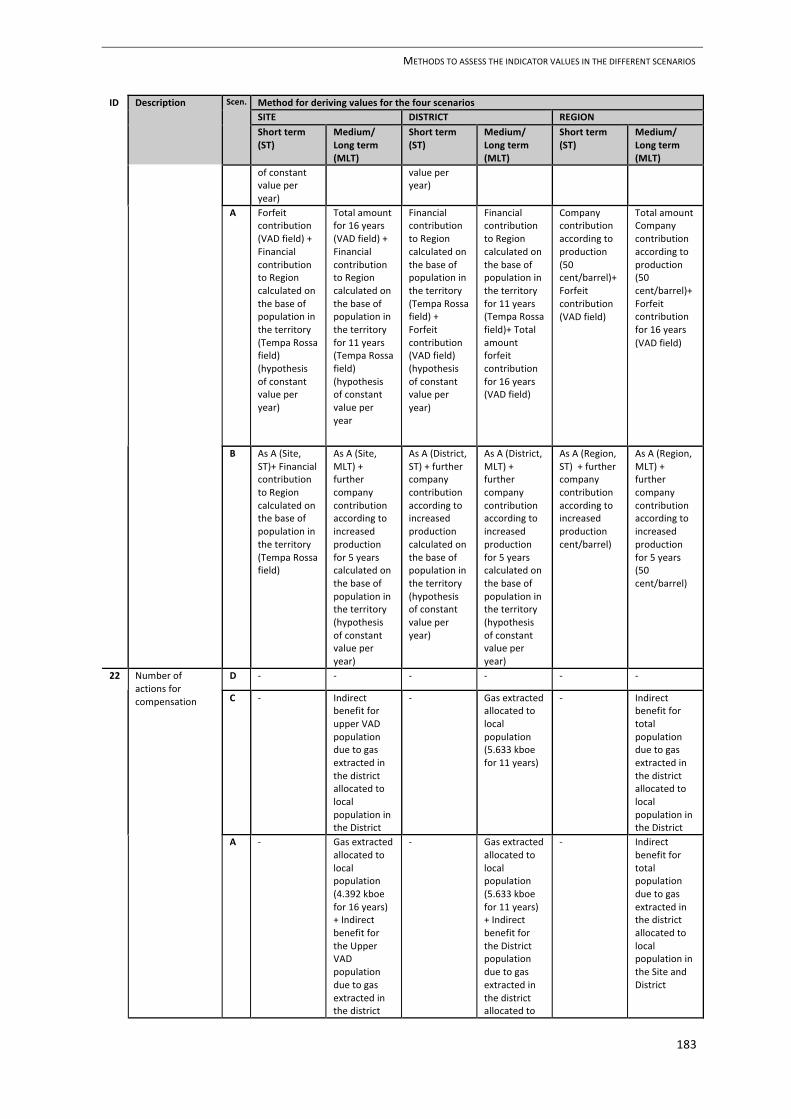
METHODS TO ASSESS THE INDICATOR VALUES IN THE DIFFERENT SCENARIOS
183
ID Description Scen. Method for deriving values for the four scenarios SITE DISTRICT REGION Short term (ST)
Medium/ Long term (MLT)
Short term (ST)
Medium/ Long term (MLT)
Short term (ST)
Medium/ Long term (MLT)
of constant value per year)
value per year)
A Forfeit contribution (VAD field) + Financial contribution to Region calculated on the base of population in the territory (Tempa Rossa field) (hypothesis of constant value per year)
Total amount for 16 years (VAD field) + Financial contribution to Region calculated on the base of population in the territory for 11 years (Tempa Rossa field) (hypothesis of constant value per year
Financial contribution to Region calculated on the base of population in the territory (Tempa Rossa field) + Forfeit contribution (VAD field) (hypothesis of constant value per year)
Financial contribution to Region calculated on the base of population in the territory for 11 years (Tempa Rossa field)+ Total amount forfeit contribution for 16 years (VAD field)
Company contribution according to production (50 cent/barrel)+ Forfeit contribution (VAD field)
Total amount Company contribution according to production (50 cent/barrel)+ Forfeit contribution for 16 years (VAD field)
B As A (Site, ST)+ Financial contribution to Region calculated on the base of population in the territory (Tempa Rossa field)
As A (Site, MLT) + further company contribution according to increased production for 5 years calculated on the base of population in the territory (hypothesis of constant value per year)
As A (District, ST) + further company contribution according to increased production calculated on the base of population in the territory (hypothesis of constant value per year)
As A (District, MLT) + further company contribution according to increased production for 5 years calculated on the base of population in the territory (hypothesis of constant value per year)
As A (Region, ST) + further company contribution according to increased production cent/barrel)
As A (Region, MLT) + further company contribution according to increased production for 5 years (50 cent/barrel)
22 Number of actions for compensation
D -‐ -‐ -‐ -‐ -‐ -‐
C -‐ Indirect benefit for upper VAD population due to gas extracted in the district allocated to local population in the District
-‐ Gas extracted allocated to local population (5.633 kboe for 11 years)
-‐ Indirect benefit for total population due to gas extracted in the district allocated to local population in the District
A -‐ Gas extracted allocated to local population (4.392 kboe for 16 years) + Indirect benefit for the Upper VAD population due to gas extracted in the district
-‐ Gas extracted allocated to local population (5.633 kboe for 11 years) + Indirect benefit for the District population due to gas extracted in the district allocated to
-‐ Indirect benefit for total population due to gas extracted in the district allocated to local population in the Site and District

APPENDIX
184
ID Description Scen. Method for deriving values for the four scenarios SITE DISTRICT REGION Short term (ST)
Medium/ Long term (MLT)
Short term (ST)
Medium/ Long term (MLT)
Short term (ST)
Medium/ Long term (MLT)
allocated to local population in the District
local population in the Upper VAD
B -‐ Gas extracted allocated to local population (5.078 kboe for 16+10 years) + Indirect benefit for the Upper VAD population due to gas extracted in the district allocated to local population in the District
-‐ Gas extracted allocated to local population (8.194 kboe for 11+5 years) + Indirect benefit for the District population due to gas extracted in the district allocated to local population in the upper VAD
-‐ Indirect benefit for total population due to gas extracted in the district allocated to local population in the Site and District
23 Number of actions
D Existence of regional observatory for monitoring and information management
As D (Site, ST) As D (Site, ST) As D (Site, ST) As D (Site, ST) As D (Site, ST)
C As D (Site, ST) + Companies contribution to transparency (annual reports for local population)
As D (Site, ST) + Companies contribution to transparency (annual reports for local population)
As D (Site, ST) + Companies contribution to transparency (annual reports for local population)
As D (Site, ST) + Companies contribution to transparency (annual reports for local population)
As D (Site, ST) + Companies contribution to transparency (annual reports for local population)
As D (Site, ST) + Companies contribution to transparency (annual reports for local population)
A As D (Site, ST) As D (Site, ST) As D (Site, ST) + Participation of local workers to baseline monitoring (Tempa Rossa field)
As D (Site, ST) As D (Site, ST) + Participation of local workers to baseline monitoring (Tempa Rossa field)
As D (Site, ST)
B As D (Site, ST) As D (Site, ST) As D (Site, ST) As D (Site, ST) As D (Site, ST) As D (Site, ST)
Key to abbreviations:
MLT = Medium/Long Term; R&D = Research and Development; Scen. = Scenario; ST = Short Term; VA = Value Added; VAD = Val d’Agri.