adequacy of sample size in population surveys
TRANSCRIPT
Adequacy of Sample Size in Population Surveys
Dr. P. Balasubramanian, Ph.D.
Founder & CEO, Theme Work Analytics, Bangalore & West Lafayette, IN, USA
Pleaseobtainpriorpermissionforreuse.Feelfreetodownloadforselfstudy.
Oct2016
! Adequacydefined! RelevantPopulaCon! PopulaConcharacterisCcs! Focusofthesurveyanditsrelevancetosampling! Unbiasedsampling?! PopulaConsizevssamplesize;revelaCons! Formulaforsamplesize! Aprioridataneeded:populaConsizeandits
characterisCcs! SubgroupsandstraCfiedsampling! Whydopollstersgowrong! QuesConnaireDesign! ClinicalTrialsissues! Smallsamplestudies
Adequacy of Sample Size in Population Surveys

! Engineersneedtofigureoutthebestfeaturestobeprovidedinmanydevicessuchasmobilephones,laptops,automobiles,washingmachinesetc..
! ManagersofmanyfirmstryhardtodeterminetheresponseofcustomerstonewproductintroducCons.
! PharmacompaniesareconducCngclinicaltrialseversooSenbeforelaunchingnewdrugsinthemarketplace.
! PollstersandPsephologistsusesurveysalltheCmetopredictwhatissuesdominatevoters’mindsandwhoislikelytowininanelecCon.
There are many common characteristics
amongst these diverse requirements.
Population Studies are needed everywhere
! Thestudyhastobeconductedandconcludedquickly.(Thereasonable-meframebeingafewdaystofewmonths.)! ItisnotpossibletopolltheenCrepopulaConanddoanexhausCvestudysincethatwouldcallforextended
Cmeperiodsandalsoprovetobeveryexpensive.! Henceweresorttosamplestudies.(meaningasmallpercentageofthepopula-onispolled)! Resultsaretabulatedoranalyzed.! TheunderlyingbeliefhereisthatthesamplestudyfindingsandconclusionsareequallyvalidandapplicabletotheenCrepopulaCon.
Hence Sample Studies can turn out to be cost effective and be conducted in reasonable time ``periods.
Need for Sample Studies
! TherearetwootherfundamentalrequirementsinSampleStudies:that
! (1)thesamplechosenshouldtrulyreflectthe characterisCcsofthepopulaCon
! (2)thesamplesizeshouldbesufficienttodraw conclusionstrulyrepresentaCveofthe populaCon.
Hence adequacy of sample is defined based on these two requirements.
Sample Vs Population

! ThestudypopulaConcontainseveryunitormembertowhich(whom)wewishtoapplytheconclusionarisingfromthesamplestudy.
! Forexample,inanelecConforofficebearersinahousingsociety,everyonewiththevoCngrightisrelevantpopulaCon.Itisimmaterialhe/sheisaciCzenofthatcountryorregion.
! SimilarlyinageneralelecCon,everyciCzen,irrespecCveofwherehe/shelives(insideoroutsidethecountry)consCtutestherelevantpopulaCon.
The concept of relevant population
Incorrectly identified population will result in invalid conclusions .
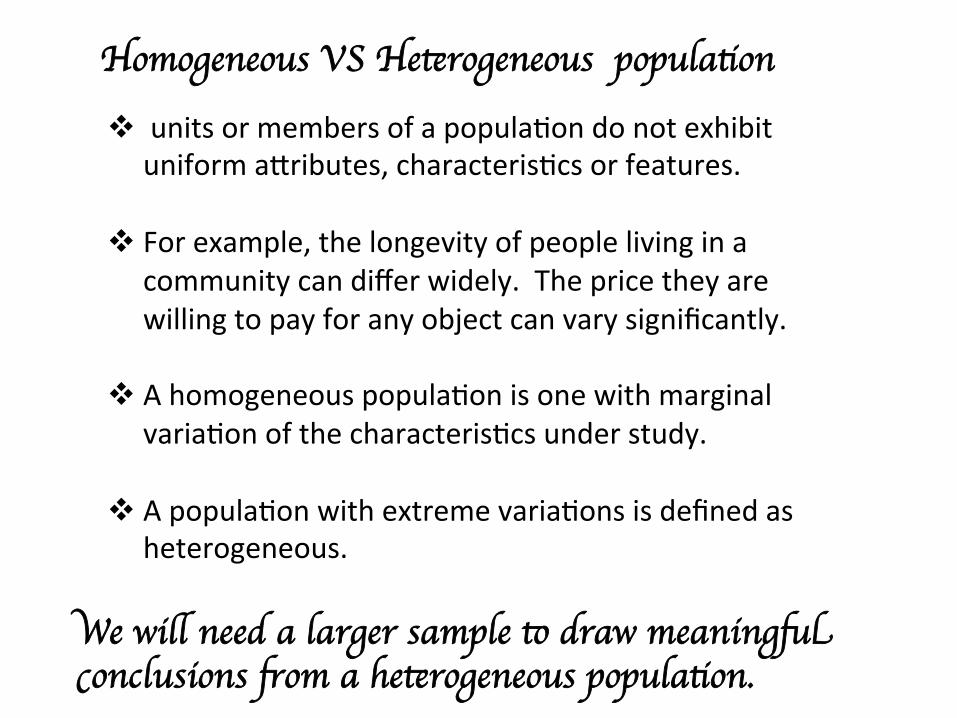
! unitsormembersofapopulaCondonotexhibituniforma^ributes,characterisCcsorfeatures.
! Forexample,thelongevityofpeoplelivingina
communitycandifferwidely.Thepricetheyarewillingtopayforanyobjectcanvarysignificantly.
! AhomogeneouspopulaConisonewithmarginal
variaConofthecharacterisCcsunderstudy.! ApopulaConwithextremevariaConsisdefinedas
heterogeneous.
We will need a larger sample to draw meaningful conclusions from a heterogeneous population.
Homogeneous VS Heterogeneous population
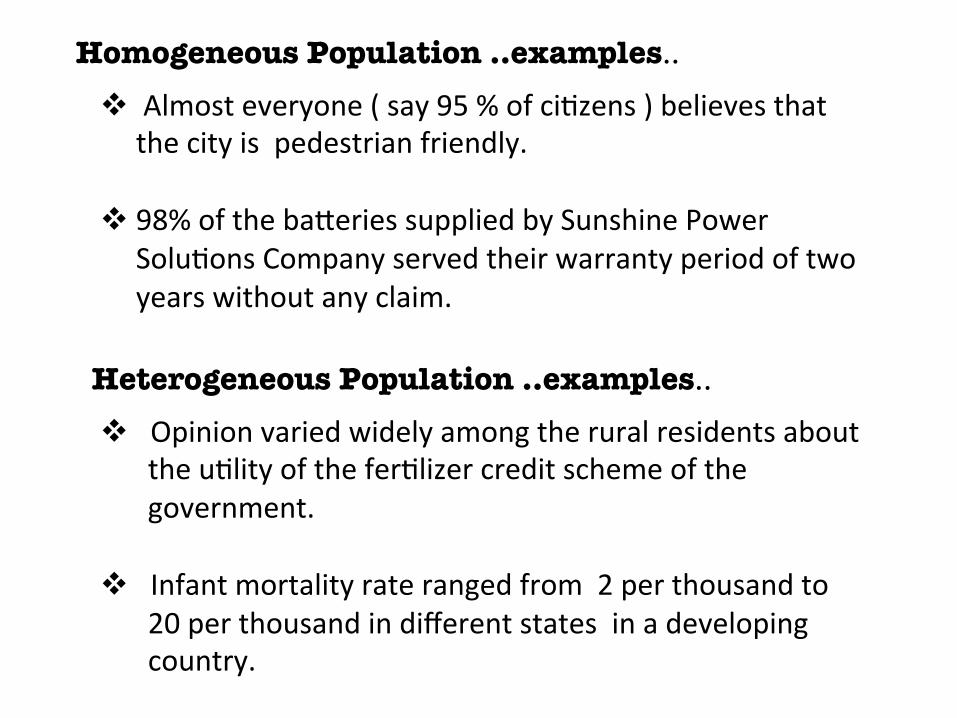
Homogeneous Population ..examples..
Heterogeneous Population ..examples..
! Almosteveryone(say95%ofciCzens)believesthatthecityispedestrianfriendly.
! 98%oftheba^eriessuppliedbySunshinePower
SoluConsCompanyservedtheirwarrantyperiodoftwoyearswithoutanyclaim.
! OpinionvariedwidelyamongtheruralresidentsabouttheuClityoftheferClizercreditschemeofthegovernment.
! Infantmortalityraterangedfrom2perthousandto20perthousandindifferentstatesinadevelopingcountry.

! Clarityonpurposeofthestudy,itsfocusandwhatinferenceswewishtodrawiscriCcalforitssuccess.
! Ambiguityinitsmissionwillresultinincorrect
idenCficaConoftherelevantpopulaCon,inadequatedesignofsurveyinstrumentsandunreliableconclusions.
! Forexample,astudyofreasonsforfailureamong
firmsrequiresanunambiguousdefiniConof“failure”.TherelevantpopulaConmustincludebothfailedand
successfulcompanies.
Focus of the study will determine the relevant population as well as its homogeneity.
Relevance of focusing on study objectives
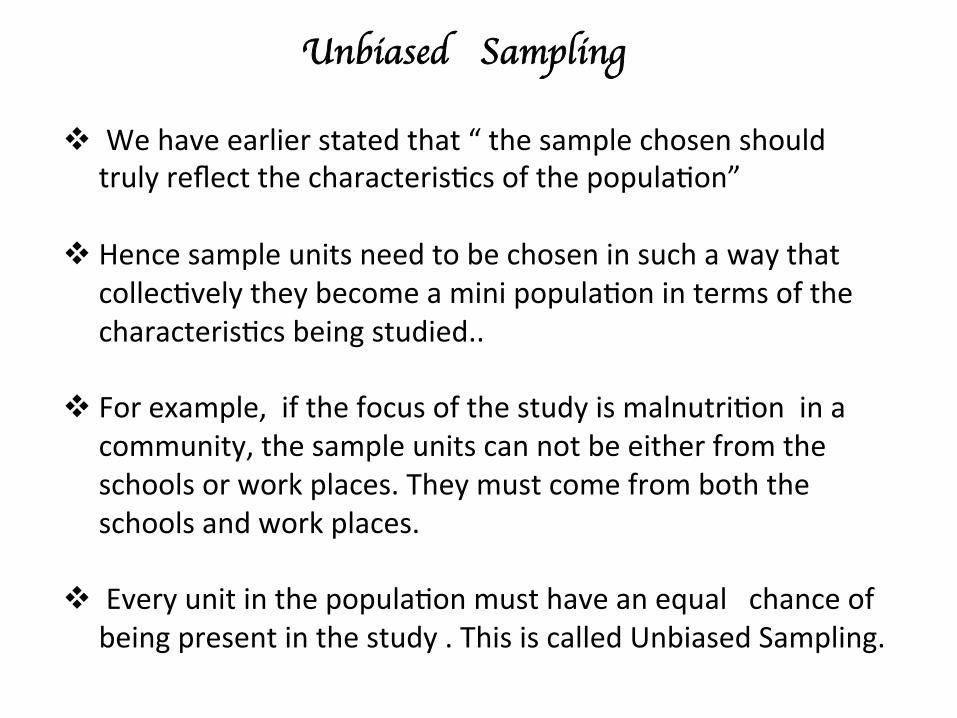
! Wehaveearlierstatedthat“thesamplechosenshouldtrulyreflectthecharacterisCcsofthepopulaCon”
! Hencesampleunitsneedtobechoseninsuchawaythat
collecCvelytheybecomeaminipopulaConintermsofthecharacterisCcsbeingstudied..
! Forexample,ifthefocusofthestudyismalnutriConina
community,thesampleunitscannotbeeitherfromtheschoolsorworkplaces.Theymustcomefromboththeschoolsandworkplaces.
! EveryunitinthepopulaConmusthaveanequalchanceof
beingpresentinthestudy.ThisiscalledUnbiasedSampling.
Unbiased Sampling

! TherearescienCficmethodstoselectthesampleunitsrandomlyfromthepopulaContoensurethereisnobiasinsampling.
! SimpleRandomSampling(SRS),StraCfiedSamplingand
ClusterSamplingaresomeofthesemethods.! RandomSamplingrequiresfinitepopulaContogivereliable
results.FurthereachunitmustbedisCnctlyidenCfied.
Unbiased Sampling techniques are the means to ensure comprehensive representation of the population most
efficiently.
Unbiased Sampling
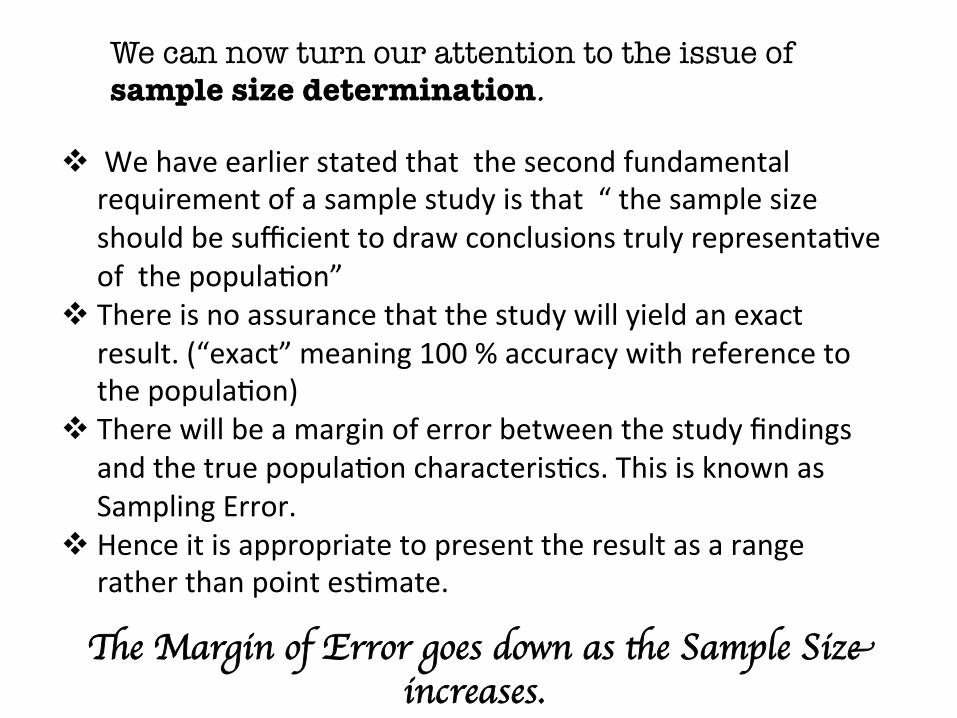
! Wehaveearlierstatedthatthesecondfundamentalrequirementofasamplestudyisthat“thesamplesizeshouldbesufficienttodrawconclusionstrulyrepresentaCveofthepopulaCon”
! Thereisnoassurancethatthestudywillyieldanexactresult.(“exact”meaning100%accuracywithreferencetothepopulaCon)
! TherewillbeamarginoferrorbetweenthestudyfindingsandthetruepopulaConcharacterisCcs.ThisisknownasSamplingError.
! HenceitisappropriatetopresenttheresultasarangeratherthanpointesCmate.
We can now turn our attention to the issue of sample size determination.
The Margin of Error goes down as the Sample Size increases.
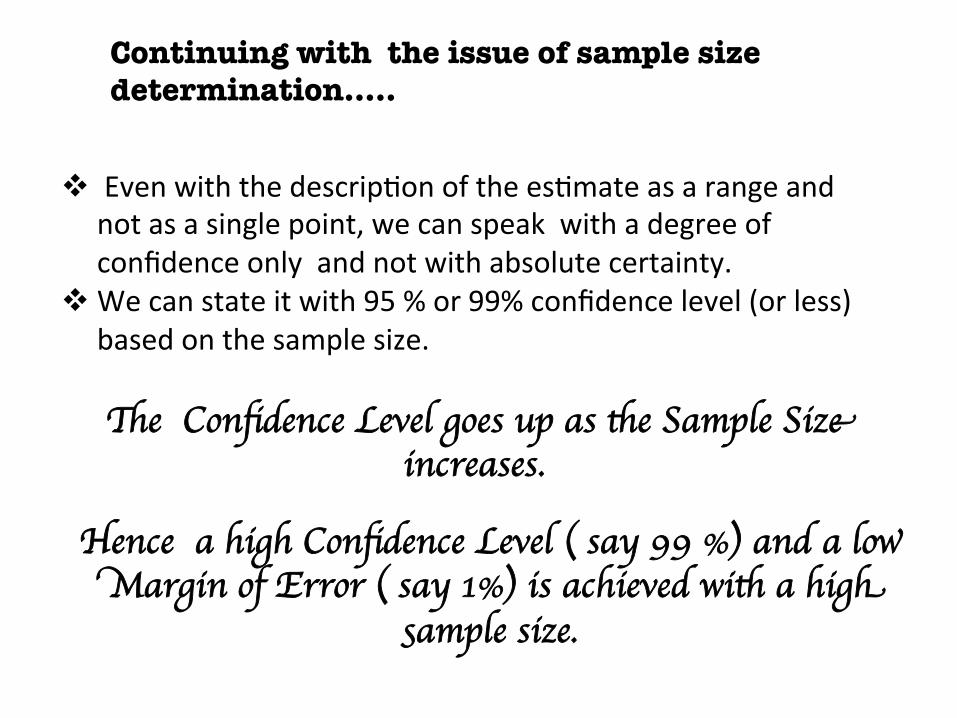
! EvenwiththedescripConoftheesCmateasarangeandnotasasinglepoint,wecanspeakwithadegreeofconfidenceonlyandnotwithabsolutecertainty.
! Wecanstateitwith95%or99%confidencelevel(orless)basedonthesamplesize.
Continuing with the issue of sample size determination…..
The Confidence Level goes up as the Sample Size increases.
Hence a high Confidence Level ( say 99 %) and a low Margin of Error ( say 1%) is achieved with a high
sample size.

sample size tables …….preamble
! WewillpresentaseriesoftablesshowingtherequiredsamplesizeforagivenpopulaConsize,allowablemarginoferrorandexpectedconfidencelevel.
! We assume that the population is quite heterogeneous in terms
of the parameter being studied. This will result in the maximum sample size ever needed.
! ThereisanelegantmathemaCcalformulatocalculatethesevalues.WewillpresenttheformulainalatersecCon.
! TherearemanyreadyreckonersandeCalculatorstohelpus
findthesamplesize.OnesuchcalculatorfromSurveymonkeyisavailableat
h^ps://www.surveymonkey.com/mp/sample-size-calculator/
sample size tables
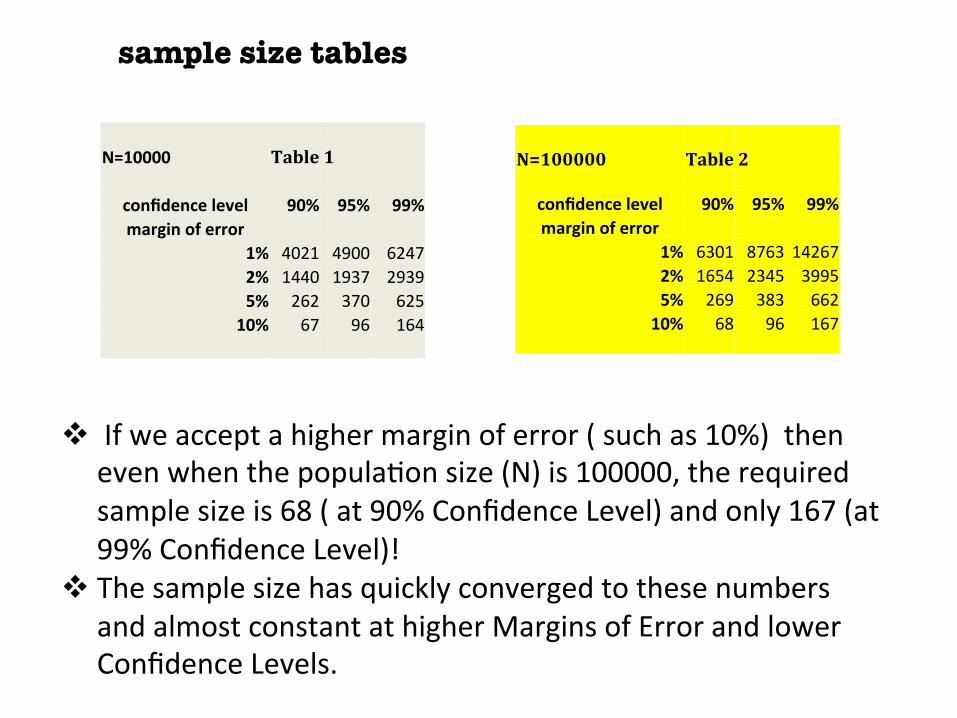
N=10000 Table1
confidencelevel 90% 95% 99%marginoferror
1% 4021 4900 62472% 1440 1937 29395% 262 370 62510% 67 96 164
N=100000 Table2
confidencelevel 90% 95% 99%marginoferror
1% 6301 8763 142672% 1654 2345 39955% 269 383 66210% 68 96 167
! Ifweacceptahighermarginoferror(suchas10%)thenevenwhenthepopulaConsize(N)is100000,therequiredsamplesizeis68(at90%ConfidenceLevel)andonly167(at99%ConfidenceLevel)!
! ThesamplesizehasquicklyconvergedtothesenumbersandalmostconstantathigherMarginsofErrorandlowerConfidenceLevels.
sample size tables
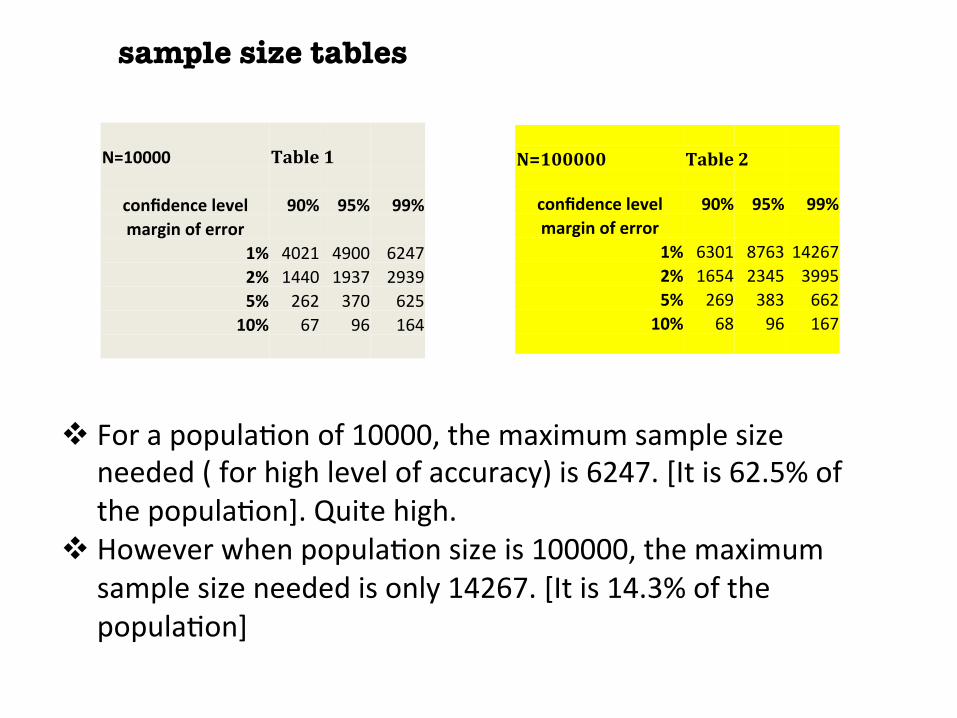
N=10000 Table1
confidencelevel 90% 95% 99%marginoferror
1% 4021 4900 62472% 1440 1937 29395% 262 370 62510% 67 96 164
N=100000 Table2
confidencelevel 90% 95% 99%marginoferror
1% 6301 8763 142672% 1654 2345 39955% 269 383 66210% 68 96 167
! ForapopulaConof10000,themaximumsamplesizeneeded(forhighlevelofaccuracy)is6247.[Itis62.5%ofthepopulaCon].Quitehigh.
! HoweverwhenpopulaConsizeis100000,themaximumsamplesizeneededisonly14267.[Itis14.3%ofthepopulaCon]
sample size tables…some more..
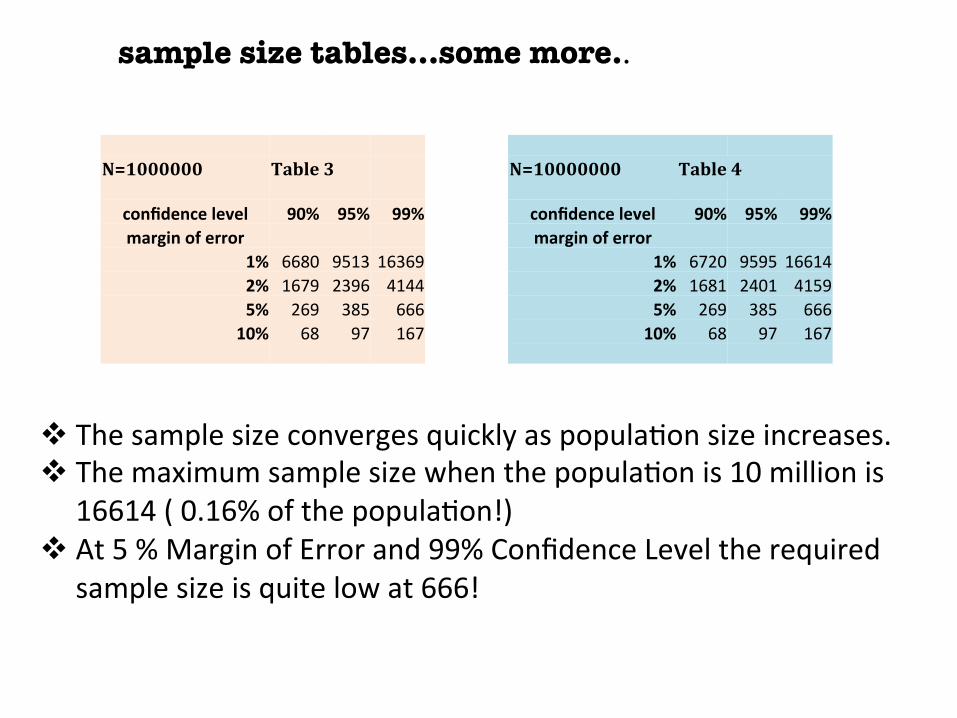
N=1000000 Table3
confidencelevel 90% 95% 99%marginoferror
1% 6680 9513 163692% 1679 2396 41445% 269 385 66610% 68 97 167
N=10000000 Table4
confidencelevel 90% 95% 99%marginoferror
1% 6720 9595 166142% 1681 2401 41595% 269 385 66610% 68 97 167
! ThesamplesizeconvergesquicklyaspopulaConsizeincreases.! ThemaximumsamplesizewhenthepopulaConis10millionis
16614(0.16%ofthepopulaCon!)! At5%MarginofErrorand99%ConfidenceLeveltherequired
samplesizeisquitelowat666!

sample size tables…at population size of 100 million N=10000000 Table4
confidencelevel 90% 95% 99%marginoferror
1% 6720 9595 166142% 1681 2401 41595% 269 385 66610% 68 97 167
! AtpopulaConsizeof100millionthesamplesizehasconvergedforallbuttwoscenario.
! ThemaximumsamplesizeneededforevenlargerpopulaConsis16641.(asdeterminedfromtheeCalculator)
! Henceany(randomsample)surveythatcoverstheenCrepopulaConoftheworldcanbecarriedouttoahighdegreeofaccuracywithasamplesizeof16641.
N=100million Table5 confidencelevel 90% 95% 99%marginoferror
1% 6724 9604 166392% 1681 2401 41615% 269 385 66610% 68 97 167
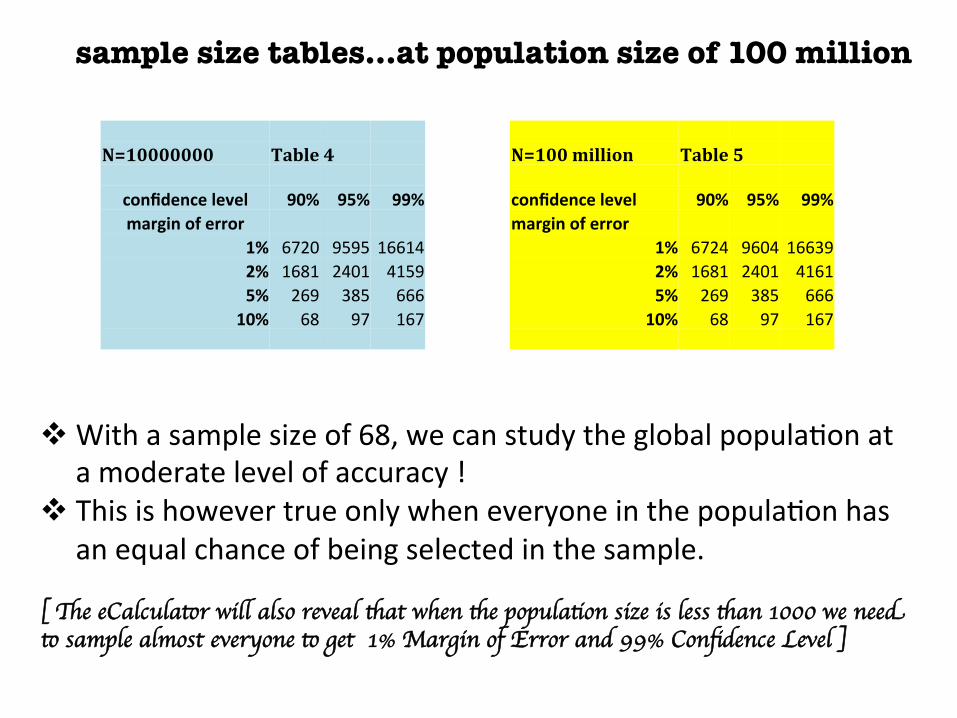
sample size tables…at population size of 100 million
N=10000000 Table4
confidencelevel 90% 95% 99%marginoferror
1% 6720 9595 166142% 1681 2401 41595% 269 385 66610% 68 97 167
! Withasamplesizeof68,wecanstudytheglobalpopulaConatamoderatelevelofaccuracy!
! ThisishowevertrueonlywheneveryoneinthepopulaConhasanequalchanceofbeingselectedinthesample.
N=100million Table5 confidencelevel 90% 95% 99%marginoferror
1% 6724 9604 166392% 1681 2401 41615% 269 385 66610% 68 97 167
[ The eCalculator will also reveal that when the population size is less than 1000 we need to sample almost everyone to get 1% Margin of Error and 99% Confidence Level ]

Formula for Sample Size…..preamble….
! WeneedtorevisittheconceptsofMarginofError,ConfidenceLevelandHomogeneitytounderstandtheSampleSizeformula.
! Furtherwehavetograspsomefundamentalconceptsfrom
StaCsCcsandProbabilityTheory.
! NormalDistribuConandCentralLimitTheoremaretermsandconceptsusedbyscienCsts,engineersandpsephologistsinthiscontext.

Margin of Error…revisited…..
! SampleStudyisunlikelytoyieldtheexactresult.(Forexample,theaverageageofresidentsinacity,basedoncensuswas32.1butonesamplestudyconductedinthesamecityfoundittobe31.5butasecondstudyresultedinthevalueof32.3)
! MarginofErroristhedifferencebetweentheactualvalueandvaluedeterminedbythesamplestudy.
! Beforethestudycommences,wecanspecifythedesiredMarginofError(say2%or5%awayfromtheactualvalue)andthendeterminethesamplesizeaccordingly.MarginofErrorisalsoknownasDegreeofPrecisioninsometexts.
The Margin of Error goes down as the Sample Size increases.

Normal Distribution ( alias Bell Curve )
AccordingtoNormalDistribuCon,WhenthepopulaConisverylarge,theobservedvalueswillliewithinabellshapedcurvewhichhas(a)mostvaluesconcentratednearthecentreand(b)distributedsymmetricallyaroundthecentre.
InourBa^eryexample,theaveragelifecanbe24months.Thentheactuallifeofaba^erycanrangefrom2to46months.Majorityoftheba^erieswillshowalifeof22to26months
Lifeinmonths
No.ofBa^eries
If the Margin of Error specified is 5 % ( 1.2 months) then we wish the sample study to find the average battery life to be in the range of 22.8 to 25.2 months. The chosen sample size should ensure this.
5030100
10162024283236
Confidence Level …revisited….
! EvenwhenmulCpleSampleStudiesaredonewiththesamepopulaCon,thereisnoassurancethatexactvalue(asperthepopulaCon)willbefound.NeitherindividualSampleStudyvaluesnortheaverageofSampleStudiesisassuredtogetustheexactvalue.
! TheBellCurveexplainsthephenomenon.DuetoSamplingError,thevalueswillliearoundtheexactvalue;moreofthemveryclosetoitbutsomeawayfromitandafewfarawayfromit.
! TheareaunderthiscurveandbetweentwoverCcallinesrepresentstheprobabilitythatwewillfindthevaluetolieonthecurvebetweenthelines.
Lifeinmonths
10162024283236
No.ofBa^eries
5030100
Confidence Level …revisited….
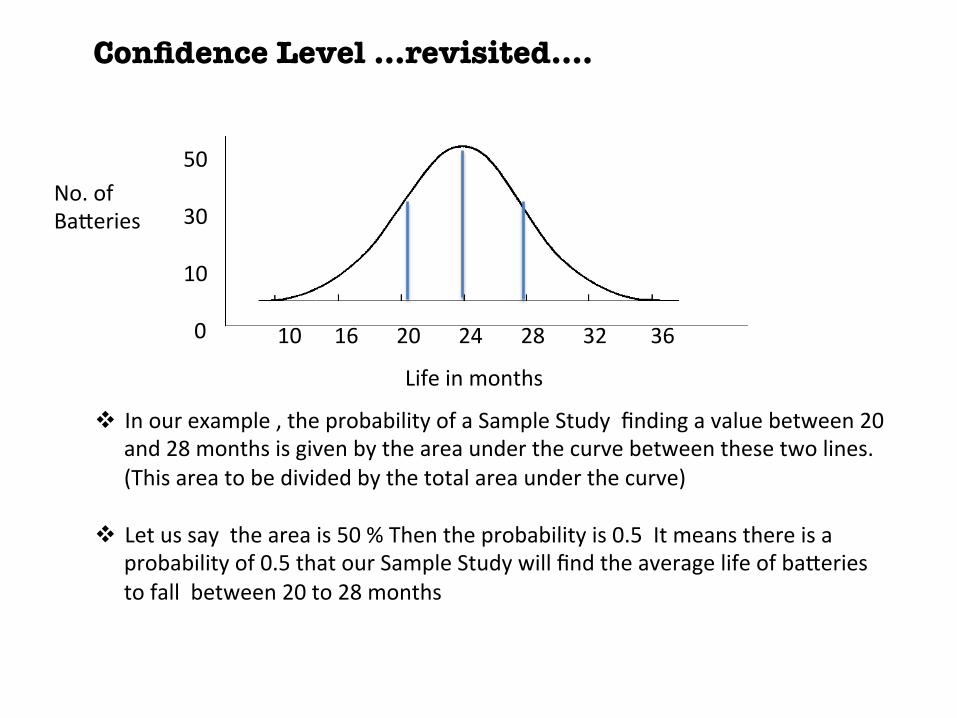
! Inourexample,theprobabilityofaSampleStudyfindingavaluebetween20and28monthsisgivenbytheareaunderthecurvebetweenthesetwolines.(Thisareatobedividedbythetotalareaunderthecurve)
! Letussaytheareais50%Thentheprobabilityis0.5Itmeansthereisaprobabilityof0.5thatourSampleStudywillfindtheaveragelifeofba^eriestofallbetween20to28months

Lifeinmonths
10162024283236
No.ofBa^eries
5030100
Confidence Level …revisited….
! SincewedesiretohaveveryhighConfidenceLevels(say95%)theareaunderthecurveshouldbeaccordingly95%.
! FurtherwewishtheMarginofErrortobelow(say5%)ThatcallsfortheSampleStudyvaluetofallwithinarangeof1.2from24months.
! Combiningthetwotogether,wecansaythatwewishtofindthesamplesizetogiveusa95%ConfidenceLevelthattheSamplevaluewillfallbetween22.8to25.2months

Homogeneityisexpressedintermsofcongruenceofopinionorlevelofdispersionaroundtheaveragevalue
Homogeneity…revisited….
10202224262836101824302836
BellCurveofahomogeneouspopulaCon
BellCurveofaheterogeneouspopulaCon
TheDispersionaroundtheaverage(alsocalledasmeaninstaCsCcs)ismeasuredandexpressedasstandarddeviaCon
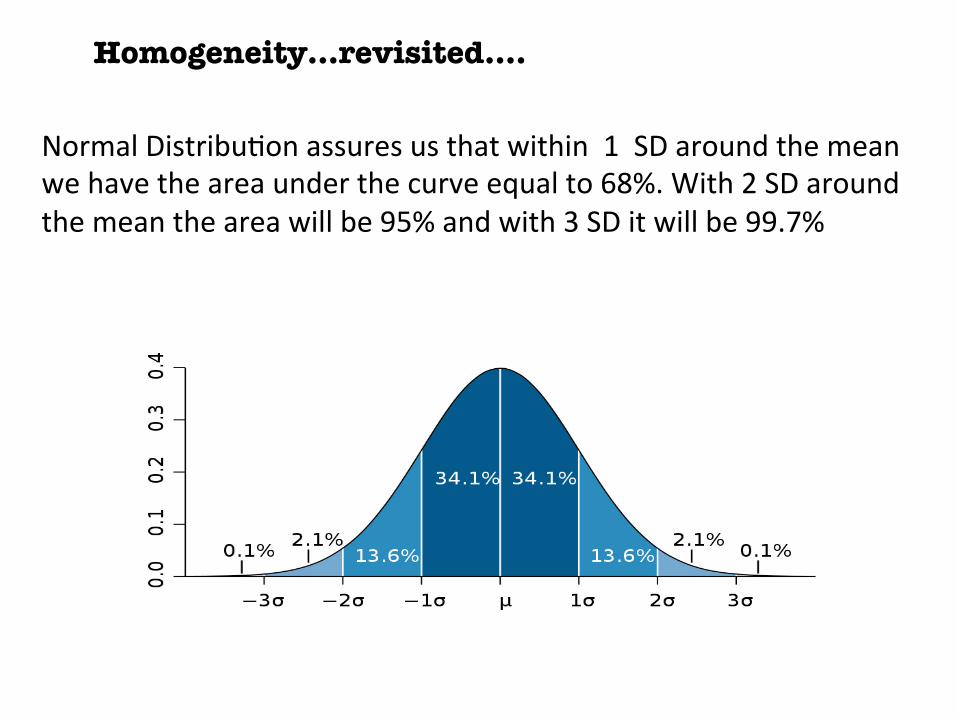
NormalDistribuConassuresusthatwithin1SDaroundthemeanwehavetheareaunderthecurveequalto68%.With2SDaroundthemeantheareawillbe95%andwith3SDitwillbe99.7%
Homogeneity…revisited….
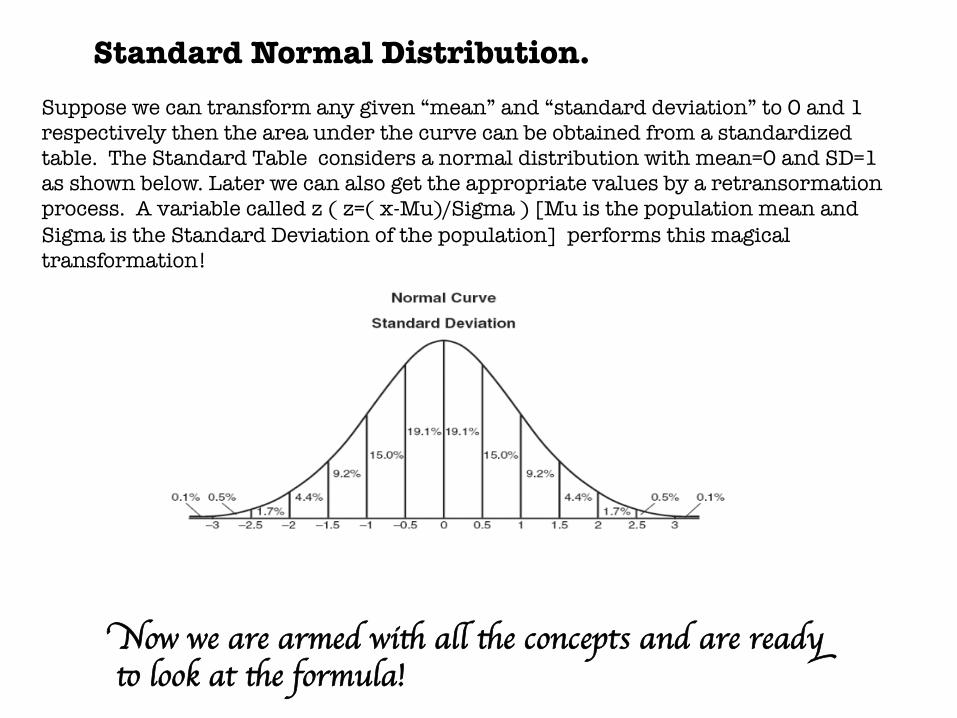
Suppose we can transform any given “mean” and “standard deviation” to 0 and 1 respectively then the area under the curve can be obtained from a standardized table. The Standard Table considers a normal distribution with mean=0 and SD=1 as shown below. Later we can also get the appropriate values by a retransormation process. A variable called z ( z=( x-Mu)/Sigma ) [Mu is the population mean and Sigma is the Standard Deviation of the population] performs this magical transformation!
Standard Normal Distribution.
Now we are armed with all the concepts and are ready to look at the formula!

Formula for determining the Sample Size.
n1=Z**2xpx(1-p)/(e**2)n0=(n1)/[1+(n1-1)/N]
! n1=SampleSizeuncorrectedforthepopulaJonsize
! n0=SampleSizecorrectedforthepopulaJonsize! Z=TheZstaJsJcvalueasderivedfromanormaldistribuJontablefor
agivenconfidencelevel.(Itis2.58at99%ConfidenceLevel)! P=esJmateofproporJonofthepopulaJonvoJngforthe
proposiJon! E=MarginofError! N=PopulaJonsizeesJmated! Symbol**represents“raisedtothepowerof”
This formula holds good for medium and large size populations and where the study is aimed at finding the % voting for a proposition.
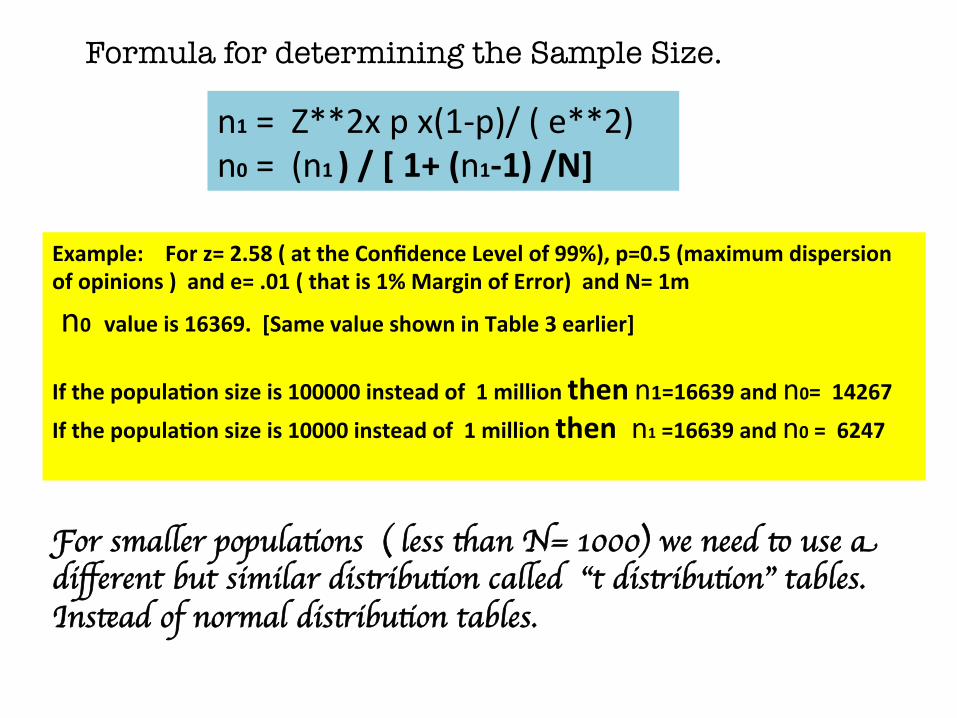
Formula for determining the Sample Size.
n1=Z**2xpx(1-p)/(e**2)n0=(n1)/[1+(n1-1)/N]
For smaller populations ( less than N= 1000) we need to use a different but similar distribution called “t distribution” tables. Instead of normal distribution tables.
Example:Forz=2.58(attheConfidenceLevelof99%),p=0.5(maximumdispersionofopinions)ande=.01(thatis1%MarginofError)andN=1m
n0valueis16369.[SamevalueshowninTable3earlier]IfthepopulaJonsizeis100000insteadof1millionthenn1=16639andn0=14267
IfthepopulaJonsizeis10000insteadof1millionthenn1=16639andn0=6247
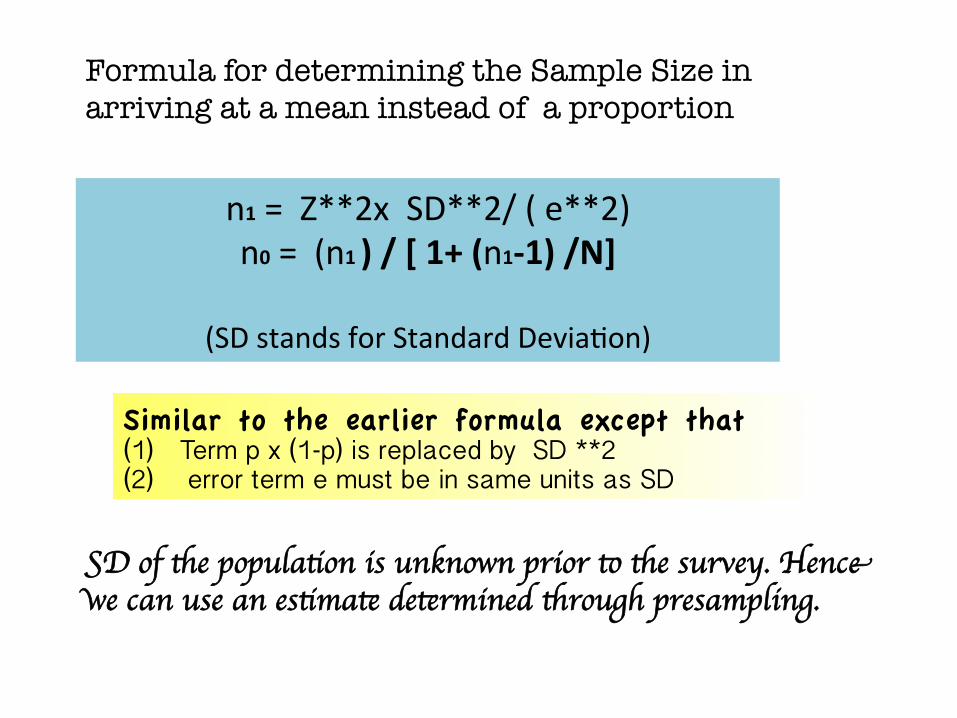
Formula for determining the Sample Size in arriving at a mean instead of a proportion
n1=Z**2xSD**2/(e**2)n0=(n1)/[1+(n1-1)/N]
(SDstandsforStandardDeviaCon)
Similar to the earlier formula except that (1) Term p x (1-p) is replaced by SD **2 �(2) error term e must be in same units as SD �
SD of the population is unknown prior to the survey. Hence we can use an estimate determined through presampling.
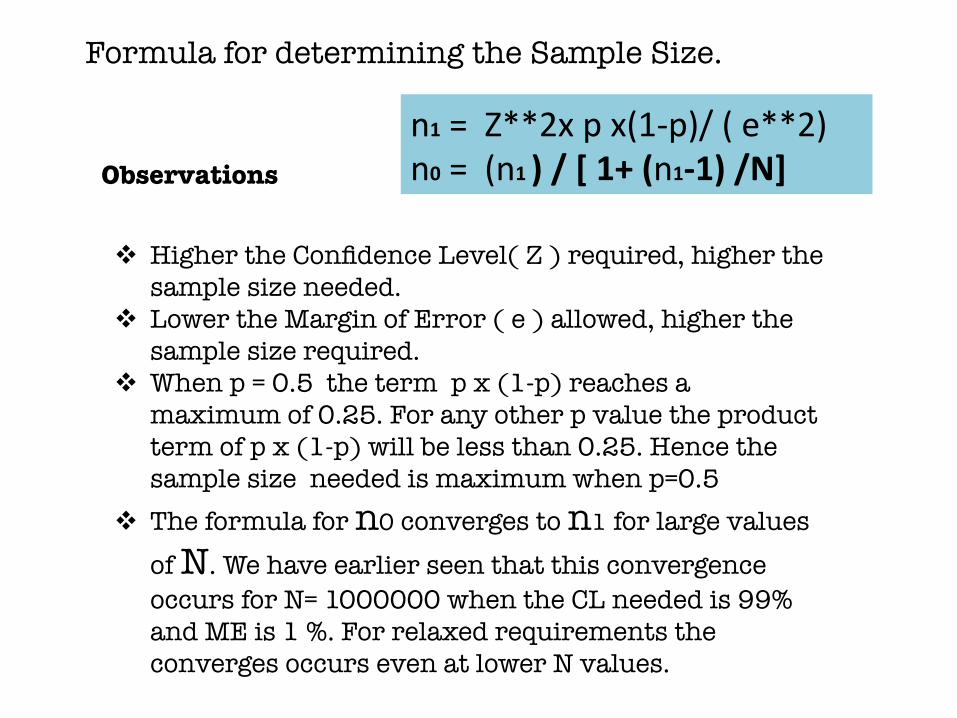
Formula for determining the Sample Size.
Observations
n1=Z**2xpx(1-p)/(e**2)n0=(n1)/[1+(n1-1)/N]
! Higher the Confidence Level( Z ) required, higher the sample size needed.
! Lower the Margin of Error ( e ) allowed, higher the sample size required.
! When p = 0.5 the term p x (1-p) reaches a maximum of 0.25. For any other p value the product term of p x (1-p) will be less than 0.25. Hence the sample size needed is maximum when p=0.5
! The formula for n0 converges to n1 for large values of N. We have earlier seen that this convergence occurs for N= 1000000 when the CL needed is 99% and ME is 1 %. For relaxed requirements the converges occurs even at lower N values.
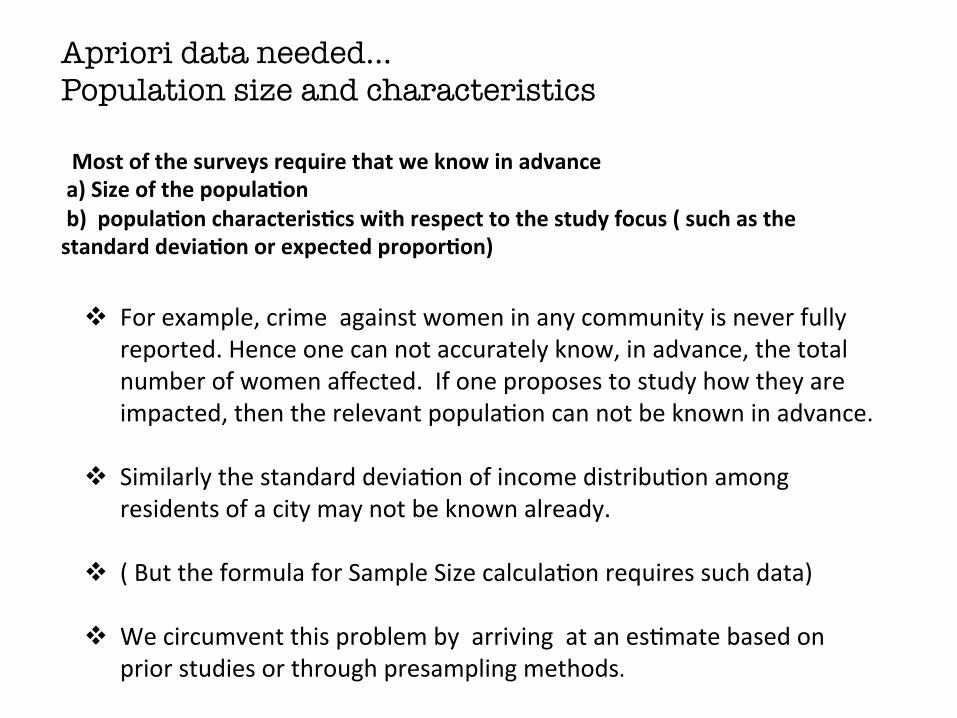
Apriori data needed… Population size and characteristics
Mostofthesurveysrequirethatweknowinadvancea)SizeofthepopulaJonb)populaJoncharacterisJcswithrespecttothestudyfocus(suchasthestandarddeviaJonorexpectedproporJon)
! Forexample,crimeagainstwomeninanycommunityisneverfullyreported.Henceonecannotaccuratelyknow,inadvance,thetotalnumberofwomenaffected.Ifoneproposestostudyhowtheyareimpacted,thentherelevantpopulaConcannotbeknowninadvance.
! SimilarlythestandarddeviaConofincomedistribuConamongresidentsofacitymaynotbeknownalready.
! (ButtheformulaforSampleSizecalculaConrequiressuchdata)
! WecircumventthisproblembyarrivingatanesCmatebasedonpriorstudiesorthroughpresamplingmethods.

Sub Groups and Stratified Sampling
! Itmaybeworthwhiletoformsubgroupsandstudythemasdifferentstrataincertainsurveys.
! (Forexample,wemaywishtofindouttheopinionofage
wisegroups)! Henceagewisestrataneedtobeformedandthesample
sizeformulaistobeappliedwithineachstratum! AggregaConofstudyvariateacrossstratarequiresdue
weightagebeinggiventoeachstratumbasedonitspopulaConsize.
Why do pollsters go wrong?
! Pollstersandpsephologistscarryoutopinionorattudesurveystodeterminewhatislikelytohappen.SomeCmestheirpredicConsgowrong.
! TheBrexitopinionpollconductedpriortothevoCngin
Britainisagoodexample.SimilarlymanyelecConresultspredictedonthebasisofpriororexitpollshavegonewrong.
Not all Sample Studies are similar in context. Their contextual difference must be well understood prior to the study.
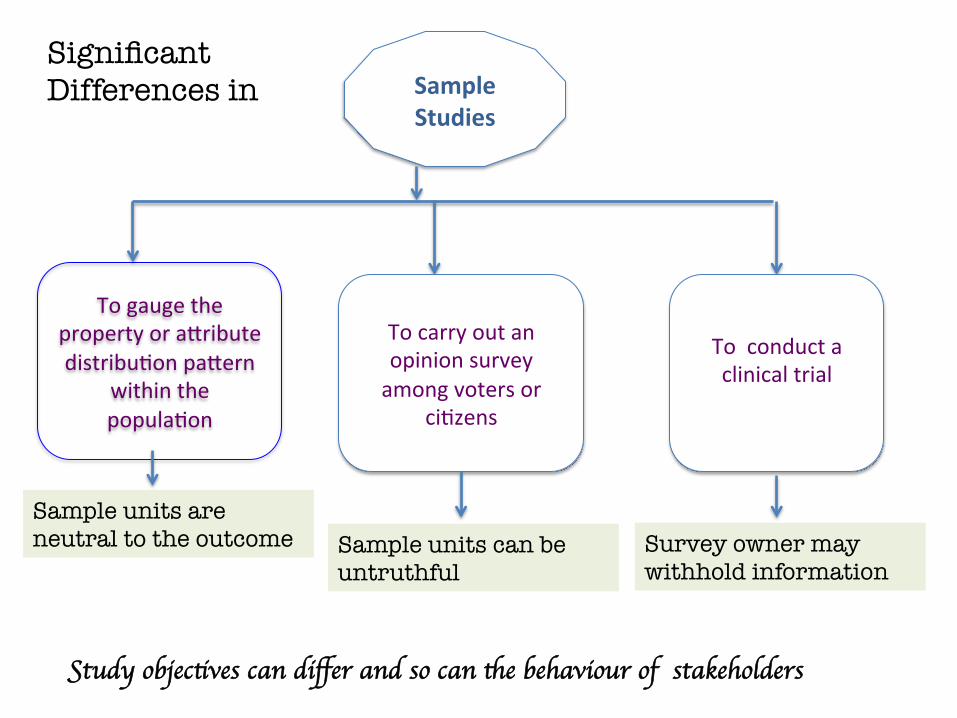
SampleStudies
Togaugethepropertyora^ributedistribuConpa^ern
withinthepopulaCon
Tocarryoutanopinionsurveyamongvotersor
ciCzens
Toconductaclinicaltrial
Sample units are neutral to the outcome Sample units can be
untruthful Survey owner may withhold information
Study objectives can differ and so can the behaviour of stakeholders
Significant Differences in
Opinion Surveys among voters
! ManyaCmesubstanCalnumberofvotersremainundecidedCllthelastminute.
! Surveyinstrumentsarenotcleverenoughtodetectpreferencesof“sitngonthefence”voters.
! SampleSizeturnsouttobeinadequatewhenmulCpleprobesareincludedinasinglequesConnaire.
! VotershaveareasonforwithholdinginformaConormisleadingthepollsters.Surveyinstrumentscannotdetectsuchdeviousbehaviour.
! InadequaterandomnessinSampleSelecCon
Better design of survey in terms of instruments, sample size and sampling plan and training the administrators along with use of modern Data Analytics aids can improve predictability of results.

Questionnaire Design
! Whensampleunitsareneutraltotheoutcomeveracityofdataisnotanissue.
! HowevermostopinionsurveysmayendupwithdatanotreflecCngthetrueopinionofthepersonsinterviewed.
! HenceitispreferabletodesignthequesConnaireasamulCplechoicequeriesthanbinaryresponses.
! Furtherthesamplesizeneedstobeincreased(25to50%)toaccountforthisunreliabilityofresponse.
! Redundantqueriesneedtobeincludedtocrossvalidateresponseandtodiscoveranomalies.
! LeadingquesConsaretobeavoided.! QuesConsmustreflectgender,raceandregionetc.sensiCvity.
Issues in Clinical Trials
TheyhavemanyspecialcharacterisJcscomparedtoregularsamplestudies.
! ThestudyduraContendstobelong;asmuchas18monthsaverage! ThestudypopulaConsizemaybeunknown.Dataona^ributedispersion
canbesparse.! HenceSampleSizedeterminaConisacomplexissue! Samplestendtodropoutduringthestudy.! NeedtobifurcatethestudypopulaConisaspecialrequirement.Onegroup
hastobeadministeredtheplacebo.Theothergroupislikelytobenefitfromthestudy.
! SampleselecConbecomesamoralandethicalissue! BothunderselecConandoverselecConofstudypopulaConcancause
dilemma.

Small Sample Studies
! TheresultscanbepresentedatalowerConfidenceLevelorhigherMarginofError.
! Validresultscanbepresentedatsomeofthestratalevelsorwithrelaxedsurveyfocus
! Itiscommontochangethestudyfocustoin-depthprobingonselecttopicswhenstudypopulaCondropsoutmidwayinclinicaltrials.(modifythenullhypothesis)
! TherearemanytechniquesandtoolsavailabletoguideindatacollecConanddataanalysis,specifictosmallsamplestudies.Thereareexpertgroupsdedicatedtoanalyzingsmallsampledata.
Whatcanbedonewhensamplesizehasshrunkunwicnglyorotherwise?

Adequacy of Sample Size in Population Surveys
Pleaseobtainpriorpermissionforreuse.Feelfreetodownloadforselfstudy.
Dr.P.Balasubramanian,Founder&CEO,ThemeWorkAnaly-cs,
Gurukrupa,508,47thCrossJayanagar5thBlock
Bangalore,India560041Ph:918041214297