adi izhar bin che ani -...
TRANSCRIPT

DETECTION OF TEETH SURFACE DEFECTS USING FIBER OPTIC DISPLACEMENT SENSOR
ADI IZHAR BIN CHE ANI
FACULTY OF ENGINEERING UNIVERSITY OF MALAYA
KUALA LUMPUR
2012

DETECTION OF TEETH SURFACE DEFECTS USING FIBER OPTIC DISPLACEMENT SENSOR
ADI IZHAR BIN CHE ANI
RESEARCH PROJECT SUBMITTED IN PARTIAL FULFILLMENT
OF THE REQUIREMENTS FOR THE DEGREE OF MASTER OF ENGINEERING
(BIOMEDICAL)
FACULTY OF ENGINEERING UNIVERSITY OF MALAYA
KUALA LUMPUR
2012

UNIVERSITI MALAYA
ORIGINAL LITERARY WORK DECLARATION
Name of Candidate: ADI IZHAR BIN CHE ANI (I.C/Passport No:
Registration/Matric No: KGL 100001
Name of Degree: Master of Engineering (Biomedical)
Title of Project Paper/Research Report/Dissertation/Thesis (“this Work”):
DETECTION OF TEETH SURFACE DEFECTS USING FIBER OPTIC DISPLACEMENT SENSOR
Field of Study: FIBER OPTIC SENSOR IN DENTISTRY
I do solemnly and sincerely declare that:
(1) I am the sole author/writer of this work; (2) This work is original; (3) Any use of any work in which copyright exists was done by way of fair dealing and for
permitted purposes and any excerpt or extract from, or reference to or reproduction of any copyright work has been disclosed expressly and sufficiently and the title of the work and its authorship have been acknowledged in this work;
(4) I do not have any actual knowledge nor do I ought reasonably to know that the making of this work constitutes an infringement of any copyright work;
(5) I hereby assign all and every rights in the copyright to this work to the University of Malaya (“UM”), who henceforth shall be owner of the copyright in this work and that any reproduction or use in any form or by any means whatsoever is prohibited without the written consent of UM having been first had and obtained;
(6) I am fully aware that if in the course of making this work I have infringed any copyright whether intentionally or otherwise, I may be subject to legal action or any other action as may be determined by UM.
Candidate’s Signature Date
Subscribed and solemnly declared before,
Witness’s Signature Date
Name:
Designation:

i
ABSTRACT
Fiber optic displacement sensor has been used recently for general medical
diagnostics and in industry for the characterization and detection of defects in
engineering components. However the lack of understanding of parameter performance
of such a sensor in teeth has largely precluded its application to dentistry. This research
describes sensor system adopting an intensity modulation technique that used a
concentric type bundled optical fiber as a probe in conjunction with the real teeth,
artificial teeth, hybrid composite resin teeth and mirror as the reflecting targets. The
performance of the sensor is investigated on the linear range, sensitivity and the peak
position. In this experiment, the sensor system is used for detecting defect on real teeth.
A 2 mm hole is drilled to create defect on the teeth surface to stimulate dental cavity.
The sensor probe is consequently fixed within the linear range of the displacement and
the intensity of the collected light as a function of lateral movement (x and y axis) of the
teeth surface is recorded while being maintained in perpendicular and constant in axial
position (z axis). The image surface of the defect teeth is reconstructed from the
recorded output voltage using the MATLAB software. This method is practically
suitable when used in conjunction with a micro-computed tomography system in
determining the defect of surface profile of a 3D tomography object being inspected
prior to the image reconstruction.

ii
ABSTRAK
Sensor anjakan gentian optik telah mula digunakan sejak kebelakangan ini
dalam diagnostik perubatan dan di dalam industri untuk pencirian dan pengesanan
kecacatan pada komponen kejuruteraan. Walaubagaimanapun, pemahaman terhadap
prestasi paramanter sensor dalam bidang pergigian masih kurang mewujudkan batasan
untuk aplikasi dalam bidang perubatan. Penyelidikan ini menggunakan fiber optik yang
disusun secara sepusat sebagai kuar dengan teknik keamatan modulasi yang disasarkan
pada gigi sebenar, gigi tiruan, gigi hybrid kandungan resin dan cermin. Prestasi sensor
diselidiki pada keluaran sensor untuk menentukan julat kelelurusan, kepekaan, dan
kedudukan puncak. Dalam uji kaji ini, sensor digunakan untuk mengesan kecacatan
pada gigi sebenar. Satu lubang 2 mm dibuat untuk mewujudkan kecacatan seakan
lubang pada permukaan gigi. Penguji sensor dipasang tetap di dalam julat kelelurusan
dan kepekaan sensor di kira di paksi sisi (paksi x dan y) sepanjang permukaan gigi serta
paksi tegak (paksi z) dibiarkan tetap semasa sepanjang penguji sensor dipasang. Imej
permukaan gigi yang rosak digambarkan daripada nilai-nilai voltan keluaran yang
direkod menggunakan perisian MATLAB. Secara praktikal, kaedah ini sesuai dengan
satu sistem pengkomputeran tomografi bagi menentukan kerosakkan permukaan obejek
3D tomografi yang sedang diperiksa sebelum pembentukan imej.

iii
ACKNOWLEDGEMENTS
Alhamdulillah, thanks to the Almighty ALLAH for giving a chance to me to
finish the project successfully. I would like to express my gratitude to the following
people:
To my supervisor, Prof. Ir. Dr. Wan Abu Bakar Bin Wan Abas (Department of
Biomedical Engineering) and Prof. Dr. Sulaiman Bin Wadi Harun (Department of
Electrical Engineering and Photonics Research Center), for the guidance and support in
monitoring the progress till the completion of this research project.
To Madam Husna Binti Abdul Rahman, who is researcher in Photonics
Research Centre, University Malaya for her assistance, advice and suggestion in helping
me completing this research project.
To Dr. Suhaila Abdullah and Dr. Mohd Noor Fareezul Noor Shahidan, for
providing the human teeth samples used in this experiment.
To my beloved wife and family who morally support and inspired me.
To anyone who was directly or indirectly involved in helping me to complete
this project.

iv
TABLE OF CONTENTS
ABSTRACT i
ABSTRAK ii
ACKNOWLEDGEMENT iii
TABLE OF CONTENTS iv
LIST OF FIGURES vi
LIST OF TABLES viii
LIST OF SYMBOLS AND ABBREVIATIONS ix
CHAPTER 1: INTRODUCTION
1.1 Overview 1
1.2 Problem Statements 3
1.3 Objective of the Study 4
1.4 Hypothesis 4
1.5 Significance of the Study 5
1.6 Scope of the Study 5
1.7 Organization of Research Report 6
CHAPTER 2: LITERATURE REVIEW
2.1 Introduction 7
2.2 Dental Hard Tissue 7
2.2.1 Composition of Dental Hard Tissue 8
2.2.2 Dental Caries and Detection Methods 9
2.3 Optical Fiber Technology 13

v
2.3.1 Principle Operation of Fiber Optic 13
2.3.2 Types of Optical Fibers 14
2.4 Fiber Optic Sensor in Dentistry 16
2.5 Fiber Optic Displacement Sensor (FODS) 17
2.5.1 Helium-Neon (He-Ne) Laser 18
2.5.2 Plastic Bundled Fiber 20
2.5.3 Silicon Detector 22
CHAPTER 3: PERFORMANCE CHARACTERISTICS OF FIBER OPTIC
DISPLACEMENT SENSOR (FODS) ON REAL TEETH
3.1 Introduction 23
3.2 Experimental Setup 24
3.3 Results and Discussions 27
CHAPTER 4: FIBER OPTIC DISPLACEMENT SENSOR (FODS) FOR
DETECTING TEETH SURFACE DEFECT THAT SIMULATE DENTAL
CAVITIES
4.1 Introduction
32
4.2 Experimental Setup 33
4.3 Results and Discussion 36
CHAPTER 5: CONCLUSION 41
BIBLIOGRAPHY 42

vi
LIST OF FIGURES
Figure Title Page
Figure 2.1 The section of a human tooth 8
Figure 2.2 Demineralisation and remineralisation cycle for enamel
caries
11
Figure 2.3 Helium-Neon (He-Ne) laser 18
Figure 2.4 Structure of plastic optical fiber (POF) 20
Figure 2.5 Size of plastic optical fiber (POF) compared to other types
of fiber
20
Figure 3.1 Schematic experimental setup for displacement sensor
using fiber bundled probe and teeth samples
25
Figure 3.2 Comparison of voltage output between Helium-Neon
(He-Ne) laser and laser diode against displacement
27
Figure 3.3 Comparison between flat mirror and human teeth sample
against displacement
29
Figure 3.4 Variation of output voltage against displacement 31
Figure 4.1 Set-up for the imaging and detection of enamel tooth
surface defect using fiber optic displacement sensor
(FODS)
34

vii
Figure 4.2 2D and 3D surface profile of the (a) molar, (b) canine, (c)
hybrid composite resin and (d) artificial surface showing a
clear difference in the reflected signal between the flawed
and unflawed tooth region
37
Figure 4.3 Variation of output against position of flawed and
unflawed canine surface
39

viii
LIST OF TABLES
Table Title Page
Table 2.1 Approximate composition of enamel and dentin as volume
percent of total tissue
9
Table 2.2 Risk and modifying factors for carries 10
Table 2.3 Methods of caries detection based on their underlying
principles with its advantages and disadvantages
12
Table 2.4 Selected optical properties of dental hard tissue 19
Table 3.1 The features of the fiber optic displacement (front slope)
on human teeth sample for various type of light source
28
Table 3.2 The features of the fiber optic displacement (front slope)
for various flat teeth surfaces
31
Table 4.1 Diameter measurement of the flaw on the tooth surface
using the fiber optic displacement sensor (FODS) and
micrometer
39

ix
LIST OF SYMBOLS AND ABBREVIATION
FODS Fiber Optic Displacement Sensor
HA Hydoxyapatite
FA Fluroapatite
FOTI Fiber Optic Transillumination
QLF Quantitative Light-Induced Fluorescence
DiFOTI Digital Image Fiber Optic Transillumination
ECM Electrical Conductance Measurement
SMF Single Mode Fiber
MMF Multimode Fiber
He-Ne Helium-Neon
POF
CW
Plastic Optical Fiber
Continuous Wave
PMMA Polymethylmethacrylate
LED Light Emitting Diode
E-H Electron-Hole
OCT Optical Coherence Tomography
2D Two-Dimensional
3D
Three-Dimensional

1
CHAPTER 1
INTRODUCTION
1.1 Overview
Biophotonics is the study of the interaction of light with biological materials.
Recently, development of biophotonics is focused on translating discoveries in the
sciences around lasers, light, and imaging into useful medical equipments (Wilson et al.,
2005). Among the biophotonics applications, optical fiber sensors possess various
advantages in electrical sensing technologies, which make it interesting for many other
areas. The advantages include the safety in chemically or explosive environment and
most important is low susceptibility to electromagnetic interference.
Fiber optic based sensor is commonly used in control and monitoring systems
for material temperature, strain, deformation and others field. These fields use the work
range in fiber optic displacement sensor (FODS) mechanism. The mechanism of FODS
can be categorized into three categories, based on 1) wavelength modulation, 2) phase
modulation, and 3) intensity modulation. The first and second categories have good
accuracy but short dynamic range, while the third category has lesser accuracy but
longer dynamical range. Moreover the third category is lower in cost and contributes
measurements that are easily interpretable.
FODS based on intensity modulation can be designed by using transmission
technique (Harun et al., 2010), where the coupling loss of power light is measured at
two-movable ends of the fiber, and the reflection technique, where the coupling loss
factor of power lights is measured due to the reflection of the moving object.

2
In the reflection technique, the sensor can be divided into two forms: 1) single
mode fiber (SMF) and 2) multi mode fiber (MMF) coupler. This research conducted an
experiment using the MMF coupler for displacement sensor on artificial teeth, hybrid
composite resin teeth, and human teeth.
Furthermore, this study investigates the potential of intensity modulated FODS
imaging for the identification of dental cavity. In this research, the discussion is on
preliminary results in the detection of flaws on various teeth surfaces, as well as
measurement of the flaws which are represented by drilled holes that simulate dental
cavities. Measurements are obtained by launching a light beam onto a tooth surface via
a bundled fiber and collecting the reflected light from the surface via a silicon
photodetector. The output voltages are measured as a function of lateral distance to
produce the tooth surface profile. The results show a clear distinction between the
flawed and unflawed tooth region. This method is simple, cost effective, non-
destructive and does not require ionizing radiation, hence providing great potential for
quality assessment of the impressional mapping methods in restorative dentistry or as an
alternative non-impressional method.

3
1.2 Problem Statement
FODS has become popular in sensing application in medicine (Jensen et al.,
1989). The sensor relies on the change in retroreflectence of light into a fiber because of
the movement of a target surface. The unique features of FODS have spread
interestingly in dentistry applications that provide with capabilities, less cost and
performance benefits over existing sensors. However, in dentistry there are many
challenges in bringing optical sensing to the clinical environment. The information on
the use of FODS and also their displacement properties on real human teeth information
are still not readily available. Researchers require these properties to enhance the
application of FODS in dentistry.
Tooth decay, which is also called dental cavity or dental caries, is the destruction
of the outer surface of a tooth. Dental cavity occurs when the plaque bacteria that live in
the mouth sticking to tooth surface use the sugar from eaten food to produce acid. The
acid will dissolve the minerals on the tooth surface, creating holes and weak spots.
The understanding of the dental cavity process has continued to develop on the
risk and modifying factors for cavity process, comes an opportunity to promote
preventative therapies that encourage the remineralisation of non-cavitated lesions (Iain
A, 2006). This will results in prevention of dental cavity with the preservation of tooth
for its surface and function. The failure to detect early stage of dental cavity, leaving the
cavity at the deep enamel has resulted in poor outcomes for remineralisation therapies.
In conclusion, the early detection system for dental cavity may help dentist to prevent
the lost of the teeth due to late detection of the cavity.

4
1.3 Objective of the Study
In this study, the performance and the displacement properties of the sensor on
real human teeth by using multimode bundled type of fiber optic sensor are investigated
by measuring the reflected light in voltage by FODS. The goals of the study are as
follows:
(i) To design FODS to be applied on the real human teeth.
(ii) To design FODS for the detection of surface defect that simulate dental
cavities on real human teeth
(iii) To demonstrate the designed FODS experimentally.
(iv) To analyze and evaluate the performance of the designed displacement
sensor.
1.4 Hypothesis
The properties of displacement on real teeth such as displacement response,
sensitivity, and dynamic range are much similar towards each other with excellent
displacement properties. Furthermore, the detected voltages by the proposed method
with an analysis can measure the surface defect areas that simulate dental cavities on
real human teeth.

5
1.5 Significance of the Study
The significance of the study is to propose a detection system for teeth surface
defect for profile inspection using a simple displacement fiber optic bundled sensor
system. The FODS is interesting due to its inherent simplicity, small in size, mobility,
wide frequency capability, extremely low displacement detection limit and ability to
perform non-contacting measurement. The proposed method of detection of teeth
surface defect is accurate to overcome the shortcomings of currently available methods.
The novel detection of teeth surface defect is highly advantages over the conventional
visual method that needs experience from the dentist since earlier detection can prevent
the lost of the teeth.
1.6 Scope of the study
The scopes of this study are as follows:
A concentric type of bundled fiber optic consisting of both transmitting and
receiving fiber as the probe, a red He-Ne laser with 632nm wavelength and a
silicon photo detector.
The real human teeth (namely molar and canine), artificial teeth and hybrid
composite resin teeth are used as samples.
A hole of 2.0 mm to 2.5 mm diameter is drilled on the teeth to create a defect on
the teeth surface to simulate dental cavity. The deep of the hole is not significant
in this study.

6
1.7 Organization of Research Report
Chapter 1 introduces the overview of optical fiber based sensor in medical
applications and the importance of early detection for dental cavities. The problem
statement, objectives of the study, hypothesis, significant of the study, and scope of the
study are stated in this chapter.
Chapter 2 presents the literatures that are related to teeth as a hard tissue and
optical fiber. Furthermore, the usage of fiber optic sensors in dentistry is reviewed. In
additional, the explanation of the component for FODS used in this research is also
discussed.
Chapter 3 covers the performance of fiber optic displacement on real human
teeth. The explanations cover the introduction, experimental method, as well as results
and discussion.
Chapter 4 covers the usage of FODS as detection system for teeth surface defect
that simulate dental cavity. The explanations cover the introduction, experimental
method, as well as results and discussion.
Finally, the research report is concluded in Chapter 5.

7
CHAPTER 2
LITERATURE REVIEW
2.1 Introduction
This chapter reviews the fiber optic sensor technology as well as the application
of FODS in medicine, focusing on dental hard tissue.
2.2 Dental Hard Tissue
Human teeth (singular tooth) consist of three primary tissue components which
are the enamel, dentine and pulp cavity as shown in Fig. 2.1. Human usually have 20
primary teeth (baby) and 32 permanent teeth (adults). A human tooth consists from
incisors, canines, premolars and molars. Incisor is a tooth adapted for cutting or
gnawing, located at the front of the mouth along the apex of dental arch. Molar is a
tooth with a broad crown used to grind the foods, located at the back of the mouth.
Enamel is the hardest and most highly mineralized substance of the body. Enamel is one
of the major tissues in single tooth, together with the dentine, cementum and pulp
cavity. Dentine is the substance between enamel or cementum and the pulp chamber.
The dentine secreted from the odontoblast of the dental pulp.

8
Figure 2.1: The section of a human tooth (Adapted from Thomas et al., 2005)
2.2.1 Composition of Dental Hard Tissue
Enamel and dentine tissue consists of mineral, lipid, protien and water. Enamel
and dentine are very different in their structure, but consists of similar components.
Table 2.1 shows approximate composition for enamel and dentine as volume percent of
each of the components involved. The organic mineral and water components are the
main role in enamel compared to dentine. The mineral in the teeth is composed of a
highly substituted hydoxyapatite (HA). This is actually similar with our bones.
However, the substitutions in the mineral crystal lattice disturb the structure and make it
much more acid soluble than the pure HA (Nelson el al., 1983). The primary major
substitution is carbonate that replaces some of the phosphate leading to an acid soluble
mineral (Nelson et al., 1982).

9
Table 2.1. Approximate composition of enamel and dentine as volume percent of total
tissue
Component Enamel approximate percent by volume
Dentine approximate percent by volume
Carbonated HA 85 47
Water 12 20
Protein and lipid
3 33
The proteins in enamel are primarily a very thin covering of the individual
crystals and comprise approximately half of the organic material. While lipid is the
other half of the organic material in enamel (Nelson et al., 1987). Dentine has a similar
mineral composition, although the carbonate content is much higher, the mineral is
much more soluble, and a large component of the tissue is collagen type I with about
10% of the protein comprised of a range of non-collagenous proteins (McCormack et
al., 1995).
2.2.2 Dental Caries and Detection Methods
A tooth cavity is an oral disease that comes from plaque bacteria. Dental plaque
(bacteria) that present in and around the teeth for period of time will produce acids that
lead to dental cavities. Dental cavity is a transmissible infectious disease but can be
prevented by noticing the presence of cavities in the mouth. Frequent ingestion of
sweets and low saliva flows is the cause of the development of cavities in the presence
of dental plaque.

10
Researchers have suggested evidence that lead to caries detection process where
numerous modifiers tending to push the mineral equilibrium in one direction to another,
i.e. towards remineralisation or demineralisation (Holt et al., 2001). The modifiers of
this system are well known and are summarised in Table 2.2 with Fig. 2.2 presenting an
overview of the dynamics of the caries process.
Table 2.2. Risk and modifying factors for caries (Adapted from Iain et al., 2006)
Primary risk factors Saliva 1 Ability of minor salivary glands to produce saliva 2 Consistency of unstimulated (resting) saliva 3 pH of unstimulated saliva 4 Stimulated salivary flow rate 5 Buffering capacity of stimulated saliva
Diet 6 Number of sugar and acid exposure per day
Fluoride 7 Past and current exposure
Oral 9 Differential staining
10 Composition 11 Activity Modifying factors 12 Past and current dental status 13 Past and current medical status 14 Compliance with oral hygiene and dietary advice 15 Lifestyle and socioeconomic status

11
Figure 2.2: Demineralisation and remineralisation cycle for enamel caries (Adapted
from Iain et al., 2006)
Critical pH of HA
Critical pH of FA
pH 6.8 6.0 5.5 5.0 4.5 4.0 3.5 3.0
Production of HA and FA Calcium & Phosphate in
saliva
Demineralisation Dissolution of HA FA forms if fluoride available Remineralisation FA reforms
Acid dissolution of crystal
8.0 6.8 6.0 5.5 5.0 4.5 4.0 3.5 3.0
Formulation of calculus
Remineralisation Demineralisation Caries
Erosion
HA is hydroxyapatite FA is flurorapatite
The diagnosis methods for dental caries are based upon the measurement of a
physical signal – these are surrogate measures of the caries process. Examples of the
physical signals that can be used in this way include X-rays, visible light, laser light,
electronic current, ultrasound, and possibly surface roughness (Pretty et al., 2004). The
device for dental cavity detection should be able to initiate and receive signal as well
interpret the strength upon signal detection. Table 2.3 demonstrates the physical
principles and the detection methods that have taken advantages of them.
The early detection of dental cavity can help patient to prevent and preserve the
teeth. Practitioners agree that identifying and preventing or treating dental cavity at their
early stages is one of the most important things in dentistry. (Fontana et al., 2010). The
late detection of dental cavity may lead to the continue growing of the lesion that will
destroy the enamel.

12
Table 2.3. Methods of caries detection based on their underlying physical principles
with its advantages and disadvantages. (Modified from literature Angmar et al., 1998;
Iain et al., 2006 )
Physical Principle
Application in caries detection
Advantages Disadvantages
X - rays Digital subtraction radiography
(1)Significantly lower resolution, with potential of 256 grey level
(1)Exposure of radiographic dose to patient Digital image
enhancement
Visible light Fiber optic transillumination (FOTI)
(1)Detection of caries on all surface; useful at proximal lesions (2)Less time needed during diagnosis (3)Economic
(1)The diagnosis is rather subjective due to analysis is based on visually of doctor (2)Training is required to be competent to used the device
Quantitative light-induced fluorescence (QLF)Digital image fiber optic transillumination (DiFOTI)
Laser light Laser fluorescence measurement (DiagnoDent)
(1)Can measure the degree of bacterial activity
(1)Need only to apply on clean and dry teeth only (2)May lead to false reading due to existing of stain and plague on teeth
Electrical current
Electrical conductance measurement
(1)Simple measurement by exploiting the conductivity of lesion and tissue
(1)Surrounding conditions such as temperature and thickness of the teeth may affect result Electrical
impedance measurement
Ultrasound Ultrasonic impedance measurement
(1)Images of tissue can be acquired by collecting the reflected sound wave
(1)Low in sensitivity and specificity when measurement (2)Discriminate between cavitated and non-cavitated inter-proximal lesions

13
2.3 Optical Fiber Technology
Fiber optic was first envisioned as optical elements in yearly 1960s. It was
believed that scientist well acquainted with the microscopic structure of the insect eye
who realized that an appropriate bundle of optical waveguides could be made to transfer
an image and the first application of fiber optic to imaging was conceived. Fiber optic is
made from a glass or plastic, which will carry lights along its length. Fiber optic mostly
is used in telecommunications, which allows transmission of signal over longer
distances and at higher bandwidths (data rates) compared with others method of
communications. The benefit of fiber optic is less loss compare to metal wires and also
immune to electromagnetic interference. Moreover, fiber optic that wrapped in bundles
may used to transmit images, thus allowing viewer to view it in a tight space.
2.3.1 Principles Operation of Fiber Optic
The main theory of the principles operation of wave guidance in fiber optic is
about the total internal reflection inside the fiber optic cable. Theoretically if a light rays
passed from one medium with a refractive index of n1 to another medium with a
refractive index of n2 where n2 is larger than n1 for example air to glass, the refracted
wave in the second medium will bend towards the normal. If n2 is less than n1, the wave
will be bent away from the normal to the surface. However, there is one instance, where
the penetrating ray will not deviate from its original path at all, that is, if it enters the
medium perpendicular to the surface or head on. In the case where n2 is less than n1
there will be a point where an incident where the ray will be totally internally reflected
where it will not enter the second material. There is an angle where the refracted wave
will be placed between the two media and also will not enter the second material, is
called the critical angle θc. This means that all light rays will be reflected at the

14
boundary if all the angles of incidence is greater than the critical angle. The further
increased of incident angle of the ray, the reflected wave is actually turned back into the
first medium, and this achieved the total internal reflection. The critical angle can be
defined by putting θ2 = 90 deg in the Snell’s law of reflection.
(2.1)
(2.2)
Optical fibers are the fiber media that guides the light ray which can be made
from plastic or glass. Since the plastic fibers have more loss and tend to have low
bandwidth so glass fibers are more common to be used. Commonly, fiber is made up of
a core, cladding and a jacket. The core is the centre or the actual fiber where the light
propagates and it has dimensions on the order of 5 to 600 µm. The cladding surrounds
the core and has an index of refraction lower than that of the core, in this way light will
propagate through the core by means of internal reflection. The jacket is surrounding the
cladding and used to protect the entire optical fiber.
2.3.2 Types of Optical Fibers
There are several types of fibers optic used commercially in the areas of
communication, medical and sensors which all the fibers optic are made differently for
their usage. Low attenuation fibers optic is required to maximize spacing of repeaters or
amplifiers in transmission link. In sensor technology, there are two most common
operating classes of fibers optic based on their properties; SMF and MMF. SMF are
classified into three different types of fibers i.e. step index, dispersion-shifted and
15
dispersion-flattened. MMF are grouped into two types; step index and graded-index
fibers.
SMF are most available with step-index profile, which has a higher index of
refraction for the core compared to the cladding. This allows the total internal reflection
to take place at the core/cladding interface. The peak difference in refractive indices of
the core and cladding is estimated around 1 to 20% in this fiber optic. The index
difference determines the numerical aperture of the fiber optic, which in return
determines the amount of light that the fiber optic can be collected from optical source.
The SMF usually has a very small core diameter (5-10µm) and allows only one mode to
propagate effectively in the core.
MMF let the light to propagate in the same wavelength along different ways
through a fiber which causes the waves to arrive at the opposite end of fiber at different
time. These fibers are not common to be used for optical communication but very useful
for sensor application. The major attraction of MMF is due to its relativity easy in
collecting light because of larger core size compared to SMF. Typical numerical
apertures (NA) of this fiber range from 0.2 to 0.4 and their core size diameter usually
ranges from 100µm to 200µm.
The experiment carried out in this research is using the MMF plastic bundled
fiber as the probe to measure the signal from receiving fiber by moving the probe away
from the zero point.

16
2.4 Fiber Optic Sensor in Dentistry
The applications and technology of optical fiber has progressed very rapidly
nowadays; however, they still need further improvement (Angmar et al., 1998). Fiber
optics offers the advantages of flexibility of beam manipulation. The intention of fiber
optic based sensor is due to the safe, rapid and non-invasive testing method of clinically
relevant physiological variables. Furthermore the advantages includes electrical
isolation, physical flexibility and needless of electrical power for driving sensor unit.
Researchers find application in designing customized probes that are tailored for
specific applications (Jeon et al., 2003).
Iain et al. suggest enhancing the visual techniques using the fiber optic sensor
technology (Iain et al., 2006). The basic of visual inspection of carries is based upon the
phenomenon of light scattering. The colour of teeth is influenced by the underlying
dental shade where when is normal, visible light, this appear as a whiter area-the so
called white spot. But, when the enamel is disrupted, the penetration photons of light are
scattered which results in an optical disruption. The suggested FOTI takes advantages of
these optical properties of enamel and enhances them by using high intensity white light
that is presented through a small aperture in the form of a dental handpiece. Light is
shone through the tooth and the scattering effect can be seen as shadows in enamel and
dentine. The advantages of this method are the ability to help discriminate between
early enamel and early dentine lesions. Furthermore, it can be used for the detection of
caries on all surfaces and is particularly useful at proximal lesions make it one would
expect this method to be at least as effective as a visual examination.
Milczewski et al. used polymer optical fiber on the measurement of orthodontic
forces (Milczewski et al., 2007). During orthodontic treatment, forces are transferred to
the teeth by using appliances designed to displace teeth a prescribed amount in desired

17
direction. The suggested polymer optical fiber had allow to control the applied forces
where at conventional method too much applied force that displaces a tooth or segment
of teeth may caused permanent damage at periodontal ligament. The researcher
exploited the structured properties of polymer photonic crystal fibers to demonstrate
improved sensitivity to applied pressure and apply it to orthodontic tooth measurement.
Hence, to develop polymer optical fiber optic sensor for measurement of the magnitude
of forces received by a single tooth during orthodontic measurement. Polymer optical
fibers have been used in sensing application and characteristic such as flexibility,
electrical and chemical immunities make them attractive for biomedical sensing (Jiang
et al., 2002).
2.5 Fiber Optic Displacement Sensor (FODS)
Displacement sensors are used wherever it is necessary to acquire the exact
position of two parts that can be moved relatively to one another. Currently, there are
several types of displacement sensors in the market. For instance, optical and magnetic
displacement sensors are used for detecting the amount of a linear displacement in
stages of machine tools and three-dimensional measurement.
In a FODS, two methods are commonly adopted, namely laser interferometry
and reflective intensity modulation techniques. Laser interferometry is based on the
fringe counting method and has high resolution and stability, however it wavelength of
light limit its precision and stability. In contrast, the reflective intensity modulation
technique is much more simple method for non-contact displacement measurements
providing high resolution and stability (Zivanovic et al., 1997).

18
The reflective intensity modulation type of sensor the reflected light from the
target sample is coupled back into a fiber from a reflecting surface and the power is
compared to a portion of the power emitted from the light source. The interest of this
type of sensor in dentistry application due to its simplicity, mobility, small in size, very
low displacement detection limit and ability to perform non-contact measurement.
The main element that used in FODS can be divided into 3 parts, namely, 1) He-
Ne laser, 2) plastic bundled fiber and 3) silicon detector.
2.5.1 Helium-Neon (He-Ne) Laser
A He-Ne laser, is a type of small gas laser. He-Ne laser operates at 632.8nm
wavelength, in the red portion of the visible spectrum make it popular to be used in
industrial and often used in laboratory demonstration of optics. The diagram of He-Ne
laser is shown in Fig. 2.3.
Fig 2.3: Helium-Neon (He-Ne) laser (Adapted from Wikipedia, 2012)
The gain medium of the laser, as referred to its name, is a mixture of helium and
neon gases, in a 5:1 to 20:1 ration, contained at low pressure Helium at 1 torr and Neon
at 0.1 torr in a glass envelope. An electrical discharge through an anode and cathode at
the end of the glass tube with voltage around 1000 volts provided the energy or pump
source to the laser. A current of 5 to 100mA is typical for continuous wave (CW)

19
operation. The optical cavity of the laser typically consists of a plane, high-reflecting
mirror at one end of the laser tube, and a concave output coupler mirror of
approximately 1% transmission at the other end.
The interaction of visible light in the red region of He-Ne laser with hard tissue
modification in dentistry can be described in Table 2.4 (Fried et al., 1995). The
absorption coefficient is about the measurement of the level of absorption occurs in
specific tissue by a specific wavelength of laser light. The visible light in the red region
of He-Ne laser can be considered as low absorption rate compared to others visible light
(Featherstone et al., 2001). From the table also, it can be seen that at the green end of
visible light, the scattering coefficient in enamel is relatively high and this reduces
towards the red. The absorption and scattering coefficient must be taken into account
when determining displacement properties of the sensor.
Table 2.4. Selected optical properties of dental hard tissue (Adapted from Featherstone
et al., 2001)
Wavelength
Absorption
coefficient, cm‐1
Scattering
coefficient, cm‐1
Enamel Dentine Enamel Dentine
543nm (green) <1 3‐4 105 280
632nm (red) <1 3‐4 60 280

20
2.5.2 Plastic Bundled Fiber
Plastic optical fiber, abbreviated POF, typically uses polymethylmethacrylate
(PMMA), a general purpose resin as the core material, and fluorinated polymers for the
clad material. The structure of POF can be described in Fig. 2.4 where in large diameter,
96% of the cross section is the core that allows light transmission. The POF consider as
consumer fibers where the cost of POF, associated optical links, connectors and
installation costs are low. POF is having much larger core diameter compared to others
fiber as shown in Fig. 2.5. Most POF used 1000µm in diameter, with a core diameter of
980µm. Due to this large diameter, transmission is possible even if the ends of the fiber
are slightly soiled or damages, or if the light axis is slightly off centre. As a result, a part
such as optical connector is made cheaper and easy to be installed.
Fig. 2.4: Structure of plastic optical fiber (POF)
Fig. 2.5: Size of plastic optical fiber (POF) compared to other types of fiber

21
POF is strong and very difficult to bend and within 25mm radius bending the
loss is very small. Due to that, it can be installed within walls or other narrow areas and
suitable for lighting in tight locations. Furthermore the installation is simple and easy
for beginner users. Normally, a red 650 nm light emitting diode (LED) is used as the
light source. Since the light source is within the visible light spectrum, users can protect
the eyes from directly viewing the light beam.
For sensing applications, the POF is normally bundled together to form a
bundled fiber. This bundled fiber can be classified into several types such as pair and
concentric types. This bundled fiber will be used in this experiment.

22
2.5.3 Silicon Detector
As for its name, silicon is used as the detector due to the moderate band gap of
the semiconductor is 1.12eV when compared to the thermal energy at room temperature
of kT = 1/40eV. The energy to create an electron-hole pair is 3.6eV, compared to the
ionization energy of 15eV in Argon gas, leading to an ionization yield for minimum
ionizing particles of about 80 electron-hole (E-H) pairs per micron. Thus, about 23000
E-H pairs are produced in the customary wafers thickness of 30µm, and collected in
about 30ns without a gain stage.
The wafers are normally n-type with a high resistivity of about 5kΩ-cm and with
a low-resistivity p-implant in form of pads, strips or pixels to create junction. With a
reverse bias of less than 100V, the detectors can then be fully depleted such that only
the thermally generated current contributes to the leakage current. The area of the
detectors are limited to the standard wafer sizes used in high-resistivity processing by
industry, which has increased the wafer size recently. Larger area detectors are now
routinely made by assembling and wire bonding several detectors into so-called ladders,
with fairly ling readout strips.
The silicon detector is used in this experiment to detect and measure the power
of the visible light. The detectors convert the photon intensity to the voltage. The lock-
in amplifier is also used together with the silicon detector in the conducted experiment.

23
CHAPTER 3
PERFORMANCE CHARACTERISTICS OF FIBER OPTIC DISPLACEMENT
SENSOR (FODS) ON REAL TEETH
3.1 Introduction
FODS are commonly constructed from plastic multimode optical fibers, which
offer benefit of low optical signal transmission loss, low production cost, compact size
and compatibility with optical fiber technology. These sensors engineering have been
used in branches of science and engineering, as it is evident from the range of properties
which has been sensed optically, ranging from light intensity, vibration, temperature,
pressure, strain, liquid level, pH, chemical analysis, concentration, density, refractive
index of liquids, teeth colorimeter and etc (Harun et al., 2011; Patil et al., 1997). The
parameter of performance for FODS is depend on blind region, linear range, sensitivity
and the peak position of optically sensed object (Patil et al., 2011).
Early studies approached the use of optical fiber sensors in medical is an
empirical fashion, while at the same time demonstrating the potential of this technology
to have a real effect in clinical industry. Rahman et al. (Rahman et al., 2011) proposed
a simple intensity modulated displacement sensor for sensing salinity based on different
concentration of sodium chloride (NaCI) in de-ionized water. While, Hong, et al.
(Hong et al., 1988) has suggested a novel type of fiber optic displacement pressure
transducer that has its pressure sensitive membrane and shows that this new type of
pressure transducer is much more better that conventional transducer.

24
In this chapter, a simple design of a FODS is demonstrated using a multimode
plastic fiber bundled based on reflective intensity modulation technique. The
performances of this sensor are investigated by correlating the detector output with
different reflectivity properties of hybrid composite resin teeth, artificial teeth and real
teeth. The simplicity of the design, high degree of sensitivity, dynamic range and the
low cost of the fabrication make it suitable for dentistry application.
3.2 Experimental Setup
Fig. 3.1 shows the schematic diagram of the experimental set-up for the fiber
optic sensor to detect axial displacement with mirror and different type of teeth. The
sensor consists of a fiber optic transmitter, mechanical chopper, fiber optic probe,
mirror or different type of teeth, a silicon photo detector, lock-in amplifier and
computer. The fiber optic probe is made of two 2 m long PMMA which consists of one
transmitting core of 1mm in diameter and 16 receiving cores of 0.25mm in diameter,
numerical aperture 0.5, core refractive index 1.492 and cladding refractive index 1.402.
A red He-Ne laser (λ=633nm) is used as the light source with an average output power
of 5.5mW, beam diameter of 0.8mm and beam divergence of 1.01mRads. Laser diode
(λ=785nm) has a collimated output beam with 2.4 x 3.4 mm in beam diameter and
output power of 20mW is also used as another light source in this experiment. This two
laser is used due to investigate which light source is the most suitable at human teeth
when is used as the target sample.

25
Fig. 3.1: Schematic experimental setup for displacement sensor using fiber bundled
probe and teeth samples
The photodetector is a high speed silicon photodiode with an optical response
which extends from 400 to 1100 nm, making it compatible with a wide range of visible
light including the 633 nm visible red He-Ne lasers used in this set up. The light source
is modulated externally by a chopper with a frequency of 113Hz as to avoid the
harmonics from the line frequency which is about 50 to 60 Hz. The modulated light
source is used in conjunction with a lock-in amplifier to reduce the dc drift and
interference of ambient stray light.
The displacement of the fiber optic probe is achieved by mounting it on a
micrometer translation stage, which is rigidly attached to a vibration free table. Light
from the fiber optic transmitter (peak wavelength at 633nm) is coupled into the
transmitting fiber. The signal from the receiving fiber is measured by moving the probe
away from the zero point, where the reflective fiber is measured by moving the probe
away from the zero point, where the reflective surface of samples and the probe are in
Laser
Chopper
Driver
Silicon
Detector
Lock‐in
Amplifier
Computer
(display)
Transmitting fiber Receiving fiber
Bundled
probe
Teeth samples
Mechanical chopper
26
close contact. The signal from the detector is converted to voltage and is measured by a
lock-in amplifier and computer via RS232 using a Delphi software.
Mirror is used as the control sample while the other teeth samples are used
consecutively as the reflecting target while measuring the output intensity by changing
the position of the fiber optic probe from 0 to 4.6 mm in a step 50µm. The displacement
profiles of the teeth samples are compared with a flat mirror due to its 100% reflectivity.

27
3.3 Results and Discussions
Fig. 3.2 shows the comparison of output voltage between He-Ne laser and laser
diode against displacement on the human teeth sample. All results exhibit increasing at
the front slope until it reached peak position and decrease at back slope when further
displacement is increased. He-Ne laser shows more gradually increasing on the output
voltage as the displacement is increased. In contrast, laser diode show less increasing on
the output voltage as the displacement is increased. From the front slope until it reached
to the peak position, the increasing output voltage value starts from 0.765mV until
1.050mV for He-Ne laser and 0.700mV until 0.7500mV for laser diode respectively.
Fig. 3.2: Comparison of voltage output between Helium-Neon (He-Ne) laser and laser
diode against displacement.

28
Table 3.1 summarize the features of the fiber optic displacement at the front
slope for He-Ne laser and laser diode. The sensitivity of the sensor is determined by a
slope of straight line portion of the curves. The peak voltage and sensitivity for He-Ne
laser and laser diode are obtained at 1.05mV and 0.8214mV/mm and 0.76mV and
0.1929mV/mm respectively. Furthermore, Featherstone et al. based on fundamental
laser interaction with dental hard tissue mentioned that visible light towards red, in this
case He-Ne laser is less scattering where He-Ne laser is more reflective compared to the
others light source (Featherstone et al.,2001). Further results and discussion will be
focusing only at He-Ne laser as the light source throughout the experiment.
No
Type of light source
Linear range, mm
Peak voltage, mV
Sensitivity, mV/mm
1 He‐Ne laser 0 ‐ 0.3 1.05 0.8214
2 Laser diode 0 ‐ 0.3 0.76 0.1929
Table 3.1. The features of the fiber optic displacement (front slope) on human teeth
sample for various type of light source.
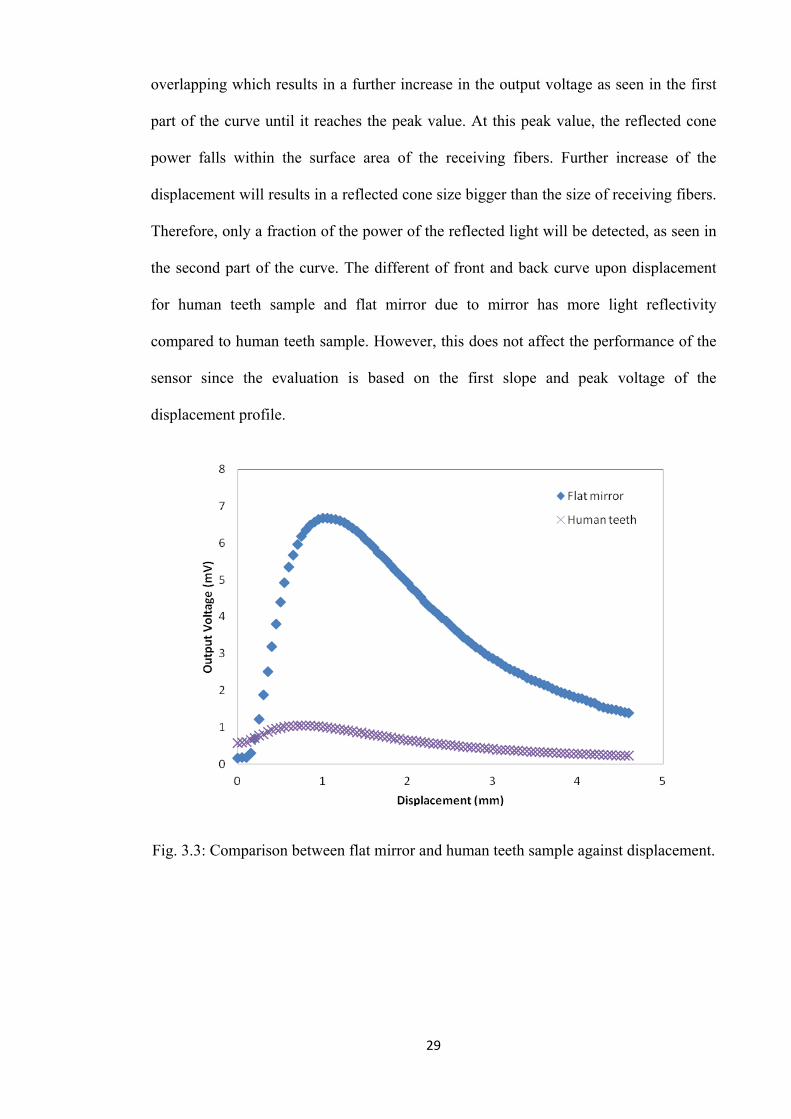
Fig. 3.3 shows the comparison between flat mirror and human teeth sample
against displacement of the sensor. All curves exhibit a gradual and linear increase in
the front slope while back slope follows an almost inverse square law relationship. The
starting output voltage is 0.165mm and 0.565mV for flat mirror and human teeth sample
respectively at the minimum displacement. Since the human teeth in general have a
higher surface roughness and even more uneven than that of a mirror, the observed
curves start at a much higher point compared to flat mirror. When the displacement is
increased, more light will be collected by the receiving cores due to the increased size of
the reflected cone of light. A further increase in the displacement leads to larger
29
overlapping which results in a further increase in the output voltage as seen in the first
part of the curve until it reaches the peak value. At this peak value, the reflected cone
power falls within the surface area of the receiving fibers. Further increase of the
displacement will results in a reflected cone size bigger than the size of receiving fibers.
Therefore, only a fraction of the power of the reflected light will be detected, as seen in
the second part of the curve. The different of front and back curve upon displacement
for human teeth sample and flat mirror due to mirror has more light reflectivity
compared to human teeth sample. However, this does not affect the performance of the
sensor since the evaluation is based on the first slope and peak voltage of the
displacement profile.
Fig. 3.3: Comparison between flat mirror and human teeth sample against displacement.
30
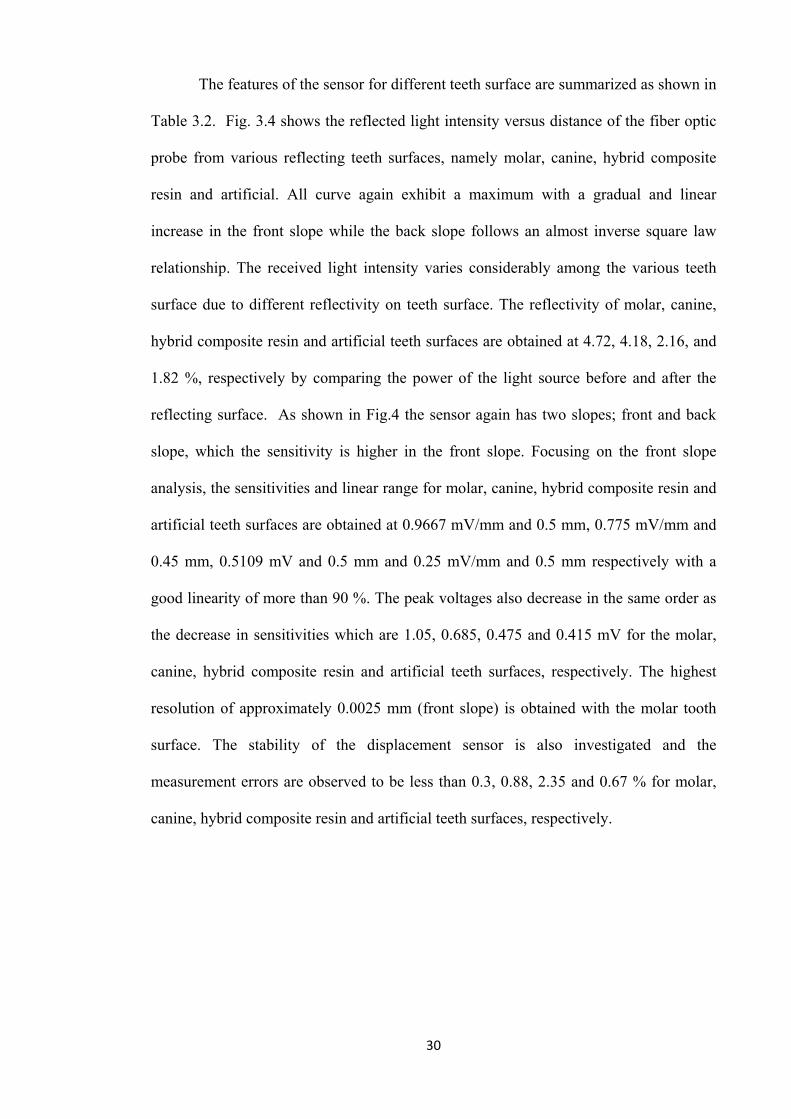
The features of the sensor for different teeth surface are summarized as shown in
Table 3.2. Fig. 3.4 shows the reflected light intensity versus distance of the fiber optic
probe from various reflecting teeth surfaces, namely molar, canine, hybrid composite
resin and artificial. All curve again exhibit a maximum with a gradual and linear
increase in the front slope while the back slope follows an almost inverse square law
relationship. The received light intensity varies considerably among the various teeth
surface due to different reflectivity on teeth surface. The reflectivity of molar, canine,
hybrid composite resin and artificial teeth surfaces are obtained at 4.72, 4.18, 2.16, and
1.82 %, respectively by comparing the power of the light source before and after the
reflecting surface. As shown in Fig.4 the sensor again has two slopes; front and back
slope, which the sensitivity is higher in the front slope. Focusing on the front slope
analysis, the sensitivities and linear range for molar, canine, hybrid composite resin and
artificial teeth surfaces are obtained at 0.9667 mV/mm and 0.5 mm, 0.775 mV/mm and
0.45 mm, 0.5109 mV and 0.5 mm and 0.25 mV/mm and 0.5 mm respectively with a
good linearity of more than 90 %. The peak voltages also decrease in the same order as
the decrease in sensitivities which are 1.05, 0.685, 0.475 and 0.415 mV for the molar,
canine, hybrid composite resin and artificial teeth surfaces, respectively. The highest
resolution of approximately 0.0025 mm (front slope) is obtained with the molar tooth
surface. The stability of the displacement sensor is also investigated and the
measurement errors are observed to be less than 0.3, 0.88, 2.35 and 0.67 % for molar,
canine, hybrid composite resin and artificial teeth surfaces, respectively.

31
Table 3.2. The features of the fiber optic displacement (front slope) for various flat teeth
surfaces.
No Type of teeth and
dimension Linear
range, mm Peak voltage,
mV Sensitivity,
mV/mm Resolution,
mm
1 Molar, 7mm x 7mm 0.05 – 0.5 1.05 0.9667 mV/mm 0.0025
2 Canine, 6mm x
7mm 0.05 – 0.45 0.685 0.775 mV/mm 0.0067
3 Hybrid composite resin, 9mm x 9mm
0 – 0.5 0.475 0.5109 mV/mm 0.0053
4 Artificial, 8mm x
10mm 0 – 0.5 0.415 0.25 mV/mm 0.0084
Fig 3.4: Variation of output voltage against displacement using He-Ne laser.

32
CHAPTER 4
FIBER OPTIC DISPLACEMENT SENSOR (FODS) FOR DETECTING TEETH
SURFACE DEFECT THAT SIMULATE DENTAL CAVITIES
4.1 Introduction
In dentistry, a successful restorative procedure depends strongly on the precise
mapping of the shape of dental cavities. Impressional methods are often used for that
purpose (Jung et al., 2010; Rao et al., 2010) but the impression material might suffer
from shape and size deformity during the course of mapping, copying and storage,
leading to defects in the process. Visualization of the surface topography may help in
the estimation of the quality of the mapping process. X-ray is one is one of the main
method used for visualization in clinical practice (Nakata et al., 2006; Vandenberghe et
al., 2010; Zabler et al., 2007). However, it involves relatively high doses of ionizing
radiation which will have a negative impact on the healthy and safety of both dental
patients and practitioners.
Optical methods are non-ionizing and hence have potential clinical applications
(Jones, Huynh et al., 2003; Shimamura et al., 2011; Wilder-Smith et al., 2009) QLF and
optical coherence tomography (OCT) are among the optical techniques receiving much
attention and are discussed in detail by Huysmans et al (Huysmans et al., 2011). QLF
uses specific wavelength of light to induce the fluorescence of the surface of the tooth.
The surface that contains cavity appears to be darker due to the increased scattering of
incident light which makes the cavity identifiable. However, QLF are rarely being used
in private clinical practice due to its high unit cost and the complex operation involved
(Rochlen et al., 2011). OCT on the other hand uses near infrared lights that are able to

33
generate high resolution images of enamel samples but often hindered by the difficulty
of performing in vivo studies and positioning of the probe (Schlueter et al., 2011).
The aim of this experiment is to develop a novel non-destructive imaging tools
for an intensity modulated FODS visualization of teeth surface defect due to dental
cavities and apply it for the determination of cavity shape and size. In our approach,
various teeth surfaces, namely molar, canine, hybrid composite resin and artificial
contains a machine drilled hole that simulate dental cavity. These types of sensors are
inexpensive and simple to operate, hence opening the feasibility for enhancements in
restorative dentistry to a wider international community.
4.2 Experimental Setup
Fig. 4.1 shows a schematic diagram for the axial displacement measurement
using a multimode plastic fiber bundled with different type of tooth sample namely,
molar, canine, hybrid composite resin and artificial. The FODS consists of a fiber optic
transmitter, mechanical chopper, multimode plastic fiber optic bundled probe, a silicon
photodetector, lock-in amplifier and a computer. The multimode plastic fiber is used
due to the ease of alignment between the light and the fiber. The MMF probe is a
commercial step index fiber coupler having a 980µm core made of PMMA, surrounded
by a 10µm layer of fluorinated polymer acting as the cladding with numerical aperture
is closed to 0.5. A red He-Ne laser (λ=633 nm) is used as the light source with an
average output of 5.5 mW, beam diameter of 0.8 mm and beam divergence of 1.01
mRads. The photodetector is a high speed silicon photodiode with an optical response
extending from 400 to 1100 nm, making it compatible with a wide range of visible light
including the 633 nm visible red He-Ne lasers used in this experiment. The red He-Ne
laser is modulated externally using a chopper at a frequency of 113 Hz as to avoid the

34
harmonics from the line frequency which is about 50 to 60 Hz. The modulated light
source is used in conjunction with a lock-in amplifier to reduce the dc drift and
interference of ambient stray light.
Fig. 4.1: Set-up for the imaging and detection of enamel tooth surface defect using fiber
optic displacement sensor (FODS)
The displacement from the tooth sample is achieved by mounting it on a
micrometer translation stage, which is rigidly attached to a vibration free table due to
keep the laser and optic fiber free from outside vibration. The signal from the receiving
fiber is measured by moving the probe away from the zero point, where the flat
reflective surface of teeth samples and the probe are in close contact. The output light is
then sent into the silicon phtotodetector and the electrical signal is then sent into the
lock-in amplifier together with the reference signal of the mechanical chopper. The
output results from the lock-in amplifier are then connected to a computer through a
RS232C port interface and the signals are processed using Delphi Software.
A red
He‐Ne Laser
Chopper
driver
Silicon
Detector
Lock‐in
Amplifier
Computer (data processing and
display)
Transmitting fiber Receiving fiber
Bundled
probe
Tooth sample
Holder
x‐y‐z micrometer stage
Mechanical chopper

35
In this experiment, the displacement of the bundled probe from the reflecting
surfaces is done in steps of 0.05 mm. The probe is consequently fixed (z axis) within the
linear range of displacement curve (as from chapter 3 results) and the intensity of the
collected light as a function of lateral movement (x and y axis) of the tooth surface is
recorded while being maintained in perpendicular and constant in axial position (z axis).
Flaws are introduced in each of teeth samples by drilling holes that simulate dental
cavities which will led to enamel surface defect. In order to use this system diameter
quantification of the enamel tooth surface defect, we exploit the difference in the
reflected light between the flawed and unflawed region. The experiment is carried out
with minimum successive steps of 0.5mm for each of the tooth surface. Lastly, the raw
data are processed and transformed into two-dimensional (2D) and three-dimensional
(3D) images using Matlab and used for the detection of the tooth cavity. The experiment
is repeated using all four different types of teeth surfaces. Due to the time constraint the
experiment was conducted one time for each teeth sample.

36
4.3 Results and Discussions
The performance of the FODS on sensitivity, linear range, peak voltage and
stability was discussed in Chapter 3. Based on the linear range from Chapter 3, the
recorded tooth surface was being maintained in perpendicular and constant in axial
position (z axis). Further results and discussion in Chapter 4 will be focused on imaging
of tooth surface prior to detection of enamel tooth surface defect.
2D and 3D imaging of the various teeth surface profiles were required by
scanning the teeth surface at various lateral positions at a fixed distance of 0.25mm
between the fiber probe and teeth surface. The fixed distance was selected from the
linear range discussed in Chapter 3. Fig. 4.2 (a) shows 2D and 3D views of the flawed
molar surface, which was obtained by 27 x 27 lines of scanning along the row axis and
column axis. The recorded signal from the flawed region is much more significantly
reduced in amplitude than the surrounding region which occurs as results of a reduction
in the reflected signal at that particular region. The intensity of the reflected light from
the tooth surface depends upon the surface texture of the tooth and standoff distance
between the surface and fiber tip. Thus, smaller reflected signal amplitude is expected.
The experiment is then repeated for canine, hybrid composite resin and artificial
surfaces with results as shown in Figs. 4.2(b), 2(c) and 2(d).

37
(a)
(b)
(c)

38
(d)
Fig. 4.2: 2D and 3D surface profile of the (a) molar, (b) canine, (c) hybrid composite
resin and (d) artificial surface showing a clear difference in the reflected signal between
the flawed and unflawed tooth region.
The figures clearly show the difference in reflected amplitudes between the
flawed region and the surrounding region, again verifying the detection capabilities of
the FODS on a enamel tooth surface. Fig. 4.3 shows the measured reflected signal taken
along the same axis of a flawed and unflawed canine surface. The region of interest
marked by the circle demonstrates the clear difference in the reflected signal between
them. The diameter of the flaw is measured based on the total lateral displacement
starting from the first occurrence of disparity in the reflected signals and ends with the
coincidence of the signals. Taking into account the distance for each displacement
which is 0.5 mm, the diameter is measured to be 2.5 mm, which is exactly the same
value when measured with a micrometer. By using the same approach, the diameter of
the surface defect in the molar, hybrid composite resin and artificial surfaces are
obtained to be 2.0, 2.5 and 2.0 mm, respectively, as summarized in Table 4.1.

39
Fig 4.3: Variation of output voltage against position of flawed and unflawed canine
surface.
Table 4.1. Diameter measurement of the flaw on the tooth surface using the fiber optic
displacement sensor (FODS) and micrometer.
No Type of tooth
surface
Micrometer measurements
(mm)
FODS measurements
(mm)
1 Molar 2.0 2.0
2 Canine 2.5 2.5
3 Hybrid composite
resin 2.5 2.5
4 Artificial 2.0 2.0

40
The results indicate the capability of implementation of the displacement sensor
for the imaging and detection of enamel tooth surface defect. In order to cater for high
resolution requirements, additional computer vision techniques and algorithms need to
be implemented for the matching computations at each position of the output disparity.
The threshold for then output disparity need to be clearly defined based on extensive
analysis of a larger amount of data with higher sampling rate.

41
CHAPTER 5
CONCLUSION
A simple design of a FODS is demonstrated using teeth samples as the light
reflective target. He-Ne laser is more suitable to be used as the light source compared to
laser diode due to its less scattering behaviour on dental hard tissue. The difference in
displacement response, sensitivity, and peak voltage on teeth samples are investigated.
The sensitivity is decreased upon the decreasing of peak voltage of each voltage with
good linearity of over 90%. The simplicity of the designed sensor will help future
researchers to use the properties of displacement for further investigation of dental hard
tissue properties.
A fiber optic sensor is introduced as a novel non-destructive method for
quantitative imaging and measurement of tooth surface defect that simulate dental
cavity in a non-contact mode. The sensor is based on intensity modulation technique
and uses a multimode plastic bundled fiber as a probe and He-Ne laser as the light
source. The feasibility of the sensor to identify teeth surface defect on different types of
teeth has been demonstrated. While, the results are still some way from clinical
applications, they demonstrate the possibility to detect tooth cavity in a safe and non-
invasive manner compared to conventional method such as x-rays. Furthermore, they
are particularly beneficial in the estimation of the quality of the impressional mapping
methods currently used in restorative dentistry.
In future, the real surface defect teeth due to dental cavity should be used as the
sample to investigate on the proposed sensor. In addition, the proposed sensor may also
be used for teeth surface imaging of the teeth that is useful in the aesthetics fields.

42
BIBLIOGRAPHY
Advances in Biophotonics. (2005). Amsterdam, , NLD: IOS Press.
Angmar-Månsson, B. E., al-Khateeb, S., & Tranaeus, S. (1998). Caries diagnosis.
Journal of dental education, 62(10), 771-780.
Featherstone, J. D. B., & Fried, D. (2001). Fundamental Interactions of Laserswith
Dental Hard Tissues. [doi: 10.1078/1615-1615-00022]. Medical Laser
Application, 16(3), 181-194.
Fontana, M., Young, D. A., Wolff, M. S., Pitts, N. B., & Longbottom, C. (2010).
Defining Dental Caries for 2010 and Beyond. [doi: 10.1016/j.cden.2010.03.007].
Dental Clinics of North America, 54(3), 423-440.
Fried, D., Glena, R. E., Featherstone, J. D. B., & Seka, W. (1995). Nature of light
scattering in dental enamel and dentin at visible and near-infrared wavelengths.
Appl. Opt., 34(7), 1278-1285.
Harun, S., Rahman, H., Saidin, N., Yasin, M., & Ahmad, H. (2011). FIBER OPTIC
DISPLACEMENT SENSOR FOR TEMPERATURE MEASUREMENT.
Sensors Journal, IEEE, PP(99), 1-1.
Harun, S. W., Yang, H. Z., Yasin, M., & Ahmad, H. (2010). Theoretical and
experimental study on the fiber optic displacement sensor with two receiving
fibers. Microwave and Optical Technology Letters, 52(2), 373-375. doi:
10.1002/mop.24900
Helium-Neon Laser. (5 January 2012) Retrieved 2012, 2012, from
http://en.wikipedia.org/wiki/Helium%E2%80%93neon_laser
Holt, R. D. (2001). Advances in dental public health. Primary dental care : journal of
the Faculty of General Dental Practitioners (UK), 8(3), 99-102.
Hong, L., Prohaska, O. J., & Nara, A. R. (1988, 4-7 Nov. 1988). Fiber-optic transducer
for blood pressure measurements. Paper presented at the Engineering in

43
Medicine and Biology Society, 1988. Proceedings of the Annual International
Conference of the IEEE.
Huysmans, M. C. D. N. J. M., Chew, H. P., & Ellwood, R. P. (2011). Clinical Studies of
Dental Erosion and Erosive Wear. Caries Research, 45(Suppl. 1), 60-68.
Iain A, P. (2006). Caries detection and diagnosis: Novel technologies. [doi:
10.1016/j.jdent.2006.06.001]. Journal of Dentistry, 34(10), 727-739.
Jensen, J. C., Li, J. K. J., & Sigel, G., Jr. (1989, 9-12 Nov 1989). A fiber optic angular
sensor for biomedical applications. Paper presented at the Engineering in
Medicine and Biology Society, 1989. Images of the Twenty-First Century.,
Proceedings of the Annual International Conference of the IEEE Engineering in.
Jeon, R. J., Mandelis, A., & Abrams, S. H. (2003). Depth profilometric case studies in
caries diagnostics of human teeth using modulated laser radiometry and
luminescence. Review of Scientific Instruments, 74(1), 380-383.
Jiang, C., Kuzyk, M. G., Ding, J.-L., Johns, W. E., & Welker, D. J. (2002). Fabrication
and mechanical behavior of dye-doped polymer optical fiber. Journal of Applied
Physics, 92(1), 4-12.
Jones, R., Huynh, G., Jones, G., & Fried, D. (2003). Near-infrared transillumination at
1310-nm for the imaging of early dental decay. Optical. Express, 11(18), 2259-
2265.
Jung, B.-Y., & Lee, K.-W. (2010). Alternative impression technique for multiple
abutments in difficult case to control. Journal Advanced Prosthodont, 2(1), 1-3.
McCormack, S. M., Fried, D., Featherstone, J. D., Glena, R. E., & Seka, W. (1995).
Scanning electron microscope observations of CO2 laser effects on dental
enamel. Journal of dental research, 74(10), 1702-1708.
Milczewski, M. S., Martelli, C., Canning, J., Stevenson, M., Simoes, J., & Kalinowski,
H. (2007, 24-27 June 2007). Measurement of orthodontic forces using polymer

44
PCF. Paper presented at the Optical Internet, 2007 and the 2007 32nd Australian
Conference on Optical Fibre Technology. COIN-ACOFT 2007. Joint
International Conference on.
Nakata, K., Naitoh, M., Izumi, M., Inamoto, K., Ariji, E., & Nakamura, H. (2006).
Effectiveness of Dental Computed Tomography in Diagnostic Imaging of
Periradicular Lesion of Each Root of a Multirooted Tooth: A Case Report.
Journal of endodontics, 32(6), 583-587.
Nelson, D. G. A., & Featherstone, J. D. B. (1982). Preparation, analysis, and
characterization of carbonated apatites. Calcified Tissue International, 34(Suppl.
2), S69-S81.
Nelson, D. G. A., Featherstone, J. D. B., Duncan, J. F., & Cutress, T. W. (1983). Effect
of carbonate and fluoride on the dissolution behaviour of synthetic apatites.
Caries Research, 17(3), 200-211.
Patil, S. S., & Shaligram, A. D. Modeling and experimental studies on retro-reflective
fiber optic micro-displacement sensor with variable geometrical properties. [doi:
10.1016/j.sna.2011.10.006]. Sensors and Actuators A: Physical(0).
Pretty, I. A., & Maupomé, G. (2004). A closer look at diagnosis in clinical dental
practice: Part 1. Reliability, validity, specificity and sensitivity of diagnostic
procedures. Journal of the Canadian Dental Association, 70(4), 251-255b.
Rahman, H. A., Harun, S. W., Yasin, M., & Ahmad, H. (2011). Fiber Optic Salinity
Sensor Using Fiber Optic Displacement Measurement With Flat and Concave
Mirror. Selected Topics in Quantum Electronics, IEEE Journal of, PP(99), 1-1.
Rao, S., Chowdhary, R., & Mahoorkar, S. (2010). A Systematic Review of Impression
Technique for Conventional Complete Denture. The Journal of Indian
Prosthodontic Society, 10(2), 105-111. doi: 10.1007/s13191-010-0020-2

45
Rochlen, G. K., & Wolff, M. S. (2011). Technological Advances in Caries Diagnosis.
Dental clinics of North America, 55(3), 441-452.
Schlueter, N., Hara, A., Shellis, R. P., & Ganss, C. (2011). Methods for the
Measurement and Characterization of Erosion in Enamel and Dentine. Caries
Research, 45(Suppl. 1), 13-23.
Shimamura, Y., Murayama, R., Kurokawa, H., Miyazaki, M., Mihata, Y., & Kmaguchi,
S. (2011). Influence of tooth-surface hydration conditions on optical coherence-
tomography imaging. J Dent, 39(8), 572-577.
Thomas P. Gilbert, M., Rudbeck, L., Willerslev, E., Hansen, A. J., Smith, C., Penkman,
K. E. H., et al. (2005). Biochemical and physical correlates of DNA
contamination in archaeological human bones and teeth excavated at Matera,
Italy. [doi: 10.1016/j.jas.2004.12.008]. Journal of Archaeological Science,
32(5), 785-793.
Vandenberghe, B., Jacobs, R., & Bosmans, H. (2010). Modern dental imaging: a review
of the current technology and clinical applications in dental practice. European
Radiology, 20(11), 2637-2655. doi: 10.1007/s00330-010-1836-1
Wilder-Smith, C. H., Wilder-Smith, P., Kawakami-Wong, H., Voronets, J., Osann, K.,
& Lussi, A. (2009). Quantification of Dental Erosions in Patients With GERD
Using Optical Coherence Tomography Before and After Double-Blind,
Randomized Treatment With Esomeprazole or Placebo. Am J Gastroenterol,
104(11), 2788-2795.
Zabler, S., Cloetens, P., & Zaslansky, P. (2007). Fresnel-propagated submicrometer x-
ray imaging of water-immersed tooth dentin. Opt. Lett., 32(20), 2987-2989.
46
Zhang, K., Butler, C., Yang, Q., & Lu, Y. (1997). A fiber optic sensor for the
measurement of surface roughness and displacement using artificial neural
networks. Instrumentation and Measurement, IEEE Transactions on, 46(4), 899-
902.
Zivanovic, S., Elazar, J., & Tomic, M. (1997, 14-17 Sep 1997). Fiber-optic
displacement sensor. Paper presented at the Microelectronics, 1997.
Proceedings., 1997 21st International Conference on.