adjusting ite’s trip generation handbook for urban...
TRANSCRIPT
THE JOURNAL OF TRANSPORT AND LAND USE http://jtlu.org. 8 . 1 [2015] pp. 5– 29
Adjusting ITE’s Trip Generation Handbook for urban context
Kelly J. Cliftona Kristina M. Curransb
Portland State University Portland State University
Christopher D. Muhsc
Portland State University
Abstract: This study examines the ways in which urban context affects vehicle trip generation rates across three land uses. An intercept travel survey was administered at 78 establishments (high-turnover restaurants, convenience markets, and drinking places) in the Portland, Oregon, region during 2011. This approach was developed to adjust the Institute of Transportation Engineers (ITE) Trip Generation Handbook vehicle trip rates based on built environment characteristics where the establishments were located. A number of policy-relevant built environment measures were used to estimate a set of nine models predicting an adjustment to ITE trip rates. Each model was estimated as a single measure: activity density, num-ber of transit corridors, number of high-frequency bus lines, employment density, lot coverage, length of bicycle facilities, presence of rail transit, retail and service employment index, and intersection density. All of these models perform similarly (Adj. R2 0.76-0.77) in estimating trip rate adjustments. Data from 34 additional sites were collected to verify the adjustments. For convenience markets and drinking places, the adjustment models were an improvement to the ITE’s handbook method, while adjustments for restaurants tended to perform similarly to those from ITE’s estimation. The approach here is useful in guiding plans and policies for a short-term improvement to the ITE’s Trip Generation Handbook. The measures are useful for communities seeking to develop local adjustments to vehicle trip rate estimates, and all could be calculated from spatial data available in most locations. The paper concludes with a discussion on what long-term improvements to the ITE’s Trip Generation Handbook might entail, with further implications in planning and practice.
[email protected], [email protected], [email protected]
Copyright 2015 Kelly J. Clifton, Kristina M. Currans, and Christopher D. Muhshttp://dx.doi.org/10.5198/jtlu.2015.378ISSN: 1938-7849 | Licensed under the Creative Commons Attribution – NonCommercial License 3.0.
The Journal of Transport and Land Use is the official journal of the World Society for Transport and Land Use (WSTLUR) and is published and sponsored by the University of Minnesota Center for Transportation Studies.
1 Introduction
The Institute of Transportation Engineers (ITE) Trip Generation Handbook (Institute of Transporta-tion Engineers 2004) and Trip Generation: An ITE Informational Report (Institute of Transportation Engineers 2008)1 began collecting data on vehicle trip rates in the 1960s and focused on single-use, vehicle-oriented trip rates in suburban sites in the United States. Despite its widespread use, the ITE Trip Generation Handbook lacks the supporting information to apply these rates across a range of ur-ban contexts. Today, there is national interest in building an evidentiary database that supports the estimation of trip generation for site-level analysis in transportation impact assessments (TIAs) for new developments located in urbanized areas that support multimodal transportation options such as infill locations, transit-oriented developments (TODs), or mixed-use developments (Lee et al. 2011, Daisa et al. 2009). For locations that support greater non-automobile mode shares, ITE recommends that local 1 For the remainder of this paper, ITE’s Trip Generation Handbook will refer to both the handbook and the accompanying informational report.
6 JOURNAL OF TRANSPORT AND LAND USE 8.1
rates be established via data collection: “If the site is located in a downtown setting, served by significant public transportation...the site is not consistent with the ITE data” (Institute of Transportation Engi-neers 2004). ITE acknowledges the limitations of the Trip Generation Handbook dataset in the omission of transit, non-motorized transportation facilities, mixed-land uses, and density but currently offers little guidance on how to address these shortcomings.
Planners are challenged to plan for the transportation impacts of infill, mixed use, and TODs with-out adequate evidenced-based guidance. Many jurisdictions have to balance the warnings on the limited applicability of the rates given in the ITE Trip Generation Handbook and the expense and effort involved in collecting local data (Nelson\Nygaard Consulting Associates 2005, E. Lerner-Lam et al. 1992, Badoe 2000, Fleet and Sosslau 1976). Despite evidence that a more compact urban form, access to transit, and a greater mix of uses generates fewer and shorter vehicle trips, local governments are often compelled to use current ITE trip generation rates to evaluate transportation impacts and calculate transportation system development charges. The expense of collecting local data, combined with the lack of alterna-tive sources of information or empirically tested methods may lead to the application of the ITE’s Trip Generation Handbook in areas outside the scope of its guidelines for use.
When analysts ignore the impacts of transit, pedestrian infrastructure, bicycle facilities, and urban settings on vehicle trip generation, vehicle trips may be vastly overestimated. High vehicle trip estimates increase the amount of vehicle-oriented development, necessitating other automobile priority measures. More vehicle use, greater capacity, abundant parking supply, faster travel times, and fewer automobile alternatives are all related to overestimating vehicle trip rates. Further, developers may be hesitant to lo-cate new developments in infill or TOD areas because of the increased impact from fees that may result from the overestimation of vehicle trips (Cervero and Arrington 2008, Ewing et al. 2011).
Alternatively, some communities rely on the application of adjustments to the ITE rates for differ-ent contexts (e.g., a 10 percent reduction in ITE rates in areas with high-frequency transit service) (Vir-ginia Department of Transportation 2010, City of San Diego 1998, City of Rockville 2011). However, these reductions are sometimes derived without empirical basis and applied arbitrarily. In these cases, “rule-of-thumb” adjustments may lead to the under-estimation of vehicle trips, which can lead to the undersupply of automobile infrastructure, potentially resulting in inadequate parking, congestion and delay. Thus, accurate estimation of vehicle trips for new development is important for both short-term accommodation of transportation system users as well as planning for the maturity of urban develop-ments over the long term.
To remedy this need, this paper presents a methodology to adjust the ITE Trip Generation Hand-book rates to better reflect the relationship between land use, transportation, and travel demand for specific land-use types located in various urban settings. The project collected data (using counts and intercept surveys) on person and vehicle trip rates for a limited number of land-use types (restaurants, 24-hour convenience markets, and drinking places). These new trip rates were compared to the ITE rates for the same land-use category and establishment size, and from this a set of models for adjusting the ITE rates as a function of built environment attributes was estimated and verified using additional data collected from establishments at other locations. Although developed from a limited number of land-use types using data collected in the Portland, Oregon, metropolitan area, the findings punctuate the need for adjustment of the ITE trip rates for infill and urban contexts; the analysis points to the key built environment attributes that can be used to define context; and the models provide a replicable ap-proach that can be expanded to other locations and other land-use types.
The remainder of this paper is organized as follows. The next section summarizes the state of the practice in how communities are estimating vehicle trip rates for different urban contexts. This is followed by a description of data collected in this study. The methods, the model estimation results,
7Adjusting ITE’s Trip Generation Handbook for Urban Context
and verification are presented. Finally the implications for planning and practice are discussed in the conclusions.
2 Literature review
The ITE Trip Generation Handbook, and accompanying Informational Report, is the most commonly referenced and utilized practical guideline for predicting vehicle trip rates during the development pro-cess. ITE also recommends using an approach developed by JHK and Associates et al. (1996) published in the Trip Generation Handbook (Institute of Transportation Engineers 2004) that reduces vehicle trip generation for locations in closer proximity to transit with supportive land uses, i.e., greater density, higher floor-to-area ratios, and available pedestrian and cycling facilities. This report was published as a draft and is only presented in the Trip Generation Handbook to provide guidance; it does not provie reductions based on context. The ITE has also supported Gard’s approach (2007) for adjusting trip rates for assessing the impacts of transit-oriented developments.
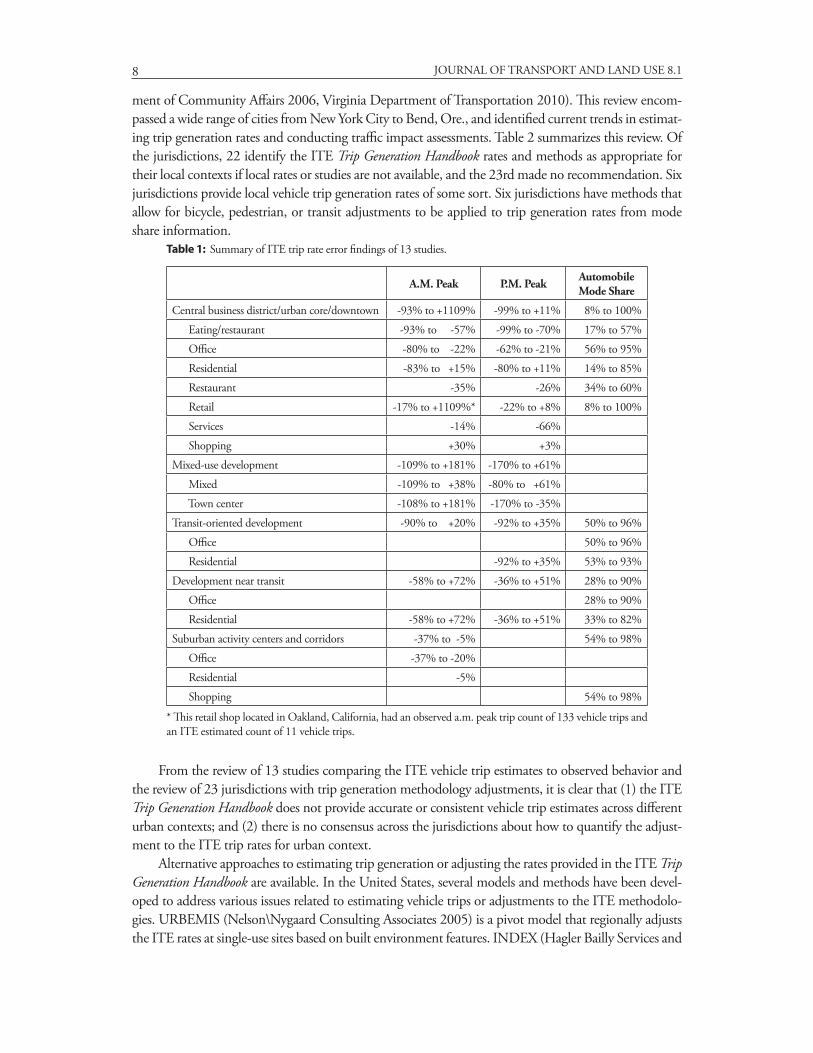
Several studies have already been performed to compare the ITE predicted vehicle trip rates to observed trip rates. Existing research has examined the differences between observed trip rates and the ITE predicted rates through comparison of the ITE predicted rates to observations at a particular type of urban context or development. The studies reviewed compared the ITE predictions to sites in mixed-use development, TOD, development near transit, urban-core areas, and suburban activity centers. To evaluate these studies together, we have summarized the results of 13 studies performed between 1987 and 2011 (Cervero 1993, Cervero and Arrington 2008, Colorado/Wyoming ITE Section Technical Committee–Trip Generation 1987, Dill 2008, Fehr and Peers 2008, Hooper 1989, Jeihani and Camilo 2009, Kimley-Horn and Associates 2009, Lapham 2001) in Table 1. The error reported within the table indicates the mismatch between observations and the corresponding ITE trip generation estimate. A positive number means observed vehicle traffic was greater than the ITE estimate, and a negative num-ber means fewer vehicles were observed than estimated by the ITE method.
The greatest range of error in ITE’s estimation of vehicle trips occurred in central business district/urban core/downtown areas, followed by mixed-use development. Error occurred both in over- and under-estimating vehicle traffic for retail and residential uses. Dining, office, and service uses all had actual vehicle trip rates below the ITE estimated rates.
The automobile mode share is provided in Table 1 for studies that counted person trips and calcu-lated persons taking a vehicle. The central business district/urban core/downtown area shows the largest range of automobile mode share. But sites in suburban activity centers and corridors contain a substan-tial range: automobile mode shares were observed to be as small as 54 percent. Places with substantial non-automobile mode shares further highlight the inapplicability of the ITE vehicle trip rate estimates in urban contexts, as the ITE method accounts for vehicle travel and does not address person trip rates. Many jurisdictions, however, have acknowledged the shortcomings and developed local adjustments to the ITE estimated vehicle trips in their own transportation planning policies.
To summarize the state of the practice of the ITE rate adjustment, we reviewed 23 jurisdictional guidelines for local adjustment from around the United States and Canada (Baltimore City Department of Transportation 2007, Bedford County Department of Planning 2004, Charlotte Department of Transportation 2006, City of Bellingham 2012, City of Bend 2009, City of Henderson 2009, City of Los Angeles Department of Transportation 2010, City of Mississauga 2008, City of Pasadena 2005, City of Rockville 2011, City of Salem 1995, City of San Diego 1998, City of Sedro-Woolley 2004, City of Vancouver 2010, Georgia Regional Transportation Authority 2002, Harris County, Texas, 1991, Montgomery Planning 2010, New York City, 2010, San Diego Municipal Code 2003, San Francisco Planning Department 2002, Southern New Hampshire Planning Commission 2010, Flordia Depart-
8 JOURNAL OF TRANSPORT AND LAND USE 8.1
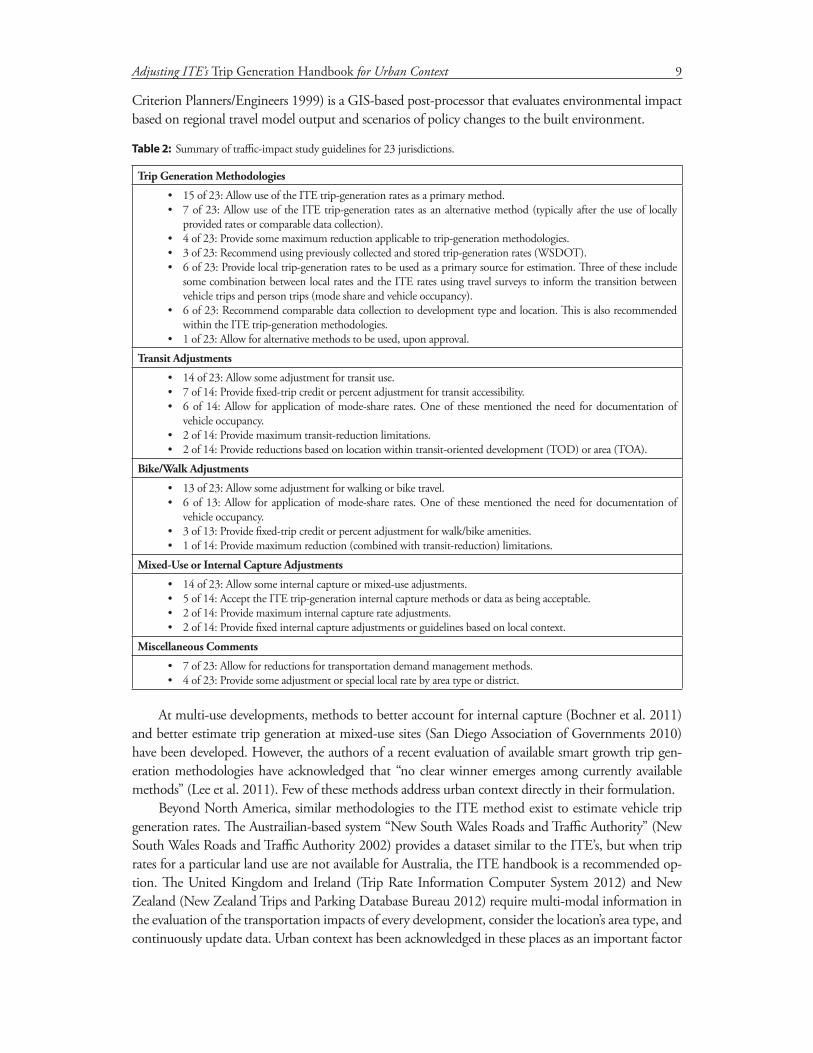
ment of Community Affairs 2006, Virginia Department of Transportation 2010). This review encom-passed a wide range of cities from New York City to Bend, Ore., and identified current trends in estimat-ing trip generation rates and conducting traffic impact assessments. Table 2 summarizes this review. Of the jurisdictions, 22 identify the ITE Trip Generation Handbook rates and methods as appropriate for their local contexts if local rates or studies are not available, and the 23rd made no recommendation. Six jurisdictions provide local vehicle trip generation rates of some sort. Six jurisdictions have methods that allow for bicycle, pedestrian, or transit adjustments to be applied to trip generation rates from mode share information.
From the review of 13 studies comparing the ITE vehicle trip estimates to observed behavior and the review of 23 jurisdictions with trip generation methodology adjustments, it is clear that (1) the ITE Trip Generation Handbook does not provide accurate or consistent vehicle trip estimates across different urban contexts; and (2) there is no consensus across the jurisdictions about how to quantify the adjust-ment to the ITE trip rates for urban context.
Alternative approaches to estimating trip generation or adjusting the rates provided in the ITE Trip Generation Handbook are available. In the United States, several models and methods have been devel-oped to address various issues related to estimating vehicle trips or adjustments to the ITE methodolo-gies. URBEMIS (Nelson\Nygaard Consulting Associates 2005) is a pivot model that regionally adjusts the ITE rates at single-use sites based on built environment features. INDEX (Hagler Bailly Services and
Table 1: Summary of ITE trip rate error findings of 13 studies.
A.M. Peak P.M. Peak Automobile Mode Share
Central business district/urban core/downtown -93% to +1109% -99% to +11% 8% to 100%
Eating/restaurant -93% to -57% -99% to -70% 17% to 57%
Office -80% to -22% -62% to -21% 56% to 95%
Residential -83% to +15% -80% to +11% 14% to 85%
Restaurant -35% -26% 34% to 60%
Retail -17% to +1109%* -22% to +8% 8% to 100%
Services -14% -66%
Shopping +30% +3%
Mixed-use development -109% to +181% -170% to +61%
Mixed -109% to +38% -80% to +61%
Town center -108% to +181% -170% to -35%
Transit-oriented development -90% to +20% -92% to +35% 50% to 96%
Office 50% to 96%
Residential -92% to +35% 53% to 93%
Development near transit -58% to +72% -36% to +51% 28% to 90%
Office 28% to 90%
Residential -58% to +72% -36% to +51% 33% to 82%
Suburban activity centers and corridors -37% to -5% 54% to 98%
Office -37% to -20%
Residential -5%
Shopping 54% to 98%
* This retail shop located in Oakland, California, had an observed a.m. peak trip count of 133 vehicle trips and an ITE estimated count of 11 vehicle trips.
9Adjusting ITE’s Trip Generation Handbook for Urban Context
Criterion Planners/Engineers 1999) is a GIS-based post-processor that evaluates environmental impact based on regional travel model output and scenarios of policy changes to the built environment.
At multi-use developments, methods to better account for internal capture (Bochner et al. 2011) and better estimate trip generation at mixed-use sites (San Diego Association of Governments 2010) have been developed. However, the authors of a recent evaluation of available smart growth trip gen-eration methodologies have acknowledged that “no clear winner emerges among currently available methods” (Lee et al. 2011). Few of these methods address urban context directly in their formulation.
Beyond North America, similar methodologies to the ITE method exist to estimate vehicle trip generation rates. The Austrailian-based system “New South Wales Roads and Traffic Authority” (New South Wales Roads and Traffic Authority 2002) provides a dataset similar to the ITE’s, but when trip rates for a particular land use are not available for Australia, the ITE handbook is a recommended op-tion. The United Kingdom and Ireland (Trip Rate Information Computer System 2012) and New Zealand (New Zealand Trips and Parking Database Bureau 2012) require multi-modal information in the evaluation of the transportation impacts of every development, consider the location’s area type, and continuously update data. Urban context has been acknowledged in these places as an important factor
Table 2: Summary of traffic-impact study guidelines for 23 jurisdictions.
Trip Generation Methodologies
• 15 of 23: Allow use of the ITE trip-generation rates as a primary method. • 7 of 23: Allow use of the ITE trip-generation rates as an alternative method (typically after the use of locally
provided rates or comparable data collection).• 4 of 23: Provide some maximum reduction applicable to trip-generation methodologies.• 3 of 23: Recommend using previously collected and stored trip-generation rates (WSDOT).• 6 of 23: Provide local trip-generation rates to be used as a primary source for estimation. Three of these include
some combination between local rates and the ITE rates using travel surveys to inform the transition between vehicle trips and person trips (mode share and vehicle occupancy).
• 6 of 23: Recommend comparable data collection to development type and location. This is also recommended within the ITE trip-generation methodologies.
• 1 of 23: Allow for alternative methods to be used, upon approval.
Transit Adjustments
• 14 of 23: Allow some adjustment for transit use.• 7 of 14: Provide fixed-trip credit or percent adjustment for transit accessibility.• 6 of 14: Allow for application of mode-share rates. One of these mentioned the need for documentation of
vehicle occupancy.• 2 of 14: Provide maximum transit-reduction limitations.• 2 of 14: Provide reductions based on location within transit-oriented development (TOD) or area (TOA).
Bike/Walk Adjustments
• 13 of 23: Allow some adjustment for walking or bike travel.• 6 of 13: Allow for application of mode-share rates. One of these mentioned the need for documentation of
vehicle occupancy.• 3 of 13: Provide fixed-trip credit or percent adjustment for walk/bike amenities.• 1 of 14: Provide maximum reduction (combined with transit-reduction) limitations.
Mixed-Use or Internal Capture Adjustments
• 14 of 23: Allow some internal capture or mixed-use adjustments.• 5 of 14: Accept the ITE trip-generation internal capture methods or data as being acceptable.• 2 of 14: Provide maximum internal capture rate adjustments.• 2 of 14: Provide fixed internal capture adjustments or guidelines based on local context.
Miscellaneous Comments
• 7 of 23: Allow for reductions for transportation demand management methods. • 4 of 23: Provide some adjustment or special local rate by area type or district.
10 JOURNAL OF TRANSPORT AND LAND USE 8.1
to consider in the estimatation of vehicle trip generation rates.One critical gap for addressing this issue is the lack of a functional definition of urban contexts.
A vast body of research exists to confirm that various aspects of built environment are significantly related to travel behavior. The Ds of development—measures of density, diversity, design, and distance to transit—have been used most often as individual correlates to levels of automobile use (Cervero and Kockelman 1997, Ewing and Cervero 2001, Lund et al. 2004, Samdahl 2010, Seskin et al. 1996, Dill 2003, Ewing and Cervero 2010). Area types, or urban contexts, represent a number of individual built environment measures taken together to categorize places, and they are also significantly related to levels of automobile travel (Seskin et al. 1996, Dill 2003, Schneider 2011). The literature shows that places in central business district, urban core, and downtown areas tend to have the lowest levels of automobile mode shares and the greatest differences to the ITE rate estimates, but suburban areas are not always as automobile oriented as often assumed (Schneider 2011, Samdahl 2010). However, the issue of defining context in modeling applications is confounded by the high correlation between different measures of the built environment and aggregate indices. To address this, many construct aggregate indices to repre-sent context, which perform better in models, but lack the specificity needed to direct urban policy and tend to be limited in their application beyond the location where they are developed.
In this study, we present an approach to adjust the ITE Trip Generation Handbook rates based on urban context. The models developed here are based on an extensive data collection effort in the Port-land, Ore., region. Adjustment models to the ITE Trip Generation Handbook rates based on context are useful in many ways. Models of this type provide easy-to-use alternatives to the ITE’s Trip Genera-tion Handbook rates and improve upon other alternatives introduced in this literature review. We also contribute an evaluation of the ITE Trip Generation Handbook rates to existing establishments in the Portland region. By focusing on context, built environment measures—both individual measures and combinations of them—can be assessed for impacts on travel behavior to provide a contribution to that body of knowledge. This method also provides a basis for other regions to develop adjustments to the ITE rates based on urban contexts.
3 Data and methods
Data for this study were collected in 2011 from June through early October at 78 sites in the Portland region. Data collection events occurred from 5 p.m. to 7 p.m. on Mondays, Tuesdays, Wednesdays, and Thursdays to better capture evening visitors to bars and restaurants. This time frame includes one hour of the weekday evening peak hour of the facility (5 p.m. to 6 p.m.) consistent with the ITE Trip Generation Handbook. Because of the limited number of sites included in our study, the study controlled for weather conditions by only collecting data on days with no precipitation over the five-month span of data collection. This limitation in data collection has the potential to introduce bias due to a greater number of non-automobile trips that might be taken when there is no precipitation. Typically summer-time data collection is usually avoided in transportation studies because of changes in travel behavior routines that occur with vacation and children being out of school. On the other hand, restaurant and bar total overall trip rates may actually be greater during this season. The ITE currently does not account for weather or seasonal variation in the data it compiles, so it is difficult to compare the impact of our study limitations with the ITE’s data.
3.1 Establishment types and site selection
Land-use types (the ITE’s land use code shown in parentheses) included in this study are: (a) high-turn-over (sit-down) restaurants (LU 932), (b) convenience markets (open 24-hours) without gas stations (LU 851) and (c) drinking places (LU 925). These land uses were selected because they can be found
11Adjusting ITE’s Trip Generation Handbook for Urban Context
in all area types including places where vehicle trip overestimation has proven most problematic: urban infill, mixed-use, and TOD areas.
Establishments were selected based on characteristics of their surrounding built environment. To ensure representation of the establishments located in a broad spectrum of urban environments found in the Portland region, a sample frame was developed from a complete census of business establishments of these land use types from the 2010 referenceUSA database (Infogroup 2011) covering these land-use types over the Portland metropolitan region. For each business establishment in this sample frame, the following built environment characteristics were collected using archived spatial information at a 0.8-kilometer (0.5-mile), straight-line buffer around the business location: intersection density, aver-age block size, percent of dwellings that are single-family detached, percent of retail employment, and percent of lot building coverage. A k-means clustering analysis of these built environment data over the sample frame resulted in five classifications of area-types that roughly corresponded to: central business district neighborhoods; urban core neighborhoods; neighborhood and regional centers; suburban town centers and corridors; and suburban areas. These area types were only used to segment the sample frame of establishments and ensure businesses were recruited from each area type. The cluster types were not used in the subsequent statistical analysis or estimation of adjustment models.
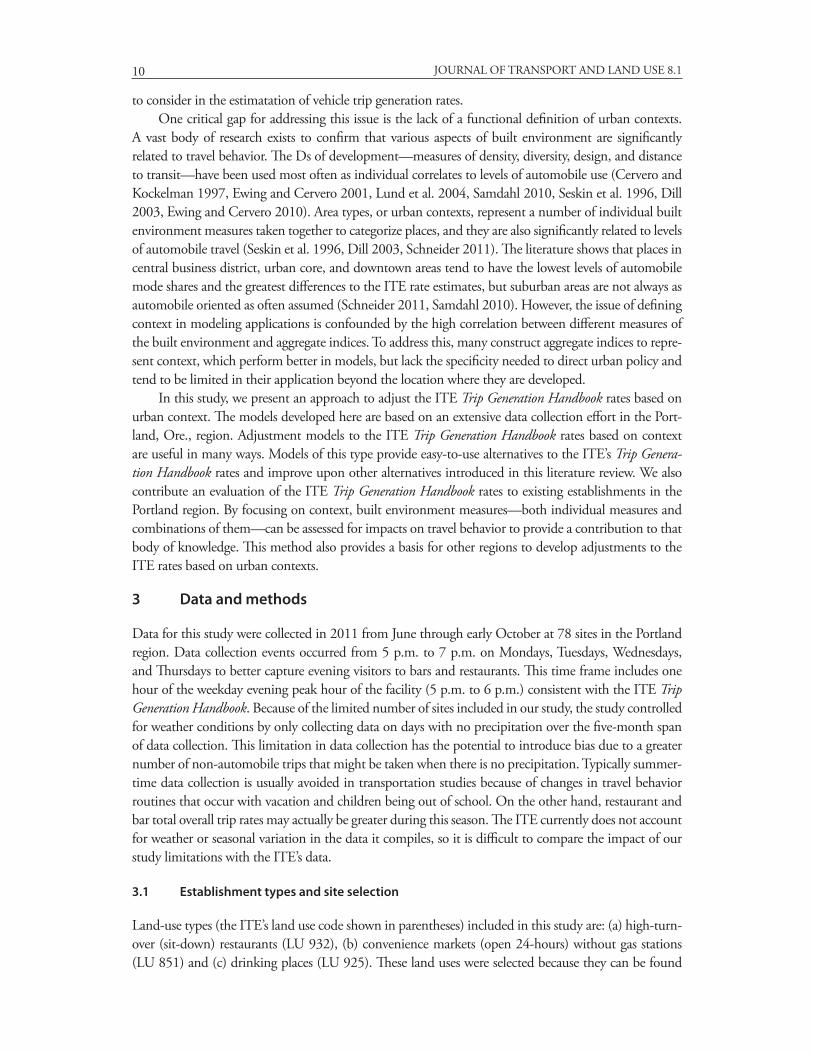
This sample frame segmented by area type was used to recruit business establishments to partici-pate in the study. Business managers were contacted by mail and follow-up telephone call. The result-ing sample of 78 establishments is shown in Figure 1. Establishments in more dense and mixed-use areas were over-sampled to ensure sufficient representation in the dataset, as we hypothesized that these locations were likely to have fewer vehicle trips. Information on business square footage was collected directly from business managers where possible, and using regional building information data (RLIS) or estimating using the building footprint (for single-story establishments) from Google Earth.
Most establishments in the study are regionally owned and operated franchises. Local establish-ments were more willing to participate in the study than national corporate franchises. As such, most were under 3,000-square-feet gross floor area and may cater to a different market segment than patrons of national chains. This is one limitation of the study; on the other hand, these are more typical of the size and type of establishments that may choose to locate in infill developments.
Figure 1: Site location map.
12 JOURNAL OF TRANSPORT AND LAND USE 8.1
3.2 Site visitor surveys
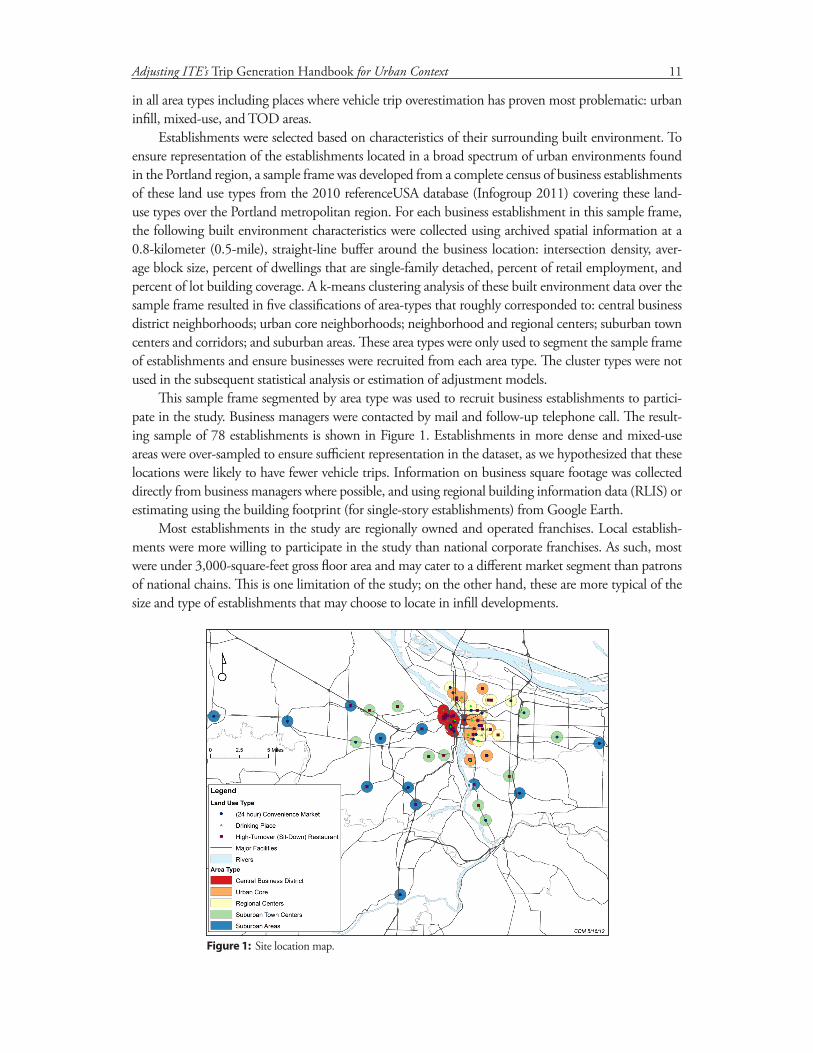
Visitor intercept surveys were administered to visitors as they left the establishment or site. A five-minute survey was administered using an electric handheld tablet (Clifton et al. 2012). A shorter survey was administered for those initially refusing the tablet survey. Key information collected from both survey instruments included travel mode(s), vehicle occupancy and home location. An average of 24 surveys was collected at each of the 78 establishments, for a total of 1884 surveys. The overall response rate was 52 percent for all surveys. More detail on sample size is provided in Table 3.
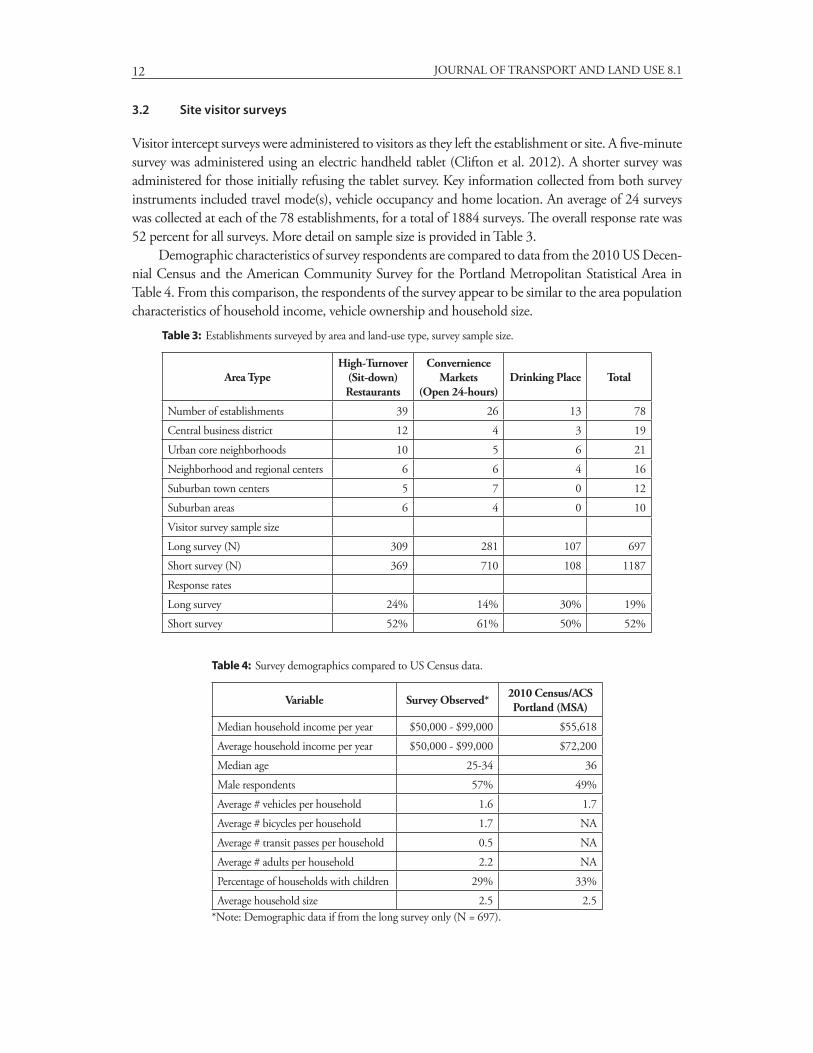
Demographic characteristics of survey respondents are compared to data from the 2010 US Decen-nial Census and the American Community Survey for the Portland Metropolitan Statistical Area in Table 4. From this comparison, the respondents of the survey appear to be similar to the area population characteristics of household income, vehicle ownership and household size.
Table 3: Establishments surveyed by area and land-use type, survey sample size.
Area TypeHigh-Turnover
(Sit-down) Restaurants
Convernience Markets
(Open 24-hours)Drinking Place Total
Number of establishments 39 26 13 78
Central business district 12 4 3 19
Urban core neighborhoods 10 5 6 21
Neighborhood and regional centers 6 6 4 16
Suburban town centers 5 7 0 12
Suburban areas 6 4 0 10
Visitor survey sample size
Long survey (N) 309 281 107 697
Short survey (N) 369 710 108 1187
Response rates
Long survey 24% 14% 30% 19%
Short survey 52% 61% 50% 52%
Table 4: Survey demographics compared to US Census data.
Variable Survey Observed* 2010 Census/ACS Portland (MSA)
Median household income per year $50,000 - $99,000 $55,618
Average household income per year $50,000 - $99,000 $72,200
Median age 25-34 36
Male respondents 57% 49%
Average # vehicles per household 1.6 1.7
Average # bicycles per household 1.7 NA
Average # transit passes per household 0.5 NA
Average # adults per household 2.2 NA
Percentage of households with children 29% 33%
Average household size 2.5 2.5*Note: Demographic data if from the long survey only (N = 697).
13Adjusting ITE’s Trip Generation Handbook for Urban Context
3.3 Person and vehicle counts
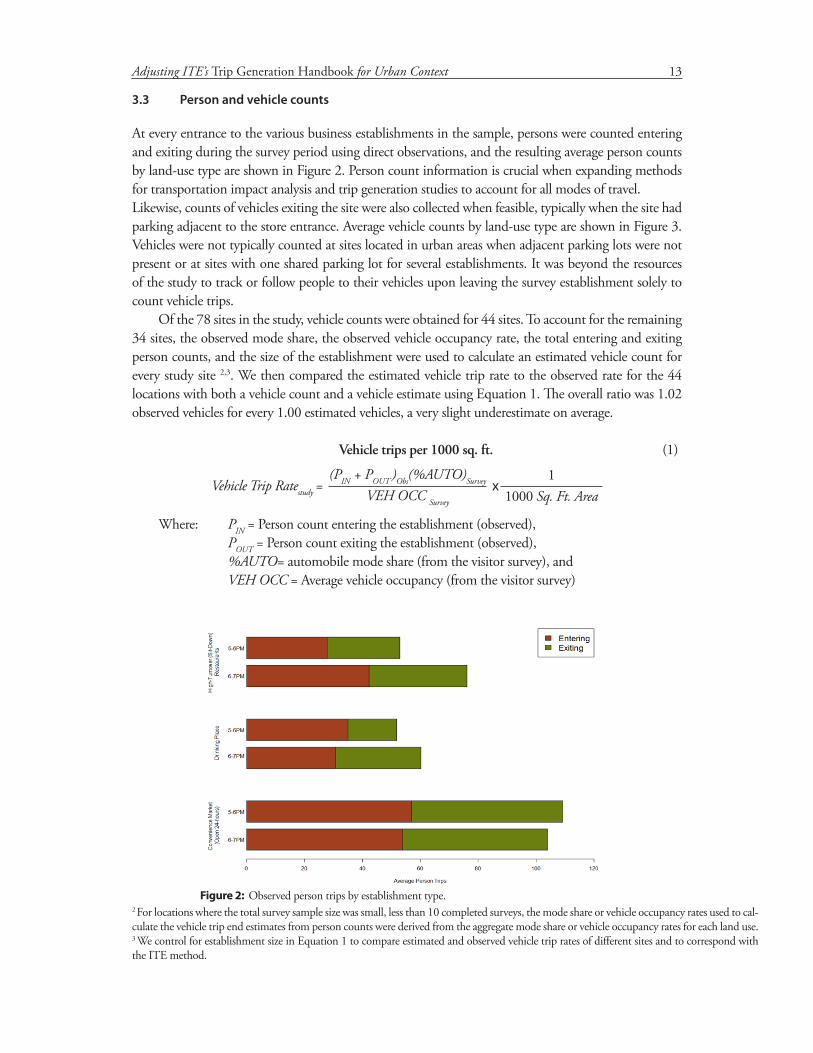
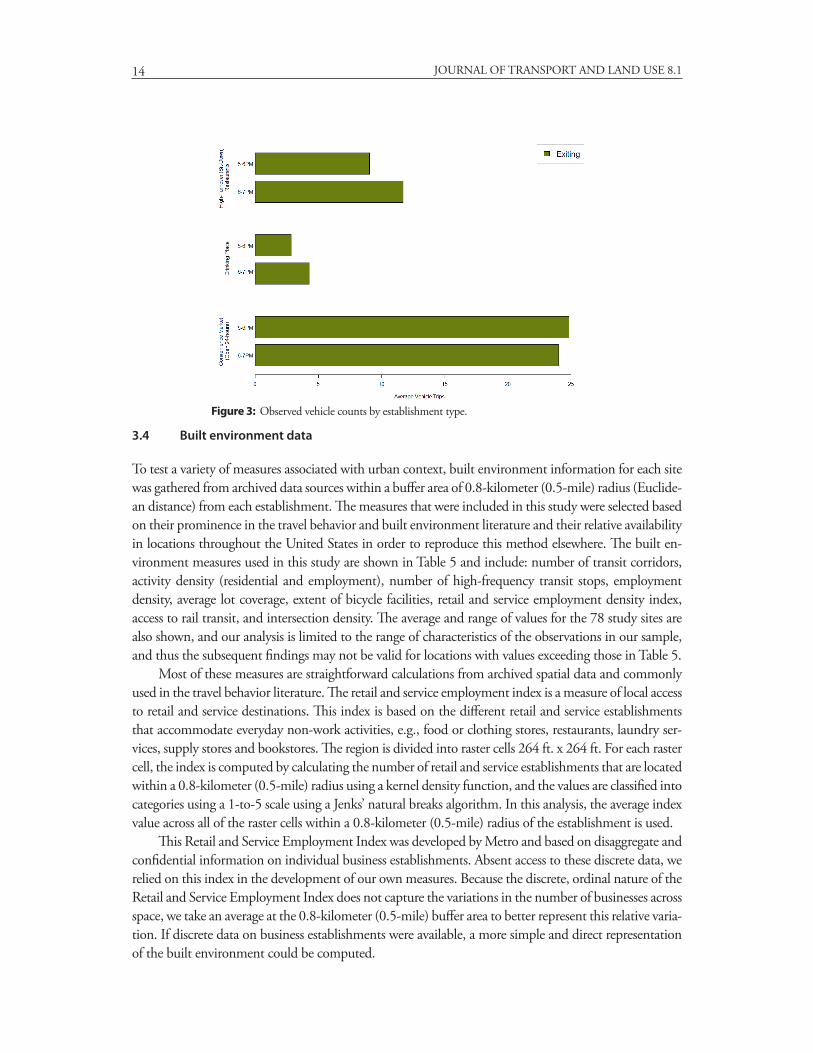
At every entrance to the various business establishments in the sample, persons were counted entering and exiting during the survey period using direct observations, and the resulting average person counts by land-use type are shown in Figure 2. Person count information is crucial when expanding methods for transportation impact analysis and trip generation studies to account for all modes of travel. Likewise, counts of vehicles exiting the site were also collected when feasible, typically when the site had parking adjacent to the store entrance. Average vehicle counts by land-use type are shown in Figure 3. Vehicles were not typically counted at sites located in urban areas when adjacent parking lots were not present or at sites with one shared parking lot for several establishments. It was beyond the resources of the study to track or follow people to their vehicles upon leaving the survey establishment solely to count vehicle trips.
Of the 78 sites in the study, vehicle counts were obtained for 44 sites. To account for the remaining 34 sites, the observed mode share, the observed vehicle occupancy rate, the total entering and exiting person counts, and the size of the establishment were used to calculate an estimated vehicle count for every study site 2,3. We then compared the estimated vehicle trip rate to the observed rate for the 44 locations with both a vehicle count and a vehicle estimate using Equation 1. The overall ratio was 1.02 observed vehicles for every 1.00 estimated vehicles, a very slight underestimate on average.
Vehicle trips per 1000 sq. ft. (1)
Where: PIN = Person count entering the establishment (observed), POUT = Person count exiting the establishment (observed), %AUTO= automobile mode share (from the visitor survey), and VEH OCC = Average vehicle occupancy (from the visitor survey)
Vehicle Trip Ratestudy =(PIN + POUT )Obs(%AUTO)Survey
VEH OCC Survey
11000 Sq. Ft. Area
x
Figure 2: Observed person trips by establishment type.2 For locations where the total survey sample size was small, less than 10 completed surveys, the mode share or vehicle occupancy rates used to cal-culate the vehicle trip end estimates from person counts were derived from the aggregate mode share or vehicle occupancy rates for each land use.3 We control for establishment size in Equation 1 to compare estimated and observed vehicle trip rates of different sites and to correspond with the ITE method.
14 JOURNAL OF TRANSPORT AND LAND USE 8.1
3.4 Built environment data
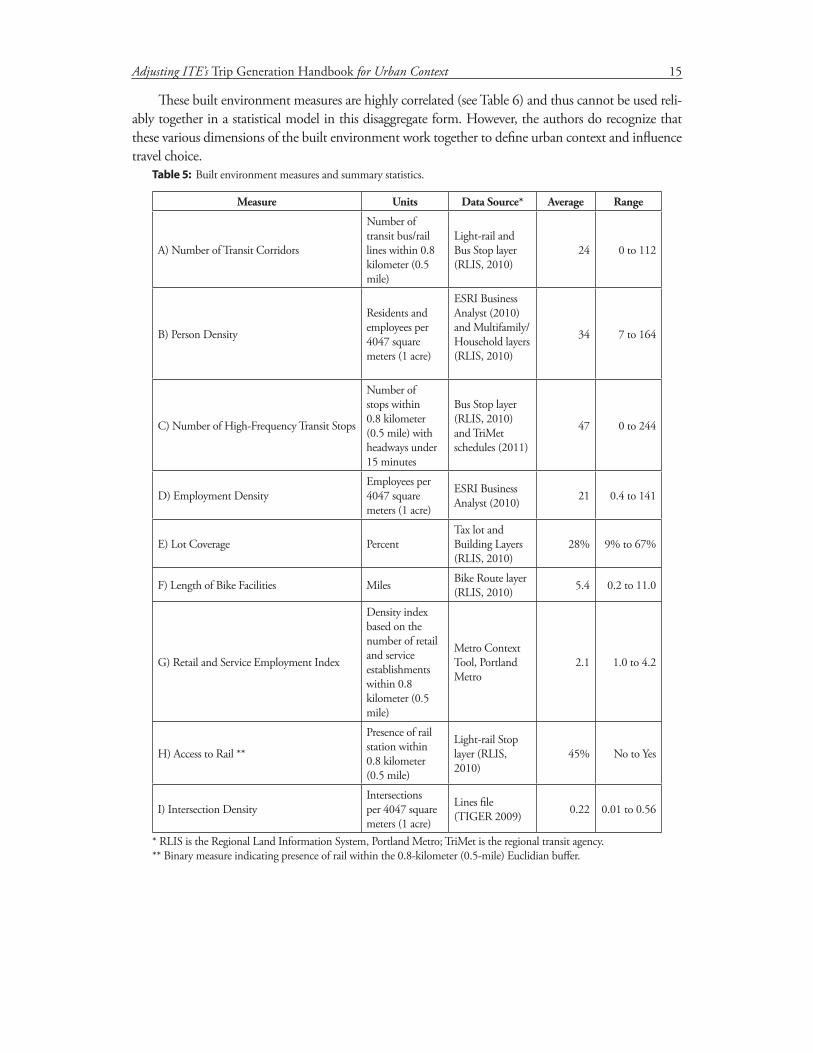
To test a variety of measures associated with urban context, built environment information for each site was gathered from archived data sources within a buffer area of 0.8-kilometer (0.5-mile) radius (Euclide-an distance) from each establishment. The measures that were included in this study were selected based on their prominence in the travel behavior and built environment literature and their relative availability in locations throughout the United States in order to reproduce this method elsewhere. The built en-vironment measures used in this study are shown in Table 5 and include: number of transit corridors, activity density (residential and employment), number of high-frequency transit stops, employment density, average lot coverage, extent of bicycle facilities, retail and service employment density index, access to rail transit, and intersection density. The average and range of values for the 78 study sites are also shown, and our analysis is limited to the range of characteristics of the observations in our sample, and thus the subsequent findings may not be valid for locations with values exceeding those in Table 5.
Most of these measures are straightforward calculations from archived spatial data and commonly used in the travel behavior literature. The retail and service employment index is a measure of local access to retail and service destinations. This index is based on the different retail and service establishments that accommodate everyday non-work activities, e.g., food or clothing stores, restaurants, laundry ser-vices, supply stores and bookstores. The region is divided into raster cells 264 ft. x 264 ft. For each raster cell, the index is computed by calculating the number of retail and service establishments that are located within a 0.8-kilometer (0.5-mile) radius using a kernel density function, and the values are classified into categories using a 1-to-5 scale using a Jenks’ natural breaks algorithm. In this analysis, the average index value across all of the raster cells within a 0.8-kilometer (0.5-mile) radius of the establishment is used.
This Retail and Service Employment Index was developed by Metro and based on disaggregate and confidential information on individual business establishments. Absent access to these discrete data, we relied on this index in the development of our own measures. Because the discrete, ordinal nature of the Retail and Service Employment Index does not capture the variations in the number of businesses across space, we take an average at the 0.8-kilometer (0.5-mile) buffer area to better represent this relative varia-tion. If discrete data on business establishments were available, a more simple and direct representation of the built environment could be computed.
Figure 3: Observed vehicle counts by establishment type.
15Adjusting ITE’s Trip Generation Handbook for Urban Context
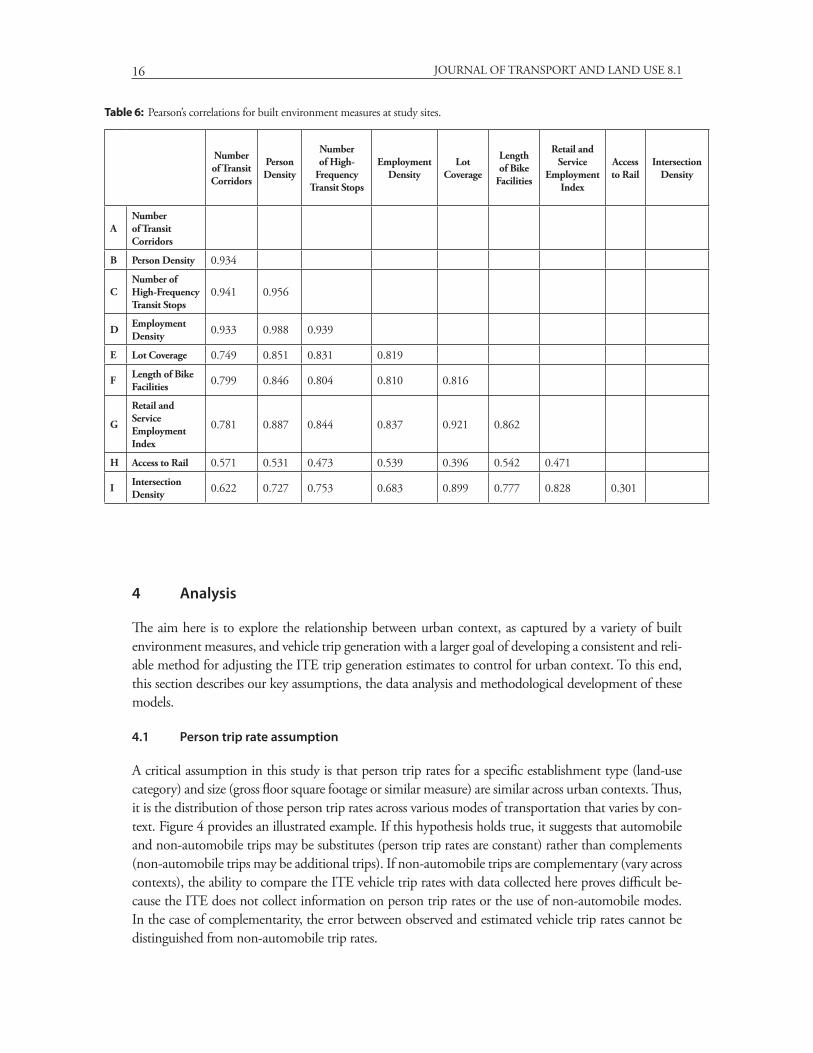
These built environment measures are highly correlated (see Table 6) and thus cannot be used reli-ably together in a statistical model in this disaggregate form. However, the authors do recognize that these various dimensions of the built environment work together to define urban context and influence travel choice.
Table 5: Built environment measures and summary statistics.
Measure Units Data Source* Average Range
A) Number of Transit Corridors
Number of transit bus/rail lines within 0.8 kilometer (0.5 mile)
Light-rail and Bus Stop layer (RLIS, 2010)
24 0 to 112
B) Person Density
Residents and employees per 4047 square meters (1 acre)
ESRI Business Analyst (2010) and Multifamily/Household layers (RLIS, 2010)
34 7 to 164
C) Number of High-Frequency Transit Stops
Number of stops within 0.8 kilometer (0.5 mile) with headways under 15 minutes
Bus Stop layer (RLIS, 2010) and TriMet schedules (2011)
47 0 to 244
D) Employment DensityEmployees per 4047 square meters (1 acre)
ESRI Business Analyst (2010) 21 0.4 to 141
E) Lot Coverage PercentTax lot and Building Layers (RLIS, 2010)
28% 9% to 67%
F) Length of Bike Facilities Miles Bike Route layer (RLIS, 2010) 5.4 0.2 to 11.0
G) Retail and Service Employment Index
Density index based on the number of retail and service establishments within 0.8 kilometer (0.5 mile)
Metro Context Tool, Portland Metro
2.1 1.0 to 4.2
H) Access to Rail **
Presence of rail station within 0.8 kilometer (0.5 mile)
Light-rail Stop layer (RLIS, 2010)
45% No to Yes
I) Intersection DensityIntersections per 4047 square meters (1 acre)
Lines file (TIGER 2009) 0.22 0.01 to 0.56
* RLIS is the Regional Land Information System, Portland Metro; TriMet is the regional transit agency.** Binary measure indicating presence of rail within the 0.8-kilometer (0.5-mile) Euclidian buffer.
16 JOURNAL OF TRANSPORT AND LAND USE 8.1
4 Analysis
The aim here is to explore the relationship between urban context, as captured by a variety of built environment measures, and vehicle trip generation with a larger goal of developing a consistent and reli-able method for adjusting the ITE trip generation estimates to control for urban context. To this end, this section describes our key assumptions, the data analysis and methodological development of these models.
4.1 Person trip rate assumption
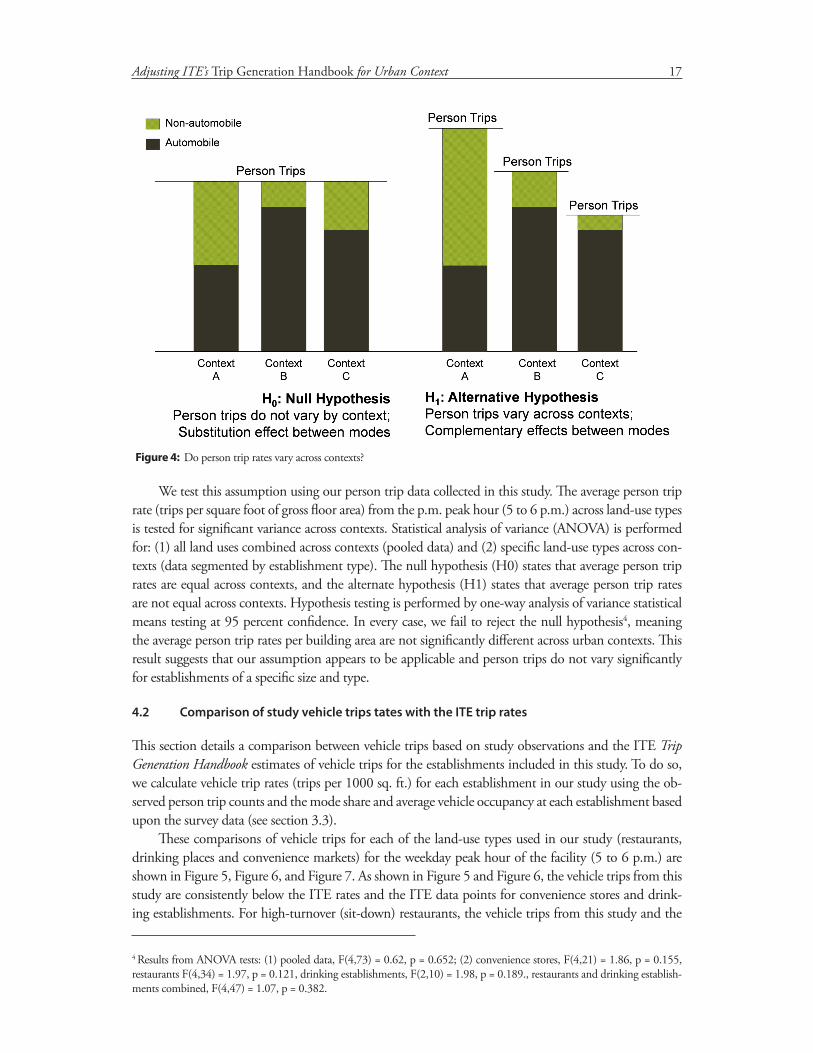
A critical assumption in this study is that person trip rates for a specific establishment type (land-use category) and size (gross floor square footage or similar measure) are similar across urban contexts. Thus, it is the distribution of those person trip rates across various modes of transportation that varies by con-text. Figure 4 provides an illustrated example. If this hypothesis holds true, it suggests that automobile and non-automobile trips may be substitutes (person trip rates are constant) rather than complements (non-automobile trips may be additional trips). If non-automobile trips are complementary (vary across contexts), the ability to compare the ITE vehicle trip rates with data collected here proves difficult be-cause the ITE does not collect information on person trip rates or the use of non-automobile modes. In the case of complementarity, the error between observed and estimated vehicle trip rates cannot be distinguished from non-automobile trip rates.
Table 6: Pearson’s correlations for built environment measures at study sites.
Number of Transit Corridors
Person Density
Number of High-
Frequency Transit Stops
Employment Density
Lot Coverage
Length of Bike
Facilities
Retail and Service
Employment Index
Access to Rail
Intersection Density
ANumber of Transit Corridors
B Person Density 0.934
CNumber of High-Frequency Transit Stops
0.941 0.956
D Employment Density 0.933 0.988 0.939
E Lot Coverage 0.749 0.851 0.831 0.819
F Length of Bike Facilities 0.799 0.846 0.804 0.810 0.816
G
Retail and Service Employment Index
0.781 0.887 0.844 0.837 0.921 0.862
H Access to Rail 0.571 0.531 0.473 0.539 0.396 0.542 0.471
I Intersection Density 0.622 0.727 0.753 0.683 0.899 0.777 0.828 0.301
17Adjusting ITE’s Trip Generation Handbook for Urban Context
We test this assumption using our person trip data collected in this study. The average person trip rate (trips per square foot of gross floor area) from the p.m. peak hour (5 to 6 p.m.) across land-use types is tested for significant variance across contexts. Statistical analysis of variance (ANOVA) is performed for: (1) all land uses combined across contexts (pooled data) and (2) specific land-use types across con-texts (data segmented by establishment type). The null hypothesis (H0) states that average person trip rates are equal across contexts, and the alternate hypothesis (H1) states that average person trip rates are not equal across contexts. Hypothesis testing is performed by one-way analysis of variance statistical means testing at 95 percent confidence. In every case, we fail to reject the null hypothesis4, meaning the average person trip rates per building area are not significantly different across urban contexts. This result suggests that our assumption appears to be applicable and person trips do not vary significantly for establishments of a specific size and type.
4.2 Comparison of study vehicle trips tates with the ITE trip rates
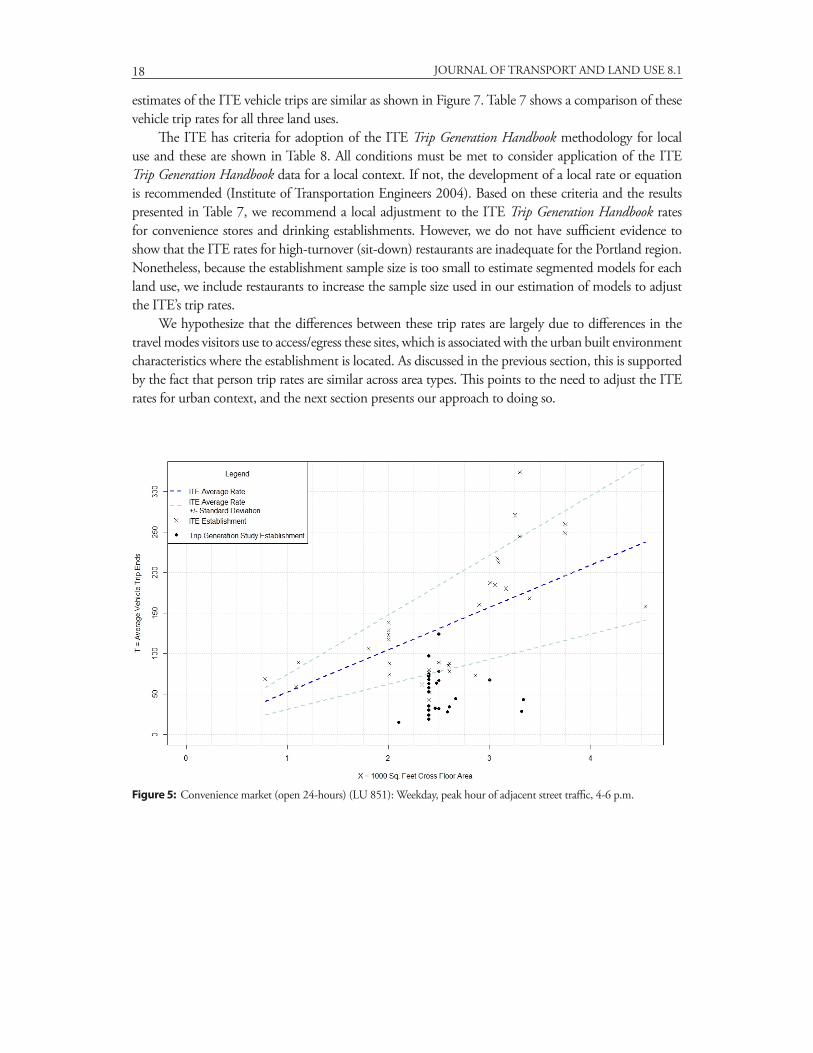
This section details a comparison between vehicle trips based on study observations and the ITE Trip Generation Handbook estimates of vehicle trips for the establishments included in this study. To do so, we calculate vehicle trip rates (trips per 1000 sq. ft.) for each establishment in our study using the ob-served person trip counts and the mode share and average vehicle occupancy at each establishment based upon the survey data (see section 3.3).
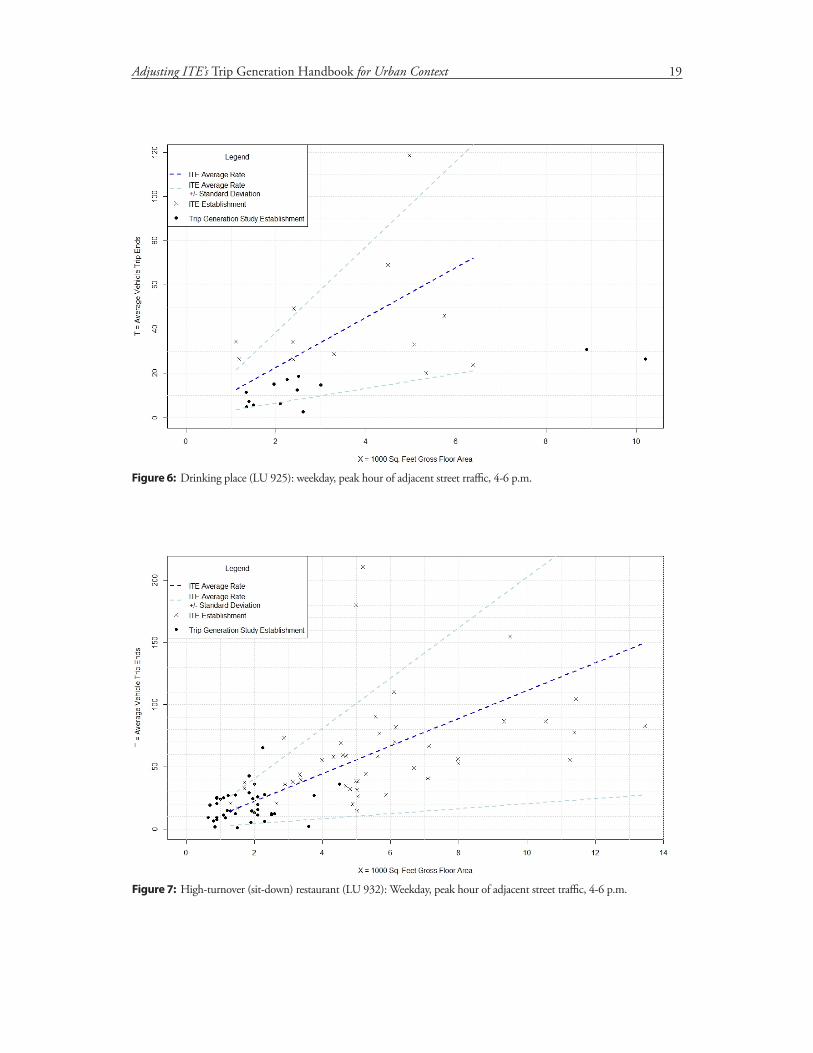
These comparisons of vehicle trips for each of the land-use types used in our study (restaurants, drinking places and convenience markets) for the weekday peak hour of the facility (5 to 6 p.m.) are shown in Figure 5, Figure 6, and Figure 7. As shown in Figure 5 and Figure 6, the vehicle trips from this study are consistently below the ITE rates and the ITE data points for convenience stores and drink-ing establishments. For high-turnover (sit-down) restaurants, the vehicle trips from this study and the
Figure 4: Do person trip rates vary across contexts?
4 Results from ANOVA tests: (1) pooled data, F(4,73) = 0.62, p = 0.652; (2) convenience stores, F(4,21) = 1.86, p = 0.155, restaurants F(4,34) = 1.97, p = 0.121, drinking establishments, F(2,10) = 1.98, p = 0.189., restaurants and drinking establish-ments combined, F(4,47) = 1.07, p = 0.382.
18 JOURNAL OF TRANSPORT AND LAND USE 8.1
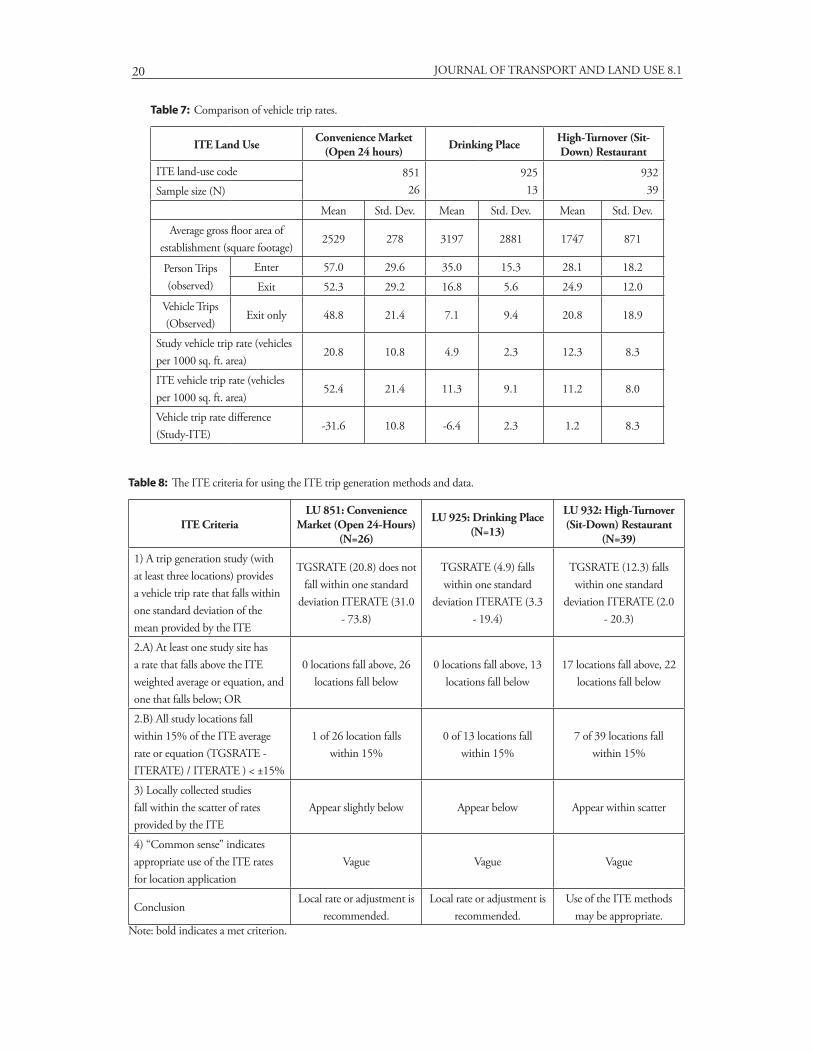
estimates of the ITE vehicle trips are similar as shown in Figure 7. Table 7 shows a comparison of these vehicle trip rates for all three land uses.
The ITE has criteria for adoption of the ITE Trip Generation Handbook methodology for local use and these are shown in Table 8. All conditions must be met to consider application of the ITE Trip Generation Handbook data for a local context. If not, the development of a local rate or equation is recommended (Institute of Transportation Engineers 2004). Based on these criteria and the results presented in Table 7, we recommend a local adjustment to the ITE Trip Generation Handbook rates for convenience stores and drinking establishments. However, we do not have sufficient evidence to show that the ITE rates for high-turnover (sit-down) restaurants are inadequate for the Portland region. Nonetheless, because the establishment sample size is too small to estimate segmented models for each land use, we include restaurants to increase the sample size used in our estimation of models to adjust the ITE’s trip rates.
We hypothesize that the differences between these trip rates are largely due to differences in the travel modes visitors use to access/egress these sites, which is associated with the urban built environment characteristics where the establishment is located. As discussed in the previous section, this is supported by the fact that person trip rates are similar across area types. This points to the need to adjust the ITE rates for urban context, and the next section presents our approach to doing so.
Figure 5: Convenience market (open 24-hours) (LU 851): Weekday, peak hour of adjacent street traffic, 4-6 p.m.
19Adjusting ITE’s Trip Generation Handbook for Urban Context
Figure 6: Drinking place (LU 925): weekday, peak hour of adjacent street rraffic, 4-6 p.m.
Figure 7: High-turnover (sit-down) restaurant (LU 932): Weekday, peak hour of adjacent street traffic, 4-6 p.m.
20 JOURNAL OF TRANSPORT AND LAND USE 8.1
Table 7: Comparison of vehicle trip rates.
ITE Land Use Convenience Market (Open 24 hours) Drinking Place High-Turnover (Sit-
Down) Restaurant
ITE land-use code 85126
92513
93239Sample size (N)
Mean Std. Dev. Mean Std. Dev. Mean Std. Dev.
Average gross floor area of establishment (square footage)
2529 278 3197 2881 1747 871
Person Trips (observed)
Enter 57.0 29.6 35.0 15.3 28.1 18.2
Exit 52.3 29.2 16.8 5.6 24.9 12.0
Vehicle Trips (Observed)
Exit only 48.8 21.4 7.1 9.4 20.8 18.9
Study vehicle trip rate (vehicles per 1000 sq. ft. area)
20.8 10.8 4.9 2.3 12.3 8.3
ITE vehicle trip rate (vehicles per 1000 sq. ft. area)
52.4 21.4 11.3 9.1 11.2 8.0
Vehicle trip rate difference (Study-ITE)
-31.6 10.8 -6.4 2.3 1.2 8.3
Table 8: The ITE criteria for using the ITE trip generation methods and data.
ITE CriteriaLU 851: Convenience
Market (Open 24-Hours) (N=26)
LU 925: Drinking Place (N=13)
LU 932: High-Turnover (Sit-Down) Restaurant
(N=39)
1) A trip generation study (with at least three locations) provides a vehicle trip rate that falls within one standard deviation of the mean provided by the ITE
TGSRATE (20.8) does not fall within one standard
deviation ITERATE (31.0 - 73.8)
TGSRATE (4.9) falls within one standard
deviation ITERATE (3.3 - 19.4)
TGSRATE (12.3) falls within one standard
deviation ITERATE (2.0 - 20.3)
2.A) At least one study site has a rate that falls above the ITE weighted average or equation, and one that falls below; OR
0 locations fall above, 26 locations fall below
0 locations fall above, 13 locations fall below
17 locations fall above, 22 locations fall below
2.B) All study locations fall within 15% of the ITE average rate or equation (TGSRATE - ITERATE) / ITERATE ) < ±15%
1 of 26 location falls within 15%
0 of 13 locations fall within 15%
7 of 39 locations fall within 15%
3) Locally collected studies fall within the scatter of rates provided by the ITE
Appear slightly below Appear below Appear within scatter
4) “Common sense” indicates appropriate use of the ITE rates for location application
Vague Vague Vague
ConclusionLocal rate or adjustment is
recommended.Local rate or adjustment is
recommended.Use of the ITE methods
may be appropriate.Note: bold indicates a met criterion.
21Adjusting ITE’s Trip Generation Handbook for Urban Context
4.3 Urban context adjustment models: Estimation and verification
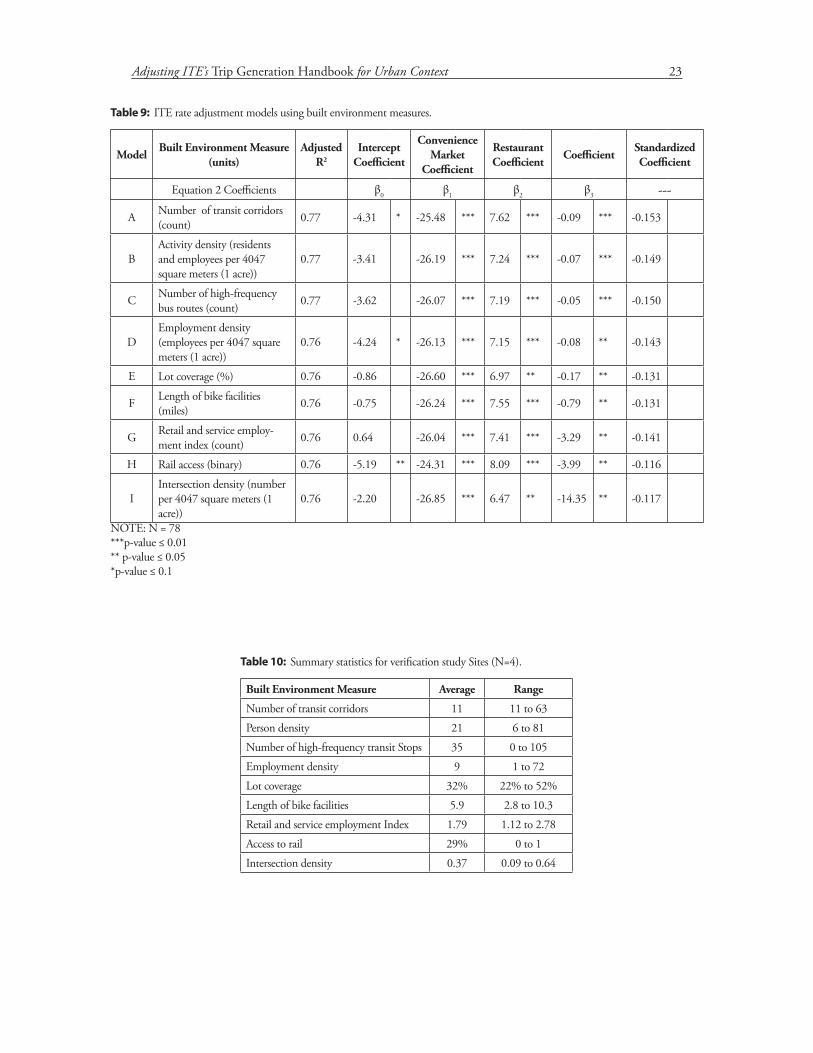
Using the pooled-sample data collected for all establishments for the weekday p.m. peak hour (5 to 6 p.m.), nine separate adjustment models are estimated using ordinary least-squared multivariate regres-sion to provide adjustments to the ITE’s vehicle trip rates for urban context. The dependent variable for each of the models is the difference between the vehicle trip rate found in this study and the trip rate estimated using the ITE’s methods (Institute of Transportation Engineers 2008, Institute of Transporta-tion Engineers 2004). In most cases in this study, the vehicle trip rate given by the ITE is greater than that calculated based on our study observations, resulting in a negative value for the adjustment. In each of the nine models shown in Table 9 (numbered A through I), the independent variables include indica-tors of the land-use type (drinking establishments are the base case) and one of the built environment measures listed in Table 5. Despite the statistical caution of using highly correlated independent vari-ables together, several models were estimated with combinations of these correlated built environment variables, but they did not yield significant improvement in model fit and were not more telling in terms of policy than those models employing a single built environment variable. The model specification is shown in Equation 2 below.
Adjustment models for urban context (2)
Adjustment = β0
Where, Adjustment= Vehicle Trip Ratestudy–Vehicle Trip RateITE ;DummyRestaurant = Indicator if the land-use type is a restaurant; DummyConvenience= Indicator if the land-use type is a convenience store; Built EnvironmentA to I= One of the built environment measures (A-I) shown in Table 5.
From the estimation results shown in Table 9, all of these models perform quite well with adjusted R2 ranging from 0.76 to 0.77. It is obvious from the parameter estimates that the land-use indicators contribute more to the adjustment than the built environment variables that represent urban context. This is expected since we had insufficient sample size to estimate separate models for each land-use type, and one would expect different land uses to have different trip generation rates.
However, once land use is controlled for, significant differences in trip generation rates can be at-tributed to the various context variables. In all models the built environment measures are negatively and significantly associated with the adjustment, although with varying levels. The negative coefficient indicates that the urban context measures are inversely correlated with the adjustment. This means that locations that have greater density, transit access, bicycle network, lot coverage and pedestrian connectiv-ity are associated with vehicle trip rates that are lower than those predicted by the ITE’s methodology. This makes sense given that one would expect greater non-automobile mode shares in locations with these built environment measures and thus require a reduction in the ITE vehicle trip rates. Interactions between the built environment and land-use type dummy variables were not significant and, therefore, were not included.
In models A through C, the built environment variables (number of transit corridors, activity density, and number of high-frequency bus routes) have greater significance with a p-value ≤ 0.01, compared to a p-value ≤ 0.05 for the built environment variables in models D through I. Since each of these built environment variables has a different operational construct (units of measurement), ex-amining their standardized coefficients is telling. Models A through C also have the built environment
+ β1DummyConvenience + β2DummyRestaurant + β3Built EnvironmentA to I
22 JOURNAL OF TRANSPORT AND LAND USE 8.1
variables with the largest standardized coefficients with number of transit corridors having the largest (-0.153), followed by number of high-frequency bus routes (-0.150) and activity density (-0.149). The other models (D-I) have similar model fits and significance levels, but there are some distinct differences from the standardized coefficients. Employment density has the greatest explanatory power of these remaining built environment variables with a standardized coefficient of -0.143 and the binary variable indicating access to rail transit within the 0.8-kilometer (0.5-mile) buffer has the lowest with a standard-ized coefficient of -0.116.
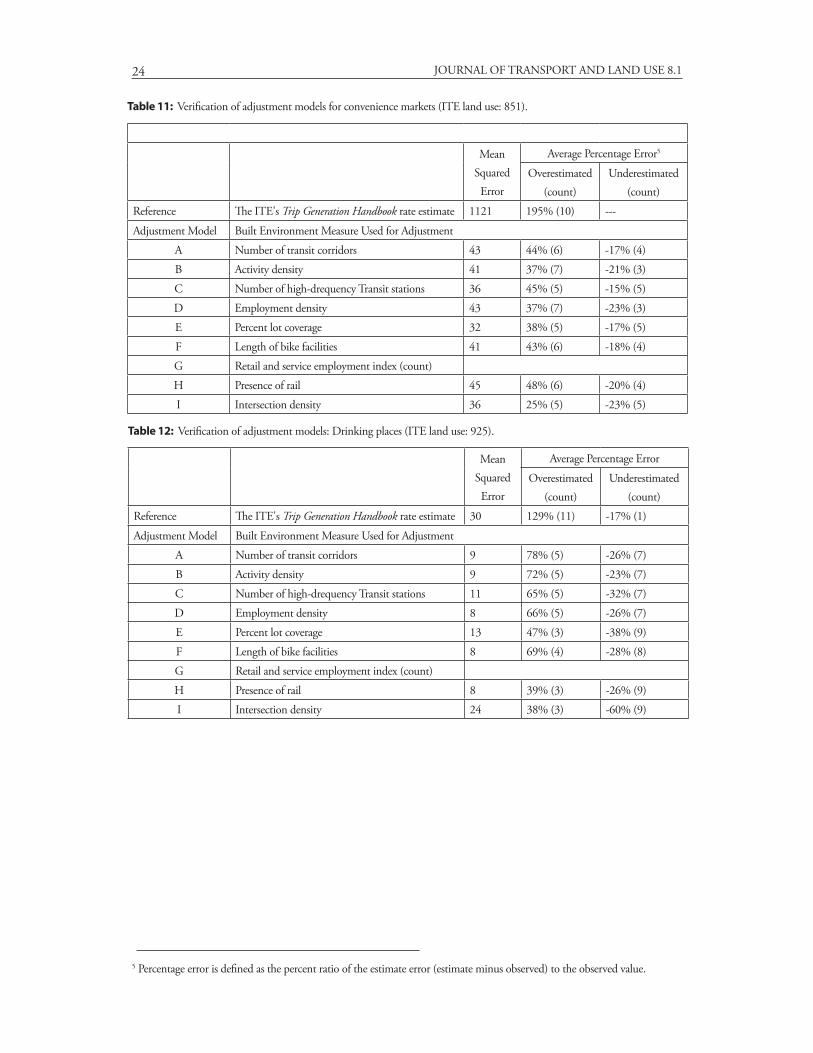
In terms of application, the results of this estimation alone do not provide sufficient direction to guide the use of these models or for the direction of future research needed to further inform models. To aid in this and better understand the performance of these models, we verified these model estimation results using independently collected data. We use the word “verification” instead of “validation” due to sample sizes required to warrant statistical merit. Because of segmentations across different land uses and urban contexts, the verification sample would need to be increased fivefold to meet statistical require-ments for a validation effort. Vehicle count data were collected from 34 additional establishments (10 convenience stores, 12 drinking places, and 12 restaurants) with varying built environment attributes in April and May of 2012, and the summary statistics for these locations are shown in Table 10. For these sites, vehicle counts entering and exiting the locations were collected using the same methodol-ogy outlined above. Using each of the estimated models A through I from Table 9, the adjustment was calculated. Then this adjustment was applied to the ITE vehicle trip rate for each establishment, and the new adjusted rate was used to estimate the number of vehicle trips for that location for the evening weekday peak hour. This model application was compared to the observed vehicle trip data collected for each of the sites. The results of this verification exercise aggregated by land-use type are shown in Table 11, Table 12 and Table 13.
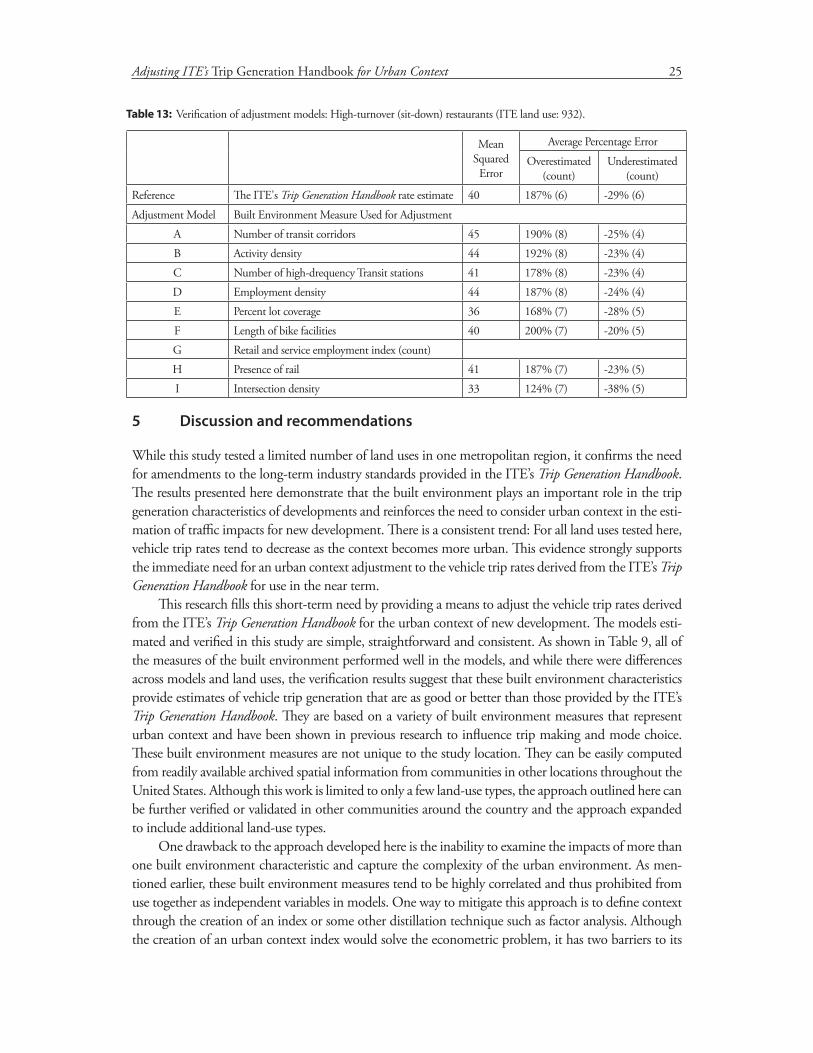
From these tables, we can see that the models developed and verified here for convenience markets and drinking places predict vehicle trips better overall than the ITE methods alone. From Table 11, the mean squared error (MSE) for the estimates developed from data and methods outlined in the ITE’s Trip Generation Handbook is 1121 for convenience markets, compared to a MSE range of 36-45 for the context adjustment models developed here. In addition, the ITE overestimated vehicle trips in every case (N=10) with an average percentage error of 195 percent. From the verification results for drinking places shown in Table 12, the MSE for the ITE’s estimates is 30, compared to a range of 8 to 24 for the urban context adjustment models. For 11 of the 12 bars in the verification sample, the ITE estimates of vehicle trips were greater than the observed verification counts with an average percentage error of 129 percent. However, the verification results for restaurants are less supportive of the context adjustment approaches developed in this paper. From the results in Table 13, the ITE estimates appear to be com-mensurate with our adjustment model performance. The ITE MSE is 40, compared to a MSE range of 33 to 45 for the adjustment models. This suggests that another approach may be necessary to adjust the ITE estimates or that the ITE method may be adequate for application in the evaluation of trip genera-tion attributed to restaurants across urban contexts.
23Adjusting ITE’s Trip Generation Handbook for Urban Context
Table 9: ITE rate adjustment models using built environment measures.
ModelBuilt Environment Measure
(units)Adjusted
R2
Intercept Coefficient
Convenience Market
Coefficient
Restaurant Coefficient
CoefficientStandardized Coefficient
Equation 2 Coefficients β0 β1 β2 β3 ---
A Number of transit corridors (count) 0.77 -4.31 * -25.48 *** 7.62 *** -0.09 *** -0.153
BActivity density (residents and employees per 4047 square meters (1 acre))
0.77 -3.41 -26.19 *** 7.24 *** -0.07 *** -0.149
C Number of high-frequency bus routes (count) 0.77 -3.62 -26.07 *** 7.19 *** -0.05 *** -0.150
DEmployment density (employees per 4047 square meters (1 acre))
0.76 -4.24 * -26.13 *** 7.15 *** -0.08 ** -0.143
E Lot coverage (%) 0.76 -0.86 -26.60 *** 6.97 ** -0.17 ** -0.131
F Length of bike facilities (miles) 0.76 -0.75 -26.24 *** 7.55 *** -0.79 ** -0.131
G Retail and service employ-ment index (count) 0.76 0.64 -26.04 *** 7.41 *** -3.29 ** -0.141
H Rail access (binary) 0.76 -5.19 ** -24.31 *** 8.09 *** -3.99 ** -0.116
IIntersection density (number per 4047 square meters (1 acre))
0.76 -2.20 -26.85 *** 6.47 ** -14.35 ** -0.117
NOTE: N = 78 ***p-value ≤ 0.01 ** p-value ≤ 0.05*p-value ≤ 0.1
Table 10: Summary statistics for verification study Sites (N=4).
Built Environment Measure Average Range
Number of transit corridors 11 11 to 63
Person density 21 6 to 81
Number of high-frequency transit Stops 35 0 to 105
Employment density 9 1 to 72
Lot coverage 32% 22% to 52%
Length of bike facilities 5.9 2.8 to 10.3
Retail and service employment Index 1.79 1.12 to 2.78
Access to rail 29% 0 to 1
Intersection density 0.37 0.09 to 0.64
24 JOURNAL OF TRANSPORT AND LAND USE 8.1
Table 11: Verification of adjustment models for convenience markets (ITE land use: 851).
Mean Squared
Error
Average Percentage Error5
Overestimated (count)
Underestimated (count)
Reference The ITE's Trip Generation Handbook rate estimate 1121 195% (10) ---
Adjustment Model Built Environment Measure Used for Adjustment
A Number of transit corridors 43 44% (6) -17% (4)
B Activity density 41 37% (7) -21% (3)
C Number of high-drequency Transit stations 36 45% (5) -15% (5)
D Employment density 43 37% (7) -23% (3)
E Percent lot coverage 32 38% (5) -17% (5)
F Length of bike facilities 41 43% (6) -18% (4)
G Retail and service employment index (count)
H Presence of rail 45 48% (6) -20% (4)
I Intersection density 36 25% (5) -23% (5)
Table 12: Verification of adjustment models: Drinking places (ITE land use: 925).
Mean Squared
Error
Average Percentage Error
Overestimated (count)
Underestimated (count)
Reference The ITE's Trip Generation Handbook rate estimate 30 129% (11) -17% (1)
Adjustment Model Built Environment Measure Used for Adjustment
A Number of transit corridors 9 78% (5) -26% (7)
B Activity density 9 72% (5) -23% (7)
C Number of high-drequency Transit stations 11 65% (5) -32% (7)
D Employment density 8 66% (5) -26% (7)
E Percent lot coverage 13 47% (3) -38% (9)
F Length of bike facilities 8 69% (4) -28% (8)
G Retail and service employment index (count)
H Presence of rail 8 39% (3) -26% (9)
I Intersection density 24 38% (3) -60% (9)
5 Percentage error is defined as the percent ratio of the estimate error (estimate minus observed) to the observed value.
25Adjusting ITE’s Trip Generation Handbook for Urban Context
5 Discussion and recommendations
While this study tested a limited number of land uses in one metropolitan region, it confirms the need for amendments to the long-term industry standards provided in the ITE’s Trip Generation Handbook. The results presented here demonstrate that the built environment plays an important role in the trip generation characteristics of developments and reinforces the need to consider urban context in the esti-mation of traffic impacts for new development. There is a consistent trend: For all land uses tested here, vehicle trip rates tend to decrease as the context becomes more urban. This evidence strongly supports the immediate need for an urban context adjustment to the vehicle trip rates derived from the ITE’s Trip Generation Handbook for use in the near term.
This research fills this short-term need by providing a means to adjust the vehicle trip rates derived from the ITE’s Trip Generation Handbook for the urban context of new development. The models esti-mated and verified in this study are simple, straightforward and consistent. As shown in Table 9, all of the measures of the built environment performed well in the models, and while there were differences across models and land uses, the verification results suggest that these built environment characteristics provide estimates of vehicle trip generation that are as good or better than those provided by the ITE’s Trip Generation Handbook. They are based on a variety of built environment measures that represent urban context and have been shown in previous research to influence trip making and mode choice. These built environment measures are not unique to the study location. They can be easily computed from readily available archived spatial information from communities in other locations throughout the United States. Although this work is limited to only a few land-use types, the approach outlined here can be further verified or validated in other communities around the country and the approach expanded to include additional land-use types.
One drawback to the approach developed here is the inability to examine the impacts of more than one built environment characteristic and capture the complexity of the urban environment. As men-tioned earlier, these built environment measures tend to be highly correlated and thus prohibited from use together as independent variables in models. One way to mitigate this approach is to define context through the creation of an index or some other distillation technique such as factor analysis. Although the creation of an urban context index would solve the econometric problem, it has two barriers to its
Table 13: Verification of adjustment models: High-turnover (sit-down) restaurants (ITE land use: 932).
Mean Squared
Error
Average Percentage Error
Overestimated (count)
Underestimated (count)
Reference The ITE's Trip Generation Handbook rate estimate 40 187% (6) -29% (6)
Adjustment Model Built Environment Measure Used for Adjustment
A Number of transit corridors 45 190% (8) -25% (4)
B Activity density 44 192% (8) -23% (4)
C Number of high-drequency Transit stations 41 178% (8) -23% (4)
D Employment density 44 187% (8) -24% (4)
E Percent lot coverage 36 168% (7) -28% (5)
F Length of bike facilities 40 200% (7) -20% (5)
G Retail and service employment index (count)
H Presence of rail 41 187% (7) -23% (5)
I Intersection density 33 124% (7) -38% (5)

26 JOURNAL OF TRANSPORT AND LAND USE 8.1
widespread use. First, it lacks policy sensitivity in interpretation as the individual built environment measures, such as activity density and pedestrian connectivity, get combined into one. Second, the use of an index is limited to the area where it is created. Unless an index is created using national-level data, it would be difficult to transfer it to another urban area or generalize its relation to trip generation. Thus, the choice between using individual elements of the built environment and a combination is not an easy one when the goal is to have a sound method that can be applied anywhere.
The various shortcomings to the ITE’s Trip Generation Handbook as a planning reference, includ-ing insensitivity to urban context, have been well documented in the previous literature. The work here provides more empirical evidence to support those critiques. Given the need for methodologies backed by empirical evidence that provide planning support for the automobile as well as non-motorized and transit modes in urban environments, a complete overhaul to the methods and data used in the Trip Generation Handbook or the development of an altogether new approach for assessing the transporta-tion impacts of new development is necessary over the long term. Any new methods should consider the impacts of motorized and non-motorized modes for all person trips and would require an entirely different data collection agenda (see Clifton et al. 2013). Specifically, the current approach to methods and data provided by the ITE would be improved by a movement away from a focus on vehicle trips and expanded to consider person-trip information and multi-modal travel. Traffic impact analyses can be important and powerful planning tools, but only if they reflect the multi-modal nature of urban environments. The analysis should provide a basis for how these person trips are distributed across the various modes, as a function of site and urban context characteristics.
This study represents a first step in moving this bar forward and advancing national standards. Data for more land uses and covering a wider range of urban contexts are needed to inform a nationally relevant methodology. But many communities across the country already have a great deal of informa-tion from their own local trip generation studies to inform a larger-scale study and validate available methodologies for regional and urban context variations. The opportunity exists to make these data more readily available to researchers to help improve practice and create new professional standards that better reflect the multi-modal nature of our cities.
Acknowledgments
The authors wish to acknowledge Metro, the regional government for the Portland, Oregon, metropoli-tan area, and the Regional Partners; the Oregon Transportation Research and Education Consortium; and the Oregon Department of Transportation for their support of this research.
References
Badoe, D. 2000. Transportation land-use interaction: Empirical findings in North America, and their implications for modeling. Transportation Research. Part A: Policy and Practice 2000: 263.
Baltimore City Department of Transportation. 2007. Procedures and Requirements for Conducting a Traf-fic Impact Study in Baltimore City. Baltimore, MD: Baltimore City Department of Transportation.
Bedford County Department of Planning. 2004. Bedford County Traffic Impact Study (TIS) Guidelines. Bedford, VA: Bedford County Department of Planning.
Bochner, B. S., K. Hooper, B. Sperry, and R. Dunphy. 2011. NCHRP Report 684: Enhancing Internal Trip Capture Estimation for Mixed-Use Developments. Washington, DC: Transportation Research Board.
27Adjusting ITE’s Trip Generation Handbook for Urban Context
Cervero, R. 1993. Ridership impacts of transit-focused development in California (UCTC No. 76). Working paper. Berkely, CA: The University of California Transportation Center.
Cervero, R., and G. B. Arrington. 2008. TCRP Report 128: Effects of TOD on Housing, Parking, and Travel. Washington, DC: Transportation Research Board.
Cervero, R., and K. Kockelman. 1997. Travel demand and the 3Ds: Density, diversity, and design. Transportation Research Part D 2 1997(3): 199–219.
Charlotte Department of Transportation. 2006. Land Development Rezoning and Traffic Impact Study Review Process. Charlotte, NC: Charlotte Department of Transportation.
City of Bellingham. 2012a. Development Guidelines and Improvement Standards: Section 11-2.02 Traffic Studies: Project Trip Generation and Design-Hour Volumes. Bellingham, WA: City of Bellingham.
City of Bellingham. 2012b. Development Guidelines and Improvement Standards: Section 11-2.13 Traffic Studies: Techical Requirements of Final Report. Bellingham, WA: City of Bellingham.
City of Bend. 2009. Chapter 10-10, development code, in Bend Code. Bend, OR: City of Bend.City of Mississauga. 2008. Traffic Impact Study Guidelines. Mississauga, Ont., Canada: City of Missis-
sauga.City of Pasadena. 2005. Transportation Impact Review Current Practice and Guidelines. Pasadena, CA:
City of Pasadena.City of Rockville. 2011. Comprehensive Transportation Review. Rockville, MD: City of Rockville.City of Salem. 1995. Development Bulletin 19: Transportation Impact Analysis. Salem, OR: City of Salem.City of San Diego. 1998. Traffic Impact Study Manual. San Diego, CA: City of San Diego.City of Sedro-Woolley. 2004. Traffic Impact Study Guidelines. Sedro-Woolley, WA: City of Sedro-Wool-
ley.City of Vancouver. 2010. City of Vancouver Traffic Study Requirements. Vancouver, WA: City of Vancou-
ver.Clifton, K. J., K. M. Currans, and C. D. Muhs. 2012. Contextual Influences on Trip Generation, Project
Report OTREC RR-12-13 prepared for Oregon Transport Research and Education Consortium, Portland, OR. http://otrec.us/project/407.
Clifton, K. J., K. M. Currans, and C. D. Muhs. 2013. Evolving the Institute for Transportation Engi-neers’ (ITE) Trip Generation Handbook: A proposal for collecting multimodal, multi-context, estab-lishment-level data. Paper presented at the 92nd Annual Meeting of the Transportation Research Board, Washington, D.C.
Colorado/Wyoming ITE Section Technical Committee–Trip Generation. 1987. Trip generation for mixed-use developments. Institute of Transportation Engineers Journal 57(2): 27–32.
Daisa, J. M., A. Mustafa, M. Mizuta, L. Schwartz, L. Espelet, D. Turlik, G. Bregman, G. 2009. Trip Generation Rates for Urban Infill Land Uses in California: Phase II Final Report. Sacramento, CA: California Department of Transportation.
Dill, J. 2003. Transit use and proximity to rail: Results from large employment sites in the San Francisco, California, Bay Area. Transportation Research Record 2003: 19–24.
Dill, J. 2008. Transit use at transit-oriented developments in Portland, Oregon, area. Transportation Research Record 2063: 159–167.
Ewing, R., M. Greenwald, M. Zhang, J. Walters, M. Feldman, R. Cervero, L. Frank, and J. Thomas. 2011.Traffic generated by mixed-use developments—Six-region study using consistent built envi-ronmental measures. Journal of Urban Planning and Development 137(3): 248–261. doi:10.1061/(ASCE)UP.1943-5444.0000068.
Ewing, R., and R. Cervero. 2010. Travel and the built environment: A meta-analysis. Journal of the American Planning Association 76(3): 265–294.
28 JOURNAL OF TRANSPORT AND LAND USE 8.1
Ewing, R., and R. Cervero. 2001. Travel and the built environment: A synthesis. Transportation Research Record 1780 (2001): 87–114.
Fehr and Peers. 2008. Summary of research demonstrating that smart growth reduces traffic. Internal, referenced in Samdahl, D. Travel Demand Research for Downtown Kent. Kent, WA: Fehr and Peers, Kent.
Fleet, C., and A. Sosslau. 1976. Trip generation procedures: An improved design for today’s needs. In-stitute of Transportation Engineering Journal 46(11).
Flordia Department of Community Affairs. 2006. Transportation Concurrency Requirements and Best Practices: Guidelines for Developing and Maintaining an Effective Transportation Concurrency Manage-ment System. Tallahassee, FL: Florida Department of Community Affairs.
Gard, J. 2007. Innovative intermodal solutions for urban transportation paper award: Quantifying transit-oriented develpment’s ability to change travel behavior. Institute of Transportation Engineers Journal 80(11): 42–46.
Georgia Regional Tranpsortation Authority. 2002. GRTA DRI Review Package Technical Guidelines. At-lanta, GA: GRTA.
Hagler Bailly Services, Inc. and Criterion Planners/Engineers. 1999. The Transportation and Environ-mental Impacts of Infill Versus Greenfield Development: A Comparative Case Study Analysis. EPA Pub. Number 231-R-99-005. Washington, DC: Enviornmental Protection Agency.
Harris County, Texas. 1991. Chapter 5, Article II. In Land Development Code: Traffic Impact Analysis Guidelines. Harris County, TX: Harris County, TX.
Henderson Department of Public Works. 2009. Traffic Impact Analysis Guidelines. Henderson, NV: Henderson Department of Public Works.
Hooper, K. G. 1989. NCHRP Report 323: Travel Characteristics at Large-Scale Suburban Activity Centers. Washington, DC: Transportation Research Board, National Research Council.
Infogroup, Inc. 2011. 2010 reference USA database. U.S. Businesses.Institute of Transportation Engineers. 2008. Trip Generation 8th Edition: An Informational Report.
Washington, DC: Institute of Transportation Engineers.Institute of Transportation Engineers. 2004. Trip Generation Handbook: An ITE Recommended Practice,
2nd Ed. Washington, DC: Institute of Transportation Engineers.Jeihani, M., and R. A. Camilo. 2009. Trip Generation Studies for Special Generators (MD-09-SP808B4J).
Hanover, MD: State Highway Administration, Maryland Department of Transportation.JHK and Associates, Pacific Rim Resources, and SG Associates.1996. DRAFT Final Report: Accessibil-
ity Measure and Transportation Impact Factor Study. Salem, OR: Oregon Department of Transpor-taton, Department of Land Conservtion and Development, Transportation and Growth Manage-ment Program.
Kimley-Horn and Associates, Inc. 2009. Trip Generation Rates for Urban Infill Land Uses in California: Phase II Final Report. Sacramento, CA: California Department of Transportation.
Lapham, M. 2001. Transit-Oriented Development—Trip Generation and Mode Split in the Portland Met-ropolitan Region. Portland, OR: Portland State University.
Lee, R., J. Miller, R. Maiss, M. Campbell, K. Shafizadeh, D. Niemeier, and S. Handy. 2011. Evaluation of Operation and Accuracy of Five Available Smart Growth Trip Generation Methodologies (UCD-ITS-RR-11-12). Davis, CA: Institute of Transportation Studies, University of California.
Lerner-Lam, E., S. P. Celniker, G. W. Halbert, C. Chellman, and S. Ryan. 1992. Neo-Traditional Neigh-borhood Design and Its Implications for Traffic Engineering. Institute of Transportation Engineering Jour-nal 62(1).
29Adjusting ITE’s Trip Generation Handbook for Urban Context
Los Angeles Department of Transportation. 2010. Traffic Study Policies and Procedures. Los Angeles, CA: Los Angeles Department of Transportation.
Lund, H. M., R. Cervero, and R. W. Willson. 2004. Travel Characteristics of Transit-Oriented Develop-ment in California. Statewide Planning Studies FTA Section 5313(b).
Montgomery Planning. 2010. Local Area Transportation Review. Montgomery County, MD: The Mary-land National Capital Park and Planning Commission.
Nelson\Nygaard Consulting Associates. 2005. Crediting Low-Traffic Developments: Adjusting Site-Level Vehicle Trip Generation Using URBEMIS. San Francisco, CA: Nelson\Nygaard Consulting Associ-ates.
New South Wales Roads and Traffic Authority. 2002. Guide to Traffic Generation Developments, Version 2.2. Sydney, Austrailia: Roads and Traffic Authority.
New York City. 2010. City Environmental Quality Review (CEQR) Chapter 16. New York: Mayor’s Of-fice of Environmental Coordination.
New Zealand Trips and Parking Database Bureau. 2012. URL: www.tdbonline.org.Samdahl, D. 2010. Travel Demand Research for Downtown Kent. Memorandum submitted to the
City of Kent, WA, June 28, 2010. Kent, WA: Fehr and Peers.San Diego Association of Governments (SANDAG). 2010. Trip Generation for Smart Growth: Planning
Tools for the San Diego Region. San Diego, CA: SANDAG.San Diego Municipal Code. 2003. Land Development Code: Trip General Manual. San Diego, CA: City
of San Diego.San Francisco Planning Department. 2002. Transportation Impact Analysis Guildelines for Environmental
Review. San Francisco, CA: City and County of San Francisco.Schneider, R. J. 2011. Understanding Sustainable Transportation Choices: Shifting Routine Automobile
Travel to Walking and Bicycling (UCTC-DISS-2011-01). Berkeley, CA: University of California Transportation Center.
Seskin, S. N., R. Cervero, and J. Zupan. 1996. National Cooperative Highway Research Program (NCHRP) Report No. 16: Transit and Urban Form. Washington, DC: National Academy Press.
Southern New Hampshire Planning Commission. 2010. Trip Generation Study. Manchester, NH: Southern New Hampshire Planning Commission.
Trip Rate Information Computer System (TRICS). 2012. Trip Rate Information Computer System Good Practice Guide. UK and Ireland.
Virginia Department of Transportaiton (VDOT). 2010. Traffic Impact Analysis Regulations Small Area Plan Amendments: 24VAC30-155-60.D.1: Traffic Impact Statement. Richmond, VA: VDOT.