adjusting the forest cover to reflect mountain pine beetle ... · pdf fileprojecting the...
TRANSCRIPT

2015 Attribute Adjustment for MPB and Fire Page 1 December 2016
Adjusting the Forest Cover to Reflect Mountain Pine Beetle Impacts,
Fires and LiDAR Data Acquisition
This describes the methodology used for the adjustment made to the provincial forest cover for the
2015 projection to account for stand changes due to mountain pine beetle (MPB) mortality, for
incorporation of Fire severity mapping and to integrate some pilot LiDAR data analysis into the
provincial forest cover.
The provincial forest cover originates as a set of photo based estimates that re loaded into and
maintained in an operational database in a system known as VRIMS (Vegetation Resource Inventory
Management System) in this operational database the data is updated for disturbances, projected for
annual growth and subjected to a number of data quality assurance processes. Annually the data is
‘published’ from this operational database to DATA BC to be available for resource management
decisions by government, industry, and the public.
Accounting for the MPB caused changes to the inventory for the past 5 years has been accomplished by
projecting the inventory and then depleting the projected inventory by the MPB predicted mortality.
This process is documented here:
http://www.for.gov.bc.ca/hts/vridata/download/MPB_Changes_to_VEG_2015.pdf
This method required a great deal of manual intervention and the changes to stand structure were
reflected only in changes to the forest tree volumes not to the stand species composition, or other stand
attributes.
To accommodate the proposed changes to the forest cover to account for the MBP impacts some
changes to the operational infrastructure are needed. First a Layer ‘D’ or dead layer is needed in the
VRIMS operational database. This is the same data model used for new inventories to be able to keep
track of dead lodgepole pine stands in new VRI inventories. Secondly the operational database VRIMS
needs a new table to hold the projected yield data for the dead layer. This dead volume is a onetime
calculation and should not change over time.
All changes to the data described in the following document are made to the VRIMS database and data.
The changes to data will become part of the published data but there are no changes to the public facing
data structures or tables anticipated. All changes proposed to test this process must be done in the
VRIMS test environment. Once staff and users are satisfied with the data should it be migrated to
production.
Ground data will be used for calibration to ensure the changes to the data mirror the changes to the
landscape.
Proposed steps are:
1) Beginning with the 2014 MPB adjustment project data in VRIMS database format
a. Project stand to year of disturbance

2015 Attribute Adjustment for MPB and Fire Page 2 December 2016
b. Set reference year to year of disturbance c. Adjust species composition to reflect MPB losses
i. For stands with single species a nominal 10% will be considered surviving and will constitute the live stand
ii. For multi species stands species re-ordering and adjustments to age and height will be necessary
d. Add PL species to layer ‘D’ e. Add age and height to layer ‘D’ f. Add basal area, stems per ha and crown closure to layer ‘D’ g. Reduce crown closure in live layer and add CC to layer ‘D’ h. Add disturbance history and disturbance date for Layer ‘D’ based on MPB year of
disturbance i. Set project Name to “MP_Update”
2) For TSAs that have had recent VRI reinventory with Layer D captured already no adjustment for
mortality is necessary
3) For TSAs that have had recent inventory work but have not had the mortality accounted for further consideration of the dead volume will be necessary.
4) Create a spatial extract of all changes tot eh VRIMS data base for the period August 2014 to August 2015. Removing these change polygons from the adjusted dataset ensures no update information or reinventory is lost when the adjustment database is incorporated.
5) Set a sliver tolerance of 1ha to eliminate small polygons created when intersecting the update information into the MPB Adjusted data.
This project is running concurrent to projects incorporating LIDAR inventories, fire disturbance updates
and Landscape level inventories into the provincial forest cover. Care must be used to ensure double
killing of the forest stands does not occur.
Rules and Assumptions for data adjustment for MPB losses:
Update is for attribute only. No polygon shapes will be changed in this process.
The target population is any forest polygon with a component of pine with a projected age greater to or
equal to 30 years. If the Pine component is less than 10% then no adjustment is carried out.
Pine is considered to be
Pa whitebark pine Pinus albicaulis
Pl lodgepole pine Pinus contorta
Pw western white pine Pinus monticola
Py ponderosa pine Pinus ponderosa
Pj Jack pine Pinus banksiana
Pf Limber Pine Pinus Flexilis

2015 Attribute Adjustment for MPB and Fire Page 3 December 2016
Only stands with greater than or equal to 10% Pine mortality will be adjusted.
Only polygons with a projected age at year of disturbance greater to or equal to 30 years will be
adjusted.
For the 2015 adjustment the population will only include the single layer stands with a rank 1 layer and
if created a ’Dead layer (Layer ‘D). There is approximately 3% of the candidate stands described as
layered stands. There are about 30,000 polygons with muti-layers in the 814,000 MPB affected
polygons. It is about 3.8% of the total MPB adjustment polygons. An attempt to adjust these multilayer
polygons will be done at some point but it is not being considered for the initial MPB adjustment.
There are three polygon estimate types in this population. Stands that were inventoried before the
MPB disturbance, those that were inventories during or after the disturbance and only the residual live
volume was estimated and those that were inventories following the MPB disturbance and both Live
and Dead layer information was collected. Identifying the stands inventories before the mpb
disturbance is fairly straight forward. It is trickier to identify the stands that are inventoried during or
after the mpb disturbance. For these all polygons with a reference year below 2009 were adjusted with
the assumption that the residual volume was taken into account and a dead layer created from the
estimate of dead stems per ha.

2015 Attribute Adjustment for MPB and Fire Page 4 December 2016
Details on changes to the data structure for the MPB adjustment are detailed in appendix 1
The 2015 Forest inventory release includes our standard data product as well as a few new products as
described below:
VEG_COMP_LYR_R1_POLY (our standard product) : provides the estimates of forest inventory for the
rank 1 tree layer. This is the workhouse dataset for almost all analysis and it has the total dead volume
for the polygon identified in the attribution as well as the attribution for the dominant (Rank 1) stand
composition
The VEG_COMP_POLY and the VEG_COMP_LAYER : are new products that will allow analysts with
the spatial forest cover estimates for all layers identified including the Dead layer ( Layer_D). This
provides more information for the stands following the MPB outbreak and requires the use of a one to
many join to the polygon for analysis.

2015 Attribute Adjustment for MPB and Fire Page 5 December 2016
The 2015 Forest Inventory differs from the 2014 Forest Inventory to reflect changes in growing stock of
the forests, in areas updated for harvest and fire and for attribute adjustments to account for the MPB.
The overall impact of these changes and the change in methodology for MPB results in an increase to
live stand volume of 215,245,035 m3 and a reduction to dead stand volume of 271,830,789 for a net
total volume reduction of 56,585,754 or 0.6% of the total 2015 volume.

2015 Attribute Adjustment for MPB and Fire Page 6 December 2016
The change in dead volume between 2014 and 2015 is significant and is due to a number of factors as
outlined in the table below:
In areas with new inventory the photo interpreted dead pine component is getting much harder
to distinguish. This is pronounced in Kamloops, Nadina, Fort St James, Quesnel and Cariboo
Natural Resource Districts.
The attribute adjustment for of the dead layer was removed from areas with wildfire activities
as this would have resulted in an over estimate of dead volume available in the 2014 projection,
Areas where new inventory data is expected this year have not been adjusted for MPB impacts
which results in an underestimate of about 8 million m3 from 2014
Updates to the inventory to reflect harvest activities account for a difference of 20 Million m3.
The change in MPB impact methodology to re-align the adjustment with the photo estimation
procedures has reduced the dead volume estimates. We are continuing ground sampling this
year to determine if further refinement to the process is warranted.
A number of spatial errors caused problems in the re integration of the adjusted forest cover.
These errors will be integrated into the operational data over the next year adding to the dead
volume estimate. The table below reflects some of these impacts.

2015 Attribute Adjustment for MPB and Fire Page 7 December 2016
Update for Fire activity
Overview The purpose of this adjustment is to account for some of the changes to the existing VRI attributes due
to fires occurring between 2007 and 2014. The process does not create or adjust spatial polygons nor
does it adjust fire perimeter boundaries as provided by BC Wildfire Service. Only specific VRI attributes
(as identified in VRIMS estimated tables section of this document) are adjusted if more than 10% of a
polygon was burnt. To accommodate the proposed changes to the forest cover to account for the
wildfire impacts fewer changes to the operational infrastructure are needed. The Layer ‘D’ or dead layer
is not needed as we are assuming that all ‘dead’ timber is lost and dead volume will not be calculated.
A broad classification of fire severity was created using Landsat satellite imagery which is applied to each VRI polygon within the fire perimeter using an overlay and weighted average process. The severity class file can potentially be used for other purposes, however it was created specifically for VRI updating, and may not be suitable for operational/detailed mapping. Methodology Target populations for classifying and updating VRI polygons:
For fire years 2007 to 2013
Fire perimeters from 2007 to 2013 inclusive, greater than 30ha, were selected in arc map from the BCGW layer whse_land_and_natural_resource.prot_historical_fire_polys_sp.
VRI polygons were intersected with this fire perimeter selection and a mask created from a query of selected features: projected_age >= 40, crown closure >= 20, site index > 3 and non-productive descriptor not blank. The purpose was to remove VRI polygons such as swamps,
2015 Attribute Adjustment for MPB and Fire Page 8 December 2016
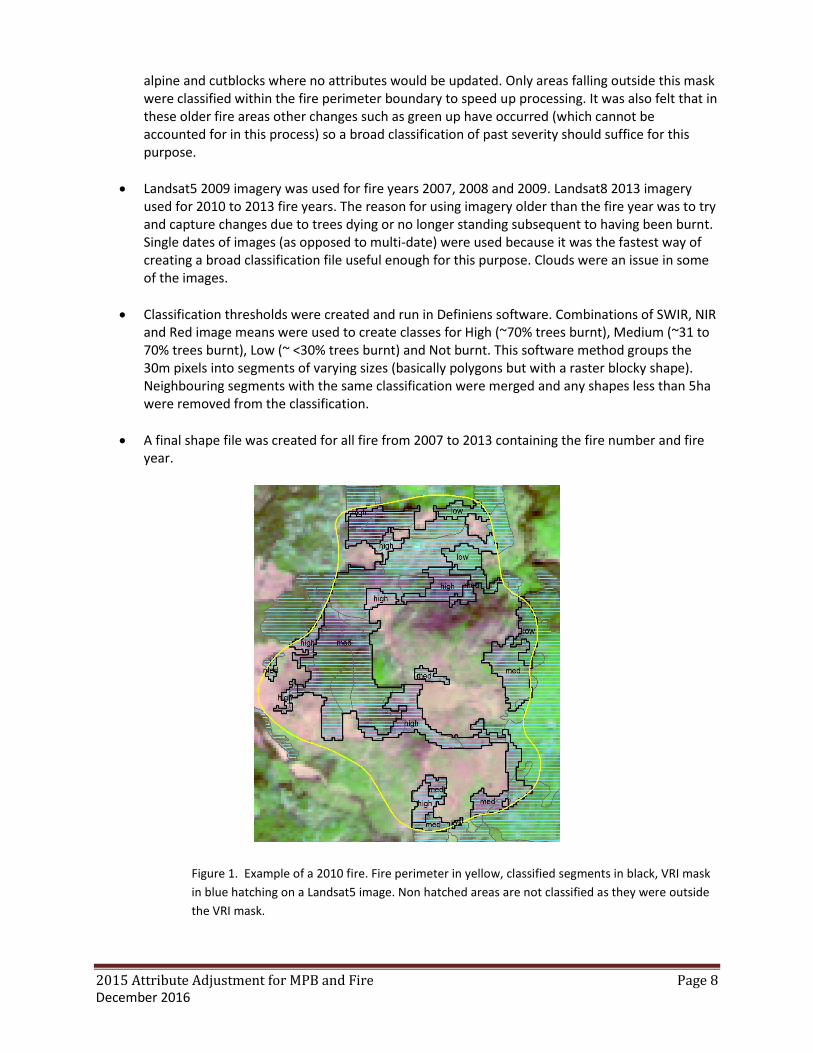
alpine and cutblocks where no attributes would be updated. Only areas falling outside this mask were classified within the fire perimeter boundary to speed up processing. It was also felt that in these older fire areas other changes such as green up have occurred (which cannot be accounted for in this process) so a broad classification of past severity should suffice for this purpose.
Landsat5 2009 imagery was used for fire years 2007, 2008 and 2009. Landsat8 2013 imagery used for 2010 to 2013 fire years. The reason for using imagery older than the fire year was to try and capture changes due to trees dying or no longer standing subsequent to having been burnt. Single dates of images (as opposed to multi-date) were used because it was the fastest way of creating a broad classification file useful enough for this purpose. Clouds were an issue in some of the images.
Classification thresholds were created and run in Definiens software. Combinations of SWIR, NIR and Red image means were used to create classes for High (~70% trees burnt), Medium (~31 to 70% trees burnt), Low (~ <30% trees burnt) and Not burnt. This software method groups the 30m pixels into segments of varying sizes (basically polygons but with a raster blocky shape). Neighbouring segments with the same classification were merged and any shapes less than 5ha were removed from the classification.
A final shape file was created for all fire from 2007 to 2013 containing the fire number and fire year.
Figure 1. Example of a 2010 fire. Fire perimeter in yellow, classified segments in black, VRI mask
in blue hatching on a Landsat5 image. Non hatched areas are not classified as they were outside
the VRI mask.

2015 Attribute Adjustment for MPB and Fire Page 9 December 2016
For fire year 2014
Fire perimeters from 2014 greater than 30ha were selected in arc map from the BCGW layer whse_land_and_natural_resource.prot_historical_fire_polys_sp.
Unlike the 2007 to 2013 process, all areas within the fire perimeter boundary, regardless of whether or not any attributes adjustments would be made, were included in the classification process. The reason for this was to create a classified file of the entire fire perimeter boundary in case it was useful for other mapping purposes beyond this VRI update.
Cutblocks were selected from a May 2015 VRIMS update file that intersected the fire perimeter boundaries in arcmap. The outer perimeter of cutblock boundaries (not internal polygons) was maintained and classification was done within these perimeters separately from the rest of the burned area.
Landsat8 2013, 2014 and/or 2015 imagery was used for 2014 fires. Pre and post imagery was used where possible. Clouds were an issue in some of the images.
Classification thresholds were created and run in Definiens software. Ratios and combinations of SWIR, NIR and Red image means from pre and post images were used to create classes for High (>70% trees burnt), Medium (>30 to 70% trees burnt), Low ( <31% trees burnt) and Not burnt. Neighbouring segments with the same classification were merged (except across cutblock boundaries).
A final shape file was created for the entire fire perimeter for the 2014 fires containing the fire number and fire year.
Figure 2. Example of a 2014 fire classification. Fire perimeter in yellow, classified segments in black, cutblock mask in blue hatching on a Landsat8 image. The bright white cloud shows how ground can be obscured from classification in some cases.

2015 Attribute Adjustment for MPB and Fire Page 10 December 2016
Update Process Only VRI polygons with >10% of the area burnt will be included in the fire update process. VRI polygons are overlaid with the classified segment file and a weighted average is used to obtain the percentage of the polygon impacted by each severity class. Attributes are then adjusted according to the following formula:
fire class high – 80% reduction to attributes
fire class medium – 50% reduction to attributes
fire class low – 20% reduction to attributes
Examples of adjustment results by percentage of polygon impacted
For Layer 1: Pl 100, crown closure 60%, Ba/Ha 50m2, Live stems 1000/ha and Dead stems 400/ha,
attributes would be adjusted as:
If 100% High severity - Layer 1 Crown closure 12%, Ba/Ha 10m2, Live stems 200/ha, and Dead stems 80/ha
If 100% Low severity - Layer 1 Crown closure 48%, Ba/Ha 40m2, Live stems 800/ha, and Dead stems 320/ha If 70% High severity and 30% medium severity – Layer 1 Crown closure 17.4 , Ba/Ha 14.5m2, 290 Live stems /ha, and 116 Dead stems /ha
Update for LiDAR Attribute Integration
LIDAR attributes were integrated into the VRI for all stands >40 years old within the area of interest on
northern Vancouver Island. Figure 1 shows the affected mapsheets and the integration process used. A
‘NEW’ process was used when adding new polygons and attributes to the VRI. An ‘EXISTING’ process
was used when updating existing VRI polygons with LiDAR attributes. A ‘COMBO’ process was used
when both a ‘NEW’ and ‘EXISTING’ polygons and attributes were present in a single mapsheet.

2015 Attribute Adjustment for MPB and Fire Page 11 December 2016
Figure 1 – LiDAR area-of-interest located on North Vancouver Island
LiDAR Integration with VRI
This section describes the process used to take the LiDAR output layers and update the information in the provincial forest inventory. Since the former is a raster product (attribute grids or cells of data each 25m) and the latter is polygonal (1 attribute value per polygon), assumptions and rules are defined in this section to facilitate the overall process. The following subsections describe the data preparation, comparison to existing VRI data and the overall integration process. Data Preparation Only the relevant output layers from the ALS modelling process were used to update the VRI polygons. These layers included; BCTS_WFP_BA12_LAYER.TIF, BCTS_WFP_MAXHT_LAYER.TIF, and BCTS_WFP_TPH12_LAYER.TIF to update basal area, stand height and stand density, respectively. The rules to satisfy the process at this stage are:
1) All VRI attributes use 7.5cm DBH utilization and, 2) Attributes must conform to VDYP7 projection updates.
Therefore, basal area @7.5cm and stand density (TPH) @ 7.5cm had to be modelled from the existing datasets. To estimate stand height at the polygon scale the MAXHT layer was multiplied by 0.8.

2015 Attribute Adjustment for MPB and Fire Page 12 December 2016
Integration process This section describes the steps used to integrate the raster-based ALS layers into the VRI framework. It is assumed at this stage that the analyst has the raster-based ALS layers for basal area, stand density and height, the current polygonal line work supplied by BCTS and WFP and the relevant VRI polygonal data (FOREST_COVER_OBJECT) cut from the VRIMS framework by individual mapsheet.
Integration steps for ‘EXISTING’ polygons
Firstly, perform a “Select by location” to select the polygons from the FOREST_COVER_OBJECT (current VRI) that have their centroid in the source layer feature (BCTS polygons). Figure 2 shows the dialog box for this procedure.
Figure 2– Select by location to select polygons to update.
Export the selected polygons as a new layer called “FCO_NVI_LIDAR” into an existing VRIMS –ready MDB.
Integration steps for ‘NEW’ polygons
To integrate new polygons into VRIMS, the first step is to clip the BCTS/WFP polygons we currently have using the FOREST_COVER_OBJECT polygons for each mapsheet. Figure 3 illustrates this operation.

2015 Attribute Adjustment for MPB and Fire Page 13 December 2016
Figure 3 – Clip new ALS polygons based on existing VRIMS polygons using a 10m tolerance.
Save the new polygons as “NEW_LIDAR_POLY” in the existing MDB file.
Integration steps for combined existing and new polygons
Some mapsheets contain both existing VRI polygons to update with LiDAR attributes and new polygons.
For these mapsheets, the processes listed above in sections 5.2.1 and 5.2.2 should be followed to
generate the line work for FCO_NVI_LIDAR and NEW_LIDAR_POLY polygonal layers. The next step is to
edit both of these layers as follows. Delete the big overlap polygon from FCO_NVI_LIDAR (this polygon is
the 'background' of the mapsheet). Next use ‘select by location’ and select NEW_LIDAR_POLY polygons
that have their centroid in FCO_NVI_LIDAR polygon file. Delete these selections from NEW_LIDAR_POLY.
Check edges of both polygon files to ensure there are no overlapping polygons. Then for the existing
polygons run zonalstats using the FCO_NVI_LIDAR.OBJECTID field to generate tables called
BA75_EXISTING, HT75_EXISTING and TPH75_EXISTING for the three LiDAR attirbutes. For the new
polygons, run zonalstats using the NEW_LIDAR_POLY.OBJECTID_1 field to generate tables called BA75,
HT75 and TPH75 for the three LiDAR attributes.
Published Data Once the data was organized into the MDB files for each mapsheet as per the VRIMS standard, these were isolated into three separate datasets, namely; New, Existing or Combo based on the integration process. Figure 4 shows how these datasets are distributed across the project area.

2015 Attribute Adjustment for MPB and Fire Page 14 December 2016
Figure 4– Mapsheets highlighted based on integration process. New polygons are those to be added into
the inventory, existing polygons are those that will have the attributes updated and combo mapsheets
have both cases.
For the NEW polygons, the three tables embedded in each mapsheet MDB are joined to the
NEW_LIDAR_POLY table using the links illustrated in Figure 5.
Figure 5 – New polygon links to basal area (BA75), stand height (HT75) and stand density (TPH75)
attribute tables.

2015 Attribute Adjustment for MPB and Fire Page 15 December 2016
For updates to existing polygons in the VRIMS system, the links illustrated in Figure 6 are shown where
the attribute tables are linked to FCO_NVI_LIDAR table.
Figure 6 – Existing polygon links to basal area (BA75_EXISTING), stand height (HT75_EXISTING) and stand
density (TPH75_EXISTING) attribute tables.
For the mapsheets that contain a combination of new and existing polygons, Figure 7 illustrates the linkages to the NEW_LIDAR_POLY table and FCO_NVI_LIDAR table.
Figure 7 – Combination of existing polygon links to BA75_EXISTING, HT75_EXISTING and
TPH75_EXISTING attribute tables (left) and new polygon links to BA75, HT75 and TPH75 (right).

2015 Attribute Adjustment for MPB and Fire Page 16 December 2016
Appendix 1
Changes to the VRIMS DATA Structures
Forest Cover Object Table:
THE_FOREST_COVER_OBJECT TABLE:
- No spatial changes, the Forest_Cover_Object_ID will be the same
- The reference year will be changed for the beetle affected stands.
- DISTURBANCE_START_YEAR, DISTURBANCE_END_YEAR, DISTURBANCE_TYPE_CODE will
be populated if no existing code there.
Disturbance Code/Disturbance Start Date/Disturbance End Date/ Disturbance Type Code: The rule to
follow is that the latest disturbance will take priority.. For example if a stand was harvested in 1990 had
mortality due to MPB in 2005 and then burned in 2010 the disturbance code would be for the fire. The
severity would be based on the severity of the fire and would lead to a volume reduction of the live
trees remaining after the MPB attack. The dead layer created for the Pl would be removed as it is likely
no longer there following the fire.
Order of applying the disturbances is important. Ideally this would be by the year of disturbance so that
beetle and fire form the year 2005 would be applied before beetle and fire for the year 2006. Given the
size of the impacted areas for beetle and fire it may only be possible to update for beetle first and then
update for fire.
Care must be taken to make sure that the fire and MPB kill data makes sense. There may be
occurrences where the polygon burned and is then given a MPB mortality. .. Recognising that year of
death for MPB is approximate and Year of Burn is much more reliable where an overlap with fire
occurring first then there will be little need to update for MPB and creation of a dead layer.
Where there is burn following the MPB kill the live layer is reduced further to account for the burn and
the dead layer is removed completely. There is likely little need for burned and mpb killed wood volume
in the provincial inventory.
Interpreter This does not change This field must be all UPPERCASE
Project Name This will change if we use this field to identify “MPB_UPDATE. This in conjunction with
the Data source code will identify the polygons that have been modified using modelled attribute
changes. This field must be all UPPERCASE
Reference Year becomes the year of disturbance for both MPB kill and Fire. The polygon must be
grown to the year of disturbance to reflect the basal area at the time of the disturbance and the stand
attributes that existed then. Tree age and tree height, basal area stems /ha will all be projected to this
new reference year

2015 Attribute Adjustment for MPB and Fire Page 17 December 2016
A new field Estimation_Base_Year will be created and the original Reference year data will populate
this field. This way we can keep track of when the inventory was originally created.
Tree Cover layer Estimated Table
THE_TREE_COVER_LAYER_ESTIMATED:
- The D layer will be added
- The Forest_Cover_Object_ID will be the same
- The table will be re-ordered
- TREE_COVER_LAYER_ESTIMATED_ID will be re-created
- Need a new Data Source code for the beetle adjustment
- The following columns will be populated:
o CROWN_CLOSURE_PCT
o VRI_LIVE_STEMS_PER_HA
o BASAL_AREA
o LAYER_LEVEL_CODE (D layer)
o FOREST_COVER_RANK_CODE (if there is a prime layer switch)
o DATA_SOURCE_BASAL_AREA_CODE
o DATA_SRC_VRI_LIVE_STEM_HA_CODE
o DATA_SOURCE_INTERPRETED_CODE
The Tree Cover Estimated ID and Layer Order will change to reflect the creation of the dead layer
attributes. The layer order for the dead layer will be n+1 the number of layers already existing for that
Forest Cover Object. For example if there is a 2 layer stand the tallest is layer order 1, the next tallest is
layer order 2 and the dead layer independent of height is layer order 3.
Tree Layer order is important for the generation of the VDYP Input Table. The dead Layer is never to be
included in the VDYP input table as the volumes once generated for the dead layer are not to be re-
calculated.
Crown Closure Pct., Basal Area and VRI live stems per ha: These attributes are all modified by the
percent disturbance calculated for the MPB kill or the fire burn severity.
For example Layer 1 Pl100 crown closure 60% Ba/Ha 50m2 Live stems 1000/ha with 50%
mortality becomes layer 1 Crown closure 30% Ba/Ha 25m2 and Live stems=500/ha
Layer “D Ba/Ha 25m2 Live Stems 0/ha
Crown closure is reduced for the live layer up to a minimum value of 10%
There is no crown closure recorded for the ‘D’ layer
Vegetation_Cover_Polygon_Est table: VRI Dead Stems Per Ha = X+ 500 stems/ha

2015 Attribute Adjustment for MPB and Fire Page 18 December 2016
The Basal area is reduced by the mpb factor to the live basal area and the dead basal area is the
remainder from the total supplied basal area – the live basal area.
The total basal area should be within the limits in the original file:
The cap on MPB disturbance is >= 90% to retain 10% of the original stand: For the above example if the
stand is 100% mortality
layer 1 Crown closure 6% Ba/Ha 5m2 and Live stems 100/ha.
The lower threshold on species at 10% so if PL species % is <10% there is no modification to the
polygon.
Data Source Interpreted Code: A new code value is assigned here to indicate that the attributes for this
polygon have been modified from original to reflect a catastrophic disturbance. For now let’s call it Data
source code 25
25 Pandemic/Catastrophic Event Adjustment (i.e. MPB, Spruce Budworm, etc.)
Forest Cover Rank Code: There is no change to this as there are only adjustments to single layer stands
BCLCS is calculated in the VRIMS database upon loading. For this automatic process the following rules
and process will be followed.
BCLCS_LEVEL4_CODE will change as species % changes and the stand changes from being Treed
Coniferous (TC)to Tree Mixed (TM) or Tree Deciduous (TB)

2015 Attribute Adjustment for MPB and Fire Page 19 December 2016
The polygon is classified as Coniferous when trees cover a minimum of 10% of the total polygon area by crown cover, and coniferous trees are 75% or more of the total tree basal area. The polygon is classified as Broadleaf when trees cover a minimum of 10% of the total polygon area by crown cover, and broadleaf trees are 75% or more of the total tree basal area. The polygon is classified as Mixed when trees cover a minimum of 10% of the total polygon area by crown cover, but neither coniferous nor broadleaf trees account for 75% or more of the total tree basal area.
BCLCS_LEVEL5_CODE will change as the modified tree crown closure changes.
DE = Dense
When level 4 is TC, TM Or TB and Tree cover is between 61% and 100% crown closure for the
polygon.
OP = Open
When level 4 is TC, TM Or TB and Tree cover is between 26% and 60% crown closure for the polygon.
SP = Sparse
When level 4 is TC, TM Or TB and Tree cover is between 10% and 25% for the polygon.
Tree Species Estimated Table
The table will be re-ordered
- TREE_SPECIES_ESTIMATED_ID will be re-generated
- The following columns will be repopulated:
o SPECIES_ORDER
o SPECIES_PCT
o AGE
o HEIGHT
o TREE_SPECIES_CODE
o DATA_SOURCE_HEIGHT_CODE
o DATA_SOURCE_AGE_CODE
o TREE_COVER_LAYER_ESTIMATED_ID
Species PCT is recalculated based on the modified basal area.

2015 Attribute Adjustment for MPB and Fire Page 20 December 2016
If the change in basal area results in a change in species order: the species order attribute changes.
If the species order does not change: the age for the species 1 is unchanged and the height is
unchanged.
If the species order changes and the polygon has an age species 2 and height species 2: then this
becomes age and height
If the species order changes and there is only age and height for primary species: then age = age and
height is calculated for second species using site tools.
If the tree species percentage changes but and t he resulting species composition is equal between
species 1 and species 2, For example Pl50 Fd50 then the species order does not change .
If Pl is not the primary species and becomes a part of the Layer D: then Layer D age and height is
calculated using site tools.
DATA_SOURCE_BASAL_AREA_CODE becomes 25
DATA_SOURCE_INTERPRETED_CODE becomes 25
DATA_SRC_VRI_LIVE_STEM_HA_CODE becomes 25
THE_VEGETATION_COVER_POLYGON_EST:
- No spatial changes, the Forest_Cover_Object_ID will be the same
- The reference year will be changed for the beetle affected stands.
- VRI_DEAD_STEMS_PER_HA will be populated for the beetle affected stands.
THE_NON_VEGETATIVE_COVER_EST and THE_LAND_COVER_COMPONENT_EST tables will not
change with the possible exception of the Land Cover Component
Conversion of the LCC
Since we are not going to change polygons from VT to something else, the only thing that is changing is
if the land cover classification changes as the percentage of conifer and deciduous in the polygon. This
is the same change that we are fixing in the BCLCS_LVL_4.
If LCC 1 is TC, TM, TB then LCC1 = BCLC_LVL_4
If LCC 2 is TC, TM, TB then LCC1 = BCLC_LVL_4
If LCC 3 is TC, TM, TB then LCC1 = BCLC_LVL_4

2015 Attribute Adjustment for MPB and Fire Page 21 December 2016
Attributes in VRIMS estimated tables
FOREST_COVER_OBJECT Table MPB Fire Lidar
FOREST_COVER_OBJECT_ID NUMBER(38) No Change No Change No Change
OPENING_NUMBER VARCHAR2(4) No Change No Change No Change
OPENING_ID NUMBER(10) No Change No Change No Change
POLYGON_NUMBER VARCHAR2(16) No Change No Change No Change
POLYGON_AREA NUMBER(15,3) No Change No Change No Change
INTERPRETER VARCHAR2(30) No Change No Change No Change
INTERPRETATION_DATE DATE No Change No Change No Change
PROJECT_NAME VARCHAR2(100) Change to MPB_UPDATE
Change to FIRE_ UPDATE
Change to LIDAR UPDATE
EXPIRY_DATE DATE System Generated
System Generated
System Generated
CREATED_DATE DATE System Generated
System Generated
System Generated
SLIVER_IND VARCHAR2(1) No Change No Change No Change
FREE_TO_GROW_IND VARCHAR2(1) No Change No Change No Change
DISTURBANCE_START_YEAR DATE Change Change No Change
DISTURBANCE_END_YEAR DATE Change Change No Change
DATA_CAPTURE_METHOD_CODE VARCHAR2(10) No Change No Change No Change
DISTURBANCE_CODE VARCHAR2(10) Change Change No Change
DISTURBANCE_TYPE_CODE VARCHAR2(10) Change Change No Change
INVENTORY_STANDARD_CODE VARCHAR2(10) No Change No Change No Change
REFERENCE_YEAR NUMBER(4) Change Change Change
VRIMS_PACKAGE_TRANSACTION_ID NUMBER(10) System generated
System generated
System generated
RETIRED_BY_PACKAGE_TRANS_ID NUMBER(10) System generated
System generated
System generated
ENTRY_TIMESTAMP DATE System generated
System generated
System generated
ENTRY_USERID VARCHAR2(30) System generated
System generated
System generated
UPDATE_TIMESTAMP DATE System generated
System generated
System generated
UPDATE_USERID VARCHAR2(30) System generated
System generated
System generated
GEOMETRY MDSYS.SDO_GEOMETRY No Change No Change No Change
OBJECT_ID AutoNumber System generated
System generated
System generated
GEOMETRY_AREA Number (double) System generated
System generated
System generated
GEOMETRY_LENGTH Number (double) System System System

2015 Attribute Adjustment for MPB and Fire Page 22 December 2016
generated generated generated
Estimation_Base_Year NUMBER(4) Change Change Change
TREE_COVER_LAYER_ESTIMATED Table
TREE_COVER_LAYER_ESTIMATED_ID NUMBER(10) Need to generate for layer D
No Change No Change
LAYER_ORDER NUMBER(3) Need to generate for layer D
No Change No Change
CROWN_CLOSURE_PCT NUMBER(3) Change Change No Change
BASAL_AREA NUMBER(10,6) Change Change Change
VRI_LIVE_STEMS_PER_HA NUMBER(8,3) Change Change Change
ESTIMATED_SITE_INDEX NUMBER(5,3) No Change No Change No Change
COVER_PATTERN_CODE VARCHAR2(10) No Change No Change No Change
DATA_SOURCE_BASAL_AREA_CODE VARCHAR2(10) Data Source Code= 25 Modelled attributes
Data Source Code= 26 Modelled attributes
Data Source Code= 30 or31 Modelled attributes
DATA_SOURCE_INTERPRETED_CODE VARCHAR2(10) Data Source Code= 25 Modelled attributes
No Change No Change
DATA_SRC_VRI_LIVE_STEM_HA_CODE VARCHAR2(10) Data Source Code= 25 Modelled attributes
Data Source Code= 26 Modelled attributes
Data Source Code= 30 or 31 Modelled attributes
ESTIMATED_SINDEX_SOURCE_CODE VARCHAR2(10) No Change No Change No Change
FOREST_COVER_OBJECT_ID NUMBER(38) No Change No Change No Change
FOREST_COVER_RANK_CODE VARCHAR2(10) This may change
No Change No Change
LAYER_LEVEL_CODE VARCHAR2(10) Need to generate for layer D
No Change No Change
NON_FOREST_DESCRIPTOR_CODE VARCHAR2(10) No Change No Change No Change
TREE_SPECIES_CODE VARCHAR2(10) No Change No Change No Change
VERTICAL_COMPLEXITY_CODE VARCHAR2(10) No Change No Change No Change
ENTRY_TIMESTAMP DATE System generated
System generated
System generated
ENTRY_USERID VARCHAR2(30) System generated
System generated
System generated
UPDATE_TIMESTAMP DATE System generated
System generated
System generated

2015 Attribute Adjustment for MPB and Fire Page 23 December 2016
UPDATE_USERID VARCHAR2(30) System generated
System generated
System generated
TREE_SPECIES_ESTIMATED Table
TREE_SPECIES_ESTIMATED_ID NUMBER(10) No Change No Change No Change
SPECIES_ORDER NUMBER(1) Change No Change No Change
SPECIES_PCT NUMBER(5,2) Change No Change No Change
AGE NUMBER(4,1) Change Change Change
HEIGHT NUMBER(5,3) Change Change Change
TREE_SPECIES_CODE VARCHAR2(10) Change No Change No Change
DATA_SOURCE_HEIGHT_CODE VARCHAR2(10) Data Source Code=25 Modelled attributes
Data Source Code= 26 Modelled attributes
Data Source Code= 30 or 31 Modelled attributes
DATA_SOURCE_AGE_CODE VARCHAR2(10) Data Source Code= 25 Modelled attributes
Data Source Code= 26 Modelled attributes
Data Source Code= 30 or 31 Modelled attributes
TREE_COVER_LAYER_ESTIMATED_ID NUMBER(10) Need to generate for layer D
No Change No Change
ENTRY_TIMESTAMP DATE System generated
System generated
System generated
ENTRY_USERID VARCHAR2(30) System generated
System generated
System generated
UPDATE_TIMESTAMP DATE System generated
System generated
System generated
UPDATE_USERID VARCHAR2(30) System generated
System generated
System generated
VEGETATION_COVER_POLYGON_EST Table
FOREST_COVER_OBJECT_ID NUMBER(38) No Change No Change No Change
INPUT_DATE DATE No Change No Change No Change
VRI_DEAD_STEMS_PER_HA NUMBER(4) Change Change No Change
SHRUB_HEIGHT NUMBER(4,1) No Change No Change No Change
SHRUB_CROWN_CLOSURE NUMBER(3) No Change No Change No Change
HERB_COVER_PCT NUMBER(3) No Change No Change No Change
BRYOID_COVER_PCT NUMBER(3) No Change No Change No Change
REFERENCE_YEAR NUMBER(4) Change Change Change
ALPINE_DESIGNATION_CODE VARCHAR2(10) No Change No Change No Change
BEC_ZONE_CODE VARCHAR2(10) No Change No Change No Change
DATA_SOURCE_ECOSYS_CLASS_CODE VARCHAR2(10) No Change No Change No Change
HERB_COVER_TYPE_CODE VARCHAR2(10) No Change No Change No Change

2015 Attribute Adjustment for MPB and Fire Page 24 December 2016
MODIFYING_PROCESS_CODE VARCHAR2(10) No Change No Change No Change
NON_PRODUCTIVE_CODE VARCHAR2(10) No Change No Change No Change
NON_PRODUCTIVE_DESCRIPTOR_CODE VARCHAR2(10) No Change No Change No Change
SITE_POSITION_MESO_CODE VARCHAR2(10) No Change No Change No Change
SOIL_NUTRIENT_REGIME_CODE VARCHAR2(10) No Change No Change No Change
SURFACE_EXPRESSION_CODE VARCHAR2(10) No Change No Change No Change
COVER_PATTERN_CODE VARCHAR2(10) No Change No Change No Change
HERB_COVER_PATTERN_CODE VARCHAR2(10) No Change No Change No Change
BCLCS_LEVEL1_CODE VARCHAR2(10) No Change No Change No Change
BCLCS_LEVEL2_CODE VARCHAR2(10) No Change No Change No Change
BCLCS_LEVEL3_CODE VARCHAR2(10) No Change No Change No Change
BCLCS_LEVEL4_CODE VARCHAR2(10) Can change as Species changes
No Change No Change
BCLCS_LEVEL5_CODE VARCHAR2(10) Can change as Crown Closure changes
Can change as Crown Closure changes
No Change
ENTRY_TIMESTAMP DATE System generated
System generated
System generated
ENTRY_USERID VARCHAR2(30) System generated
System generated
System generated
UPDATE_TIMESTAMP DATE System generated
System generated
System generated
NON_VEGETATIVE_COVER_EST Table
NON_VEGETATIVE_COVER_EST_ID NUMBER(10) No Change No Change No Change
NON_VEG_ORDER NUMBER(3) No Change No Change No Change
NON_VEG_COVER_PCT NUMBER(3) No Change No Change No Change
NON_VEG_COVER_TYPE_CODE VARCHAR2(10) No Change No Change No Change
COVER_PATTERN_CODE VARCHAR2(10) No Change No Change No Change
FOREST_COVER_OBJECT_ID NUMBER(38) No Change No Change No Change
LAYER_LEVEL_CODE VARCHAR2(10) No Change No Change No Change
ENTRY_TIMESTAMP DATE System generated
System generated
System generated
ENTRY_USERID VARCHAR2(30) System generated
System generated
System generated
UPDATE_TIMESTAMP DATE System generated
System generated
System generated
UPDATE_USERID VARCHAR2(30) System generated
System generated
System generated
LAND_COVER_COMPONENT_EST Table
LAND_COVER_COMPONENT_EST_ID NUMBER(10) No Change No Change No Change

2015 Attribute Adjustment for MPB and Fire Page 25 December 2016
LAND_COVER_ORDER NUMBER(3) No Change No Change No Change
COVERAGE_PCT NUMBER(3) No Change No Change No Change
FOREST_COVER_OBJECT_ID NUMBER(38) No Change No Change No Change
LAND_COVER_CLASS_CODE VARCHAR2(10) No Change No Change No Change
LAND_COVER_LEVEL_CODE VARCHAR2(10) No Change No Change No Change
SOIL_MOISTURE_REGIME_CODE VARCHAR2(10) No Change No Change No Change
ENTRY_TIMESTAMP DATE No Change No Change No Change
ENTRY_USERID VARCHAR2(30) No Change No Change No Change
UPDATE_TIMESTAMP DATE No Change No Change No Change
UPDATE_USERID VARCHAR2(30) No Change No Change No Change
PROJECTED_YIELD_EST Table
TREE_COVER_LAYER_ESTIMATED_ID NUMBER(10) Need to generate for layer D
PROJECTED_YIELD_ID NUMBER(10)
PROJECTED_YEAR NUMBER(4)
DBH_LIMIT NUMBER(10)
BASAL_AREA NUMBER(10,6)
DIAMETER NUMBER(10)
LOREY_HEIGHT NUMBER(5,3)
TREES_PER_HECTARE NUMBER(8,3)
VOLUME_CLOSE_UTILIZATION
VOLUME_LESS_DECAY
VOLUME_LESS_DECAY_WASTE
VOLUME_LESS_DECAY_WASTE_BREAK
VOLUME_WHOLE_STEM
TREE_SPECIES_ESTIMATED_ID NUMBER(10)
ENTRY_TIMESTAMP DATE
ENTRY_USERID VARCHAR2(30)
UPDATE_TIMESTAMP DATE
UPDATE_USERID VARCHAR2(30)

2015 Attribute Adjustment for MPB and Fire Page 26 December 2016
Appendix 2
Changes to VEG_COMP_LYR_R1_POLY to account for Mountain Pine Beetle Losses in 2012-14
Background: British Columbia (B.C.) is currently experiencing the largest mountain pine beetle infestation
ever recorded in North America. By the year 2017, the MPB is forecast to destroy about 57 per
cent of the merchantable pine volume that was on the provincial land base at the start of the
infestation.
A recognised weakness in the provincial forest cover inventory is the difficulty to update for catastrophic natural events like the impact of the mountain pine beetle. Three key questions must be answered to determine the impact of MPB on the Forest Inventory.
How to decide if the pine is dead? (What tools, rules and when?)
What attributes do users need? (age, height, live density, dead stems per ha, volume live, and volume dead)
Has the inventory been estimated using conditions prior to the MPB disturbance or post the MPB disturbance. This is illustrated in examples 1 and 2 below.
Conversion of live standing volume to dead volume follow predictions made using the
provincial MPB model and the 2010 aerial overview surveys. The Year of Disturbance for this
stand mortality is determined using satellite image analysis to determine the Year of
Death. The loss predictions were applied to the individual forest cover polygons to provide an
analysis ready dataset for strategic decision makers.
Information on the Provincial Mountain Pine Beetle prediction model is found
here: http://www.for.gov.bc.ca/hre/bcmpb/
Methodology: Example 1: To account for the volume losses in a given VRI stand in an inventory done prior to
MPB the following data changes were completed:
1. To account for the losses for MPB killed forest stands two datasets have been used:
Year of Death (YOD). It was completed for 22 impacted forest districts using satellite imagery between 2000 and 2008. This identifies stands that have changed to „Red Attack‟ during this period. The analysis was unable to identify the initial „Green Attack‟. Methodology for the YOD mapping is found here: http://www.for.gov.bc.ca/hts/rs/beetle_detection.html
BCMPB (cumkill2010). It is a cumulative kill raster dataset. For more information see: http://www.for.gov.bc.ca/hre/bcmpb/

2015 Attribute Adjustment for MPB and Fire Page 27 December 2016
The BCMPB rasters are cells of 16ha. In each cell is a single percentage cumulative
kill for the pine.
400m
400m
BCMPB Raster Cells
2. The BCMPB data was used to determine the amount of pine killed, dead stems per ha
and dead volume per ha and dead stems per ha (Appendix 1): Provincial forest cover was overlaid with BCMPB data layer. This layer is not
restricted to the 22 Timber Supply Areas. As a result some beetle kill is found on the eastern portions of coastal Timber Supply Areas like Midcoast or the Fraser TSA.
Percent of pine killed in the VRI polygon was determined by the area weighted of total BCMPB percent of pine killed with the VRI polygon. Pine is considered to be lodgepole pine (Pl, Pli, Plc), pondersoa or yellow pine (Py), whitebark pine (Pa),

2015 Attribute Adjustment for MPB and Fire Page 28 December 2016
and western white pine (Pw).
400m
400m
BCMPB Raster Cells
Forest Cover Polygon
Pl 80 Sw2090 yrs,27.0 m 32 m2 BA, 980 live stems per ha,450 dead stems per ha, PL total volume 180m3/haSw live volume 40m3/ha
The percent of pine killed was used to determine the dead volume per ha. The
live volume per ha was recalculated as the total vol.
400m
400m
BCMPB Raster Cells
Forest Cover Polygon
Pl 80 Sw2090 yrs,27.0 m 32 m2 BA, 980 live stems per ha,450 dead stems per ha, PL total volume 180m3/haSw live volume 40m3/ha
40%
40%
50%
30%
4ha
4ha
6 ha
2ha
Area weighted total BCMPB Kill:live pine vol/ha= original live pine vol/ha*(1-cumulative kill factor)
Live pine vol/ha=180(1-0.40)= 108m3/ha
Dead pine volume = original live pine vol/ha*(cumulative kill factor)Dead pine volume = 180(0.40) = 72m3/ha

2015 Attribute Adjustment for MPB and Fire Page 29 December 2016
40%
40%
50%
30%
4ha
4ha
6 ha
2ha
Area weighted total BCMPB Kill:live pine vol/ha= original live pine vol/ha*(1-cumulative kill factor)
1) Live pine vol/ha=180(1-0.40)= 108m3/ha* 6ha=648m32) Live pine vol/ha=180(1-030)= 126m3/ha*4ha=504m33) Live pine vol/ha=180(1-0.50)= 90m3/ha*2ha=180m34) Live pine vol/ha=180(1-0.40)= 108m3/ha*4ha=432m3
Dead pine volume = original live pine vol/ha*(cumulative kill factor)1) Dead pine volume = 180(0.40) = 72m3/ha*6ha=432m32) Dead pine volume = 180(0.30) = 54m3/ha*4ha=216m33) Dead pine volume = 180(0.50) = 90m3/ha*2ha=180m34) Dead pine volume = 180(0.40) = 72m3/ha**4ha=288m3
40%
40%
50%
30%
4ha
4ha
6 ha
2ha
Total live volume =648+504+180+432=1764m3
Total Dead Volume = 432+216+180+288=1116m3

2015 Attribute Adjustment for MPB and Fire Page 30 December 2016
40%
40%
50%
30%
4ha
4ha
6 ha
2ha
Live volume per ha=total live volume/areaLive Volume per ha= 1764/16 =110m3/ha
Dead volume per ha= total dead volume/area = 1116/16=70m3/ha
40%
40%
50%
30%
4ha
4ha
6 ha
2ha
Percentage Kill= total dead/total live + dead=1116/(1764+1116) = 39%
The dead stems per ha and live stems per ha was calculated.

2015 Attribute Adjustment for MPB and Fire Page 31 December 2016
40%
40%
50%
30%
4ha
4ha
6 ha
2ha
Dead stems/ha=Original live stems/ha*%Pine*Percentage kill +dead stems/haDead stems/ha= ((980*0.8)*0.39)+ 450= 756 dead stems per ha
Live stems/ha= original live stems per ha- new dead stems per haLive stems/ha= 980-306= 674 live stems/ha
The calculated volume information was done for all utilization levels, 12.5,17,5
and 22.5.
3. The YOD data was used to determine the Year of infestation for each VRI polygon
identified by the BCMPB as having dead pine..
Provincial forest cover was overlaid with YOD data layer.
For polygons with more than one YOD identified, the YOD value that accounts for the largest area with the polygons becomes the YOD for the entire polygon.
For polygons where no year of death was identified the YOD was based on the nearest year of death polygon in the YOD dataset.

2015 Attribute Adjustment for MPB and Fire Page 32 December 2016
YOD 2005
YOD 2006
Polygon 1
Polygon 2
Polygon 1 Majority of polygon is in YOD=2005Polygon 2 Closest YOD Polygon is 2006
Example 2: For a given VRI stand in the inventory done after MPB For the newer inventory areas, since the dead pine information was captured for the live and dead stems per ha and the species composition already, the dead volume per ha was calculated using a different approach ( Appendix 1) : Calculated the ratio of the total live stems and dead stems for pine from the
captured information.
The dead volume information was calculated using the same ratio of the live stems per ha and dead stems per ha for pine. The live volume per ha was recalculated accordingly.
The calculated volume information was done for all utilization levels, 12.5, 17.5 and 22.5.

2015 Attribute Adjustment for MPB and Fire Page 33 December 2016
Forest Cover Polygon
Sw 80 Pl2090 yrs,27.0 m 32 m2 BA, 280 live stems per ha,1450 dead stems per ha, Sw live volume 40m3/haPL live volume 15m3/ha
Post MPB Polygon
Live Pine stems per ha =280*0.2=56 stems per haLive pl volume per stem =15m3/ha/56 stems/ha=0.27m3/stemDead Pl volume=1450 stems/ha*0.27 m3/stem= 388 m3/ha
4. For stands impacted by a volume reduction the EARLIEST_NONLOGGING_DIST_TYPE is
updated to ‘I’ to reflect Insect and the EARLIEST_NONLOGGING_DIST_DATE was updated to the year of death determined from YOD data set.
5. The STAND_PERCENTAGE_DEAD column was populated with the calculated percentage dead (in this example 39%).
6. The map label was updated to reflect the disturbance history. This helps identify impacted stands when plotting forest cover maps.
Figure For a given VRI stand in the inventory done prior to MPB
Appendix 3

2015 Attribute Adjustment for MPB and Fire Page 34 December 2016
Methodology for example 1: To account for the volume losses in a given VRI stand in an inventory
done prior to MPB
𝜃𝑝 : original pine percentage in species composition;
v : original total stand volume;
n : the number of overlayed BCMPB polygons;
𝑎𝑘 (k=1, 2,3 …n): the area of the kth BCMPB overlay polygon;
a: area of the stand, 𝑎 = ∑ 𝑎𝑘𝑛𝑘=1
𝜌𝑘 : percentage kill of the kth BCMPB overlay polygon;
𝑣𝑝𝑘 : live pine volume of the kth BCMPB overlay polygon, where 𝑣𝑝𝑘 = 𝑣 ∗ 𝜃𝑝 ∗ (1 − 𝜌𝑘);
𝑣𝑑𝑘 : dead pine volume of the kth BCMPB overlay polygon, where 𝑣𝑑𝑘 = 𝑣 ∗ 𝜃𝑝 ∗ 𝜌𝑘
Area weighted live pine volume: 𝑣𝑙𝑝
𝑣𝑙𝑝 =1
𝑎∑ 𝑎𝑘
𝑛
𝑘=1
∗ 𝑣𝑝𝑘
Area weighted dead pine volume: 𝑣𝑑𝑝
𝑣𝑑𝑝 =1
𝑎∑ 𝑎𝑘
𝑛
𝑘=1
∗ 𝑣𝑑𝑘
Percentage of total kill: 𝜌
𝜌 =1
𝑎∑ 𝑎𝑘
𝑛
𝑘=1
∗ 𝜌𝑘
For live and dead trees per ha (tph), replace the volume items with tph
Methodology for example 2
For a given VRI stand in the inventory done after MPB

2015 Attribute Adjustment for MPB and Fire Page 35 December 2016
v : stand volume;
𝜃𝑝 : pine percentage in species composition;
𝑡𝑙 : total live stems per ha;
𝑡𝑑 : total dead stems per ha
𝑡𝑙𝑝: lived pine stems per ha, 𝑡𝑙𝑝 = 𝑡𝑙 ∗ 𝜃𝑝
𝑣𝑝 : live pine volume, 𝑣𝑝 = 𝑣 ∗ 𝜃𝑝
The dead pine volume: 𝑣𝑑𝑝
𝑣𝑑𝑝 =𝑡𝑙 ∗ 𝑣𝑝
𝑡𝑙𝑝