administrator's guide release 3.7 - oracle · oracle® coherence administrator's guide...
TRANSCRIPT
Oracle® CoherenceAdministrator's Guide
Release 3.7.1
E22838-01
September 2011
provides key administration concepts and detailed instructions for administering Coherence clusters and caches.

Oracle Coherence Administrator's Guide, Release 3.7.1
E22838-01
Copyright © 2011, Oracle and/or its affiliates. All rights reserved.
Primary Author: Joe Ruzzi
This software and related documentation are provided under a license agreement containing restrictions on use and disclosure and are protected by intellectual property laws. Except as expressly permitted in your license agreement or allowed by law, you may not use, copy, reproduce, translate, broadcast, modify, license, transmit, distribute, exhibit, perform, publish, or display any part, in any form, or by any means. Reverse engineering, disassembly, or decompilation of this software, unless required by law for interoperability, is prohibited.
The information contained herein is subject to change without notice and is not warranted to be error-free. If you find any errors, please report them to us in writing.
If this is software or related documentation that is delivered to the U.S. Government or anyone licensing it on behalf of the U.S. Government, the following notice is applicable:
U.S. GOVERNMENT RIGHTS Programs, software, databases, and related documentation and technical data delivered to U.S. Government customers are "commercial computer software" or "commercial technical data" pursuant to the applicable Federal Acquisition Regulation and agency-specific supplemental regulations. As such, the use, duplication, disclosure, modification, and adaptation shall be subject to the restrictions and license terms set forth in the applicable Government contract, and, to the extent applicable by the terms of the Government contract, the additional rights set forth in FAR 52.227-19, Commercial Computer Software License (December 2007). Oracle USA, Inc., 500 Oracle Parkway, Redwood City, CA 94065.
This software or hardware is developed for general use in a variety of information management applications. It is not developed or intended for use in any inherently dangerous applications, including applications that may create a risk of personal injury. If you use this software or hardware in dangerous applications, then you shall be responsible to take all appropriate fail-safe, backup, redundancy, and other measures to ensure its safe use. Oracle Corporation and its affiliates disclaim any liability for any damages caused by use of this software or hardware in dangerous applications.
Oracle is a registered trademark of Oracle Corporation and/or its affiliates. Other names may be trademarks of their respective owners.
This software and documentation may provide access to or information on content, products, and services from third parties. Oracle Corporation and its affiliates are not responsible for and expressly disclaim all warranties of any kind with respect to third-party content, products, and services. Oracle Corporation and its affiliates will not be responsible for any loss, costs, or damages incurred due to your access to or use of third-party content, products, or services.
iii
Contents
Preface ................................................................................................................................................................ vii
Audience...................................................................................................................................................... viiDocumentation Accessibility .................................................................................................................... viiRelated Documents .................................................................................................................................... viiConventions ............................................................................................................................................... viii
1 Deploying Coherence-Based Applications
Deploying Coherence with a Standalone Application ..................................................................... 1-1Deploying Coherence to an Application Server ................................................................................ 1-1
Deploying Coherence as an Application Server Library.............................................................. 1-2Deploying Coherence in a Java EE Module ................................................................................... 1-2
Deploying Coherence Within an EAR ..................................................................................... 1-2Deploying Coherence Within a WAR...................................................................................... 1-3
Running Multiple Applications in a Single Cluster ......................................................................... 1-3Specifying a Scope Name.................................................................................................................. 1-3Scoping Applications in a JavaEE Environment ........................................................................... 1-4
Isolating Applications in a JavaEE Environment ................................................................... 1-4Sharing Application Data in a JavaEE Environment ............................................................. 1-5
Scoping Applications in a Standalone Environment .................................................................... 1-5Providing a Custom Scope Resolver ............................................................................................... 1-6
2 Platform-Specific Deployment Considerations
Deploying to AIX ..................................................................................................................................... 2-1Multicast and IPv6 ............................................................................................................................. 2-1Unique Multicast Addresses and Ports .......................................................................................... 2-1
Deploying to Cisco Switches ................................................................................................................. 2-2Buffer Space and Packet Pauses ...................................................................................................... 2-2Multicast Connectivity on Large Networks ................................................................................... 2-2Multicast Outages .............................................................................................................................. 2-2
Deploying to Foundry Switches............................................................................................................ 2-4Multicast Connectivity ...................................................................................................................... 2-4
Deploying to IBM BladeCenters ........................................................................................................... 2-5MAC Address Uniformity and Load Balancing............................................................................ 2-5
Deploying to IBM JVMs ......................................................................................................................... 2-5OutOfMemoryError........................................................................................................................... 2-5
iv
Heap Sizing ......................................................................................................................................... 2-5Deploying to Linux .................................................................................................................................. 2-6
Native POSIX Thread Library (NPTL) ........................................................................................... 2-6TSC High Resolution Timesource ................................................................................................... 2-6
Deploying to Oracle JRockit JVMs....................................................................................................... 2-7JRockit and the Native Posix Thread Library (NPTL) .................................................................. 2-7OutOfMemoryError........................................................................................................................... 2-7
Deploying to Oracle JVMs ..................................................................................................................... 2-7Heap Sizes ........................................................................................................................................... 2-7AtomicLong ........................................................................................................................................ 2-7OutOfMemoryError........................................................................................................................... 2-7
Deploying to OS X ................................................................................................................................... 2-8Multicast and IPv6 ............................................................................................................................. 2-8Unique Multicast Addresses and Ports .......................................................................................... 2-8Socket Buffer Sizing ........................................................................................................................... 2-8
Deploying to Solaris ................................................................................................................................ 2-8Solaris 10 (x86 and SPARC) .............................................................................................................. 2-8Solaris 10 Networking ....................................................................................................................... 2-9
Deploying to Virtual Machines ............................................................................................................. 2-9Supported Deployment..................................................................................................................... 2-9Multicast Connectivity ...................................................................................................................... 2-9Performance ........................................................................................................................................ 2-9Fault Tolerance ................................................................................................................................... 2-9
Deploying to Windows ........................................................................................................................ 2-10Performance Tuning ....................................................................................................................... 2-10Personal Firewalls ........................................................................................................................... 2-10Disconnected Network Interface .................................................................................................. 2-10
Deploying to z/OS ................................................................................................................................. 2-10EBCDIC............................................................................................................................................. 2-11Multicast ........................................................................................................................................... 2-11
3 Evaluating Performance and Scalability
Measuring Latency and Throughput.................................................................................................... 3-1Demonstrating Scalability ...................................................................................................................... 3-1Tuning Your Environment ...................................................................................................................... 3-2Evaluating the Measurements of a Large Sample Cluster ............................................................... 3-2Scalability: A Test Case ........................................................................................................................... 3-3
Overview of the Scalability Test Case ............................................................................................. 3-3Step 1: Create Test Data for Aggregation ....................................................................................... 3-4Step 2: Configure a Partitioned Cache ............................................................................................ 3-6Step 3: Add an Index.......................................................................................................................... 3-6Step 4: Perform a Parallel Aggregation........................................................................................... 3-7Step 5: Run the Aggregation Test Case........................................................................................... 3-7Step 6: Analyzing the Results ........................................................................................................... 3-8
4 Performing a Network Performance Test
Running the Datagram Test Utility....................................................................................................... 4-1
v
How to Test Network Performance....................................................................................................... 4-2Performing a Bidirectional Test ....................................................................................................... 4-3Performing a Distributed Test.......................................................................................................... 4-4
Understanding Report Statistics ........................................................................................................... 4-4
5 Performing a Multicast Connectivity Test
Running the Multicast Test Utility ....................................................................................................... 5-1How to Test Multicast .............................................................................................................................. 5-2Troubleshooting Multicast Communications ..................................................................................... 5-3
6 Performance Tuning
Operating System Tuning ....................................................................................................................... 6-1Socket Buffer Sizes ............................................................................................................................. 6-1High Resolution timesource (Linux) ............................................................................................... 6-2Datagram size (Microsoft Windows) .............................................................................................. 6-3Thread Scheduling (Microsoft Windows) ...................................................................................... 6-3Swapping............................................................................................................................................. 6-4Load Balancing Network Interrupts (Linux) ................................................................................. 6-4
Network Tuning........................................................................................................................................ 6-6Network Interface Settings ............................................................................................................... 6-6Bus Considerations ............................................................................................................................ 6-7Network Infrastructure Settings ...................................................................................................... 6-7Switch and Subnet Considerations.................................................................................................. 6-7Ethernet Flow-Control....................................................................................................................... 6-8Path MTU ............................................................................................................................................ 6-8
JVM Tuning ............................................................................................................................................... 6-9Basic Sizing Recommendation ......................................................................................................... 6-9Heap Size Considerations ................................................................................................................. 6-9
General Guidelines .................................................................................................................. 6-10Moving the Cache Out of the Application Heap................................................................. 6-12
Garbage Collection Monitoring .................................................................................................... 6-13Coherence Communication Tuning ................................................................................................... 6-14
Validation ......................................................................................................................................... 6-14Data Access Patterns ............................................................................................................................. 6-14
Data Access Distribution (hot spots) ............................................................................................ 6-15Cluster-node Affinity...................................................................................................................... 6-15Read/Write Ratio and Data Sizes................................................................................................. 6-15Interleaving Cache Reads and Writes .......................................................................................... 6-15
7 Production Checklist
Network Recommendations................................................................................................................... 7-1Cache Size Calculation Recommendations ......................................................................................... 7-3Hardware Recommendations................................................................................................................. 7-5Operating System Recommendations .................................................................................................. 7-7JVM Recommendations .......................................................................................................................... 7-8Security Recommendations................................................................................................................. 7-10

vi
Application Instrumentation Recommendations ........................................................................... 7-10Coherence Modes and Editions .......................................................................................................... 7-11Coherence Operational Configuration Recommendations........................................................... 7-12Coherence Cache Configuration Recommendations ..................................................................... 7-13Large Cluster Configuration Recommendations ............................................................................ 7-14Death Detection Recommendations .................................................................................................. 7-14TCMP Log Messages .............................................................................................................................. A-1Configuration Log Messages ................................................................................................................ A-7Partitioned Cache Service Log Messages............................................................................................ A-8
vii
Preface
Welcome to Oracle Coherence Administrator's Guide. This document provides key administration concepts and detailed instructions for administering Coherence clusters and caches.
AudienceThe Administrator's Guide is intended for the following audiences:
■ Primary Audience – Administrators and Operators who want to administer Coherence clusters in their network environment.
■ Secondary Audience – System Architects and developers who want to understand the options for administering Coherence.
The audience should be familiar with Java and JavaEE. In addition, the examples in this guide require the installation and use of the Oracle Coherence product. Users should be familiar with running command line scripts.
Documentation AccessibilityFor information about Oracle's commitment to accessibility, visit the Oracle Accessibility Program website at http://www.oracle.com/pls/topic/lookup?ctx=acc&id=docacc.
Access to Oracle SupportOracle customers have access to electronic support through My Oracle Support. For information, visit http://www.oracle.com/pls/topic/lookup?ctx=acc&id=info or visit http://www.oracle.com/pls/topic/lookup?ctx=acc&id=trs if you are hearing impaired.
Related DocumentsFor more information, see the following documents that are included in the Oracle Coherence documentation set:
■ Oracle Coherence Developer's Guide
■ Oracle Coherence Client Guide
■ Oracle Coherence Getting Started Guide
■ Oracle Coherence Integration Guide for Oracle Coherence
viii
■ Oracle Coherence Management Guide
■ Oracle Coherence Security Guide
■ Oracle Coherence Tutorial for Oracle Coherence
■ Oracle Coherence User's Guide for Oracle Coherence*Web
■ Oracle Coherence Java API Reference
■ Oracle Coherence C++ API Reference
■ Oracle Coherence .NET API Reference
■ Oracle Coherence Release Notes for Oracle Coherence
ConventionsThe following text conventions are used in this document:
Convention Meaning
boldface Boldface type indicates graphical user interface elements associated with an action, or terms defined in text or the glossary.
italic Italic type indicates book titles, emphasis, or placeholder variables for which you supply particular values.
monospace Monospace type indicates commands within a paragraph, URLs, code in examples, text that appears on the screen, or text that you enter.
1
Deploying Coherence-Based Applications 1-1
1Deploying Coherence-Based Applications
This chapter provides instructions for deploying Coherence into a run-time environment.
The following sections are included in this chapter:
■ Deploying Coherence with a Standalone Application
■ Deploying Coherence to an Application Server
■ Running Multiple Applications in a Single Cluster
Deploying Coherence with a Standalone ApplicationStandalone applications that leverage Coherence must include the COHERENCE_HOME/lib/coherence.jar library on the application’s classpath. Any Coherence configuration files must also be included in the classpath and must appear before the Coherence library. For more information on configuration, see Oracle Coherence Developer's Guide.
The following example starts an application called MyApp. The classpath includes the coherence.jar library and the location (COHERENCE_HOME) that contains the tangosol-coherence-override.xml and coherence-cache-config.xml configuration files.
java -jar -cp COHERENCE_HOME;COHERENCE_HOME\lib\coherence.jar com.MyApp
Deploying Coherence to an Application ServerJava EE applications that leverage Coherence have two options for deploying Coherence: as an application server library or as part of a Java EE module. Coherence cluster members are class loader scoped. Therefore, the option selected results in a different deployment scenario. All modules share a single cluster member if Coherence is deployed as an application server library. Whereas, a Java EE module is its own cluster member if Coherence is deployed as part of the module. Each option has its own benefits and assumptions and generally balances resource utilization with how isolated the cluster member is from other modules.
Note: This section does not include instructions for deploying Coherence*Web. See the Oracle Coherence*Web User's Guide for instructions on deploying Coherence*Web and clustering HTTP session data.
Deploying Coherence to an Application Server
1-2 Oracle Coherence Administrator's Guide
Deploying Coherence as an Application Server LibraryCoherence can be deployed as an application server library. In this deployment scenario, an application server’s startup classpath is modified to include the COHERENCE_HOME/lib/coherence.jar library. In addition, any objects that are being placed into the cache must also be available in the server’s classpath. Consult your application server vendor’s documentation for instructions on adding libraries to the server’s classpath.
This scenario results in a single cluster member that is shared by all applications that are deployed in the server’s containers. This scenario minimizes resource utilization because only one copy of the Coherence classes are loaded into the JVM. See "Running Multiple Applications in a Single Cluster" on page 1-3 for detailed instructions on isolating Coherence applications from each other when choosing this deployment style.
Deploying Coherence in a Java EE ModuleCoherence can be deployed within an EAR file or a WAR file. This style of deployment is generally preferred because modification to the application server run-time environment is not required and because cluster members are isolated to either the EAR or WAR.
Deploying Coherence Within an EARCoherence can be deployed as part of an EAR. This deployment scenario results in a single cluster member that is shared by all Web applications in the EAR. Resource utilization is moderate because only one copy of the Coherence classes are loaded per EAR. However, all Web applications may be affected by any one module’s use of the cluster member. See "Running Multiple Applications in a Single Cluster" on page 1-3 for detailed instructions for isolating Coherence applications from each other.
To deploy Coherence within an enterprise application:
1. Copy the coherence.jar library to a location within the enterprise application directory structure.
2. Using a text editor, open the META-INF/application.xml deployment descriptor.
3. Add a <java> element that contains the path (relative to the top level of the application directory) and name of the coherence library. For example:
<application> <display-name>MyApp</display-name> <module> <java>coherence.jar</java> </module> ...</application>
4. Make sure any objects that are to be placed in the cache are added to the application in the same manner as described above.
5. Save and close the descriptor.
6. package and deploy the application.
Running Multiple Applications in a Single Cluster
Deploying Coherence-Based Applications 1-3
Deploying Coherence Within a WARCoherence can be deployed as part of a Web application. This deployment scenario results in each Web application having its own cluster member, which is isolated from all other Web applications. This scenario uses the most amount of resources because there are as many copies of the Coherence classes loaded as there are deployed Web applications that include Coherence. This scenario is ideal when deploying only a few Web applications to an application server.
To deploy Coherence within a Web application:
1. Copy the coherence.jar library to the Web Application’s WEB-INF/lib directory.
2. Make sure any objects that are to be placed in the cache are located in either the WEB-INF/lib or WEB-INF/classes directory.
3. Package and deploy the application.
Running Multiple Applications in a Single ClusterCoherence can be deployed in shared environments where multiple applications use the same cluster but define their own set of Coherence caches and services. For such scenarios, each application uses its own cache configuration file that includes a scope name that controls whether the caches and services are allowed to be shared among applications.
The following topics are included in this section:
■ Specifying a Scope Name
■ Scoping Applications in a JavaEE Environment
■ Scoping Applications in a Standalone Environment
■ Providing a Custom Scope Resolver
Specifying a Scope NameThe <scope-name> element is used to specify a name that uniquely identifies the caches and services in a cache configuration file. If specified, all caches and service are isolated and cannot be used by other applications that run on the same cluster.
The following example configures a scope name called accounts and results in the use of accounts as a prefix to all services instantiated by the ConfigurableCacheFactory that is created based on the configuration. The scope name is an attribute of a cache factory instance and only affects that cache factory instance.
<?xml version='1.0'?>
<cache-config xmlns:xsi="http://www.w3.org/2001/XMLSchema-instance" xmlns="http://xmlns.oracle.com/coherence/coherence-cache-config" xsi:schemaLocation="http://xmlns.oracle.com/coherence/coherence-cache-config coherence-cache-config.xsd"> <scope-name>accounts</scope-name>
Note: The prefix is only used for service names, not cache names. In addition, applications that do not explicitly configure a scope name are able to join each other and share caches and services.
Running Multiple Applications in a Single Cluster
1-4 Oracle Coherence Administrator's Guide
<caching-scheme-mapping> ...
Scoping Applications in a JavaEE EnvironmentDeploying Coherence as an application server library, or as part of an EAR, allows multiple applications to use the same cluster as a single cluster member (one JVM). In such deployment scenarios, multiple applications may choose to use a single set of Coherence caches and services that are configured in a single coherence-cache-config.xml file. This type of deployment is only suggested (and only practical) in controlled environments where application deployment is coordinated. The likelihood of collisions between caches, services and other configuration settings is high and may lead to unexpected results. Moreover, all applications may be affected by any one application's use of the Coherence node.
The alternative is to have each application include its own cache configuration file that defines the caches and services that are unique to the application. The configurations are then isolated by specifying a scope name using the <scope-name> element in the cache configuration file. Likewise, applications can explicitly allow other applications to share their caches and services if required.
Isolating Applications in a JavaEE EnvironmentThe following example demonstrates the steps that are required to isolate two Web applications (trade.war and accounts.war) from using each other’s caches and services:
1. Create a cache configuration file for the trade application (for example, trade-cache-config.xml) that defines a scope name called trade and include any cache scheme definitions for the application:
<?xml version='1.0'?>
<cache-config xmlns:xsi="http://www.w3.org/2001/XMLSchema-instance" xmlns="http://xmlns.oracle.com/coherence/coherence-cache-config" xsi:schemaLocation="http://xmlns.oracle.com/coherence/coherence-cache-config coherence-cache-config.xsd"> <scope-name>trade</scope-name> ...
2. Create a cache configuration file for the accounts application (for example, accounts-cache-config.xml) that defines a scope name called accounts and include any cache scheme definitions for the application:
<?xml version='1.0'?>
<cache-config xmlns:xsi="http://www.w3.org/2001/XMLSchema-instance" xmlns="http://xmlns.oracle.com/coherence/coherence-cache-config" xsi:schemaLocation="http://xmlns.oracle.com/coherence/coherence-cache-config coherence-cache-config.xsd"> <scope-name>accounts</scope-name> ...
Note: This scenario assumes that a single JVM contains multiple instances of ConfigurableCacheFactory that each pertain to an application. WebLogic server is an example of this kind of environment.
Running Multiple Applications in a Single Cluster
Deploying Coherence-Based Applications 1-5
3. Ensure the cache configurations files are included in their respective WAR files (typically in the WEB-INF/classes directory) so that they can be loaded at run time and used by the application.
Sharing Application Data in a JavaEE EnvironmentApplications can share data by allowing access to their caches and services. The following example demonstrates allowing a Web application (trade.war) to access the caches and services of another Web application (accounts.war):
1. Create a cache configuration file for the trade application (for example, trade-cache-config.xml) that defines a scope name called trade and include any cache scheme definitions for the application:
<?xml version='1.0'?>
<cache-config xmlns:xsi="http://www.w3.org/2001/XMLSchema-instance" xmlns="http://xmlns.oracle.com/coherence/coherence-cache-config" xsi:schemaLocation="http://xmlns.oracle.com/coherence/coherence-cache-config coherence-cache-config.xsd"> <scope-name>trade</scope-name> ...
2. Create a cache configuration file (for example, accounts-cache-config.xml) for the accounts application that defines a scope name called accounts and include any cache scheme definitions for the application:
<?xml version='1.0'?>
<cache-config xmlns:xsi="http://www.w3.org/2001/XMLSchema-instance" xmlns="http://xmlns.oracle.com/coherence/coherence-cache-config" xsi:schemaLocation="http://xmlns.oracle.com/coherence/coherence-cache-config coherence-cache-config.xsd"> <scope-name>accounts</scope-name> ...
3. Ensure the cache configurations files are included in their respective WAR files (typically in the WEB-INF/classes directory) so that they can be loaded at run time and used by the application.
4. The trade application must also include the accounts-cache-config.xml file to access the caches and services of the accounts application.
5. The trade application can then use the following pattern to create cache factories for the accounts application:
ClassLoader loader = ...CacheFactoryBuilder builder = CacheFactory.getCacheFactoryBuilder();ConfigurableCacheFactory tradesCcf = builder.getConfigurableCacheFactory(tradesUri, loader);ConfigurableCacheFactory accountsCcf = builder.getConfigurableCacheFactory(accountsUri, loader);
Scoping Applications in a Standalone EnvironmentStandalone applications that use a single Coherence cluster can each include their own cache configuration files; however, these configurations are coalesced into a single ConfigurableCacheFactory. Since there is a 1 to 1 relationship between ConfigurableCacheFactory and DefaultCacheServer, application scoping is
Running Multiple Applications in a Single Cluster
1-6 Oracle Coherence Administrator's Guide
not feasible within a single cluster node. Instead, one or more instances of DefaultCacheServer must be started for each cache configuration, and each cache configuration must include a scope name.
The following example isolates two applications (trade and accounts) from using each other’s caches and services:
1. Create a cache configuration file for the trade application (for example, trade-cache-config.xml) that defines a scope name called trade and include any cache scheme definitions for the application:
<?xml version='1.0'?>
<cache-config xmlns:xsi="http://www.w3.org/2001/XMLSchema-instance" xmlns="http://xmlns.oracle.com/coherence/coherence-cache-config" xsi:schemaLocation="http://xmlns.oracle.com/coherence/coherence-cache-config coherence-cache-config.xsd"> <scope-name>trade</scope-name> ...
2. Start a DefaultCacheServer instance that loads the trade-cache-config.xml cache configuration file.
3. Create a cache configuration file for the accounts application (for example, accounts-cache-config.xml) that defines a scope name called accounts and include any cache scheme definitions for the application:
<?xml version='1.0'?>
<cache-config xmlns:xsi="http://www.w3.org/2001/XMLSchema-instance" xmlns="http://xmlns.oracle.com/coherence/coherence-cache-config" xsi:schemaLocation="http://xmlns.oracle.com/coherence/coherence-cache-config coherence-cache-config.xsd"> <scope-name>accounts</scope-name> ...
4. Start a DefaultCacheServer instance that loads the accounts-cache-config.xml cache configuration file.
Providing a Custom Scope ResolverThe com.tangosol.net.ScopeResolver interface allows containers and applications to modify the scope name for a given ConfigurableCacheFactory at run time to enforce (or disable) isolation between applications. Implement the ScopeResolver interface and add any custom functionality as required.
To enable a custom scope resolver, the fully qualified name of the implementation class must be defined in the operational override file using the <scope-resolver> element within the <cache-factory-builder-config> node. For example:
<?xml version='1.0'?>
<coherence xmlns:xsi="http://www.w3.org/2001/XMLSchema-instance" xmlns="http://xmlns.oracle.com/coherence/coherence-operational-config" xsi:schemaLocation="http://xmlns.oracle.com/coherence/ coherence-operational-config coherence-operational-config.xsd">
Note: To share data between applications, the applications must use the same cache configuration file. Coherence does not support using multiple cache configurations which specify the same scope name.
Running Multiple Applications in a Single Cluster
Deploying Coherence-Based Applications 1-7
<cache-factory-builder-config> <scope-resolver> <class-name>package.MyScopeResolver</class-name> </scope-resolver> </cache-factory-builder-config><coherence>
As an alternative, the <instance> element supports the use of a <class-factory-name> element to specify a factory class that is responsible for creating ScopeResolver instances, and a <method-name> element to specify the static factory method on the factory class that performs object instantiation. The following example gets a custom scope resolver instance using the getResolver method on the MyScopeResolverFactory class.
<?xml version='1.0'?>
<coherence xmlns:xsi="http://www.w3.org/2001/XMLSchema-instance" xmlns="http://xmlns.oracle.com/coherence/coherence-operational-config" xsi:schemaLocation="http://xmlns.oracle.com/coherence/ coherence-operational-config coherence-operational-config.xsd"> <cache-factory-builder-config> <scope-resolver> <class-factory-name>package.MyScopeReolverFactory</class-factory-name> <method-name>getResolver</method-name> </scope-resolver> </cache-factory-builder-config><coherence>
Any initialization parameters that are required for an implementation can be specified using the <init-params> element. The following example sets an isDeployed parameter to true.
<?xml version='1.0'?>
<coherence xmlns:xsi="http://www.w3.org/2001/XMLSchema-instance" xmlns="http://xmlns.oracle.com/coherence/coherence-operational-config" xsi:schemaLocation="http://xmlns.oracle.com/coherence/ coherence-operational-config coherence-operational-config.xsd"> <cache-factory-builder-config> <scope-resolver> <class-name>package.MyScopeResolver</class-name> <init-params> <init-param> <param-name>isDeployed</param-name> <param-value>true</param-value> </init-param> </init-params> </scope-resolver> </cache-factory-builder-config><coherence>

Running Multiple Applications in a Single Cluster
1-8 Oracle Coherence Administrator's Guide
2
Platform-Specific Deployment Considerations 2-1
2Platform-Specific DeploymentConsiderations
This chapter identifies issues that should be considered when deploying Coherence to various platforms and offers solutions if available.
The following sections are included in this chapter:
■ Deploying to AIX
■ Deploying to Cisco Switches
■ Deploying to Foundry Switches
■ Deploying to IBM BladeCenters
■ Deploying to IBM JVMs
■ Deploying to Linux
■ Deploying to Oracle JRockit JVMs
■ Deploying to Oracle JVMs
■ Deploying to OS X
■ Deploying to Solaris
■ Deploying to Virtual Machines
■ Deploying to Windows
■ Deploying to z/OS
Deploying to AIXWhen deploying Coherence on AIX, be aware of the following:
Multicast and IPv6AIX 5.2 and above default to running multicast over IPv6 rather then IPv4. If you run in a mixed IPv6/IPv4 environment, configure your JVMs to explicitly use IPv4. This can be done by setting the java.net.preferIPv4Stack system property to true on the Java command line. See the IBM 32-bit SDK for AIX User Guide for details.
Unique Multicast Addresses and PortsOn AIX, it is suggested that each Coherence cluster use a unique multicast address and port, as some versions of AIX do not take both into account when delivering
Deploying to Cisco Switches
2-2 Oracle Coherence Administrator's Guide
packets. See the <multicast-listener> element for details on configuring the address.
Deploying to Cisco SwitchesWhen deploying Coherence with Cisco switches, be aware of the following:
Buffer Space and Packet Pauses Under heavy UDP packet load some Cisco switches may run out of buffer space and exhibit frequent multi-second communication pauses. These communication pauses can be identified by a series of Coherence log messages referencing communication delays with multiple nodes which cannot be attributed to local or remote GCs.
Experienced a 4172 ms communication delay (probable remote GC) with Member(Id=7, Timestamp=2008-09-15 12:15:47.511, Address=xxx.xxx.x.xx:8089, MachineId=13838); 320 packets rescheduled, PauseRate=0.31, Threshold=512
The Cisco 6500 series support configuration the amount of buffer space available to each Ethernet port or ASIC. In high load applications it may be necessary to increase the default buffer space. This can be accomplished by executing:
fabric buffer-reserve high
See Cisco's documentation for additional details on this setting.
Multicast Connectivity on Large NetworksCisco's default switch configuration does not support proper routing of multicast packets between switches due to the use of IGMP snooping. See the Cisco's documentation regarding the issue and solutions.
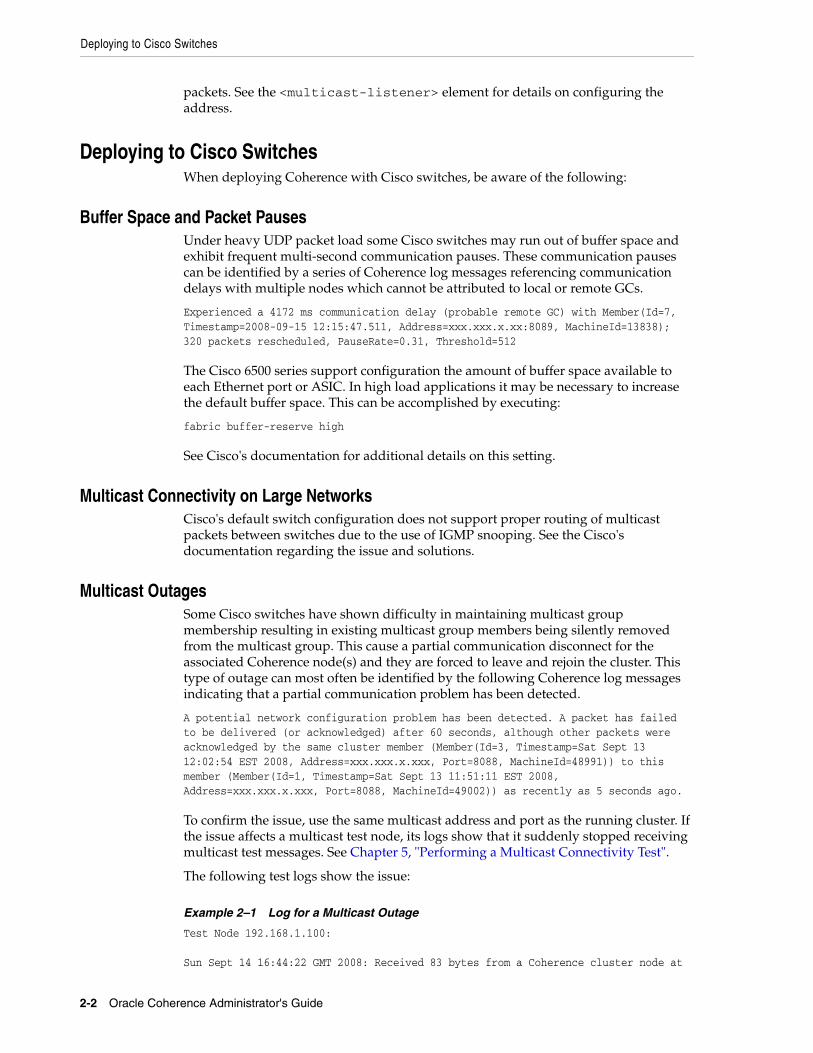
Multicast OutagesSome Cisco switches have shown difficulty in maintaining multicast group membership resulting in existing multicast group members being silently removed from the multicast group. This cause a partial communication disconnect for the associated Coherence node(s) and they are forced to leave and rejoin the cluster. This type of outage can most often be identified by the following Coherence log messages indicating that a partial communication problem has been detected.
A potential network configuration problem has been detected. A packet has failed to be delivered (or acknowledged) after 60 seconds, although other packets were acknowledged by the same cluster member (Member(Id=3, Timestamp=Sat Sept 13 12:02:54 EST 2008, Address=xxx.xxx.x.xxx, Port=8088, MachineId=48991)) to this member (Member(Id=1, Timestamp=Sat Sept 13 11:51:11 EST 2008, Address=xxx.xxx.x.xxx, Port=8088, MachineId=49002)) as recently as 5 seconds ago.
To confirm the issue, use the same multicast address and port as the running cluster. If the issue affects a multicast test node, its logs show that it suddenly stopped receiving multicast test messages. See Chapter 5, "Performing a Multicast Connectivity Test".
The following test logs show the issue:
Example 2–1 Log for a Multicast Outage
Test Node 192.168.1.100:
Sun Sept 14 16:44:22 GMT 2008: Received 83 bytes from a Coherence cluster node at
Deploying to Cisco Switches
Platform-Specific Deployment Considerations 2-3
182.168.1.100: ??? Sun Sept 14 16:44:23 GMT 2008: Received test packet 76 from ip=/192.168.1.101, group=/224.3.2.0:32367, ttl=4. Sun Sept 14 16:44:23 GMT 2008: Received 83 bytes from a Coherence cluster node at 182.168.1.100: ??? Sun Sept 14 16:44:23 GMT 2008: Sent packet 85. Sun Sept 14 16:44:23 GMT 2008: Received test packet 85 from self. Sun Sept 14 16:44:24 GMT 2008: Received 83 bytes from a Coherence cluster node at 182.168.1.100: ??? Sun Sept 14 16:44:25 GMT 2008: Received test packet 77 from ip=/192.168.1.101, group=/224.3.2.0:32367, ttl=4. Sun Sept 14 16:44:25 GMT 2008: Received 83 bytes from a Coherence cluster node at 182.168.1.100: ??? Sun Sept 14 16:44:25 GMT 2008: Sent packet 86. Sun Sept 14 16:44:25 GMT 2008: Received test packet 86 from self. Sun Sept 14 16:44:26 GMT 2008: Received 83 bytes from a Coherence cluster node at 182.168.1.100: ??? Sun Sept 14 16:44:27 GMT 2008: Received test packet 78 from ip=/192.168.1.101, group=/224.3.2.0:32367, ttl=4. Sun Sept 14 16:44:27 GMT 2008: Received 83 bytes from a Coherence cluster node at 182.168.1.100: ??? Sun Sept 14 16:44:27 GMT 2008: Sent packet 87. Sun Sept 14 16:44:27 GMT 2008: Received test packet 87 from self. Sun Sept 14 16:44:28 GMT 2008: Received 83 bytes from a Coherence cluster node at 182.168.1.100: ??? Sun Sept 14 16:44:29 GMT 2008: Received 83 bytes from a Coherence cluster node at 182.168.1.100: ??? Sun Sept 14 16:44:29 GMT 2008: Sent packet 88. Sun Sept 14 16:44:29 GMT 2008: Received test packet 88 from self. Sun Sept 14 16:44:30 GMT 2008: Received 83 bytes from a Coherence cluster node at 182.168.1.100: ??? Sun Sept 14 16:44:31 GMT 2008: Received 83 bytes from a Coherence cluster node at 182.168.1.100: ??? Sun Sept 14 16:44:31 GMT 2008: Sent packet 89. Sun Sept 14 16:44:31 GMT 2008: Received test packet 89 from self. Sun Sept 14 16:44:32 GMT 2008: Received 83 bytes from a Coherence cluster node at 182.168.1.100: ??? Sun Sept 14 16:44:33 GMT 2008: Received 83 bytes from a Coherence cluster node at 182.168.1.100: ???
Test Node 192.168.1.101:
Sun Sept 14 16:44:22 GMT 2008: Sent packet 76.Sun Sept 14 16:44:22 GMT 2008: Received test packet 76 from self. Sun Sept 14 16:44:22 GMT 2008: Received 83 bytes from a Coherence cluster node at 192.168.1.100: ??? Sun Sept 14 16:44:22 GMT 2008: Received test packet 85 from ip=/192.168.1.100, group=/224.3.2.0:32367, ttl=4. Sun Sept 14 16:44:23 GMT 2008: Received 83 bytes from a Coherence cluster node at 192.168.1.100: ??? Sun Sept 14 16:44:24 GMT 2008: Sent packet 77.Sun Sept 14 16:44:24 GMT 2008: Received test packet 77 from self. Sun Sept 14 16:44:24 GMT 2008: Received 83 bytes from a Coherence cluster node at 192.168.1.100: ??? Sun Sept 14 16:44:24 GMT 2008: Received test packet 86 from ip=/192.168.1.100, group=/224.3.2.0:32367, ttl=4. Sun Sept 14 16:44:25 GMT 2008: Received 83 bytes from a Coherence cluster node at 192.168.1.100: ??? Sun Sept 14 16:44:26 GMT 2008: Sent packet 78.Sun Sept 14 16:44:26 GMT 2008: Received test packet 78 from self. Sun Sept 14 16:44:26 GMT 2008: Received 83 bytes from a Coherence cluster node at
Deploying to Foundry Switches
2-4 Oracle Coherence Administrator's Guide
192.168.1.100: ??? Sun Sept 14 16:44:26 GMT 2008: Received test packet 87 from ip=/192.168.1.100, group=/224.3.2.0:32367, ttl=4. Sun Sept 14 16:44:27 GMT 2008: Received 83 bytes from a Coherence cluster node at 192.168.1.100: ??? Sun Sept 14 16:44:28 GMT 2008: Sent packet 79.Sun Sept 14 16:44:28 GMT 2008: Received test packet 79 from self. Sun Sept 14 16:44:28 GMT 2008: Received 83 bytes from a Coherence cluster node at 192.168.1.100: ??? Sun Sept 14 16:44:28 GMT 2008: Received test packet 88 from ip=/192.168.1.100, group=/224.3.2.0:32367, ttl=4. Sun Sept 14 16:44:29 GMT 2008: Received 83 bytes from a Coherence cluster node at 192.168.1.100: ??? Sun Sept 14 16:44:30 GMT 2008: Sent packet 80.Sun Sept 14 16:44:30 GMT 2008: Received test packet 80 from self. Sun Sept 14 16:44:30 GMT 2008: Received 83 bytes from a Coherence cluster node at 192.168.1.100: ??? Sun Sept 14 16:44:30 GMT 2008: Received test packet 89 from ip=/192.168.1.100, group=/224.3.2.0:32367, ttl=4. Sun Sept 14 16:44:31 GMT 2008: Received 83 bytes from a Coherence cluster node at 192.168.1.100: ??? Sun Sept 14 16:44:32 GMT 2008: Sent packet 81.Sun Sept 14 16:44:32 GMT 2008: Received test packet 81 from self. Sun Sept 14 16:44:32 GMT 2008: Received 83 bytes from a Coherence cluster node at 192.168.1.100: ??? Sun Sept 14 16:44:32 GMT 2008: Received test packet 90 from ip=/192.168.1.100, group=/224.3.2.0:32367, ttl=4. Sun Sept 14 16:44:33 GMT 2008: Received 83 bytes from a Coherence cluster node at 192.168.1.100: ??? Sun Sept 14 16:44:34 GMT 2008: Sent packet 82.
Note that at 16:44:27 the first test node stops receiving multicast packets from other computers. The operating system continues to properly forward multicast traffic from other processes on the same computer, but the test packets (79 and higher) from the second test node are not received. Also note that both the test packets and the cluster's multicast traffic generated by the first node do continue to be delivered to the second node. This indicates that the first node was silently removed from the multicast group.
If you encounter this multicast issue it is suggested that you contact Cisco technical support, or you may consider changing your configuration to unicast-only by using the Coherence well-known-addresses feature. See the <well-known-addresses> element for details on configuring the address.
Deploying to Foundry SwitchesWhen deploying Coherence with Foundry switches, be aware of the following:
Multicast ConnectivityFoundry switches have shown to exhibit difficulty in handing multicast traffic. When deploying on with Foundry switches, ensure that all computers that are part of the Coherence cluster can communicate over multicast. See Chapter 5, "Performing a Multicast Connectivity Test".
If you encounter issues with multicast you may consider changing your configuration to unicast-only by using the well-known-addresses feature. See the <well-known-addresses> element for details on configuring the address.
Deploying to IBM JVMs
Platform-Specific Deployment Considerations 2-5
Deploying to IBM BladeCentersWhen deploying Coherence on IBM BladeCenters, be aware of the following:
MAC Address Uniformity and Load BalancingA typical deployment on a BladeCenter may include blades with two NICs where one is used for administration purposes and the other for cluster traffic. By default, the MAC addresses assigned to the blades of a BladeCenter are uniform enough that the first NIC generally has an even MAC address and the second has an odd MAC address. If the BladeCenter's uplink to a central switch also has an even number of channels, then layer 2 (MAC based) load balancing may prevent one set of NICs from making full use of the available uplink bandwidth as they are all bound to either even or odd channels. This issue arises due to the assumption in the switch that MAC addresses are essentially random, which in BladeCenter's is untrue. Remedies to this situation include:
■ Use layer 3 (IP based) load balancing (if the IP addresses do not follow the same even/odd pattern).
■ This setting must be applied across all switches carrying cluster traffic.
■ Randomize the MAC address assignments by swapping them between the first and second NIC on alternating computers.
■ Linux enables you to change a NIC's MAC address using the ifconfig command.
■ For other operating systems custom tools may be available to perform the same task.
Deploying to IBM JVMsWhen deploying Coherence on IBM JVMs, be aware of the following:
OutOfMemoryErrorJVMs that experience an OutOfMemoryError can be left in an indeterministic state which can have adverse effects on a cluster. We recommend configuring JVMs to exit upon encountering an OutOfMemoryError instead of allowing the JVM to attempt recovery. Here is the parameter to configure this setting on IBM JVMs:
UNIX:
-Xdump:tool:events=throw,filter=java/lang/OutOfMemoryError,exec="kill -9 %pid"
Windows:
-Xdump:tool:events=throw,filter=java/lang/OutOfMemoryError,exec="taskkill /F /PID %pid"
Heap SizingIBM does not recommend fixed size heaps for JVMs. In many cases, it is recommended to use the default for -Xms (in other words, omit this setting and only set -Xmx). See this link for more details:
http://www.ibm.com/developerworks/java/jdk/diagnosis/
Deploying to Linux
2-6 Oracle Coherence Administrator's Guide
It is recommended to configure the JVM to generate a heap dump if an OutOfMemoryError is thrown to assist the investigation into the root cause for the error. IBM JVMs generate a heap dump on OutOfMemoryError by default; no further configuration is required.
Deploying to LinuxWhen deploying Coherence on Linux, be aware of the following:
Native POSIX Thread Library (NPTL) Early versions of the NPTL are prone to deadlock, especially when combined with 2.4 Linux Kernels. The kernel version and NPTL version can be obtained by executing the following commands:
uname -agetconf GNU_LIBPTHREAD_VERSION
If running on a 2.4 kernel, it is recommended that you avoid using any version of the NPTL, and revert to using LinuxThreads library. This can be done by setting the LD_ASSUME_KERNEL environment variable before launching Java.
export LD_ASSUME_KERNEL=2.4.19getconf GNU_LIBPTHREAD_VERSION
If running on a 2.6 kernel, it is recommended that you use a 1.0 or higher version of NPTL. If upgrading the NPTL version is not possible then it is then recommended that you switch to LinuxThreads library.
NPTL related issues are known to occur with Red Hat Linux 9 and Red Hat Enterprise Linux 3, and are also likely to effect any 2.4 based Linux distribution with a backported version of the NPTL. See http://java.sun.com/developer/technicalArticles/JavaTechandLinux/RedHat for more details on this issue.
TSC High Resolution Timesource Linux has several high resolution timesources to choose from, the fastest TSC (Time Stamp Counter) unfortunately is not always reliable. Linux chooses TSC by default, and during startup checks for inconsistencies, if found it switches to a slower safe timesource. The slower time sources can be 10 to 30 times more expensive to query then the TSC timesource, and may have a measurable impact on Coherence performance. Note that Coherence and the underlying JVM are not aware of the timesource which the operating system is using. It is suggested that you check your system logs (/var/log/dmesg) to verify that the following is not present.
kernel: Losing too many ticks!kernel: TSC cannot be used as a timesource.kernel: Possible reasons for this are:kernel: You're running with Speedstep,kernel: You don't have DMA enabled for your hard disk (see hdparm),kernel: Incorrect TSC synchronization on an SMP system (see dmesg).kernel: Falling back to a sane timesource now.
As the log messages suggest, this can be caused by a variable rate CPU (SpeedStep), having DMA disabled, or incorrect TSC synchronization on multi CPU computers. If present it is suggested that you work with your system administrator to identify the cause and allow the TSC timesource to be used.
Deploying to Oracle JVMs
Platform-Specific Deployment Considerations 2-7
Deploying to Oracle JRockit JVMsWhen deploying Coherence on JRockit JVMs, be aware of the following:
JRockit and the Native Posix Thread Library (NPTL)When running JRockit on Linux, Oracle recommends using 2.6 kernels, and ensuring that the NPTL is enabled. See Oracle's documentation regarding this issue.
OutOfMemoryErrorJVMs that experience an OutOfMemoryError can be left in an indeterministic state which can have adverse effects on a cluster. We recommend configuring JVMs to exit upon encountering an OutOfMemoryError instead of allowing the JVM to attempt recovery. Here is the parameter to configure this setting on JRockit JVMs:
-XXexitOnOutOfMemory
Additionally, it is recommended to configure the JVM to generate a heap dump if an OutOfMemoryError is thrown to assist the investigation into the root cause for the error. Use the following flags to enable this feature on JRockit:
-Djrockit.oomdiagnostics=true -Djrockit.oomdiagnostics.filename=<path to file>
Deploying to Oracle JVMsWhen deploying Coherence on Oracle JVMs, be aware of the following:
Heap SizesCoherence recommends keeping heap sizes at 1-4GB per JVM. However, larger heap sizes, up to 20GB, are suitable for some applications where the simplified management of fewer, larger JVMs outweighs the performance benefits of many smaller JVMs. Using multiple cache servers allows a single computer to achieve higher capacities. With Oracle's JVMs, heap sizes beyond 4GB are reasonable, though GC tuning is still advisable to minimize long GC pauses. See Oracles's GC Tuning Guide for tuning details. It is also advisable to run with fixed sized heaps as this generally lowers GC times. See "JVM Tuning" on page 6-9 for additional information.
AtomicLongWhen available Coherence uses the highly concurrent AtomicLong class, which allows concurrent atomic updates to long values without requiring synchronization.
It is suggested to run in server mode to ensure that the stable and highly concurrent version can be used. To run the JVM in server mode include the -server option on the Java command line.
OutOfMemoryErrorJVMs that experience an OutOfMemoryError can be left in an indeterministic state which can have adverse effects on a cluster. We recommend configuring JVMs to exit upon encountering an OutOfMemoryError instead of allowing the JVM to attempt recovery. Here is the parameter to configure this setting on Sun JVMs:
UNIX:
-XX:OnOutOfMemoryError="kill -9 %p"
Deploying to OS X
2-8 Oracle Coherence Administrator's Guide
Windows:
-XX:OnOutOfMemoryError="taskkill /F /PID %p"
Additionally, it is recommended to configure the JVM to generate a heap dump if an OutOfMemoryError is thrown to assist the investigation into the root cause for the error. Use the following flag to enable this feature on the Sun JVM:
-XX:+HeapDumpOnOutOfMemoryError
Deploying to OS XWhen deploying Coherence on OS X, be aware of the following:
Multicast and IPv6OS X defaults to running multicast over IPv6 rather then IPv4. If you run in a mixed IPv6/IPv4 environment, configure your JVMs to explicitly use IPv4. This can be done by setting the java.net.preferIPv4Stack system property to true on the Java command line.
Unique Multicast Addresses and PortsOn OS X, it is suggested that each Coherence cluster use a unique multicast address and port, as some versions of OS X do not take both into account when delivering packets. See the multicast-listener for details on configuring the address.
Socket Buffer SizingGenerally, Coherence prefers 2MB or higher buffers, but for OS X this may result in unexpectedly high kernel CPU time, which in turn reduces throughput. For OS X, the suggested buffers size is 768KB, though your own tuning may find a better size. See the <packet-buffer> element for details on specifying the amount of buffer space Coherence requests.
Deploying to SolarisWhen deploying Coherence on Solaris, be aware of the following:
Solaris 10 (x86 and SPARC)When running on Solaris 10, there are known issues relate to packet corruption and multicast disconnections. These most often manifest as either EOFExceptions, "Large gap" warnings while reading packet data, or frequent packet timeouts. It is highly recommend that the patches for both issues below be applied when using Coherence on Solaris 10 systems.
Possible Data Integrity Issues on Solaris 10 Systems Using the e1000g Driver for the Intel Gigabit Network Interface Card (NIC)
https://support.oracle.com/CSP/main/article?cmd=show&type=NOT&doctype=ALERT&id=1000972.1
IGMP(1) Packets do not Contain IP Router Alert Option When Sent From Solaris 10 Systems With Patch 118822-21 (SPARC) or 118844-21 (x86/x64) or Later Installed
Deploying to Virtual Machines
Platform-Specific Deployment Considerations 2-9
https://support.oracle.com/CSP/main/article?cmd=show&type=NOT&doctype=ALERT&id=1000940.1
Solaris 10 NetworkingIf running on Solaris 10, review the above Solaris 10 (x86 and SPARC) issues which relate to packet corruption and multicast disconnections. These most often manifest as either EOFExceptions, "Large gap" warnings while reading packet data, or frequent packet timeouts. It is highly recommend that the patches for both issues be applied when using Coherence on Solaris 10 systems.
Deploying to Virtual MachinesWhen deploying Coherence to virtual machines, be aware of the following:
Supported DeploymentCoherence is supported within virtual machine environments and there should be no functional differences between running it there or in a non-virtualized operating system.
There is currently an issue with the VMWare Query Performance Counter feature that causes Coherence to hang when starting with JRockit on a Windows 2003 or Windows XP VM image. To work around this issue, remove the /usepmtimer switch from the boot.ini file and restart the virtual machine. The issue is detailed in the following VMWare knowledge base article:
http://kb.vmware.com/selfservice/microsites/search.do?language=en_US&cmd=displayKC&externalId=1011714
Multicast ConnectivityUsing virtualization adds another layer to your network topology, and like all other layers it must be properly configured to support multicast networking. See the <multicast-listener> element for details on configuring multicast.
PerformanceIt is less likely that a process running in a virtualized operating system can fully use gigabit Ethernet. This is not specific to Coherence, and is visible on most network intensive virtualized applications.
See the following VMWare article covering their network performance as compared to non-virtualized operating systems.
http://www.vmware.com/pdf/esx_network_planning.pdf
Fault ToleranceFrom a Coherence fault tolerance perspective, there is more configuration which must occur to ensure that cache entry backups reside on physically separate hardware. Manual computer identity must be configured so that Coherence can ensure that backups are not inadvertently stored on the same physical computer as the primary. This can be configured by using the <machine-id> element within the operational configuration file. See the <unicast-listener> element for details on configuring this element.
Deploying to Windows
2-10 Oracle Coherence Administrator's Guide
Deploying to WindowsWhen deploying Coherence on Windows, be aware of the following:
Performance TuningOut of the box Windows is not optimized for background processes and heavy network loads. This may be addressed by running the optimize.reg script included in the Coherence installation's bin directory. See "Operating System Tuning" on page 6-1 for details on the optimizations which are performed.
Personal FirewallsIf running a firewall on a computer you may have difficulties in forming a cluster consisting of multiple computers. This can be resolved by either:
■ Disabling the firewall, though this is generally not recommended.
■ Granting full network access to the Java executable which runs Coherence.
■ Opening up individual address and ports for Coherence.
By default Coherence uses TCP and UDP ports starting at 8088, subsequent nodes on the same computer use increasing port numbers. Coherence may also communicate over multicast; the default address and port differs between releases an is based on the version number of the release. See the <unicast-listener> and <multicast-listener> elements to configure the address and port.
Disconnected Network InterfaceOn Microsoft Windows, if the Network Interface Card (NIC) is unplugged from the network, the operating system invalidates the associated IP address. The effect of this is that any socket which is bound to that IP address enters an error state. This results in the Coherence nodes exiting the cluster and residing in an error state until the NIC is reattached to the network. In cases where it is desirable to allow multiple collocated JVMs to remain clustered during a physical outage Windows must be configured to not invalidate the IP address.
To adjust this parameter:
1. Run Registry Editor (regedit)
2. Locate the following registry key
HKLM\System\CurrentControlSet\Services\Tcpip\Parameters
3. Add or reset the following new DWORD value
Name: DisableDHCPMediaSenseValue: 1 (boolean)
4. Reboot
While the name of the keyword includes DHCP, the setting effects both static and dynamic IP addresses. See Microsoft Windows TCP/IP Implementation Details for additional information:
http://technet.microsoft.com/en-us/library/bb726981.aspx#EDAA
Deploying to z/OSWhen deploying Coherence on z/OS, be aware of the following:

Deploying to z/OS
Platform-Specific Deployment Considerations 2-11
EBCDICWhen deploying Coherence into environments where the default character set is EBCDIC rather than ASCII, ensure that Coherence configuration files which are loaded from JAR files or off of the classpath are in ASCII format. Configuration files loaded directly from the file system should be stored in the systems native format of EBCDIC.
MulticastUnder some circumstances, Coherence cluster nodes that run within the same logical partition (LPAR) on z/OS on IBM zSeries cannot communicate with each other. (This problem does not occur on the zSeries when running on Linux.)
The root cause is that z/OS may bind the MulticastSocket that Coherence uses to an automatically-assigned port, but Coherence requires the use of a specific port in order for cluster discovery to operate correctly. (Coherence does explicitly initialize the java.net.MulitcastSocket to use the necessary port, but that information appears to be ignored on z/OS when there is an instance of Coherence running within that same LPAR.)
The solution is to run only one instance of Coherence within a z/OS LPAR; if multiple instances are required, each instance of Coherence should be run in a separate z/OS LPAR. Alternatively well known addresses may be used. See the <well-known-addresses> element for details on configuring the address.

Deploying to z/OS
2-12 Oracle Coherence Administrator's Guide
3
Evaluating Performance and Scalability 3-1
3Evaluating Performance and Scalability
Coherence distributed caches are often evaluated against pre-existing local caches. The local caches generally take the form of in-processes hash maps. While Coherence does include facilities for in-process non-clustered caches, direct performance comparison between local caches and a distributed cache is not realistic. By the very nature of being out of process, the distributed cache must perform serialization and network transfers. For this cost, you gain cluster wide coherency of the cache data, and data and query scalability beyond what a single JVM or computer provides. This does not mean that you cannot achieve impressive performance using a distributed cache, but it must be evaluated in the correct context.
The following sections are included in this chapter:
■ Measuring Latency and Throughput
■ Demonstrating Scalability
■ Tuning Your Environment
■ Evaluating the Measurements of a Large Sample Cluster
■ Scalability: A Test Case
Measuring Latency and ThroughputWhen evaluating performance you try to establish two things, latency, and throughput. A simple performance analysis test may simply try performing a series of timed cache accesses in a tight loop. While these tests may accurately measure latency, to measure maximum throughput on a distributed cache a test must make use of multiple threads concurrently accessing the cache, and potentially multiple test clients. In a single threaded test, the client thread naturally spends the majority of the time simply waiting on the network. By running multiple clients/threads, you can more efficiently make use of your available processing power by issuing several requests in parallel. The use of batching operations can also be used to increase the data density of each operation. As you add threads, you should see that the throughput continues to increase until the CPU or network has been maximized, while the overall latency remains constant for the same period.
Demonstrating ScalabilityTo show true linear scalability as you increase cluster size, be prepared to add hardware, and not simply JVMs to the cluster. Adding JVMs to a single computer scales up to the point where the CPU or network are fully used.
Tuning Your Environment
3-2 Oracle Coherence Administrator's Guide
Plan on testing with clusters with more then just two cache servers (storage enabled nodes). The jump from one to two cache servers does not show the same scalability as from two to four. The reason for this is because by default Coherence maintains one backup copy of each piece of data written into the cache. The process of maintaining backups only begins when there are two storage-enabled nodes in the cluster (there must be a place to put the backup). Thus when you move from a one to two, the amount of work involved in a mutating operation such as a put operation actually doubles, but beyond that the amount of work stays fixed and is evenly distributed across the nodes. "Scalability: A Test Case" on page 3-3 provides an example test case that demonstrates scalability.
Tuning Your EnvironmentTo get the most out of your cluster it is important that you've tuned of your environment and JVMs. Chapter 6, "Performance Tuning,", provides good start to getting the most out of your environment. For example, Coherence includes a registry script for Windows (optimize.reg), which adjusts a few critical settings and allow Windows to achieve much higher data rates.
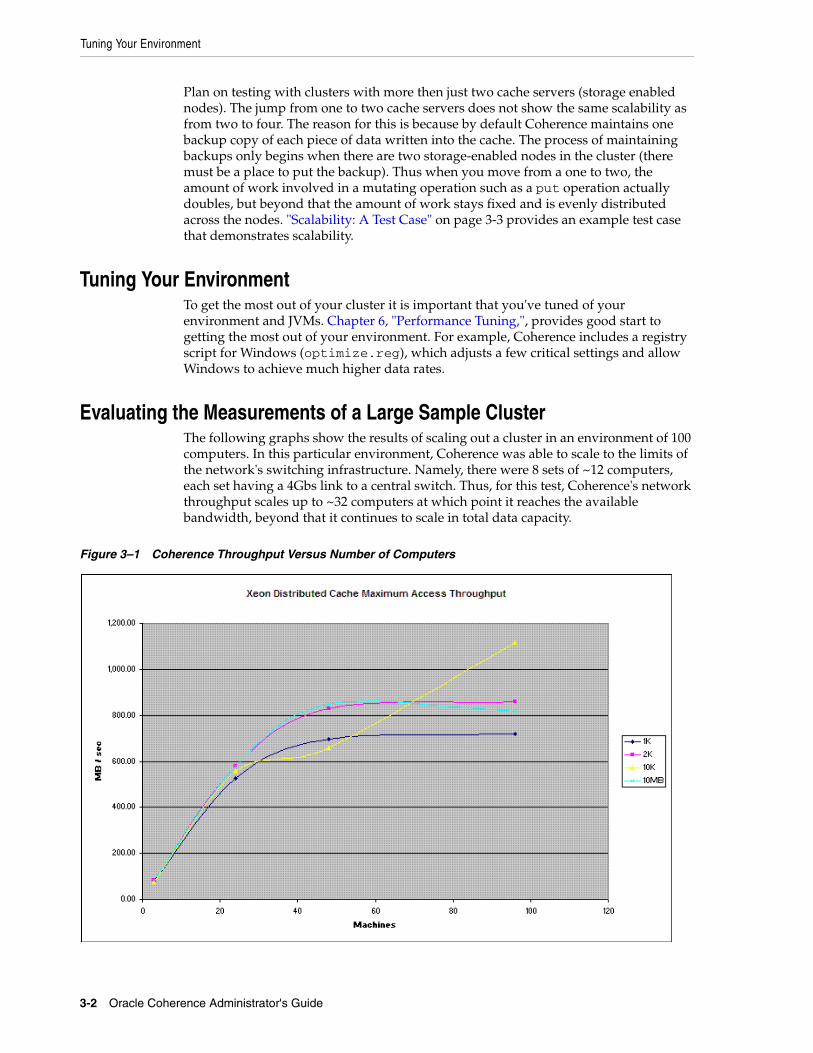
Evaluating the Measurements of a Large Sample ClusterThe following graphs show the results of scaling out a cluster in an environment of 100 computers. In this particular environment, Coherence was able to scale to the limits of the network's switching infrastructure. Namely, there were 8 sets of ~12 computers, each set having a 4Gbs link to a central switch. Thus, for this test, Coherence's network throughput scales up to ~32 computers at which point it reaches the available bandwidth, beyond that it continues to scale in total data capacity.
Figure 3–1 Coherence Throughput Versus Number of Computers
Scalability: A Test Case
Evaluating Performance and Scalability 3-3
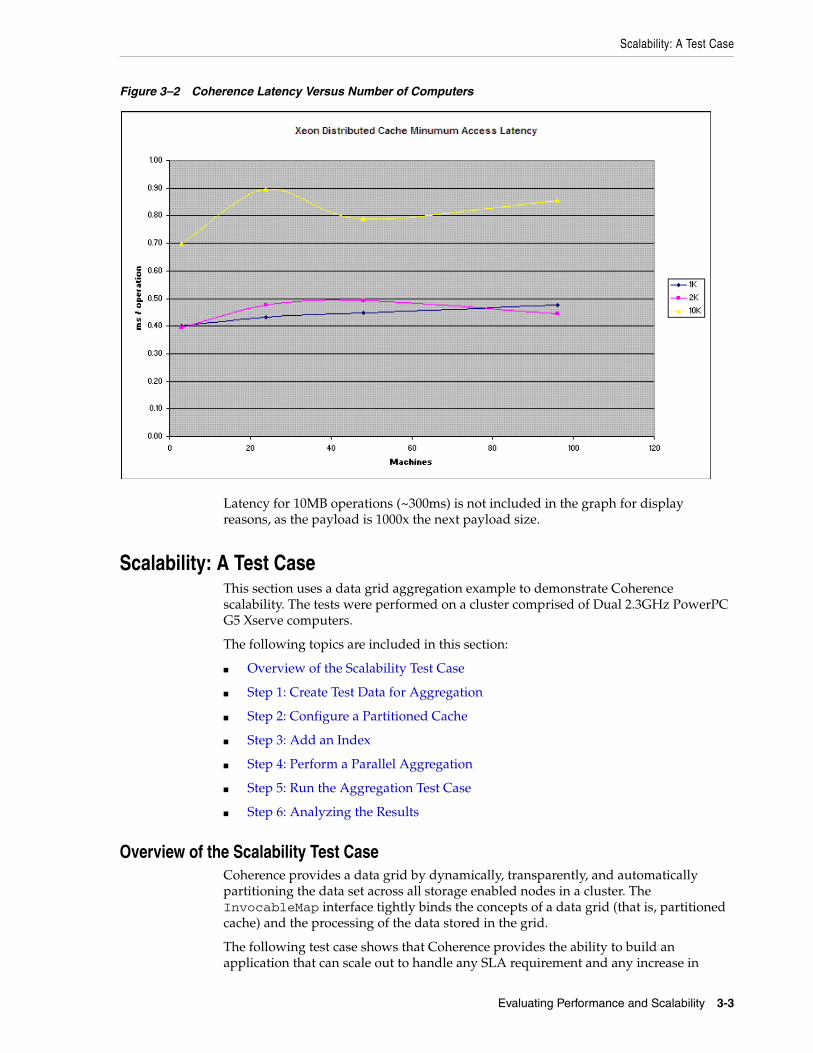
Figure 3–2 Coherence Latency Versus Number of Computers
Latency for 10MB operations (~300ms) is not included in the graph for display reasons, as the payload is 1000x the next payload size.
Scalability: A Test CaseThis section uses a data grid aggregation example to demonstrate Coherence scalability. The tests were performed on a cluster comprised of Dual 2.3GHz PowerPC G5 Xserve computers.
The following topics are included in this section:
■ Overview of the Scalability Test Case
■ Step 1: Create Test Data for Aggregation
■ Step 2: Configure a Partitioned Cache
■ Step 3: Add an Index
■ Step 4: Perform a Parallel Aggregation
■ Step 5: Run the Aggregation Test Case
■ Step 6: Analyzing the Results
Overview of the Scalability Test CaseCoherence provides a data grid by dynamically, transparently, and automatically partitioning the data set across all storage enabled nodes in a cluster. The InvocableMap interface tightly binds the concepts of a data grid (that is, partitioned cache) and the processing of the data stored in the grid.
The following test case shows that Coherence provides the ability to build an application that can scale out to handle any SLA requirement and any increase in
Scalability: A Test Case
3-4 Oracle Coherence Administrator's Guide
throughput requirements. The example in this test case clearly demonstrates Coherence's ability to linearly increase the number of trades aggregated per second as hardware is increased. That is, if one computer can aggregate X trades per second, a second computer added to the data grid increases the aggregate to 2X trades per second, a third computer added to the data grid increases the aggregate to 3X trades per second and so on.
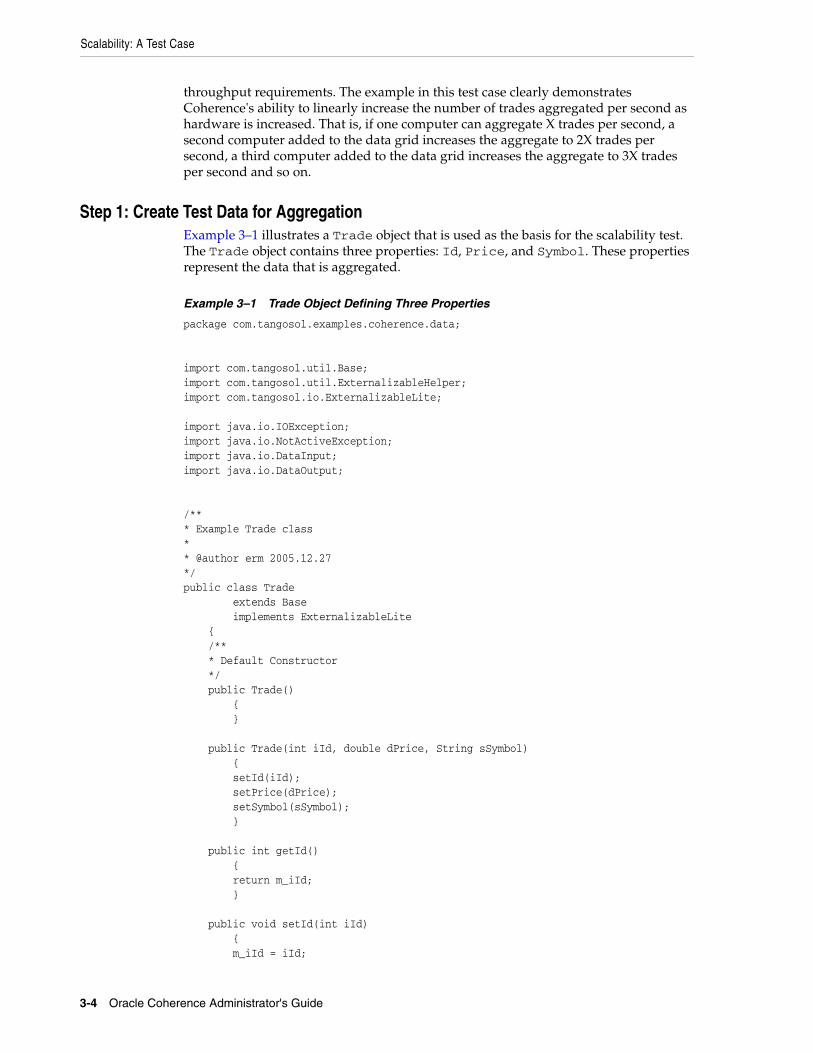
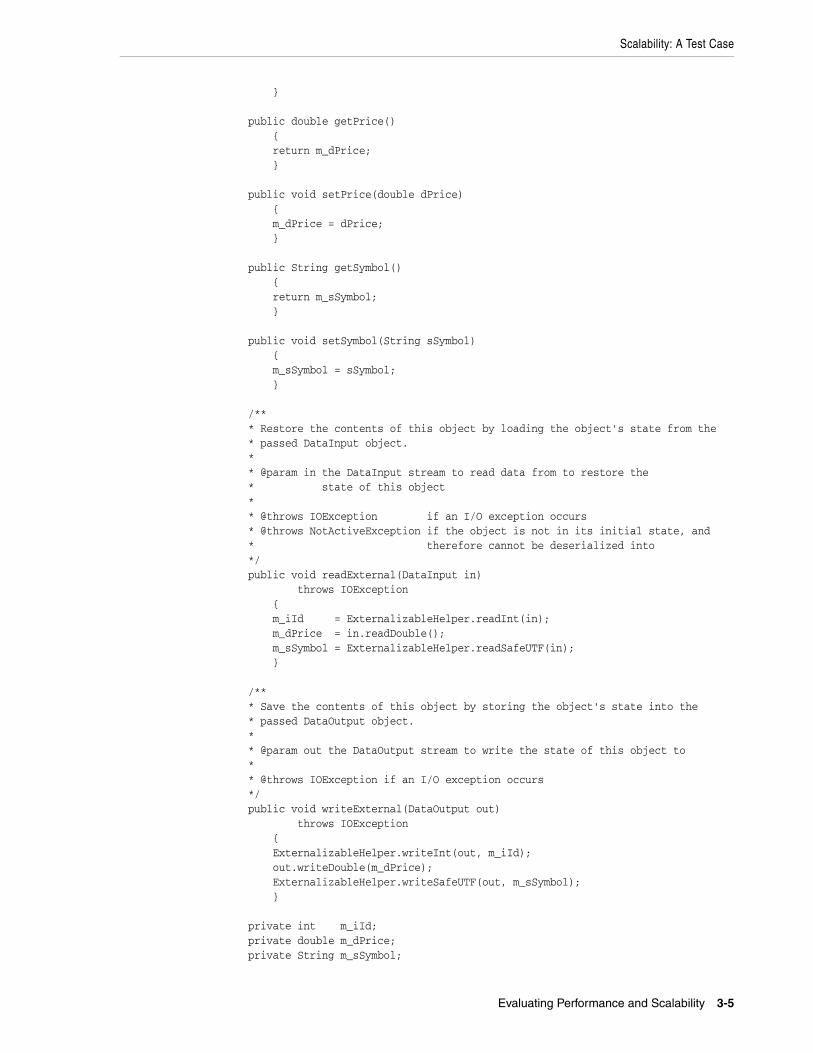
Step 1: Create Test Data for AggregationExample 3–1 illustrates a Trade object that is used as the basis for the scalability test. The Trade object contains three properties: Id, Price, and Symbol. These properties represent the data that is aggregated.
Example 3–1 Trade Object Defining Three Properties
package com.tangosol.examples.coherence.data;
import com.tangosol.util.Base;import com.tangosol.util.ExternalizableHelper;import com.tangosol.io.ExternalizableLite;
import java.io.IOException;import java.io.NotActiveException;import java.io.DataInput;import java.io.DataOutput;
/*** Example Trade class** @author erm 2005.12.27*/public class Trade extends Base implements ExternalizableLite { /** * Default Constructor */ public Trade() { }
public Trade(int iId, double dPrice, String sSymbol) { setId(iId); setPrice(dPrice); setSymbol(sSymbol); }
public int getId() { return m_iId; }
public void setId(int iId) { m_iId = iId;
Scalability: A Test Case
Evaluating Performance and Scalability 3-5
}
public double getPrice() { return m_dPrice; }
public void setPrice(double dPrice) { m_dPrice = dPrice; }
public String getSymbol() { return m_sSymbol; }
public void setSymbol(String sSymbol) { m_sSymbol = sSymbol; }
/** * Restore the contents of this object by loading the object's state from the * passed DataInput object. * * @param in the DataInput stream to read data from to restore the * state of this object * * @throws IOException if an I/O exception occurs * @throws NotActiveException if the object is not in its initial state, and * therefore cannot be deserialized into */ public void readExternal(DataInput in) throws IOException { m_iId = ExternalizableHelper.readInt(in); m_dPrice = in.readDouble(); m_sSymbol = ExternalizableHelper.readSafeUTF(in); }
/** * Save the contents of this object by storing the object's state into the * passed DataOutput object. * * @param out the DataOutput stream to write the state of this object to * * @throws IOException if an I/O exception occurs */ public void writeExternal(DataOutput out) throws IOException { ExternalizableHelper.writeInt(out, m_iId); out.writeDouble(m_dPrice); ExternalizableHelper.writeSafeUTF(out, m_sSymbol); }
private int m_iId; private double m_dPrice; private String m_sSymbol;
Scalability: A Test Case
3-6 Oracle Coherence Administrator's Guide
}
Step 2: Configure a Partitioned CacheExample 3–2 defines one wildcard cache mapping that maps to a distributed scheme which has unlimited capacity:
Example 3–2 Mapping a cache-mapping to a caching-scheme with Unlimited Capacity
<?xml version="1.0"?>
<cache-config xmlns:xsi="http://www.w3.org/2001/XMLSchema-instance" xmlns="http://xmlns.oracle.com/coherence/coherence-cache-config" xsi:schemaLocation="http://xmlns.oracle.com/coherence/coherence-cache-config coherence-cache-config.xsd"> <caching-scheme-mapping> <cache-mapping> <cache-name>*</cache-name> <scheme-name>example-distributed</scheme-name> </cache-mapping> </caching-scheme-mapping>
<caching-schemes> <!-- Distributed caching scheme. --> <distributed-scheme> <scheme-name>example-distributed</scheme-name> <service-name>DistributedCache</service-name>
<backing-map-scheme> <class-scheme> <scheme-ref>unlimited-backing-map</scheme-ref> </class-scheme> </backing-map-scheme>
<autostart>true</autostart> </distributed-scheme>
<!-- Backing map scheme definition used by all the caches that do not require any eviction policies --> <class-scheme> <scheme-name>unlimited-backing-map</scheme-name>
<class-name>com.tangosol.util.SafeHashMap</class-name> </class-scheme> </caching-schemes></cache-config>
Step 3: Add an IndexExample 3–3 illustrates the code to add an index to the Price property. Adding an index to this property increases performance by allowing Coherence to access the values directly rather than having to deserialize each item to accomplish the calculation.
Scalability: A Test Case
Evaluating Performance and Scalability 3-7
Example 3–3 Adding an Index to the Price Property
ReflectionExtractor extPrice = new ReflectionExtractor("getPrice");m_cache.addIndex(extPrice, true, null);
In the test case, the aggregation speed was increased by more than 2x after an index was applied.
Step 4: Perform a Parallel AggregationExample 3–4 illustrates the code to perform a parallel aggregation across all JVMs in the data grid. The aggregation is initiated and the results are received by a single client. That is, a single "low-power" client can use the full processing power of the cluster/data grid in aggregate to perform this aggregation in parallel with just one line of code.
Example 3–4 Perform a Parallel Aggregation Across all JVMs in the Grid
Double DResult;DResult = (Double) m_cache.aggregate((Filter) null, new DoubleSum("getPrice"));
Step 5: Run the Aggregation Test CaseThis section describes the sample test runs and the overall test environment. The JDK used on both the client and the servers was Java 2 Runtime Environment, Standard Edition (build 1.5.0_05-84).
A test run does several things:
1. Loads 200,000 trade objects into the data grid.
2. Adds indexes to Price property.
3. Performs a parallel aggregation of all trade objects stored in the data grid. This aggregation step is done 20 times to obtain an "average run time" to ensure that the test takes into account garbage collection.
4. Loads 400,000 trade objects into the data grid.
5. Repeats steps 2 and 3.
6. Loads 600,000 trade objects into the data grid.
7. Repeats steps 2 and 3.
8. Loads 800,000 trade objects into the data grid.
9. Repeats steps 2 and 3.
10. Loads 1,000,000 trade objects into the data grid.
11. Repeats steps 2 and 3.
Client Considerations: The test client itself is run on an Intel Core Duo iMac which is marked as local storage disabled. The command line used to start the client was:
java ... -Dtangosol.coherence.distributed.localstorage=false -Xmx128m -Xms128m com.tangosol.examples.coherence.invocable.TradeTest
This Test Suite (and Subsequent Results) Includes Data from Four Test Runs:
1. Start 4 JVMs on one Xserve - Perform a test run
2. Start 4 JVMs on each of two Xserves - Perform a test run
3. Start 4 JVMs on each of three Xserves - Perform a test run
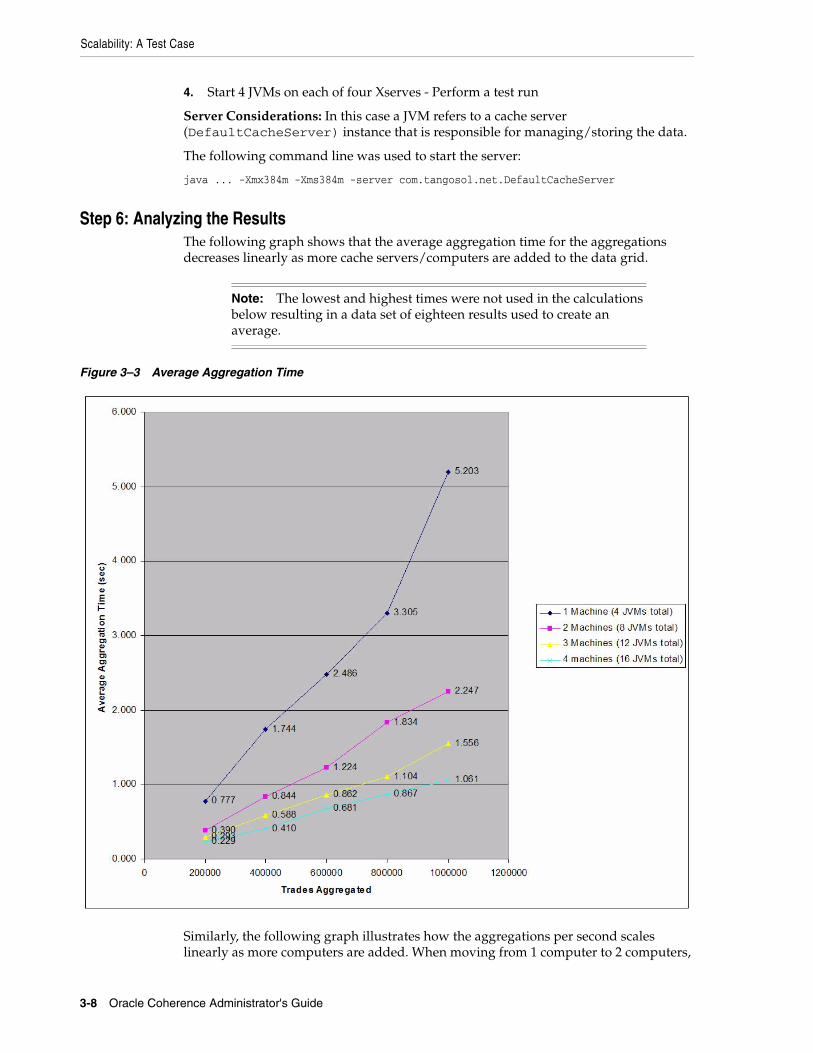
Scalability: A Test Case
3-8 Oracle Coherence Administrator's Guide
4. Start 4 JVMs on each of four Xserves - Perform a test run
Server Considerations: In this case a JVM refers to a cache server (DefaultCacheServer) instance that is responsible for managing/storing the data.
The following command line was used to start the server:
java ... -Xmx384m -Xms384m -server com.tangosol.net.DefaultCacheServer
Step 6: Analyzing the ResultsThe following graph shows that the average aggregation time for the aggregations decreases linearly as more cache servers/computers are added to the data grid.
Figure 3–3 Average Aggregation Time
Similarly, the following graph illustrates how the aggregations per second scales linearly as more computers are added. When moving from 1 computer to 2 computers,
Note: The lowest and highest times were not used in the calculations below resulting in a data set of eighteen results used to create an average.
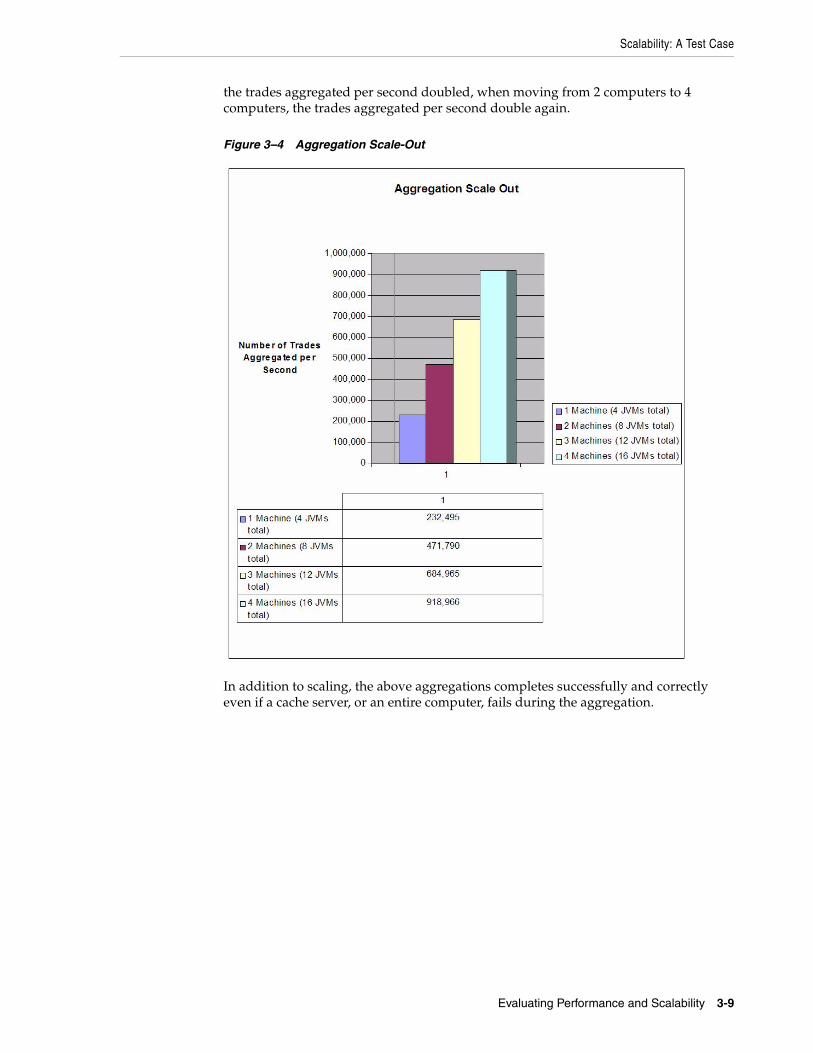
Scalability: A Test Case
Evaluating Performance and Scalability 3-9
the trades aggregated per second doubled, when moving from 2 computers to 4 computers, the trades aggregated per second double again.
Figure 3–4 Aggregation Scale-Out
In addition to scaling, the above aggregations completes successfully and correctly even if a cache server, or an entire computer, fails during the aggregation.

Scalability: A Test Case
3-10 Oracle Coherence Administrator's Guide
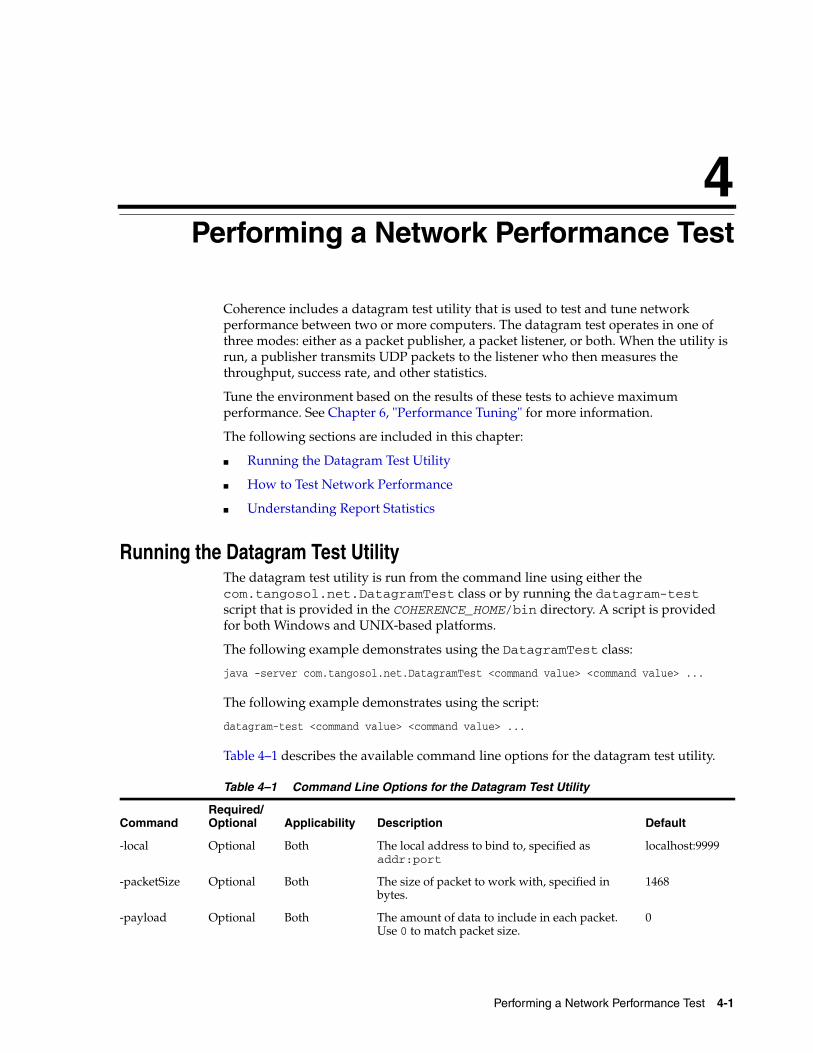
4
Performing a Network Performance Test 4-1
4Performing a Network Performance Test
Coherence includes a datagram test utility that is used to test and tune network performance between two or more computers. The datagram test operates in one of three modes: either as a packet publisher, a packet listener, or both. When the utility is run, a publisher transmits UDP packets to the listener who then measures the throughput, success rate, and other statistics.
Tune the environment based on the results of these tests to achieve maximum performance. See Chapter 6, "Performance Tuning" for more information.
The following sections are included in this chapter:
■ Running the Datagram Test Utility
■ How to Test Network Performance
■ Understanding Report Statistics
Running the Datagram Test UtilityThe datagram test utility is run from the command line using either the com.tangosol.net.DatagramTest class or by running the datagram-test script that is provided in the COHERENCE_HOME/bin directory. A script is provided for both Windows and UNIX-based platforms.
The following example demonstrates using the DatagramTest class:
java -server com.tangosol.net.DatagramTest <command value> <command value> ...
The following example demonstrates using the script:
datagram-test <command value> <command value> ...
Table 4–1 describes the available command line options for the datagram test utility.
Table 4–1 Command Line Options for the Datagram Test Utility
CommandRequired/Optional Applicability Description Default
-local Optional Both The local address to bind to, specified as addr:port
localhost:9999
-packetSize Optional Both The size of packet to work with, specified in bytes.
1468
-payload Optional Both The amount of data to include in each packet. Use 0 to match packet size.
0
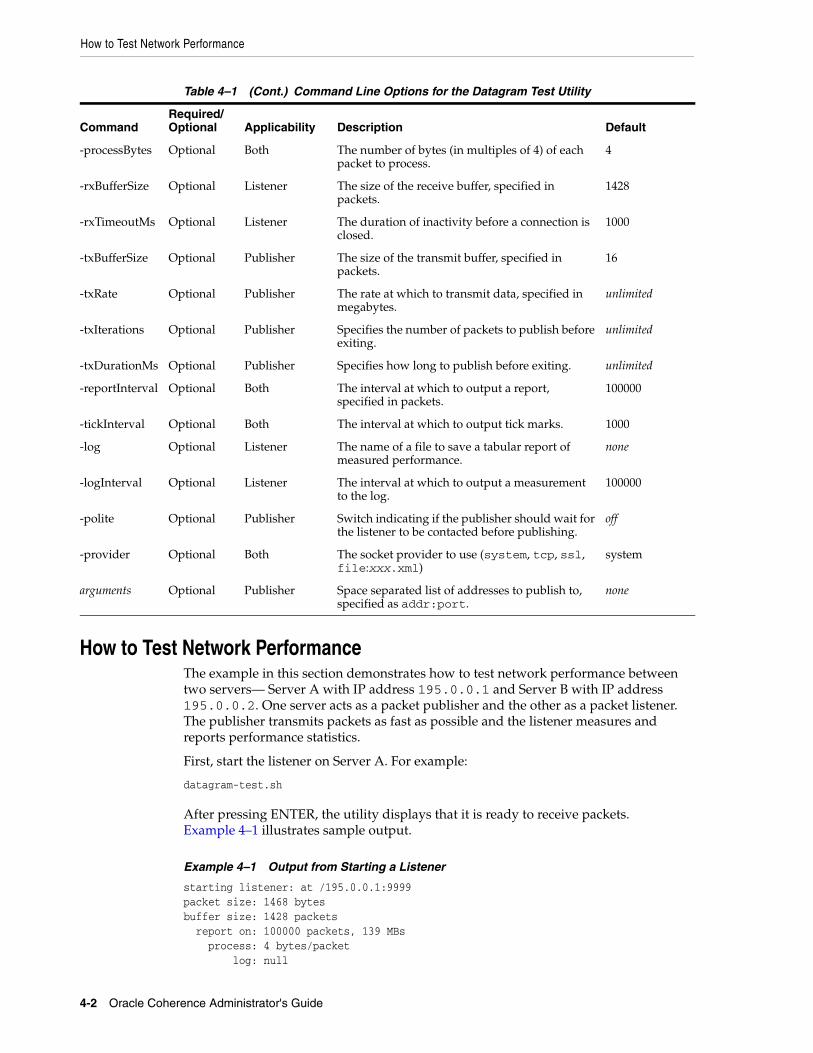
How to Test Network Performance
4-2 Oracle Coherence Administrator's Guide
How to Test Network PerformanceThe example in this section demonstrates how to test network performance between two servers— Server A with IP address 195.0.0.1 and Server B with IP address 195.0.0.2. One server acts as a packet publisher and the other as a packet listener. The publisher transmits packets as fast as possible and the listener measures and reports performance statistics.
First, start the listener on Server A. For example:
datagram-test.sh
After pressing ENTER, the utility displays that it is ready to receive packets. Example 4–1 illustrates sample output.
Example 4–1 Output from Starting a Listener
starting listener: at /195.0.0.1:9999packet size: 1468 bytesbuffer size: 1428 packets report on: 100000 packets, 139 MBs process: 4 bytes/packet log: null
-processBytes Optional Both The number of bytes (in multiples of 4) of each packet to process.
4
-rxBufferSize Optional Listener The size of the receive buffer, specified in packets.
1428
-rxTimeoutMs Optional Listener The duration of inactivity before a connection is closed.
1000
-txBufferSize Optional Publisher The size of the transmit buffer, specified in packets.
16
-txRate Optional Publisher The rate at which to transmit data, specified in megabytes.
unlimited
-txIterations Optional Publisher Specifies the number of packets to publish before exiting.
unlimited
-txDurationMs Optional Publisher Specifies how long to publish before exiting. unlimited
-reportInterval Optional Both The interval at which to output a report, specified in packets.
100000
-tickInterval Optional Both The interval at which to output tick marks. 1000
-log Optional Listener The name of a file to save a tabular report of measured performance.
none
-logInterval Optional Listener The interval at which to output a measurement to the log.
100000
-polite Optional Publisher Switch indicating if the publisher should wait for the listener to be contacted before publishing.
off
-provider Optional Both The socket provider to use (system, tcp, ssl, file:xxx.xml)
system
arguments Optional Publisher Space separated list of addresses to publish to, specified as addr:port.
none
Table 4–1 (Cont.) Command Line Options for the Datagram Test Utility
CommandRequired/Optional Applicability Description Default
How to Test Network Performance
Performing a Network Performance Test 4-3
log on: 139 MBs
The test, by default, tries to allocate a network receive buffer large enough to hold 1428 packets, or about 2 MB. The utility reports an error and exits if it cannot allocate this buffer. Either decrease the requested buffer size using the -rxBufferSize parameter, or increase the operating system’s network buffer settings. Increase the operating system buffers for the best performance. See Chapter 7, "Production Checklist" for details on tuning an operating system for Coherence.
Start the publisher on Server B and direct it to publish to Server A. For example:
datagram-test.sh servera
After pressing ENTER, the test instance on Server B starts both a listener and a publisher. However, the listener is not used in this configuration. Example 4–2 demonstrates the sample output that displays in the Server B command window.
Example 4–2 Datagram Test—Starting a Listener and a Publisher on a Server
starting listener: at /195.0.0.2:9999packet size: 1468 bytesbuffer size: 1428 packets report on: 100000 packets, 139 MBs process: 4 bytes/packet log: null log on: 139 MBs
starting publisher: at /195.0.0.2:9999 sending to servera/195.0.0.1:9999packet size: 1468 bytesbuffer size: 16 packets report on: 100000 packets, 139 MBs process: 4 bytes/packet peers: 1 rate: no limit
no packet burst limitoooooooooOoooooooooOoooooooooOoooooooooOoooooooooOoooooooooOoooooooooOoooooooooO
The series of o and O marks appear as data is (O)utput on the network. Each o represents 1000 packets, with O indicators at every 10,000 packets.
On Server A, a corresponding set of i and I marks, representing network (I)nput. This indicates that the two test instances are communicating.
Performing a Bidirectional TestThe test can also be run in bidirectional mode where both servers act as publishers and listeners. Restart the test instances and supply the instance on Server A with the address for Server B. For example on Server A run:
datagram-test.sh -polite serverb
The -polite parameter instructs this test instance to not start publishing until it starts to receive data. Run the same command as before on Server B.
datagram-test.sh servera
Understanding Report Statistics
4-4 Oracle Coherence Administrator's Guide
Performing a Distributed TestThe test can be run with more than two computers. For example, setup two publishers to target a single listener. This style of testing is far more realistic then simple one-to-one testing and may identify network bottlenecks that may not otherwise be apparent.
The following example runs the datagram test among 4 computers:
On Server A:
datagramtest.sh -txRate 100 -polite serverb serverc serverd
On Server B:
datagramtest.sh -txRate 100 -polite servera serverc serverd
On Server C:
datagramtest.sh -txRate 100 -polite servera serverb serverd
On Server D:
datagramtest.sh -txRate 100 servera serverb serverc
This test sequence causes all nodes to send a total of 100MB per second to all other nodes (that is, 33MB/node/second). On a fully switched 1GbE network this should be achievable without packet loss.
To simplify the execution of the test, all nodes can be started with an identical target list, they obviously transmit to themselves as well, but this loopback data can easily be factored out. It is important to start all but the last node using the -polite switch, as this causes all other nodes to delay testing until the final node is started.
Understanding Report StatisticsEach side of the test (publisher and listener) periodically report performance statistics. The publisher simply reports the rate at which it is publishing data on the network. For example:
Tx summary 1 peers: life: 97 MB/sec, 69642 packets/sec now: 98 MB/sec, 69735 packets/sec
The report includes both the current transmit rate (since last report) and the lifetime transmit rate.
Table 4–2 describes the statistics that can be reported by the listener.
Table 4–2 Listener Statistics
Element Description
Elapsed The time interval that the report covers.
Packet size The received packet size.
Throughput The rate at which packets are being received.
Received The number of packets received.
Missing The number of packets which were detected as lost.
Success rate The percentage of received packets out of the total packets sent.
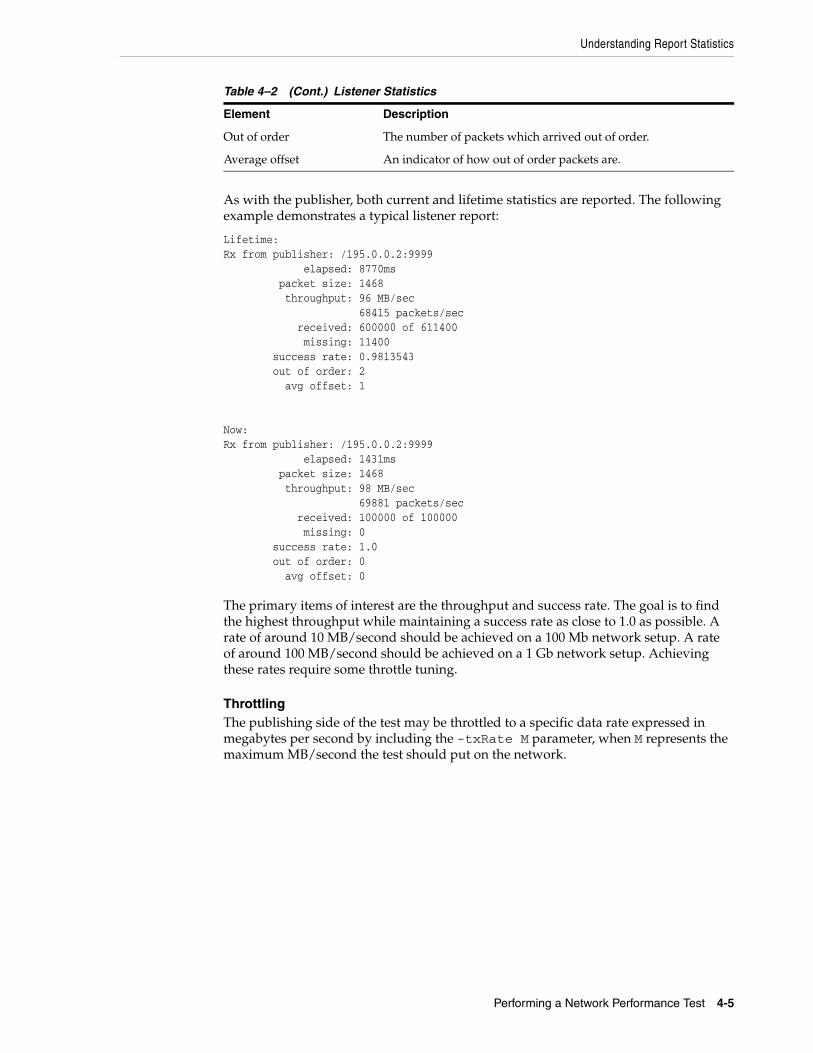
Understanding Report Statistics
Performing a Network Performance Test 4-5
As with the publisher, both current and lifetime statistics are reported. The following example demonstrates a typical listener report:
Lifetime:Rx from publisher: /195.0.0.2:9999 elapsed: 8770ms packet size: 1468 throughput: 96 MB/sec 68415 packets/sec received: 600000 of 611400 missing: 11400 success rate: 0.9813543 out of order: 2 avg offset: 1
Now:Rx from publisher: /195.0.0.2:9999 elapsed: 1431ms packet size: 1468 throughput: 98 MB/sec 69881 packets/sec received: 100000 of 100000 missing: 0 success rate: 1.0 out of order: 0 avg offset: 0
The primary items of interest are the throughput and success rate. The goal is to find the highest throughput while maintaining a success rate as close to 1.0 as possible. A rate of around 10 MB/second should be achieved on a 100 Mb network setup. A rate of around 100 MB/second should be achieved on a 1 Gb network setup. Achieving these rates require some throttle tuning.
ThrottlingThe publishing side of the test may be throttled to a specific data rate expressed in megabytes per second by including the -txRate M parameter, when M represents the maximum MB/second the test should put on the network.
Out of order The number of packets which arrived out of order.
Average offset An indicator of how out of order packets are.
Table 4–2 (Cont.) Listener Statistics
Element Description

Understanding Report Statistics
4-6 Oracle Coherence Administrator's Guide
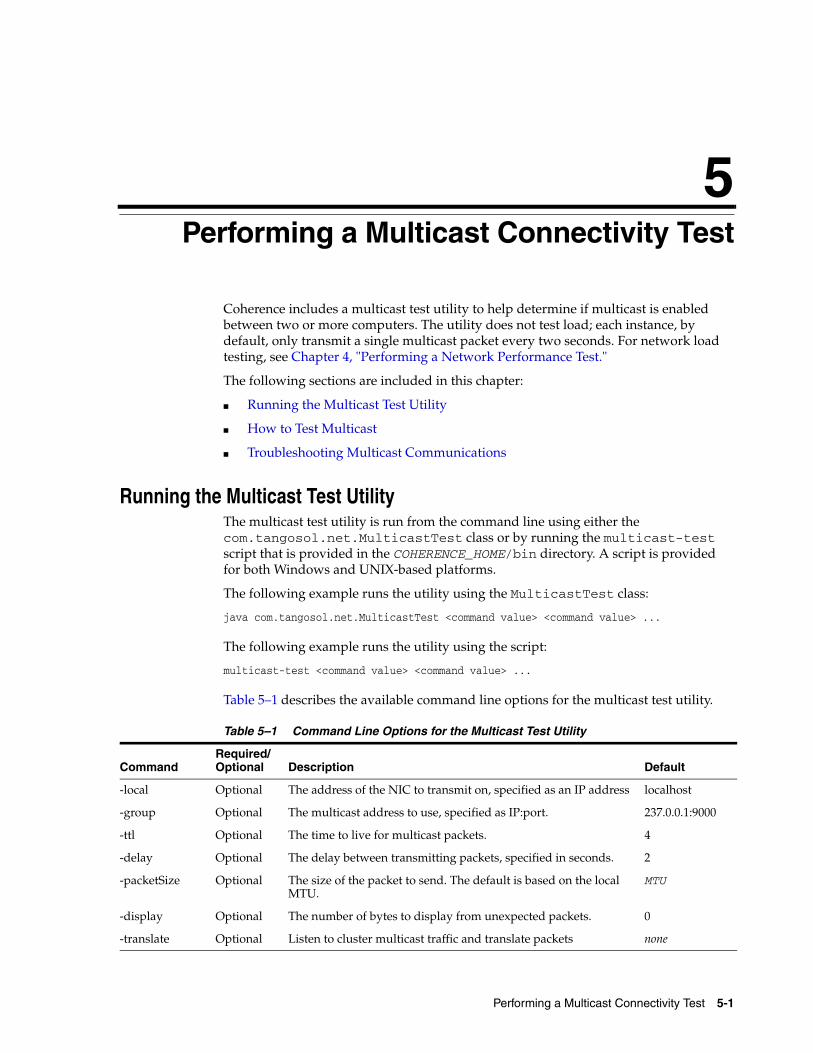
5
Performing a Multicast Connectivity Test 5-1
5Performing a Multicast Connectivity Test
Coherence includes a multicast test utility to help determine if multicast is enabled between two or more computers. The utility does not test load; each instance, by default, only transmit a single multicast packet every two seconds. For network load testing, see Chapter 4, "Performing a Network Performance Test."
The following sections are included in this chapter:
■ Running the Multicast Test Utility
■ How to Test Multicast
■ Troubleshooting Multicast Communications
Running the Multicast Test UtilityThe multicast test utility is run from the command line using either the com.tangosol.net.MulticastTest class or by running the multicast-test script that is provided in the COHERENCE_HOME/bin directory. A script is provided for both Windows and UNIX-based platforms.
The following example runs the utility using the MulticastTest class:
java com.tangosol.net.MulticastTest <command value> <command value> ...
The following example runs the utility using the script:
multicast-test <command value> <command value> ...
Table 5–1 describes the available command line options for the multicast test utility.
Table 5–1 Command Line Options for the Multicast Test Utility
CommandRequired/Optional Description Default
-local Optional The address of the NIC to transmit on, specified as an IP address localhost
-group Optional The multicast address to use, specified as IP:port. 237.0.0.1:9000
-ttl Optional The time to live for multicast packets. 4
-delay Optional The delay between transmitting packets, specified in seconds. 2
-packetSize Optional The size of the packet to send. The default is based on the local MTU.
MTU
-display Optional The number of bytes to display from unexpected packets. 0
-translate Optional Listen to cluster multicast traffic and translate packets none
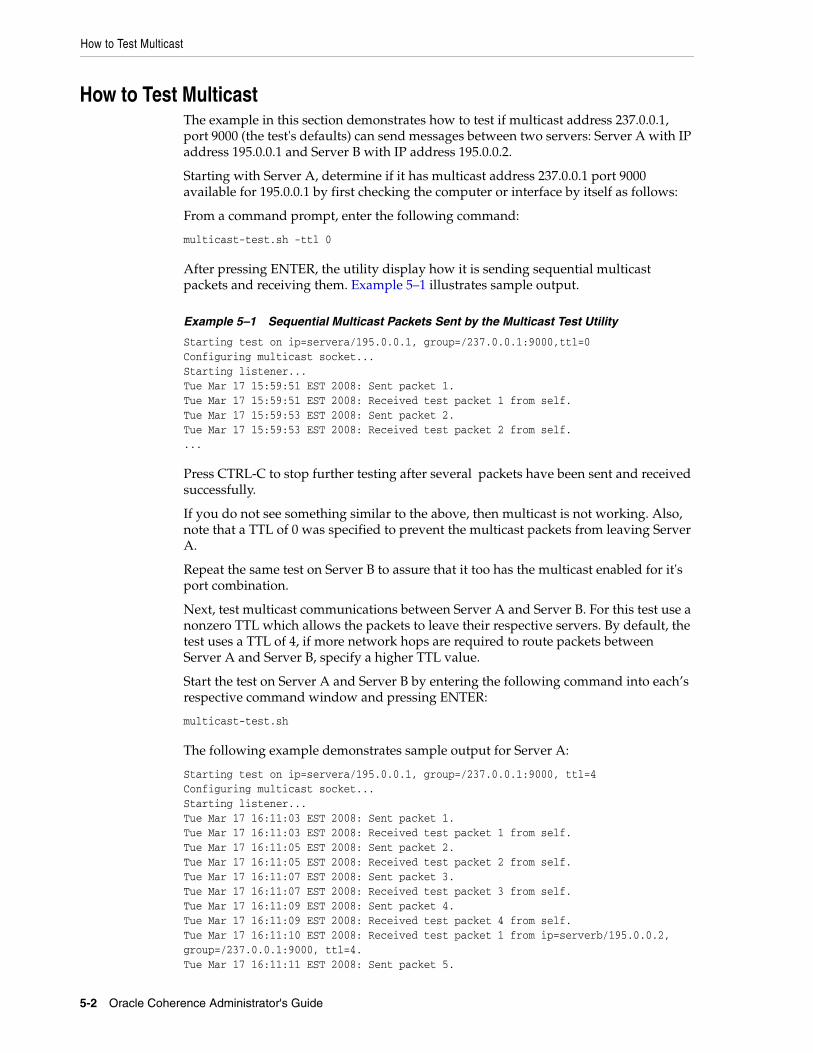
How to Test Multicast
5-2 Oracle Coherence Administrator's Guide
How to Test MulticastThe example in this section demonstrates how to test if multicast address 237.0.0.1, port 9000 (the test's defaults) can send messages between two servers: Server A with IP address 195.0.0.1 and Server B with IP address 195.0.0.2.
Starting with Server A, determine if it has multicast address 237.0.0.1 port 9000 available for 195.0.0.1 by first checking the computer or interface by itself as follows:
From a command prompt, enter the following command:
multicast-test.sh -ttl 0
After pressing ENTER, the utility display how it is sending sequential multicast packets and receiving them. Example 5–1 illustrates sample output.
Example 5–1 Sequential Multicast Packets Sent by the Multicast Test Utility
Starting test on ip=servera/195.0.0.1, group=/237.0.0.1:9000,ttl=0Configuring multicast socket...Starting listener...Tue Mar 17 15:59:51 EST 2008: Sent packet 1.Tue Mar 17 15:59:51 EST 2008: Received test packet 1 from self.Tue Mar 17 15:59:53 EST 2008: Sent packet 2.Tue Mar 17 15:59:53 EST 2008: Received test packet 2 from self....
Press CTRL-C to stop further testing after several packets have been sent and received successfully.
If you do not see something similar to the above, then multicast is not working. Also, note that a TTL of 0 was specified to prevent the multicast packets from leaving Server A.
Repeat the same test on Server B to assure that it too has the multicast enabled for it's port combination.
Next, test multicast communications between Server A and Server B. For this test use a nonzero TTL which allows the packets to leave their respective servers. By default, the test uses a TTL of 4, if more network hops are required to route packets between Server A and Server B, specify a higher TTL value.
Start the test on Server A and Server B by entering the following command into each’s respective command window and pressing ENTER:
multicast-test.sh
The following example demonstrates sample output for Server A:
Starting test on ip=servera/195.0.0.1, group=/237.0.0.1:9000, ttl=4Configuring multicast socket...Starting listener...Tue Mar 17 16:11:03 EST 2008: Sent packet 1.Tue Mar 17 16:11:03 EST 2008: Received test packet 1 from self.Tue Mar 17 16:11:05 EST 2008: Sent packet 2.Tue Mar 17 16:11:05 EST 2008: Received test packet 2 from self.Tue Mar 17 16:11:07 EST 2008: Sent packet 3.Tue Mar 17 16:11:07 EST 2008: Received test packet 3 from self.Tue Mar 17 16:11:09 EST 2008: Sent packet 4.Tue Mar 17 16:11:09 EST 2008: Received test packet 4 from self.Tue Mar 17 16:11:10 EST 2008: Received test packet 1 from ip=serverb/195.0.0.2, group=/237.0.0.1:9000, ttl=4.Tue Mar 17 16:11:11 EST 2008: Sent packet 5.
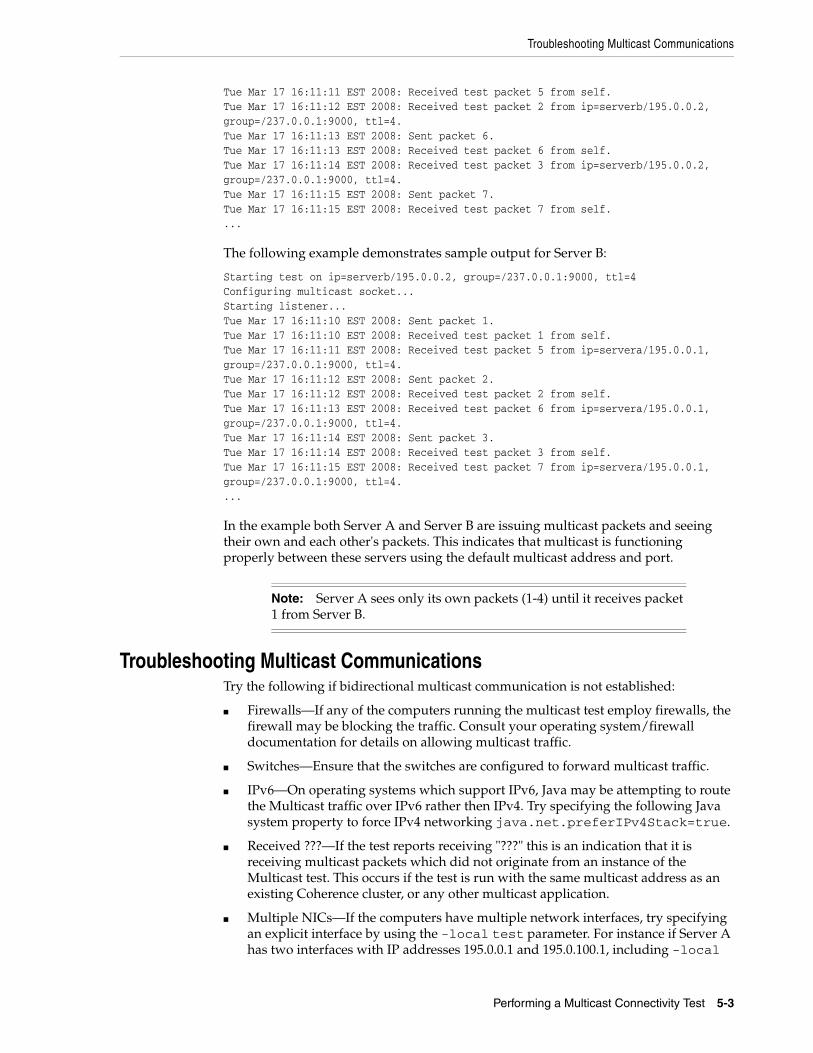
Troubleshooting Multicast Communications
Performing a Multicast Connectivity Test 5-3
Tue Mar 17 16:11:11 EST 2008: Received test packet 5 from self.Tue Mar 17 16:11:12 EST 2008: Received test packet 2 from ip=serverb/195.0.0.2, group=/237.0.0.1:9000, ttl=4.Tue Mar 17 16:11:13 EST 2008: Sent packet 6.Tue Mar 17 16:11:13 EST 2008: Received test packet 6 from self.Tue Mar 17 16:11:14 EST 2008: Received test packet 3 from ip=serverb/195.0.0.2, group=/237.0.0.1:9000, ttl=4.Tue Mar 17 16:11:15 EST 2008: Sent packet 7.Tue Mar 17 16:11:15 EST 2008: Received test packet 7 from self....
The following example demonstrates sample output for Server B:
Starting test on ip=serverb/195.0.0.2, group=/237.0.0.1:9000, ttl=4Configuring multicast socket...Starting listener...Tue Mar 17 16:11:10 EST 2008: Sent packet 1.Tue Mar 17 16:11:10 EST 2008: Received test packet 1 from self.Tue Mar 17 16:11:11 EST 2008: Received test packet 5 from ip=servera/195.0.0.1, group=/237.0.0.1:9000, ttl=4.Tue Mar 17 16:11:12 EST 2008: Sent packet 2.Tue Mar 17 16:11:12 EST 2008: Received test packet 2 from self.Tue Mar 17 16:11:13 EST 2008: Received test packet 6 from ip=servera/195.0.0.1, group=/237.0.0.1:9000, ttl=4.Tue Mar 17 16:11:14 EST 2008: Sent packet 3.Tue Mar 17 16:11:14 EST 2008: Received test packet 3 from self.Tue Mar 17 16:11:15 EST 2008: Received test packet 7 from ip=servera/195.0.0.1, group=/237.0.0.1:9000, ttl=4....
In the example both Server A and Server B are issuing multicast packets and seeing their own and each other's packets. This indicates that multicast is functioning properly between these servers using the default multicast address and port.
Troubleshooting Multicast CommunicationsTry the following if bidirectional multicast communication is not established:
■ Firewalls—If any of the computers running the multicast test employ firewalls, the firewall may be blocking the traffic. Consult your operating system/firewall documentation for details on allowing multicast traffic.
■ Switches—Ensure that the switches are configured to forward multicast traffic.
■ IPv6—On operating systems which support IPv6, Java may be attempting to route the Multicast traffic over IPv6 rather then IPv4. Try specifying the following Java system property to force IPv4 networking java.net.preferIPv4Stack=true.
■ Received ???—If the test reports receiving "???" this is an indication that it is receiving multicast packets which did not originate from an instance of the Multicast test. This occurs if the test is run with the same multicast address as an existing Coherence cluster, or any other multicast application.
■ Multiple NICs—If the computers have multiple network interfaces, try specifying an explicit interface by using the -local test parameter. For instance if Server A has two interfaces with IP addresses 195.0.0.1 and 195.0.100.1, including -local
Note: Server A sees only its own packets (1-4) until it receives packet 1 from Server B.
Troubleshooting Multicast Communications
5-4 Oracle Coherence Administrator's Guide
195.0.0.1 on the test command line would ensure that the multicast packets used the first interface. In addition, the computer’s routing table may require explicit configuration to forward multicast traffic through the desired network interface. This can be done by issuing the following command:
route add -net 224.0.0.0 netmask 240.0.0.0 dev eth1
Where eth1 is the device that is designated to transmit multicast traffic.
■ AIX—On AIX systems, the following multicast issues may be encountered:
■ IPv6—In addition to specifying java.net.preferIPv4Stack=true, the operating system may require additional configuration to perform IPv4 name resolution. Add hosts=local,bind4 to the /etc/netsvc.conf file.
■ Virtual IP (VIPA)—AIX does not support multicast with VIPA. If using VIPA either bind multicast to a non-VIPA device, or run Coherence with multicast disabled. See the Oracle Coherence Developer's Guide for details.
■ MTU—Configure the MTU for the multicast device to 1500 bytes.
■ Cisco Switches—See "Deploying to Cisco Switches" on page 2-2 for the list of known issues.
■ Foundry Switches—See "Deploying to Foundry Switches" on page 2-4 for the list of known issues.
If multicast is not functioning properly, consult with a network administrator or sysadmin to determine the cause and to correct the situation.
6
Performance Tuning 6-1
6Performance Tuning
This chapter provides tuning instructions to help achieve maximum performance. See also Chapter 4, "Performing a Network Performance Test."
The following sections are included in this chapter:
■ Operating System Tuning
■ Network Tuning
■ JVM Tuning
■ Coherence Communication Tuning
■ Data Access Patterns
Operating System TuningThe following topics are included in this section:
■ Socket Buffer Sizes
■ High Resolution timesource (Linux)
■ Datagram size (Microsoft Windows)
■ Thread Scheduling (Microsoft Windows)
■ Swapping
■ Load Balancing Network Interrupts (Linux)
Socket Buffer SizesTo help minimization of packet loss, the operating system socket buffers must be large enough to handle the incoming network traffic while your Java application is paused during garbage collection. By default Coherence attempts to allocate a socket buffer of 2MB. Coherence uses smaller buffers if your operating system is not configured to allow for large buffers. Most versions of UNIX have a very low default buffer limit, which should be increased to at least 2MB.
Coherence issues the following warning if the operating system failed to allocate the full size buffer.
UnicastUdpSocket failed to set receive buffer size to 1428 packets (2096304 bytes); actual size is 89 packets (131071 bytes). Consult your OS documentation regarding increasing the maximum socket buffer size. Proceeding with the actual value may cause sub-optimal performance.
Operating System Tuning
6-2 Oracle Coherence Administrator's Guide
Though it is safe to operate with the smaller buffers it is recommended that you configure your operating system to allow for larger buffers.
On Linux execute (as root):
sysctl -w net.core.rmem_max=2096304sysctl -w net.core.wmem_max=2096304
On Solaris execute (as root):
ndd -set /dev/udp udp_max_buf 2096304
On AIX execute (as root):
no -o rfc1323=1no -o sb_max=4194304
On Windows:
Windows does not impose a buffer size restriction by default.
Other:
For information on increasing the buffer sizes for other operating systems, refer to your operating system's documentation.
You may configure Coherence to request alternate sized buffers for packet publishers and unicast listeners by using the <packet-buffer> element.
High Resolution timesource (Linux)Linux has several high resolution timesources to choose from, the fastest TSC (Time Stamp Counter) unfortunately is not always reliable. Linux chooses TSC by default and during startup checks for inconsistencies, if found it switches to a slower safe timesource. The slower time sources can be 10 to 30 times more expensive to query then the TSC timesource, and may have a measurable impact on Coherence performance. Note that Coherence and the underlying JVM are not aware of the timesource which the operating system is using. It is suggested that you check your system logs (/var/log/dmesg) to verify that the following is not present. Example 6–1 illustrates a sample timesource log.
Example 6–1 Log Message from a Linux Timesource
kernel: Losing too many ticks!kernel: TSC cannot be used as a timesource.kernel: Possible reasons for this are:kernel: You're running with Speedstep,kernel: You don't have DMA enabled for your hard disk (see hdparm),kernel: Incorrect TSC synchronization on an SMP system (see dmesg).kernel: Falling back to a sane timesource now.
As the log messages suggest, this can be caused by a variable rate CPU (SpeedStep), having DMA disabled, or incorrect TSC synchronization on multi CPU computers. If present, work with your system administrator to identify and correct the cause allowing the TSC timesource to be used.
Note: Note that AIX only supports specifying buffer sizes of 1MB, 4MB, and 8MB.
Operating System Tuning
Performance Tuning 6-3
In some older versions of Linux there is a bug related to unsynchronized TSCs in multiprocessor systems. This bug can result in the clock apparently jumping forward by 4398 seconds, and then immediately jumping back to the correct time. This bug can trigger erroneous Coherence packet transmission timeouts resulting in nodes being incorrectly removed from the cluster. If you experience cluster disconnects along with a warning of a "4398 second" timeout it is suggested that you upgrade you Linux kernel. An example of such a log warning is as follows:
A potential communication problem has been detected. A packet has failed to be delivered (or acknowledged) after 4398 seconds ...
See the following resource for more details on this Linux TSC issue:
http://lkml.org/lkml/2007/8/23/96
https://bugzilla.redhat.com/show_bug.cgi?id=452185
Datagram size (Microsoft Windows)Microsoft Windows supports a fast I/O path which is used when sending "small" datagrams. The default setting for what is considered a small datagram is 1024 bytes; increasing this value to match your network MTU (normally 1500) can significantly improve network performance.
To adjust this parameter:
1. Run Registry Editor (regedit)
2. Locate the following registry key HKLM\System\CurrentControlSet\Services\AFD\Parameters
3. Add the following new DWORD value Name: FastSendDatagramThreshold Value: 1500 (decimal)
4. Restart.
See Appendix C of http://technet.microsoft.com/en-us/library/bb726981.aspx for more details on this parameter
Thread Scheduling (Microsoft Windows)Windows (including NT, 2000 and XP) is optimized for desktop application usage. If you run two console ("DOS box") windows, the one that has the focus can use almost 100% of the CPU, even if other processes have high-priority threads in a running state. To correct this imbalance, you must configure the Windows thread scheduling to less-heavily favor foreground applications.
1. Open the Control Panel.
2. Open System.
3. Select the Advanced tab.
4. Under Performance select Settings.
5. Select the Advanced tab.
Note: The COHERENCE_HOME/bin/optimize.reg script performs this change. After running the script, restart the computer for the changes to take effect.
Operating System Tuning
6-4 Oracle Coherence Administrator's Guide
6. Under Processor scheduling, choose Background services.
SwappingSwapping, also known as paging, is the use of secondary storage to store and retrieve application data for use in RAM memory. Swapping is automatically performed by the operating system and typically occurs when the available RAM memory is depleted. Swapping can have a significant impact on Coherence's performance and should be avoided. Often, swapping manifests itself as Coherence nodes being removed from the cluster due to long periods of unresponsiveness caused by them having been swapped out of RAM. See "Avoid using virtual memory (paging to disk)." on page 7-8 for more information.
To avoid swapping, ensure that sufficient RAM memory is available on the computer or that the number of running processes is accounted for and do not consume all the available RAM. Tools such as vmstat and top (on Unix and Linux) and taskmgr (on Windows) should be used to monitor swap rates.
Swappiness in LinuxLinux, by default, may choose to swap out a process or some of its heap due to low usage even if it is not running low on RAM. Swappiness is performed to be ready to handle eventual memory requests. Swappiness should be avoided for Coherence JVMs. The swappiness setting on Linux is a value between 0 and 100, where higher values encourage more optimistic swapping. The default value is 60. For Coherence, a lower value (0 if possible) should always be set.
To see the current swappiness value that is set, enter the following at the command prompt:
cat /proc/sys/vm/swappiness
To temporarily set the swappiness, as the root user echo a value onto /proc/sys/vm/swappiness. The following example sets the value to 0.
echo 0 > /proc/sys/vm/swappiness
To set the value permanently, modify the /etc/sysctl.conf file.
Load Balancing Network Interrupts (Linux)Linux kernels (2.4 and higher) have the ability to balance hardware interrupt requests across multiple CPUs or CPU cores. The feature is referred to as SMP IRQ Affinity and results in better system performance as well as better CPU utilization. For Coherence, significant performance can be gained by balancing ethernet card interrupts for all servers that host cluster members.
Most Linux installations are not configured to balance network interrupts. The default network interrupt behavior uses a single processor (typically CPU0) to handle all network interrupts and can become a serious performance bottleneck with high volumes of network traffic. Balancing network interrupts among multiple CPUs increases the performance of network-based operations.
Note: The COHERENCE_HOME/bin/optimize.reg script performs this change. After running the script, restart the computer for the changes to take effect.
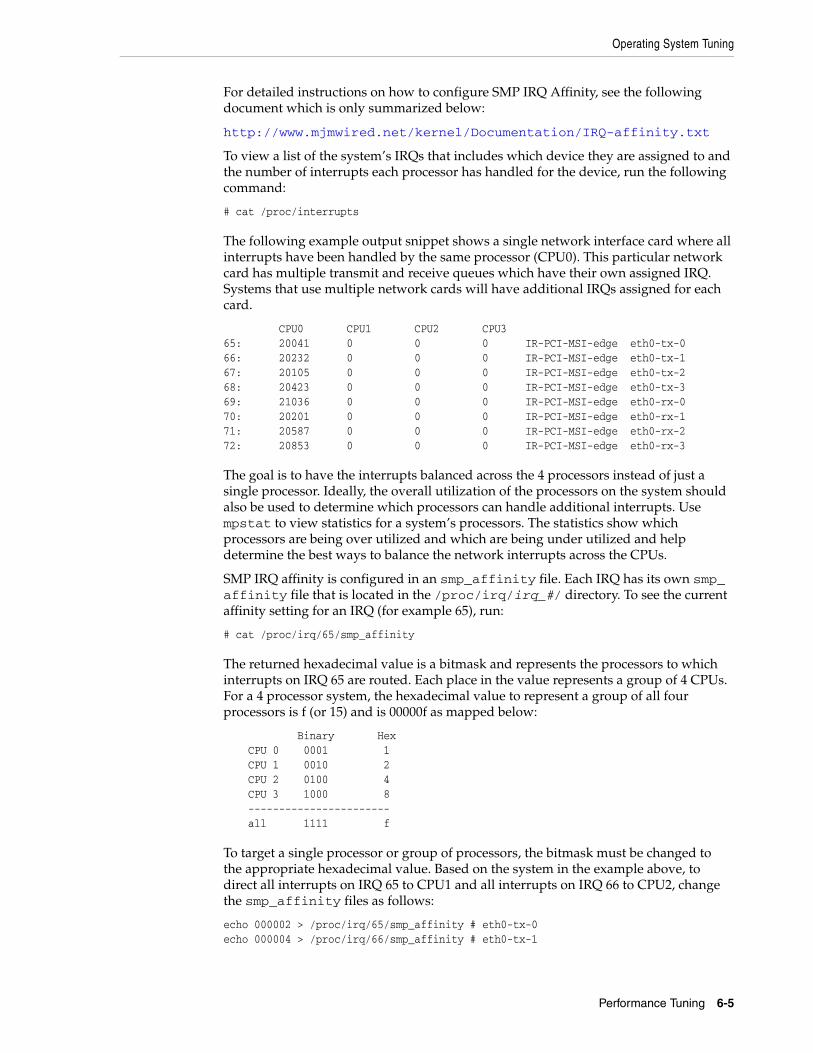
Operating System Tuning
Performance Tuning 6-5
For detailed instructions on how to configure SMP IRQ Affinity, see the following document which is only summarized below:
http://www.mjmwired.net/kernel/Documentation/IRQ-affinity.txt
To view a list of the system’s IRQs that includes which device they are assigned to and the number of interrupts each processor has handled for the device, run the following command:
# cat /proc/interrupts
The following example output snippet shows a single network interface card where all interrupts have been handled by the same processor (CPU0). This particular network card has multiple transmit and receive queues which have their own assigned IRQ. Systems that use multiple network cards will have additional IRQs assigned for each card.
CPU0 CPU1 CPU2 CPU365: 20041 0 0 0 IR-PCI-MSI-edge eth0-tx-066: 20232 0 0 0 IR-PCI-MSI-edge eth0-tx-167: 20105 0 0 0 IR-PCI-MSI-edge eth0-tx-268: 20423 0 0 0 IR-PCI-MSI-edge eth0-tx-369: 21036 0 0 0 IR-PCI-MSI-edge eth0-rx-070: 20201 0 0 0 IR-PCI-MSI-edge eth0-rx-171: 20587 0 0 0 IR-PCI-MSI-edge eth0-rx-272: 20853 0 0 0 IR-PCI-MSI-edge eth0-rx-3
The goal is to have the interrupts balanced across the 4 processors instead of just a single processor. Ideally, the overall utilization of the processors on the system should also be used to determine which processors can handle additional interrupts. Use mpstat to view statistics for a system’s processors. The statistics show which processors are being over utilized and which are being under utilized and help determine the best ways to balance the network interrupts across the CPUs.
SMP IRQ affinity is configured in an smp_affinity file. Each IRQ has its own smp_affinity file that is located in the /proc/irq/irq_#/ directory. To see the current affinity setting for an IRQ (for example 65), run:
# cat /proc/irq/65/smp_affinity
The returned hexadecimal value is a bitmask and represents the processors to which interrupts on IRQ 65 are routed. Each place in the value represents a group of 4 CPUs. For a 4 processor system, the hexadecimal value to represent a group of all four processors is f (or 15) and is 00000f as mapped below:
Binary Hex CPU 0 0001 1 CPU 1 0010 2 CPU 2 0100 4 CPU 3 1000 8 ----------------------- all 1111 f
To target a single processor or group of processors, the bitmask must be changed to the appropriate hexadecimal value. Based on the system in the example above, to direct all interrupts on IRQ 65 to CPU1 and all interrupts on IRQ 66 to CPU2, change the smp_affinity files as follows:
echo 000002 > /proc/irq/65/smp_affinity # eth0-tx-0echo 000004 > /proc/irq/66/smp_affinity # eth0-tx-1
Network Tuning
6-6 Oracle Coherence Administrator's Guide
To direct all interrupts on IRQ 65 to both CPU1 and CPU2, change the smp_affinity file as follows:
echo 000006 > /proc/irq/65/smp_affinity # eth0-tx-0
To direct all interrupts on each IRQ to all CPUs, change the smp_affinity files as follows:
echo 00000f > /proc/irq/65/smp_affinity # eth0-tx-0echo 00000f > /proc/irq/66/smp_affinity # eth0-tx-1echo 00000f > /proc/irq/67/smp_affinity # eth0-tx-2echo 00000f > /proc/irq/68/smp_affinity # eth0-tx-3echo 00000f > /proc/irq/69/smp_affinity # eth0-rx-0echo 00000f > /proc/irq/70/smp_affinity # eth0-rx-1echo 00000f > /proc/irq/71/smp_affinity # eth0-rx-2echo 00000f > /proc/irq/72/smp_affinity # eth0-rx-3
Network Tuning■ Network Interface Settings
■ Bus Considerations
■ Network Infrastructure Settings
■ Switch and Subnet Considerations
■ Ethernet Flow-Control
■ Path MTU
Network Interface SettingsVerify that your Network card (NIC) is configured to operate at it's maximum link speed and at full duplex. The process for doing this varies between operating systems.
On Linux execute (as root):
ethtool eth0
See the man page on ethtool for further details and for information on adjust the interface settings.
On Solaris execute (as root):
kstat ce:0 | grep link_
This displays the link settings for interface 0. Items of interest are link_duplex (2 = full), and link_speed which is reported in Mbps.
On Windows:
1. Open the Control Panel.
Note: If running on Solaris 10, review issues 102712 and 102741 which relate to packet corruption and multicast disconnections. These often manifest as either EOFExceptions, "Large gap" warnings while reading packet data, or frequent packet timeouts. It is highly recommend that the patches for both issues be applied when using Coherence on Solaris 10 systems.
Network Tuning
Performance Tuning 6-7
2. Open Network Connections.
3. Open the Properties dialog for desired network adapter.
4. Select Configure.
5. Select the Advanced tab.
6. Locate the driver specific property for Speed & Duplex.
7. Set it to either auto or to a specific speed and duplex setting.
Bus ConsiderationsFor 1Gb and faster PCI network cards, the system's bus speed may be the limiting factor for network performance. PCI and PCI-X busses are half-duplex, and all devices run at the speed of the slowest device on the bus. Standard PCI buses have a maximum throughput of approximately 1Gb/sec and thus are not capable of fully using a full-duplex 1Gb NIC. PCI-X has a much higher maximum throughput (1GB/sec), but can be hobbled by a single slow device on the bus. If you find that you are not able to achieve satisfactory bidirectional data rates, evaluate your computer's bus configuration. For instance, simply relocating the NIC to a private bus may improve performance.
Network Infrastructure SettingsIf you experience frequent multi-second communication pauses across multiple cluster nodes, try increasing your switch's buffer space. These communication pauses can be identified by a series of Coherence log messages identifying communication delays with multiple nodes which are not attributable to local or remote GCs.
Example 6–2 Message Indicating a Communication Delay
Experienced a 4172 ms communication delay (probable remote GC) with Member(Id=7, Timestamp=2006-10-20 12:15:47.511, Address=192.168.0.10:8089, MachineId=13838); 320 packets rescheduled, PauseRate=0.31, Threshold=512
Some switches such as the Cisco 6500 series support configuration the amount of buffer space available to each Ethernet port or ASIC. In high load applications it may be necessary to increase the default buffer space. On Cisco this can be accomplished by executing:
fabric buffer-reserve high
See Cisco's documentation for additional details on this setting.
Switch and Subnet ConsiderationsCluster members may be split across multiple switches and may be part of multiple subnets. However, such topologies can increase the impact of network latency on cluster communication by an order of magnitude. Tipsily, the impact materializes as communication delays that affect cluster and application performance. If possible, consider always locating all cluster members on the same switch and subnet to minimize the impact of network latency.
See also: "Evaluate the Production Network’s Speed" on page 7-2.
Network Tuning
6-8 Oracle Coherence Administrator's Guide
Ethernet Flow-ControlFull duplex Ethernet includes a flow-control feature which allows the receiving end of a point to point link to slow down the transmitting end. This is implemented by the receiving end sending an Ethernet PAUSE frame to the transmitting end, the transmitting end then halts transmissions for the interval specified by the PAUSE frame. Note that this pause blocks all traffic from the transmitting side, even traffic destined for computers which are not overloaded. This can induce a head of line blocking condition, where one overloaded computer on a switch effectively slows down all other computers. Most switch vendors recommend that Ethernet flow-control be disabled for inter switch links, and at most be used on ports which are directly connected to computers. Even in this setup head of line blocking can still occur, and thus it is advisable to disable Ethernet flow-control. Higher level protocols such as TCP/IP and Coherence TCMP include their own flow-control mechanisms which are not subject to head of line blocking, and also negate the need for the lower level flow-control.
See http://www.networkworld.com/netresources/0913flow2.html for more details on this subject
Path MTUBy default Coherence assumes a 1500 byte network MTU, and uses a default packet size of 1468 based on this assumption. Having a packet size which does not fill the MTU results in an under used network. If your equipment uses a different MTU, then configure Coherence by specifying the <packet-size> setting, which is 32 bytes smaller then the network path's minimal MTU.
If you are unsure of your equipment’s MTU along the full path between nodes, you can use either the standard ping or traceroute utilities to determine the MTU. For example, execute a series of ping or traceroute operations between the two computers. With each attempt, specify a different packet size, starting from a high value and progressively moving downward until the packets start to make it through without fragmentation.
On Linux execute:
ping -c 3 -M do -s 1468 serverb
On Solaris execute:
traceroute -F serverb 1468
On Windows execute:
ping -n 3 -f -l 1468 serverb
On other operating systems: Consult the documentation for the ping or traceroute command to see how to disable fragmentation, and specify the packet size.
If you receive a message stating that packets must be fragmented then the specified size is larger then the path's MTU. Decrease the packet size until you find the point at which packets can be transmitted without fragmentation. If you find that you must use packets smaller then 1468, you may want to contact your network administrator to get the MTU increased to at least 1500.
JVM Tuning
Performance Tuning 6-9
JVM Tuning■ Basic Sizing Recommendation
■ Heap Size Considerations
■ Garbage Collection Monitoring
Basic Sizing RecommendationThe recommendations in this section are sufficient for general use cases and require minimal setup effort. The primary issue to consider when sizing your JVMs is a balance of available RAM versus garbage collection (GC) pause times.
Cache ServersThe standard, safe recommendation for Coherence cache servers is to run a fixed size heap of up to 4GB. In addition, use an incremental garbage collector to minimize GC pause durations. Lastly, run all Coherence JVMs in server mode, by specifying the -server on the JVM command line. This allows for several performance optimizations for long running applications.
For example:
java -server -Xms1g -Xmx1g -Xincgc -Xloggc: -cp coherence.jar com.tangosol.net.DefaultCacheServer
This sizing allows for good performance without the need for more elaborate JVM tuning. For more information on garbage collection, see "Garbage Collection Monitoring" on page 6-13.
Larger heap sizes (up to 20GB heaps with JDK 6) are possible and have been implemented in production environments; however, it becomes more important to monitor and tune the JVMs to minimize the GC pauses. It may also be necessary to alter the storage ratios such that the amount of scratch space is increased to facilitate faster GC compactions. Additionally, it is recommended that you make use of an up-to-date JVM version (such as HotSpot 1.6) as it includes significant improvements for managing large heaps. See "Heap Size Considerations" below for additional details.
TCMP ClientsCoherence TCMP clients should be configured similarly to cache servers as long GCs could cause them to be misidentified as being terminated.
Extends ClientsCoherence Extend clients are not technically speaking cluster members and, as such, the effect of long GCs is less detrimental. For extend clients it is recommended that you follow the existing guidelines as set forth by the application in which you are embedding coherence.
Heap Size ConsiderationsUse this section to decide:
■ How many CPUs are need for your system
■ How much memory is need for each system
■ How many JVMs to run per system
■ How much heap to configure with each JVM
JVM Tuning
6-10 Oracle Coherence Administrator's Guide
Since all applications are different, this section should be read as guidelines. You must answer the following questions to choose the configuration that is right for you:
■ How much data is to be stored in Coherence caches?
■ What are the application requirements in terms of latency and throughput?
■ How CPU or Network intensive is the application?
Sizing is an imprecise science. There is no substitute for frequent performance and stress testing.
The following topics are included in this section:
■ General Guidelines
■ Moving the Cache Out of the Application Heap
General GuidelinesRunning with a fixed sized heap saves the JVM from having to grow the heap on demand and results in improved performance. To specify a fixed size heap use the -Xms and -Xmx JVM options, setting them to the same value. For example:
java -server -Xms4G -Xmx4G ...
A JVM process consumes more system memory then the specified heap size. The heap size settings specify the amount of heap which the JVM makes available to the application, but the JVM itself also consume additional memory. The amount consumed differs depending on the operating system, and JVM settings. For instance, a HotSpot JVM running on Linux configured with a 1GB JVM consumes roughly 1.2GB of RAM. It is important to externally measure the JVMs memory utilization to ensure that RAM is not over committed. Tools such as top, vmstat, and Task Manager are useful in identifying how much RAM is actually being used.
Storage RatiosThe basic recommendation for how much data can be stored within a cache server of a given size is to use a 1/3rd of the heap for primary cache storage. This leaves another 1/3rd for backup storage and the final 1/3rd for scratch space. Scratch space is then used for things such as holding classes, temporary objects, network transfer buffers, and GC compaction. You may instruct Coherence to limit primary storage on a per-cache basis by configuring the <high-units> element and specifying a BINARY value for the <unit-calculator> element. These settings are automatically applied to backup storage as well.
Ideally, both the primary and backup storage also fits within the JVMs tenured space (for HotSpot based JVMs). See HotSpot's Tuning Garbage Collection guide for details on sizing the collectors generations:
http://www.oracle.com/technetwork/java/javase/gc-tuning-6-140523.html
Cache Topologies and Heap SizeFor large data sets, partitioned or near caches are recommended. Varying the number of Coherence JVMs does not significantly affect cache performance because the scalability of the partitioned cache is linear for both reading and writing. Using a replicated cache puts significant pressure on GC.

JVM Tuning
Performance Tuning 6-11
Planning Capacity for Data Grid OperationsData grid operations (such as queries and aggregations) have additional heap space requirements and their use must be planned for accordingly. During data grid operations, binary representations of the cache entries that are part of the result set are held in-memory. Depending on the operation, the entries may also be held in deserialized form for the duration of the operation. Typically, this doubles the amount of memory for each entry in the result set. In addition, a second binary copy is maintained when using RAM or flash journaling as the backing map implementation due to differences in how the objects are stored. The second binary copy is also held for the duration of the operation and increases the total memory for each entry in the result set by 3x.
Heap memory usage depends on the size of the result set on which the operations are performed and the number of concurrent requests being handled. The result set size is affected by both the total number of entries as well as the size of each entry. Moderately sized result sets that are maintained on a storage cache server would not likely exhaust the heap’s memory. However, if the result set is sufficiently large, the additional memory requirements can cause the heap to run out of memory. Data grid aggregate operations typically involve larger data sets and are more likely to exhaust the available memory than other operations.
The JVMs heap size should be increased on storage enabled cache servers whenever large result sets are expected. If a 1/3rd of the heap has been reserved for scratch space (as recommended above), ensure the scratch space that is allocated can support the projected result set sizes. Alternatively, data grid operations can use the PartitionedFilter API. The API reduces memory consumption by executing grid operations against individual partition sets. See Oracle Coherence Java API Reference for details on using this API.
Deciding How Many JVMs to Run Per System
The number of JVMs (nodes) to run per system depends on the system's number of processors/cores and amount of memory. As a starting point, plan to run one JVM for every two cores. This recommendation balances the following factors:
■ Multiple JVMs per server allow Coherence to make more efficient use of network resources. Coherence's packet-publisher and packet-receiver have a fixed number of threads per JVM; as you add cores, you'll want to add JVMs to scale across these cores.
■ Too many JVMs increases contention and context switching on processors.
■ Too few JVMs may not be able to handle available memory and may not fully use the NIC.
■ Especially for larger heap sizes, JVMs must have available processing capacity to avoid long GC pauses.
Depending on your application, you can add JVMs up toward one per core. The recommended number of JVMs and amount of configured heap may also vary based on the number of processors/cores per socket and on the computer architecture.
Sizing Your HeapWhen considering heap size, it is important to find the right balance. The lower bound is determined by per-JVM overhead (and also, manageability of a potentially large number of JVMs). For example, if there is a fixed overhead of 100MB for infrastructure software (for example, JMX agents, connection pools, internal JVM structures), then the use of JVMs with 256MB heap sizes results in close to 40% overhead for non-cache data. The upper bound on JVM heap size is governed by memory management

JVM Tuning
6-12 Oracle Coherence Administrator's Guide
overhead, specifically the maximum duration of GC pauses and the percentage of CPU allocated to GC (and other memory management tasks).
GC can affect the following:
■ The latency of operations against Coherence. Larger heaps cause longer and less predictable latency than smaller heaps.
■ The stability of the cluster. With very large heaps, lengthy long garbage collection pauses can trick TCMP into believing a cluster member is terminated since the JVM is unresponsive during GC pauses. Although TCMP takes GC pauses into account when deciding on member health, at some point it may decide the member is terminated.
The following guidelines are provided:
■ For Oracle 1.6 JVM or JRockit, a conservative heap size of 4GB is recommended for most applications and is based on throughput, latency, and stability. However, larger heap sizes, up to 20GB, are suitable for some applications where the simplified management of fewer, larger JVMs outweighs the performance benefits of many smaller JVMs. A core-to-heap ratio of roughly 1 core: 2 GB is ideal, with some leeway to manage more GB per core (3 or even 4 GB). Every application is different and GC must be monitored accordingly.
■ Use Oracle's Concurrent Mark and Sweep (CMS) GC (-XX:+UseConcMarkSweepGC) or JRockit's Deterministic GC (-Xgcprio:deterministic) to improve GC performance.
The length of a GC pause scales worse than linearly to the size of the heap. That is, if you double the size of the heap, pause times due to GC more than double (in general). GC pauses are also impacted by application usage:
■ Pause times increase as the amount of live data in the heap increases. Do not exceed 70% live data in your heap. This includes primary data, backup data, indexes, and application data.
■ High object allocation rates increase pause times. Even "simple" Coherence applications can cause high object allocation rates since every network packet generates many objects.
■ CPU-intensive computations increase contention and may also contribute to higher pause times.
Depending on your latency requirements, you can increase allocated heap space beyond the above recommendations, but be sure to stress test your system.
Moving the Cache Out of the Application HeapUsing dedicated Coherence cache server instances for Partitioned cache storage minimizes the heap size of application JVMs because the data is no longer stored locally. As most Partitioned cache access is remote (with only 1/N of data being held locally), using dedicated cache servers does not generally impose much additional overhead. Near cache technology may still be used, and it generally has a minimal impact on heap size (as it is caching an even smaller subset of the Partitioned cache). Many applications are able to dramatically reduce heap sizes, resulting in better responsiveness.
Local partition storage may be enabled (for cache servers) or disabled (for application server clients) with the tangosol.coherence.distributed.localstorage Java property (for example, -Dtangosol.coherence.distributed.localstorage=false).
JVM Tuning
Performance Tuning 6-13
It may also be disabled by modifying the <local-storage> setting in the tangosol-coherence.xml (or tangosol-coherence-override.xml) file as follows:
Example 6–3 Disabling Partition Storage
<?xml version='1.0'?>
<coherence xmlns:xsi="http://www.w3.org/2001/XMLSchema-instance" xmlns="http://xmlns.oracle.com/coherence/coherence-operational-config" xsi:schemaLocation="http://xmlns.oracle.com/coherence/ coherence-operational-config coherence-operational-config.xsd"> <cluster-config> <services> <!-- id value must match what's in tangosol-coherence.xml for DistributedCache service --> <service id="3"> <init-params> <init-param id="4"> <param-name>local-storage</param-name> <param-value system-property="tangosol.coherence.distributed. localstorage">false</param-value> </init-param> </init-params> </service> </services> </cluster-config></coherence>
At least one storage-enabled JVM must be started before any storage-disabled clients access the cache.
Garbage Collection MonitoringLengthy GC pause times can negatively impact the Coherence cluster and are typically indistinguishable from node termination. A Java application cannot send or receive packets during these pauses. As for receiving the operating system buffered packets, the packets may be discarded and must be retransmitted. For these reasons, it is very important that cluster nodes are sized and tuned to ensure that their GC times remain minimal. As a general rule, a node should spend less than 10% of its time paused in GC, normal GC times should be under 100ms, and maximum GC times should be around 1 second.
For detailed information on GC tuning, refer to the HotSpot garbage collection tuning guide:
http://www.oracle.com/technetwork/java/javase/gc-tuning-6-140523.html
Log messages are generated when one cluster node detects that another cluster node has been unresponsive for a period of time, generally indicating that a target cluster node was in a GC cycle.
Example 6–4 Message Indicating Target Cluster Node is in Garbage Collection Mode
Experienced a 4172 ms communication delay (probable remote GC) with Member(Id=7, Timestamp=2006-10-20 12:15:47.511, Address=192.168.0.10:8089, MachineId=13838); 320 packets rescheduled, PauseRate=0.31, Threshold=512
Coherence Communication Tuning
6-14 Oracle Coherence Administrator's Guide
PauseRate indicates the percentage of time for which the node has been considered unresponsive since the statistics were last reset. Nodes reported as unresponsive for more then a few percent of their lifetime may be worth investigating for GC tuning.
GC activity can be monitored in many ways; some Oracle JVM mechanisms include:
■ -verbose:gc (writes GC log to standard out; use -Xloggc to direct it to some custom location)
■ -XX:+PrintGCDetails, -XX:+PrintGCTimeStamps, -XX:+PrintHeapAtGC, -XX:+PrintTenuringDistribution, -XX:+PrintGCApplicationStoppedTime -XX:+PrintGCApplicationConcurrentTime
■ -Xprof: enables profiling. Profiling activities should be distinguished between testing and production deployments and its effects on resources and performance should always be monitored
■ JConsole, VisualVM (including VisualGC plug-in) and JRockit Misson Control
Coherence Communication TuningCoherence includes the <traffic-jam> and <flow-control> TCMP configuration elements for throttling the amount of traffic it places on the network. These settings are used to control the rate of packet flow within and between cluster nodes. See Oracle Coherence Developer's Guide for detailed information on configuring these settings.
ValidationTo determine how these settings are affecting performance, check if cluster nodes are experiencing packet loss, or packet duplication, or both. This can be obtained by looking at the following JMX statistics on various cluster nodes:
■ ClusterNodeMBean.PublisherSuccessRate—If less then 1.0, packets are being detected as lost and being resent. Rates below 0.98 may warrant investigation and tuning.
■ ClusterNodeMBean.ReceiverSuccessRate—If less then 1.0, the same packet is being received multiple times (duplicates), likely due to the publisher being overly aggressive in declaring packets as lost.
■ ClusterNodeMBean.WeakestChannel—Identifies the remote cluster node which the current node is having most difficulty communicating with.
See Oracle Coherence Management Guide for information on using JMX to monitor Coherence.
Data Access Patterns■ Data Access Distribution (hot spots)
■ Cluster-node Affinity
■ Read/Write Ratio and Data Sizes
■ Interleaving Cache Reads and Writes
Data Access Patterns
Performance Tuning 6-15
Data Access Distribution (hot spots)When caching a large data set, typically a small portion of that data set is responsible for most data accesses. For example, in a 1000 object datasets, 80% of operations may be against a 100 object subset. The remaining 20% of operations may be against the other 900 objects. Obviously the most effective return on investment is gained by caching the 100 most active objects; caching the remaining 900 objects provides 25% more effective caching while requiring a 900% increase in resources.
However, if every object is accessed equally often (for example in sequential scans of the datasets), then caching requires more resources for the same level of effectiveness. In this case, achieving 80% cache effectiveness would require caching 80% of the datasets versus 10%. (Note that sequential scans of partially cached data sets generally defeat MRU, LFU and MRU-LFU eviction policies). In practice, most non-synthetic (benchmark) data access patterns are uneven, and respond well to caching subsets of data.
In cases where a subset of data is active, and a smaller subset is particularly active, Near caching can be very beneficial when used with the "all" invalidation strategy (this is effectively a two-tier extension of the above rules).
Cluster-node AffinityCoherence's Near cache technology transparently takes advantage of cluster-node affinity, especially when used with the "present" invalidation strategy. This topology is particularly useful when used with a sticky load-balancer. Note that the "present" invalidation strategy results in higher overhead (as opposed to "all") when the front portion of the cache is "thrashed" (very short lifespan of cache entries); this is due to the higher overhead of adding/removing key-level event listeners. In general, a cache should be tuned to avoid thrashing and so this is usually not an issue.
Read/Write Ratio and Data SizesGenerally speaking, the following cache topologies are best for the following use cases:
■ Replicated cache—small amounts of read-heavy data (for example, metadata)
■ Partitioned cache—large amounts of read/write data (for example, large data caches)
■ Near cache—similar to Partitioned, but has further benefits from read-heavy tiered access patterns (for example, large data caches with hotspots) and "sticky" data access (for example, sticky HTTP session data). Depending on the synchronization method (expiry, asynchronous, synchronous), the worst case performance may range from similar to a Partitioned cache to considerably worse.
Interleaving Cache Reads and WritesInterleaving refers to the number of cache reads between each cache write. The Partitioned cache is not affected by interleaving (as it is designed for 1:1 interleaving). The Replicated and Near caches by contrast are optimized for read-heavy caching, and prefer a read-heavy interleave (for example, 10 reads between every write). This is because they both locally cache data for subsequent read access. Writes to the cache forces these locally cached items to be refreshed, a comparatively expensive process (relative to the near-zero cost of fetching an object off the local memory heap). Note that with the Near cache technology, worst-case performance is still similar to the Partitioned cache; the loss of performance is relative to best-case scenarios.

Data Access Patterns
6-16 Oracle Coherence Administrator's Guide
Note that interleaving is related to read/write ratios, but only indirectly. For example, a Near cache with a 1:1 read/write ratio may be extremely fast (all writes followed by all reads) or much slower (1:1 interleave, write-read-write-read...).
7
Production Checklist 7-1
7Production Checklist
This chapter provides a checklist of areas that should be planned for and considered when moving from a development or test environment to a production environment. Solutions and best practices are provided an should be implemented as required. Additional recommendation when using Coherence*Extend can be found in Oracle Coherence Client Guide.
The following sections are included in this chapter:
■ Network Recommendations
■ Cache Size Calculation Recommendations
■ Hardware Recommendations
■ Operating System Recommendations
■ JVM Recommendations
■ Security Recommendations
■ Application Instrumentation Recommendations
■ Coherence Modes and Editions
■ Coherence Operational Configuration Recommendations
■ Coherence Cache Configuration Recommendations
■ Large Cluster Configuration Recommendations
■ Death Detection Recommendations
Network Recommendations
Create a Unique ClusterA unique cluster ensures that cluster members do not accidentally join existing clusters that are on the network. To ensure that the clusters are completely isolated, configure a dedicated multicast IP address and port for each cluster and configure a unique cluster name. See Oracle Coherence Developer's Guide for details.
Test in a Clustered EnvironmentAfter the POC or prototype stage is complete, and until load testing begins, it is not out of the ordinary for an application to be developed and tested by engineers in a non-clustered form. Testing primarily in the non-clustered configuration can hide problems with the application architecture and implementation that appear later in staging or even production.
Network Recommendations
7-2 Oracle Coherence Administrator's Guide
Make sure that the application has been tested in a clustered configuration before moving to production. There are several ways for clustered testing to be a natural part of the development process; for example:
■ Developers can test with a locally clustered configuration (at least two instances running on their own computer). This works well with the TTL=0 setting, since clustering on a single computer works with the TTL=0 setting.
■ Unit and regression tests can be introduced that run in a test environment that is clustered. This may help automate certain types of clustered testing that an individual developer would not always remember (or have the time) to do.
Evaluate the Production Network’s SpeedMost production networks are based on 10 Gigabit Ethernet (10GbE), with some still built on Gigabit Ethernet (GbE) and 100Mb Ethernet. For Coherence, GbE and 10GbE are suggested and 10GbE is recommended. Most servers support 10GbE, and switches are economical, highly available, and widely deployed.
It is important to understand the topology of the production network, and what the devices are used to connect all of the servers that run Coherence. For example, if there are ten different switches being used to connect the servers, are they all the same type (make and model) of switch? Are they all the same speed? Do the servers support the network speeds that are available?
In general, all servers should share a reliable, fully switched network. This generally implies sharing a single switch (ideally, two parallel switches and two network cards per server for availability). There are two primary reasons for this. The first is that using multiple switches almost always results in a reduction in effective network capacity. The second is that multi-switch environments are more likely to have network partitioning events where a partial network failure results in two or more disconnected sets of servers. While partitioning events are rare, Coherence cache servers ideally should share a common switch.
To demonstrate the impact of multiple switches on bandwidth, consider several servers plugged into a single switch. As additional servers are added, each server receives dedicated bandwidth from the switch backplane. For example, on a fully switched gigabit backplane, each server receives a gigabit of inbound bandwidth and a gigabit of outbound bandwidth for a total of 2Gbps full duplex bandwidth. Four servers would have an aggregate of 8Gbps bandwidth. Eight servers would have an aggregate of 16Gbps. And so on up to the limit of the switch (in practice, usually in the range of 160-192Gbps for a gigabit switch). However, consider the case of two switches connected by a 4Gbps (8Gbps full duplex) link. In this case, as servers are added to each switch, they have full mesh bandwidth up to a limit of four servers on each switch (that is, all four servers on one switch can communicate at full speed with the four servers on the other switch). However, adding additional servers potentially create a bottleneck on the inter-switch link. For example, if five servers on one switch send data to five servers on the other switch at 1Gbps per server, then the combined 5Gbps is restricted by the 4Gbps link. Note that the actual limit may be much higher depending on the traffic-per-server and also the portion of traffic that must actually move across the link. Also note that other factors such as network protocol overhead and uneven traffic patterns may make the usable limit much lower from an application perspective.
Avoid mixing and matching network speeds: Make sure that all servers connect to the network at the same speed and that all of the switches and routers between those servers run at that same speed or faster.
Cache Size Calculation Recommendations
Production Checklist 7-3
Before deploying an application, run the datagram test utility to test the actual network speed and determine its capability for pushing large amounts of data. See Chapter 4, "Performing a Network Performance Test," for details. Furthermore, the datagram test utility must be run with an increasing ratio of publishers to consumers, since a network that appears fine with a single publisher and a single consumer may completely fall apart as the number of publishers increases, as occurs with the default configuration of Cisco 6500 series switches. See "Deploying to Cisco Switches" on page 2-2 for more information.
Consider the Use of MulticastThe term multicast refers to the ability to send a packet of information from one server and to have that packet delivered in parallel by the network to many servers. Coherence supports both multicast and multicast-free clustering. Oracle suggests the use of multicast when possible because it is an efficient option for many servers to communicate. In addition, use a known dedicated multicast address, if possible, to ensure multicast availability.
However, there are several common reasons why multicast cannot be used:
■ Some organizations disallow the use of multicast.
■ Multicast cannot operate over certain types of network equipment; for example, many WAN routers disallow or do not support multicast traffic.
■ Multicast is occasionally unavailable for technical reasons; for example, some switches do not support multicast traffic.
First, determine if the desired deployment configuration is to use multicast.
Before deploying an application that uses multicast, you must run the Multicast Test to verify that multicast is working and to determine the correct (the minimum) TTL value for the production environment. See Chapter 5, "Performing a Multicast Connectivity Test" for more information.
Applications that cannot use multicast for deployment must use the WKA configuration. See Oracle Coherence Developer's Guide for details.
Configure Network DevicesIf either the datagram test and multicast test have failed or returned poor results, there may be configuration problems with the network devices in use. Even if the tests passed without incident and the results were perfect, it is still possible that there are lurking issues with the configuration of the network devices.
Review the suggestions in "Network Tuning" on page 6-6.
Plan for Sustained Network OutagesThe Coherence cluster protocol can of detect and handle a wide variety of connectivity failures. The clustered services are able to identify the connectivity issue, and force the offending cluster node to leave and re-join the cluster. In this way the cluster ensures a consistent shared state among its members.
See "Death Detection Recommendations" on page 7-14 for more details. See also "Deploying to Cisco Switches" on page 2-2
Cache Size Calculation RecommendationsThe recommendations in this sections are used to calculate the approximate size of a cache. Understanding what size cache is required can help determine how many
Cache Size Calculation Recommendations
7-4 Oracle Coherence Administrator's Guide
JVMs, how much physical memory, and how many CPUs and servers are required. Hardware and JVM recommendations are provided later in this chapter. The recommendations are only guidelines: an accurate view of size can only be validated through specific tests that take into account an application’s load and use cases that simulate expected users volumes, transactions profiles, processing operations, and so on.
As a general rule, allocate at least 3x the physical heap size as the data set size, assuming that you are going to keep 1 backup copy of primary data. To make a more accurate calculation, the size of a cache can be calculated as follows and also assumes 1 backup copy of primary data:
Cache Capacity = Number of entries * 2 * Entry Size
Where:
Entry Size = Serialized form of the key + Serialized form of the Value + 150 bytes
For example, consider a cache that contains 5 million objects, where the value and key serialized are 100 bytes and 2kb, respectively.
Calculate the entry size:
100 bytes + 2048 bytes + 150 bytes = 2298 bytes
Then, calculate the cache capacity:
5000000 * 2 * 2298 bytes = 21,915 MB
If indexing is used, the index size must also be taken into account. Un-ordered cache indexes consist of the serialized attribute value and the key. Ordered indexes include additional forward and backward navigation information.
Indexes are stored in memory. Each node will require 2 additional maps (instances of java.util.HashMap) for an index: one for a reverse index and one for a forward index. The reverse index size is a cardinal number for the value (size of the value domain, that is, the number of distinct values). The forward index size is of the key set size. The extra memory cost for the HashMap is about 30 bytes. Extra cost for each extracted indexed value is 12 bytes (the object reference size) plus the size for the value itself.
For example, the extra size for a Long value is 20 bytes (12 bytes + 8 bytes) and for a String is 12 bytes + the string length. There is also an additional reference (12 bytes) cost for indexes with a large cardinal number and a small additional cost (about 4 bytes) for sorted indexes. Therefore, calculate an approximate index cost as:
Index size = forward index map + backward index map + reference + value size
For an indexed Long value of large cardinal, it's going to be approximately:
30 bytes + 30 bytes + 12 bytes + 8 bytes = 80 bytes
For an indexed String of an average length of 20 chars it's going to be approximately:
30 bytes + 30 bytes + 12 bytes + (20 bytes * 2) = 112 bytes
The index cost is relatively high for small objects, but it's constant and becomes less and less expensive for larger objects.
Sizing a cache is not an exact science. Assumptions on the size and maximum number of objects have to be made. A complete example follows:
■ Estimated average entry size = 1k
■ Estimated maximum number of cache objects = 100k
Hardware Recommendations
Production Checklist 7-5
■ String indexes of 20 chars = 5
Calculate the index size:
5 * 112 bytes * 100k = 56MB
Then, calculate the cache capacity:
100k * 2 * 1k + 56MB = ~312MB
Each JVM stores on-heap data itself and require some free space to process data. With a 1GB heap this will be approximately 300MB or more. The JVM process address space for the JVM – outside of the heap is also approximately 200MB. Therefore, to store 312MB of data requires the following memory for each node in a 2 node JVM cluster:
312MB (for data) + 300MB (working JVM heap) + 200MB (JVM executable) = 812MB (of physical memory)
Note that this is the minimum heap space that is required. It is prudent to add additional space, to take account of any inaccuracies in your estimates, about 10%, and for growth (if this is anticipated).
With the addition of JVM memory requirements, the complete formula for calculating memory requirements for a cache can be written as follows:
Cache Memory Requirement = ((Size of cache entries + Size of indexes) * 2 (for primary and backup)) + JVM working memory (~30% of 1GB JVM)
Hardware Recommendations
Plan Realistic Load TestsDevelopment typically occurs on relatively fast workstations. Moreover, test cases are usually non-clustered and tend to represent single-user access (that is, only the developer). In such environments the application may seem extraordinarily responsive.
Before moving to production, ensure that realistic load tests have been routinely run in a cluster configuration with simulated concurrent user load.
Develop on Adequate Hardware Before ProductionCoherence is compatible with all common workstation hardware. Most developers use PC or Apple hardware, including notebooks, desktops and workstations.
Developer systems should have a significant amount of RAM to run a modern IDE, debugger, application server, database and at least two cluster instances. Memory utilization varies widely, but to ensure productivity, the suggested minimum memory configuration for developer systems is 2GB. Desktop systems and workstations can often be configured with 4GB.
Developer systems should have two or more CPU cores to increase the quality of code related to multi-threading. Many bugs related to concurrent execution of multiple threads only appear on multi-CPU systems (systems that contain multiple processor sockets or CPU cores).
Select a Server Hardware PlatformOracle works to support the hardware that the customer has standardized on or otherwise selected for production deployment.
Hardware Recommendations
7-6 Oracle Coherence Administrator's Guide
■ Oracle has customers running on virtually all major server hardware platforms. The majority of customers use "commodity x86" servers, with a significant number deploying Sun Sparc (including Niagra) and IBM Power servers.
■ Oracle continually tests Coherence on "commodity x86" servers, both Intel and AMD.
■ Intel, Apple and IBM provide hardware, tuning assistance and testing support to Oracle.
■ Oracle conducts internal Coherence certification on all IBM server platforms.
■ Oracle and Azul test Coherence regularly on Azul appliances, including the 48-core "Vega 2" chip.
If the server hardware purchase is still in the future, the following are suggested for Coherence:
The most cost-effective server hardware platform is "commodity x86", either Intel or AMD, with one to two processor sockets and two to four CPU cores per processor socket. If selecting an AMD Opteron system, it is strongly recommended that it be a two processor socket system, since memory capacity is usually halved in a single socket system. Intel "Woodcrest" and "Clovertown" Xeons are strongly recommended over the previous Intel Xeon CPUs due to significantly improved 64-bit support, much lower power consumption, much lower heat emission and far better performance. These new Xeons are currently the fastest commodity x86 CPUs, and can support a large memory capacity per server regardless of the processor socket count by using fully buffered memory called "FB-DIMMs".
It is strongly recommended that servers be configured with a minimum of 4GB of RAM. For applications that plan to store massive amounts of data in memory (tens or hundreds of gigabytes, or more), evaluate the cost-effectiveness of 16GB or even 32GB of RAM per server. Commodity x86 server RAM is readily available in a density of 2GB per DIMM, with higher densities available from only a few vendors and carrying a large price premium; so, a server with 8 memory slots only supports 16GB in a cost-effective manner. Also, note that a server with a very large amount of RAM likely must run more Coherence nodes (JVMs) per server to use that much memory, so having a larger number of CPU cores helps. Applications that are data-heavy require a higher ratio of RAM to CPU, while applications that are processing-heavy require a lower ratio. For example, it may be sufficient to have two dual-core Xeon CPUs in a 32GB server running 15 Coherence Cache Server nodes performing mostly identity-based operations (cache accesses and updates), but if an application makes frequent use of Coherence features such as indexing, parallel queries, entry processors and parallel aggregation, then it is more effective to have two quad-core Xeon CPUs in a 16GB server - a 4:1 increase in the CPU:RAM ratio.
A minimum of 1000Mbps for networking (for example, Gigabit Ethernet or better) is strongly recommended. NICs should be on a high bandwidth bus such as PCI-X or PCIe, and not on standard PCI. In the case of PCI-X having the NIC on an isolated or otherwise lightly loaded 133MHz bus may significantly improve performance. See also "Bus Considerations" on page 6-7.
Plan the Number of ServersCoherence is primarily a scale-out technology. The natural mode of operation is to span many servers (for example, 2-socket or 4-socket commodity servers). However, Coherence can also effectively scale-up on a small number of large servers by using multiple JVMs per server. Failover and failback are more efficient the more servers that are present in the cluster and the impact of a server failure is lessened. A cluster must contain a minimum of four physical servers to avoid the possibility of data loss
Operating System Recommendations
Production Checklist 7-7
during a failure. In most WAN configurations, each data center has independent clusters (usually interconnected by Extend-TCP). This increases the total number of discrete servers (four servers per data center, multiplied by the number of data centers).
Coherence is often deployed on smaller clusters (one, two or three physical servers) but this practice has increased risk if a server failure occurs under heavy load. As discussed in "Evaluate the Production Network’s Speed" on page 7-2, Coherence clusters are ideally confined to a single switch (for example, fewer than 96 physical servers). In some use cases, applications that are compute-bound or memory-bound applications (as opposed to network-bound) may run acceptably on larger clusters.
Also, given the choice between a few large JVMs and a lot of small JVMs, the latter may be the better option. There are several production environments of Coherence that span hundreds of JVMs. Some care is required to properly prepare for clusters of this size, but smaller clusters of dozens of JVMs are readily achieved. Please note that disabling UDP multicast (by using WKA) or running on slower networks (for example, 100Mbps Ethernet) reduces network efficiency and make scaling more difficult.
Decide How Many Servers are Required Based on JVMs UsedThe following rules should be followed in determining how many servers are required for reliable high availability configuration and how to configure the number of storage-enabled JVMs.
1. There must be more than two servers. A grid with only two servers stops being machine-safe as soon as several JVMs on one server are different than the number of JVMs on the other server; so, even when starting with two servers with equal number of JVMs, losing one JVM forces the grid out of machine-safe state. Four or more servers present the most stable topology, but deploying on just three servers would work if the other rules are adhered to.
2. For a server that has the largest number of JVMs in the cluster, that number of JVMs must not exceed the total number of JVMs on all the other servers in the cluster.
3. A server with the smallest number of JVMs should run at least half the number of JVMs as a server with the largest number of JVMs; this rule is particularly important for smaller clusters.
4. The margin of safety improves as the number of JVMs tends toward equality on all computers in the cluster; this is more of a general practice than the preceding rules.
Operating System Recommendations
Selecting an Operating SystemThe top three operating systems for application development using Coherence are, in this order: Windows 2000/XP (~85%), Mac OS X (~10%) and Linux (~5%). The top four operating systems for production deployment are, in this order: Linux, Solaris, AIX and Windows. Thus, it is relatively unlikely that the development and deployment operating systems are the same. Make sure that regular testing is occurring on the target operating system.
Oracle tests on and supports various Linux distributions (including customers that have custom Linux builds), Sun Solaris, IBM AIX, Windows Vista/2003/2000/XP,

JVM Recommendations
7-8 Oracle Coherence Administrator's Guide
Apple Mac OS X, OS/400 and z/OS. Additionally, Oracle supports customers running HP-UX and various BSD UNIX distributions.
If the server operating system decision is still in the future, the following are suggested for Coherence:
For commodity x86 servers, Linux distributions based on the Linux 2.6 kernel are recommended. While it is expected that most 2.6-based Linux distributions provide a good environment for running Coherence, the following are recommended by Oracle: Oracle Unbreakable Linux supported Linux including Oracle Linux and Red Hat Enterprise Linux (version 4 or later) and Suse Linux Enterprise (version 10 or later). Oracle also routinely tests using distributions such as RedHat Fedora Core 5 and even Knoppix Live CD.
Review and follow the instructions in Chapter 2, "Platform-Specific Deployment Considerations" for the operating system on which Coherence is deployed.
Avoid using virtual memory (paging to disk).In a Coherence-based application, primary data management responsibilities (for example, Dedicated Cache Servers) are hosted by Java-based processes. Modern Java distributions do not work well with virtual memory. In particular, garbage collection (GC) operations may slow down by several orders of magnitude if memory is paged to disk. With modern commodity hardware and a modern JVM, a Java process with a reasonable heap size (512MB-2GB) typically performs a full garbage collection in a few seconds if all of the process memory is in RAM. However, this may grow to many minutes if the JVM is partially resident on disk. During garbage collection, the node appears unresponsive for an extended period and the choice for the rest of the cluster is to either wait for the node (blocking a portion of application activity for a corresponding amount of time) or to consider the unresponsive node as failed and perform failover processing. Neither of these outcomes are a good option, and it is important to avoid excessive pauses due to garbage collection. JVMs should be configured with a set heap size to ensure that the heap does not deplete the available RAM memory. Also, periodic processes (such as daily backup programs) should be monitored to ensure that memory usage spikes do not cause Coherence JVMs to be paged to disk.
See also: "Swapping" on page 6-4.
JVM RecommendationsDuring development, developers typically use the latest Oracle JVM or a direct derivative such as the Mac OS X JVM.
The main issues related to using a different JVM in production are:
■ Command line differences, which may expose problems in shell scripts and batch files;
■ Logging and monitoring differences, which may mean that tools used to analyze logs and monitor live JVMs during development testing may not be available in production;
■ Significant differences in optimal GC configuration and approaches to GC tuning;
■ Differing behaviors in thread scheduling, garbage collection behavior and performance, and the performance of running code.
Make sure that regular testing has occurred on the JVM that is used in production.
JVM Recommendations
Production Checklist 7-9
Select a JVMIn terms of Oracle Coherence versions:
■ Coherence is supported on Oracle JVM 1.6 update 23.
Often the choice of JVM is dictated by other software. For example:
■ IBM only supports IBM WebSphere running on IBM JVMs. Most of the time, this is the IBM "Sovereign" or "J9" JVM, but when WebSphere runs on Sun Solaris/Sparc, IBM builds a JVM using the Sun JVM source code instead of its own.
■ Oracle WebLogic typically includes a JVM which is intended to be used with it. On some platforms, this is the Oracle WebLogic JRockit JVM.
■ Apple Mac OS X, HP-UX, IBM AIX and other operating systems only have one JVM vendor (Apple, HP and IBM respectively).
■ Certain software libraries and frameworks have minimum Java version requirements because they take advantage of relatively new Java features.
On commodity x86 servers running Linux or Windows, the Oracle JVM is recommended. Generally speaking, the recent update versions are recommended.
Basically, at some point before going to production, a JVM vendor and version should be selected and well tested, and absent any flaws appearing during testing and staging with that JVM, that should be the JVM that is used when going to production. For applications requiring continuous availability, a long-duration application load test (for example, at least two weeks) should be run with that JVM before signing off on it.
Review and follow the instructions in Chapter 2, "Platform-Specific Deployment Considerations" for the JVM on which Coherence is deployed.
Set JVM OptionsJVM configuration options vary over versions and between vendors, but the following are generally suggested. See Chapter 2, "Platform-Specific Deployment Considerations," for specific JVM considerations.
■ Using the -server option results in substantially better performance.
■ Using identical heap size values for both -Xms and -Xmx yields substantially better performance on Oracle and JRockit JVMs and "fail fast" memory allocation.
■ Monitor garbage collection– especially when using large heaps: -verbose:gc, -XX:+UseConcMarkSweepGC, -XX:+PrintGCDetails, -XX:+PrintGCTimeStamps, -XX:+PrintHeapAtGC, -XX:+PrintTenuringDistribution, -XX:+PrintGCApplicationStoppedTime -XX:+PrintGCApplicationConcurrentTime
■ JVMs that experience an OutOfMemoryError can be left in an indeterministic state which can have adverse effects on a cluster. We recommend configuring JVMs to exit upon encountering an OutOfMemoryError instead of allowing the JVM to attempt recovery: On Linux, -XX:OnOutOfMemoryError="kill -9 %p"; on Windows, -XX:OnOutOfMemoryError="taskkill /F /PID %p".
Note: Oracle recommends testing and deploying using the latest supported Oracle JVM based on your platform and Coherence version.
Security Recommendations
7-10 Oracle Coherence Administrator's Guide
■ Capture a heap dump if the JVM experiences an out of memory error: -XX:+HeapDumpOnOutOfMemoryError.
Plan to Test Mixed JVM EnvironmentsCoherence is pure Java software and can run in clusters composed of any combination of JVM vendors and versions and Oracle tests such configurations.
Note that it is possible for different JVMs to have slightly different serialization formats for Java objects, meaning that it is possible for an incompatibility to exist when objects are serialized by one JVM, passed over the wire, and a different JVM (vendor, version, or both) attempts to deserialize it. Fortunately, the Java serialization format has been very stable for several years, so this type of issue is extremely unlikely. However, it is highly recommended to test mixed configurations for consistent serialization before deploying in a production environment.
See also:
■ "Deploying to Oracle JRockit JVMs" on page 2-7
■ "Deploying to IBM JVMs" on page 2-5
■ "Deploying to Oracle JVMs" on page 2-7
Security Recommendations
Ensure Security Privileges The minimum set of privileges required for Coherence to function are specified in the security.policy file which is included as part of the Coherence installation. This file can be found in coherence/lib/security/security.policy. If using the Java Security Manager, these privileges must be granted in order for Coherence to function properly.
Plan for SSL RequirementsCoherence-based applications may chose to implement varying levels of security as required, including SSL-based security between cluster members and between Coherence*Extend clients and the cluster. If SSL is a requirement, ensure that all servers have a digital certificate that has been verified and signed by a trusted certificate authority and that the digital certificate is imported into the servers’ key store and trust store as required. Coherence*Extend clients must include a trust key store that contains the certificate authority’s digital certificate that was used to sign the proxy’s digital certificate. See Oracle Coherence Security Guide for detailed instructions on setting up SSL.
Application Instrumentation RecommendationsSome Java-based management and monitoring solutions use instrumentation (for example, bytecode-manipulation and ClassLoader substitution). Oracle has observed issues with such solutions in the past. Use these solutions cautiously even though there are no current issues reported with the major vendors.
Coherence Modes and Editions
Production Checklist 7-11
Coherence Modes and Editions
Select the Production ModeCoherence may be configured to operate in either evaluation, development, or production mode. These modes do not limit access to features, but instead alter some default configuration settings. For instance, development mode allows for faster cluster startup to ease the development process.
The development mode is used for all pre-production activities, such as development and testing. This is an important safety feature because development nodes are restricted from joining with production nodes. Development mode is the default mode. Production mode must be explicitly specified when using Coherence in a production environment. To change the mode to production mode, edit the tangosol-coherence.xml (located in coherence.jar) and enter prod as the value for the <license-mode> element. For example:
...<license-config> ... <license-mode system-property="tangosol.coherence.mode">prod</license-mode></license-config>...
The tangosol.coherence.mode system property is used to specify the license mode instead of using the operational deployment descriptor. For example:
-Dtangosol.coherence.mode=prod
In addition to preventing mixed mode clustering, the license-mode also dictates the operational override file to use. When in eval mode the tangosol-coherence-override-eval.xml file is used; when in dev mode the tangosol-coherence-override-dev.xml file is used; whereas, the tangosol-coherence-override-prod.xml file is used when the prod mode is specified. A tangosol-coherence-override.xml file (if it is included in the classpath before the coherence.jar file) is used no matter which mode is selected and overrides any mode-specific override files.
Select the Edition
All nodes within a cluster must use the same license edition and mode. Be sure to obtain enough licenses for the all the cluster members in the production environment. The servers hardware configuration (number or type of processor sockets, processor packages or CPU cores) may be verified using ProcessorInfo utility included with Coherence. For example:
java -cp coherence.jar com.tangosol.license.ProcessorInfo
If the result of the ProcessorInfo program differs from the licensed configuration, send the program's output and the actual configuration as a support issue.
The default edition is grid edition. To change the edition, edit the operational override file and add an <edition-name> element, within the <license-config> element, that includes an edition name as defined in Table 7–1. For example:
Note: The current recommendation is not to use the edition switch. The switches are no longer used to enforce license restrictions.
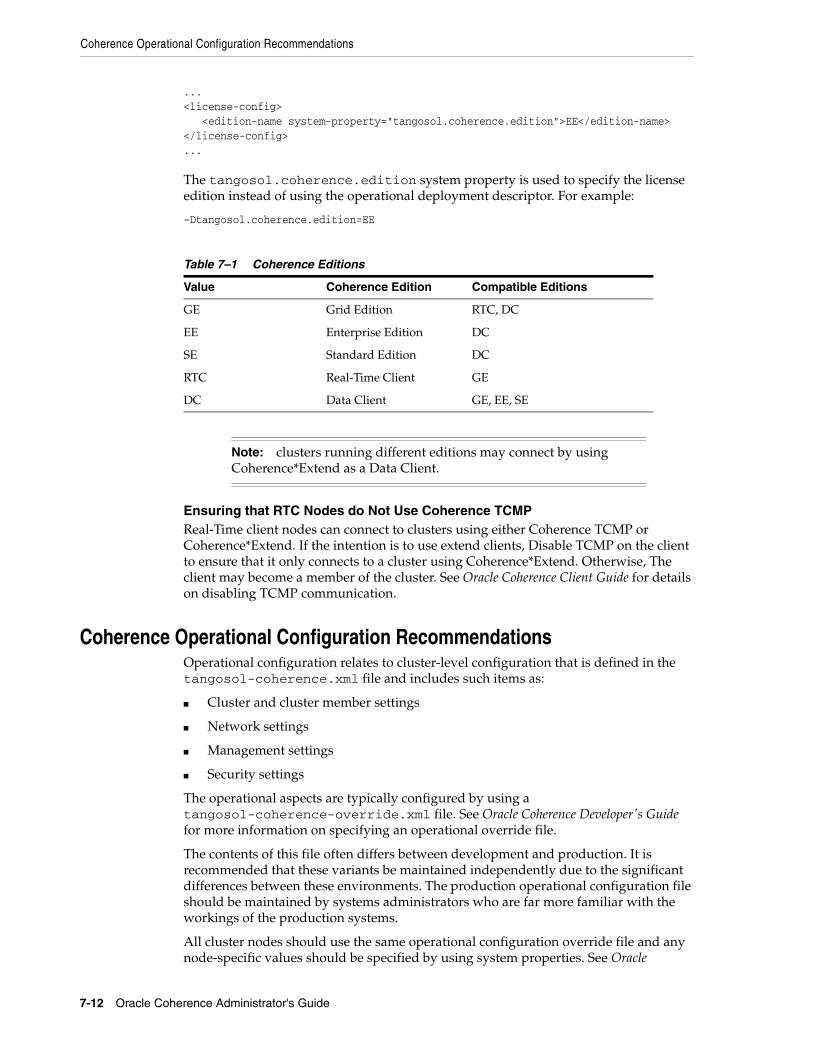
Coherence Operational Configuration Recommendations
7-12 Oracle Coherence Administrator's Guide
...<license-config> <edition-name system-property="tangosol.coherence.edition">EE</edition-name></license-config>...
The tangosol.coherence.edition system property is used to specify the license edition instead of using the operational deployment descriptor. For example:
-Dtangosol.coherence.edition=EE
Ensuring that RTC Nodes do Not Use Coherence TCMPReal-Time client nodes can connect to clusters using either Coherence TCMP or Coherence*Extend. If the intention is to use extend clients, Disable TCMP on the client to ensure that it only connects to a cluster using Coherence*Extend. Otherwise, The client may become a member of the cluster. See Oracle Coherence Client Guide for details on disabling TCMP communication.
Coherence Operational Configuration RecommendationsOperational configuration relates to cluster-level configuration that is defined in the tangosol-coherence.xml file and includes such items as:
■ Cluster and cluster member settings
■ Network settings
■ Management settings
■ Security settings
The operational aspects are typically configured by using a tangosol-coherence-override.xml file. See Oracle Coherence Developer's Guide for more information on specifying an operational override file.
The contents of this file often differs between development and production. It is recommended that these variants be maintained independently due to the significant differences between these environments. The production operational configuration file should be maintained by systems administrators who are far more familiar with the workings of the production systems.
All cluster nodes should use the same operational configuration override file and any node-specific values should be specified by using system properties. See Oracle
Table 7–1 Coherence Editions
Value Coherence Edition Compatible Editions
GE Grid Edition RTC, DC
EE Enterprise Edition DC
SE Standard Edition DC
RTC Real-Time Client GE
DC Data Client GE, EE, SE
Note: clusters running different editions may connect by using Coherence*Extend as a Data Client.
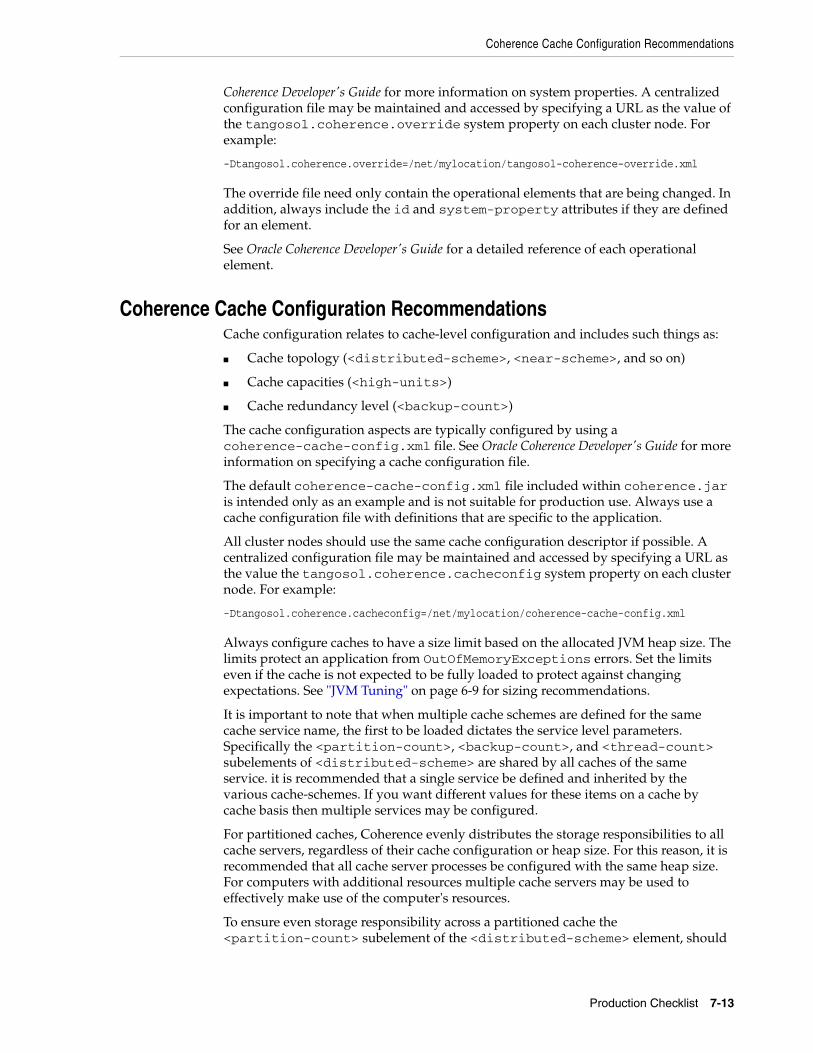
Coherence Cache Configuration Recommendations
Production Checklist 7-13
Coherence Developer's Guide for more information on system properties. A centralized configuration file may be maintained and accessed by specifying a URL as the value of the tangosol.coherence.override system property on each cluster node. For example:
-Dtangosol.coherence.override=/net/mylocation/tangosol-coherence-override.xml
The override file need only contain the operational elements that are being changed. In addition, always include the id and system-property attributes if they are defined for an element.
See Oracle Coherence Developer's Guide for a detailed reference of each operational element.
Coherence Cache Configuration RecommendationsCache configuration relates to cache-level configuration and includes such things as:
■ Cache topology (<distributed-scheme>, <near-scheme>, and so on)
■ Cache capacities (<high-units>)
■ Cache redundancy level (<backup-count>)
The cache configuration aspects are typically configured by using a coherence-cache-config.xml file. See Oracle Coherence Developer's Guide for more information on specifying a cache configuration file.
The default coherence-cache-config.xml file included within coherence.jar is intended only as an example and is not suitable for production use. Always use a cache configuration file with definitions that are specific to the application.
All cluster nodes should use the same cache configuration descriptor if possible. A centralized configuration file may be maintained and accessed by specifying a URL as the value the tangosol.coherence.cacheconfig system property on each cluster node. For example:
-Dtangosol.coherence.cacheconfig=/net/mylocation/coherence-cache-config.xml
Always configure caches to have a size limit based on the allocated JVM heap size. The limits protect an application from OutOfMemoryExceptions errors. Set the limits even if the cache is not expected to be fully loaded to protect against changing expectations. See "JVM Tuning" on page 6-9 for sizing recommendations.
It is important to note that when multiple cache schemes are defined for the same cache service name, the first to be loaded dictates the service level parameters. Specifically the <partition-count>, <backup-count>, and <thread-count> subelements of <distributed-scheme> are shared by all caches of the same service. it is recommended that a single service be defined and inherited by the various cache-schemes. If you want different values for these items on a cache by cache basis then multiple services may be configured.
For partitioned caches, Coherence evenly distributes the storage responsibilities to all cache servers, regardless of their cache configuration or heap size. For this reason, it is recommended that all cache server processes be configured with the same heap size. For computers with additional resources multiple cache servers may be used to effectively make use of the computer's resources.
To ensure even storage responsibility across a partitioned cache the <partition-count> subelement of the <distributed-scheme> element, should
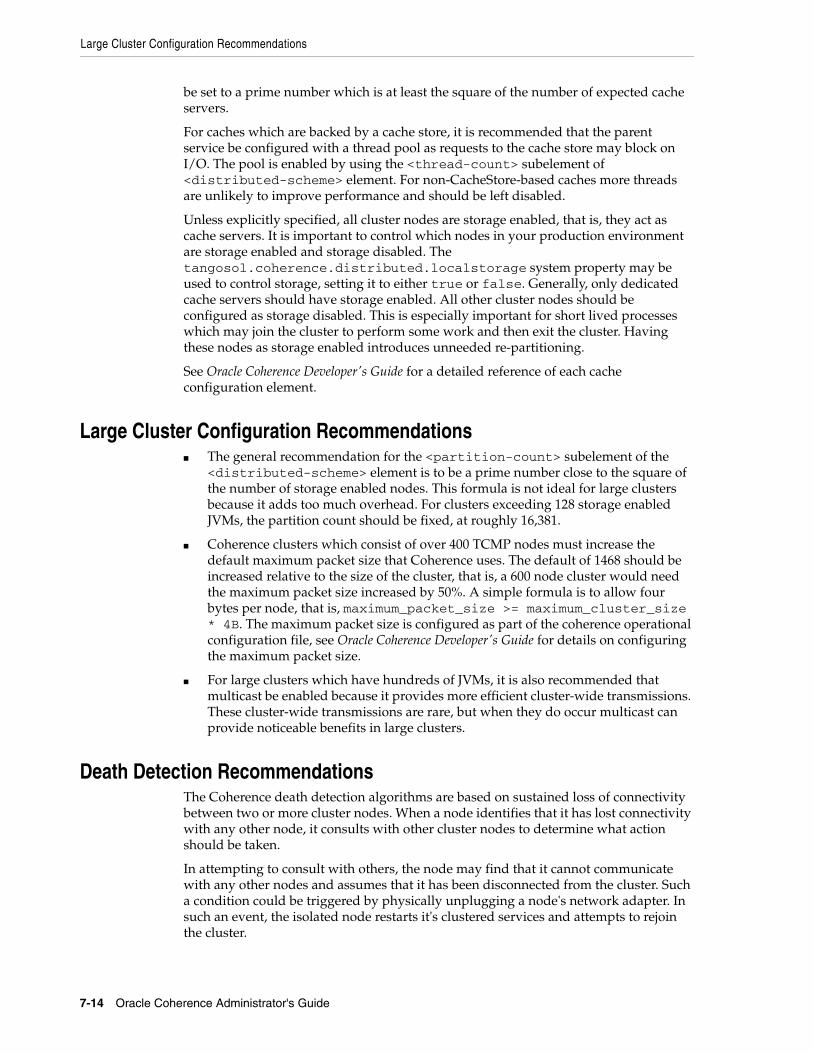
Large Cluster Configuration Recommendations
7-14 Oracle Coherence Administrator's Guide
be set to a prime number which is at least the square of the number of expected cache servers.
For caches which are backed by a cache store, it is recommended that the parent service be configured with a thread pool as requests to the cache store may block on I/O. The pool is enabled by using the <thread-count> subelement of <distributed-scheme> element. For non-CacheStore-based caches more threads are unlikely to improve performance and should be left disabled.
Unless explicitly specified, all cluster nodes are storage enabled, that is, they act as cache servers. It is important to control which nodes in your production environment are storage enabled and storage disabled. The tangosol.coherence.distributed.localstorage system property may be used to control storage, setting it to either true or false. Generally, only dedicated cache servers should have storage enabled. All other cluster nodes should be configured as storage disabled. This is especially important for short lived processes which may join the cluster to perform some work and then exit the cluster. Having these nodes as storage enabled introduces unneeded re-partitioning.
See Oracle Coherence Developer's Guide for a detailed reference of each cache configuration element.
Large Cluster Configuration Recommendations■ The general recommendation for the <partition-count> subelement of the
<distributed-scheme> element is to be a prime number close to the square of the number of storage enabled nodes. This formula is not ideal for large clusters because it adds too much overhead. For clusters exceeding 128 storage enabled JVMs, the partition count should be fixed, at roughly 16,381.
■ Coherence clusters which consist of over 400 TCMP nodes must increase the default maximum packet size that Coherence uses. The default of 1468 should be increased relative to the size of the cluster, that is, a 600 node cluster would need the maximum packet size increased by 50%. A simple formula is to allow four bytes per node, that is, maximum_packet_size >= maximum_cluster_size * 4B. The maximum packet size is configured as part of the coherence operational configuration file, see Oracle Coherence Developer's Guide for details on configuring the maximum packet size.
■ For large clusters which have hundreds of JVMs, it is also recommended that multicast be enabled because it provides more efficient cluster-wide transmissions. These cluster-wide transmissions are rare, but when they do occur multicast can provide noticeable benefits in large clusters.
Death Detection RecommendationsThe Coherence death detection algorithms are based on sustained loss of connectivity between two or more cluster nodes. When a node identifies that it has lost connectivity with any other node, it consults with other cluster nodes to determine what action should be taken.
In attempting to consult with others, the node may find that it cannot communicate with any other nodes and assumes that it has been disconnected from the cluster. Such a condition could be triggered by physically unplugging a node's network adapter. In such an event, the isolated node restarts it's clustered services and attempts to rejoin the cluster.

Death Detection Recommendations
Production Checklist 7-15
If connectivity with other cluster nodes remains unavailable, the node may (depending on well known address configuration) form a new isolated cluster, or continue searching for the larger cluster. In either case, the previously isolated cluster nodes rejoins the running cluster when connectivity is restored. As part of rejoining the cluster, the nodes former cluster state is discarded, including any cache data it may have held, as the remainder of the cluster has taken on ownership of that data (restoring from backups).
It is obviously not possible for a node to identify the state of other nodes without connectivity. To a single node, local network adapter failure and network wide switch failure looks identical and are handled in the same way, as described above. The important difference is that for a switch failure all nodes are attempting to re-join the cluster, which is the equivalent of a full cluster restart, and all prior state and data is dropped.
Dropping all data is not desirable and, to avoid this as part of a sustained switch failure, you must take additional precautions. Options include:
■ Increase detection intervals: The cluster relies on a deterministic process-level death detection using the TcpRing component and hardware death detection using the IpMonitor component. Process-level detection is performed within milliseconds and network or machine failures are detected within 15 seconds by default. Increasing these value allows the cluster to wait longer for connectivity to return. Death detection is enabled by default and is configured within the <tcp-ring-listener> element. See Oracle Coherence Developer's Guide for details on configuring death detection.
■ Persist data to external storage: By using a Read Write Backing Map, the cluster persists data to external storage, and can retrieve it after a cluster restart. So long as write-behind is disabled (the <write-delay> subelement of <read-write-backing-map-scheme>) no data would be lost if a switch fails. The downside here is that synchronously writing through to external storage increases the latency of cache update operations, and the external storage may become a bottleneck.
■ Decide on a cluster quorum: The cluster quorum policy mandates the minimum number of cluster members that must remain in the cluster when the cluster service is terminating suspect members. During intermittent network outages, a high number of cluster members may be removed from the cluster. Using a cluster quorum, a certain number of members are maintained during the outage and are available when the network recovers. See Oracle Coherence Developer's Guide for details on configuring cluster quorum.
■ Add network level fault tolerance: Adding a redundant layer to the cluster's network infrastructure allows for individual pieces of networking equipment to fail without disrupting connectivity. This is commonly achieved by using at least two network adapters per computer, and having each adapter connected to a separate switch. This is not a feature of Coherence but rather of the underlying operating system or network driver. The only change to Coherence is that it
Note: To ensure that Windows does not disable a network adapter when it is disconnected, add the following Windows registry DWORD, setting it to 1:HKEY_LOCAL_MACHINE\SYSTEM\CurrentControlSet\Services\Tcpip\Parameters\DisableDHCPMediaSense. This setting also affects static IPs despite the name.

Death Detection Recommendations
7-16 Oracle Coherence Administrator's Guide
should be configured to bind to the virtual rather then physical network adapter. This form of network redundancy goes by different names depending on the operating system, see Linux bonding, Solaris trunking and Windows teaming for further details.
A
Log Message Glossary A-1
ALog Message Glossary
The following sections are included in this appendix:
■ TCMP Log Messages
■ Configuration Log Messages
■ Partitioned Cache Service Log Messages
TCMP Log MessagesThe following are TCMP-related log messages:
Experienced a %n1 ms communication delay (probable remote GC) with Member %s%n1 - the latency in milliseconds of the communication delay; %s - the full Member infor-mation. Severity: 2-Warning or 5-Debug Level 5 or 6-Debug Level 6 depending on the length of the delay.Cause: This node detected a delay in receiving acknowledgment packets from the specified node, and has determined that is it likely due to a remote GC (rather than a local GC). This message indicates that the overdue acknowledgment has been received from the specified node, and that it has likely emerged from its GC.
Action: Prolonged and frequent garbage collection can adversely affect cluster performance and availability. If these warnings are seen frequently, review your JVM heap and GC configuration and tuning. See Chapter 6, "Performance Tuning," for more details.
Failed to satisfy the variance: allowed=%n1 actual=%n2%n1 - the maximum allowed latency in milliseconds; %n2 - the actual latency in millisec-onds. Severity: 3-Informational or 5-Debug Level 5 depending on the message frequency.Cause: One of the first steps in the Coherence cluster discovery protocol is the calculation of the clock difference between the new and the senior nodes. This step assumes a relatively small latency for peer-to-peer round trip UDP communications between the nodes. By default, the configured maximum allowed latency (the value of the <maximum-time-variance> configuration element) is 16 milliseconds. See the <incoming-message-handler> element in the Oracle Coherence Developer's Guide. Failure to satisfy that latency causes this message to be logged and increases the latency threshold, which is reflected in a follow up message.
Action: If the latency consistently stays very high (over 100 milliseconds), consult your network administrator and see Chapter 4, "Performing a Network Performance Test."
TCMP Log Messages
A-2 Oracle Coherence Administrator's Guide
Created a new cluster "%s1" with Member(%s2)%s1 - the cluster name; %s2 - the full Member information. Severity: 3-Informational.Cause: This Coherence node attempted to join an existing cluster in the configured amount of time (specified by the <join-timeout-milliseconds> element, see the <multicast-listener> element), but did not receive any responses from any other node. As a result, it created a new cluster with the specified name (either configured by the <cluster-name> element, see <member-identity> element, or calculated based on the multicast listener address and port, or the <well-known-addresses> list). The Member information includes the node id, creation timestamp, unicast address and port, location, process id, role, and so on.
Action: None, if this node is expected to be the first node in the cluster. Otherwise, the operational configuration has to be reviewed to determine the reason that this node does not join the existing cluster.
This Member(%s1) joined cluster "%s2" with senior Member(%s3)%s1 - the full Member information for this node; %s2 - the cluster name; %s3 - the full Member information for the cluster senior node. Severity: 3-Informational.Cause: This Coherence node has joined an existing cluster.
Action: None, if this node is expected to join an existing cluster. Otherwise, identify the running cluster and consider corrective actions.
Member(%s) joined Cluster with senior member %n%s - the full Member information for a new node that joined the cluster this node belongs to; %n - the node id of the cluster senior node. Severity: 5-Debug Level 5.Cause: A new node has joined an existing Coherence cluster.
Action: None.
Member(%s) left Cluster with senior member %n%s - the full Member information for a node that left the cluster; %n - the node id of the cluster senior node. Severity: 5-Debug Level 5.Cause: A node has left the cluster. This departure could be caused by the programmatic shutdown, process termination (normal or abnormal), or any other communication failure (for example, a network disconnect or a very long GC pause). This message reports the node's departure.
Action: None, if the node departure was intentional. Otherwise, the departed node logs should be analyzed.
MemberLeft notification for Member %n received from Member(%s)%n - the node id of the departed node; %s - the full Member information for a node that left the cluster. Severity: 5-Debug Level 5.Cause: When a Coherence node terminates, this departure is detected by nodes earlier than others. Most commonly, a node connected through the TCP ring connection ("TCP ring buddy") would be the first to detect it. This message provides the information about the node that detected the departure first.
Action: None, if the node departure was intentional. Otherwise, the logs for both the departed and the detecting nodes should be analyzed.
Service %s joined the cluster with senior service member %n%s - the service name; %n - the senior service member id. Severity: 5-Debug Level 5.Cause: When a clustered service starts on a given node, Coherence initiates a handshake protocol between all cluster nodes running the specified service. This
TCMP Log Messages
Log Message Glossary A-3
message serves as an indication that this protocol has been initiated. If the senior node is not currently known, it is shown as "n/a".
Action: None.
This node appears to have partially lost the connectivity: it receives responses from MemberSet(%s1) which communicate with Member(%s2), but is not responding directly to this member; that could mean that either requests are not coming out or responses are not coming in; stopping cluster service.%s1 - set of members that can communicate with the member indicated in %s2; %s2 - member that can communicate with set of members indicated in %s1. Severity: 1-Error.Cause: The communication link between this member and the member indicated by %s2 has been broken. However, the set of witnesses indicated by %s1 report no communication issues with %s2. It is therefore assumed that this node is in a state of partial failure, thus resulting in the shutdown of its cluster threads.
Action: Corrective action is not necessarily required, since the rest of the cluster presumably is continuing its operation and this node may recover and rejoin the cluster. On the other hand, it may warrant an investigation into root causes of the problem (especially if it is recurring with some frequency).
validatePolls: This senior encountered an overdue poll, indicating a dead member, a significant network issue or an Operating System threading library bug (e.g. Linux NPTL): PollSeverity: 2-WarningCause: When a node joins a cluster, it performs a handshake with each cluster node. A missing handshake response prevents this node from joining the service. The log message following this one indicates the corrective action taken by this node.
Action: If this message reoccurs, further investigation into the root cause may be warranted.
Received panic from senior Member(%s1) caused by Member(%s2)%s1 - the cluster senior member as known by this node; %s2 - a member claiming to be the senior member. Severity: 1-Error.Cause: This occurs after a cluster is split into multiple cluster islands (usually due to a network link failure.) When a link is restored and the corresponding island seniors see each other, the panic protocol is initiated to resolve the conflict.
Action: If this issue occurs frequently, the root cause of the cluster split should be investigated.
Member %n1 joined Service %s with senior member %n2%n1 - an id of the Coherence node that joins the service; %s - the service name; %n2 - the senior node for the service. Severity: 5-Debug Level 5.Cause: When a clustered service starts on any cluster node, Coherence initiates a handshake protocol between all cluster nodes running the specified service. This message serves as an indication that the specified node has successfully completed the handshake and joined the service.
Action: None.
Member %n1 left Service %s with senior member %n2%n1 - an id of the Coherence node that joins the service; %s - the service name; %n2 - the senior node for the service. Severity: 5-Debug Level 5.
TCMP Log Messages
A-4 Oracle Coherence Administrator's Guide
Cause: When a clustered service terminates on some cluster node, all other nodes that run this service are notified about this event. This message serves as an indication that the specified clustered service at the specified node has terminated.
Action: None.
Service %s: received ServiceConfigSync containing %n entries%s - the service name; %n - the number of entries in the service configuration map. Sever-ity: 5-Debug Level 5.Cause: As a part of the service handshake protocol between all cluster nodes running the specified service, the service senior member updates every new node with the full content of the service configuration map. For the partitioned cache services that map includes the full partition ownership catalog and internal ids for all existing caches. The message is also sent for an abnormal service termination at the senior node when a new node assumes the service seniority. This message serves as an indication that the specified node has received that configuration update.
Action: None.
TcpRing: connecting to member %n using TcpSocket{%s}%s - the full information for the TcpSocket that serves as a TcpRing connector to another node; %n - the node id to which this node has connected. Severity: 5-Debug Level 5.Cause: For quick process termination detection Coherence utilizes a feature called TcpRing, which is a sparse collection of TCP/IP-based connection between different nodes in the cluster. Each node in the cluster is connected to at least one other node, which (if at all possible) is running on a different physical box. This connection is not used for any data transfer; only trivial "heartbeat" communications are sent once a second per each link. This message indicates that the connection between this and specified node is initialized.
Action: None.
Rejecting connection to member %n using TcpSocket{%s}%n - the node id that tries to connect to this node; %s - the full information for the Tcp-Socket that serves as a TcpRing connector to another node. Severity: 4-Debug Level 4.Cause: Sometimes the TCP Ring daemons running on different nodes could attempt to join each other or the same node at the same time. In this case, the receiving node may determine that such a connection would be redundant and reject the incoming connection request. This message is logged by the rejecting node when this happens.
Action: None.
Timeout while delivering a packet; requesting the departure confirmation for Member(%s1) by MemberSet(%s2)%s1 - the full Member information for a node that this node failed to communicate with; %s2 - the full information about the "witness" nodes that are asked to confirm the sus-pected member departure. Severity: 2-Warning.Cause: Coherence uses UDP for all data communications (mostly peer-to-peer unicast), which by itself does not have any delivery guarantees. Those guarantees are built into the cluster management protocol used by Coherence (TCMP). The TCMP daemons are responsible for acknowledgment (ACK or NACK) of all incoming communications. If one or more packets are not acknowledged within the ACK interval ("ack-delay-milliseconds"), they are resent. This repeats until the packets are finally acknowledged or the timeout interval elapses ("timeout-milliseconds"). At this time, this message is logged and the "witness"
TCMP Log Messages
Log Message Glossary A-5
protocol is engaged, asking other cluster nodes whether they experience similar communication delays with the non-responding node. The witness nodes are chosen based on their roles and location.
Action: Corrective action is not necessarily required, since the rest of the cluster presumably is continuing its operation and this node may recover and rejoin the cluster. On the other hand, it may warrant an investigation into root causes of the problem (especially if it is recurring with some frequency).
This node appears to have become disconnected from the rest of the cluster containing %n nodes. All departure confirmation requests went unanswered. Stopping cluster service.%n - the number of other nodes in the cluster this node was a member of. Severity: 1-Error.Cause: Sometime a node that lives within a valid Java process, stops communicating to other cluster nodes. (Possible reasons include: a network failure; extremely long GC pause; swapped out process.) In that case, other cluster nodes may choose to revoke the cluster membership fro the paused node and completely shun any further communication attempts by that node, causing this message be logged when the process attempts to resume cluster communications.
Action: Corrective action is not necessarily required, since the rest of the cluster presumably is continuing its operation and this node may recover and rejoin the cluster. On the other hand, it may warrant an investigation into root causes of the problem (especially if it is recurring with some frequency).
A potential communication problem has been detected. A packet has failed to be delivered (or acknowledged) after %n1 seconds, although other packets were acknowledged by the same cluster member (Member(%s1)) to this member (Member(%s2)) as recently as %n2 seconds ago. Possible causes include network failure, poor thread scheduling (see FAQ if running on Windows), an extremely overloaded server, a server that is attempting to run its processes using swap space, and unreasonably lengthy GC times.%n1 - The number of seconds a packet has failed to be delivered or acknowledged; %s1 - the recipient of the packets indicated in the message; %s2 - the sender of the packets indi-cated in the message; %n2 - the number of seconds since a packet was delivered success-fully between the two members indicated above. Severity: 2-Warning.Cause: Possible causes are indicated in the text of the message.
Action: If this issue occurs frequently, the root cause should be investigated.
Node %s1 is not allowed to create a new cluster; WKA list: [%s2]%s1 - Address of node attempting to join cluster; %s2 - List of WKA addresses. Severity: 1-Error.Cause: The cluster is configured to use WKA, and there are no nodes present in the cluster that are in the WKA list.
Action: Ensure that at least one node in the WKA list exists in the cluster, or add this node's address to the WKA list.
This member is configured with a compatible but different WKA list then the senior Member(%s). It is strongly recommended to use the same WKA list for all cluster members.%s - the senior node of the cluster. Severity: 2-Warning.Cause: The WKA list on this node is different than the WKA list on the senior node.
TCMP Log Messages
A-6 Oracle Coherence Administrator's Guide
Action: The WKA list on this node is different than the WKA list on the senior node.
UnicastUdpSocket failed to set receive buffer size to %n1 packets (%n2 bytes); actual size is %n3 packets (%n4 bytes). Consult your OS documentation regarding increasing the maximum socket buffer size. Proceeding with the actual value may cause sub-optimal performance.%n1 - the number of packets that fits in the buffer that Coherence attempted to allocate; %n2 - the size of the buffer Coherence attempted to allocate; %n3 - the number of packets that fits in the actual allocated buffer size; %n4 - the actual size of the allocated buffer. Severity: 2-Warning.Cause: See "Operating System Tuning" on page 6-1.
Action: See "Operating System Tuning" on page 6-1.
The timeout value configured for IpMonitor pings is shorter than the value of 5 seconds. Short ping timeouts may cause an IP address to be wrongly reported as unreachable on some platforms.Severity: 2-WarningCause: The ping timeout value is less than 5 seconds.
Action: Ensure that the ping timeout that is configured within the <tcp-ring-listener> element is greater than 5 seconds.
Network failure encountered during InetAddress.isReachable(): %s%n - a stack trace. Severity: 5-Debug Level 5.Cause: The IpMonitor component is unable to ping a member and has reached the configured timeout interval.
Action: Ensure that the member is operational or verify a network outage. The ping timeout that is configured within the <tcp-ring-listener> element can be increased to allow for a longer timeout as required by the network.
TcpRing has been explicitly disabled, this is not a recommended practice and will result in a minimum death detection time of %n seconds for failed processes.%n - the number of seconds that is specified by the packet publisher’s resend timeout which is 5 minutes by default. Severity: 2-Warning.Cause: The TcpRing Listener component has been disabled.
Action: Enable the TcpRing listener within the <tcp-ring-listener> element.
IpMonitor has been explicitly disabled, this is not a recommended practice and will result in a minimum death detection time of %n seconds for failed machines or networks.%n - the number of seconds that is specified by the packet publisher’s resend timeout which is 5 minutes by default. Severity: 2-Warning.Cause: The IpMonitor component has been disabled.
Action: The IpMonitor component is enabled when the TcpRing listener is enabled within the <tcp-ring-listener> element.
TcpRing connecting to %s%s - the cluster member to which this member has joined to form a TCP-Ring. Severity: 6-Debug Level 6.Cause: This message indicates that the connection between this and the specified member is initialized. The TCP-Ring is used for quick process termination detection and is a sparse collection of TCP/IP-based connection between different nodes in the cluster.
Configuration Log Messages
Log Message Glossary A-7
Action: none.
TcpRing disconnected from %s to maintain ring%s - the cluster member from which this member has disconnected. Severity: 6-Debug Level 6.Cause: This message indicates that this member has disconnected from the specified member and that the specified member is no longer a member of the TCP-Ring. The TCP-Ring is used for quick process termination detection and is a sparse collection of TCP/IP-based connection between different nodes in the cluster.
Action: If the member was intentionally stopped, no further action is required. Otherwise, the member may have been released from the cluster due to a failure or network outage. Restart the member.
TcpRing disconnected from %s due to a peer departure; removing the member.%s - the cluster member from which this member has disconnected. Severity: 5-Debug Level 5.Cause: This message indicates that this member has disconnected from the specified member and that the specified member is no longer a member of the TCP-Ring. The TCP-Ring is used for quick process termination detection and is a sparse collection of TCP/IP-based connection between different nodes in the cluster.
Action: If the member was intentionally stopped, no further action is required. Otherwise, the member may have been released from the cluster due to a failure or network outage. Restart the member.
TcpRing connection to "%s" refused ("%s1"); removing the member.%s - the cluster member to which this member was refused a connection; %s1- the refusal message. Severity: 5-Debug Level 5.Cause: The specified member has refused a TCP connection from this member and has subsequently been removed from the TCP-Ring.
Action: If the member was intentionally stopped, no further action is required. Otherwise, the member may have been released from the cluster due to a failure or network outage. Restart the member.
Configuration Log MessagesThe following are configuration-related log messages:
java.io.IOException: Configuration file is missing: "tangosol-coherence.xml"Severity: 1-Error.Cause: The operational configuration descriptor cannot be loaded.
Action: Make sure that the tangosol-coherence.xml resource can be loaded from the class path specified in the Java command line.
Loaded operational configuration from resource "%s"%s - the full resource path (URI) of the operational configuration descriptor. Severity: 3-Informational.Cause: The operational configuration descriptor is loaded by Coherence from the specified location.
Action: If the location of the operational configuration descriptor was explicitly specified using system properties or programmatically, verify that the reported URI matches the expected location.
Partitioned Cache Service Log Messages
A-8 Oracle Coherence Administrator's Guide
Loaded operational overrides from "%s"%s - the URI (file or resource) of the operational configuration descriptor override. Sever-ity: 3-Informational.Cause: The operational configuration descriptor points to an override location, from which the descriptor override has been loaded.
Action: If the location of the operational configuration descriptor was explicitly specified using system properties, descriptor override or programmatically, verify that the reported URI matches the expected location.
Optional configuration override "%s" is not specified%s - the URI of the operational configuration descriptor override. Severity: 3-Informa-tional.Cause: The operational configuration descriptor points to an override location which does not contain any resource.
Action: Verify that the operational configuration descriptor override is not supposed to exist.
java.io.IOException: Document "%s1" is cyclically referenced by the 'xml-override' attribute of element %s2%s1 - the URI of the operational configuration descriptor or override; %s2 - the name of the XML element that contains an incorrect reference URI. Severity: 1-Error.Cause: The operational configuration override points to itself or another override that point to it, creating an infinite recursion.
Action: Correct the invalid xml-override attribute's value.
java.io.IOException: Exception occurred during parsing: %s%s - the XML parser error. Severity: 1-Error.Cause: The specified XML is invalid and cannot be parsed.
Action: Correct the XML document.
Loaded cache configuration from "%s"%s - the URI (file or resource) of the cache configuration descriptor. Severity: 3-Informa-tional.Cause: The operational configuration descriptor or a programmatically created ConfigurableCacheFactory instance points to a cache configuration descriptor that has been loaded.
Action: Verify that the reported URI matches the expected cache configuration descriptor location.
Partitioned Cache Service Log MessagesThe following are partitioned cache-related log messages:
Asking member %n1 for %n2 primary partitions%n1 - the node id this node asks to transfer partitions from; %n2 - the number of parti-tions this node is willing to take. Severity: 4-Debug Level 4.Cause: When a storage-enabled partitioned service starts on a Coherence node, it first receives the configuration update that informs it about other storage-enabled service nodes and the current partition ownership information. That information allows it to calculate the "fair share" of partitions that each node is supposed to own after the re-distribution process. This message demarcates the beginning of the transfer request to a specified node for its "fair" ownership distribution.

Partitioned Cache Service Log Messages
Log Message Glossary A-9
Action: None.
Transferring %n1 out of %n2 primary partitions to member %n3 requesting %n4%n1 - the number of primary partitions this node transferring to a requesting node; %n2 - the total number of primary partitions this node currently owns; %n3 - the node id that this transfer is for; %n4 - the number of partitions that the requesting node asked for. Severity: 4-Debug Level 4.Cause: During the partition distribution protocol, a node that owns less than a "fair share" of primary partitions requests any of the nodes that own more than the fair share to transfer a portion of owned partitions. The owner may choose to send any number of partitions less or equal to the requested amount. This message demarcates the beginning of the corresponding primary data transfer.
Action: None.
Transferring %n1 out of %n2 partitions to a machine-safe backup 1 at member %n3 (under %n4)%n1 - the number of backup partitions this node transferring to a different node; %n2 - the total number of partitions this node currently owns that are "endangered" (do not have a backup); %n3 - the node id that this transfer is for; %n4 - the number of partitions that the transferee can take before reaching the "fair share" amount. Severity: 4-Debug Level 4.Cause: After the primary partition ownership is completed, nodes start distributing the backups, ensuring the "strong backup" policy, that places backup ownership to nodes running on computers that are different from the primary owners' computers. This message demarcates the beginning of the corresponding backup data transfer.
Action: None.
Transferring backup%n1 for partition %n2 from member %n3 to member %n4%n1 - the index of the backup partition that this node transferring to a different node; %n2 - the partition number that is being transferred; %n3 the node id of the previous owner of this backup partition; %n4 the node id that the backup partition is being transferred to. Severity: 5-Debug Level 5.Cause: During the partition distribution protocol, a node that determines that a backup owner for one of its primary partitions is overloaded may choose to transfer the backup ownership to another, underloaded node. This message demarcates the beginning of the corresponding backup data transfer.
Action: None.
Failed backup transfer for partition %n1 to member %n2; restoring owner from: %n2 to: %n3%n1 the partition number for which a backup transfer was in-progress; %n2 the node id that the backup partition was being transferred to; %n3 the node id of the previous backup owner of the partition. Severity: 4-Debug Level 4.Cause: This node was in the process of transferring a backup partition to a new backup owner when that node left the service. This node is restoring the backup ownership to the previous backup owner.
Action: None.
Deferring the distribution due to %n1 pending configuration updates%n1- the number of configuration updates. Severity: 5-Debug Level 5.Cause: This node is in the process of updating the global ownership map (notifying other nodes about ownership changes) when the periodic scheduled distribution check takes place. Before the previous ownership changes (most likely
Partitioned Cache Service Log Messages
A-10 Oracle Coherence Administrator's Guide
due to a previously completed transfer) are finalized and acknowledged by the other service members, this node postpones subsequent scheduled distribution checks.
Action: None.
Limiting primary transfer to %n1 KB (%n2 partitions)%n1 - the size in KB of the transfer that was limited; %n2 the number of partitions that were transferred. Severity: 4-Debug Level 4.Cause: When a node receives a request for some number of primary partitions from an underloaded node, it may transfer any number of partitions (up to the requested amount) to the requester. The size of the transfer is limited by the <transfer-threshold> element located within a <distributed-scheme> element. This message indicates that the distribution algorithm limited the transfer to the specified number of partitions due to the transfer-threshold.
Action: None.
DistributionRequest was rejected because the receiver was busy. Next retry in %n1 ms%n1 - the time in milliseconds before the next distribution check is scheduled. Severity: 6-Debug Level 6.Cause: This (underloaded) node issued a distribution request to another node asking for one or more partitions to be transferred. However, the other node declined to initiate the transfer as it was in the process of completing a previous transfer with a different node. This node waits at least the specified amount of time (to allow time for the previous transfer to complete) before the next distribution check.
Action: None.
Restored from backup %n1 partitions%n1 - the number of partitions being restored. Severity: 3-Informational.Cause: The primary owner for some backup partitions owned by this node has left the service. This node is restoring those partitions from backup storage (assuming primary ownership). This message is followed by a list of the partitions that are being restored.
Action: None.
Re-publishing the ownership for partition %n1 (%n2)%n1 the partition number whose ownership is being re-published; %n2 the node id of the primary partition owner, or 0 if the partition is orphaned. Severity: 4-Debug Level 4.Cause: This node is in the process of transferring a partition to another node when a service membership change occurred, necessitating redistribution. This message indicates this node re-publishing the ownership information for the partition whose transfer is in-progress.
Action: None.
%n1> Ownership conflict for partition %n2 with member %n3 (%n4!=%n5)%n1 - the number of attempts made to resolve the ownership conflict; %n2 - the partition whose ownership is in dispute; %n3 - the node id of the service member in disagreement about the partition ownership; %n4 - the node id of the partition's primary owner in this node's ownership map; %n5 - the node id of the partition's primary owner in the other node's ownership map. Severity: 4-Debug Level 4.Cause: If a service membership change occurs while the partition ownership is in-flux, it is possible for the ownership to become transiently out-of-sync and
Partitioned Cache Service Log Messages
Log Message Glossary A-11
require reconciliation. This message indicates that such a conflict was detected, and denotes the attempts to resolve it.
Action: None.
Assigned %n1 orphaned primary partitions%n1 - the number of orphaned primary partitions that were re-assigned. Severity: 2-Warning.Cause: This service member (the most senior storage-enabled) has detected that one or more partitions have no primary owner (orphaned), most likely due to several nodes leaving the service simultaneously. The remaining service members agree on the partition ownership, after which the storage-senior assigns the orphaned partitions to itself. This message is followed by a list of the assigned orphan partitions. This message indicates that data in the corresponding partitions may have been lost.
Action: None.
validatePolls: This service timed-out due to unanswered handshake request. Manual intervention is required to stop the members that have not responded to this PollSeverity: 1-Error.Cause: When a node joins a clustered service, it performs a handshake with each clustered node running the service. A missing handshake response prevents this node from joining the service. Most commonly, it is caused by an unresponsive (for example, deadlocked) service thread.
Action: Corrective action may require locating and shutting down the JVM running the unresponsive service. See My Oracle Support Note 845363.1 for more details.
https://metalink.oracle.com/CSP/ui/flash.html#tab=KBHome%28page=KBHome&id=%28%29%29,%28page=KBNavigator&id=%28viewingMode=1143&from=BOOKMARK&bmDocType=HOWTO&bmDocDsrc=KB&bmDocTitle=845363.1&bmDocID=845363.1%29%29
java.lang.RuntimeException: Storage is not configuredSeverity: 1-Error.Cause: A cache request was made on a service that has no storage-enabled service members. Only storage-enabled service members may process cache requests, so there must be at least one storage-enabled member.
Action: Check the configuration/deployment to ensure that members that are intended to store cache data are configured to be storage-enabled. Storage is enabled on a member using the <local-storage> element located within a <distributed-scheme> element, or by using the -Dtangosol.coherence.distributed.localstorage command-line override.
An entry was inserted into the backing map for the partitioned cache "%s" that is not owned by this member; the entry will be removed."%s - the name of the cache into which insert was attempted. Severity: 1-Error.Cause: The backing map for a partitioned cache may only contain keys that are owned by that member. Cache requests are routed to the service member owning the requested keys, ensuring that service members only process requests for keys which they own. This message indicates that the backing map for a cache detected an insertion for a key which is not owned by the member. This is most likely caused by a direct use of the backing-map as opposed to the exposed cache APIs

Partitioned Cache Service Log Messages
A-12 Oracle Coherence Administrator's Guide
(for example, NamedCache) in user code running on the cache server. This message is followed by a Java exception stack trace showing where the insertion was made.
Action: Examine the user-code implicated by the stack-trace to ensure that any backing-map operations are safe. This error can be indicative of an incorrect implementation of KeyAssociation
Exception occurred during filter evaluation: %s; removing the filter...%s - the description of the filter that failed during evaluation. Severity: 1-Error.Cause: An exception was thrown while evaluating a filter for a MapListener registered on this cache. As a result, some map events may not have been issued. Additionally, to prevent further failures, the filter (and associated MapListener) are removed. This message is followed by a Java exception stack trace showing where the failure occurred.
Action: Review filter implementation and the associated stack trace for errors.
Exception occurred during event transformation: %s; removing the filter...%s - the description of the filter that failed during event transformation. Severity: 1-Error.Cause: An Exception was thrown while the specified filter was transforming a MapEvent for a MapListener registered on this cache. As a result, some map events may not have been issued. Additionally, to prevent further failures, the Filter implementation (and associated MapListener) are removed. This message is followed by a Java exception stack trace showing where the failure occurred.
Action: Review the filter implementation and the associated stack trace for errors.
Exception occurred during index rebuild: %s%s - the stack trace for the exception that occurred during index rebuild. Severity: 1-Error.Cause: An Exception was thrown while adding or rebuilding an index. A likely cause of this is a faulty ValueExtractor implementation. As a result of the failure, the associated index is removed. This message is followed by a Java exception stack trace showing where the failure occurred.
Action: Review the ValueExtractor implementation and associated stack trace for errors.
Exception occurred during index update: %s%s - the stack trace for the exception that occurred during index update. Severity: 1-Error.Cause: An Exception was thrown while updating an index. A likely cause of this is a faulty ValueExtractor implementation. As a result of the failure, the associated index is removed. This message is followed by a Java exception stack trace showing where the failure occurred.
Action: Review the ValueExtractor implementation and associated stack trace for errors.
Exception occurred during query processing: %s%s - the stack trace for the exception that occurred while processing a query. Severity: 1-Error.Cause: An Exception was thrown while processing a query. A likely cause of this is an error in the filter implementation used by the query. This message is followed by a Java exception stack trace showing where the failure occurred.
Action: Review the filter implementation and associated stack trace for errors.
BackingMapManager %s1: returned "null" for a cache: %s2
Partitioned Cache Service Log Messages
Log Message Glossary A-13
%s1 - the classname of the BackingMapManager implementation that returned a null backing-map; %s2 - the name of the cache for which the BackingMapManager returned null. Severity: 1-Error.Cause: A BackingMapManager returned null for a backing-map for the specified cache.
Action: Review the specified BackingMapManager implementation for errors and to ensure that it properly instantiates a backing map for the specified cache.
BackingMapManager %s1: failed to instantiate a cache: %s2%s1 - the classname of the BackingMapManager implementation that failed to create a backing-map; %s2 - the name of the cache for which the BackingMapManager failed. Severity: 1-Error.Cause: A BackingMapManager unexpectedly threw an Exception while attempting to instantiate a backing-map for the specified cache.
Action: Review the specified BackingMapManager implementation for errors and to ensure that it properly instantiates a backing map for the specified cache.
BackingMapManager %s1: failed to release a cache: %s2%s1 - the classname of the BackingMapManager implementation that failed to release a backing-map; %s2 - the name of the cache for which the BackingMapManager failed. Severity: 1-Error.Cause: A BackingMapManager unexpectedly threw an Exception while attempting to release a backing-map for the specified cache.
Action: Review the specified BackingMapManager implementation for errors and to ensure that it properly releases a backing map for the specified cache.
Unexpected event during backing map operation: key=%s1; expected=%s2; actual=%s3%s1 - the key being modified by the cache; %s2 - the expected backing-map event from the cache operation in progress; %s3 - the actual MapEvent received. Severity: 6-Debug Level 6.Cause: While performing a cache operation, an unexpected MapEvent was received on the backing-map. This indicates that a concurrent operation was performed directly on the backing-map and is most likely caused by direct manipulation of the backing-map as opposed to the exposed cache APIs (for example, NamedCache) in user code running on the cache server.
Action: Examine any user-code that may directly modify the backing map to ensure that any backing-map operations are safe.
Application code running on "%s1" service thread(s) should not call %s2 as this may result in deadlock. The most common case is a CacheFactory call from a custom CacheStore implementation.%s1 - the name of the service which has made a re-entrant call; %s2 - the name of the method on which a re-entrant call was made. Severity: 2-Warning.Cause: While executing application code on the specified service, a re-entrant call (a request to the same service) was made. Coherence does not support re-entrant service calls, so any application code (CacheStore, EntryProcessor, and so on...) running on the service thread(s) should avoid making cache requests.
Action: Remove re-entrant calls from application code running on the service thread(s) and consider using alternative design strategies as outlined in the Oracle Coherence Developer's Guide.
Repeating %s1 for %n1 out of %n2 items due to re-distribution of %s2
Partitioned Cache Service Log Messages
A-14 Oracle Coherence Administrator's Guide
%s1 - the description of the request that must be repeated; %n1 - the number of items that are outstanding due to re-distribution; %n2 - the total number of items requested; %s2 - the list of partitions that are in the process of re-distribution and for which the request must be repeated. Severity: 5-Debug Level 5.Cause: When a cache request is made, the request is sent to the service members owning the partitions to which the request refers. If one or more of the partitions that a request refers to is in the process of being transferred (for example, due to re-distribution), the request is rejected by the (former) partition owner and is automatically resent to the new partition owner.
Action: None.
Error while starting cluster: com.tangosol.net.RequestTimeoutException: Timeout during service start: ServiceInfo(%s)%s - information on the service that could not be started. Severity: 1-Error.Cause: When joining a service, every service in the cluster must respond to the join request. If one or more nodes have a service that does not respond within the timeout period, the join times out.
Action: See My Oracle Support Note 845363.1
https://metalink.oracle.com/CSP/ui/flash.html#tab=KBHome%28page=KBHome&id=%28%29%29,%28page=KBNavigator&id=%28viewingMode=1143&from=BOOKMARK&bmDocType=HOWTO&bmDocDsrc=KB&bmDocTitle=845363.1&bmDocID=845363.1%29%29
Failed to restart services: com.tangosol.net.RequestTimeoutException: Timeout during service start: ServiceInfo(%s)%s - information on the service that could not be started. Severity: 1-Error.Cause: When joining a service, every service in the cluster must respond to the join request. If one or more nodes have a service that does not respond within the timeout period, the join times out.
Action: See My Oracle Support Note 845363.1
https://metalink.oracle.com/CSP/ui/flash.html#tab=KBHome%28page=KBHome&id=%28%29%29,%28page=KBNavigator&id=%28viewingMode=1143&from=BOOKMARK&bmDocType=HOWTO&bmDocDsrc=KB&bmDocTitle=845363.1&bmDocID=845363.1%29%29