adopted capital improvement program
TRANSCRIPT
New: Bailey’s Upper Elementary School for the Arts and Sciences
A D O P T E D
Fiscal Years 2016-20
Capital Improvement Program


Karen K. Garza, Superintendent FAIRFAX COUNTY 8115 Gatehouse Road PUBLIC SCHOOLS Falls Church, Virginia 22042 December 5, 2014 MEMORANDUM TO: School Board FROM: Karen K. Garza SUBJECT: Capital Improvement Program – FY2016 – FY2020 I am pleased to submit to you the proposed Capital Improvement Program (CIP) for the Fiscal Years 2016-2020. This year we have added additional information to the CIP to assist readers in understanding our long term goals as we continue to contend with growing enrollment and limited capital funding. This version of the CIP includes potential capacity and capital solutions to schools which are currently or projected to be over-capacity. The intent of the solutions was to provide relief through surplus capacity at adjacent facilities as well as taking advantage of projects which have already been identified in previous CIPs. We have also included maps of our surplus properties and former schools which may ultimately be part of capital solutions in the future. Between September 2013 and 2014, the total Fairfax County Public Schools (FCPS) membership grew by approximately 2,000 students. Since September 2006, the total membership has grown by nearly 22,000 students. Membership is projected to continue to increase over the five-year CIP horizon to approximately 198,000 students by school year 2019-20. Demographic growth and shifts, especially growing Hispanic and Asian student populations, have comprised a large part of the increasing enrollment within FCPS. For the first time since before the most recent growth began (the 2007-08 school year), Kindergarten totals have dropped for the 2014-15 school year. This is coupled with an overall reduction trend of students in grades one through seven, in 2013-14 and 2014-15. FCPS may be nearing or have passed a relative enrollment peak in the early elementary grades. However, due to cumulative growth in elementary schools since the 2007-08 school year, middle and high school enrollments are experiencing growth. The Spring 2014 enrollment projections show continued growth in total enrollments well beyond the 2019-20 school year, with much of the growth occurring in middle and high school levels. The current and anticipated enrollment increases continue to present a major challenge as the school system struggles to provide sufficient capacity in our schools. Despite the planned additional capacity intended to address projected needs, uneven enrollment growth throughout the county will necessitate the continuation of small and large scale boundary adjustments to take advantage of available capacity whenever it is practicable to do so. The capital funding stream shown in the FY2016 – FY2020 CIP reflects $250 million approved by county voters in the 2013 School Bond Referendum. This funding will allow the construction of one new elementary school, capacity enhancements at one elementary school, renovations (including capacity enhancements) at nine elementary schools, one middle and one high school, construction planning for one high school addition and renovation planning for eight elementary schools, one middle and two high schools. The 2013 School Bond Referendum also provides funding for site acquisition. The anticipated need for two additional unfunded elementary schools - one in the Fairfax/Oakton area and one in North West Fairfax County area are included in the CIP. The CIP also includes a new elementary school on Fort Belvoir which is jointly funded with the Department of Defense.
School Board Page 2 December 5, 2014 Funding for capital improvement projects is currently limited by a $155 million yearly cap on school bond sales. Providing the additional new schools and capacity enhancements required to accommodate enrollment growth will cause delays in the schedule of many future renovation projects. Last year the School Board and Board of Supervisors formed a committee to study ways to solve the long renovation cycle of our schools due to the limited capital funding available. The Infrastructure Finance Committee recognized that the bond items which pertain to replacement of key infrastructure such as roofs, parking lots and mechanical systems was delaying the implementation of school renovations. Beginning in FY 2016, the Board of Supervisors approved an additional $13.1 million to FCPS to offset the infrastructure replacement which will benefit renovation projects in the near future. Project costs have also been updated in this document to reflect those currently being experienced. As a result, the FY2016-FY2020 five-year capital requirement totals approximately $856 million or roughly $171 million per year. The five-year requirement represents roughly 50% of the $1.7 billion total CIP cost for FY2016-FY2025 (including prior year expenditures). Funds approved in the 2013 School Bond Referendum and previous referenda will address approximately $220 million of the five-year requirement leaving a balance of $636 million unfunded. We anticipate the next bond referendum will be in the fall of 2015. Capital improvement requirements for the ensuing five-year period (FY2021 through FY2025) have been included to conform to Fairfax County’s CIP format. Approximately $593 million in capital project requirements are included within this out-year time frame. KKG/kv Attachment cc: Leadership Team

FY 2016-20 • CAPITAL IMPROVEMENT PROGRAM • OFFICE OF FACILITIES PLANNING SERVICES • FAIRFAX COUNTY PUBLIC SCHOOLS
iii
SCHOOL BOARD
Tamara Derenak Kaufax, ChairmanLEE DISTRICT
Theodore J. Velkoff, Vice ChairmanMEMBER AT LARGE
Sandra S. EvansMASON DISTRICT
Patricia HynesHUNTER MILL DISTRICT
Ryan L. McElveenMEMBER AT LARGE
Megan O. McLaughlinBRADDOCK DISTRICT
Ilryong MoonMEMBER AT LARGE
Patricia S. ReedPROVIDENCE DISTRICT
Elizabeth L. SchultzSPRINGFIELD DISTRICT
Kathy L. SmithSULLY DISTRICT
Daniel G. StorckMOUNT VERNON DISTRICT
Jane K. StraussDRANESVILLE DISTRICT
Harris LaTeefSTUDENT REPRESENTATIVE
ADMINISTRATION
Karen K. GarzaSUPERINTENDENT
Steven LockardDEPUTY SUPERINTENDENT
Susan QuinnCHIEF OPERATING OFFICER
Jeffrey K. PlatenbergASSISTANT SUPERINTENDENT
Kevin SneedSPECIAL PROJECTS ADMINISTRATOR
CAPITAL PROJECTS AND PLANNING
Aimee J. HollebASSISTANT DIRECTOR
OFFICE OF FACILITIES PLANNING SERVICES

FY 2016-20 • CAPITAL IMPROVEMENT PROGRAM • OFFICE OF FACILITIES PLANNING SERVICES • FAIRFAX COUNTY PUBLIC SCHOOLS
iv
Staff acknowledges and thanks the Facilities Planning Advisory Council (FPAC) for their contributions to the preparation of the FY 2016-20 Capital Improvement Program.
FACILITIES PLANNING ADVISORY COUNCIL (FPAC)
Karen Hogan, ChairAT-LARGE
Daniel AminoffMASON DISTRICT
Matt BrooksSPRINGFIELD DISTRICT
Chad ConewayMOUNT VERNON DISTRICT
Allen GriffithCITY OF FAIRFAX
Charles HookeyBRADDOCK DISTRICT
Kristen HyattSULLY DISTRICT
Chris MolivadasPROVIDENCE DISTRICT
Christopher NunevillerLEE DISTRICT
Howard PerlsteinHUNTER MILL DISTRICT
David PhillipsAT-LARGE
Adam SiegelDRANESVILLE DISTRICT
Mamie VillaflorAT-LARGE
Additional information about FPAC may be found at their web page:http://www.fcps.edu/fts/planning/fpac/index.shtml
Staff acknowledges and thanks the Department of Information Technology, Multimedia Design Services, for their contributions to the preparation of the
FY 2016-20 Capital Improvement Program book.

FY 2016-20 • CAPITAL IMPROVEMENT PROGRAM • OFFICE OF FACILITIES PLANNING SERVICES • FAIRFAX COUNTY PUBLIC SCHOOLS
1
Table of Contents
◗ SUMMARY HIGHLIGHTS . . . . . . . . . . . . . . . 3
◗ BONDS
FCPS School Bond Process . . . . . . . . . . . . . . . . . . . . . 5
The Capital Improvement Program (CIP) . . . . . . . . . 5
CIP Process and Cycle . . . . . . . . . . . . . . . . . . . . . . . . 6
Capital Program Recommendations
New Construction . . . . . . . . . . . . . . . . . . . . . . . . . 7
Capacity Enhancements . . . . . . . . . . . . . . . . . . . . . 7
Renovations . . . . . . . . . . . . . . . . . . . . . . . . . . . . . . 7
Special Program Facilities . . . . . . . . . . . . . . . . . . . . 7
Site Acquisition . . . . . . . . . . . . . . . . . . . . . . . . . . . . 8
Capital Project Summary
Construction Costs and Funding . . . . . . . . . . . . . . . 8
Bond Referendum Need . . . . . . . . . . . . . . . . . . . . . 8
Cash Flow Sheets . . . . . . . . . . . . . . . . . . . . . . . . . . 9
Mitigation of New Residential Development: Cash Proffers . . . . . . . . . . . . . . . . . 12
Proffer Contribution Update . . . . . . . . . . . . . . . . . . 12
◗ PROJECTIONS
Background . . . . . . . . . . . . . . . . . . . . . . . . . . . . . . . 13
Projections Process . . . . . . . . . . . . . . . . . . . . . . . . . 14
Enrollment Trends . . . . . . . . . . . . . . . . . . . . . . . . . 17
General Education Student Enrollment and Projections . . . . . . . . . . . . . . . . . . 17
Special Population/Program Enrollment and Projections . . . . . . . . . . . . . . . . . . 17
Other Student Populations . . . . . . . . . . . . . . . . . . 17
Enrollment Impact from New Housing: Residential Development Monitoring . . . . . . . . . . 19
FCPS Membership History and 10-Year Projections: By Grade . . . . . . . . . . . . . . . . 20
FCPS Membership History and 10-Year Projections: By Level . . . . . . . . . . . . . . . . 21
◗ CAPACITY
Assessment of Facility Capacity
School Capacity—Information and Assessment . . 23
School Capacity Model . . . . . . . . . . . . . . . . . . . . . 23
Temporary Classroom Needs . . . . . . . . . . . . . . . . 24
Determining Renovation Requirements . . . . . . . . 24
Enrollment and Capacity Comparisons
Countywide Comparisons . . . . . . . . . . . . . . . . . . . 25
School-Level Comparisons . . . . . . . . . . . . . . . . . . 25
◗ REGION SUMMARIES
Capacity Utilization Maps and Enrollment Summaries
Region 1 . . . . . . . . . . . . . . . . . . . . . . . . . . . . . . . . 33
Region 2 . . . . . . . . . . . . . . . . . . . . . . . . . . . . . . . . 39
Region 3 . . . . . . . . . . . . . . . . . . . . . . . . . . . . . . . . 46
Region 4 . . . . . . . . . . . . . . . . . . . . . . . . . . . . . . . . 52
Region 5 . . . . . . . . . . . . . . . . . . . . . . . . . . . . . . . . 58
Regional Summary . . . . . . . . . . . . . . . . . . . . . . . . 64
◗ ADDITIONAL MAPS
Elementary School AAP Assignments and School-Based AAP Centers . . . . . . . . . . . . . . 65
Middle School Assignments for Advanced Academic Programs . . . . . . . . . . . . . . . 66
2008-09 Births Per Housing Units . . . . . . . . . . . . . 67
2012-13 Births Per Housing Units . . . . . . . . . . . . . . 68
Fairfax County Comprehensive Plan: Development Centers and 2012-13 School Year Births . . . . . . . . 69
FCPS Owned Vacant School Sites, Community Building, and Administrative/Special Programs Centers . . . . . . . 70
◗ ALPHABETICAL LIST OF SCHOOLS . . . . . . 71
◗ GLOSSARY OF TERMS . . . . . . . . . . . . . . . 87

FY 2016-20 • CAPITAL IMPROVEMENT PROGRAM • OFFICE OF FACILITIES PLANNING SERVICES • FAIRFAX COUNTY PUBLIC SCHOOLS
2
FY 2016-20 • CAPITAL IMPROVEMENT PROGRAM • OFFICE OF FACILITIES PLANNING SERVICES • FAIRFAX COUNTY PUBLIC SCHOOLS
3
students within FCPS schools. Despite the planned additional capacity intended to address projected needs, uneven enrollment growth throughout the County will necessitate the continuation of boundary adjustments to take advantage of available capacity whenever it is practicable to do so.
Between September 2013 and 2014, total FCPS membership grew by approximately 2,000 students. Since September 2006, total membership has grown by nearly 22,000 students. Membership is projected to continue increasing over the five-year CIP horizon, reaching approximately 198,000 students by school year 2019-20.
The CIP proposes capacity enhancements to Langley, Herndon, Oakton and West Springfield High Schools as part of their renovations and additions at Westbriar Elementary and South Lakes High Schools to expand the schools’ capacities. The CIP proposes four new elementary schools: one in the Richmond Highway Corridor (Route 1 area) to relieve overcrowding at schools in the Groveton/Hybla Valley area; one in the North West county area to address current overcrowding in the Coates and McNair Elementary School areas, as well as projected enrollment growth from new transit oriented developments associated with the Metro rail expansion along the new Silver Line; a new school to relieve overcrowding in the Fairfax/Oakton area; and a new school on the army base to relieve overcrowding at Fort Belvoir ES. This new school is jointly funded with the Department of Defense.
The FY 2016–20 Capital Improvement Program (CIP) updates and builds upon the previously approved program of capital expenditures. The CIP project schedule assumes continuation of an annual expenditure limit of $155 million imposed by the Fairfax County Board of Supervisors. The CIP assumes that participating school systems with students attending Thomas Jefferson High School for Science and Technology will fund their proportionate share of the cost of renovating that school. The CIP includes federal funds that have been approved to provide for construction of a new elementary school on the grounds of Fort Belvoir. School construction projects approved in the November 2013 School Bond Referendum are included in this CIP as funded projects.
The following summarizes the proposed FY 2016-20 CIP and the important assumptions upon which it is based:
Although new housing had been one of the primary sources of growth within FCPS during the 1980s and 1990s, newly completed housing declined numerically during the economic downturn. As the County approaches build-out, new housing is forecast to rise numerically in units, but its composition is likely to change. Forecasts of housing in Fairfax County and City include larger numbers and proportions of mid and high rise residential developments, which have typically drawn fewer families with school-aged children. Anticipation and completion of the Silver Line Metro has already spurred higher density residential growth along that corridor. This new residential growth, along with potential changes in families residing within existing residential areas adjacent to that corridor, may, in part, result in an increase in
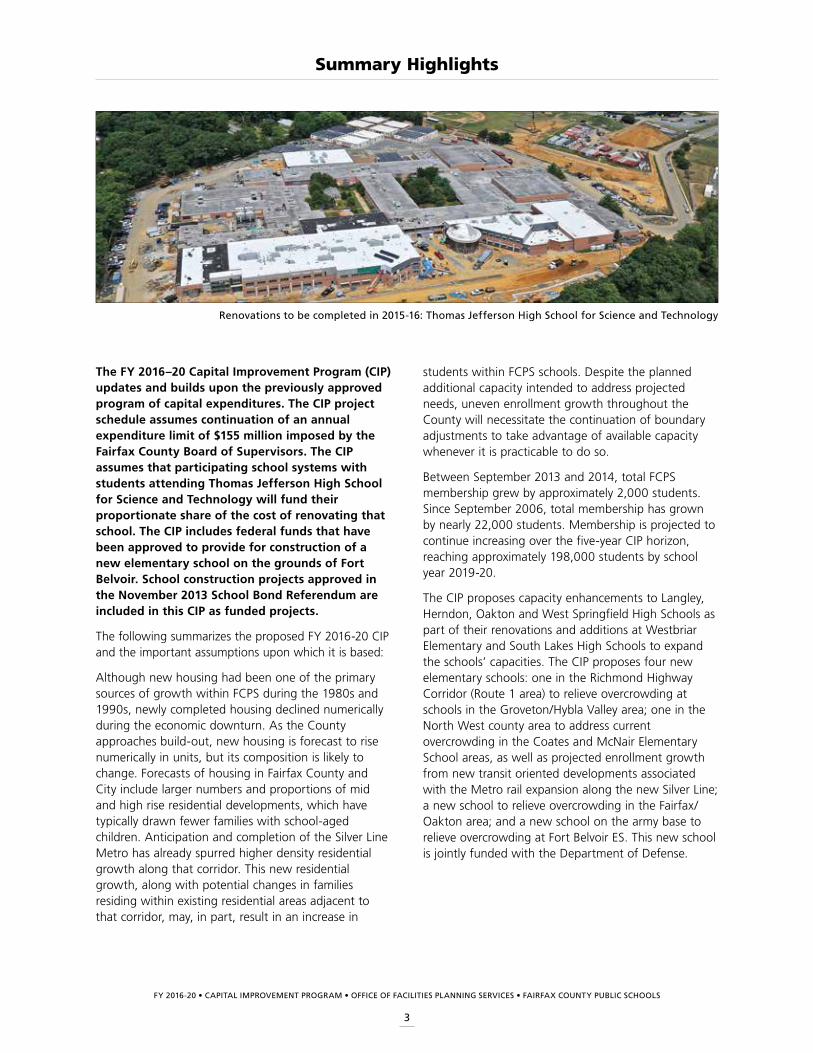
Renovations to be completed in 2015-16: Thomas Jefferson High School for Science and Technology
Summary Highlights

FY 2016-20 • CAPITAL IMPROVEMENT PROGRAM • OFFICE OF FACILITIES PLANNING SERVICES • FAIRFAX COUNTY PUBLIC SCHOOLS
4
A new section entitled “Enrollment Impact from New Housing-Residential Development Monitoring” has been added in the projections chapter of the CIP. This section highlights how FCPS monitors new developments and their impact on schools. Also, added is a new section, in the bonds chapter, entitled “Mitigation of New Residential Developments: Cash Proffers.” This section highlights FCPS’ recommendations to developers for monetary contributions to offset the impact of development on surrounding schools. Additionally, a systemwide summary sheet has been added to provide an overview of current (2014-15 school year) and projected (2019-20 school year) enrollments, capacities and capacity balances by high school pyramid and region for elementary, middle, and high school levels. Finally, the FCPS owned vacant site maps now includes vacant school buildings and administrative centers.
Recommended boundary adjustment options and program changes are included in the CIP for future consideration only. Any option chosen for potential implementation will be discussed and decided through a transparent process that engages the community, in accordance with School Board Policy and Regulations. This includes adjustments needed for Advanced Academic Program centers at existing facilities and newly identified site locations.
For more information about facility needs, as sorted by region, pyramid, and school, see Attachments A, B, C, and D presented to the Fairfax County Public Schools School Board during the November 10, 2014, work session: http://www.boarddocs.com/vsba/fairfax/Board.nsf/Public or http://www.fcps.edu/fts/planning/cip.shtml.
Interior modifications to enhance capacity, based on anticipated program changes, are proposed. These alterations will total $3.0 million and will be funded out of the $5.0 million set aside from the 2013 Bond Referendum.
The school renovation program is based upon several criteria, compiled and referred to as the renovation queue. The current renovation queue was approved by the School Board in January of 2009 and established the order in which schools will be renovated as evaluated and ranked by an independent architectural and engineering firm. Due to the continuing increase in student population, it should be noted that the construction of new capacity, whether it is a new school or addition, could adversely impact the timing of some renovation projects. To the extent known, any such delays are shown in this year’s CIP. Although construction costs are rising, the increases will be offset by additional funding approved by the Board of Supervisors to cover infrastructure replacement costs.
This document provides advance notice to school communities about capital projects and/or possible changes in attendance areas/programs over the next five years. The region summaries include maps reflecting capacity utilizations and recommendations for student accommodations. An alphabetical listing of all schools and a glossary of commonly used terms have been included in the CIP to show important facility and feeder school information.
Summary Highlights (Continued)
Important NoteThe FCPS FY 2016-20 Capital Improvement Plan (CIP) is a planning and fiscal management tool used to coordinate the location, timing and financing of projects over a five-year period. The CIP includes the proposed capital improvement projects, a year-by-year schedule of anticipated spending, and actual and estimated costs. The CIP is a working document which is updated annually to reflect changing conditions within our schools and communities. Additionally, it offers a broader planning schedule in order to focus staff efforts and community conversations. FCPS faces significant capacity challenges which will require strategic decisions about boundaries, capacity enhancements, new schools, and programmatic changes. Parallel work is also underway to design a new, more systematic approach to future decision-making processes that impact facilities planning.
FY 2016-20 • CAPITAL IMPROVEMENT PROGRAM • OFFICE OF FACILITIES PLANNING SERVICES • FAIRFAX COUNTY PUBLIC SCHOOLS
5
and debt service limitations established by the Fairfax County BOS. Because of construction projects in process over multiple years and a spending limitation of $155 million each year for capital projects, the time line can range from 5-7 years or more for capital projects to go from bond approval to completion.
FCPS School Bond ProcessIn Virginia, school boards do not have taxing authority and are fiscally dependent on the local government. Because bonds are a future obligation for taxpayers, Virginia law requires that voters approve long-term debt incurred by bonds through a referendum. Most city and county governments use bonds—a form of long-term borrowing—to finance public facilities and infrastructure. Traditionally, Fairfax County has used the sale of municipal bonds to fund these large expenditures. This enables the costs of major capital improvements to be spread over the many years that the facilities are used. This also avoids an excessive cost burden to current taxpayers and shares the cost of these long-term investments with future taxpayers who will also use the facilities. Voter approval authorizes the Fairfax County Board of Supervisors (BOS) to sell bonds, when needed, to generate the funds for a range of public facilities like schools.
Of the nation’s more than 3,000 counties, Fairfax County is amongst 37 that have the “triple A” bond ratings from all three rating agencies (source: FY 2015 Fairfax County Adopted Budget Plan (overview) page 216). High bond ratings allow the County to sell the bonds at exceptionally low interest rates, thereby saving considerably on the cost of the project. To ensure that the County’s bond ratings are not jeopardized, the Fairfax County BOS adheres to financial management principles that set limits on the annual cost of the County’s debt service and net long-term debt. The County also follows a self-imposed limit on the level of the average bond sale. As long as the bond debt service costs do not increase significantly as a percentage of the combined general fund disbursements, Fairfax County’s bonded debt will not be a contributing factor to any increase in local taxes.
While the practice of municipal bond sales has provided a reliable resource for funding capital improvement projects, the bond spending cap for FCPS of $155 million per year has limited funding availability, thus limiting FCPS’ ability to renovate and add capacity to the facilities.
Every two years in November, school capital facility projects are part of a school bond referendum, which is added to the general election ballot. Actual start and completion dates for CIP projects depend on cash flow
Bonds
Bonds for Capital Improvements Projects
• New construction
• Capacity enhancement (additions to existing schools and other modifications)
• Renovation program
• Special program facilities
• Site acquisition
• Infrastructure management: Technology upgrades, American Disabilities Act upgrades, roof and HVAC replacement, athletic infrastructure, security enhancements, and asphalt paving infrastructure management. These funds were included in the 2013 bond referendum but are not included in the FY 2016-20 CIP cash flow due to additional funding approved by the Board of Supervisors.
The Capital Improvement ProgramFairfax County Public Schools is a component of the Fairfax County government, and as such, the County Board of Supervisors authorizes the funding for the school system, which comprises just over 50% of the total County budget. County residents are more familiar with the operating fund that finances the day-to-day school operations, books, teachers, desks, equipment, minor maintenance, etc. However, capital improvements such as new schools, capacity enhancements, and school renovations are not funded through the general or school operating fund. Capital expenditures typically are planned for assets with 20-25 years of useful life and are funded through the sale of bonds in coordination with Fairfax County.
FY 2016-20 • CAPITAL IMPROVEMENT PROGRAM • OFFICE OF FACILITIES PLANNING SERVICES • FAIRFAX COUNTY PUBLIC SCHOOLS
6
CIP Process and CycleThe following outlines the time line and process which identifies current and future student accommodation needs and guides the recommendations for CIP prioritization:
April
• Enrollment projections are completed for the next school year and the subsequent five years based on enrollment trends at each school and systemwide
• Enrollment projections are analyzed to support detailed student accommodation planning for specific schools or groups of schools that will be implemented over the summer prior to the next school year (trailers, interior modifications)
• Program needs and resulting school capacity requirements are determined
August-September
• Solutions for capacity imbalances are considered and recommendations developed for any new capital projects such as new schools, capacity enhancements, modular additions, or relocations
October-November
• Staff compares current September 30th enrollment, projected enrollment and the updated school capacities to finalize and update capacity surplus or deficit data for each school; the Design and Construction Dashboard is updated
December
• CIP is presented to the School Board
January
• Public hearing, School Board work session, and School Board action on the CIP
February/March
• CIP incorporated into the Fairfax County CIP, which includes facilities planning for other public agencies, such as police, fire, libraries, and parks, and is presented to the Planning Commission
These major improvements are funded separately from the day-to-day expenditures of the school system. Despite the surge in enrollment growth over the past several years and the need for additional school facilities, school capital spending remains limited to $155 million per year.
Each year, FCPS develops a five-year planning document known as the Capital Improvement Program (CIP) to address future facility needs. The CIP lists all projects managed by the school system’s Office of Design and Construction. Capital improvements are funded through the sale of school bonds, which must be approved by a majority of voters. The list includes projects that are funded from prior bond sales and projects that are unfunded. The unfunded projects reflect planning for identified needs, which will be included in future bond referenda. The actual timing for capital project starts and completions is largely dependent on cash flow and debt service which are governed by the Board of Supervisors.
The CIP guides the development of the construction fund to ensure:
• efficient and effective use of FCPS-owned facilities
• classroom capacity and infrastructure meet instruction program and community needs
• facility needs are met equitably across the County
As a planning document, the CIP is not static. Every year, FCPS evaluates the capacity and effective building utilization of each school. The CIP adjusts to shifts in student population and the needs of the community as they become more defined and as projects move closer to implementation. A key element of the CIP is planning for the cash flow to fund these projects while working within the County’s debt service and capital spending limitations. The CIP cash flow has been predicated on 4% to 6% cost increases for future fiscal years. Increases in construction market pricing, coupled with CIP initiatives providing additional capacity to accommodate enrollment increases, could result in some timing delays for school renovation starts. As enrollment growth drives the demand for more capacity, the cash flow may increasingly shift away from renovations, potentially increasing the time a school community may have to wait for their school renewal.
Bonds (Continued)
FY 2016-20 • CAPITAL IMPROVEMENT PROGRAM • OFFICE OF FACILITIES PLANNING SERVICES • FAIRFAX COUNTY PUBLIC SCHOOLS
7
Bonds (Continued)
Capital Program RecommendationsUsing a five-year planning horizon, FCPS identifies capacity deficits that cannot otherwise be addressed through school boundary changes, program relocations, temporary facilities, or other internal building modifications designed to recapture underutilized or unused capacity. Significant capacity shortages for schools which are likely to persist over time become candidates for new construction projects to enhance school capacity.
While they are the most visible component, new construction projects are only part of the CIP picture. Renovations are aimed at assuring that all schools provide the facilities necessary to support current educational programs regardless of the age of the buildings. Renovations are also used to restore capacity lost due to low-ratio special program instruction and other new instructional support needs (e.g., technology labs). Depending on need, a renovated school may acquire a new heating plant, air conditioning, upgraded electrical and plumbing systems, and spaces required to support the educational program.
In addition to new construction and renovations, FCPS periodically undertakes other capital projects to support its facilities. Examples include installation of safety and security systems as well as improvement of facilities for students and citizens with disabilities.
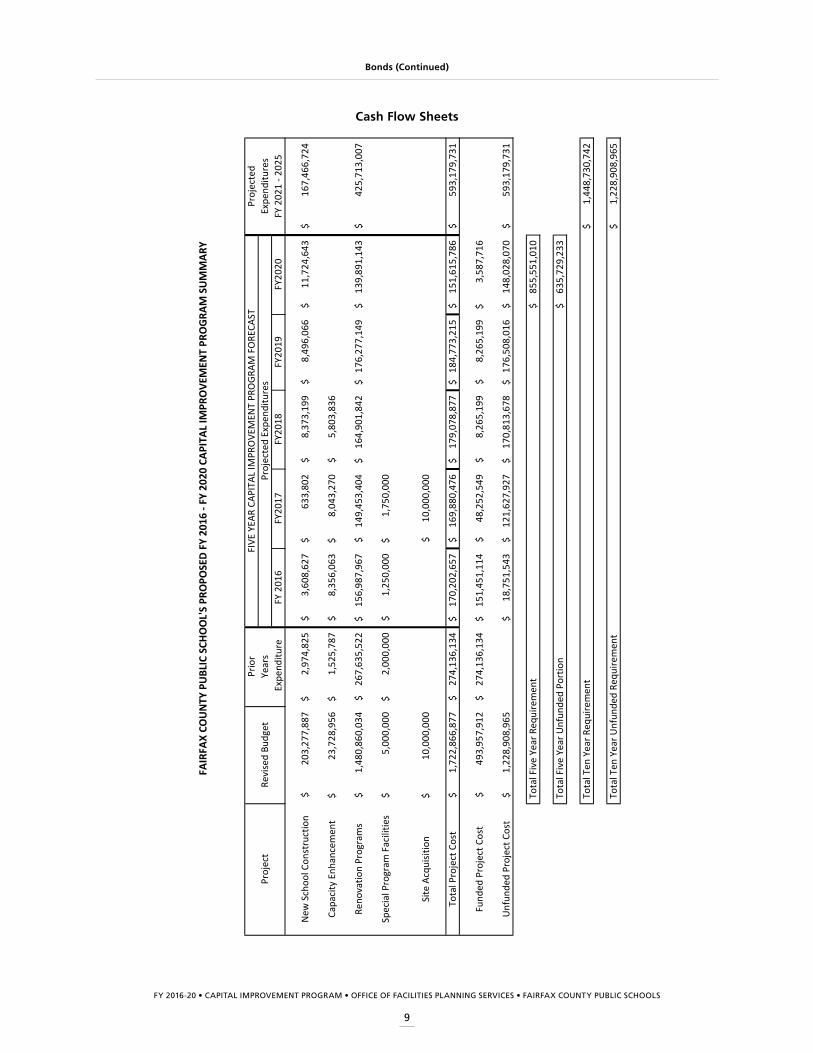
Individual project requirements for the next five years are indicated in the CIP. Annual expenditures for Fiscal Years 2016 through 2020 and needs for the ensuing five years are shown on the Cash Flow Sheet. The FY2021 through FY2025 data is provided to conform to the County’s guidance that ten years of cash flow and capital requirements be identified. It is noted that this CIP project list and supporting materials comprise a “statement of need.” Project rates of execution are constrained to reflect the County’s cash flow restriction of $155 million per year. Project costs have been updated to reflect recent rates of inflation in construction costs.
New Construction
The region summaries present summary data on student memberships and facility capacity utilizations for selected groupings of elementary, middle, high, and secondary schools. Included in the summaries are the impacts of funded projects now scheduled for construction. Also identified in the summaries are unfunded increases in instructional and support space
required to accommodate projected growth in general education, special education, and other programs. This CIP proposes funding of $203 million for construction of new school facilities to accommodate membership growth. The total five-year cost of new facilities is $33 million, of which $8 million is unfunded.
Capacity Enhancements
The school system is facing a challenging time in which student enrollment is growing and is projected to exceed available capacity. The CIP includes capacity enhancements at one elementary school and one high school. The CIP proposes funding of $24 million for capacity enhancements. The total five-year requirement for capacity enhancements is $22 million, of which $14 million is unfunded.
Renovations
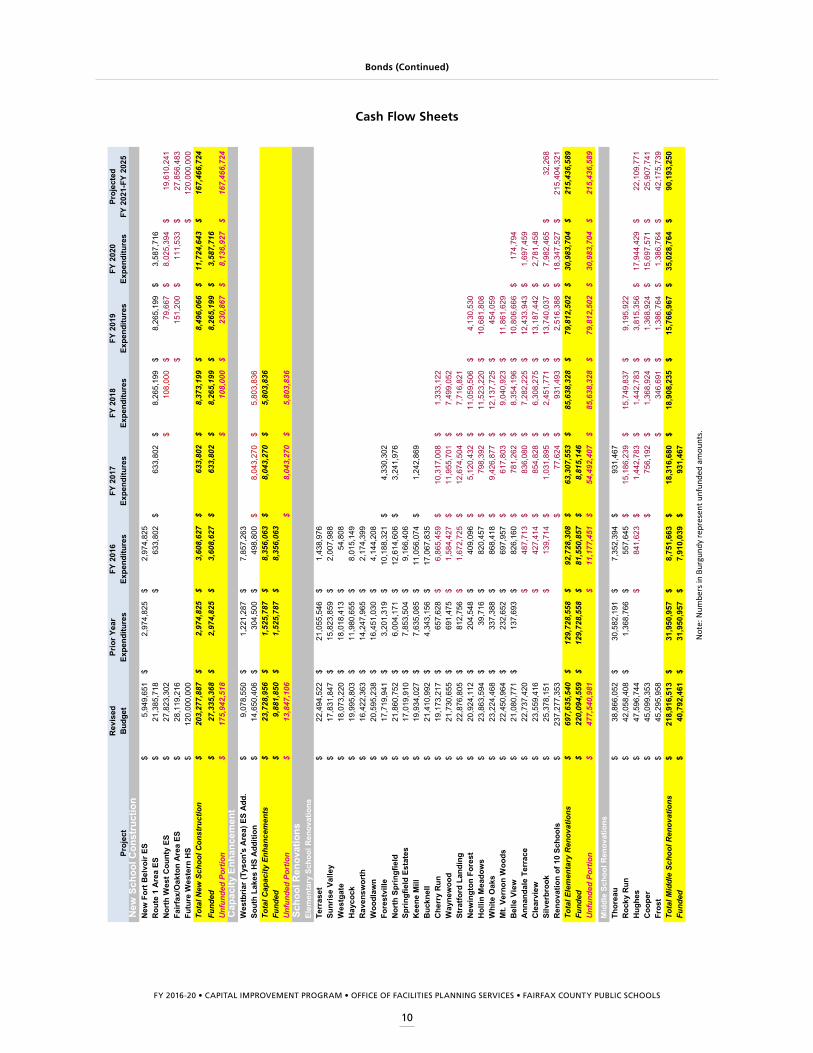
Both the usable lives of school facilities and School Board policy require renovation of buildings on 20-25 year cycles. Given the number of schools now in operation, this need implies a requirement to renovate an average of six elementary schools, one middle school, and one high school per year. This five-year CIP proposes the renovation of twenty-two elementary schools, five middle schools, and six high schools. Many of these renovations will include capacity enhancements to accommodate projected enrollment. The CIP proposes funding of $1.5 billion for renovations. The five-year cost of renovations is $788 million of which $613 million is unfunded.
The Current (Five-Year) Renovation Requirement (in millions)
Elementary Schools $352
Middle Schools $97
High Schools $339
Total $788
Special Program Facilities
The CIP includes $5 million to provide capacity enhancements at various schools to accommodate special programs such as Advanced Academic Programs and Special Education at the elementary and middle school levels. The total five-year requirement for special program facilities is $3 million, all of which is funded.

FY 2016-20 • CAPITAL IMPROVEMENT PROGRAM • OFFICE OF FACILITIES PLANNING SERVICES • FAIRFAX COUNTY PUBLIC SCHOOLS
8
Bonds (Continued)
Capital Project SummaryThe proposed FY 2016–20 Cash Flow Sheet lists CIP projects, with approved bond funding shown in black. Although this CIP project listing and its supporting materials comprise a “statement of need,” the projected rates of execution are constrained by the County’s cash-flow guidance, which currently limits expenditures to $155 million per year.
Construction Costs and Funding
Construction costs increased at an annualized rate of 6% last year, which matches historical norms for the past 20 years. The primary cause of the increase was not material increases, which are typically the primary
Capital Project Funding AllocationFY 2016-20
70%
27%
3%
Renovations
Additions
New Construction
Capital Project Funding AllocationFY 2021-25
58%
13%
29%Renovations
Additions
New Construction
Site Acquisition
The CIP proposes funding of $10 million, all of which is funded, to acquire sites for future schools.
cost driver, but a shortage of subcontractors to perform the work. The two primary factors are the recession, which has forced limitations upon the bonding capacity of the contractors and the reduction in the quantity of federal government and commercial construction projects. It should be noted that upon each project bid and at the conclusion of the fiscal year, all future project costs and trends are reevaluated, which results in the CIP cash flow reflecting the most recent cost trends.
Renovation costs are based upon staff evaluation of recently completed renovation and infrastructure replacement projects using the same escalation factors as for new construction. Both renovation and new construction cost figures include architectural, County and engineering fees, contingencies, and equipment costs. The funding requirements for individual projects shown in the CIP Cash Flow Summary chart are distributed across several fiscal years. This methodology is consistent with the presentation of capital funding requirements in the Fairfax County Capital Improvement Program.
Anticipated FY 2016-20 expenditures for the projects in this CIP total $856 million of which $220 million is funded with approved bonds and $636 million is unfunded. The average annual five-year CIP expenditure (funded and unfunded) is $171 million. Ten years of project cash-flow information has been provided at the request of the County. The first five years have been broken out as is required in the Code of Virginia capital program planning guidance to school divisions. The remaining five years of estimated need are provided as a supplement to conform to the County’s request.
It should be noted that the total cost (funded and unfunded) of projects identified in this CIP is $1.7 billion, of which $274 million is the anticipated prior year expense. Due to cash flow limits, $593 million is projected after the five-year CIP planning period.
The School Board has scheduled a public hearing on the FY 2016–20 CIP for January 6, 2015. School Board action on the proposed CIP is scheduled for January 22, 2015.
Bond Referendum Need
This CIP reflects funding approved in the November 2013 School Bond Referendum and indicates the need for a 2015 School Bond Referendum followed by additional referenda in subsequent years.
FY 2016-20 • CAPITAL IMPROVEMENT PROGRAM • OFFICE OF FACILITIES PLANNING SERVICES • FAIRFAX COUNTY PUBLIC SCHOOLS
9
FAIR
FAX
COU
NTY
PU
BLIC
SCH
OO
L'S
PRO
POSE
D FY
201
6 - F
Y 20
20 C
APIT
AL IM
PRO
VEM
ENT
PRO
GRAM
SU
MM
ARY
Prio
rPr
ojec
ted
Proj
ect
Revi
sed
Budg
etYe
ars
Expe
nditu
res
Exp
endi
ture
FY 2
016
FY20
17FY
2018
FY20
19FY
2020
FY 2
021
- 202
5
New
Sch
ool C
onst
ruct
ion
203,
277,
887
$
2,
974,
825
$
3,60
8,62
7$
63
3,80
2$
8,37
3,19
9$
8,
496,
066
$
11,7
24,6
43$
167,
466,
724
$
Capa
city
Enh
ance
men
t23
,728
,956
$
1,52
5,78
7$
8,
356,
063
$
8,04
3,27
0$
5,
803,
836
$
Reno
vatio
n Pr
ogra
ms
1,48
0,86
0,03
4$
26
7,63
5,52
2$
156,
987,
967
$
14
9,45
3,40
4$
164,
901,
842
$
17
6,27
7,14
9$
13
9,89
1,14
3$
425,
713,
007
$
Spec
ial P
rogr
am F
acili
ties
5,00
0,00
0$
2,00
0,00
0$
1,
250,
000
$
1,75
0,00
0$
Site
Acq
uisit
ion
10,0
00,0
00$
10
,000
,000
$
Tota
l Pro
ject
Cos
t1,
722,
866,
877
$
274,
136,
134
$
17
0,20
2,65
7$
169,
880,
476
$
17
9,07
8,87
7$
184,
773,
215
$
151,
615,
786
$
59
3,17
9,73
1$
Fund
ed P
roje
ct C
ost
493,
957,
912
$
27
4,13
6,13
4$
151,
451,
114
$
48
,252
,549
$
8,
265,
199
$
8,26
5,19
9$
3,
587,
716
$
Unf
unde
d Pr
ojec
t Cos
t1,
228,
908,
965
$
18,7
51,5
43$
121,
627,
927
$
17
0,81
3,67
8$
176,
508,
016
$
148,
028,
070
$
59
3,17
9,73
1$
Tota
l Fiv
e Ye
ar R
equi
rem
ent
855,
551,
010
$
Tota
l Fiv
e Ye
ar U
nfun
ded
Port
ion
635,
729,
233
$
Tota
l Ten
Yea
r Req
uire
men
t1,
448,
730,
742
$
Tota
l Ten
Yea
r Unf
unde
d Re
quire
men
t1,
228,
908,
965
$
FIVE
YEA
R CA
PITA
L IM
PRO
VEM
ENT
PRO
GRAM
FO
RECA
STPr
ojec
ted
Expe
nditu
res
Bonds (Continued)
Cash Flow Sheets
FY 2016-20 • CAPITAL IMPROVEMENT PROGRAM • OFFICE OF FACILITIES PLANNING SERVICES • FAIRFAX COUNTY PUBLIC SCHOOLS
10
Rev
ised
Prio
r Yea
rFY
201
6FY
201
7FY
201
8FY
201
9FY
202
0Pr
ojec
ted
Proj
ect
Bud
get
Expe
nditu
res
Expe
nditu
res
Expe
nditu
res
Expe
nditu
res
Expe
nditu
res
Expe
nditu
res
FY 2
021-
FY 2
025
New
Sch
ool C
onst
ruct
ion
New
For
t Bel
voir
ES
5,94
9,65
1$
2,97
4,82
5$
2,
974,
825
$
R
oute
1 A
rea
ES21
,385
,718
$
633,
802
$
633,
802
$
8,
265,
199
$
8,
265,
199
$
3,
587,
716
$
Nor
th W
est C
ount
y ES
27,8
23,3
02$
10
8,00
0$
79
,667
$
8,
025,
394
$
19,6
10,2
41$
Fairf
ax/O
akto
n A
rea
ES28
,119
,216
$
151,
200
$
111,
533
$
27
,856
,483
$
Fu
ture
Wes
tern
HS
120,
000,
000
$
120,
000,
000
$
To
tal N
ew S
choo
l Con
stru
ctio
n20
3,27
7,88
7$
2,97
4,82
5$
3,
608,
627
$
63
3,80
2$
8,37
3,19
9$
8,49
6,06
6$
11,7
24,6
43$
167,
466,
724
$
Fu
nded
27,3
35,3
68$
2,
974,
825
$
3,60
8,62
7$
633,
802
$
8,
265,
199
$
8,
265,
199
$
3,
587,
716
$
U
nfun
ded
Port
ion
175,
942,
518
$
10
8,00
0$
23
0,86
7$
8,
136,
927
$
16
7,46
6,72
4$
Cap
acity
Enh
ance
men
tW
estb
riar (
Tyso
n's
Are
a) E
S A
dd.
9,07
8,55
0$
1,22
1,28
7$
7,
857,
263
$
So
uth
Lake
s H
S A
dditi
on14
,650
,406
$
304,
500
$
49
8,80
0$
8,
043,
270
$
5,80
3,83
6$
Tota
l Cap
acity
Enh
ance
men
ts23
,728
,956
$
1,52
5,78
7$
8,
356,
063
$
8,
043,
270
$
5,80
3,83
6$
Fund
ed9,
881,
850
$
1,
525,
787
$
8,35
6,06
3$
Unf
unde
d Po
rtio
n13
,847
,106
$
8,04
3,27
0$
5,
803,
836
$
Sc
hool
Ren
ovat
ions
Elem
enta
ry S
choo
l Ren
ovat
ions
Terr
aset
22
,494
,522
$
21,0
55,5
46$
1,
438,
976
$
Su
nris
e Va
lley
17,8
31,8
47$
15
,823
,859
$
2,00
7,98
8$
Wes
tgat
e 18
,073
,220
$
18,0
18,4
13$
54
,808
$
H
ayco
ck19
,995
,803
$
11,9
80,6
55$
8,
015,
149
$
R
aven
swor
th16
,422
,363
$
14,2
47,9
65$
2,
174,
399
$
W
oodl
awn
20,5
95,2
38$
16
,451
,030
$
4,14
4,20
8$
Fore
stvi
lle17
,719
,941
$
3,20
1,31
9$
10
,188
,321
$
4,
330,
302
$
Nor
th S
prin
gfie
ld21
,860
,752
$
6,00
4,17
1$
12
,614
,606
$
3,
241,
976
$
Sprin
gfie
ld E
stat
es17
,019
,910
$
7,85
3,50
4$
9,
166,
406
$
K
eene
Mill
19,9
34,0
27$
7,
635,
085
$
11,0
56,0
74$
1,24
2,86
9$
B
uckn
ell
21,4
10,9
92$
4,
343,
156
$
17,0
67,8
35$
Che
rry
Run
19,1
73,2
17$
65
7,62
8$
6,86
5,45
9$
10,3
17,0
08$
1,
333,
122
$
W
ayne
woo
d21
,730
,655
$
691,
475
$
1,
584,
427
$
11
,955
,701
$
7,49
9,05
2$
Stra
tford
Lan
ding
22,8
76,8
05$
81
2,75
6$
1,67
2,72
5$
12,6
74,5
04$
7,
716,
821
$
N
ewin
gton
For
est
20,9
24,1
12$
20
4,54
8$
409,
096
$
5,12
0,43
2$
11
,059
,506
$
4,
130,
530
$
H
ollin
Mea
dow
s23
,863
,594
$
39,7
16$
82
0,45
7$
79
8,39
2$
11,5
23,2
20$
10,6
81,8
08$
Whi
te O
aks
23,2
24,4
68$
33
7,38
8$
868,
418
$
9,42
6,87
7$
12
,137
,725
$
45
4,05
9$
M
t. Ve
rnon
Woo
ds22
,450
,964
$
232,
652
$
69
7,95
7$
61
7,80
3$
9,04
0,92
3$
11,8
61,6
29$
Bel
le V
iew
21,0
80,7
71$
13
7,69
3$
826,
160
$
781,
262
$
8,
354,
196
$
10
,806
,666
$
17
4,79
4$
Ann
anda
le T
erra
ce22
,737
,420
$
487,
713
$
836,
080
$
7,
282,
225
$
12
,433
,943
$
1,
697,
459
$
Cle
arvi
ew23
,559
,416
$
427,
414
$
854,
828
$
6,
308,
275
$
13
,187
,442
$
2,
781,
458
$
Silv
erbr
ook
25,3
78,1
51$
13
9,71
4$
1,
031,
895
$
2,45
1,77
1$
13,7
40,0
37$
7,98
2,46
5$
32
,268
$
Ren
ovat
ion
of 1
0 Sc
hool
s23
7,27
7,35
3$
77
,624
$
931,
493
$
2,51
6,38
8$
18,3
47,5
27$
215,
404,
321
$
To
tal E
lem
enta
ry R
enov
atio
ns69
7,63
5,54
0$
129,
728,
558
$
92
,728
,308
$
63,3
07,5
53$
85,6
38,3
28$
79
,812
,502
$
30,9
83,7
04$
215,
436,
589
$
Fu
nded
220,
094,
559
$
12
9,72
8,55
8$
81,5
50,8
57$
8,
815,
146
$
Unf
unde
d Po
rtio
n47
7,54
0,98
1$
11,1
77,4
51$
54
,492
,407
$
85
,638
,328
$
79,8
12,5
02$
30
,983
,704
$
21
5,43
6,58
9$
Mid
dle
Scho
ol R
enov
atio
nsTh
orea
u 38
,866
,052
$
30,5
82,1
91$
7,
352,
394
$
93
1,46
7$
Roc
ky R
un42
,058
,408
$
1,36
8,76
6$
55
7,64
5$
15
,186
,239
$
15,7
49,8
37$
9,19
5,92
2$
Hug
hes
47,5
96,7
44$
84
1,62
3$
1,
442,
783
$
1,44
2,78
3$
3,81
5,35
6$
17,9
44,4
29$
22,1
09,7
71$
Coo
per
45,0
99,3
53$
75
6,19
2$
1,36
8,92
4$
1,36
8,92
4$
15,6
97,5
71$
25,9
07,7
41$
Fros
t45
,295
,958
$
346,
691
$
1,38
6,76
4$
1,38
6,76
4$
42
,175
,739
$
To
tal M
iddl
e Sc
hool
Ren
ovat
ions
218,
916,
513
$
31,9
50,9
57$
8,
751,
663
$
18
,316
,680
$
18,9
08,2
35$
15,7
66,9
67$
35,0
28,7
64$
90,1
93,2
50$
Fund
ed40
,792
,461
$
31,9
50,9
57$
7,
910,
039
$
93
1,46
7$
Not
e: N
umbe
rs in
Bur
gund
y re
pres
ent u
nfun
ded
amou
nts.
Bonds (Continued)
Cash Flow Sheets

FY 2016-20 • CAPITAL IMPROVEMENT PROGRAM • OFFICE OF FACILITIES PLANNING SERVICES • FAIRFAX COUNTY PUBLIC SCHOOLS
11
Rev
ised
Prio
r Yea
rFY
201
6FY
201
7FY
201
8FY
201
9FY
202
0Pr
ojec
ted
Proj
ect
Bud
get
Expe
nditu
res
Expe
nditu
res
Expe
nditu
res
Expe
nditu
res
Expe
nditu
res
Expe
nditu
res
FY 2
021-
FY 2
025
Unf
unde
d Po
rtio
n17
8,12
4,05
3$
84
1,62
3$
17
,385
,214
$
18,9
08,2
35$
15,7
66,9
67$
35,0
28,7
64$
90,1
93,2
50$
Hig
h Sc
hool
Ren
ovat
ions
Jeffe
rson
89,5
00,0
65$
70
,707
,883
$
18,7
92,1
82$
Lang
ley
78,1
06,1
57$
26
,697
,577
$
26,6
67,1
36$
24,7
41,4
43$
W
est S
prin
gfie
ld
91,2
78,2
64$
4,
270,
003
$
6,73
2,46
9$
38,7
09,4
39$
22
,521
,814
$
19
,044
,539
$
H
ernd
on10
2,13
9,91
8$
2,
617,
477
$
1,65
3,14
3$
2,99
7,59
8$
23
,325
,920
$
30
,064
,906
$
41
,480
,874
$
O
akto
n10
1,52
3,29
9$
1,
663,
066
$
1,66
3,06
6$
1,38
0,69
1$
12
,883
,476
$
28
,662
,156
$
29
,471
,723
$
25
,799
,121
$
Fa
lls C
hurc
h10
1,76
0,27
1$
1,
624,
069
$
2,
926,
078
$
2,
926,
078
$
94,2
84,0
47$
Tota
l Hig
h Sc
hool
Ren
ovat
ions
564,
307,
974
$
105,
956,
006
$
55
,507
,997
$
67
,829
,171
$
60,3
55,2
79$
80,6
97,6
80$
73,8
78,6
75$
120,
083,
168
$
Fu
nded
180,
853,
667
$
105,
956,
006
$
48
,775
,528
$
26
,122
,134
$
Unf
unde
d Po
rtio
n38
3,45
4,30
7$
6,
732,
469
$
41
,707
,037
$
60,3
55,2
79$
80,6
97,6
80$
73,8
78,6
75$
120,
083,
168
$
Tota
l Ren
ovat
ions
(All
Scho
ols)
1,48
0,86
0,03
4$
267,
635,
522
$
15
6,98
7,96
7$
14
9,45
3,40
4$
164,
901,
842
$
176,
277,
149
$
139,
891,
143
$
425,
713,
007
$
Fu
nded
441,
740,
693
$
267,
635,
522
$
13
8,23
6,42
4$
35
,868
,747
$
Unf
unde
d Po
rtio
n1,
039,
119,
341
$
18
,751
,543
$
11
3,58
4,65
7$
164,
901,
842
$
176,
277,
149
$
139,
891,
143
$
425,
713,
007
$
Spec
ial P
rogr
am F
acili
ties
Inte
rior M
odifi
catio
ns fo
r Cap
acity
5,00
0,00
0$
2,00
0,00
0$
1,
250,
000
$
1,
750,
000
$
Tota
l Spe
cial
Pro
gram
s5,
000,
000
$
2,
000,
000
$
1,25
0,00
0$
1,75
0,00
0$
U
nfun
ded
Port
ion
Site
Acq
uisi
tion
Futu
re H
igh
Scho
ol S
ite10
,000
,000
$
10,0
00,0
00$
To
tal S
ite A
cqui
sitio
n10
,000
,000
$
10,0
00,0
00$
U
nfun
ded
Port
ion
Tota
l Pro
ject
Cos
t1,
722,
866,
877
$
27
4,13
6,13
4$
170,
202,
657
$
169,
880,
476
$
17
9,07
8,87
7$
18
4,77
3,21
5$
15
1,61
5,78
6$
59
3,17
9,73
1$
Fund
ed P
ortio
n49
3,95
7,91
2$
27
4,13
6,13
4$
151,
451,
114
$
48,2
52,5
49$
8,
265,
199
$
8,
265,
199
$
3,
587,
716
$
Unf
unde
d Po
rtio
n1,
228,
908,
965
$
18
,751
,543
$
12
1,62
7,92
7$
170,
813,
678
$
176,
508,
016
$
148,
028,
070
$
593,
179,
731
$
Not
e: N
umbe
rs in
Bur
gund
y re
pres
ent u
nfun
ded
amou
nts.
Bonds (Continued)
Cash Flow Sheets
FY 2016-20 • CAPITAL IMPROVEMENT PROGRAM • OFFICE OF FACILITIES PLANNING SERVICES • FAIRFAX COUNTY PUBLIC SCHOOLS
12
Proffer Contribution Update
The School Public Facilities Impact Formula and the related implementation of Public Facilities Residential Development Criterion became effective on January 7, 2003. Since that time, the development review process for residential rezoning applications has included an assessment of the impacts of new residential development on public school facilities; typically including a recommended monetary proffer contribution to mitigate such impacts.
Pursuant to the implementation of the Public Facilities Criterion, regular updates are provided in order to reflect changes in student yield ratios by unit type and changes in capital construction costs. Using the adopted methodology, the suggested per student monetary proffer contribution as of December 1, 2014, is $11,749.
While the suggested per student proffer contribution changes from year to year, FCPS recommended, as part of the proffer contribution, an escalation clause be included. The escalation clause recommends that the greater of the two per-student proffer contributions–either the contribution amount at the time of the development review or the contribution amount at the time the proffer is triggered – be applied. The escalation clause is requested given that development review for residential rezoning applications are being submitted now but actual construction and occupancy may not occur for several years. Thus, it is likely that the proffer contribution will increase given that the proffer formula is tied, in part, to construction costs.
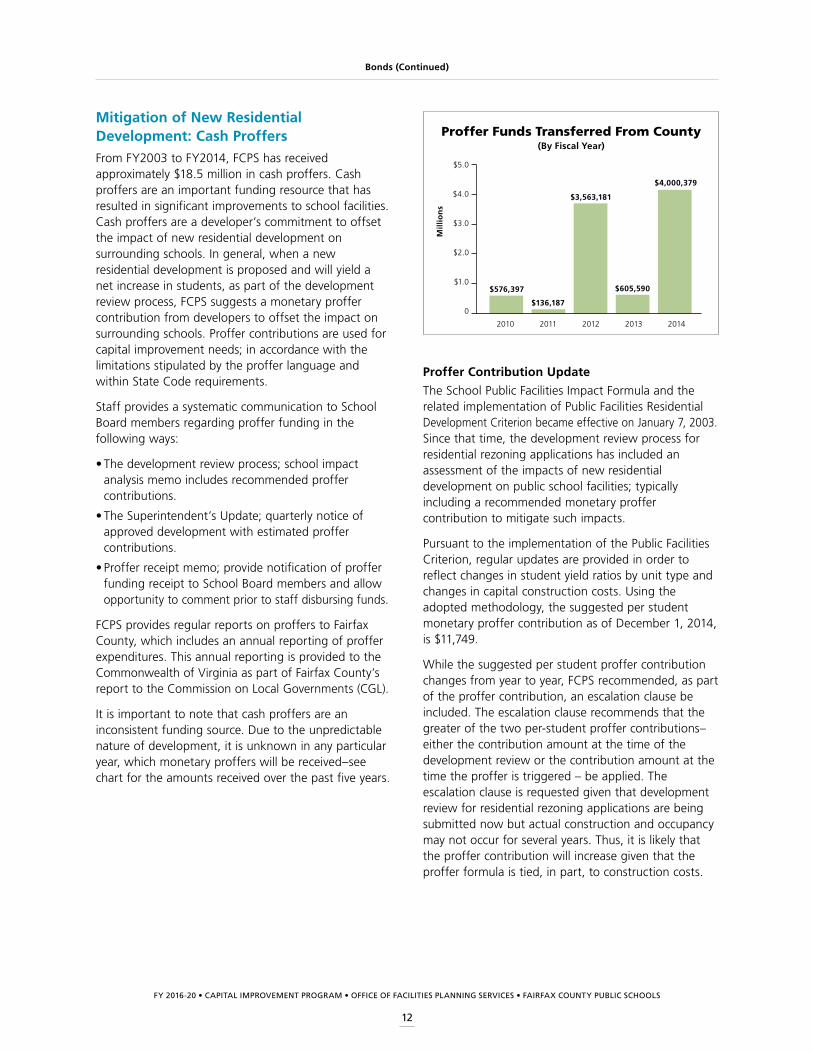
Mitigation of New Residential Development: Cash ProffersFrom FY2003 to FY2014, FCPS has received approximately $18.5 million in cash proffers. Cash proffers are an important funding resource that has resulted in significant improvements to school facilities. Cash proffers are a developer’s commitment to offset the impact of new residential development on surrounding schools. In general, when a new residential development is proposed and will yield a net increase in students, as part of the development review process, FCPS suggests a monetary proffer contribution from developers to offset the impact on surrounding schools. Proffer contributions are used for capital improvement needs; in accordance with the limitations stipulated by the proffer language and within State Code requirements.
Staff provides a systematic communication to School Board members regarding proffer funding in the following ways:
• The development review process; school impact analysis memo includes recommended proffer contributions.
• The Superintendent’s Update; quarterly notice of approved development with estimated proffer contributions.
• Proffer receipt memo; provide notification of proffer funding receipt to School Board members and allow opportunity to comment prior to staff disbursing funds.
FCPS provides regular reports on proffers to Fairfax County, which includes an annual reporting of proffer expenditures. This annual reporting is provided to the Commonwealth of Virginia as part of Fairfax County’s report to the Commission on Local Governments (CGL).
It is important to note that cash proffers are an inconsistent funding source. Due to the unpredictable nature of development, it is unknown in any particular year, which monetary proffers will be received–see chart for the amounts received over the past five years.
Bonds (Continued)
Proffer Funds Transferred From County(By Fiscal Year)
2010
Mil
lio
ns
2011 2012 2013 2014
$5.0
$4.0
$3.0
$2.0
$1.0
0
$576,397
$3,563,181
$605,590
$4,000,379
$136,187
FY 2016-20 • CAPITAL IMPROVEMENT PROGRAM • OFFICE OF FACILITIES PLANNING SERVICES • FAIRFAX COUNTY PUBLIC SCHOOLS
13
Step 1: In developing enrollment projections, recent and historical enrollment patterns at each school and districtwide are considered, as well as births, local and regional economic conditions, new housing forecasts, and other factors. The Office of Facilities Planning Services develops enrollment projections in March of each year for the following six school years. School years two through six of the six-year enrollment projection set comprise the enrollment projections horizon for the CIP. At the same time, current program needs and the resulting school capacity surplus or deficit of school facilities are established.
Step 2: Projected enrollments and capacities are compared. Capacity shortages and surpluses are identified.
Step 3: Recommended solutions to the capacity imbalances are developed and evaluated.
The following section describes how these projections and analyses are formulated. Outcomes are summarized for the current-year planning cycle.
BackgroundEach year, FCPS develops a five-year Capital Improvement Program (CIP) to address future facility needs. The CIP assesses requirements for new facilities, renovation of existing facilities, and other facility-related needs. The list of capital projects resulting from this assessment provides a clear statement of school facility requirements. Actual completion dates for CIP projects depend on cash flow and debt service limitations established by the Fairfax County Board of Supervisors.
The Office of Facilities Planning Services has begun to develop a comprehensive planning process to guide future facility needs and their inclusion within the CIP, among other future purposes. Presently, FCPS uses the following steps each year to aid in identifying future student accommodation needs and in recommending the best ways to address these needs. Given the limitations in the current budget and possibly future years’ budgets, along with the urgency to address significant and continuing capacity deficits at schools throughout the county, the focus of capital spending is directed to capacity enhancement for schools that are likely to experience continued pressures from high enrollments.
Projections
1995 2000 2005 2015 2020 2025 20302010 20132012
Actual
Projected
969,700
879,400
1,033,600
1,109,700 1,111,600 1,120,600
1,262,2001,216,100
1,166,000
1,081,700
600,000
800,000
1,000,000
1,200,000
1,400,000
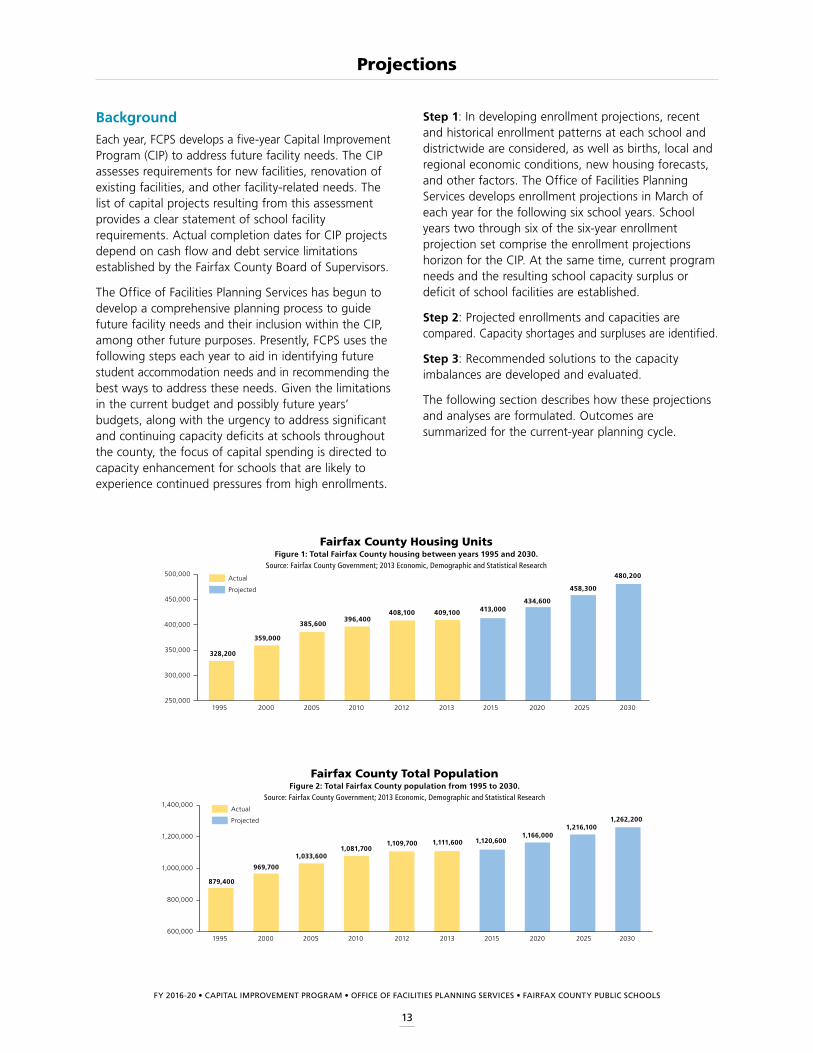
Fairfax County Total PopulationFigure 2: Total Fairfax County population from 1995 to 2030.
Source: Fairfax County Government; 2013 Economic, Demographic and Statistical Research
1995
328,200
2000 2005 2015 2020 2025 20302010
359,000
385,600
434,600
408,100 409,100
458,300
480,200
396,400
Actual
Projected
250,000
300,000
350,000
400,000
500,000
450,000
2012 2013
413,000
Fairfax County Housing UnitsFigure 1: Total Fairfax County housing between years 1995 and 2030.
Source: Fairfax County Government; 2013 Economic, Demographic and Statistical Research
FY 2016-20 • CAPITAL IMPROVEMENT PROGRAM • OFFICE OF FACILITIES PLANNING SERVICES • FAIRFAX COUNTY PUBLIC SCHOOLS
14
These data are reviewed in each attendance area to determine whether students from new (forecast) housing are included as part of school enrollment projections, and if so, by how many students and in which projected school year(s). To estimate the number of students generated from forecast new development over the six-year horizon, student yield (generation) rates are calculated from IPLS’s current housing stock, by type of housing, and through ratios calculated by matching students to housing. The appropriate yield rates are then applied, as appropriate, to forecast housing units within each attendance area by housing type.
In addition, the City of Fairfax Planning Office has begun to provide data about forecast housing units to FCPS. Those data are likewise evaluated to determine whether students should be included, how many, and in which projection years.
Student populations, including Advanced Academic Programs (formerly Gifted and Talented), Special Education (level 2 or self-contained), FECEP/Head Start, Preschool Resource, Alternative High Schools and Alternative Court Programs, among other programs, are projected by specialists. These student population projections are included and shown either by school or within total projected membership, as appropriate.
Projection ProcessFCPS enrollment projections are developed in a bottom-up fashion for general education students, beginning with elementary, then middle, and finally high schools. Projections of Kindergarten students are based on historical relationships between Kindergarten memberships and births (five years prior) of Fairfax County and City residents by attendance area. Each cohort is then aged through successive grades based on selected historical ratios or averages of those ratios, school by school. Projections may be modified, as necessary, to take into account other factors such as new housing completions.
New housing data forecasts are considered with each projection effort. The number of additional students attributed to new housing decreased during the recent economic downturn as fewer houses were completed. As the County and City have approached build-out, less land is available and greater housing density is being planned. Fewer students are generated (yielded) from mid- and high-rise residential housing than from lower density housing. Most student growth within FCPS in recent years has resulted from larger families and less from new housing. To reasonably account for forecast new housing each year, data from Fairfax County’s IPLS (Integrated Parcel Life Cycle System) are extracted. These data provide FCPS staff with the location and number of current housing units, as well as forecasted housing units, anticipated by the County.
PROJECTIONS (Continued)

FY 2016-20 • CAPITAL IMPROVEMENT PROGRAM • OFFICE OF FACILITIES PLANNING SERVICES • FAIRFAX COUNTY PUBLIC SCHOOLS
15
PROJECTIONS (Continued)
2005-06 2008-092007-082006-07
1,468
2013-14
856 738
1,119
-453 -326
2,692
2009-10
1,333
2010-11 2011-12 2012-13 2014-15
1,057
2015-16
1,3511,173
2016-17 2017-18
1,529
1,960
1,450
HistoricalProjected
500
1,000
1,500
2,000
2,500
0
-500
-1,000
3,000
3,500
2018-19 2019-20
1,236
School Year
Net K-12 Student In-Migration to FCPSFigure 3
2013-14 2014-152008-09 2009-10 2010-11 2012-132011-12
185,611
2015-16
189,146
2016-17
191,543
2017-18
195,910193,748
172,110168,777
174,473177,711
180,664
Historical
Projected
183,576
150,000
160,000
170,000
200,000
190,000
180,000
197,707
2018-19 2019-20School Year
Historical and Projected MembershipFigure 4: Total enrollment historical and projected through 2019-20.
1975-76
8,707
10,610
1985-86
10,114
1990-91
9,295 9,023
1995-96
10,197
8,592
2000-01
10,391 9,896
2010-11
12,22111,463
2019-20
12,732 12,765
Kindergarten: Historical
12th Grade: Historical
Kindergarten: Projected
12th Grade: Projected
7,984
0
2,000
4,000
6,000
8,000
10,000
12,000
14,000
School Year
Comparison of Kindergarten and 12th Grade MembershipFigure 5: Kindergarten and 12th grade membership.
FY 2016-20 • CAPITAL IMPROVEMENT PROGRAM • OFFICE OF FACILITIES PLANNING SERVICES • FAIRFAX COUNTY PUBLIC SCHOOLS
16
PROJECTIONS (Continued)
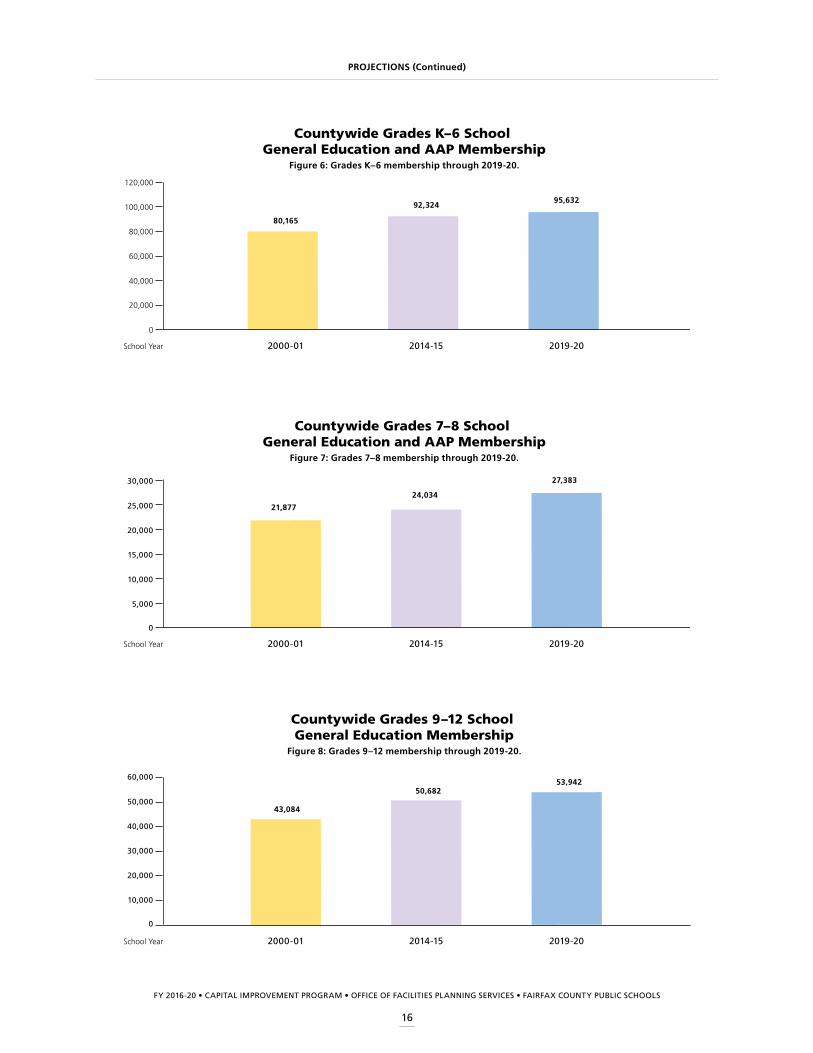
Countywide Grades K–6 School General Education and AAP Membership
Figure 6: Grades K–6 membership through 2019-20.
2000-01
80,165
92,324
2014-15
95,632
2019-20
0
20,000
40,000
60,000
80,000
100,000
120,000
School Year
2000-01
21,877
24,034
2014-15
27,383
2019-20School Year
Countywide Grades 7–8 School General Education and AAP Membership
Figure 7: Grades 7–8 membership through 2019-20.
2000-01
43,084
50,682
2014-15
53,942
2019-20School Year
10,000
20,000
30,000
40,000
50,000
60,000
0
Countywide Grades 9–12 School General Education Membership
Figure 8: Grades 9–12 membership through 2019-20.
FY 2016-20 • CAPITAL IMPROVEMENT PROGRAM • OFFICE OF FACILITIES PLANNING SERVICES • FAIRFAX COUNTY PUBLIC SCHOOLS
17
PROJECTIONS (Continued)
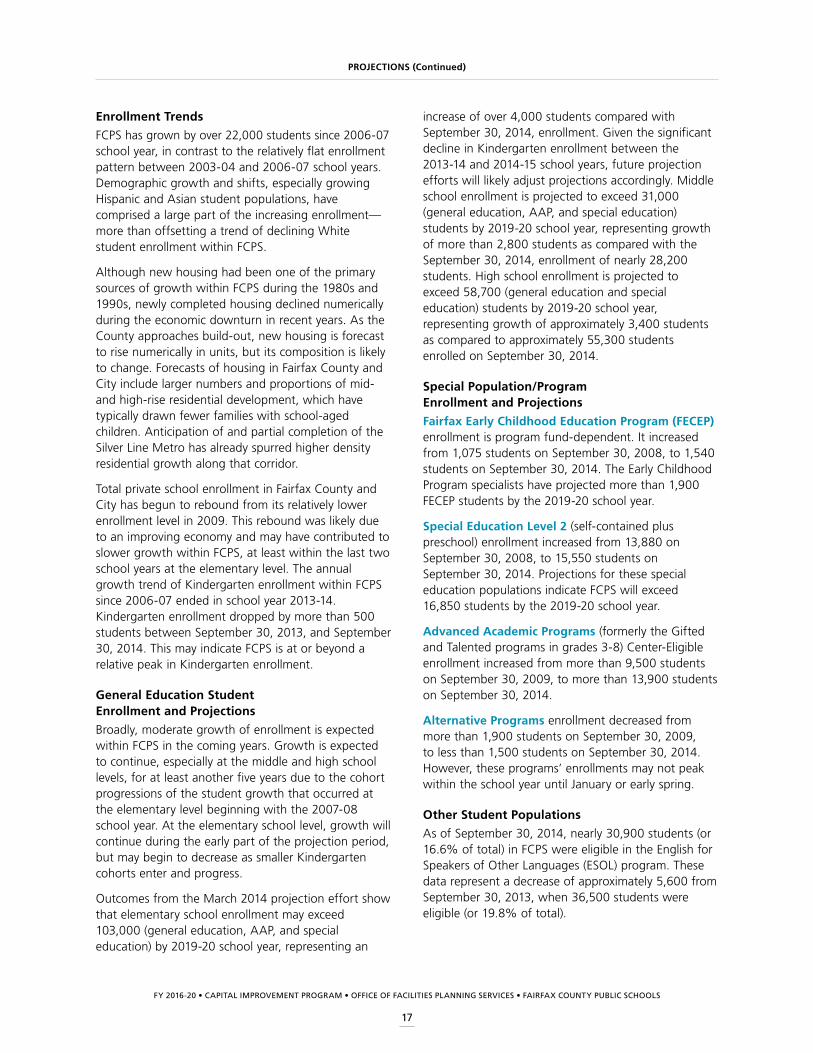
increase of over 4,000 students compared with September 30, 2014, enrollment. Given the significant decline in Kindergarten enrollment between the 2013-14 and 2014-15 school years, future projection efforts will likely adjust projections accordingly. Middle school enrollment is projected to exceed 31,000 (general education, AAP, and special education) students by 2019-20 school year, representing growth of more than 2,800 students as compared with the September 30, 2014, enrollment of nearly 28,200 students. High school enrollment is projected to exceed 58,700 (general education and special education) students by 2019-20 school year, representing growth of approximately 3,400 students as compared to approximately 55,300 students enrolled on September 30, 2014.
Special Population/Program Enrollment and Projections
Fairfax Early Childhood Education Program (FECEP) enrollment is program fund-dependent. It increased from 1,075 students on September 30, 2008, to 1,540 students on September 30, 2014. The Early Childhood Program specialists have projected more than 1,900 FECEP students by the 2019-20 school year.
Special Education Level 2 (self-contained plus preschool) enrollment increased from 13,880 on September 30, 2008, to 15,550 students on September 30, 2014. Projections for these special education populations indicate FCPS will exceed 16,850 students by the 2019-20 school year.
Advanced Academic Programs (formerly the Gifted and Talented programs in grades 3-8) Center-Eligible enrollment increased from more than 9,500 students on September 30, 2009, to more than 13,900 students on September 30, 2014.
Alternative Programs enrollment decreased from more than 1,900 students on September 30, 2009, to less than 1,500 students on September 30, 2014. However, these programs’ enrollments may not peak within the school year until January or early spring.
Other Student Populations
As of September 30, 2014, nearly 30,900 students (or 16.6% of total) in FCPS were eligible in the English for Speakers of Other Languages (ESOL) program. These data represent a decrease of approximately 5,600 from September 30, 2013, when 36,500 students were eligible (or 19.8% of total).
Enrollment Trends
FCPS has grown by over 22,000 students since 2006-07 school year, in contrast to the relatively flat enrollment pattern between 2003-04 and 2006-07 school years. Demographic growth and shifts, especially growing Hispanic and Asian student populations, have comprised a large part of the increasing enrollment—more than offsetting a trend of declining White student enrollment within FCPS.
Although new housing had been one of the primary sources of growth within FCPS during the 1980s and 1990s, newly completed housing declined numerically during the economic downturn in recent years. As the County approaches build-out, new housing is forecast to rise numerically in units, but its composition is likely to change. Forecasts of housing in Fairfax County and City include larger numbers and proportions of mid- and high-rise residential development, which have typically drawn fewer families with school-aged children. Anticipation of and partial completion of the Silver Line Metro has already spurred higher density residential growth along that corridor.
Total private school enrollment in Fairfax County and City has begun to rebound from its relatively lower enrollment level in 2009. This rebound was likely due to an improving economy and may have contributed to slower growth within FCPS, at least within the last two school years at the elementary level. The annual growth trend of Kindergarten enrollment within FCPS since 2006-07 ended in school year 2013-14. Kindergarten enrollment dropped by more than 500 students between September 30, 2013, and September 30, 2014. This may indicate FCPS is at or beyond a relative peak in Kindergarten enrollment.
General Education Student Enrollment and Projections
Broadly, moderate growth of enrollment is expected within FCPS in the coming years. Growth is expected to continue, especially at the middle and high school levels, for at least another five years due to the cohort progressions of the student growth that occurred at the elementary level beginning with the 2007-08 school year. At the elementary school level, growth will continue during the early part of the projection period, but may begin to decrease as smaller Kindergarten cohorts enter and progress.
Outcomes from the March 2014 projection effort show that elementary school enrollment may exceed 103,000 (general education, AAP, and special education) by 2019-20 school year, representing an

FY 2016-20 • CAPITAL IMPROVEMENT PROGRAM • OFFICE OF FACILITIES PLANNING SERVICES • FAIRFAX COUNTY PUBLIC SCHOOLS
18
considerably over time and represented 19.4% of total students in 2014 compared with 18.8% in 2009 and 17.2% in 2004. The percentage of Black students was 10.2% in 2014, compared with 10.4% in 2009 and 10.7% in 2004. All together, the growth in Hispanic and Asian minorities has offset the long-term decline in White student population within FCPS. In September 2014, the percentage of students identified as being Two or More Races was 5.0% compared with (previously defined as Multiracial) 5.9% in 2009 and 4.5% in 2004. Two groups, American Indian and Alaska Natives, together with Native Hawaiians, together comprised 0.3% of student population in 2014 compared with 0.3% (American Indian and Alaskan Natives only) in 2009, as well as 2004.
PROJECTIONS (Continued)
Additionally, as of September 30, 2014, nearly 58,500 students (or 31.4% of total) were found to be eligible for the Free and Reduced-Price Meals (FRM) program. Those data represent an increase of approximately 7,800 eligible students from September 30, 2013, when 50,700 students were eligible (or 27.5% of total).
Students reported as White (non-Hispanic White) comprised 40.4% of total students in September 2014, as compared with 45.3% in September 2009 and 51.4% in 2004. The percentage of students of Hispanic/Latino ethnicity has been the fastest growing population in FCPS and represented 24.6% of total students in 2014, compared with 18.8% in 2009 and 15.5% in 2004. The percentage of Asian students (previously defined as Asian/Pacific Islander) grew
FECEP: Historical
Special Education: Historical
1995-96 2000-01 2005-06 2010-11 2019-20
806 814 872 1,096
11,907
14,497
7,725
10,043
1,913
16,858FECEP: Projected
Special Education: Projected
Note: School years 2010-11 and 2019-20 special education totals include preschool resource students.
0
2,000
4,000
6,000
8,000
10,000
12,000
14,000
18,000
16,000
School Year
Historical and Projected FECEP and Special Education MembershipsFigure 9: Special Education and FECEP through school year 2019-20.
5.0%Two
or More
10.2%Black
0.1%Hawaiian/Pacific Islander
24.6%Hispanic/
Latino
40.4%White
19.4%Asian
0.3%American
Indian/Alaskan
*U.S. Department of Education and local reporting categories.
2014-15 School Year Percentage of Ethnic Membership*Figure 10: Percent by race/ethnicity.

FY 2016-20 • CAPITAL IMPROVEMENT PROGRAM • OFFICE OF FACILITIES PLANNING SERVICES • FAIRFAX COUNTY PUBLIC SCHOOLS
19
Rezonings are often a key first step in the development process for new housing. Upon rezoning approval, additional plan and permit approvals are needed before construction can begin. It is common for a site with an approved rezoning to take several months, or even years, to begin the plan and permit process.
3. Each year, data from Fairfax County IPLS (Integrated Parcel Life Cycle System) provides the FCPS Planning Office with the location and number of current housing units, as well as forecasted housing units, projected by the County. These data are reviewed to determine whether students from new (forecast) housing should be included as part of school enrollment projections in every attendance area, and if so, by how many students and in which projected school years.
Enrollment Impact from New Housing: Residential Development Monitoring FCPS monitors new residential development as part of the following processes:
1. Development Review-Comprehensive Plan/Planning Study Review
2. Development Review-Rezoning Review/Proffer Process
3. Enrollment Projections
These steps are further detailed below.
1. During the Comprehensive Plan/Planning Study Review process, FCPS staff works with the County to determine the impact planned new housing would have on school facilities. In addition to the estimated student yields from the planned housing, recommendations for future school facilities needs are provided to County staff. Formal school impact analysis memos are sent to the County’s Department of Planning and Zoning. These are also distributed to the appropriate school principals, regional offices, and School Board members.
The Office of Facilities Planning Services works with the County’s Department of Planning and Zoning and other County agencies in long range planning initiatives. Recent planning studies which have been undertaken include those related to metro rail expansion in areas such as: Tysons Corner, Reston and the Route 28 corridor, as well as redevelopment efforts in areas such as: Bailey’s Crossroads, Seven Corners, Springfield Mall, and Richmond Highway. It is important to note these studies are often the first step for planned new housing and are typically designed with long-term planning horizons.
2. As part of the Rezoning Review process, the FCPS Office of Facilities Planning Services works with the County to determine the impact proposed new housing would have on school facilities. Recommendations for monetary proffers and/or school facilities needs are provided to County staff. Formal school impact analysis memos are sent to the County’s Department of Planning and Zoning. These are also distributed to the appropriate school principals, regional offices, and School Board members.
PROJECTIONS (Continued)
New Residential Development Monitoring
Community Long-Term
Parcel Short-Term
Comprehensive Planning/Planning StudyScope: Community (collection of large
developments/subdivisions)Horizon: Long-term (several years to decades)
RezoningScope: Large development/subdivision
(collection of parcels)Horizon: Mid-term (3-5+ years)
Enrollment Projections(IPLS)
Scope: Parcel specificHorizon:
Short-term(1-6 years)
Scope Horizon
Further, as part of the Development Review process, FCPS uses GIS map layers to plot and track residential development to provide for a more cumulative and comprehensive review of development impacts on County schools, which improves long-range planning for the needs of school facilities.
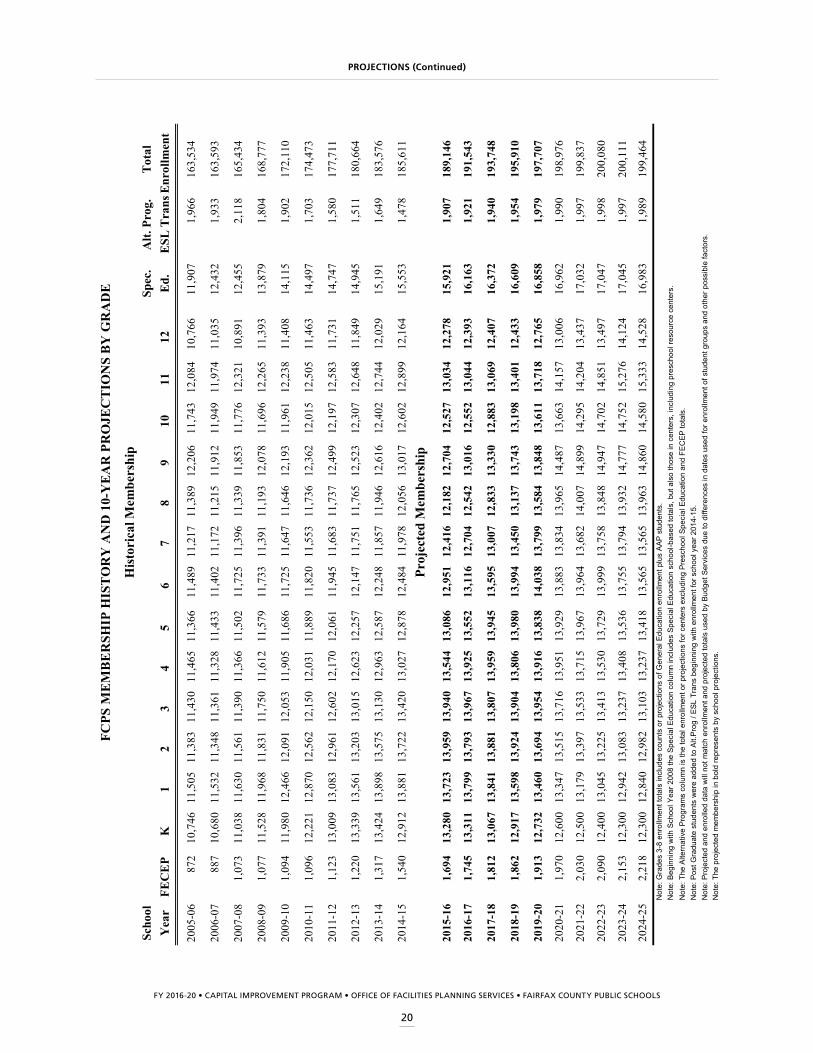
FY 2016-20 • CAPITAL IMPROVEMENT PROGRAM • OFFICE OF FACILITIES PLANNING SERVICES • FAIRFAX COUNTY PUBLIC SCHOOLS
20
PROJECTIONS (Continued)
Scho
ol
Spec
.A
lt. P
rog.
Tot
alY
ear
FEC
EP
K1
23
45
67
89
1011
12E
d.E
SL T
rans
Enr
ollm
ent
1998
758
10,0
5411
,299
11,3
2711
,496
11,0
1410
,634
10,6
1510
,435
10,6
5311
,083
10,6
9210
,233
9,20
28,
950
2,41
215
0,85
7
2005
-06
872
10,7
4611
,505
11,3
8311
,430
11,4
6511
,366
11,4
8911
,217
11,3
8912
,206
11,7
4312
,084
10,7
6611
,907
1,96
616
3,53
4
2006
-07
887
10,6
8011
,532
11,3
4811
,361
11,3
2811
,433
11,4
0211
,172
11,2
1511
,912
11,9
4911
,974
11,0
3512
,432
1,93
316
3,59
3
2007
-08
1,07
311
,038
11,6
3011
,561
11,3
9011
,366
11,5
0211
,725
11,3
9611
,339
11,8
5311
,776
12,3
2110
,891
12,4
552,
118
165,
434
2008
-09
1,07
711
,528
11,9
6811
,831
11,7
5011
,612
11,5
7911
,733
11,3
9111
,193
12,0
7811
,696
12,2
6511
,393
13,8
791,
804
168,
777
2009
-10
1,09
411
,980
12,4
6612
,091
12,0
5311
,905
11,6
8611
,725
11,6
4711
,646
12,1
9311
,961
12,2
3811
,408
14,1
151,
902
172,
110
2010
-11
1,09
612
,221
12,8
7012
,562
12,1
5012
,031
11,8
8911
,820
11,5
5311
,736
12,3
6212
,015
12,5
0511
,463
14,4
971,
703
174,
473
2011
-12
1,12
313
,009
13,0
8312
,961
12,6
0212
,170
12,0
6111
,945
11,6
8311
,737
12,4
9912
,197
12,5
8311
,731
14,7
471,
580
177,
711
2012
-13
1,22
013
,339
13,5
6113
,203
13,0
1512
,623
12,2
5712
,147
11,7
5111
,765
12,5
2312
,307
12,6
4811
,849
14,9
451,
511
180,
664
2013
-14
1,31
713
,424
13,8
9813
,575
13,1
3012
,963
12,5
8712
,248
11,8
5711
,946
12,6
1612
,402
12,7
4412
,029
15,1
911,
649
183,
576
2014
-15
1,54
012
,912
13,8
8113
,722
13,4
2013
,027
12,8
7812
,484
11,9
7812
,056
13,0
1712
,602
12,8
9912
,164
15,5
531,
478
185,
611
2015
-16
1,69
413
,280
13,7
2313
,959
13,9
4013
,544
13,0
8612
,951
12,4
1612
,182
12,7
0412
,527
13,0
3412
,278
15,9
211,
907
189,
146
2016
-17
1,74
513
,311
13,7
9913
,793
13,9
6713
,925
13,5
5213
,116
12,7
0412
,542
13,0
1612
,552
13,0
4412
,393
16,1
631,
921
191,
543
2017
-18
1,81
213
,067
13,8
4113
,881
13,8
0713
,959
13,9
4513
,595
13,0
0712
,833
13,3
3012
,883
13,0
6912
,407
16,3
721,
940
193,
748
2018
-19
1,86
212
,917
13,5
9813
,924
13,9
0413
,806
13,9
8013
,994
13,4
5013
,137
13,7
4313
,198
13,4
0112
,433
16,6
091,
954
195,
910
2019
-20
1,91
312
,732
13,4
6013
,694
13,9
5413
,916
13,8
3814
,038
13,7
9913
,584
13,8
4813
,611
13,7
1812
,765
16,8
581,
979
197,
707
2020
-21
1,97
012
,600
13,3
4713
,515
13,7
1613
,951
13,9
2913
,883
13,8
3413
,965
14,4
8713
,663
14,1
5713
,006
16,9
621,
990
198,
976
2021
-22
2,03
012
,500
13,1
7913
,397
13,5
3313
,715
13,9
6713
,964
13,6
8214
,007
14,8
9914
,295
14,2
0413
,437
17,0
321,
997
199,
837
2022
-23
2,09
012
,400
13,0
4513
,225
13,4
1313
,530
13,7
2913
,999
13,7
5813
,848
14,9
4714
,702
14,8
5113
,497
17,0
471,
998
200,
080
2023
-24
2,15
312
,300
12,9
4213
,083
13,2
3713
,408
13,5
3613
,755
13,7
9413
,932
14,7
7714
,752
15,2
7614
,124
17,0
451,
997
200,
111
2024
-25
2,21
812
,300
12,8
4012
,982
13,1
0313
,237
13,4
1813
,565
13,5
6513
,963
14,8
6014
,580
15,3
3314
,528
16,9
831,
989
199,
464
Not
e: G
rade
s 3-
8 en
rollm
ent t
otal
s in
clud
es c
ount
s or
pro
ject
ions
of G
ener
al E
duca
tion
enro
llmen
t plu
s AA
P st
uden
ts.
Not
e: B
egin
ning
with
Sch
ool Y
ear 2
008
the
Spec
ial E
duca
tion
colu
mn
incl
udes
Spe
cial
Edu
catio
n sc
hool
-bas
ed to
tals
, but
als
o th
ose
in c
ente
rs, i
nclu
ding
pre
scho
ol re
sour
ce c
ente
rs.
Not
e: T
he A
ltern
ativ
e Pr
ogra
ms
colu
mn
is th
e to
tal e
nrol
lmen
t or p
roje
ctio
ns fo
r cen
ters
exc
ludi
ng P
resc
hool
Spe
cial
Edu
catio
n an
d FE
CEP
tota
ls.
Not
e: P
ost G
radu
ate
stud
ents
wer
e ad
ded
to A
lt.Pr
og /
ESL
Tran
s be
ginn
ing
with
enr
ollm
ent f
or s
choo
l yea
r 201
4-15
.N
ote:
Pro
ject
ed a
nd e
nrol
led
data
will
not
mat
ch e
nrol
lmen
t and
pro
ject
ed to
tals
use
d by
Bud
get S
ervi
ces
due
to d
iffer
ence
s in
dat
es u
sed
for e
nrol
lmen
t of s
tude
nt g
roup
s an
d ot
her p
ossi
ble
fact
ors.
Hist
oric
al M
embe
rshi
p
FCPS
ME
MB
ER
SHIP
HIS
TO
RY
AN
D 1
0-Y
EA
R P
RO
JEC
TIO
NS
BY
GR
AD
E
Proj
ecte
d M
embe
rshi
p
Not
e: T
he p
roje
cted
mem
bers
hip
in b
old
repr
esen
ts b
y sc
hool
pro
ject
ions
.
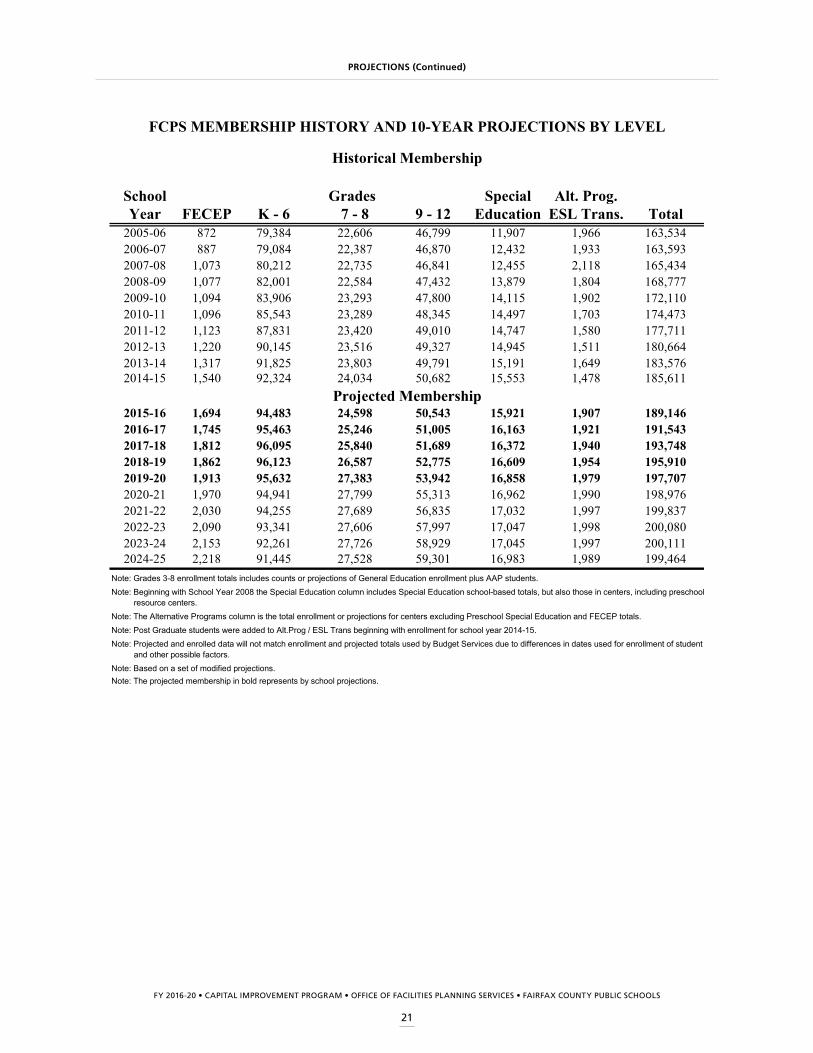
FY 2016-20 • CAPITAL IMPROVEMENT PROGRAM • OFFICE OF FACILITIES PLANNING SERVICES • FAIRFAX COUNTY PUBLIC SCHOOLS
21
PROJECTIONS (Continued)
School Special Alt. Prog.Year FECEP K - 6 7 - 8 9 - 12 Education ESL Trans. Total
2005-06 872 79,384 22,606 46,799 11,907 1,966 163,5342006-07 887 79,084 22,387 46,870 12,432 1,933 163,5932007-08 1,073 80,212 22,735 46,841 12,455 2,118 165,4342008-09 1,077 82,001 22,584 47,432 13,879 1,804 168,7772009-10 1,094 83,906 23,293 47,800 14,115 1,902 172,1102010-11 1,096 85,543 23,289 48,345 14,497 1,703 174,4732011-12 1,123 87,831 23,420 49,010 14,747 1,580 177,7112012-13 1,220 90,145 23,516 49,327 14,945 1,511 180,6642013-14 1,317 91,825 23,803 49,791 15,191 1,649 183,5762014-15 1,540 92,324 24,034 50,682 15,553 1,478 185,611
2015-16 1,694 94,483 24,598 50,543 15,921 1,907 189,1462016-17 1,745 95,463 25,246 51,005 16,163 1,921 191,5432017-18 1,812 96,095 25,840 51,689 16,372 1,940 193,7482018-19 1,862 96,123 26,587 52,775 16,609 1,954 195,9102019-20 1,913 95,632 27,383 53,942 16,858 1,979 197,7072020-21 1,970 94,941 27,799 55,313 16,962 1,990 198,9762021-22 2,030 94,255 27,689 56,835 17,032 1,997 199,8372022-23 2,090 93,341 27,606 57,997 17,047 1,998 200,0802023-24 2,153 92,261 27,726 58,929 17,045 1,997 200,1112024-25 2,218 91,445 27,528 59,301 16,983 1,989 199,464
Note: Grades 3-8 enrollment totals includes counts or projections of General Education enrollment plus AAP students.Note: Beginning with School Year 2008 the Special Education column includes Special Education school-based totals, but also those in centers, including preschool
Note: The Alternative Programs column is the total enrollment or projections for centers excluding Preschool Special Education and FECEP totals.Note: Post Graduate students were added to Alt.Prog / ESL Trans beginning with enrollment for school year 2014-15.
Note: Based on a set of modified projections.Note: The projected membership in bold represents by school projections.
Note: Projected and enrolled data will not match enrollment and projected totals used by Budget Services due to differences in dates used for enrollment of student groups and other possible factors.
Projected Membership
FCPS MEMBERSHIP HISTORY AND 10-YEAR PROJECTIONS BY LEVEL
Grades
Historical Membership
resource centers.

FY 2016-20 • CAPITAL IMPROVEMENT PROGRAM • OFFICE OF FACILITIES PLANNING SERVICES • FAIRFAX COUNTY PUBLIC SCHOOLS
22
FY 2016-20 • CAPITAL IMPROVEMENT PROGRAM • OFFICE OF FACILITIES PLANNING SERVICES • FAIRFAX COUNTY PUBLIC SCHOOLS
23
Modular additions continue to be counted towards capacity while trailer classrooms do not. Classroom trailers will continue to remain on site in many schools where small capacity deficits or even capacity surplus exists, largely due to lack of funding to remove and store elsewhere. Trailer relocations, however, will take place when additional trailers are needed to accommodate an increase in enrollment at specific schools.
Having determined the overall methodology that would be used to determine capacity for elementary, middle, and high schools, it is then necessary to determine how each individual school is using space. FCPS is very meticulous in assessing the capacity of each school by conducting a site survey of each building. The Office of Design and Construction has a dedicated Capacity Architect who surveys the current use of every space within our schools. With this specific information, the capacity of each school is determined based upon building design, unique characteristics, and program utilization. Thus, two schools with the same exact physical characteristics can have very different capacities depending upon the programs that are assigned to those schools. Capacities can change from year to year based upon programs and changes made by the School Board, such as an increase or decrease in class size.
Expanded facility and membership information for all schools may be viewed at the following link: www.fcps.edu/fts under the link “Facility & Enrollment Dashboard-Spring 2014.” In a dashboard-style format, the website provides enrollment and projection updates for individual schools with projection and capacity updates provided as needed to reflect program changes, modifications to the physical school building or changes to educational specifications on class size. Most recently, additional data have been added, including the number of out of boundary students, the transfer status for schools (open or closed to transfer), information regarding program distribution in each high school pyramid and their feeder schools, and whether the school projections are trending up or down. The capacity model is used to help identify critical capacity surpluses and deficits. The capacity assessments for all schools will serve to inform and direct facilities planning activities such as identifying schools that should be closed to transfers; prioritizing temporary/permanent classrooms or building additions; and, guide new program placement and boundary changes.
Assessment of Facility Capacity
School Capacity—Information and Assessment
Understanding and accurately capturing school capacity has become increasingly important as FCPS struggles to meet the challenge of increasing enrollment pressures in many schools, especially given that membership has grown by approximately 22,000 students since September 2006. Knowing how many students a school can accommodate allows FCPS to quickly assess appropriate program placement and to develop student accommodation solutions. Accurate school capacity assessment helps to ensure that classroom spaces are sized appropriately and spaces are designed with flexibility in order to meet the needs of multiple and/or changing instructional programs. Beyond current programmatic and enrollment challenges, accurate capacity assessments are necessary to formulate long-term facility plans.
As a follow-up to the 2007 DeJong Capacity Study and the 2008 implementation of a new methodology for school capacity calculation, FCPS provided detailed school capacity and facility information on the public website in the form of a Facilities and Enrollment Dashboard, which may be found at http://www.fcps.edu/fts. The methodology used to calculate capacity for each school type can be found at: http://www.fcps.edu/fts/dashboard under the link “Methodology and Calculation.”
It should be noted that for some schools, the capacity as listed in the CIP may vary with that provided on the Facilities and Enrollment Dashboard. The numbers that are provided in the CIP are considered to be the Planning Program Capacities; the capacity numbers posted on the Dashboard are the Transfer Program Capacities, based on existing classroom usage. The planning capacity listed for a school reflects the potential for classrooms used as non-teaching space to be recaptured for classroom use as may be needed to accommodate program changes and enrollment growth.
School Capacity Model
It is important to note that school capacity is measured differently depending upon the school type. For instance, elementary schools are calculated based upon the number of core classrooms and self-contained special education rooms. FCPS middle schools are team taught, which limits the amount of students to the quantity of rooms required to support a team. High school capacity is far more complex than that in elementary and middle schools. The capacity of a high school is based upon the required core programs and the various elective options available.
Capacity
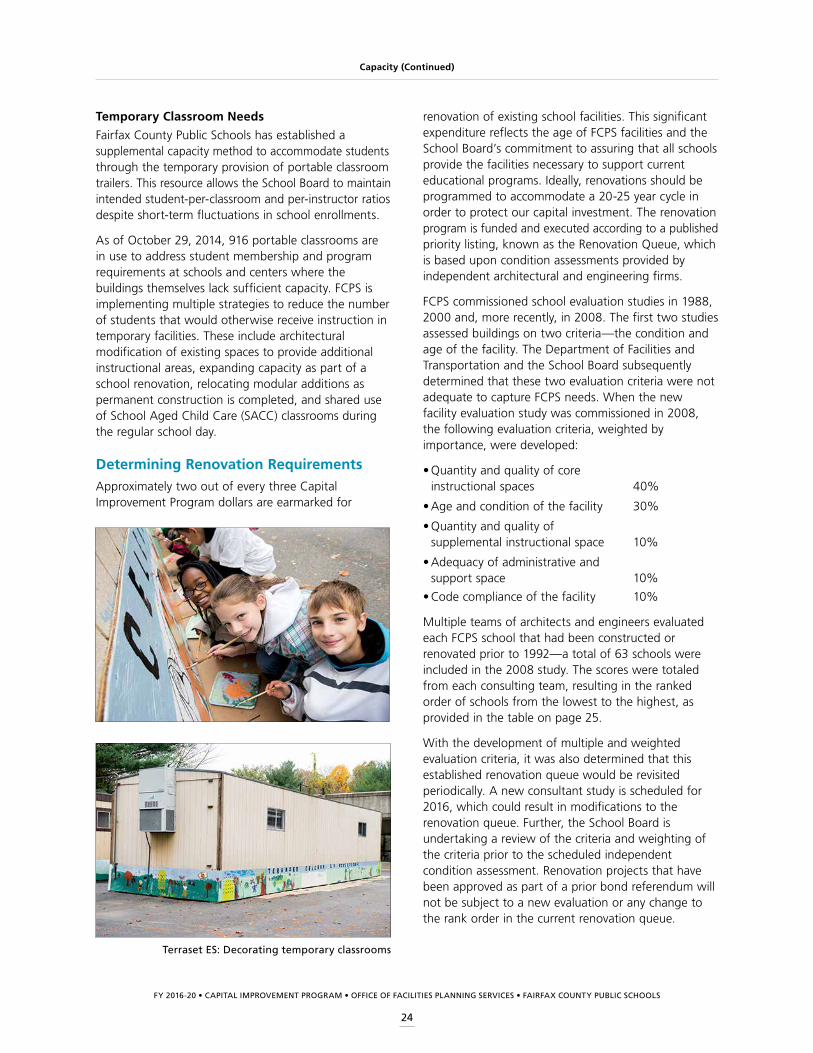
FY 2016-20 • CAPITAL IMPROVEMENT PROGRAM • OFFICE OF FACILITIES PLANNING SERVICES • FAIRFAX COUNTY PUBLIC SCHOOLS
24
Terraset ES: Decorating temporary classrooms
renovation of existing school facilities. This significant expenditure reflects the age of FCPS facilities and the School Board’s commitment to assuring that all schools provide the facilities necessary to support current educational programs. Ideally, renovations should be programmed to accommodate a 20-25 year cycle in order to protect our capital investment. The renovation program is funded and executed according to a published priority listing, known as the Renovation Queue, which is based upon condition assessments provided by independent architectural and engineering firms.
FCPS commissioned school evaluation studies in 1988, 2000 and, more recently, in 2008. The first two studies assessed buildings on two criteria—the condition and age of the facility. The Department of Facilities and Transportation and the School Board subsequently determined that these two evaluation criteria were not adequate to capture FCPS needs. When the new facility evaluation study was commissioned in 2008, the following evaluation criteria, weighted by importance, were developed:
• Quantity and quality of core instructional spaces 40%
• Age and condition of the facility 30%
• Quantity and quality of supplemental instructional space 10%
• Adequacy of administrative and support space 10%
• Code compliance of the facility 10%
Multiple teams of architects and engineers evaluated each FCPS school that had been constructed or renovated prior to 1992—a total of 63 schools were included in the 2008 study. The scores were totaled from each consulting team, resulting in the ranked order of schools from the lowest to the highest, as provided in the table on page 25.
With the development of multiple and weighted evaluation criteria, it was also determined that this established renovation queue would be revisited periodically. A new consultant study is scheduled for 2016, which could result in modifications to the renovation queue. Further, the School Board is undertaking a review of the criteria and weighting of the criteria prior to the scheduled independent condition assessment. Renovation projects that have been approved as part of a prior bond referendum will not be subject to a new evaluation or any change to the rank order in the current renovation queue.
Temporary Classroom Needs
Fairfax County Public Schools has established a supplemental capacity method to accommodate students through the temporary provision of portable classroom trailers. This resource allows the School Board to maintain intended student-per-classroom and per-instructor ratios despite short-term fluctuations in school enrollments.
As of October 29, 2014, 916 portable classrooms are in use to address student membership and program requirements at schools and centers where the buildings themselves lack sufficient capacity. FCPS is implementing multiple strategies to reduce the number of students that would otherwise receive instruction in temporary facilities. These include architectural modification of existing spaces to provide additional instructional areas, expanding capacity as part of a school renovation, relocating modular additions as permanent construction is completed, and shared use of School Aged Child Care (SACC) classrooms during the regular school day.
Determining Renovation RequirementsApproximately two out of every three Capital Improvement Program dollars are earmarked for
Capacity (Continued)
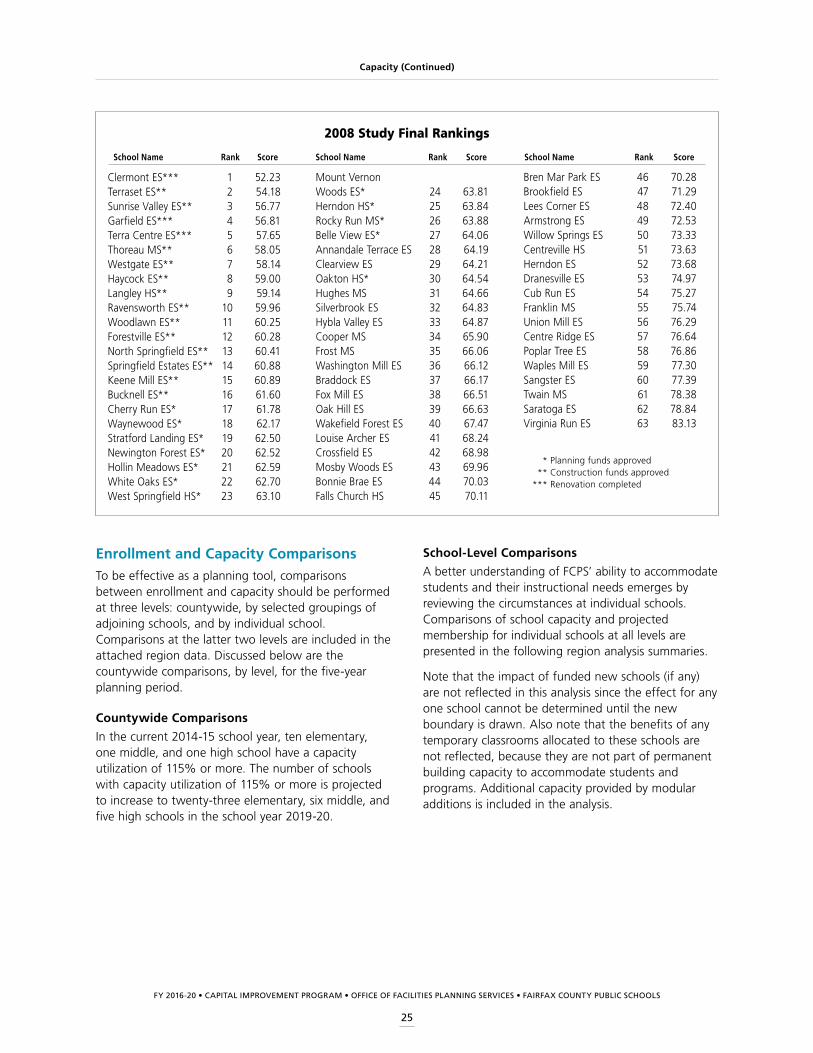
FY 2016-20 • CAPITAL IMPROVEMENT PROGRAM • OFFICE OF FACILITIES PLANNING SERVICES • FAIRFAX COUNTY PUBLIC SCHOOLS
25
School-Level Comparisons
A better understanding of FCPS’ ability to accommodate students and their instructional needs emerges by reviewing the circumstances at individual schools. Comparisons of school capacity and projected membership for individual schools at all levels are presented in the following region analysis summaries.
Note that the impact of funded new schools (if any) are not reflected in this analysis since the effect for any one school cannot be determined until the new boundary is drawn. Also note that the benefits of any temporary classrooms allocated to these schools are not reflected, because they are not part of permanent building capacity to accommodate students and programs. Additional capacity provided by modular additions is included in the analysis.
Enrollment and Capacity ComparisonsTo be effective as a planning tool, comparisons between enrollment and capacity should be performed at three levels: countywide, by selected groupings of adjoining schools, and by individual school. Comparisons at the latter two levels are included in the attached region data. Discussed below are the countywide comparisons, by level, for the five-year planning period.
Countywide Comparisons
In the current 2014-15 school year, ten elementary, one middle, and one high school have a capacity utilization of 115% or more. The number of schools with capacity utilization of 115% or more is projected to increase to twenty-three elementary, six middle, and five high schools in the school year 2019-20.
Capacity (Continued)
2008 Study Final Rankings
School Name Rank Score School Name Rank Score School Name Rank Score
Clermont ES*** 1 52.23Terraset ES** 2 54.18Sunrise Valley ES** 3 56.77Garfield ES*** 4 56.81Terra Centre ES*** 5 57.65Thoreau MS** 6 58.05Westgate ES** 7 58.14Haycock ES** 8 59.00Langley HS** 9 59.14Ravensworth ES** 10 59.96Woodlawn ES** 11 60.25Forestville ES** 12 60.28North Springfield ES** 13 60.41Springfield Estates ES** 14 60.88Keene Mill ES** 15 60.89Bucknell ES** 16 61.60Cherry Run ES* 17 61.78Waynewood ES* 18 62.17Stratford Landing ES* 19 62.50Newington Forest ES* 20 62.52Hollin Meadows ES* 21 62.59White Oaks ES* 22 62.70West Springfield HS* 23 63.10
Mount Vernon Woods ES* 24 63.81Herndon HS* 25 63.84Rocky Run MS* 26 63.88Belle View ES* 27 64.06Annandale Terrace ES 28 64.19Clearview ES 29 64.21Oakton HS* 30 64.54Hughes MS 31 64.66Silverbrook ES 32 64.83Hybla Valley ES 33 64.87Cooper MS 34 65.90Frost MS 35 66.06Washington Mill ES 36 66.12Braddock ES 37 66.17Fox Mill ES 38 66.51Oak Hill ES 39 66.63Wakefield Forest ES 40 67.47Louise Archer ES 41 68.24Crossfield ES 42 68.98Mosby Woods ES 43 69.96Bonnie Brae ES 44 70.03Falls Church HS 45 70.11
Bren Mar Park ES 46 70.28Brookfield ES 47 71.29Lees Corner ES 48 72.40Armstrong ES 49 72.53Willow Springs ES 50 73.33Centreville HS 51 73.63Herndon ES 52 73.68Dranesville ES 53 74.97Cub Run ES 54 75.27Franklin MS 55 75.74Union Mill ES 56 76.29Centre Ridge ES 57 76.64Poplar Tree ES 58 76.86Waples Mill ES 59 77.30Sangster ES 60 77.39Twain MS 61 78.38Saratoga ES 62 78.84Virginia Run ES 63 83.13
* Planning funds approved ** Construction funds approved *** Renovation completed
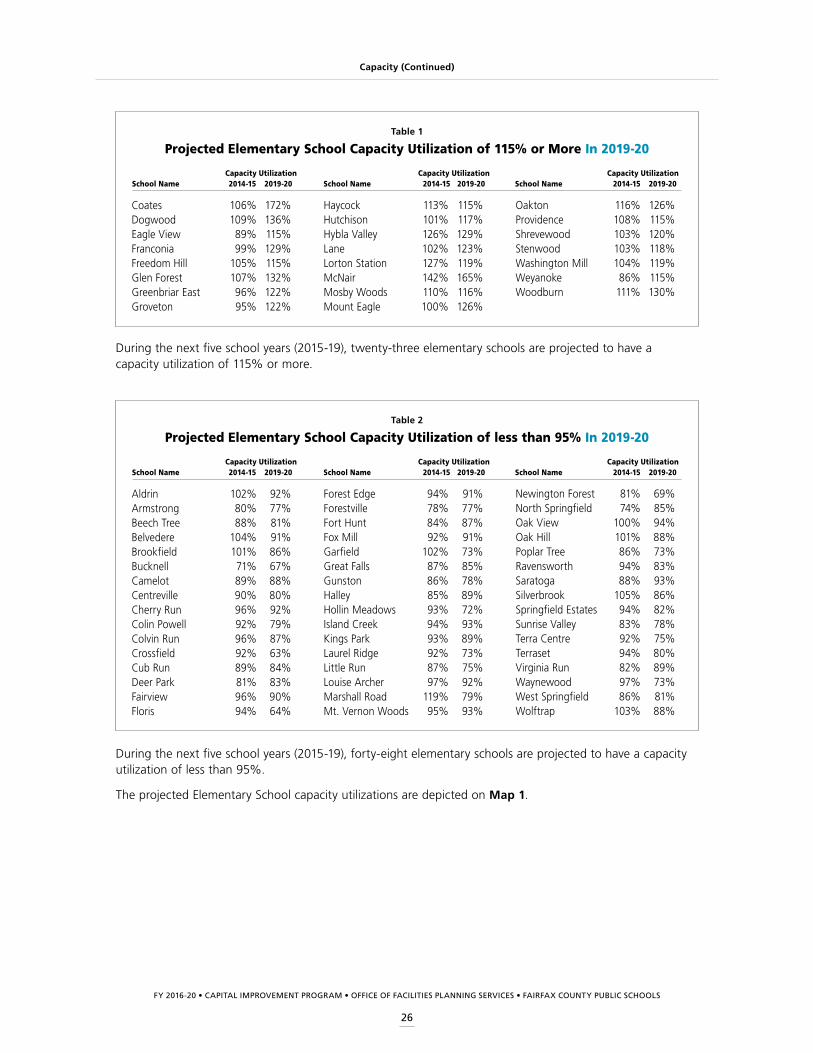
FY 2016-20 • CAPITAL IMPROVEMENT PROGRAM • OFFICE OF FACILITIES PLANNING SERVICES • FAIRFAX COUNTY PUBLIC SCHOOLS
26
Capacity (Continued)
Table 1
Projected Elementary School Capacity Utilization of 115% or More In 2019-20
Capacity Utilization Capacity Utilization Capacity UtilizationSchool Name 2014-15 2019-20 School Name 2014-15 2019-20 School Name 2014-15 2019-20
Coates 106% 172%Dogwood 109% 136%Eagle View 89% 115%Franconia 99% 129%Freedom Hill 105% 115%Glen Forest 107% 132%Greenbriar East 96% 122%Groveton 95% 122%
Haycock 113% 115%Hutchison 101% 117%Hybla Valley 126% 129%Lane 102% 123%Lorton Station 127% 119%McNair 142% 165%Mosby Woods 110% 116%Mount Eagle 100% 126%
Oakton 116% 126%Providence 108% 115%Shrevewood 103% 120%Stenwood 103% 118%Washington Mill 104% 119%Weyanoke 86% 115%Woodburn 111% 130%
Table 2
Projected Elementary School Capacity Utilization of less than 95% In 2019-20
Capacity Utilization Capacity Utilization Capacity UtilizationSchool Name 2014-15 2019-20 School Name 2014-15 2019-20 School Name 2014-15 2019-20
Aldrin 102% 92%Armstrong 80% 77%Beech Tree 88% 81%Belvedere 104% 91%Brookfield 101% 86%Bucknell 71% 67%Camelot 89% 88%Centreville 90% 80%Cherry Run 96% 92%Colin Powell 92% 79%Colvin Run 96% 87%Crossfield 92% 63%Cub Run 89% 84%Deer Park 81% 83%Fairview 96% 90%Floris 94% 64%
Forest Edge 94% 91%Forestville 78% 77%Fort Hunt 84% 87%Fox Mill 92% 91%Garfield 102% 73%Great Falls 87% 85%Gunston 86% 78%Halley 85% 89%Hollin Meadows 93% 72%Island Creek 94% 93%Kings Park 93% 89%Laurel Ridge 92% 73%Little Run 87% 75%Louise Archer 97% 92%Marshall Road 119% 79%Mt. Vernon Woods 95% 93%
Newington Forest 81% 69%North Springfield 74% 85%Oak View 100% 94%Oak Hill 101% 88%Poplar Tree 86% 73%Ravensworth 94% 83%Saratoga 88% 93%Silverbrook 105% 86%Springfield Estates 94% 82%Sunrise Valley 83% 78%Terra Centre 92% 75%Terraset 94% 80%Virginia Run 82% 89%Waynewood 97% 73%West Springfield 86% 81%Wolftrap 103% 88%
During the next five school years (2015-19), twenty-three elementary schools are projected to have a capacity utilization of 115% or more.
During the next five school years (2015-19), forty-eight elementary schools are projected to have a capacity utilization of less than 95%.
The projected Elementary School capacity utilizations are depicted on Map 1.
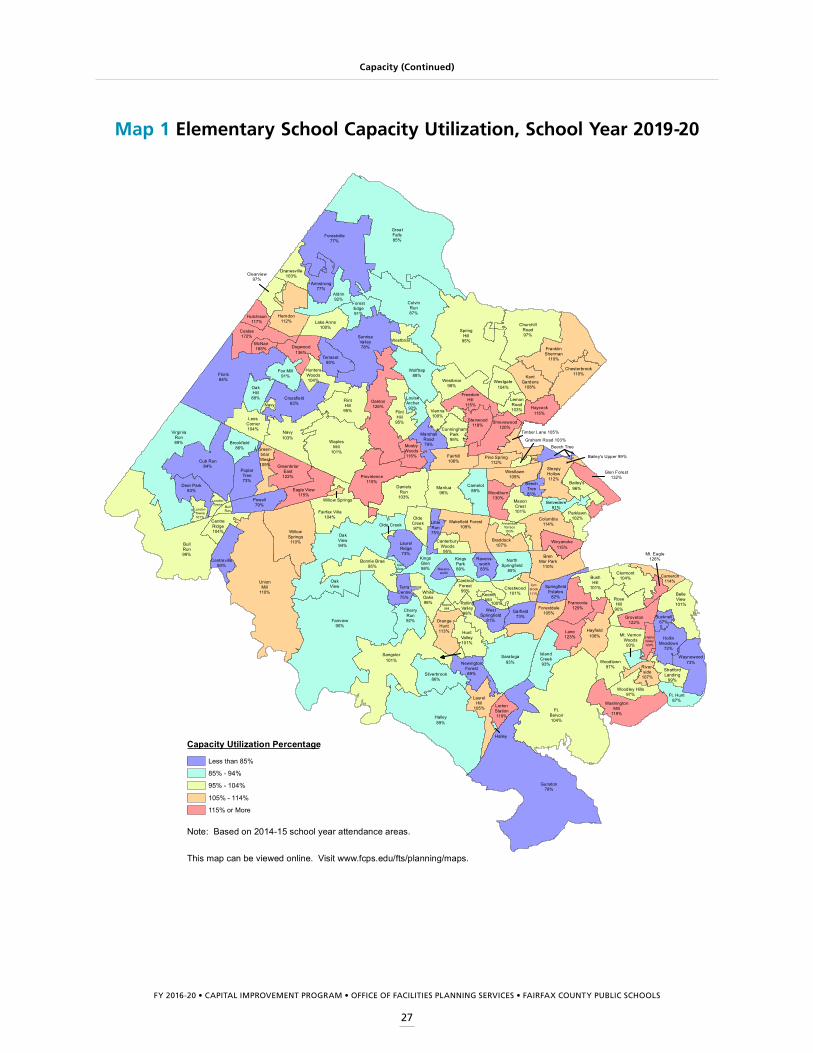
FY 2016-20 • CAPITAL IMPROVEMENT PROGRAM • OFFICE OF FACILITIES PLANNING SERVICES • FAIRFAX COUNTY PUBLIC SCHOOLS
27
Bailey's Upper 99%
OakView
KingsGlen98%
100%
Aldrin92%
Armstrong77%
ChurchillRoad97%
Clearview97%
ColvinRun87%
Crossfield63%
CunninghamPark95%
Dogwood136%
Dranesville103%
FlintHill
95%
FlintHill
95%
ForestEdge91%
Forestville77%
Fox Mill91%
GreatFalls85%
Herndon112%
HuntersWoods104%
Hutchison117% Lake Anne
100%
LouiseArcher92%
MarshallRoad79%Mosby
Woods116%
Navy
Navy103%
Oakton126%
SpringHill
95%SunriseValley78%
Terraset80%
Vienna100%
WaplesMill
101%
Wolftrap88%
AnnandaleTerrace103%
Bailey's96%
Beech Tree
BeechTree81%
Belvedere91%
Braddock107%
BrenMar Park
110%
Camelot88%
Chesterbrook110%
Columbia114%
Fairhill106%
FranklinSherman
110%
FreedomHill
115%
Glen Forest132%
Graham Road 103%
Haycock115%
KentGardens
108%
LemonRoad103%
MasonCrest101%
NorthSpringfield
85%
Parklawn102%
PSPine Spring112%
Shrevewood120%
SleepyHollow112%
Stenwood118%
Timber Lane 105%
Westbriar
Westbriar98%
Westgate104%
Westlawn109%
Weyanoke115%
Woodburn130%
BelleView101%
Bucknell67%
BushHill
101%
Cameron114%
Clermont104%
Crestwood101%
Forestdale105%
Ft.Belvoir104%
Ft. Hunt87%
Franconia129%
Garfield73% Groveton
122%
Gunston78%
Hayfield106% Hollin
Meadows72%
HyblaValley129%
IslandCreek93%
Lane123%
LortonStation119%
Lyn-brook111%
Mt. Eagle126%
Mt. VernonWoods
93%
River-side
107%
RoseHill
95%
Saratoga93%
SpringfieldEstates
82%
StratfordLanding
99%
WashingtonMill
119%
Waynewood73%Woodlawn
97%
Woodley Hills97%
Bonnie Brae95%
BullRun
BullRun99%
CardinalForest99%
CentreRidge104%
Centreville80%
CherryRun92%Fairview
90%
Halley
Halley89%
HuntValley101%
KeeneMill
KeeneMill
KingsPark89%
LaurelHill
105%
LaurelRidge73%
NewingtonForest69%
OakView
OakView94%
OrangeHunt113%
Powell79%
Ravens-worth
Ravens-worth83%
RollingValley98%
Sangster101%
Silverbrook86%
TerraCentre75%
UnionMill
110%
WestSpringfield
81%
WhiteOaks98%
Brookfield86%
CanterburyWoods
95%
Coates172%
Cub Run84%
DanielsRun
103%
Deer Park83% Eagle View
115%
Fairfax Villa104%
Floris64%
GreenbriarEast
122%
Green-briarWest109%
LeesCorner104%
LittleRun75%
LondonTowne
LondonTowne101%
Mantua96%
McNair165%
OakHill
88%
Olde CreekOlde
Creek97%
PoplarTree73%
Providence115%
VirginiaRun89%
Wakefield Forest109%
Willow Springs
WillowSprings110%
Elementary School Capacity Utilization, School Year 2019-20
Less than 85%
85% - 94%
95% - 104%
105% - 114%
115% or More
Capacity Utilization Percentage
Note: Based on 2014-15 school year attendance areas.
This map can be viewed online. Visit www.fcps.edu/fts/planning/maps.
Capacity (Continued)
Map 1 Elementary School Capacity Utilization, School Year 2019-20

FY 2016-20 • CAPITAL IMPROVEMENT PROGRAM • OFFICE OF FACILITIES PLANNING SERVICES • FAIRFAX COUNTY PUBLIC SCHOOLS
28
During the next five school years (2015-19), fourteen middle schools are projected to have a capacity utilization of less than 95%.
The projected Middle School capacity utilizations are illustrated on Map 2.
During the next five school years (2015-19), six middle schools are projected to have a capacity utilization of 115% or more.
Capacity (Continued)
Table 3
Projected Middle School Capacity Utilization of 115% or More In 2019-20
Capacity Utilization Capacity Utilization Capacity UtilizationSchool Name 2014-15 2019-20 School Name 2014-15 2019-20 School Name 2014-15 2019-20
Carson 106% 123%Glasgow 98% 119%
Hughes 90% 115%Jackson 115% 138%
Kilmer 114% 150%Longfellow 103% 116%
Table 4
Projected Middle School Capacity Utilization of Less Than 95% In 2019-20
Capacity Utilization Capacity Utilization Capacity UtilizationSchool Name 2014-15 2019-20 School Name 2014-15 2019-20 School Name 2014-15 2019-20
Cooper 67% 65%Franklin 73% 77%Hayfield 69% 81%Irving 75% 82%Key 83% 91%
Lake Braddock 84% 87%Lanier 83% 86%Liberty 85% 87%Poe 65% 86%Robinson 88% 80%
South County 76% 80%Stone 75% 75%Thoreau 101% 64%Whitman 75% 85%
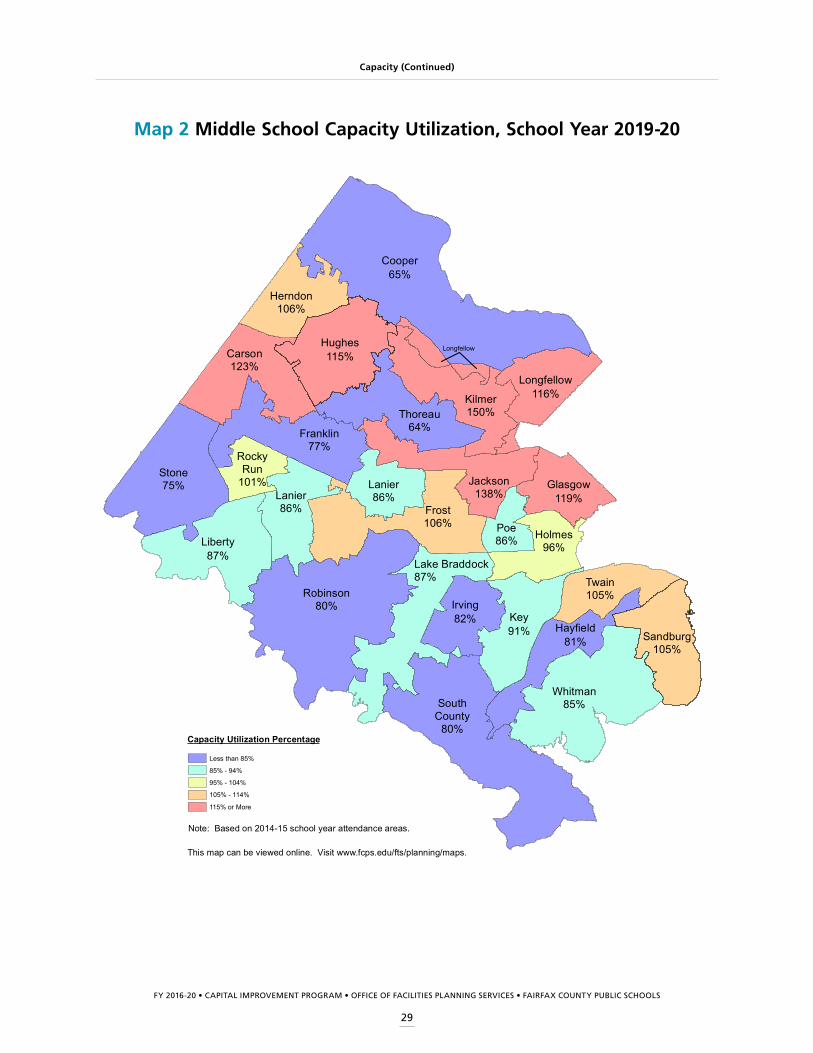
FY 2016-20 • CAPITAL IMPROVEMENT PROGRAM • OFFICE OF FACILITIES PLANNING SERVICES • FAIRFAX COUNTY PUBLIC SCHOOLS
29
Longfellow
Irving82%
Lake Braddock87%
Liberty87%
Robinson80%
SouthCounty
80%
Hayfield81%
Key91% Sandburg
105%
Twain105%
Whitman85%
Glasgow119%
Holmes96%
Jackson138%
Kilmer150%
Longfellow116%
Poe86%
Carson123%
Cooper65%
Herndon106%
Hughes115%
Thoreau64%Franklin
77%
Frost106%
Lanier86%Lanier
86%
RockyRun
101%Stone75%
Middle School Capacity Utilization, School Year 2019-20
Capacity Utilization Percentage
Less than 85%
85% - 94%
95% - 104%
105% - 114%
115% or More
Note: Based on 2014-15 school year attendance areas.
This map can be viewed online. Visit www.fcps.edu/fts/planning/maps.
Capacity (Continued)
Map 2 Middle School Capacity Utilization, School Year 2019-20
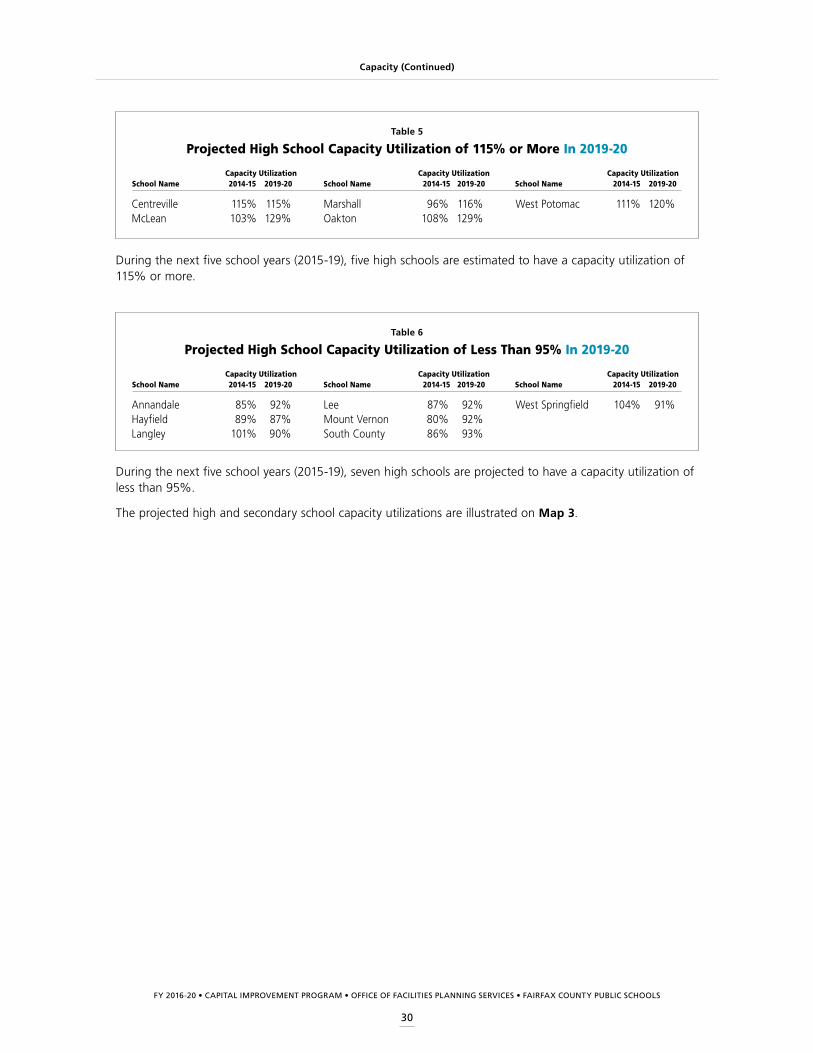
FY 2016-20 • CAPITAL IMPROVEMENT PROGRAM • OFFICE OF FACILITIES PLANNING SERVICES • FAIRFAX COUNTY PUBLIC SCHOOLS
30
During the next five school years (2015-19), five high schools are estimated to have a capacity utilization of 115% or more.
During the next five school years (2015-19), seven high schools are projected to have a capacity utilization of less than 95%.
The projected high and secondary school capacity utilizations are illustrated on Map 3.
Capacity (Continued)
Table 5
Projected High School Capacity Utilization of 115% or More In 2019-20
Capacity Utilization Capacity Utilization Capacity UtilizationSchool Name 2014-15 2019-20 School Name 2014-15 2019-20 School Name 2014-15 2019-20
Centreville 115% 115%McLean 103% 129%
Marshall 96% 116%Oakton 108% 129%
West Potomac 111% 120%
Table 6
Projected High School Capacity Utilization of Less Than 95% In 2019-20
Capacity Utilization Capacity Utilization Capacity UtilizationSchool Name 2014-15 2019-20 School Name 2014-15 2019-20 School Name 2014-15 2019-20
Annandale 85% 92%Hayfield 89% 87%Langley 101% 90%
Lee 87% 92%Mount Vernon 80% 92%South County 86% 93%
West Springfield 104% 91%
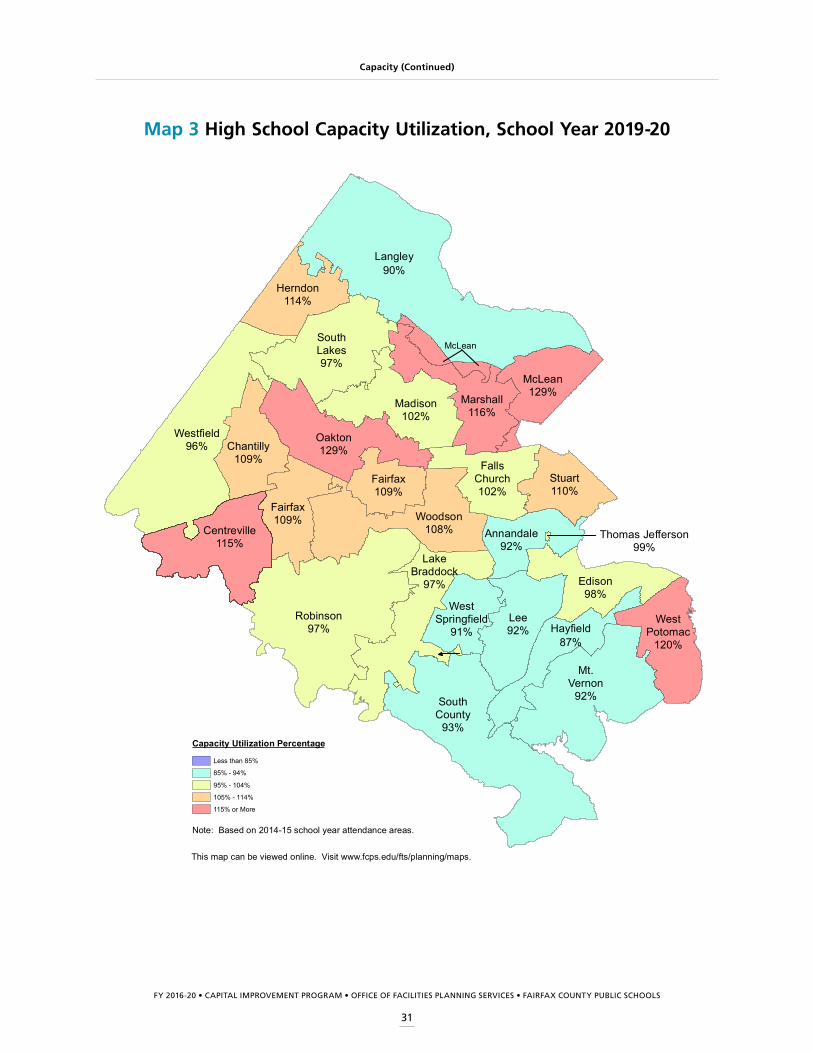
FY 2016-20 • CAPITAL IMPROVEMENT PROGRAM • OFFICE OF FACILITIES PLANNING SERVICES • FAIRFAX COUNTY PUBLIC SCHOOLS
31
Thomas Jefferson99%
Herndon114%
Langley90%
Madison102%
Oakton129%
SouthLakes97%
Annandale92%
FallsChurch102%
Marshall116%
McLean
McLean129%
Stuart110%
Edison98%
Hayfield87%
Lee92%
Mt.Vernon
92%
WestPotomac
120%
Chantilly109%
Fairfax109%
Fairfax109%
Westfield96%
Woodson108%Centreville
115%Lake
Braddock97%
Robinson97%
SouthCounty
93%
WestSpringfield
91%
High School Capacity Utilization, School Year 2019-20
Capacity Utilization Percentage
Less than 85%
85% - 94%
95% - 104%
105% - 114%
115% or More
Note: Based on 2014-15 school year attendance areas.
This map can be viewed online. Visit www.fcps.edu/fts/planning/maps.
Capacity (Continued)
Map 3 High School Capacity Utilization, School Year 2019-20

FY 2016-20 • CAPITAL IMPROVEMENT PROGRAM • OFFICE OF FACILITIES PLANNING SERVICES • FAIRFAX COUNTY PUBLIC SCHOOLS
32

FY 2016-20 • CAPITAL IMPROVEMENT PROGRAM • OFFICE OF FACILITIES PLANNING SERVICES • FAIRFAX COUNTY PUBLIC SCHOOLS
33
Recommended boundary adjustment options and program changes are included in the CIP for future consideration only. Any option chosen for potential implementation will be discussed and decided through a transparent process that engages the community, in accordance with School Board Policy and Regulations. This includes adjustments needed for Advanced Academic Program centers at existing facilities and newly identified site locations.
For most recent capacity information see Facility & Enrollment Dashboard, http://www.fcps.edu/fts/dashboard.
Aldrin92%
Armstrong77%
ChurchillRoad97%
Clearview97%
ColvinRun87%
Crossfield63%
CunninghamPark95%
Dogwood136%
Dranesville103%
FlintHill
95%
FlintHill
95%
ForestEdge91%
Forestville77%
FoxMill91%
GreatFalls85%
Herndon112%
HuntersWoods104%
Hutchison117%
Lake Anne100%
LouiseArcher92%
MarshallRoad79%
MosbyWoods116%
Navy
Navy103%
Oakton126%
SpringHill
95%
SunriseValley78%
Terraset80%
Vienna100%
WaplesMill
101%
Wolftrap88%
Region 1 Elementary SchoolsCapacity Utilization 2019 - 2020
Less than 85%
85% - 94%
95% - 104%
105% - 114%
115% or More
Capacity Utilization
WestbriarRegion 2
Note: Based on 2014-15 school yearattendance areas.
Armstrong: Potential for new programs.
Colvin Run: Reassign Westbriar ES students who live closer to Colvin Run ES to Colvin Run ES.
Clearview:
• Renovation and capacity enhancement to be completed in the 10-year CIP cycle.
• Reassign Herndon ES students to Clearview ES once the Clearview ES renovation has been completed. This option will provide capacity relief to Herndon ES.
• Reassign the AAP students residing within the Aldrin ES and Armstrong ES attendance areas from Forest Edge ES AAP Center to the already existing Clearview ES AAP Center upon completion of the renovation. This AAP Center realignment will keep the cohorts together.
Crossfield: Reassign Navy ES students to Crossfield ES which is under capacity. This option will provide capacity relief to Navy ES.
Region 1 Elementary School Capacity Utilization, School Year 2019-20
Region Summaries
FY 2016-20 • CAPITAL IMPROVEMENT PROGRAM • OFFICE OF FACILITIES PLANNING SERVICES • FAIRFAX COUNTY PUBLIC SCHOOLS
34
Region Summaries (Continued)
Dogwood: Reassign Dogwood ES students to other South Lakes HS Pyramid elementary schools which have sufficient capacity such as Terraset ES and/or Sunrise Valley ES. Upon completion of their renovations, Terraset ES will have a capacity of 800 and Sunrise Valley ES will have a capacity of 750 in the 2016-17 school year.
Dranesville: Capacity deficit accommodated with temporary facilities or interior architectural modifications.
Forest Edge: Reassign the AAP students residing within the Aldrin ES and Armstrong ES attendance areas from Forest Edge ES AAP Center to the already existing Clearview ES AAP Center upon completion of the renovation. This AAP Center realignment will keep the cohorts together.
Forestville: Potential for new programs.
Herndon: Reassign Herndon ES students to Clearview ES once the Clearview ES renovation has been completed. This option will provide capacity relief to Herndon ES.
Hutchison: Construct a new elementary school facility in the North West part of the county to accommodate growth at McNair ES and Coates ES. This option will involve a number of school reassignments and shifts in program offerings to provide the necessary capacity relief to Coates ES and McNair ES.
Louise Archer: Reassign AAP students residing within the Marshall Road ES attendance area from Mosby Woods ES AAP Center to Louise Archer ES AAP Center.
Marshall Road: At the conclusion of the capacity enhancement, the school will have a capacity of 900 students in the 2015-16 school year. Potential for new programs.
Mosby Woods:
• Create a new AAP Center at Providence ES. Reassign the City of Fairfax AAP students from Mosby Woods ES AAP Center to the new AAP Center at Providence ES. Reassign students residing within Fairfax County from Providence ES to Mosby Woods ES. This option will provide capacity relief to Providence ES and allows residents of the City of Fairfax to remain in the City of Fairfax facilities.
• Reassign AAP students residing within the Marshall Road ES attendance area from Mosby Woods ES AAP Center to Louise Archer ES AAP Center.
Navy: Reassign Navy ES students to Crossfield ES which is under capacity. This option will provide capacity relief to Navy ES.
Oakton:
• Convert the Oakton ES auditorium to 4 classrooms which will reduce the need for trailers.
• Construct a new elementary school in the Fairfax-Oakton area. Reassign students residing within the Fairfax-Oakton area to the new school (based on the specific location of the school).
Sunrise Valley:
• At the conclusion of the renovation and capacity enhancement, the school will have a capacity of 750 students in the 2016-17 school year.
• Reassign Dogwood ES students to other South Lakes HS Pyramid elementary schools which have sufficient capacity such as Terraset ES and/or Sunrise Valley ES, upon completion of their renovations.
Terraset:
• At the conclusion of the renovation and capacity enhancement, the school will have a capacity of 800 students in the 2016-17 school year.
• Reassign Dogwood ES students to other South Lakes HS Pyramid elementary schools which have sufficient capacity such as Terraset ES and/or Sunrise Valley ES, upon completion of their renovations.

FY 2016-20 • CAPITAL IMPROVEMENT PROGRAM • OFFICE OF FACILITIES PLANNING SERVICES • FAIRFAX COUNTY PUBLIC SCHOOLS
35
Region Summaries (Continued)
Recommended boundary adjustment options and program changes are included in the CIP for future consideration only. Any option chosen for potential implementation will be discussed and decided through a transparent process that engages the community, in accordance with School Board Policy and Regulations. This includes adjustments needed for Advanced Academic Program centers at existing facilities and newly identified site locations.
For most recent capacity information see Facility & Enrollment Dashboard, http://www.fcps.edu/fts/dashboard.
Region 1 Middle School Capacity Utilization, School Year 2019-20
Hughes: Renovation and capacity enhancement to be completed in the 10-year CIP cycle.
Thoreau:
• At the conclusion of the renovation and capacity enhancement, the school will have a capacity of 1,350 students in the 2017-18 school year.
• Create a new AAP Center at Thoreau MS. Reassign AAP students residing within the Thoreau MS attendance area from Kilmer MS AAP Center and Jackson MS AAP Center to the new AAP Center at Thoreau MS. This option will provide capacity relief to Jackson MS and Kilmer MS.
• Reassign a portion of the Jackson MS students, who will eventually attend Oakton HS, to Thoreau MS. This option will provide capacity relief to Jackson MS and promote cohort survival.
Carson: Create a new AAP Center at Franklin MS. Reassign AAP students residing within the Franklin MS attendance area from Carson MS AAP Center to the new AAP Center at Franklin MS. This option will provide capacity relief to Carson MS.
Cooper: Create a new AAP Center at Cooper MS. Reassign AAP students residing within the Cooper MS attendance area from Longfellow MS AAP Center and Kilmer MS AAP Center to the new AAP Center at Cooper MS. This option will provide capacity relief to Longfellow MS and Kilmer MS. It will create a full capacity middle school at Cooper MS. This new AAP Center will keep the Langley HS Pyramid cohorts together in middle school.
Herndon: Capacity deficit accommodated with temporary facilities or interior architectural modifications.
Carson123%
Cooper65%
Herndon106%
Hughes115%
Thoreau64%
Region 1 Middle SchoolsCapacity Utilization 2019 - 2020
Capacity Utilization
Less than 85%
85% - 94%
95% - 104%
105% - 114%
115% or More
Note: Based on 2014-15 schoolyear attendance areas.
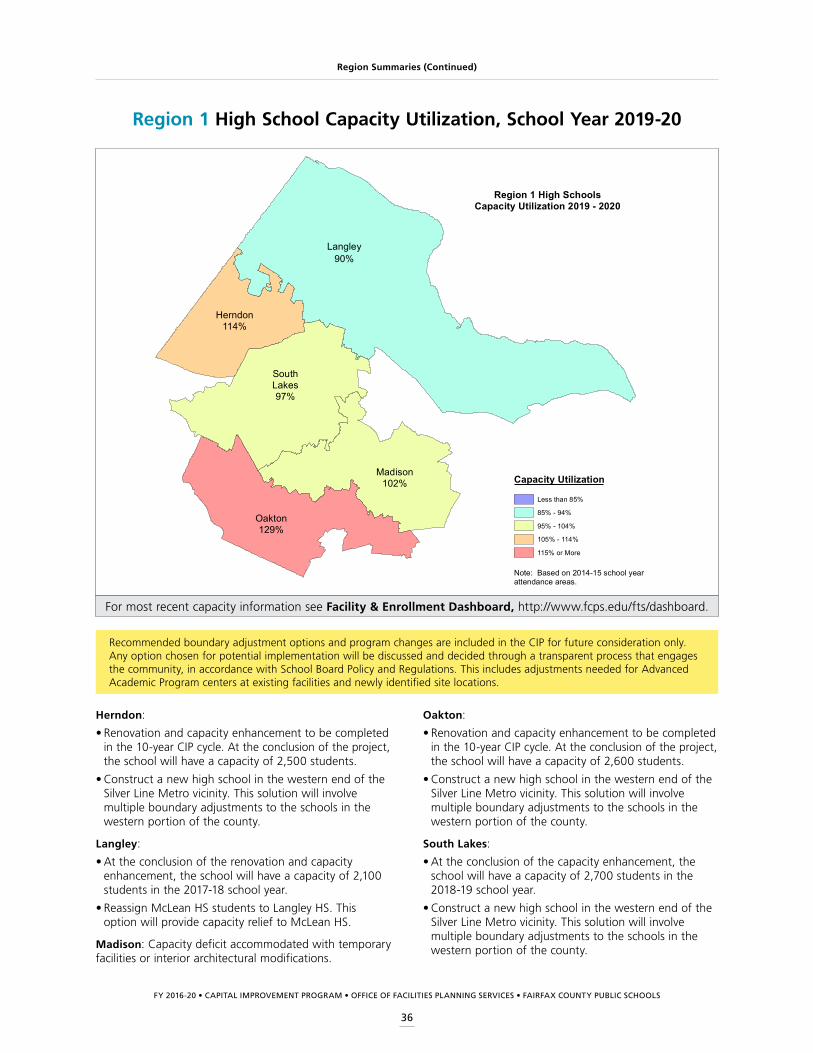
FY 2016-20 • CAPITAL IMPROVEMENT PROGRAM • OFFICE OF FACILITIES PLANNING SERVICES • FAIRFAX COUNTY PUBLIC SCHOOLS
36
Region Summaries (Continued)
Recommended boundary adjustment options and program changes are included in the CIP for future consideration only. Any option chosen for potential implementation will be discussed and decided through a transparent process that engages the community, in accordance with School Board Policy and Regulations. This includes adjustments needed for Advanced Academic Program centers at existing facilities and newly identified site locations.
For most recent capacity information see Facility & Enrollment Dashboard, http://www.fcps.edu/fts/dashboard.
Region 1 High School Capacity Utilization, School Year 2019-20
Herndon114%
Langley90%
Madison102%
Oakton129%
SouthLakes97%
Region 1 High SchoolsCapacity Utilization 2019 - 2020
Capacity Utilization
Less than 85%
85% - 94%
95% - 104%
105% - 114%
115% or More
Note: Based on 2014-15 school yearattendance areas.
Oakton:
• Renovation and capacity enhancement to be completed in the 10-year CIP cycle. At the conclusion of the project, the school will have a capacity of 2,600 students.
• Construct a new high school in the western end of the Silver Line Metro vicinity. This solution will involve multiple boundary adjustments to the schools in the western portion of the county.
South Lakes:
• At the conclusion of the capacity enhancement, the school will have a capacity of 2,700 students in the 2018-19 school year.
• Construct a new high school in the western end of the Silver Line Metro vicinity. This solution will involve multiple boundary adjustments to the schools in the western portion of the county.
Herndon:
• Renovation and capacity enhancement to be completed in the 10-year CIP cycle. At the conclusion of the project, the school will have a capacity of 2,500 students.
• Construct a new high school in the western end of the Silver Line Metro vicinity. This solution will involve multiple boundary adjustments to the schools in the western portion of the county.
Langley:
• At the conclusion of the renovation and capacity enhancement, the school will have a capacity of 2,100 students in the 2017-18 school year.
• Reassign McLean HS students to Langley HS. This option will provide capacity relief to McLean HS.
Madison: Capacity deficit accommodated with temporary facilities or interior architectural modifications.

FY 2016-20 • CAPITAL IMPROVEMENT PROGRAM • OFFICE OF FACILITIES PLANNING SERVICES • FAIRFAX COUNTY PUBLIC SCHOOLS
37
Region Summaries (Continued)
Acc
urac
y of
Cur
rent
Cur
rent
Cur
rent
201
41
Year
Pro
ject
ion
Cap
acity
Sch
ool
Cap
acity
Enr
ollm
ent
For 2
014
Bal
ance
2015
2016
2017
2018
2019
2015
2016
2017
2018
2019
Her
ndon
H.S
.2,
088
2,26
797
.66%
-179
2,24
92,
291
2,25
72,
305
2,38
9-1
61-2
03-1
69-2
17-3
01H
ernd
on M
.S.
1,14
21,
056
93.8
4%86
973
962
1,07
41,
139
1,21
316
918
068
3-7
1A
ldrin
372
773
895
.80%
-11
713
713
674
676
670
1414
5351
57A
rmst
rong
358
647
096
.81%
116
492
496
482
477
453
9490
104
109
133
Cle
arvi
ew6
754
695
99.8
6%59
725
718
730
738
732
2936
2416
22D
rane
svill
e84
276
997
.92%
7383
587
387
587
586
77
-31
-33
-33
-25
Her
ndon
940
940
97.7
7%0
1,02
41,
029
1,07
81,
070
1,04
9-8
4-8
9-1
38-1
30-1
09H
utch
ison
972
984
96.4
4%-1
21,
072
1,11
31,
124
1,14
41,
142
-100
-141
-152
-172
-170
Acc
urac
y of
Cur
rent
Cur
rent
Cur
rent
201
41
Year
Pro
ject
ion
Cap
acity
Sch
ool
Cap
acity
Enr
ollm
ent
For 2
014
Bal
ance
2015
2016
2017
2018
2019
2015
2016
2017
2018
2019
Lang
ley
H.S
.51,
970/
2,10
01,
996
99.5
5%-2
61,
960
1,96
91,
933
1,91
51,
889
101
167
185
211
Coo
per M
.S.
1,08
072
797
.52%
353
723
672
630
704
702
357
408
450
376
378
Chu
rchi
ll R
oad6
829
857
98.6
0%-2
884
582
980
981
680
7-1
60
2013
22C
olvi
n R
un6
908
871
98.2
8%37
873
834
807
800
786
3574
101
108
122
Fore
stvi
lle75
459
110
0.00
%16
356
357
357
757
457
719
118
117
718
017
7G
reat
Fal
ls63
355
294
.75%
8155
656
755
955
053
977
6674
8394
Spr
ing
Hill
1,04
695
597
.28%
9196
41,
000
1,01
698
799
582
4630
5951
Acc
urac
y of
Cur
rent
Cur
rent
Cur
rent
201
41
Year
Pro
ject
ion
Cap
acity
Sch
ool
Cap
acity
Enr
ollm
ent
For 2
014
Bal
ance
2015
2016
2017
2018
2019
2015
2016
2017
2018
2019
Mad
ison
H.S
.2,
098
2,05
998
.83%
392,
078
2,10
62,
124
2,12
62,
141
20-8
-26
-28
-43
Thor
eau
M.S
.581
6/1,
350
827
99.4
0%-1
182
882
684
284
486
3-1
2-1
050
850
648
7C
unni
ngha
m P
ark
569
518
95.9
5%51
517
529
548
543
540
5240
2126
29Fl
int H
ill63
770
598
.58%
-68
687
646
613
623
608
-50
-924
1429
Loui
se A
rche
r4, 6
722
699
95.8
5%23
692
655
667
661
666
3067
5561
56M
arsh
all R
oad5
586/
900
695
100.
00%
-109
722
724
720
725
712
178
176
180
175
188
Vie
nna
427
433
99.0
8%-6
434
423
436
437
429
-74
-9-1
0-2
Wol
ftrap
569
585
93.8
5%-1
652
353
051
150
250
046
3958
6769
Sch
ool Y
ear C
apac
ity B
alan
ce
Pro
ject
ed S
choo
l Yea
r Mem
bers
hip
Sch
ool Y
ear C
apac
ity B
alan
ce
Reg
ion
1
Her
ndon
H.S
. Pyr
amid
Lang
ley
H.S
. Pyr
amid
Pro
ject
ed S
choo
l Yea
r Mem
bers
hip
Sch
ool Y
ear C
apac
ity B
alan
ceP
roje
cted
Sch
ool Y
ear M
embe
rshi
p
Mad
ison
H.S
. Pyr
amid

FY 2016-20 • CAPITAL IMPROVEMENT PROGRAM • OFFICE OF FACILITIES PLANNING SERVICES • FAIRFAX COUNTY PUBLIC SCHOOLS
38
Region Summaries (Continued)
Acc
urac
y of
Cur
rent
Cur
rent
Cur
rent
201
41
Year
Pro
ject
ion
Cap
acity
Sch
ool
Cap
acity
Enr
ollm
ent
For 2
014
Bal
ance
2015
2016
2017
2018
2019
2015
2016
2017
2018
2019
Oak
ton
H.S
.22,
091
2,26
799
.87%
-176
2,27
32,
342
2,45
82,
592
2,69
2-1
82-2
51-3
67-5
01-6
01C
arso
n M
.S.6
1,35
01,
430
96.2
9%-8
01,
492
1,56
11,
564
1,59
81,
656
-142
-211
-214
-248
-306
Cro
ssfie
ld3
743
686
94.3
1%57
607
589
555
517
470
136
154
188
226
273
Mos
by W
oods
692
11,
011
99.7
0%-9
01,
031
1,02
21,
056
1,06
71,
065
-110
-101
-135
-146
-144
Nav
y4, 6
896
873
99.7
7%23
907
957
941
946
926
-11
-61
-45
-50
-30
Oak
ton
732
847
97.6
4%-1
1587
088
591
291
792
2-1
38-1
53-1
80-1
85-1
90W
aple
s M
ill85
785
096
.47%
786
988
187
786
486
2-1
2-2
4-2
0-7
-5
Acc
urac
y of
Cur
rent
Cur
rent
Cur
rent
201
41
Year
Pro
ject
ion
Cap
acity
Sch
ool
Cap
acity
Enr
ollm
ent
For 2
014
Bal
ance
2015
2016
2017
2018
2019
2015
2016
2017
2018
2019
Sou
th L
akes
H.S
.52,
126/
2,70
02,
378
99.7
9%-2
522,
452
2,53
02,
558
2,58
82,
606
-326
-404
-432
112
94H
ughe
s M
.S.6
1,10
91,
001
97.8
0%10
81,
071
1,19
81,
253
1,24
31,
275
38-8
9-1
44-1
34-1
66D
ogw
ood3
756
823
92.8
3%-6
791
294
997
31,
013
1,03
0-1
56-1
93-2
17-2
57-2
74Fo
rest
Edg
e683
678
799
.87%
4980
380
680
278
276
433
3034
5472
Fox
Mill
696
643
99.3
8%53
629
651
638
635
635
6745
5861
61H
unte
rs W
oods
4, 6
923
1,04
598
.47%
-122
1,01
895
396
396
696
2-9
5-3
0-4
0-4
3-3
9La
ke A
nne
709
677
97.4
9%32
675
682
697
710
712
3427
12-1
-3S
unris
e V
alle
y3, 5
, 669
4/75
057
997
.41%
115
601
591
591
588
585
9315
915
916
216
5Te
rrase
t559
0/80
055
410
0.00
%36
589
603
610
634
638
119
719
016
616
2
3 Sig
nific
ant c
hang
es d
ue to
NC
LB s
endi
ng/re
ceiv
ing
stud
ents
.
Pro
ject
ed S
choo
l Yea
r Mem
bers
hip
Oak
ton
H.S
. Pyr
amid
Upd
ated
09/
30/1
4
Pro
ject
ed S
choo
l Yea
r Mem
bers
hip
Sch
ool Y
ear C
apac
ity B
alan
ce
To
view
info
rmat
ion
perta
inin
g to
Cap
acity
& E
nrol
lmen
t, Fa
cilit
ies
& Si
tes,
and
Pyr
amid
& S
peci
al P
rogr
ams,
plea
se v
isit
the
FCPS
Das
hboa
rd S
ite:
http
://w
ww
.fcps
.edu
/fts/
dash
boar
d/in
dex.
shtm
l
Cap
aciti
es a
nd c
apac
ity b
alan
ces
incl
ude
mod
ular
add
ition
s.
4 Sig
nific
ant p
rogr
am o
r oth
er c
hang
es.
2 Bou
ndar
y st
udy
impa
ct. S
choo
ls c
urre
ntly
goi
ng th
roug
h ph
ased
-in b
ound
ary
chan
ges.S
choo
l Yea
r Cap
acity
Bal
ance
Sout
h La
kes
H.S
. Pyr
amid
1 Enr
ollm
ent f
igur
es d
o no
t inc
lude
Spe
cial
Edu
catio
n C
ente
r stu
dent
s.
6 G
ener
al E
duca
tion
and
AAP
Cen
ter s
choo
l.
5 D
enot
es c
urre
nt/fu
ture
cap
acity
.

FY 2016-20 • CAPITAL IMPROVEMENT PROGRAM • OFFICE OF FACILITIES PLANNING SERVICES • FAIRFAX COUNTY PUBLIC SCHOOLS
39
Region Summaries (Continued)
Recommended boundary adjustment options and program changes are included in the CIP for future consideration only. Any option chosen for potential implementation will be discussed and decided through a transparent process that engages the community, in accordance with School Board Policy and Regulations. This includes adjustments needed for Advanced Academic Program centers at existing facilities and newly identified site locations.
AnnandaleTerrace103%
Bailey's96%
Bailey's Upper99%
Beech TreeBeechTree81%
BeechTree81%
Belvedere91%
Braddock107%
BrenMar Park
110%
Camelot88%
Chesterbrook110%
Columbia114%
Fairhill106%
FranklinSherman
110%
FreedomHill
115%
GlenForest132%
Graham Road103%
Haycock115%
KentGardens
108%
LemonRoad103%
MasonCrest101%
NorthSpringfield
85%
Parklawn102%
PineSpring
PineSpring112%
Shrevewood120%
SleepyHollow112%
Stenwood118%
TimberLane105%
Westbriar
Westbriar98% Westgate
104%
Westlawn109%
Weyanoke115%
Woodburn130%
Region 2 Elementary SchoolsCapacity Utilization 2019 - 2020
Capacity Utilization
Less than 85%
85% - 94%
95% - 104%
105% - 114%
115% or More
Note: Based on 2014-15 school yearattendance areas.
For most recent capacity information see Facility & Enrollment Dashboard, http://www.fcps.edu/fts/dashboard.
relief to Belvedere ES and Canterbury Woods ES. Due to grade configurations, see related middle school changes at Glasgow.
Braddock:
• Renovation and capacity enhancement to be completed in the 10-year CIP cycle.
• Create a new AAP Center at an elementary school in the Annandale HS Pyramid, such as Braddock ES or Annandale Terrace ES, in conjunction with their renovations. This option will provide capacity relief to Belvedere ES and Canterbury Woods ES. Due to grade configurations, see related middle school changes at Poe.
Annandale Terrace:
• Renovation and capacity enhancement to be completed in the 10-year CIP cycle.
• Create a new AAP Center at an elementary school in the Annandale HS Pyramid, such as Braddock ES or Annandale Terrace ES, in conjunction with their renovations. This option will provide capacity relief to Belvedere ES and Canterbury Woods ES. Due to grade configurations, see related middle school changes at Poe.
Belvedere: Create a new AAP Center at an elementary school in the Annandale HS Pyramid, such as Braddock ES or Annandale Terrace ES, in conjunction with their renovations. This option will provide capacity
Region 2 Elementary School Capacity Utilization, School Year 2019-20
FY 2016-20 • CAPITAL IMPROVEMENT PROGRAM • OFFICE OF FACILITIES PLANNING SERVICES • FAIRFAX COUNTY PUBLIC SCHOOLS
40
Region Summaries (Continued)
Kent Gardens: Capacity deficit accommodated with temporary facilities or interior architectural modifications.
Lemon Road: Reopen Pimmit Site as an elementary school to accommodate enrollment growth in the Marshall HS and McLean HS Pyramids.
Pine Spring: Reopen either the Leis Center or the Graham Road Community Building to provide capacity relief to the Falls Church/Marshall/McLean HS Pyramid schools.
Shrevewood: Reopen the Dunn Loring Administrative Center as an elementary school to accommodate projected growth in the surrounding schools (Freedom Hill ES, Shrevewood ES, Stenwood ES in the Marshall HS Pyramid).
Sleepy Hollow: Capacity deficit accommodated with temporary facilities or interior architectural modifications.
Stenwood: Reopen the Dunn Loring Administrative Center as an elementary school to accommodate projected growth in the surrounding schools (Freedom Hill ES, Shrevewood ES, Stenwood ES in the Marshall HS Pyramid).
Timber Lane: Reopen either the Leis Center or the Graham Road Community Building to provide capacity relief to the Falls Church/Marshall/McLean HS Pyramid schools.
Westbriar:
• At the conclusion of the capacity enhancement, the school will have a capacity of 900 students in the 2016-17 school year.
• Reassign Westbriar ES students who live closer to Colvin Run ES to Colvin Run ES.
• Reopen Pimmit Site as an elementary school to accommodate enrollment growth in the Marshall HS and McLean HS Pyramids.
Westgate:
• At the conclusion of the renovation and capacity enhancement, the school will have a capacity of 750 students in the 2016-17 school year.
• Reopen Pimmit Site as an elementary school to accommodate enrollment growth in the Marshall HS and McLean HS Pyramids.
Westlawn: Reopen either the Leis Center or the Graham Road Community Building to provide capacity relief to the Falls Church/Marshall/McLean HS Pyramid schools.
Weyanoke: Monitor enrollments.
Woodburn: Reopen either the Leis Center or the Graham Road Community Building to provide capacity relief to the Falls Church/Marshall/McLean HS Pyramid schools.
Bren Mar Park: Capacity deficit accommodated with temporary facilities or interior architectural modifications.
Chesterbrook: Construct an addition at Chesterbrook ES. Create a new AAP Center at Chesterbrook ES. Reassign AAP students residing within the Chesterbrook ES attendance area from Haycock ES AAP Center to the new AAP Center at Chesterbrook ES. This option will provide capacity relief to Chesterbrook ES and Haycock ES.
Columbia: Capacity deficit accommodated with temporary facilities or interior architectural modifications.
Fairhill: Capacity deficit accommodated with temporary facilities or interior architectural modifications.
Franklin Sherman: Construct an addition at Franklin Sherman ES. Create a new AAP Center at Franklin Sherman ES. Reassign AAP students residing within the Franklin Sherman ES attendance area from Haycock ES AAP Center to the new AAP Center at Franklin Sherman ES. This option will provide capacity relief to Franklin Sherman ES and Haycock ES.
Freedom Hill: Reopen the Dunn Loring Administrative Center as an elementary school to accommodate projected growth in the surrounding schools (Freedom Hill ES, Shrevewood ES, Stenwood ES in the Marshall HS Pyramid).
Glen Forest:
• Reassign students from Glen Forest ES to other Stuart HS Pyramid elementary schools which have sufficient capacity. This option will provide capacity relief to Glen Forest ES.
• Construct a new elementary school in the Eastern Fairfax County area. This option will provide capacity relief to neighboring schools such as Glen Forest ES.
Graham Road: Reopen either the Leis Center or the Graham Road Community Building to provide capacity relief to the Falls Church/Marshall/McLean HS Pyramid schools.
Haycock:
• At the conclusion of the renovation and capacity enhancement, the school will have a capacity of 877 students in the 2016-17 school year.
• Upon completion of additions and opening of new AAP Centers at Chesterbrook ES and Franklin Sherman ES: Reassign AAP students residing within the Chesterbrook ES attendance area from Haycock ES AAP Center to the new AAP Center at Chesterbrook ES. This option will provide capacity relief to Chesterbrook ES and Haycock ES. Reassign AAP students residing within the Franklin Sherman ES attendance area from Haycock ES AAP Center to the new AAP Center at Franklin Sherman ES. This option will provide capacity relief to Franklin Sherman ES and Haycock ES.

FY 2016-20 • CAPITAL IMPROVEMENT PROGRAM • OFFICE OF FACILITIES PLANNING SERVICES • FAIRFAX COUNTY PUBLIC SCHOOLS
41
Region Summaries (Continued)
For most recent capacity information see Facility & Enrollment Dashboard, http://www.fcps.edu/fts/dashboard.
Recommended boundary adjustment options and program changes are included in the CIP for future consideration only. Any option chosen for potential implementation will be discussed and decided through a transparent process that engages the community, in accordance with School Board Policy and Regulations. This includes adjustments needed for Advanced Academic Program centers at existing facilities and newly identified site locations.
Glasgow119%
Holmes96%
Jackson138%
Kilmer150%
Longfellow
Longfellow
Longfellow116%
Poe86%
Region 2 Middle SchoolsCapacity Utilization 2019 - 2020
Capacity Utilization
Less than 85%
85% - 94%
95% - 104%
105% - 114%
115% or More
Note: Based on 2014-15 school year attendance areas.
Jackson:
• Create a new AAP Center at Thoreau MS. Reassign AAP students residing within the Thoreau MS attendance area from Kilmer MS AAP Center and Jackson MS AAP Center to the new AAP Center at Thoreau MS. This option will provide capacity relief to Jackson MS and Kilmer MS.
• Reassign a portion of the Jackson MS students, who will eventually attend Oakton HS, to Thoreau MS. This option will provide capacity relief to Jackson MS and promote cohort survival.
Glasgow:
• Install a modular addition at Glasgow MS to accommodate severe capacity deficits over the next five years.
• Create a new AAP Center at Poe MS. Reassign the Annandale HS Pyramid middle school AAP students from Glasgow MS and Frost MS to the new AAP Center at Poe MS. This option will provide capacity relief to Glasgow MS and Frost MS. This option will promote the Annandale HS Pyramid cohorts.
Region 2 Middle School Capacity Utilization, School Year 2019-20

FY 2016-20 • CAPITAL IMPROVEMENT PROGRAM • OFFICE OF FACILITIES PLANNING SERVICES • FAIRFAX COUNTY PUBLIC SCHOOLS
42
Region Summaries (Continued)
Longfellow: Create a new AAP Center at Cooper MS. Reassign AAP students residing within the Cooper MS attendance area from Longfellow MS AAP Center and Kilmer MS AAP Center to the new AAP Center at Cooper MS. This option will provide capacity relief to Longfellow MS and Kilmer MS. It will create a full capacity middle school at Cooper MS. This new AAP Center will keep the Langley HS Pyramid cohorts together in middle school.
Poe: Create a new AAP Center at Poe MS. Reassign the Annandale HS Pyramid middle school AAP students from Glasgow MS and Frost MS to the new AAP Center at Poe MS. This option will provide capacity relief to Glasgow MS and Frost MS. This option will promote the Annandale HS Pyramid cohorts.
Kilmer:
• Create a new AAP Center at Cooper MS. Reassign AAP students residing within the Cooper MS attendance area from Longfellow MS AAP Center and Kilmer MS AAP Center to the new AAP Center at Cooper MS. This option will provide capacity relief to Longfellow MS and Kilmer MS. It will create a full capacity middle school at Cooper MS. This new AAP Center will keep the Langley HS Pyramid cohorts together in middle school.
• Create a new AAP Center at Thoreau MS. Reassign AAP students residing within the Thoreau MS attendance area from Kilmer MS AAP Center and Jackson MS AAP Center to the new AAP Center at Thoreau MS. This option will provide capacity relief to Jackson MS and Kilmer MS.
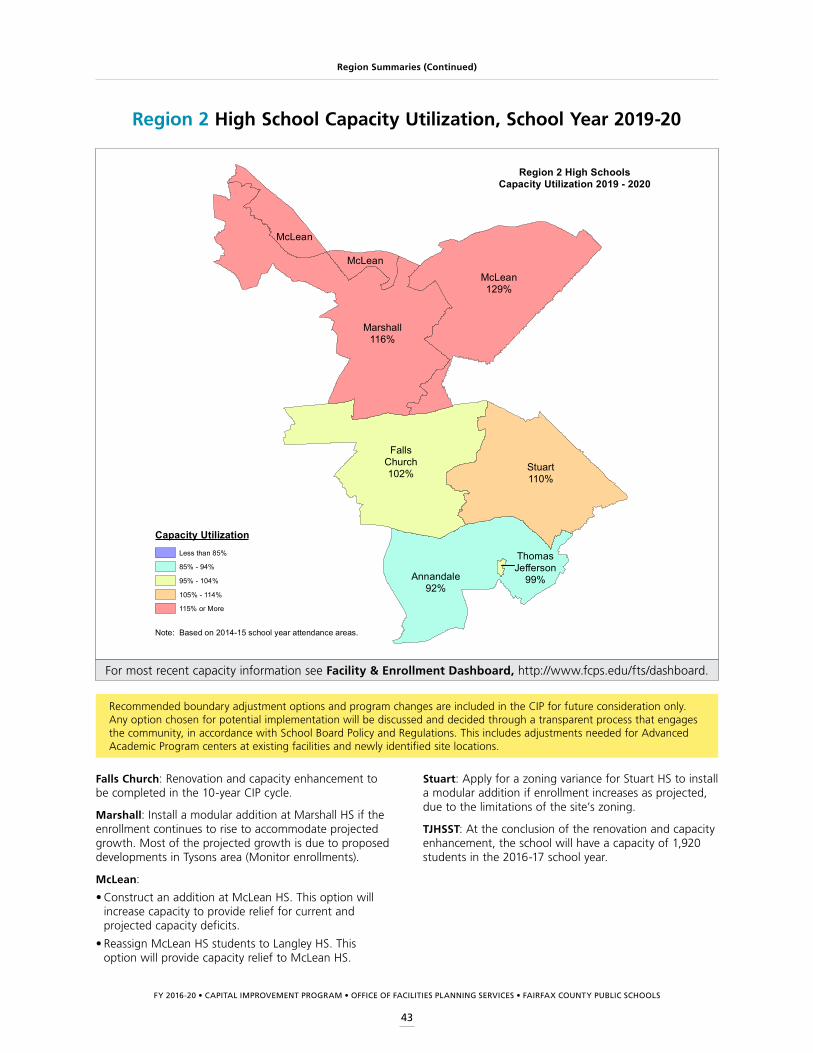
FY 2016-20 • CAPITAL IMPROVEMENT PROGRAM • OFFICE OF FACILITIES PLANNING SERVICES • FAIRFAX COUNTY PUBLIC SCHOOLS
43
Region Summaries (Continued)
For most recent capacity information see Facility & Enrollment Dashboard, http://www.fcps.edu/fts/dashboard.
Recommended boundary adjustment options and program changes are included in the CIP for future consideration only. Any option chosen for potential implementation will be discussed and decided through a transparent process that engages the community, in accordance with School Board Policy and Regulations. This includes adjustments needed for Advanced Academic Program centers at existing facilities and newly identified site locations.
Annandale92%
FallsChurch102%
Marshall116%
McLean
McLean
McLean129%
Stuart110%
ThomasJefferson
99%
Region 2 High SchoolsCapacity Utilization 2019 - 2020
Capacity UtilizationLess than 85%
85% - 94%
95% - 104%
105% - 114%
115% or More
Note: Based on 2014-15 school year attendance areas.
Stuart: Apply for a zoning variance for Stuart HS to install a modular addition if enrollment increases as projected, due to the limitations of the site’s zoning.
TJHSST: At the conclusion of the renovation and capacity enhancement, the school will have a capacity of 1,920 students in the 2016-17 school year.
Falls Church: Renovation and capacity enhancement to be completed in the 10-year CIP cycle.
Marshall: Install a modular addition at Marshall HS if the enrollment continues to rise to accommodate projected growth. Most of the projected growth is due to proposed developments in Tysons area (Monitor enrollments).
McLean:
• Construct an addition at McLean HS. This option will increase capacity to provide relief for current and projected capacity deficits.
• Reassign McLean HS students to Langley HS. This option will provide capacity relief to McLean HS.
Region 2 High School Capacity Utilization, School Year 2019-20
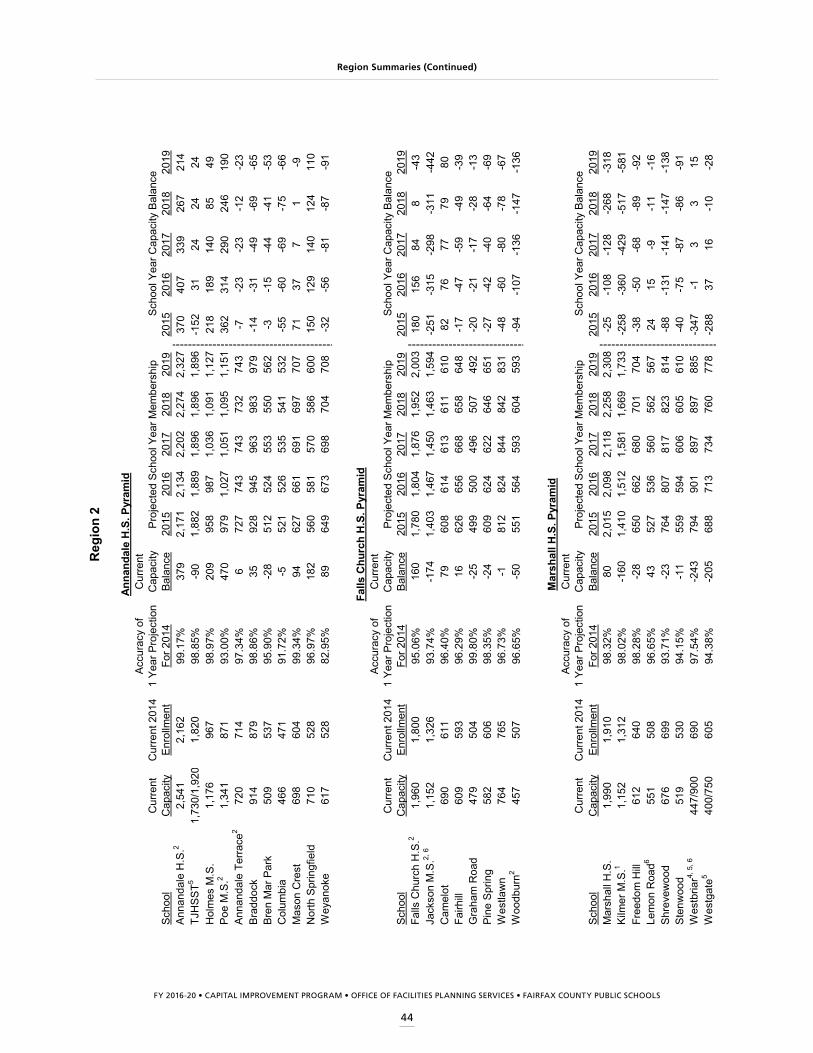
FY 2016-20 • CAPITAL IMPROVEMENT PROGRAM • OFFICE OF FACILITIES PLANNING SERVICES • FAIRFAX COUNTY PUBLIC SCHOOLS
44
Region Summaries (Continued)
Acc
urac
y of
Cur
rent
Cur
rent
Cur
rent
201
41
Year
Pro
ject
ion
Cap
acity
Sch
ool
Cap
acity
Enr
ollm
ent
For 2
014
Bal
ance
2015
2016
2017
2018
2019
2015
2016
2017
2018
2019
Ann
anda
le H
.S.2
2,54
12,
162
99.1
7%37
92,
171
2,13
42,
202
2,27
42,
327
370
407
339
267
214
TJH
SS
T51,
730/
1,92
01,
820
98.8
5%-9
01,
882
1,88
91,
896
1,89
61,
896
-152
3124
2424
Hol
mes
M.S
.1,
176
967
98.9
7%20
995
898
71,
036
1,09
11,
127
218
189
140
8549
Poe
M.S
.21,
341
871
93.0
0%47
097
91,
027
1,05
11,
095
1,15
136
231
429
024
619
0A
nnan
dale
Ter
race
272
071
497
.34%
672
774
374
373
274
3-7
-23
-23
-12
-23
Bra
ddoc
k91
487
998
.86%
3592
894
596
398
397
9-1
4-3
1-4
9-6
9-6
5B
ren
Mar
Par
k50
953
795
.90%
-28
512
524
553
550
562
-3-1
5-4
4-4
1-5
3C
olum
bia
466
471
91.7
2%-5
521
526
535
541
532
-55
-60
-69
-75
-66
Mas
on C
rest
698
604
99.3
4%94
627
661
691
697
707
7137
71
-9N
orth
Spr
ingf
ield
710
528
96.9
7%18
256
058
157
058
660
015
012
914
012
411
0W
eyan
oke
617
528
82.9
5%89
649
673
698
704
708
-32
-56
-81
-87
-91
Acc
urac
y of
Cur
rent
Cur
rent
Cur
rent
201
41
Year
Pro
ject
ion
Cap
acity
Sch
ool
Cap
acity
Enr
ollm
ent
For 2
014
Bal
ance
2015
2016
2017
2018
2019
2015
2016
2017
2018
2019
Falls
Chu
rch
H.S
.21,
960
1,80
095
.06%
160
1,78
01,
804
1,87
61,
952
2,00
318
015
684
8-4
3Ja
ckso
n M
.S.2,
61,
152
1,32
693
.74%
-174
1,40
31,
467
1,45
01,
463
1,59
4-2
51-3
15-2
98-3
11-4
42C
amel
ot69
061
196
.40%
7960
861
461
361
161
082
7677
7980
Fairh
ill60
959
396
.29%
1662
665
666
865
864
8-1
7-4
7-5
9-4
9-3
9G
raha
m R
oad
479
504
99.8
0%-2
549
950
049
650
749
2-2
0-2
1-1
7-2
8-1
3P
ine
Spr
ing
582
606
98.3
5%-2
460
962
462
264
665
1-2
7-4
2-4
0-6
4-6
9W
estla
wn
764
765
96.7
3%-1
812
824
844
842
831
-48
-60
-80
-78
-67
Woo
dbur
n245
750
796
.65%
-50
551
564
593
604
593
-94
-107
-136
-147
-136
Acc
urac
y of
Cur
rent
Cur
rent
Cur
rent
201
41
Year
Pro
ject
ion
Cap
acity
Sch
ool
Cap
acity
Enr
ollm
ent
For 2
014
Bal
ance
2015
2016
2017
2018
2019
2015
2016
2017
2018
2019
Mar
shal
l H.S
.1,
990
1,91
098
.32%
802,
015
2,09
82,
118
2,25
82,
308
-25
-108
-128
-268
-318
Kilm
er M
.S.1
1,15
21,
312
98.0
2%-1
601,
410
1,51
21,
581
1,66
91,
733
-258
-360
-429
-517
-581
Free
dom
Hill
612
640
98.2
8%-2
865
066
268
070
170
4-3
8-5
0-6
8-8
9-9
2Le
mon
Roa
d655
150
896
.65%
4352
753
656
056
256
724
15-9
-11
-16
Shr
evew
ood
676
699
93.7
1%-2
376
480
781
782
381
4-8
8-1
31-1
41-1
47-1
38S
tenw
ood
519
530
94.1
5%-1
155
959
460
660
561
0-4
0-7
5-8
7-8
6-9
1W
estb
riar4,
5, 6
447/
900
690
97.5
4%-2
4379
490
189
789
788
5-3
47-1
33
15W
estg
ate5
400/
750
605
94.3
8%-2
0568
871
373
476
077
8-2
8837
16-1
0-2
8
Mar
shal
l H.S
. Pyr
amid
Sch
ool Y
ear C
apac
ity B
alan
ce
Pro
ject
ed S
choo
l Yea
r Mem
bers
hip
Sch
ool Y
ear C
apac
ity B
alan
ce
Reg
ion
2
Anna
ndal
e H
.S. P
yram
id
Falls
Chu
rch
H.S
. Pyr
amid
Pro
ject
ed S
choo
l Yea
r Mem
bers
hip
Sch
ool Y
ear C
apac
ity B
alan
ceP
roje
cted
Sch
ool Y
ear M
embe
rshi
p
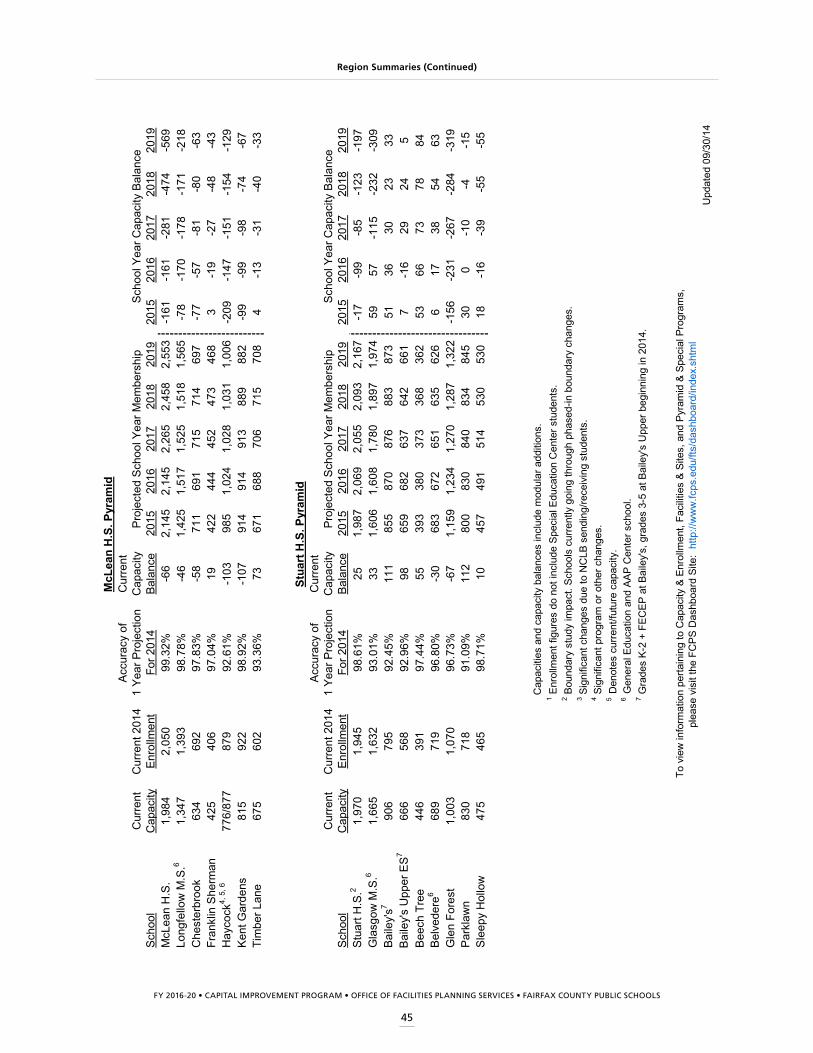
FY 2016-20 • CAPITAL IMPROVEMENT PROGRAM • OFFICE OF FACILITIES PLANNING SERVICES • FAIRFAX COUNTY PUBLIC SCHOOLS
45
Region Summaries (Continued)
Acc
urac
y of
Cur
rent
Cur
rent
Cur
rent
201
41
Year
Pro
ject
ion
Cap
acity
Sch
ool
Cap
acity
Enr
ollm
ent
For 2
014
Bal
ance
2015
2016
2017
2018
2019
2015
2016
2017
2018
2019
McL
ean
H.S
.1,
984
2,05
099
.32%
-66
2,14
52,
145
2,26
52,
458
2,55
3-1
61-1
61-2
81-4
74-5
69Lo
ngfe
llow
M.S
.61,
347
1,39
398
.78%
-46
1,42
51,
517
1,52
51,
518
1,56
5-7
8-1
70-1
78-1
71-2
18C
hest
erbr
ook
634
692
97.8
3%-5
871
169
171
571
469
7-7
7-5
7-8
1-8
0-6
3Fr
ankl
in S
herm
an42
540
697
.04%
1942
244
445
247
346
83
-19
-27
-48
-43
Hay
cock
4, 5
, 677
6/87
787
992
.61%
-103
985
1,02
41,
028
1,03
11,
006
-209
-147
-151
-154
-129
Ken
t Gar
dens
815
922
98.9
2%-1
0791
491
491
388
988
2-9
9-9
9-9
8-7
4-6
7Ti
mbe
r Lan
e67
560
293
.36%
7367
168
870
671
570
84
-13
-31
-40
-33
Acc
urac
y of
Cur
rent
Cur
rent
Cur
rent
201
41
Year
Pro
ject
ion
Cap
acity
Sch
ool
Cap
acity
Enr
ollm
ent
For 2
014
Bal
ance
2015
2016
2017
2018
2019
2015
2016
2017
2018
2019
Stu
art H
.S.2
1,97
01,
945
98.6
1%25
1,98
72,
069
2,05
52,
093
2,16
7-1
7-9
9-8
5-1
23-1
97G
lasg
ow M
.S.6
1,66
51,
632
93.0
1%33
1,60
61,
608
1,78
01,
897
1,97
459
57-1
15-2
32-3
09B
aile
y's7
906
795
92.4
5%11
185
587
087
688
387
351
3630
2333
Bai
ley'
s U
pper
ES
766
656
892
.96%
9865
968
263
764
266
17
-16
2924
5B
eech
Tre
e44
639
197
.44%
5539
338
037
336
836
253
6673
7884
Bel
vede
re6
689
719
96.8
0%-3
068
367
265
163
562
66
1738
5463
Gle
n Fo
rest
1,00
31,
070
96.7
3%-6
71,
159
1,23
41,
270
1,28
71,
322
-156
-231
-267
-284
-319
Par
klaw
n83
071
891
.09%
112
800
830
840
834
845
300
-10
-4-1
5S
leep
y H
ollo
w47
546
598
.71%
1045
749
151
453
053
018
-16
-39
-55
-55
6 G
ener
al E
duca
tion
and
AAP
Cen
ter s
choo
l.7 G
rade
s K-
2 +
FEC
EP a
t Bai
ley'
s, g
rade
s 3-
5 at
Bai
ley'
s U
pper
beg
inni
ng in
201
4.
Upd
ated
09/
30/1
4
McL
ean
H.S
. Pyr
amid
5 D
enot
es c
urre
nt/fu
ture
cap
acity
.
4 Sig
nific
ant p
rogr
am o
r oth
er c
hang
es.
2 Bou
ndar
y st
udy
impa
ct. S
choo
ls c
urre
ntly
goi
ng th
roug
h ph
ased
-in b
ound
ary
chan
ges.
Sch
ool Y
ear C
apac
ity B
alan
ce
Stua
rt H
.S. P
yram
id
Pro
ject
ed S
choo
l Yea
r Mem
bers
hip
Sch
ool Y
ear C
apac
ity B
alan
ce
To
view
info
rmat
ion
perta
inin
g to
Cap
acity
& E
nrol
lmen
t, Fa
cilit
ies
& Si
tes,
and
Pyr
amid
& S
peci
al P
rogr
ams,
plea
se v
isit
the
FCPS
Das
hboa
rd S
ite:
http
://w
ww
.fcps
.edu
/fts/
dash
boar
d/in
dex.
shtm
l
Cap
aciti
es a
nd c
apac
ity b
alan
ces
incl
ude
mod
ular
add
ition
s.
3 Sig
nific
ant c
hang
es d
ue to
NC
LB s
endi
ng/re
ceiv
ing
stud
ents
.
Pro
ject
ed S
choo
l Yea
r Mem
bers
hip
1 Enr
ollm
ent f
igur
es d
o no
t inc
lude
Spe
cial
Edu
catio
n C
ente
r stu
dent
s.
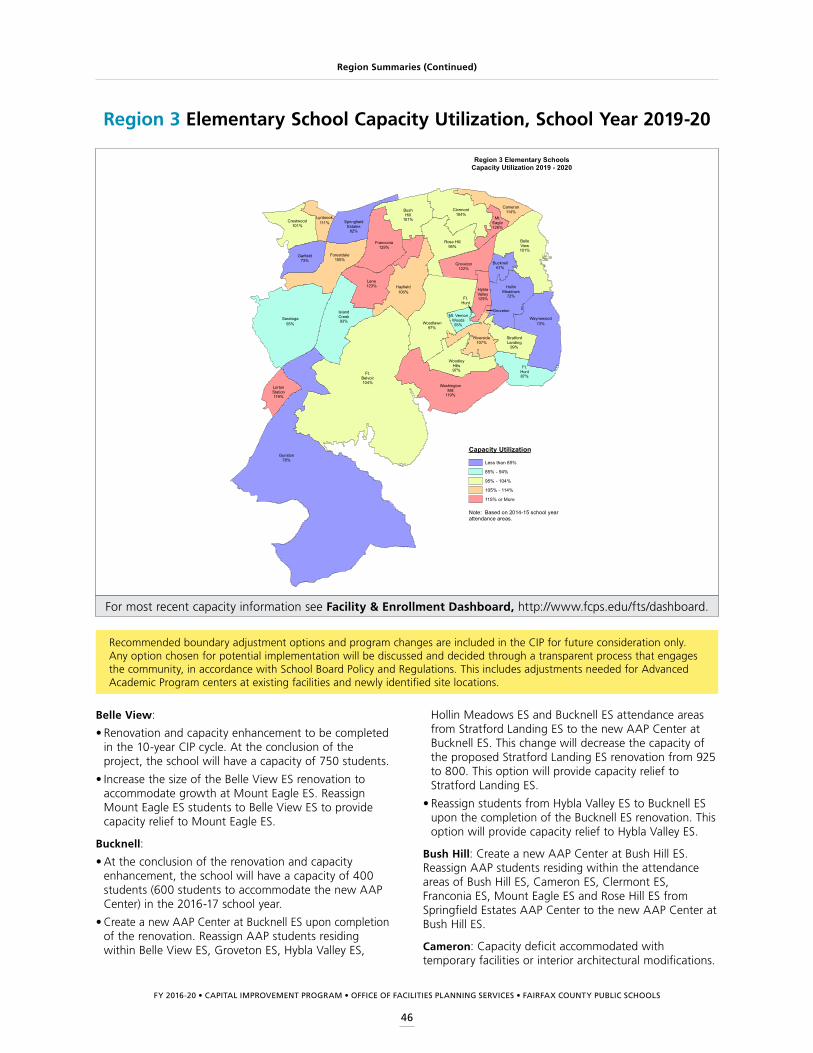
FY 2016-20 • CAPITAL IMPROVEMENT PROGRAM • OFFICE OF FACILITIES PLANNING SERVICES • FAIRFAX COUNTY PUBLIC SCHOOLS
46
Region Summaries (Continued)
Recommended boundary adjustment options and program changes are included in the CIP for future consideration only. Any option chosen for potential implementation will be discussed and decided through a transparent process that engages the community, in accordance with School Board Policy and Regulations. This includes adjustments needed for Advanced Academic Program centers at existing facilities and newly identified site locations.
For most recent capacity information see Facility & Enrollment Dashboard, http://www.fcps.edu/fts/dashboard.
Region 3 Elementary School Capacity Utilization, School Year 2019-20
Ft.Hunt
Groveton
BelleView101%
Bucknell67%
BushHill
101%
Cameron114%Clermont
104%Crestwood
101%
Forestdale105%
Ft.Belvoir104%
Ft.Hunt87%
Franconia129%
Garfield73%
Groveton122%
Gunston78%
Hayfield106%
HollinMeadows
72%HyblaValley129%
IslandCreek93%
Lane123%
LortonStation119%
Lynbrook111%
Mt.Eagle126%
Mt. VernonWoods93%
Riverside107%
Rose Hill95%
Saratoga93%
SpringfieldEstates
82%
StratfordLanding
99%
WashingtonMill
119%
Waynewood73%Woodlawn
97%
WoodleyHills97%
Region 3 Elementary SchoolsCapacity Utilization 2019 - 2020
Capacity Utilization
Less than 85%
85% - 94%
95% - 104%
105% - 114%
115% or More
Note: Based on 2014-15 school yearattendance areas.
Hollin Meadows ES and Bucknell ES attendance areas from Stratford Landing ES to the new AAP Center at Bucknell ES. This change will decrease the capacity of the proposed Stratford Landing ES renovation from 925 to 800. This option will provide capacity relief to Stratford Landing ES.
• Reassign students from Hybla Valley ES to Bucknell ES upon the completion of the Bucknell ES renovation. This option will provide capacity relief to Hybla Valley ES.
Bush Hill: Create a new AAP Center at Bush Hill ES. Reassign AAP students residing within the attendance areas of Bush Hill ES, Cameron ES, Clermont ES, Franconia ES, Mount Eagle ES and Rose Hill ES from Springfield Estates AAP Center to the new AAP Center at Bush Hill ES.
Cameron: Capacity deficit accommodated with temporary facilities or interior architectural modifications.
Belle View:
• Renovation and capacity enhancement to be completed in the 10-year CIP cycle. At the conclusion of the project, the school will have a capacity of 750 students.
• Increase the size of the Belle View ES renovation to accommodate growth at Mount Eagle ES. Reassign Mount Eagle ES students to Belle View ES to provide capacity relief to Mount Eagle ES.
Bucknell:
• At the conclusion of the renovation and capacity enhancement, the school will have a capacity of 400 students (600 students to accommodate the new AAP Center) in the 2016-17 school year.
• Create a new AAP Center at Bucknell ES upon completion of the renovation. Reassign AAP students residing within Belle View ES, Groveton ES, Hybla Valley ES,
FY 2016-20 • CAPITAL IMPROVEMENT PROGRAM • OFFICE OF FACILITIES PLANNING SERVICES • FAIRFAX COUNTY PUBLIC SCHOOLS
47
Region Summaries (Continued)
Mount Vernon Woods: Renovation to be completed in the 2019-20 school year.
Riverside: Capacity deficit accommodated with temporary facilities or interior architectural modifications.
Rose Hill: Reopen Virginia Hills Administrative Center as a new Arts & Science Magnet Elementary School. Reassign students from Groveton ES and Rose Hill ES to this new school. This option will provide capacity relief to each facility. In addition, the new school will have approximately 200 seats available for the magnet program.
Springfield Estates: Create a new AAP Center at Bush Hill ES. Reassign AAP students residing within the attendance areas of Bush Hill ES, Cameron ES, Clermont ES, Franconia ES, Mount Eagle ES and Rose Hill ES from Springfield Estates AAP Center to the new AAP Center at Bush Hill ES.
Stratford Landing:
• At the conclusion of the renovation and capacity enhancement, the school will have a capacity of 925 students (800 students if the AAP Center is realigned with the new AAP Center at Bucknell ES) in the 2018-19 school year.
• Create a new AAP Center at Bucknell ES upon completion of the renovation. Reassign AAP students residing within Belle View ES, Groveton ES, Hybla Valley ES, Hollin Meadows ES and Bucknell ES attendance areas from Stratford Landing ES to the new AAP Center at Bucknell ES. This change will increase the Bucknell ES capacity from 400 to 600. This option will provide capacity relief to Stratford Landing ES.
• Reassign students from Hybla Valley ES to Hollin Meadows ES and Stratford Landing ES upon the completion of their renovation projects. This option will provide capacity relief to Hybla Valley ES.
• Reassign students from Stratford Landing ES to Fort Hunt ES. This option will provide capacity relief to Stratford Landing ES and will reduce the capacity enhancement needed with the renovation.
• Relocate modular additions from Stratford Landing ES to West Potomac HS to accommodate enrollment growth.
Washington Mill: Renovation and capacity enhancement to be completed in the 10-year CIP cycle.
Waynewood: Relocate modular additions from Waynewood ES to West Potomac HS to accommodate enrollment growth.
Woodlawn: At the conclusion of the renovation and capacity enhancement, the school will have a capacity of 700 students in the 2016-17 school year.
Clermont: At the conclusion of the renovation and capacity enhancement, the school will have a capacity of 600 students in the 2015-16 school year.
Forestdale: Capacity deficit accommodated with temporary facilities or interior architectural modifications. (Projected growth from Springfield Mall Developments)
Fort Hunt: Reassign students from Stratford Landing ES to Fort Hunt ES. This option will provide capacity relief to Stratford Landing ES and will reduce the capacity enhancement needed with the renovation.
Franconia: Capacity deficit accommodated with temporary facilities or interior architectural modifications.
Garfield: At the conclusion of the renovation and capacity enhancement, the school will have a capacity of 475 students in the 2015-16 school year.
Groveton: Reopen Virginia Hills Administrative Center as a new Arts & Science Magnet Elementary School. Reassign students from Groveton ES and Rose Hill ES to this new school. This option will provide capacity relief to each facility. In addition, the new school will have approximately 200 seats available for the magnet program.
Hayfield: Capacity deficit accommodated with temporary facilities or interior architectural modifications.
Hollin Meadows:
• At the conclusion of the renovation and capacity enhancement, the school will have a capacity of 875 students in the 2019-20 school year.
• Reassign students from Hybla Valley ES to Hollin Meadows ES and Stratford Landing ES upon the completion of their renovation projects. This option will provide capacity relief to Hybla Valley ES.
Hybla Valley:
• Reassign students from Hybla Valley ES to Hollin Meadows ES and Stratford Landing ES upon the completion of their renovation projects. This option will provide capacity relief to Hybla Valley ES.
• Reassign students from Hybla Valley ES to Bucknell ES upon the completion of the Bucknell ES renovation. This option will provide capacity relief to Hybla Valley ES.
Lane: Potential for Capacity Enhancement.
Lorton Station: Create a new AAP Center at either Newington Forest ES or Silverbrook ES to provide capacity relief to Lorton Station ES. Reassign AAP students from Lorton Station ES AAP Center to the new AAP Center. This option will create an AAP Center in the South County HS Pyramid which will keep the cohorts together.
Lynbrook: Capacity deficit accommodated with temporary facilities or interior architectural modifications.
Mount Eagle: Increase the size of the Belle View ES renovation to accommodate growth at Mount Eagle ES. Reassign Mount Eagle ES students to Belle View ES to provide capacity relief to Mount Eagle ES.

FY 2016-20 • CAPITAL IMPROVEMENT PROGRAM • OFFICE OF FACILITIES PLANNING SERVICES • FAIRFAX COUNTY PUBLIC SCHOOLS
48
Region Summaries (Continued)
For most recent capacity information see Facility & Enrollment Dashboard, http://www.fcps.edu/fts/dashboard.
Recommended boundary adjustment options and program changes are included in the CIP for future consideration only. Any option chosen for potential implementation will be discussed and decided through a transparent process that engages the community, in accordance with School Board Policy and Regulations. This includes adjustments needed for Advanced Academic Program centers at existing facilities and newly identified site locations.
Hayfield81%
Key91%
Sandburg105%
Twain105%
Whitman85%
Region 3 Middle SchoolsCapacity Utilization 2019 - 2020
Capacity Utilization
Less than 85%
85% - 94%
95% - 104%
105% - 114%
115% or More
Note: Based on 2014-15 school yearattendance areas.
Sandburg: At the conclusion of the renovation and capacity enhancement, the school will have a capacity of 1,525 students in the 2015-16 school year.
Twain: Capacity deficit accommodated with temporary facilities or interior architectural modifications.
Region 3 Middle School Capacity Utilization, School Year 2019-20
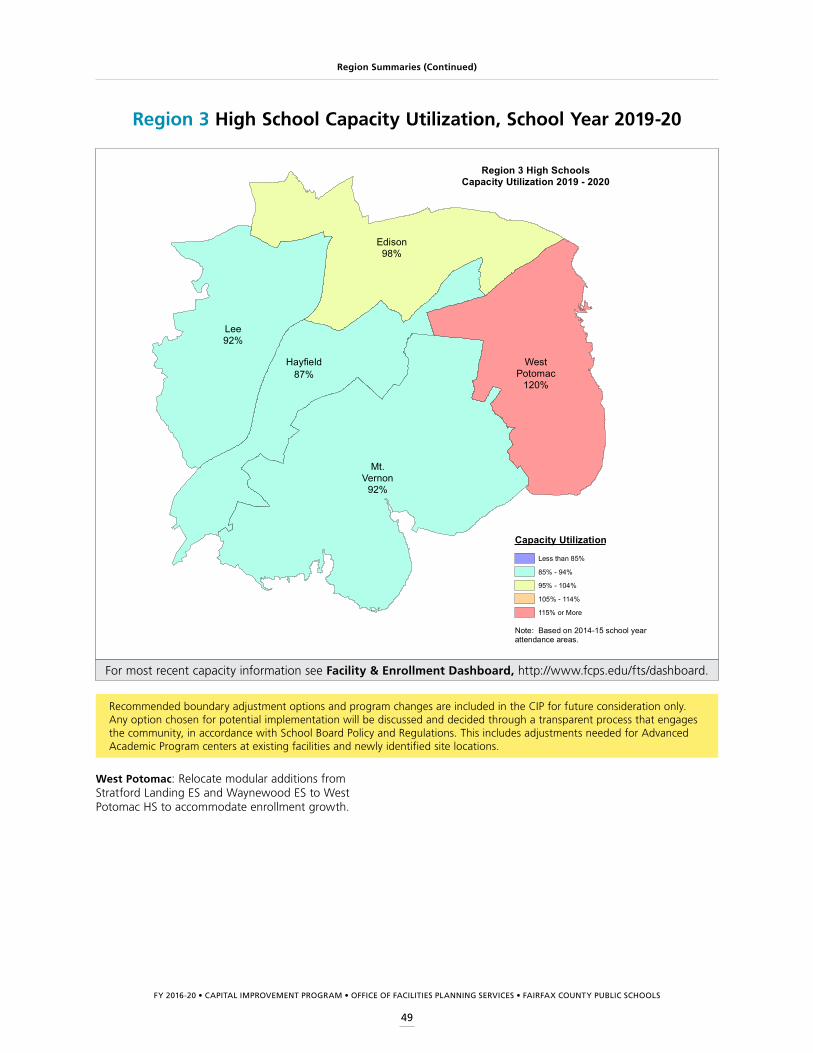
FY 2016-20 • CAPITAL IMPROVEMENT PROGRAM • OFFICE OF FACILITIES PLANNING SERVICES • FAIRFAX COUNTY PUBLIC SCHOOLS
49
Region Summaries (Continued)
For most recent capacity information see Facility & Enrollment Dashboard, http://www.fcps.edu/fts/dashboard.
Recommended boundary adjustment options and program changes are included in the CIP for future consideration only. Any option chosen for potential implementation will be discussed and decided through a transparent process that engages the community, in accordance with School Board Policy and Regulations. This includes adjustments needed for Advanced Academic Program centers at existing facilities and newly identified site locations.
Edison98%
Hayfield87%
Lee92%
Mt.Vernon
92%
WestPotomac
120%
Region 3 High SchoolsCapacity Utilization 2019 - 2020
Capacity Utilization
Less than 85%
85% - 94%
95% - 104%
105% - 114%
115% or More
Note: Based on 2014-15 school yearattendance areas.
West Potomac: Relocate modular additions from Stratford Landing ES and Waynewood ES to West Potomac HS to accommodate enrollment growth.
Region 3 High School Capacity Utilization, School Year 2019-20

FY 2016-20 • CAPITAL IMPROVEMENT PROGRAM • OFFICE OF FACILITIES PLANNING SERVICES • FAIRFAX COUNTY PUBLIC SCHOOLS
50
Region Summaries (Continued)
Acc
urac
y of
Cur
rent
Cur
rent
Cur
rent
201
41
Year
Pro
ject
ion
Cap
acity
Sch
ool
Cap
acity
Enr
ollm
ent
For 2
014
Bal
ance
2015
2016
2017
2018
2019
2015
2016
2017
2018
2019
Edi
son
H.S
.22,
101
1,90
597
.01%
196
1,90
71,
922
1,94
91,
989
2,06
319
417
915
211
238
Twai
n M
.S.6
1,01
693
096
.13%
8695
997
198
71,
014
1,06
957
4529
2-5
3B
ush
Hill
355
447
293
.01%
8251
854
555
156
255
836
93
-8-4
Cam
eron
653
522
96.7
4%13
155
860
565
169
174
395
482
-38
-90
Cle
rmon
t3, 5
350/
600
544
99.6
3%-1
9458
461
262
261
862
116
-12
-22
-18
-21
Fran
coni
a53
052
794
.50%
356
860
264
966
568
6-3
8-7
2-1
19-1
35-1
56M
ount
Eag
le40
040
192
.77%
-145
748
349
050
950
4-5
7-8
3-9
0-1
09-1
04R
ose
Hill
844
752
97.8
7%92
781
780
797
809
801
6364
4735
43
Acc
urac
y of
Cur
rent
Cur
rent
Cur
rent
201
41
Year
Pro
ject
ion
Cap
acity
Sch
ool
Cap
acity
Enr
ollm
ent
For 2
014
Bal
ance
2015
2016
2017
2018
2019
2015
2016
2017
2018
2019
Hay
field
H.S
.22,
235
1,99
295
.98%
243
1,90
41,
835
1,85
51,
889
1,94
033
140
038
034
629
5H
ayfie
ld M
.S.2
1,26
987
298
.74%
397
873
921
950
999
1,02
539
634
831
927
024
4G
unst
on62
153
296
.80%
8953
351
849
847
948
288
103
123
142
139
Hay
field
375
071
599
.58%
3571
174
277
078
079
239
8-2
0-3
0-4
2Is
land
Cre
ek3
846
792
98.8
6%54
803
804
802
789
791
4342
4457
55La
ne3
820
838
98.6
9%-1
887
092
496
099
11,
010
-50
-104
-140
-171
-190
Lorto
n S
tatio
n684
11,
071
97.8
5%-2
301,
041
1,01
31,
020
1,01
91,
000
-200
-172
-179
-178
-159
Acc
urac
y of
Cur
rent
Cur
rent
Cur
rent
201
41
Year
Pro
ject
ion
Cap
acity
Sch
ool
Cap
acity
Enr
ollm
ent
For 2
014
Bal
ance
2015
2016
2017
2018
2019
2015
2016
2017
2018
2019
Lee
H.S
.2,
075
1,80
398
.61%
272
1,76
11,
774
1,81
61,
844
1,91
531
430
125
923
116
0K
ey M
.S.1
1,08
089
493
.85%
186
831
799
859
936
985
249
281
221
144
95C
rest
woo
d68
967
798
.52%
1270
972
172
171
069
6-2
0-3
2-3
2-2
1-7
Fore
stda
le64
857
389
.35%
7564
967
665
466
367
9-1
-28
-6-1
5-3
1G
arfie
ld5
363/
475
371
98.3
8%-8
365
361
353
350
349
110
114
122
125
126
Lynb
rook
679
694
97.1
2%-1
569
874
276
175
675
5-1
9-6
3-8
2-7
7-7
6S
arat
oga
857
752
98.0
1%10
577
276
377
780
480
185
9480
5356
Spr
ingf
ield
Est
ates
681
476
994
.93%
4573
570
568
468
166
479
109
130
133
150
Sch
ool Y
ear C
apac
ity B
alan
ceP
roje
cted
Sch
ool Y
ear M
embe
rshi
p
Reg
ion
3
Edis
on H
.S. P
yram
id
Hay
field
H.S
. Pyr
amid
Pro
ject
ed S
choo
l Yea
r Mem
bers
hip
Sch
ool Y
ear C
apac
ity B
alan
ce
Pro
ject
ed S
choo
l Yea
r Mem
bers
hip
Sch
ool Y
ear C
apac
ity B
alan
ce
Lee
H.S
. Pyr
amid
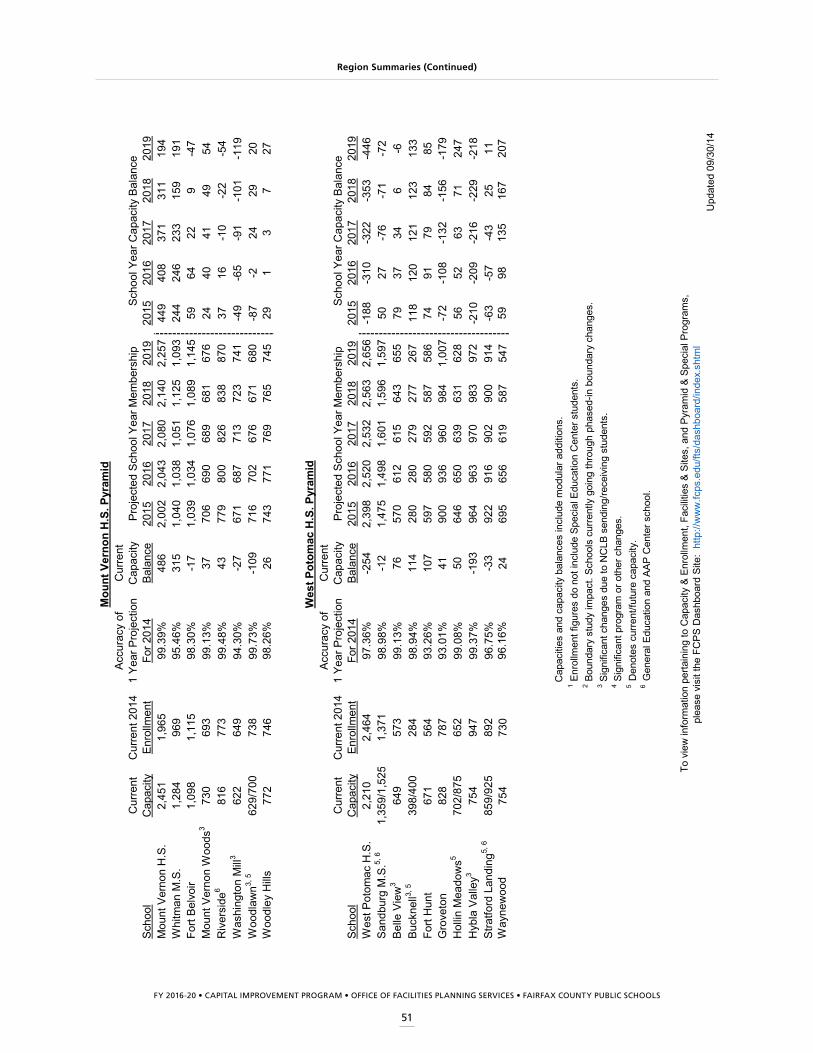
FY 2016-20 • CAPITAL IMPROVEMENT PROGRAM • OFFICE OF FACILITIES PLANNING SERVICES • FAIRFAX COUNTY PUBLIC SCHOOLS
51
Region Summaries (Continued)
Acc
urac
y of
Cur
rent
Cur
rent
Cur
rent
201
41
Year
Pro
ject
ion
Cap
acity
Sch
ool
Cap
acity
Enr
ollm
ent
For 2
014
Bal
ance
2015
2016
2017
2018
2019
2015
2016
2017
2018
2019
Mou
nt V
erno
n H
.S.
2,45
11,
965
99.3
9%48
62,
002
2,04
32,
080
2,14
02,
257
449
408
371
311
194
Whi
tman
M.S
.1,
284
969
95.4
6%31
51,
040
1,03
81,
051
1,12
51,
093
244
246
233
159
191
Fort
Bel
voir
1,09
81,
115
98.3
0%-1
71,
039
1,03
41,
076
1,08
91,
145
5964
229
-47
Mou
nt V
erno
n W
oods
373
069
399
.13%
3770
669
068
968
167
624
4041
4954
Riv
ersi
de6
816
773
99.4
8%43
779
800
826
838
870
3716
-10
-22
-54
Was
hing
ton
Mill
362
264
994
.30%
-27
671
687
713
723
741
-49
-65
-91
-101
-119
Woo
dlaw
n3, 5
629/
700
738
99.7
3%-1
0971
670
267
667
168
0-8
7-2
2429
20W
oodl
ey H
ills
772
746
98.2
6%26
743
771
769
765
745
291
37
27
Acc
urac
y of
Cur
rent
Cur
rent
Cur
rent
201
41
Year
Pro
ject
ion
Cap
acity
Sch
ool
Cap
acity
Enr
ollm
ent
For 2
014
Bal
ance
2015
2016
2017
2018
2019
2015
2016
2017
2018
2019
Wes
t Pot
omac
H.S
.2,
210
2,46
497
.36%
-254
2,39
82,
520
2,53
22,
563
2,65
6-1
88-3
10-3
22-3
53-4
46S
andb
urg
M.S
.5, 6
1,35
9/1,
525
1,37
198
.98%
-12
1,47
51,
498
1,60
11,
596
1,59
750
27-7
6-7
1-7
2B
elle
Vie
w3
649
573
99.1
3%76
570
612
615
643
655
7937
346
-6B
uckn
ell3,
539
8/40
028
498
.94%
114
280
280
279
277
267
118
120
121
123
133
Fort
Hun
t67
156
493
.26%
107
597
580
592
587
586
7491
7984
85G
rove
ton
828
787
93.0
1%41
900
936
960
984
1,00
7-7
2-1
08-1
32-1
56-1
79H
ollin
Mea
dow
s570
2/87
565
299
.08%
5064
665
063
963
162
856
5263
7124
7H
ybla
Val
ley3
754
947
99.3
7%-1
9396
496
397
098
397
2-2
10-2
09-2
16-2
29-2
18S
tratfo
rd L
andi
ng5,
685
9/92
589
296
.75%
-33
922
916
902
900
914
-63
-57
-43
2511
Way
new
ood
754
730
96.1
6%24
695
656
619
587
547
5998
135
167
207
6 G
ener
al E
duca
tion
and
AAP
Cen
ter s
choo
l.
To
view
info
rmat
ion
perta
inin
g to
Cap
acity
& E
nrol
lmen
t, Fa
cilit
ies
& Si
tes,
and
Pyr
amid
& S
peci
al P
rogr
ams,
plea
se v
isit
the
FCPS
Das
hboa
rd S
ite:
http
://w
ww
.fcps
.edu
/fts/
dash
boar
d/in
dex.
shtm
l
Cap
aciti
es a
nd c
apac
ity b
alan
ces
incl
ude
mod
ular
add
ition
s.
3 Sig
nific
ant c
hang
es d
ue to
NC
LB s
endi
ng/re
ceiv
ing
stud
ents
.
Pro
ject
ed S
choo
l Yea
r Mem
bers
hip
1 Enr
ollm
ent f
igur
es d
o no
t inc
lude
Spe
cial
Edu
catio
n C
ente
r stu
dent
s.
5 D
enot
es c
urre
nt/fu
ture
cap
acity
.
4 Sig
nific
ant p
rogr
am o
r oth
er c
hang
es.
2 Bou
ndar
y st
udy
impa
ct. S
choo
ls c
urre
ntly
goi
ng th
roug
h ph
ased
-in b
ound
ary
chan
ges.S
choo
l Yea
r Cap
acity
Bal
ance
Wes
t Pot
omac
H.S
. Pyr
amid
Pro
ject
ed S
choo
l Yea
r Mem
bers
hip
Sch
ool Y
ear C
apac
ity B
alan
ce
Upd
ated
09/
30/1
4
Mou
nt V
erno
n H
.S. P
yram
id
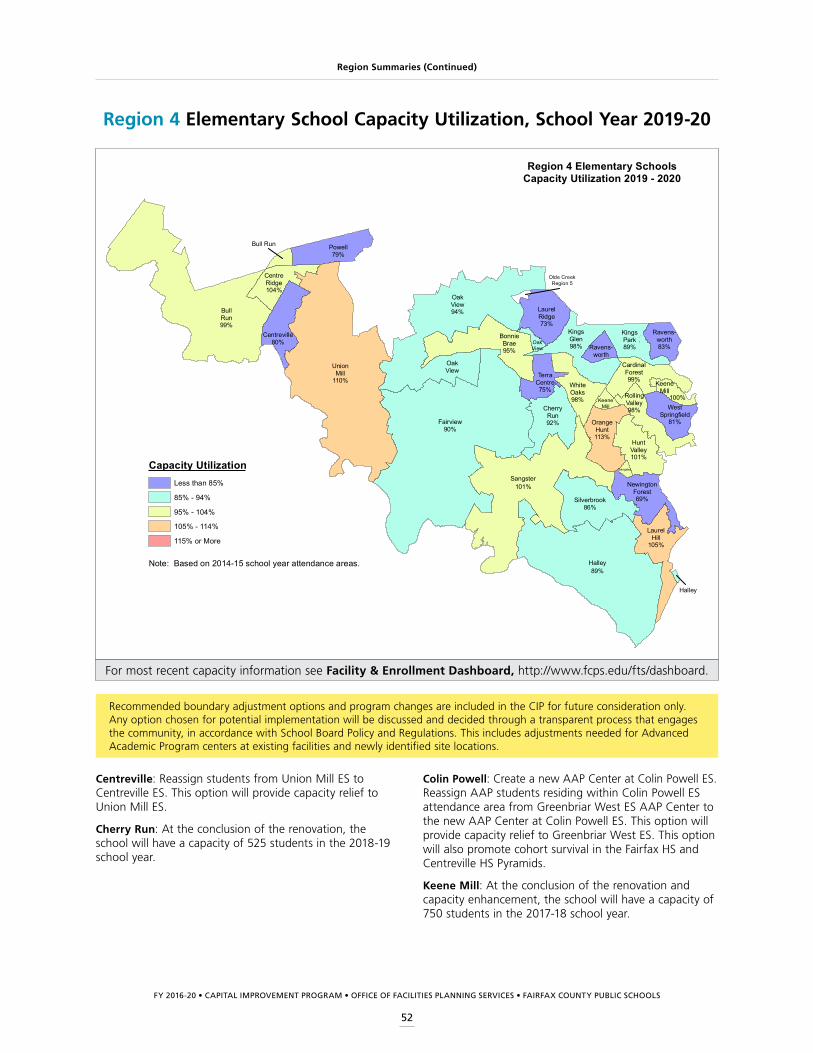
FY 2016-20 • CAPITAL IMPROVEMENT PROGRAM • OFFICE OF FACILITIES PLANNING SERVICES • FAIRFAX COUNTY PUBLIC SCHOOLS
52
Region Summaries (Continued)
For most recent capacity information see Facility & Enrollment Dashboard, http://www.fcps.edu/fts/dashboard.
Recommended boundary adjustment options and program changes are included in the CIP for future consideration only. Any option chosen for potential implementation will be discussed and decided through a transparent process that engages the community, in accordance with School Board Policy and Regulations. This includes adjustments needed for Advanced Academic Program centers at existing facilities and newly identified site locations.
Centreville: Reassign students from Union Mill ES to Centreville ES. This option will provide capacity relief to Union Mill ES.
Cherry Run: At the conclusion of the renovation, the school will have a capacity of 525 students in the 2018-19 school year.
Colin Powell: Create a new AAP Center at Colin Powell ES. Reassign AAP students residing within Colin Powell ES attendance area from Greenbriar West ES AAP Center to the new AAP Center at Colin Powell ES. This option will provide capacity relief to Greenbriar West ES. This option will also promote cohort survival in the Fairfax HS and Centreville HS Pyramids.
Keene Mill: At the conclusion of the renovation and capacity enhancement, the school will have a capacity of 750 students in the 2017-18 school year.
OakView
KingsGlen98%
100%
Bull Run
Halley
BonnieBrae95%
BullRun99%
CardinalForest99%
CentreRidge104%
Centreville80%
CherryRun92%Fairview
90%
Halley89%
HuntValley101%
KeeneMill
KeeneMill
KingsPark89%
LaurelHill
105%
LaurelRidge73%
NewingtonForest69%
OakView
OakView94%
OrangeHunt113%
Powell79%
Ravens-worth
Ravens-worth83%
RollingValley98%
Sangster
Sangster101%
Silverbrook86%
TerraCentre75%
UnionMill
110%
WestSpringfield
81%
WhiteOaks98%
Region 4 Elementary SchoolsCapacity Utilization 2019 - 2020
Less than 85%
85% - 94%
95% - 104%
105% - 114%
115% or More
Capacity Utilization
Olde CreekRegion 5
Note: Based on 2014-15 school year attendance areas.
Region 4 Elementary School Capacity Utilization, School Year 2019-20
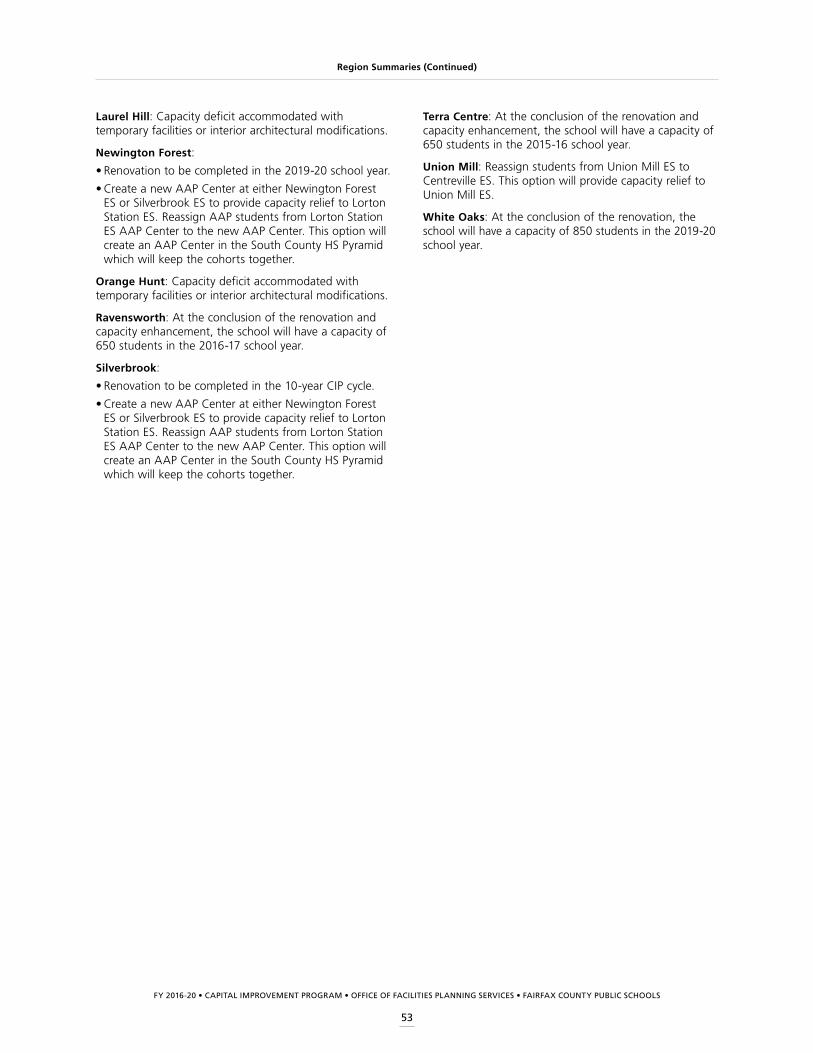
FY 2016-20 • CAPITAL IMPROVEMENT PROGRAM • OFFICE OF FACILITIES PLANNING SERVICES • FAIRFAX COUNTY PUBLIC SCHOOLS
53
Region Summaries (Continued)
Laurel Hill: Capacity deficit accommodated with temporary facilities or interior architectural modifications.
Newington Forest:
• Renovation to be completed in the 2019-20 school year.
• Create a new AAP Center at either Newington Forest ES or Silverbrook ES to provide capacity relief to Lorton Station ES. Reassign AAP students from Lorton Station ES AAP Center to the new AAP Center. This option will create an AAP Center in the South County HS Pyramid which will keep the cohorts together.
Orange Hunt: Capacity deficit accommodated with temporary facilities or interior architectural modifications.
Ravensworth: At the conclusion of the renovation and capacity enhancement, the school will have a capacity of 650 students in the 2016-17 school year.
Silverbrook:
• Renovation to be completed in the 10-year CIP cycle.
• Create a new AAP Center at either Newington Forest ES or Silverbrook ES to provide capacity relief to Lorton Station ES. Reassign AAP students from Lorton Station ES AAP Center to the new AAP Center. This option will create an AAP Center in the South County HS Pyramid which will keep the cohorts together.
Terra Centre: At the conclusion of the renovation and capacity enhancement, the school will have a capacity of 650 students in the 2015-16 school year.
Union Mill: Reassign students from Union Mill ES to Centreville ES. This option will provide capacity relief to Union Mill ES.
White Oaks: At the conclusion of the renovation, the school will have a capacity of 850 students in the 2019-20 school year.
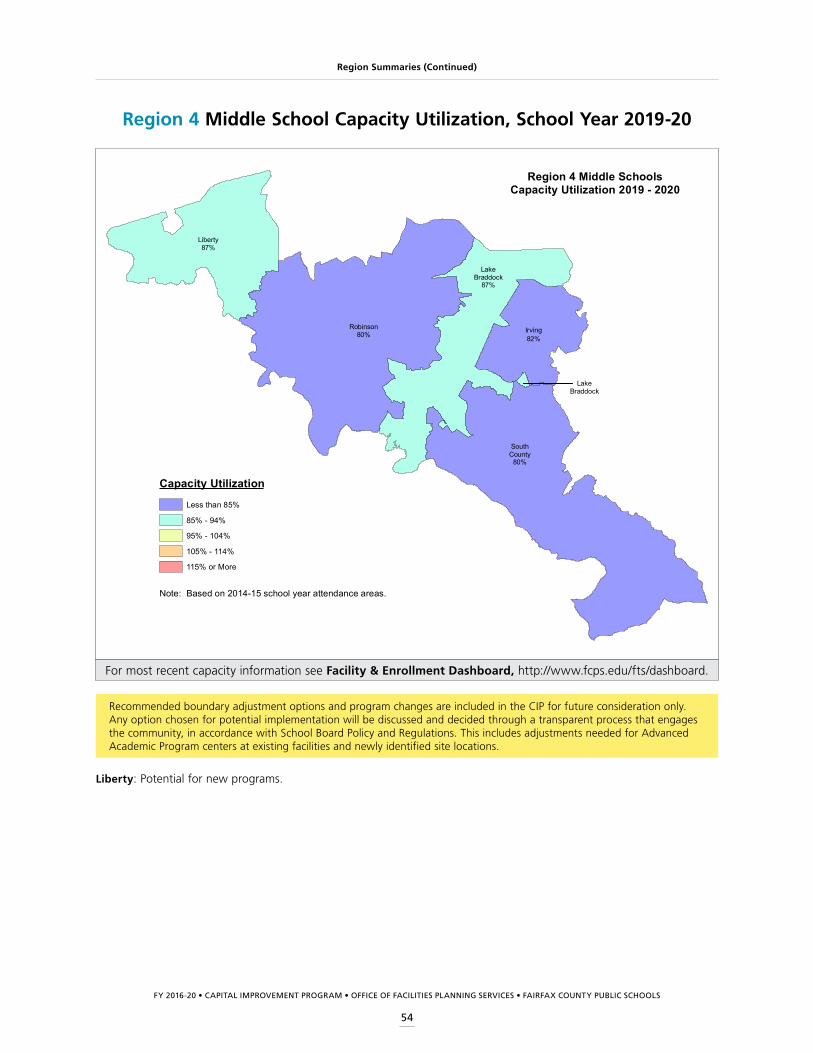
FY 2016-20 • CAPITAL IMPROVEMENT PROGRAM • OFFICE OF FACILITIES PLANNING SERVICES • FAIRFAX COUNTY PUBLIC SCHOOLS
54
Region Summaries (Continued)
For most recent capacity information see Facility & Enrollment Dashboard, http://www.fcps.edu/fts/dashboard.
Recommended boundary adjustment options and program changes are included in the CIP for future consideration only. Any option chosen for potential implementation will be discussed and decided through a transparent process that engages the community, in accordance with School Board Policy and Regulations. This includes adjustments needed for Advanced Academic Program centers at existing facilities and newly identified site locations.
Irving82%
LakeBraddock
LakeBraddock
87%
Liberty87%
Robinson80%
SouthCounty
80%
Region 4 Middle SchoolsCapacity Utilization 2019 - 2020
Capacity Utilization
Less than 85%
85% - 94%
95% - 104%
105% - 114%
115% or More
Note: Based on 2014-15 school year attendance areas.
Region 4 Middle School Capacity Utilization, School Year 2019-20
Liberty: Potential for new programs.
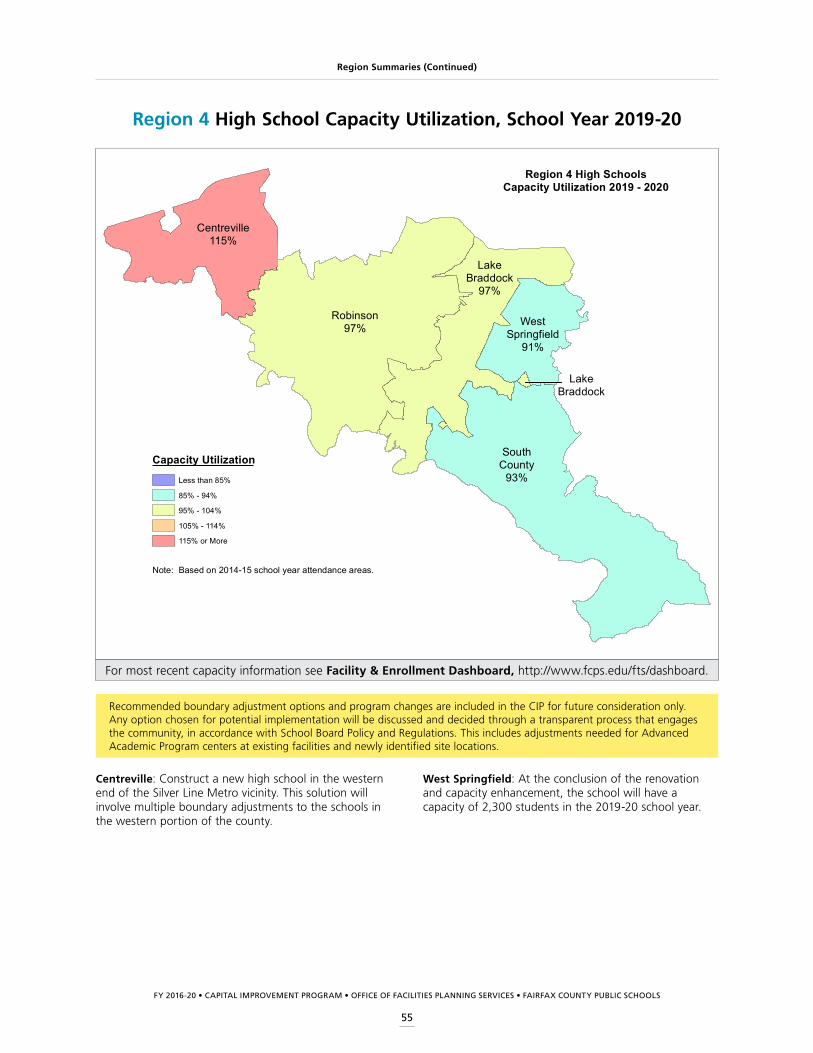
FY 2016-20 • CAPITAL IMPROVEMENT PROGRAM • OFFICE OF FACILITIES PLANNING SERVICES • FAIRFAX COUNTY PUBLIC SCHOOLS
55
Region Summaries (Continued)
For most recent capacity information see Facility & Enrollment Dashboard, http://www.fcps.edu/fts/dashboard.
Recommended boundary adjustment options and program changes are included in the CIP for future consideration only. Any option chosen for potential implementation will be discussed and decided through a transparent process that engages the community, in accordance with School Board Policy and Regulations. This includes adjustments needed for Advanced Academic Program centers at existing facilities and newly identified site locations.
Centreville115%
LakeBraddock
LakeBraddock
97%
Robinson97%
SouthCounty
93%
WestSpringfield
91%
Region 4 High SchoolsCapacity Utilization 2019 - 2020
Capacity Utilization
Less than 85%
85% - 94%
95% - 104%
105% - 114%
115% or More
Note: Based on 2014-15 school year attendance areas.
Region 4 High School Capacity Utilization, School Year 2019-20
Centreville: Construct a new high school in the western end of the Silver Line Metro vicinity. This solution will involve multiple boundary adjustments to the schools in the western portion of the county.
West Springfield: At the conclusion of the renovation and capacity enhancement, the school will have a capacity of 2,300 students in the 2019-20 school year.
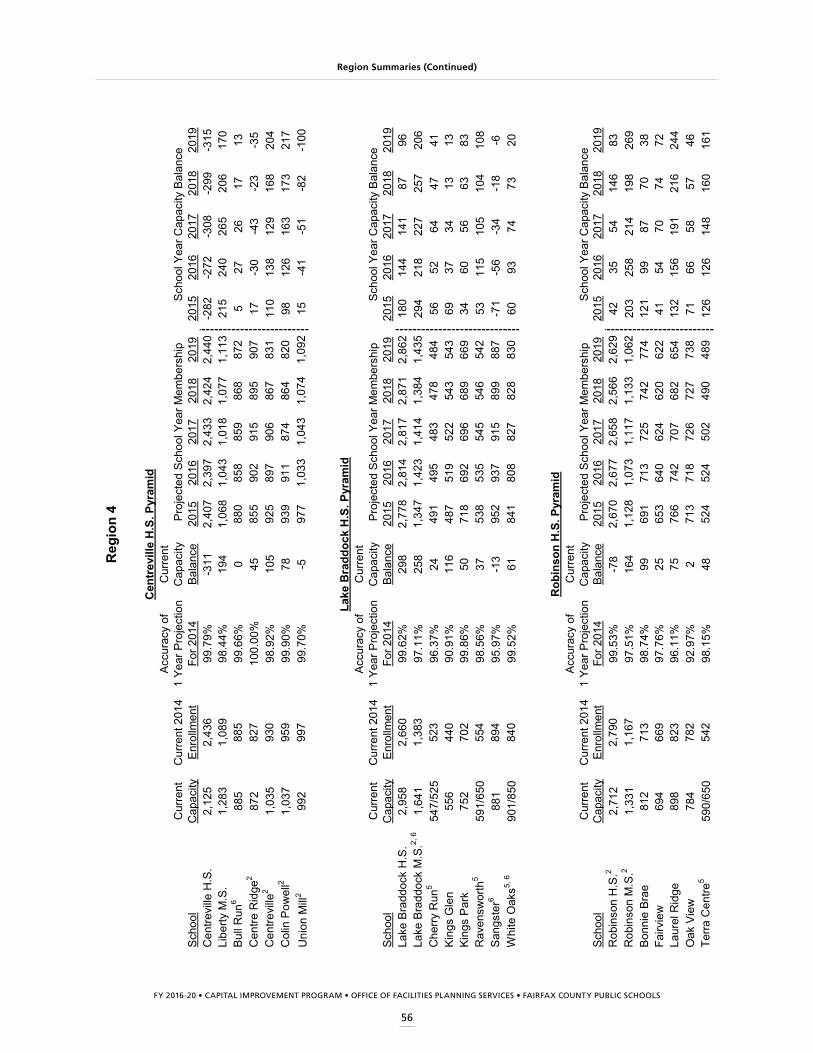
FY 2016-20 • CAPITAL IMPROVEMENT PROGRAM • OFFICE OF FACILITIES PLANNING SERVICES • FAIRFAX COUNTY PUBLIC SCHOOLS
56
Region Summaries (Continued)
Acc
urac
y of
Cur
rent
Cur
rent
Cur
rent
201
41
Year
Pro
ject
ion
Cap
acity
Sch
ool
Cap
acity
Enr
ollm
ent
For 2
014
Bal
ance
2015
2016
2017
2018
2019
2015
2016
2017
2018
2019
Cen
trevi
lle H
.S.
2,12
52,
436
99.7
9%-3
112,
407
2,39
72,
433
2,42
42,
440
-282
-272
-308
-299
-315
Libe
rty M
.S.
1,28
31,
089
98.4
4%19
41,
068
1,04
31,
018
1,07
71,
113
215
240
265
206
170
Bul
l Run
688
588
599
.66%
088
085
885
986
887
25
2726
1713
Cen
tre R
idge
287
282
710
0.00
%45
855
902
915
895
907
17-3
0-4
3-2
3-3
5C
entre
ville
21,
035
930
98.9
2%10
592
589
790
686
783
111
013
812
916
820
4C
olin
Pow
ell2
1,03
795
999
.90%
7893
991
187
486
482
098
126
163
173
217
Uni
on M
ill2
992
997
99.7
0%-5
977
1,03
31,
043
1,07
41,
092
15-4
1-5
1-8
2-1
00
Acc
urac
y of
Cur
rent
Cur
rent
Cur
rent
201
41
Year
Pro
ject
ion
Cap
acity
Sch
ool
Cap
acity
Enr
ollm
ent
For 2
014
Bal
ance
2015
2016
2017
2018
2019
2015
2016
2017
2018
2019
Lake
Bra
ddoc
k H
.S.
2,95
82,
660
99.6
2%29
82,
778
2,81
42,
817
2,87
12,
862
180
144
141
8796
Lake
Bra
ddoc
k M
.S.2,
61,
641
1,38
397
.11%
258
1,34
71,
423
1,41
41,
384
1,43
529
421
822
725
720
6C
herry
Run
554
7/52
552
396
.37%
2449
149
548
347
848
456
5264
4741
Kin
gs G
len
556
440
90.9
1%11
648
751
952
254
354
369
3734
1313
Kin
gs P
ark
752
702
99.8
6%50
718
692
696
689
669
3460
5663
83R
aven
swor
th5
591/
650
554
98.5
6%37
538
535
545
546
542
5311
510
510
410
8S
angs
ter6
881
894
95.9
7%-1
395
293
791
589
988
7-7
1-5
6-3
4-1
8-6
Whi
te O
aks5,
690
1/85
084
099
.52%
6184
180
882
782
883
060
9374
7320
Acc
urac
y of
Cur
rent
Cur
rent
Cur
rent
201
41
Year
Pro
ject
ion
Cap
acity
Sch
ool
Cap
acity
Enr
ollm
ent
For 2
014
Bal
ance
2015
2016
2017
2018
2019
2015
2016
2017
2018
2019
Rob
inso
n H
.S.2
2,71
22,
790
99.5
3%-7
82,
670
2,67
72,
658
2,56
62,
629
4235
5414
683
Rob
inso
n M
.S.2
1,33
11,
167
97.5
1%16
41,
128
1,07
31,
117
1,13
31,
062
203
258
214
198
269
Bon
nie
Bra
e81
271
398
.74%
9969
171
372
574
277
412
199
8770
38Fa
irvie
w69
466
997
.76%
2565
364
062
462
062
241
5470
7472
Laur
el R
idge
898
823
96.1
1%75
766
742
707
682
654
132
156
191
216
244
Oak
Vie
w78
478
292
.97%
271
371
872
672
773
871
6658
5746
Terra
Cen
tre5
590/
650
542
98.1
5%48
524
524
502
490
489
126
126
148
160
161
Rob
inso
n H
.S. P
yram
id
Reg
ion
4
Cen
trev
ille
H.S
. Pyr
amid
Lake
Bra
ddoc
k H
.S. P
yram
id
Pro
ject
ed S
choo
l Yea
r Mem
bers
hip
Sch
ool Y
ear C
apac
ity B
alan
ce
Pro
ject
ed S
choo
l Yea
r Mem
bers
hip
Sch
ool Y
ear C
apac
ity B
alan
ce
Sch
ool Y
ear C
apac
ity B
alan
ceP
roje
cted
Sch
ool Y
ear M
embe
rshi
p
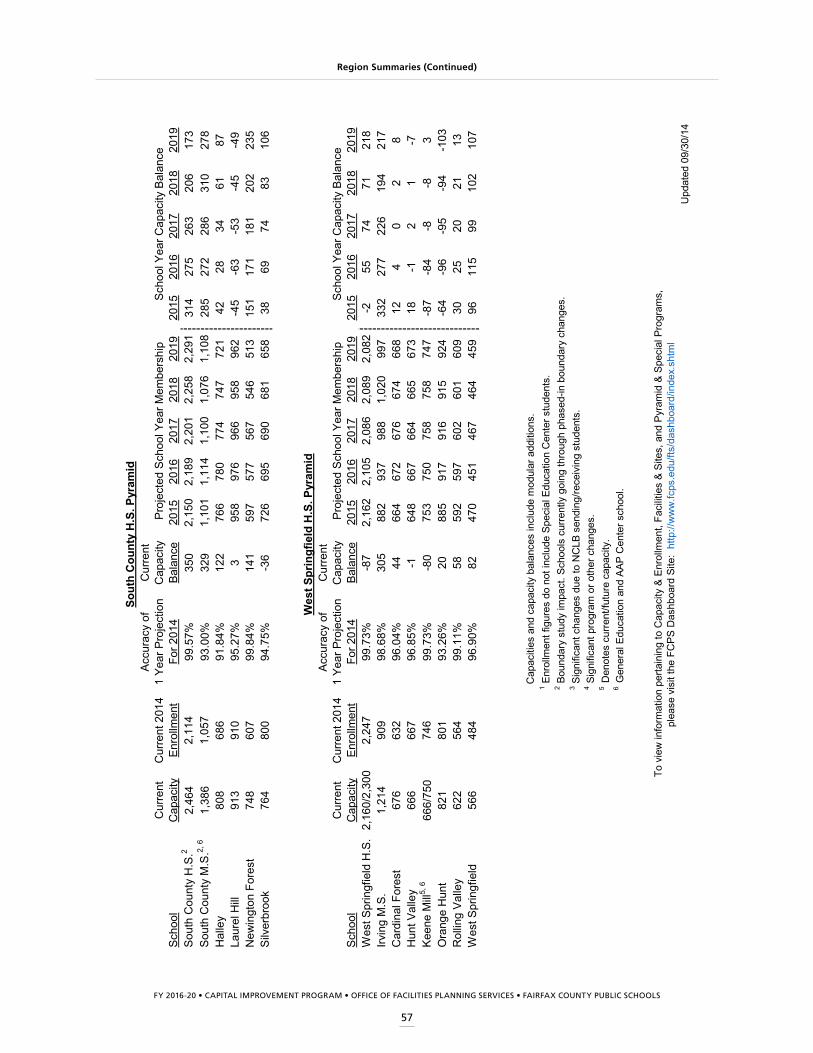
FY 2016-20 • CAPITAL IMPROVEMENT PROGRAM • OFFICE OF FACILITIES PLANNING SERVICES • FAIRFAX COUNTY PUBLIC SCHOOLS
57
Region Summaries (Continued)
Acc
urac
y of
Cur
rent
Cur
rent
Cur
rent
201
41
Year
Pro
ject
ion
Cap
acity
Sch
ool
Cap
acity
Enr
ollm
ent
For 2
014
Bal
ance
2015
2016
2017
2018
2019
2015
2016
2017
2018
2019
Sou
th C
ount
y H
.S.2
2,46
42,
114
99.5
7%35
02,
150
2,18
92,
201
2,25
82,
291
314
275
263
206
173
Sou
th C
ount
y M
.S.2,
61,
386
1,05
793
.00%
329
1,10
11,
114
1,10
01,
076
1,10
828
527
228
631
027
8H
alle
y80
868
691
.84%
122
766
780
774
747
721
4228
3461
87La
urel
Hill
913
910
95.2
7%3
958
976
966
958
962
-45
-63
-53
-45
-49
New
ingt
on F
ores
t74
860
799
.84%
141
597
577
567
546
513
151
171
181
202
235
Silv
erbr
ook
764
800
94.7
5%-3
672
669
569
068
165
838
6974
8310
6
Acc
urac
y of
Cur
rent
Cur
rent
Cur
rent
201
41
Year
Pro
ject
ion
Cap
acity
Sch
ool
Cap
acity
Enr
ollm
ent
For 2
014
Bal
ance
2015
2016
2017
2018
2019
2015
2016
2017
2018
2019
Wes
t Spr
ingf
ield
H.S
.2,
160/
2,30
02,
247
99.7
3%-8
72,
162
2,10
52,
086
2,08
92,
082
-255
7471
218
Irvin
g M
.S.
1,21
490
998
.68%
305
882
937
988
1,02
099
733
227
722
619
421
7C
ardi
nal F
ores
t67
663
296
.04%
4466
467
267
667
466
812
40
28
Hun
t Val
ley
666
667
96.8
5%-1
648
667
664
665
673
18-1
21
-7K
eene
Mill
5, 6
666/
750
746
99.7
3%-8
075
375
075
875
874
7-8
7-8
4-8
-83
Ora
nge
Hun
t82
180
193
.26%
2088
591
791
691
592
4-6
4-9
6-9
5-9
4-1
03R
ollin
g V
alle
y62
256
499
.11%
5859
259
760
260
160
930
2520
2113
Wes
t Spr
ingf
ield
56
648
496
.90%
8247
045
146
746
445
996
115
9910
210
7
6 G
ener
al E
duca
tion
and
AAP
Cen
ter s
choo
l.
Upd
ated
09/
30/1
4
Sout
h C
ount
y H
.S. P
yram
id
2 Bou
ndar
y st
udy
impa
ct. S
choo
ls c
urre
ntly
goi
ng th
roug
h ph
ased
-in b
ound
ary
chan
ges.S
choo
l Yea
r Cap
acity
Bal
ance
Wes
t Spr
ingf
ield
H.S
. Pyr
amid
Pro
ject
ed S
choo
l Yea
r Mem
bers
hip
Sch
ool Y
ear C
apac
ity B
alan
ce
To
view
info
rmat
ion
perta
inin
g to
Cap
acity
& E
nrol
lmen
t, Fa
cilit
ies
& Si
tes,
and
Pyr
amid
& S
peci
al P
rogr
ams,
plea
se v
isit
the
FCPS
Das
hboa
rd S
ite:
http
://w
ww
.fcps
.edu
/fts/
dash
boar
d/in
dex.
shtm
l
Cap
aciti
es a
nd c
apac
ity b
alan
ces
incl
ude
mod
ular
add
ition
s.
3 Sig
nific
ant c
hang
es d
ue to
NC
LB s
endi
ng/re
ceiv
ing
stud
ents
.
Pro
ject
ed S
choo
l Yea
r Mem
bers
hip
1 Enr
ollm
ent f
igur
es d
o no
t inc
lude
Spe
cial
Edu
catio
n C
ente
r stu
dent
s.
5 D
enot
es c
urre
nt/fu
ture
cap
acity
.
4 Sig
nific
ant p
rogr
am o
r oth
er c
hang
es.
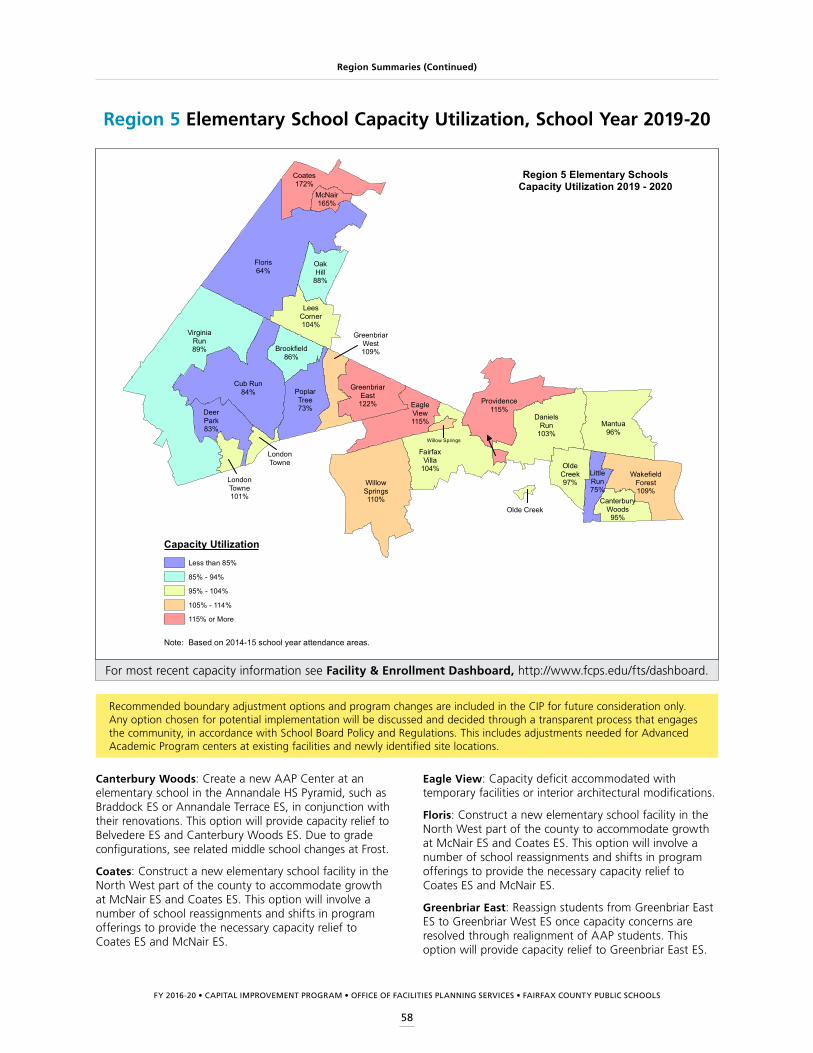
FY 2016-20 • CAPITAL IMPROVEMENT PROGRAM • OFFICE OF FACILITIES PLANNING SERVICES • FAIRFAX COUNTY PUBLIC SCHOOLS
58
Region Summaries (Continued)
For most recent capacity information see Facility & Enrollment Dashboard, http://www.fcps.edu/fts/dashboard.
Recommended boundary adjustment options and program changes are included in the CIP for future consideration only. Any option chosen for potential implementation will be discussed and decided through a transparent process that engages the community, in accordance with School Board Policy and Regulations. This includes adjustments needed for Advanced Academic Program centers at existing facilities and newly identified site locations.
Region 5 Elementary School Capacity Utilization, School Year 2019-20
DanielsRun
103%
GreenbriarEast122%
GreenbriarWest109%
LondonTowne
LondonTowne101%
WakefieldForest109%
Brookfield86%
CanterburyWoods95%
Coates172%
Cub Run84%
DeerPark83%
EagleView115%
FairfaxVilla
104%
Floris64%
LeesCorner104%
LittleRun75%
Mantua96%
McNair165%
OakHill
88%
Olde Creek
OldeCreek97%
PoplarTree73%
Providence115%
VirginiaRun89%
Willow Springs
WillowSprings110%
Region 5 Elementary SchoolsCapacity Utilization 2019 - 2020
Capacity UtilizationLess than 85%
85% - 94%
95% - 104%
105% - 114%
115% or More
Note: Based on 2014-15 school year attendance areas.
Canterbury Woods: Create a new AAP Center at an elementary school in the Annandale HS Pyramid, such as Braddock ES or Annandale Terrace ES, in conjunction with their renovations. This option will provide capacity relief to Belvedere ES and Canterbury Woods ES. Due to grade configurations, see related middle school changes at Frost.
Coates: Construct a new elementary school facility in the North West part of the county to accommodate growth at McNair ES and Coates ES. This option will involve a number of school reassignments and shifts in program offerings to provide the necessary capacity relief to Coates ES and McNair ES.
Eagle View: Capacity deficit accommodated with temporary facilities or interior architectural modifications.
Floris: Construct a new elementary school facility in the North West part of the county to accommodate growth at McNair ES and Coates ES. This option will involve a number of school reassignments and shifts in program offerings to provide the necessary capacity relief to Coates ES and McNair ES.
Greenbriar East: Reassign students from Greenbriar East ES to Greenbriar West ES once capacity concerns are resolved through realignment of AAP students. This option will provide capacity relief to Greenbriar East ES.

FY 2016-20 • CAPITAL IMPROVEMENT PROGRAM • OFFICE OF FACILITIES PLANNING SERVICES • FAIRFAX COUNTY PUBLIC SCHOOLS
59
Region Summaries (Continued)
Providence:
• Create a new AAP Center at Providence ES. Reassign the City of Fairfax AAP students from Mosby Woods ES AAP Center to the new AAP Center at Providence ES. Reassign students residing within Fairfax County from Providence ES to Mosby Woods ES. This option will provide capacity relief to Providence ES and allows residents of the City of Fairfax to remain in the City of Fairfax facilities.
• Construct a new elementary school in the Fairfax-Oakton area. Reassign students residing within the Fairfax-Oakton area to the new school (based on the specific location of the school).
Wakefield Forest: Capacity deficit accommodated with temporary facilities or interior architectural modifications.
Willow Springs: Capacity deficit accommodated with temporary facilities or interior architectural modifications.
Greenbriar West:
• Create a new AAP Center at Colin Powell ES. Reassign AAP students residing within Colin Powell ES attendance area from Greenbriar West ES AAP Center to the new AAP Center at Colin Powell ES. This option will also promote cohort survival in the Fairfax HS and Centreville HS Pyramids.
• Create a new AAP Center at Poplar Tree ES. Reassign AAP students residing within the Poplar Tree ES attendance areas to the new AAP Center at Poplar Tree ES. This option will also provide capacity relief to Greenbriar West ES.
• Reassign students from Greenbriar East ES to Greenbriar West ES once capacity concerns are resolved through realignment of AAP students. This option will provide capacity relief to Greenbriar East ES.
McNair: Construct a new elementary school facility in the North West part of the county to accommodate growth at McNair ES and Coates ES. This option will involve a number of school reassignments and shifts in program offerings to provide the necessary capacity relief to Coates ES and McNair ES.
Poplar Tree: Create a new AAP Center at Poplar Tree ES. Reassign AAP students residing within the Poplar Tree ES attendance areas to the new AAP Center at Poplar Tree ES. This option will provide capacity relief to Greenbriar West ES.

FY 2016-20 • CAPITAL IMPROVEMENT PROGRAM • OFFICE OF FACILITIES PLANNING SERVICES • FAIRFAX COUNTY PUBLIC SCHOOLS
60
Region Summaries (Continued)
Recommended boundary adjustment options and program changes are included in the CIP for future consideration only. Any option chosen for potential implementation will be discussed and decided through a transparent process that engages the community, in accordance with School Board Policy and Regulations. This includes adjustments needed for Advanced Academic Program centers at existing facilities and newly identified site locations.
For most recent capacity information see Facility & Enrollment Dashboard, http://www.fcps.edu/fts/dashboard.
Region 5 Middle School Capacity Utilization, School Year 2019-20
Franklin77%
Frost106%
Lanier86%
Lanier86%
RockyRun
101%Stone75%
Region 5 Middle SchoolsCapacity Utilization 2019 - 2020
Capacity Utilization
Less than 85%
85% - 94%
95% - 104%
105% - 114%
115% or More
Note: Based on 2014-15 school year attendance areas.
Franklin: Create a new AAP Center at Franklin MS. Reassign AAP students residing within the Franklin MS attendance area from Carson MS AAP Center to the new AAP Center at Franklin MS. This option will provide capacity relief to Carson MS.
Frost: Create a new AAP Center at Poe MS. Reassign the Annandale HS Pyramid middle school AAP students from Glasgow MS and Frost MS to the new AAP Center at Poe MS. This option will provide capacity relief to Glasgow MS and Frost MS. This option will promote the Annandale HS Pyramid cohorts.
Lanier: Create a new AAP Center at Lanier MS to accommodate Fairfax HS Pyramid students, which will provide capacity relief to Rocky Run MS. This new AAP Center will keep the cohorts together.
Rocky Run:
• At the conclusion of the renovation and capacity enhancement, the school will have a capacity of 1,350 students in the 2019-20 school year.
• Create a new AAP Center at Lanier MS to accommodate Fairfax HS Pyramid students, which will provide capacity relief to Rocky Run MS. This new AAP Center will keep the cohorts together.
• Create a new AAP Center at Stone MS to accommodate Westfield HS Pyramid students, which will provide capacity relief to Rocky Run MS. This new AAP Center will keep the cohorts together. These changes will significantly drop enrollments at Rocky Run MS.
Stone: Create a new AAP Center at Stone MS to accommodate Westfield HS Pyramid students and also provide capacity relief to Rocky Run MS. This new AAP Center will keep the cohorts together.

FY 2016-20 • CAPITAL IMPROVEMENT PROGRAM • OFFICE OF FACILITIES PLANNING SERVICES • FAIRFAX COUNTY PUBLIC SCHOOLS
61
Region Summaries (Continued)
Recommended boundary adjustment options and program changes are included in the CIP for future consideration only. Any option chosen for potential implementation will be discussed and decided through a transparent process that engages the community, in accordance with School Board Policy and Regulations. This includes adjustments needed for Advanced Academic Program centers at existing facilities and newly identified site locations.
For most recent capacity information see Facility & Enrollment Dashboard, http://www.fcps.edu/fts/dashboard.
Chantilly109%
Fairfax109%
Fairfax109%
Westfield96%
Woodson108%
Region 5 High SchoolsCapacity Utilization 2019 - 2020
Capacity Utilization
Less than 85%
85% - 94%
95% - 104%
105% - 114%
115% or More
Note: Based on 2014-15 school year attendance areas.
Region 5 High School Capacity Utilization, School Year 2019-20
Chantilly: Monitor enrollments of elementary school and middle school feeders.
Fairfax: Monitor enrollments as the boundary change phasing completes after school year 2016-17.
Westfield: Construct a new high school in the western end of the Silver Line Metro vicinity. This solution will involve multiple boundary adjustments to the schools in the western portion of the county.
Woodson: Install a modular addition at Woodson HS to accommodate severe capacity deficits over the next five years.
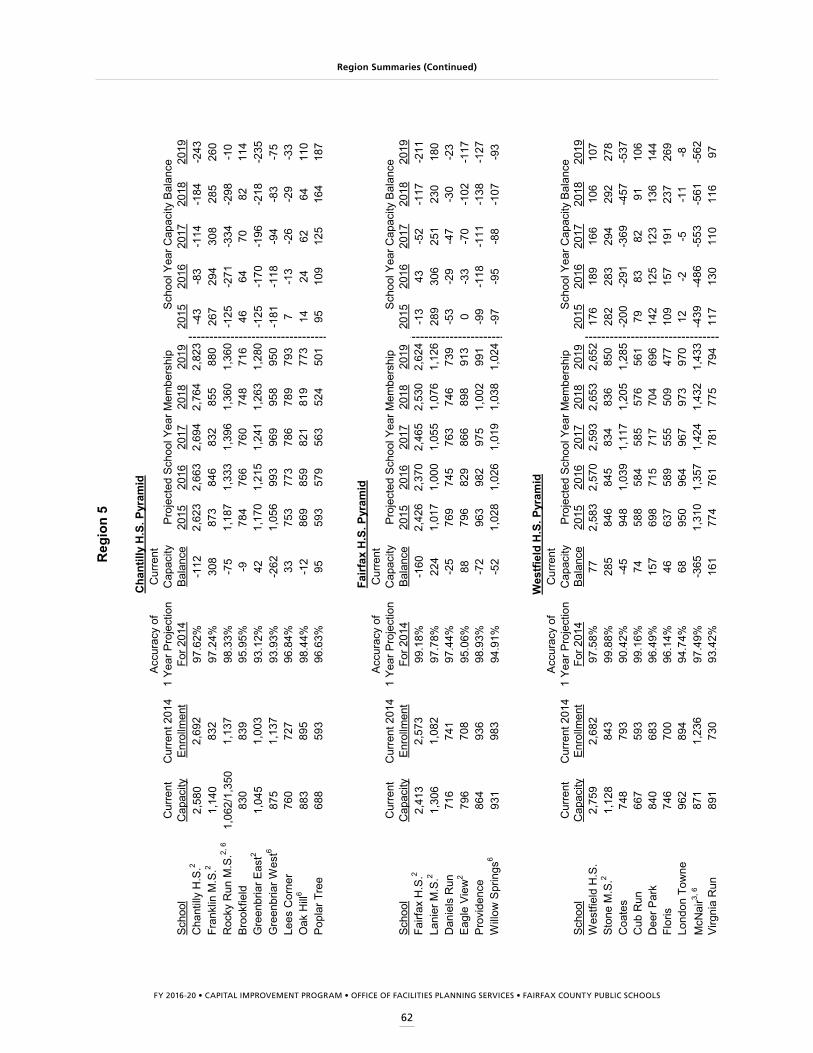
FY 2016-20 • CAPITAL IMPROVEMENT PROGRAM • OFFICE OF FACILITIES PLANNING SERVICES • FAIRFAX COUNTY PUBLIC SCHOOLS
62
Region Summaries (Continued)
Acc
urac
y of
Cur
rent
Cur
rent
Cur
rent
201
41
Year
Pro
ject
ion
Cap
acity
Sch
ool
Cap
acity
Enr
ollm
ent
For 2
014
Bal
ance
2015
2016
2017
2018
2019
2015
2016
2017
2018
2019
Cha
ntill
y H
.S.2
2,58
02,
692
97.6
2%-1
122,
623
2,66
32,
694
2,76
42,
823
-43
-83
-114
-184
-243
Fran
klin
M.S
.21,
140
832
97.2
4%30
887
384
683
285
588
026
729
430
828
526
0R
ocky
Run
M.S
.2, 6
1,06
2/1,
350
1,13
798
.33%
-75
1,18
71,
333
1,39
61,
360
1,36
0-1
25-2
71-3
34-2
98-1
0B
rook
field
830
839
95.9
5%-9
784
766
760
748
716
4664
7082
114
Gre
enbr
iar E
ast2
1,04
51,
003
93.1
2%42
1,17
01,
215
1,24
11,
263
1,28
0-1
25-1
70-1
96-2
18-2
35G
reen
bria
r Wes
t687
51,
137
93.9
3%-2
621,
056
993
969
958
950
-181
-118
-94
-83
-75
Lees
Cor
ner
760
727
96.8
4%33
753
773
786
789
793
7-1
3-2
6-2
9-3
3O
ak H
ill6
883
895
98.4
4%-1
286
985
982
181
977
314
2462
6411
0P
opla
r Tre
e68
859
396
.63%
9559
357
956
352
450
195
109
125
164
187
Acc
urac
y of
Cur
rent
Cur
rent
Cur
rent
201
41
Year
Pro
ject
ion
Cap
acity
Sch
ool
Cap
acity
Enr
ollm
ent
For 2
014
Bal
ance
2015
2016
2017
2018
2019
2015
2016
2017
2018
2019
Fairf
ax H
.S.2
2,41
32,
573
99.1
8%-1
602,
426
2,37
02,
465
2,53
02,
624
-13
43-5
2-1
17-2
11La
nier
M.S
.21,
306
1,08
297
.78%
224
1,01
71,
000
1,05
51,
076
1,12
628
930
625
123
018
0D
anie
ls R
un71
674
197
.44%
-25
769
745
763
746
739
-53
-29
-47
-30
-23
Eag
le V
iew
279
670
895
.06%
8879
682
986
689
891
30
-33
-70
-102
-117
Pro
vide
nce
864
936
98.9
3%-7
296
398
297
51,
002
991
-99
-118
-111
-138
-127
Will
ow S
prin
gs6
931
983
94.9
1%-5
21,
028
1,02
61,
019
1,03
81,
024
-97
-95
-88
-107
-93
Acc
urac
y of
Cur
rent
Cur
rent
Cur
rent
201
41
Year
Pro
ject
ion
Cap
acity
Sch
ool
Cap
acity
Enr
ollm
ent
For 2
014
Bal
ance
2015
2016
2017
2018
2019
2015
2016
2017
2018
2019
Wes
tfiel
d H
.S.
2,75
92,
682
97.5
8%77
2,58
32,
570
2,59
32,
653
2,65
217
618
916
610
610
7S
tone
M.S
.21,
128
843
99.8
8%28
584
684
583
483
685
028
228
329
429
227
8C
oate
s74
879
390
.42%
-45
948
1,03
91,
117
1,20
51,
285
-200
-291
-369
-457
-537
Cub
Run
667
593
99.1
6%74
588
584
585
576
561
7983
8291
106
Dee
r Par
k84
068
396
.49%
157
698
715
717
704
696
142
125
123
136
144
Flor
is74
670
096
.14%
4663
758
955
550
947
710
915
719
123
726
9Lo
ndon
Tow
ne96
289
494
.74%
6895
096
496
797
397
012
-2-5
-11
-8M
cNai
r3, 6
871
1,23
697
.49%
-365
1,31
01,
357
1,42
41,
432
1,43
3-4
39-4
86-5
53-5
61-5
62V
irgni
a R
un89
173
093
.42%
161
774
761
781
775
794
117
130
110
116
97
Sch
ool Y
ear C
apac
ity B
alan
ceP
roje
cted
Sch
ool Y
ear M
embe
rshi
p
Reg
ion
5
Cha
ntill
y H
.S. P
yram
id
Fairf
ax H
.S. P
yram
id
Pro
ject
ed S
choo
l Yea
r Mem
bers
hip
Sch
ool Y
ear C
apac
ity B
alan
ce
Pro
ject
ed S
choo
l Yea
r Mem
bers
hip
Sch
ool Y
ear C
apac
ity B
alan
ce
Wes
tfiel
d H
.S. P
yram
id
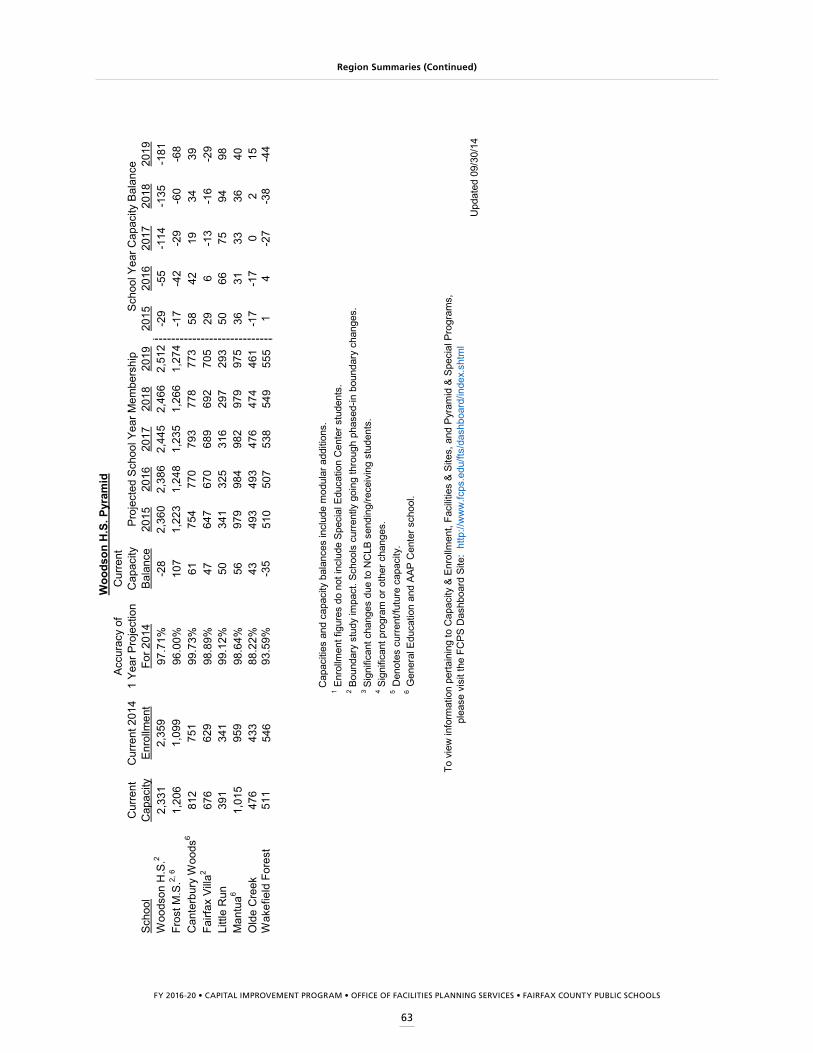
FY 2016-20 • CAPITAL IMPROVEMENT PROGRAM • OFFICE OF FACILITIES PLANNING SERVICES • FAIRFAX COUNTY PUBLIC SCHOOLS
63
Region Summaries (Continued)
Acc
urac
y of
Cur
rent
Cur
rent
Cur
rent
201
41
Year
Pro
ject
ion
Cap
acity
Sch
ool
Cap
acity
Enr
ollm
ent
For 2
014
Bal
ance
2015
2016
2017
2018
2019
2015
2016
2017
2018
2019
Woo
dson
H.S
.22,
331
2,35
997
.71%
-28
2,36
02,
386
2,44
52,
466
2,51
2-2
9-5
5-1
14-1
35-1
81Fr
ost M
.S.2,
61,
206
1,09
996
.00%
107
1,22
31,
248
1,23
51,
266
1,27
4-1
7-4
2-2
9-6
0-6
8C
ante
rbur
y W
oods
681
275
199
.73%
6175
477
079
377
877
358
4219
3439
Fairf
ax V
illa2
676
629
98.8
9%47
647
670
689
692
705
296
-13
-16
-29
Littl
e R
un39
134
199
.12%
5034
132
531
629
729
350
6675
9498
Man
tua6
1,01
595
998
.64%
5697
998
498
297
997
536
3133
3640
Old
e C
reek
476
433
88.2
2%43
493
493
476
474
461
-17
-17
02
15W
akef
ield
For
est
511
546
93.5
9%-3
551
050
753
854
955
51
4-2
7-3
8-4
4
6 G
ener
al E
duca
tion
and
AAP
Cen
ter s
choo
l.
3 Sig
nific
ant c
hang
es d
ue to
NC
LB s
endi
ng/re
ceiv
ing
stud
ents
.
Pro
ject
ed S
choo
l Yea
r Mem
bers
hip
1 Enr
ollm
ent f
igur
es d
o no
t inc
lude
Spe
cial
Edu
catio
n C
ente
r stu
dent
s.
5 D
enot
es c
urre
nt/fu
ture
cap
acity
.
4 Sig
nific
ant p
rogr
am o
r oth
er c
hang
es.
2 Bou
ndar
y st
udy
impa
ct. S
choo
ls c
urre
ntly
goi
ng th
roug
h ph
ased
-in b
ound
ary
chan
ges.S
choo
l Yea
r Cap
acity
Bal
ance
Cap
aciti
es a
nd c
apac
ity b
alan
ces
incl
ude
mod
ular
add
ition
s.
Upd
ated
09/
30/1
4
Woo
dson
H.S
. Pyr
amid
To
view
info
rmat
ion
perta
inin
g to
Cap
acity
& E
nrol
lmen
t, Fa
cilit
ies
& Si
tes,
and
Pyr
amid
& S
peci
al P
rogr
ams,
plea
se v
isit
the
FCPS
Das
hboa
rd S
ite:
http
://w
ww
.fcps
.edu
/fts/
dash
boar
d/in
dex.
shtm
l
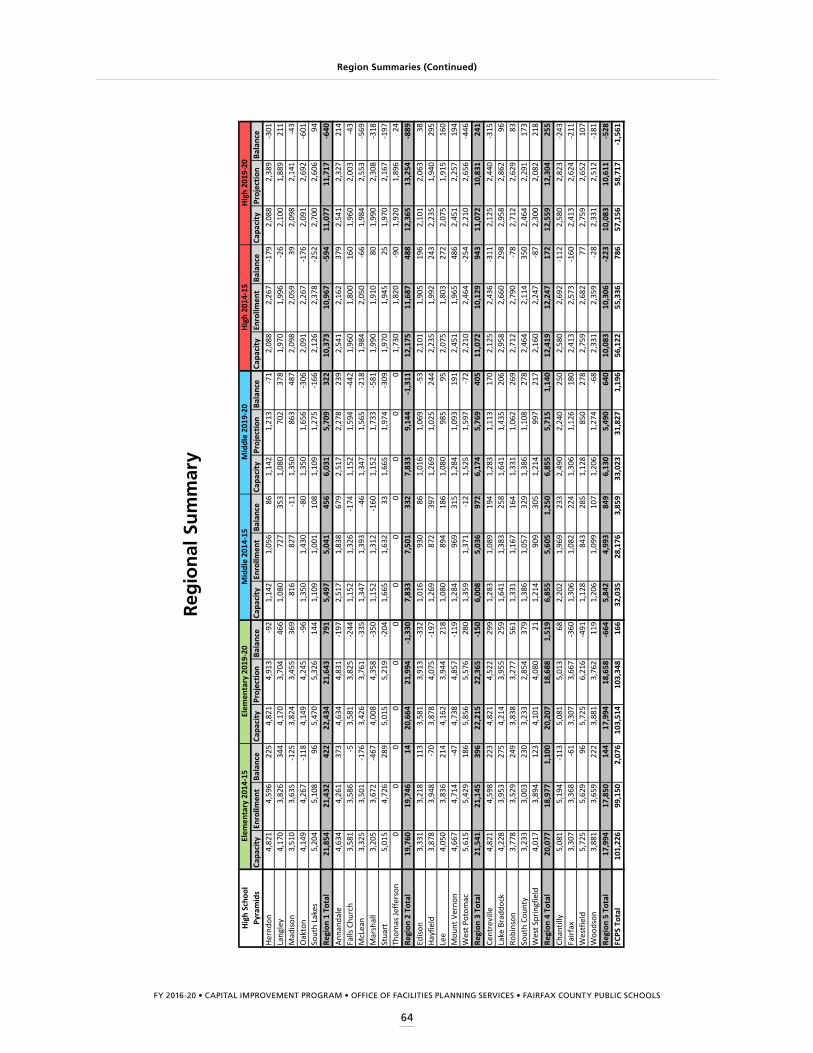
FY 2016-20 • CAPITAL IMPROVEMENT PROGRAM • OFFICE OF FACILITIES PLANNING SERVICES • FAIRFAX COUNTY PUBLIC SCHOOLS
64
Region Summaries (Continued)
Regi
onal
Sum
mar
y
Capa
city
Enro
llmen
tBa
lanc
eCa
paci
tyPr
ojec
tion
Bala
nce
Capa
city
Enro
llmen
tBa
lanc
eCa
paci
tyPr
ojec
tion
Bala
nce
Capa
city
Enro
llmen
tBa
lanc
eCa
paci
tyPr
ojec
tion
Bala
nce
Hern
don
4,82
14,
596
225
4,82
14,
913
-92
1,14
21,
056
861,
142
1,21
3-7
12,
088
2,26
7-1
792,
088
2,38
9-3
01La
ngle
y4,
170
3,82
634
44,
170
3,70
446
61,
080
727
353
1,08
070
237
81,
970
1,99
6-2
62,
100
1,88
921
1M
adiso
n3,
510
3,63
5-1
253,
824
3,45
536
981
682
7-1
11,
350
863
487
2,09
82,
059
392,
098
2,14
1-4
3O
akto
n4,
149
4,26
7-1
184,
149
4,24
5-9
61,
350
1,43
0-8
01,
350
1,65
6-3
062,
091
2,26
7-1
762,
091
2,69
2-6
01So
uth
Lake
s5,
204
5,10
896
5,47
05,
326
144
1,10
91,
001
108
1,10
91,
275
-166
2,12
62,
378
-252
2,70
02,
606
94Re
gion
1 T
otal
21,8
5421
,432
422
22,4
3421
,643
791
5,49
75,
041
456
6,03
15,
709
322
10,3
7310
,967
-594
11,0
7711
,717
-640
Anna
ndal
e4,
634
4,26
137
34,
634
4,83
1-1
972,
517
1,83
867
92,
517
2,27
823
92,
541
2,16
237
92,
541
2,32
721
4Fa
lls C
hurc
h3,
581
3,58
6-5
3,58
13,
825
-244
1,15
21,
326
-174
1,15
21,
594
-442
1,96
01,
800
160
1,96
02,
003
-43
McL
ean
3,32
53,
501
-176
3,42
63,
761
-335
1,34
71,
393
-46
1,34
71,
565
-218
1,98
42,
050
-66
1,98
42,
553
-569
Mar
shal
l3,
205
3,67
2-4
674,
008
4,35
8-3
501,
152
1,31
2-1
601,
152
1,73
3-5
811,
990
1,91
080
1,99
02,
308
-318
Stua
rt5,
015
4,72
628
95,
015
5,21
9-2
041,
665
1,63
233
1,66
51,
974
-309
1,97
01,
945
251,
970
2,16
7-1
97Th
omas
Jeffe
rson
00
00
00
00
00
00
1,73
01,
820
-90
1,92
01,
896
24Re
gion
2 T
otal
19,7
6019
,746
1420
,664
21,9
94-1
,330
7,83
37,
501
332
7,83
39,
144
-1,3
1112
,175
11,6
8748
812
,365
13,2
54-8
89Ed
ison
3,33
13,
218
113
3,58
13,
913
-332
1,01
693
086
1,01
61,
069
-53
2,10
11,
905
196
2,10
12,
063
38Ha
yfie
ld3,
878
3,94
8-7
03,
878
4,07
5-1
971,
269
872
397
1,26
91,
025
244
2,23
51,
992
243
2,23
51,
940
295
Lee
4,05
03,
836
214
4,16
23,
944
218
1,08
089
418
61,
080
985
952,
075
1,80
327
22,
075
1,91
516
0M
ount
Ver
non
4,66
74,
714
-47
4,73
84,
857
-119
1,28
496
931
51,
284
1,09
319
12,
451
1,96
548
62,
451
2,25
719
4W
est P
otom
ac5,
615
5,42
918
65,
856
5,57
628
01,
359
1,37
1-1
21,
525
1,59
7-7
22,
210
2,46
4-2
542,
210
2,65
6-4
46Re
gion
3 T
otal
21,5
4121
,145
396
22,2
1522
,365
-150
6,00
85,
036
972
6,17
45,
769
405
11,0
7210
,129
943
11,0
7210
,831
241
Cent
revi
lle4,
821
4,59
822
34,
821
4,52
229
91,
283
1,08
919
41,
283
1,11
317
02,
125
2,43
6-3
112,
125
2,44
0-3
15La
ke B
radd
ock
4,22
83,
953
275
4,21
43,
955
259
1,64
11,
383
258
1,64
11,
435
206
2,95
82,
660
298
2,95
82,
862
96Ro
bins
on3,
778
3,52
924
93,
838
3,27
756
11,
331
1,16
716
41,
331
1,06
226
92,
712
2,79
0-7
82,
712
2,62
983
Sout
h Co
unty
3,23
33,
003
230
3,23
32,
854
379
1,38
61,
057
329
1,38
61,
108
278
2,46
42,
114
350
2,46
42,
291
173
Wes
t Spr
ingf
ield
4,01
73,
894
123
4,10
14,
080
211,
214
909
305
1,21
499
721
72,
160
2,24
7-8
72,
300
2,08
221
8Re
gion
4 T
otal
20,0
7718
,977
1,10
020
,207
18,6
881,
519
6,85
55,
605
1,25
06,
855
5,71
51,
140
12,4
1912
,247
172
12,5
5912
,304
255
Chan
tilly
5,08
15,
194
-113
5,08
15,
013
682,
202
1,96
923
32,
490
2,24
025
02,
580
2,69
2-1
122,
580
2,82
3-2
43Fa
irfax
3,30
73,
368
-61
3,30
73,
667
-360
1,30
61,
082
224
1,30
61,
126
180
2,41
32,
573
-160
2,41
32,
624
-211
Wes
tfiel
d5,
725
5,62
996
5,72
56,
216
-491
1,12
884
328
51,
128
850
278
2,75
92,
682
772,
759
2,65
210
7W
oods
on3,
881
3,65
922
23,
881
3,76
211
91,
206
1,09
910
71,
206
1,27
4-6
82,
331
2,35
9-2
82,
331
2,51
2-1
81Re
gion
5 T
otal
17,9
9417
,850
144
17,9
9418
,658
-664
5,84
24,
993
849
6,13
05,
490
640
10,0
8310
,306
-223
10,0
8310
,611
-528
FCPS
Tot
al10
1,22
699
,150
2,07
610
3,51
410
3,34
816
632
,035
28,1
763,
859
33,0
2331
,827
1,19
656
,122
55,3
3678
657
,156
58,7
17-1
,561
High
Sch
ool
Pyra
mid
sHi
gh 2
019-
20El
emen
tary
201
4-15
Elem
enta
ry 2
019-
20M
iddl
e 20
14-1
5M
iddl
e 20
19-2
0Hi
gh 2
014-
15
Reg
ion
al S
um
mar
y

FY 2016-20 • CAPITAL IMPROVEMENT PROGRAM • OFFICE OF FACILITIES PLANNING SERVICES • FAIRFAX COUNTY PUBLIC SCHOOLS
65
_̂
_̂
_̂_̂
_̂
_̂
_̂
_̂
_̂_̂
_̂_̂
_̂_̂
_̂
_̂_̂
_̂
_̂
_̂
_̂ _̂
_̂_̂
_̂_̂
_̂
_̂
_̂_̂
_̂
_̂
_̂
_̂
_̂_̂_̂
_̂
_̂ _̂
_̂
_̂_̂
_̂
_̂
_̂
_̂
_̂
_̂
!
!
!!!!
!
!
!!
!
!
!
!
!
!
!
!!
!!!
!
!
!
!
!
CubRun
VirginiaRun
(Hunters Woods AAP Center) PS
FairfaxVilla
Bailey's Upper
CLEARVIEW
FORESTEDGE
CHURCHILLROAD
COLVINRUN
MCNAIR SUNRISEVALLEY
HUNTERSWOODS * WESTBRIAR
HAYCOCK
LEMONROAD
OAKHILL
LOUISEARCHER
* NAVY
GREENBRIARWEST
MOSBYWOODS
MANTUA
BELVEDERE
WILLOWSPRINGSBULL RUN
SPRINGFIELDESTATES
KEENEMILL
WHITEOAKS
SANGSTER
STRATFORDLANDING
LORTONSTATION
RIVERSIDE
CANTERBURYWOODS
Aldrin
AnnandaleTerrace
Arm-strong
Bailey's
Beech Tree
BeechTree
BelleView
BonnieBrae
Braddock
BrenMar Park
Brookfield
Bucknell
BullRun
BushHill
Camelot
Cameron
CardinalForest
CentreRidge
Cen
trevi
lle
CherryRun
Chesterbrook
Clermont
Coates
Columbia
Crest-wood
* Crossfield
Cub Run
* Cunning- ham Park
DanielsRun
DeerPark
Dogwood
Dranesville
EagleView
FairfaxVilla
Fairhill
Fairview
* Flint Hill
FlintHill
Floris
Forestdale
Forestville
Ft.Belvoir
Ft. Hunt
Fox Mill
Franconia
FranklinSherman
* Freedom Hill
Garfield
GlenForest
GrahamRd
GreatFalls
GreenbriarEast
Groveton
Gunston
Halley
Halley
Hayfield
Herndon
HollinMeadows
HuntValley
Hutchison
HyblaValley
IslandCreek
KeeneMill
KentGardens
KingsGlen
KingsPark
LakeAnne
Lane
LaurelHill
LaurelRidge
LeesCorner
LittleRun
LondonTowne
LondonTowne
Lyn-brook
MarshallRoad
MasonCrest
Mt.Eagle
Mt.VernonWoods
Navy
NewingtonForest
NorthSpringfieldOak
View
Oak View
Oakton
Olde Creek
OldeCreek
OrangeHunt
Park-lawn
PineSpring
PoplarTree
Powell
Providence
Ravens-worth
Ravens-worth
RoseHill
Saratoga
Shreve-wood
Silverbrook
SleepyHollow
SpringHill
* Sten- wood
TerraCentre
Terraset
Timber Lane
UnionMill
* Vienna
Virginia Run
WakefieldForest
WaplesMill
WashingtonMill
Wayne-wood
WestSpringfield
West-briar
West-gate
Westlawn
Weyanoke
Willow Springs
* Wolftrap
Wood-burn
Woodlawn
WoodleyHills
2014 - 2015 Elementary School Advanced Academic Program andSchool-Based Advanced Academic Program Center
Attendance Areas
School Based Advanced Academic Program Centers
* Contact AAP Office for center assignments by grade. 571-423-4740_̂
ES AAP Attendance Areas for School Year 2014 - 2015
BELVEDERE
BULL RUN
CANTERBURY WOODS
CHURCHILL ROAD
CLEARVIEW
COLVIN RUN
FOREST EDGE
GREENBRIAR WEST
HAYCOCK
HUNTERS WOODS
KEENE MILL
LEMON ROAD
LORTON STATION
LOUISE ARCHER
MANTUA
MCNAIR
MOSBY WOODS
NAVY
OAK HILL
RIVERSIDE
SANGSTER
SPRINGFIELD ESTATES
STRATFORD LANDING
SUNRISE VALLEY
WESTBRIAR
WHITE OAKS
WILLOW SPRINGS
This map can be viewed online. Visit www.fcps.edu/fts/planning/maps.
Elementary School AAP Assignments and School-Based AAP Centers
Additional Maps
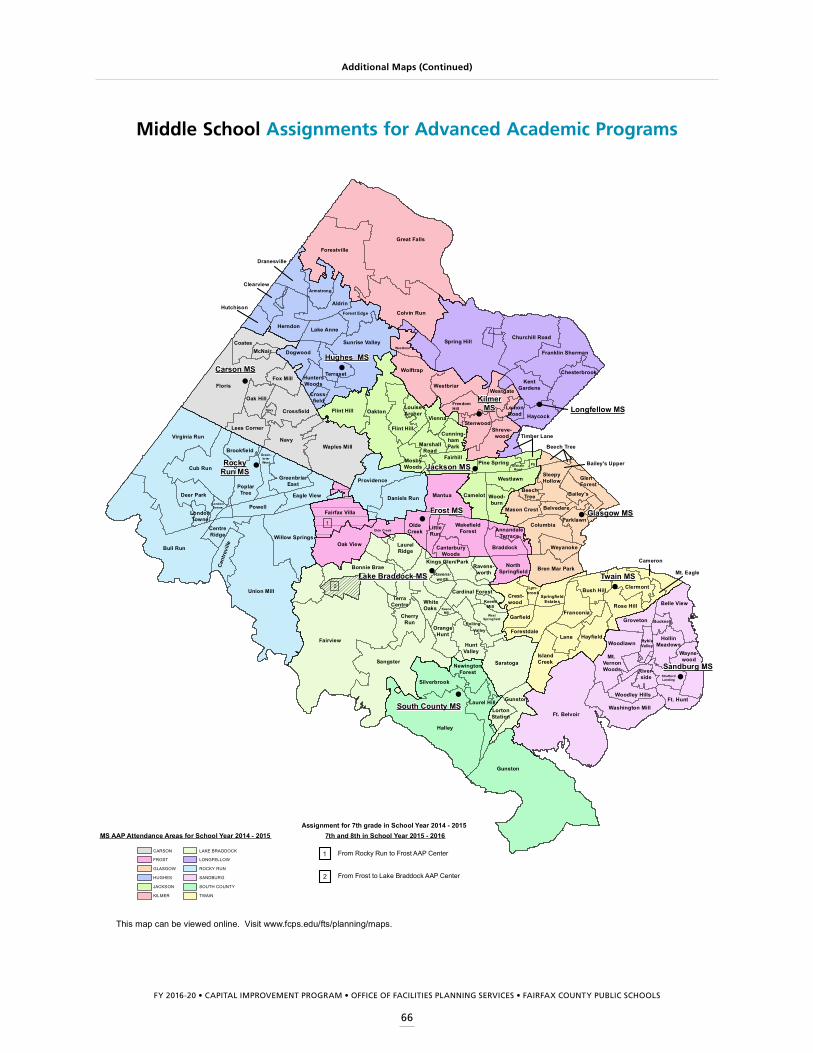
FY 2016-20 • CAPITAL IMPROVEMENT PROGRAM • OFFICE OF FACILITIES PLANNING SERVICES • FAIRFAX COUNTY PUBLIC SCHOOLS
66
!
!
!
!
!!
!!
!
!
!
!
Kings Glen/Park
Cross-field
PS
Valley
Gunston
Twain MS
Frost MS
KilmerMS
Carson MS
Glasgow MS
Jackson MS
Hughes MS
Sandburg MS
RockyRun MS
Longfellow MS
South County MS
Lake Braddock MS
Fairview
Gunston
Halley
Great Falls
Floris
Union Mill
Ft. Belvoir
Bull Run
Sangster
Oak View
Spring Hill
Virginia Run
Forestville
Oakton
Colvin Run
Navy
Cub Run
Waples Mill
Saratoga
Mantua
Sunrise Valley
Lane
Wolftrap
Churchill Road
Willow Springs
Woodlawn
Flint HillCrossfield
Aldrin
Fairfax Villa
Herndon
Providence
Coates
Daniels Run
Hayfield
Flint Hill
Fairhill
Belle View
Westbriar
Powell
Bonnie Brae
Columbia
Camelot
Silverbrook
Washington Mill
Clermont
Rose Hill
Eagle View
Terraset
Dogwood
Forestdale
Bren Mar Park
Oak Hill
Haycock
Westlawn
Lake Anne
Bush Hill
Fox Mill
Deer Park
Westgate
Stenwood
Braddock
Ft. Hunt
Lees Corner
Groveton
Brookfield
Garfield
Mason Crest
Bailey's
Weyanoke
Woodley Hills
Franklin Sherman
Wayne-wood
Laurel Hill
IslandCreek
PoplarTree
Franconia
Chesterbrook
Vienna
CherryRun
Shreve-wood
ParklawnWakefield
Forest
Armstrong
Cen
trev
ille
SleepyHollow
HuntValley
Dranesville
GreenbriarEast
KentGardens
GlenForest
OrangeHunt
LaurelRidge
Wood-burn
WhiteOaks
Crest-wood
FreedomHill
OldeCreek
Forest Edge
River-side
MarshallRoad
HollinMeadows
Cardinal Forest
Clearview
Rolling
HuntersWoods
Cameron
Westbriar
NorthSpringfield
CentreRidge
NewingtonForest
LittleRun
Pine Spring
Hutchison
Belvedere
TerraCentre
Timber Lane
MosbyWoods
McNair
WestSpringfield
SpringfieldEstates
Green-briarWest
Ravens-worth
Cunning-hamPark
LouiseArcher
LemonRoad
Bucknell
LortonStation
StratfordLanding
Lyn-brook
CanterburyWoods
BeechTree
Mt. Eagle
HyblaValley
AnnandaleTerrace
KeeneMill
Navy
Ravens-worth
LondonTowne
LondonTowne
KeeneMill
Mt. VernonWoods
GrahamRoad
Olde Creek
Beech Tree
Bailey's Upper
2014 - 2015 Middle School Assignments forAdvanced Academic Program Centers
MS AAP Attendance Areas for School Year 2014 - 2015
CARSON
FROST
GLASGOW
HUGHES
JACKSON
KILMER
LAKE BRADDOCK
LONGFELLOW
ROCKY RUN
SANDBURG
SOUTH COUNTY
TWAIN
7th and 8th in School Year 2015 - 2016
From Rocky Run to Frost AAP Center
From Frost to Lake Braddock AAP Center
Assignment for 7th grade in School Year 2014 - 2015
2
1
2
1
This map can be viewed online. Visit www.fcps.edu/fts/planning/maps.
Middle School Assignments for Advanced Academic Programs
Additional Maps (Continued)
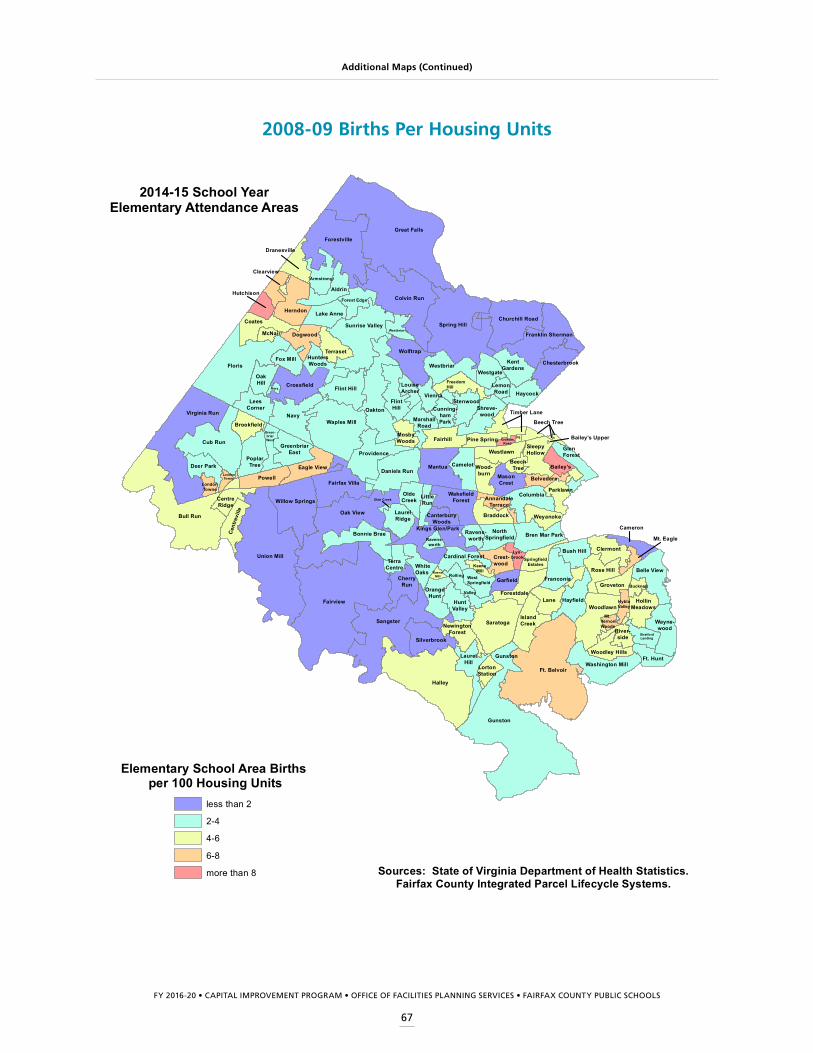
FY 2016-20 • CAPITAL IMPROVEMENT PROGRAM • OFFICE OF FACILITIES PLANNING SERVICES • FAIRFAX COUNTY PUBLIC SCHOOLS
67
Bailey's Upper
Beech Tree
Olde Creek
GrahamRoad
Mt. VernonWoods
KeeneMill
LondonTowne
LondonTowne
Ravens-worth
Navy
KeeneMill
AnnandaleTerrace
HyblaValley
Mt. Eagle
BeechTree
CanterburyWoods
Lyn-brook
StratfordLanding
LortonStation
Bucknell
LemonRoad
LouiseArcher
Cunning-hamPark
Ravens-worth
Green-briarWest
SpringfieldEstates
WestSpringfield
McNair
MosbyWoods
Timber Lane
TerraCentre
Belvedere
Hutchison
Pine Spring
LittleRun
NewingtonForest
CentreRidge
NorthSpringfield
Westbriar
Cameron
HuntersWoods
Rolling
Clearview
Cardinal Forest
HollinMeadows
MarshallRoad
River-side
Forest Edge
OldeCreek
FreedomHill
Crest-woodWhite
Oaks
Wood-burn
LaurelRidge
OrangeHunt
GlenForest
KentGardens
GreenbriarEast
Dranesville
HuntValley
SleepyHollow
Cen
trev
ille
Armstrong
WakefieldForest
Parklawn
Shreve-wood
CherryRun
Vienna
Chesterbrook
Franconia
PoplarTree
IslandCreek
LaurelHill
Wayne-wood
Franklin Sherman
Woodley Hills
Weyanoke
Bailey's
MasonCrest
Garfield
Brookfield
Groveton
LeesCorner
Ft. Hunt
Braddock
Stenwood
Westgate
Deer Park
Fox Mill
Bush Hill
Lake Anne
Westlawn
Haycock
OakHill
Bren Mar Park
Forestdale
Dogwood
Terraset
Eagle View
Rose Hill
Clermont
Washington Mill
Silverbrook
Camelot
Columbia
Bonnie Brae
Powell
Westbriar
Belle View
Fairhill
FlintHill
Hayfield
Daniels Run
Coates
Providence
Herndon
Fairfax Villa
Aldrin
Crossfield Flint Hill
Woodlawn
Willow Springs
Churchill Road
Wolftrap
Lane
Sunrise Valley
Mantua
Saratoga
Waples Mill
Cub Run
Navy
Colvin Run
Oakton
Forestville
Virginia Run
Spring Hill
Oak View
Sangster
Bull Run
Ft. Belvoir
Union Mill
Floris
Great Falls
Halley
Gunston
Fairview
Kings Glen/Park
PS
Valley
Gunston
2009-10 Births Per Housing Units
2014-15 School YearElementary Attendance Areas
Sources: State of Virginia Department of Health Statistics.Fairfax County Integrated Parcel Lifecycle Systems.
Elementary School Area Births per 100 Housing Units
less than 2
2-4
4-6
6-8
more than 8
2008-09 Births Per Housing Units
Additional Maps (Continued)

FY 2016-20 • CAPITAL IMPROVEMENT PROGRAM • OFFICE OF FACILITIES PLANNING SERVICES • FAIRFAX COUNTY PUBLIC SCHOOLS
68
Bailey's Upper
Beech Tree
Olde Creek
GrahamRoad
Mt. VernonWoods
KeeneMill
LondonTowne
LondonTowne
Ravens-worth
Navy
KeeneMill
AnnandaleTerrace
HyblaValley
Mt. Eagle
BeechTree
CanterburyWoods
Lyn-brook
StratfordLanding
LortonStation
Bucknell
LemonRoad
LouiseArcher
Cunning-hamPark
Ravens-worth
Green-briarWest
SpringfieldEstates
WestSpringfield
McNair
MosbyWoods
Timber Lane
TerraCentre
Belvedere
Hutchison
Pine Spring
LittleRun
NewingtonForest
CentreRidge
NorthSpringfield
Westbriar
Cameron
HuntersWoods
Rolling
Clearview
Cardinal Forest
HollinMeadows
MarshallRoad
River-side
Forest Edge
OldeCreek
FreedomHill
Crest-woodWhite
Oaks
Wood-burn
LaurelRidge
OrangeHunt
GlenForest
KentGardens
GreenbriarEast
Dranesville
HuntValley
SleepyHollow
Cen
trev
ille
Armstrong
WakefieldForest
Parklawn
Shreve-wood
CherryRun
Vienna
Chesterbrook
Franconia
PoplarTree
IslandCreek
LaurelHill
Wayne-wood
Franklin Sherman
Woodley Hills
Weyanoke
Bailey's
MasonCrest
Garfield
Brookfield
Groveton
LeesCorner
Ft. Hunt
Braddock
Stenwood
Westgate
Deer Park
Fox Mill
Bush Hill
Lake Anne
Westlawn
Haycock
OakHill
Bren Mar Park
Forestdale
Dogwood
Terraset
Eagle View
Rose Hill
Clermont
Washington Mill
Silverbrook
Camelot
Columbia
Bonnie Brae
Powell
Westbriar
Belle View
Fairhill
FlintHill
Hayfield
Daniels Run
Coates
Providence
Herndon
Fairfax Villa
Aldrin
CrossfieldFlint Hill
Woodlawn
Willow Springs
Churchill Road
Wolftrap
Lane
Sunrise Valley
Mantua
Saratoga
Waples Mill
Cub Run
Navy
Colvin Run
Oakton
Forestville
Virginia Run
Spring Hill
Oak View
Sangster
Bull Run
Ft. Belvoir
Union Mill
Floris
Great Falls
Halley
Gunston
Fairview
Kings Glen/Park
PS
Valley
Gunston
2012-13 Births Per Housing Units
2014-15 School YearElementary Attendance Areas
Sources: State of Virginia Department of Health Statistics.Fairfax County Integrated Parcel Lifecycle Systems.
Elementary School Area Births per 100 Housing Units
less than 2
2-4
4-6
6-8
more than 8
2012-13 Births Per Housing Units
Additional Maps (Continued)

FY 2016-20 • CAPITAL IMPROVEMENT PROGRAM • OFFICE OF FACILITIES PLANNING SERVICES • FAIRFAX COUNTY PUBLIC SCHOOLS
69
Franconia SpringfieldTSA
West FallsChurch TSA
BaileysCrossroads
HyblaValley/Gum
Springs
SevenCorners
Reston-HerndonSuburban Center
Dulles (Route28 Corridor)
Suburban Center
Lorton-SouthRoute 1
Centreville
TysonsCorner Urban
Center
Merrifield Suburban Center
Huntington-Penn Daw
TSA
Fairfax Center Suburban Center
Fairfax County Comprehensive Plan -
:0 4 82
Miles
LegendFCPS Division Boundary
Fairfax County Comprehensive Plan - Development Centers
Note:Each dot represents a birth located within
the Elementary Attendance Area and does not represent the exact
location of the residence.
Birth Data Source: State of Virginia Dept. of Health Statistics
TSA = Transit Station Areas
Development Centers, and 2012-13 School Year BirthsFairfax County Comprehensive Plan: Development Centers and 2012-13 School Year Births
Additional Maps (Continued)

FY 2016-20 • CAPITAL IMPROVEMENT PROGRAM • OFFICE OF FACILITIES PLANNING SERVICES • FAIRFAX COUNTY PUBLIC SCHOOLS
70
!(
!(
!(
!(
!(
!(
!(
!(
!(!(
!(
!(
!(
!(
!(
Pimmit Hills
Graham RdComm Bldg
FormerClifton ES
Dunn Loring
Leis Ctr
NancySprague
CtrSideburn
WiltonWoods
VirginiaHills Ctr
Lorton
Gatehouse
HutchisonMS Site
WestfieldSite
StonehurstES Site
FairfieldES Site
LEE JACKSON MEMORIAL HWY LEESBUR
GPIKE
RIC
HM
ON
DH
WY
ARLINGTON BLVD
LEESBURG PIKE
LEE HWY
CEN
TRE
VILL
ER
D
F
A IRFAX
COUNTY
PK
WY
SULL
Y R
D
RIC
HMOND
HWY
FAIRFAX BLVDFAIRFA X BLVD
FCPS Owned, Vacant School Sites, Buildings andAdministrative / Special Programs Centers
Legend
!( Vacant School Bldg., Community Bldg., and Admin. / Special Programs Cntrs.
!( Owned Vacant School Sites
SchoolSite No. Site Name
HowAcquired
TaxMap No.
MagisterialDistrict Acreage Present Status
137
225
240
287
Stonehurst ES
Fairfield ES
Westfield ES
Hutchison MS
Dedicated
Dedicated
Dedicated
Purchased
48-4
101-1
43-2
16-1
Providence
Lee
Sully
Dranesville
5.39
11.33
12.00
24.20
4/14/77: Interim use agreement with theStonehurst Homeowners Association.
4/22/75: Agreement with civic association (Boy Scout Troop #831) for clean-up.Partially developed. Scheduled byRecreation Department.
Acreage shown is available after HighSchool and FCPA use, transportationfacility and road dedication.
Interim use agreement with ParkAuthority.
(Pinewood Lake)
Additional Maps (Continued)
FCPS Owned Vacant School Sites, Community Building, and Administrative/Special Programs Centers
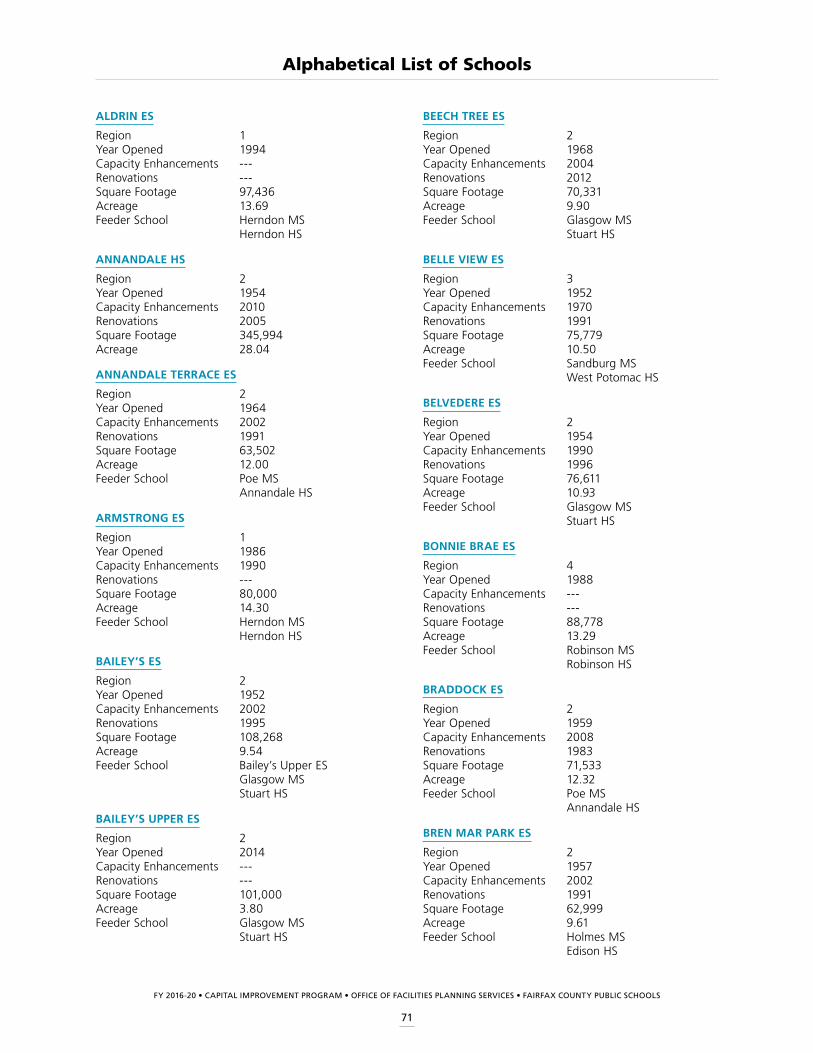
FY 2016-20 • CAPITAL IMPROVEMENT PROGRAM • OFFICE OF FACILITIES PLANNING SERVICES • FAIRFAX COUNTY PUBLIC SCHOOLS
71
BEECH TREE ES
Region 2Year Opened 1968Capacity Enhancements 2004Renovations 2012Square Footage 70,331Acreage 9.90Feeder School Glasgow MS Stuart HS
BELLE VIEW ES
Region 3Year Opened 1952Capacity Enhancements 1970Renovations 1991Square Footage 75,779Acreage 10.50Feeder School Sandburg MS West Potomac HS
BELVEDERE ES
Region 2Year Opened 1954Capacity Enhancements 1990Renovations 1996Square Footage 76,611Acreage 10.93Feeder School Glasgow MS Stuart HS
BONNIE BRAE ES
Region 4Year Opened 1988Capacity Enhancements ---Renovations ---Square Footage 88,778Acreage 13.29Feeder School Robinson MS Robinson HS
BRADDOCK ES
Region 2Year Opened 1959Capacity Enhancements 2008Renovations 1983Square Footage 71,533Acreage 12.32Feeder School Poe MS Annandale HS
BREN MAR PARK ES
Region 2Year Opened 1957Capacity Enhancements 2002Renovations 1991Square Footage 62,999Acreage 9.61Feeder School Holmes MS Edison HS
ALDRIN ES
Region 1Year Opened 1994Capacity Enhancements ---Renovations ---Square Footage 97,436Acreage 13.69Feeder School Herndon MS Herndon HS
ANNANDALE HS
Region 2Year Opened 1954Capacity Enhancements 2010Renovations 2005Square Footage 345,994Acreage 28.04
ANNANDALE TERRACE ES
Region 2Year Opened 1964Capacity Enhancements 2002Renovations 1991Square Footage 63,502Acreage 12.00Feeder School Poe MS Annandale HS
ARMSTRONG ES
Region 1Year Opened 1986Capacity Enhancements 1990Renovations ---Square Footage 80,000Acreage 14.30Feeder School Herndon MS Herndon HS
BAILEY’S ES
Region 2Year Opened 1952Capacity Enhancements 2002Renovations 1995Square Footage 108,268Acreage 9.54Feeder School Bailey’s Upper ES Glasgow MS Stuart HS
BAILEY’S UPPER ES
Region 2Year Opened 2014Capacity Enhancements ---Renovations ---Square Footage 101,000Acreage 3.80Feeder School Glasgow MS Stuart HS
Alphabetical List of Schools
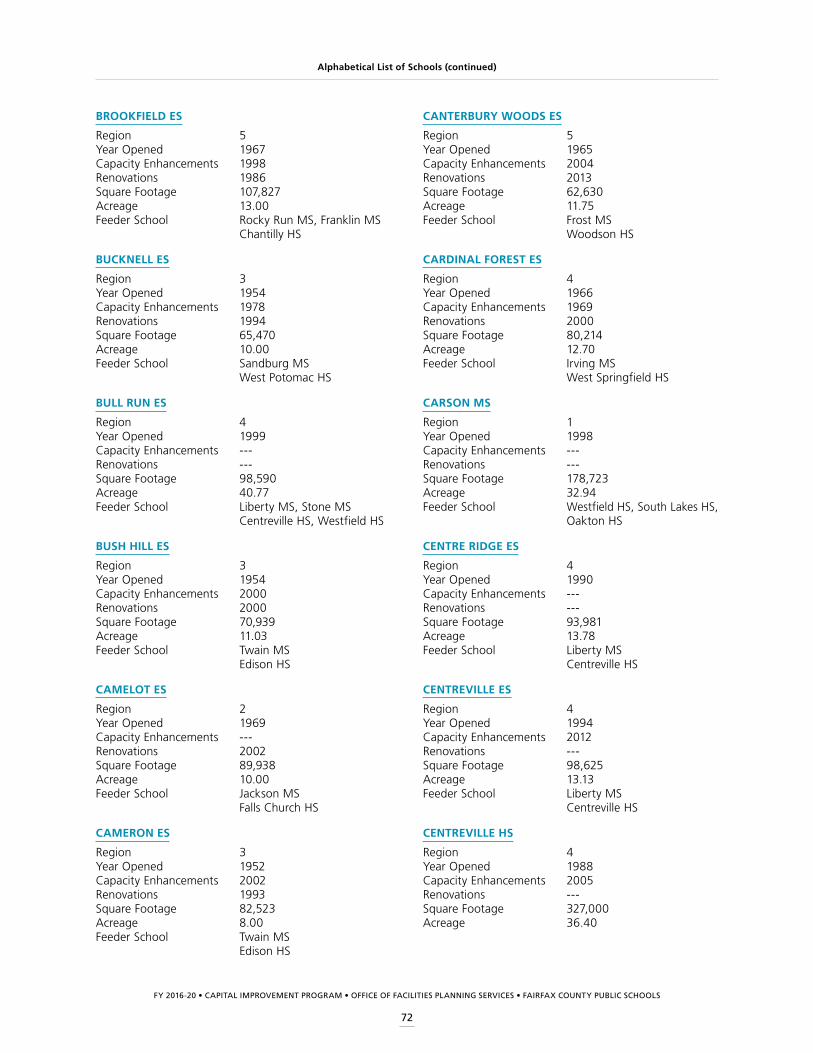
FY 2016-20 • CAPITAL IMPROVEMENT PROGRAM • OFFICE OF FACILITIES PLANNING SERVICES • FAIRFAX COUNTY PUBLIC SCHOOLS
72
CANTERBURY WOODS ES
Region 5Year Opened 1965Capacity Enhancements 2004Renovations 2013Square Footage 62,630Acreage 11.75Feeder School Frost MS Woodson HS
CARDINAL FOREST ES
Region 4Year Opened 1966Capacity Enhancements 1969Renovations 2000Square Footage 80,214Acreage 12.70Feeder School Irving MS West Springfield HS
CARSON MS
Region 1Year Opened 1998Capacity Enhancements --- Renovations ---Square Footage 178,723Acreage 32.94Feeder School Westfield HS, South Lakes HS,
Oakton HS
CENTRE RIDGE ES
Region 4Year Opened 1990Capacity Enhancements ---Renovations ---Square Footage 93,981Acreage 13.78Feeder School Liberty MS Centreville HS
CENTREVILLE ES
Region 4Year Opened 1994Capacity Enhancements 2012Renovations ---Square Footage 98,625Acreage 13.13Feeder School Liberty MS Centreville HS
CENTREVILLE HS
Region 4Year Opened 1988Capacity Enhancements 2005Renovations ---Square Footage 327,000Acreage 36.40
BROOKFIELD ES
Region 5Year Opened 1967Capacity Enhancements 1998Renovations 1986Square Footage 107,827Acreage 13.00Feeder School Rocky Run MS, Franklin MS Chantilly HS
BUCKNELL ES
Region 3Year Opened 1954Capacity Enhancements 1978Renovations 1994Square Footage 65,470Acreage 10.00Feeder School Sandburg MS West Potomac HS
BULL RUN ES
Region 4Year Opened 1999Capacity Enhancements ---Renovations ---Square Footage 98,590Acreage 40.77Feeder School Liberty MS, Stone MS Centreville HS, Westfield HS
BUSH HILL ES
Region 3Year Opened 1954Capacity Enhancements 2000Renovations 2000Square Footage 70,939Acreage 11.03Feeder School Twain MS Edison HS
CAMELOT ES
Region 2Year Opened 1969Capacity Enhancements ---Renovations 2002Square Footage 89,938Acreage 10.00Feeder School Jackson MS Falls Church HS
CAMERON ES
Region 3Year Opened 1952Capacity Enhancements 2002Renovations 1993Square Footage 82,523Acreage 8.00Feeder School Twain MS Edison HS
Alphabetical List of Schools (continued)
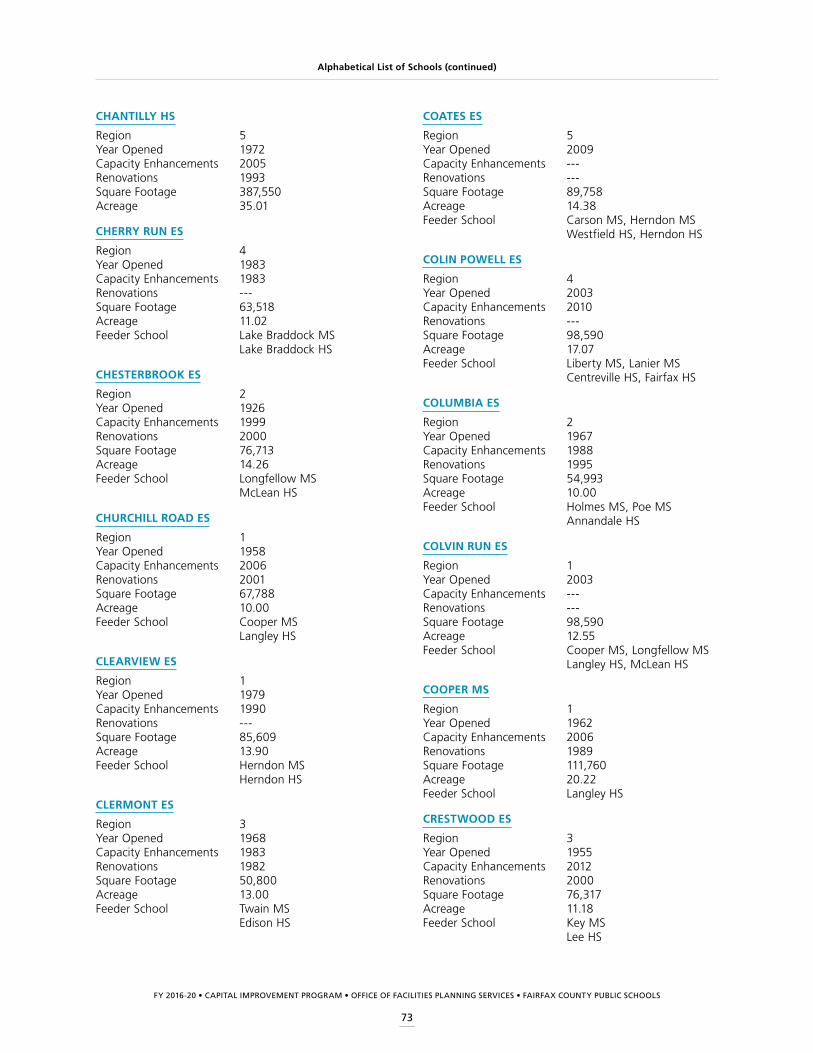
FY 2016-20 • CAPITAL IMPROVEMENT PROGRAM • OFFICE OF FACILITIES PLANNING SERVICES • FAIRFAX COUNTY PUBLIC SCHOOLS
73
Alphabetical List of Schools (continued)
COATES ES
Region 5Year Opened 2009Capacity Enhancements ---Renovations ---Square Footage 89,758Acreage 14.38Feeder School Carson MS, Herndon MS Westfield HS, Herndon HS
COLIN POWELL ES
Region 4Year Opened 2003Capacity Enhancements 2010Renovations ---Square Footage 98,590Acreage 17.07Feeder School Liberty MS, Lanier MS Centreville HS, Fairfax HS
COLUMBIA ES
Region 2Year Opened 1967Capacity Enhancements 1988Renovations 1995Square Footage 54,993Acreage 10.00Feeder School Holmes MS, Poe MS Annandale HS
COLVIN RUN ES
Region 1Year Opened 2003Capacity Enhancements ---Renovations ---Square Footage 98,590Acreage 12.55Feeder School Cooper MS, Longfellow MS Langley HS, McLean HS
COOPER MS
Region 1Year Opened 1962Capacity Enhancements 2006Renovations 1989Square Footage 111,760Acreage 20.22Feeder School Langley HS
CRESTWOOD ES
Region 3Year Opened 1955Capacity Enhancements 2012Renovations 2000Square Footage 76,317Acreage 11.18Feeder School Key MS Lee HS
CHANTILLY HS
Region 5Year Opened 1972Capacity Enhancements 2005Renovations 1993Square Footage 387,550Acreage 35.01
CHERRY RUN ES
Region 4Year Opened 1983Capacity Enhancements 1983Renovations ---Square Footage 63,518Acreage 11.02Feeder School Lake Braddock MS Lake Braddock HS
CHESTERBROOK ES
Region 2Year Opened 1926Capacity Enhancements 1999Renovations 2000Square Footage 76,713Acreage 14.26Feeder School Longfellow MS McLean HS
CHURCHILL ROAD ES
Region 1Year Opened 1958Capacity Enhancements 2006Renovations 2001Square Footage 67,788Acreage 10.00Feeder School Cooper MS Langley HS
CLEARVIEW ES
Region 1Year Opened 1979Capacity Enhancements 1990Renovations ---Square Footage 85,609Acreage 13.90Feeder School Herndon MS Herndon HS
CLERMONT ES
Region 3Year Opened 1968Capacity Enhancements 1983Renovations 1982Square Footage 50,800Acreage 13.00Feeder School Twain MS Edison HS
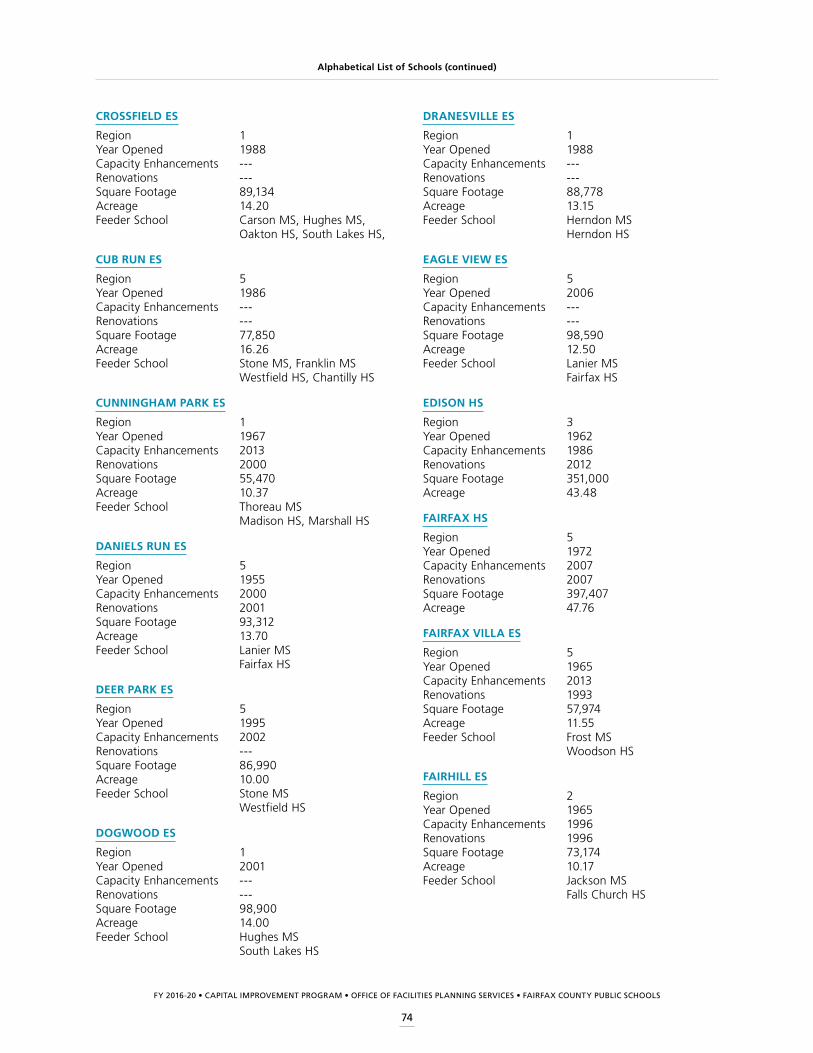
FY 2016-20 • CAPITAL IMPROVEMENT PROGRAM • OFFICE OF FACILITIES PLANNING SERVICES • FAIRFAX COUNTY PUBLIC SCHOOLS
74
DRANESVILLE ES
Region 1Year Opened 1988Capacity Enhancements ---Renovations ---Square Footage 88,778Acreage 13.15Feeder School Herndon MS Herndon HS
EAGLE VIEW ES
Region 5Year Opened 2006Capacity Enhancements ---Renovations ---Square Footage 98,590Acreage 12.50Feeder School Lanier MS Fairfax HS
EDISON HS
Region 3Year Opened 1962Capacity Enhancements 1986Renovations 2012Square Footage 351,000Acreage 43.48
FAIRFAX HS
Region 5Year Opened 1972Capacity Enhancements 2007Renovations 2007Square Footage 397,407Acreage 47.76
FAIRFAX VILLA ES
Region 5Year Opened 1965Capacity Enhancements 2013Renovations 1993Square Footage 57,974Acreage 11.55Feeder School Frost MS Woodson HS
FAIRHILL ES
Region 2Year Opened 1965Capacity Enhancements 1996Renovations 1996Square Footage 73,174Acreage 10.17Feeder School Jackson MS Falls Church HS
CROSSFIELD ES
Region 1Year Opened 1988Capacity Enhancements ---Renovations ---Square Footage 89,134Acreage 14.20Feeder School Carson MS, Hughes MS,
Oakton HS, South Lakes HS,
CUB RUN ES
Region 5Year Opened 1986Capacity Enhancements ---Renovations ---Square Footage 77,850Acreage 16.26Feeder School Stone MS, Franklin MS Westfield HS, Chantilly HS
CUNNINGHAM PARK ES
Region 1Year Opened 1967Capacity Enhancements 2013Renovations 2000Square Footage 55,470Acreage 10.37Feeder School Thoreau MS Madison HS, Marshall HS
DANIELS RUN ES
Region 5Year Opened 1955Capacity Enhancements 2000Renovations 2001Square Footage 93,312Acreage 13.70Feeder School Lanier MS Fairfax HS
DEER PARK ES
Region 5Year Opened 1995Capacity Enhancements 2002Renovations ---Square Footage 86,990Acreage 10.00Feeder School Stone MS Westfield HS
DOGWOOD ES
Region 1Year Opened 2001Capacity Enhancements ---Renovations ---Square Footage 98,900Acreage 14.00Feeder School Hughes MS South Lakes HS
Alphabetical List of Schools (continued)
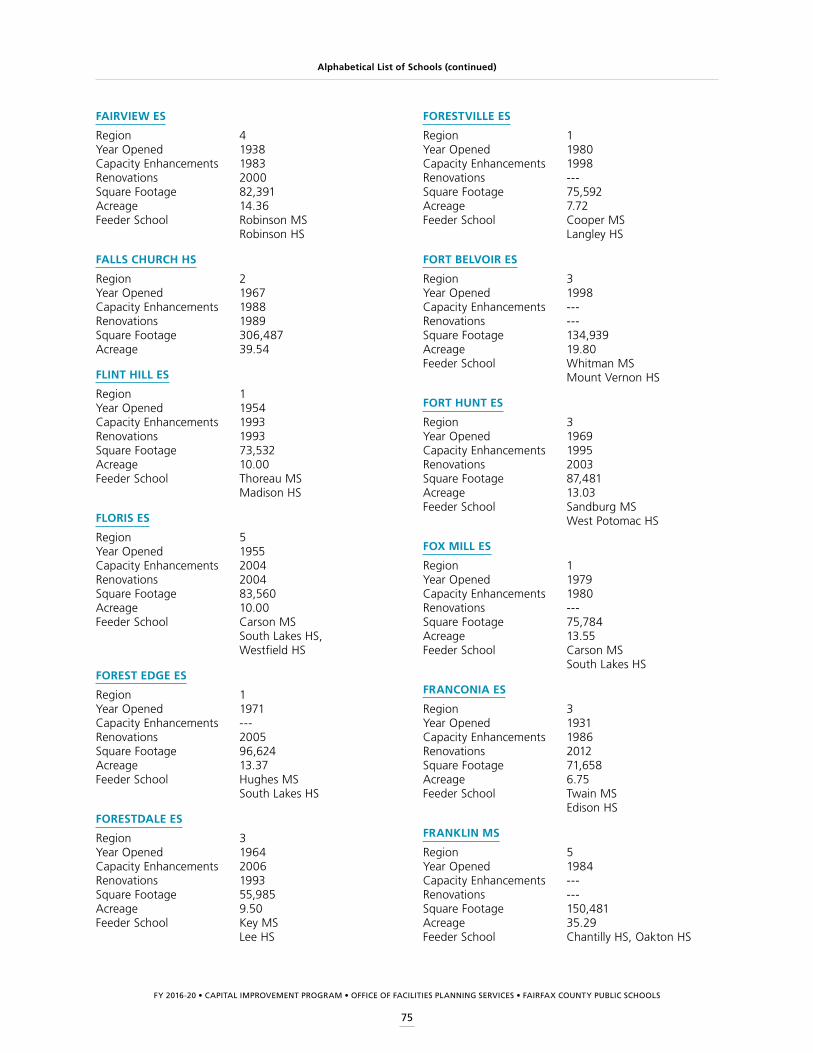
FY 2016-20 • CAPITAL IMPROVEMENT PROGRAM • OFFICE OF FACILITIES PLANNING SERVICES • FAIRFAX COUNTY PUBLIC SCHOOLS
75
FORESTVILLE ES
Region 1Year Opened 1980Capacity Enhancements 1998Renovations ---Square Footage 75,592Acreage 7.72Feeder School Cooper MS Langley HS
FORT BELVOIR ES
Region 3Year Opened 1998Capacity Enhancements ---Renovations ---Square Footage 134,939Acreage 19.80Feeder School Whitman MS Mount Vernon HS
FORT HUNT ES
Region 3Year Opened 1969Capacity Enhancements 1995Renovations 2003Square Footage 87,481Acreage 13.03Feeder School Sandburg MS West Potomac HS
FOX MILL ES
Region 1Year Opened 1979Capacity Enhancements 1980Renovations ---Square Footage 75,784Acreage 13.55Feeder School Carson MS South Lakes HS
FRANCONIA ES
Region 3Year Opened 1931Capacity Enhancements 1986Renovations 2012Square Footage 71,658Acreage 6.75Feeder School Twain MS Edison HS
FRANKLIN MS
Region 5Year Opened 1984Capacity Enhancements ---Renovations --- Square Footage 150,481Acreage 35.29Feeder School Chantilly HS, Oakton HS
FAIRVIEW ES
Region 4Year Opened 1938Capacity Enhancements 1983Renovations 2000Square Footage 82,391Acreage 14.36Feeder School Robinson MS Robinson HS
FALLS CHURCH HS
Region 2Year Opened 1967Capacity Enhancements 1988Renovations 1989Square Footage 306,487Acreage 39.54
FLINT HILL ES
Region 1Year Opened 1954Capacity Enhancements 1993Renovations 1993Square Footage 73,532Acreage 10.00Feeder School Thoreau MS Madison HS
FLORIS ES
Region 5Year Opened 1955Capacity Enhancements 2004Renovations 2004Square Footage 83,560Acreage 10.00Feeder School Carson MS South Lakes HS,
Westfield HS
FOREST EDGE ES
Region 1Year Opened 1971Capacity Enhancements ---Renovations 2005Square Footage 96,624Acreage 13.37Feeder School Hughes MS South Lakes HS
FORESTDALE ES
Region 3Year Opened 1964Capacity Enhancements 2006Renovations 1993Square Footage 55,985Acreage 9.50Feeder School Key MS Lee HS
Alphabetical List of Schools (continued)
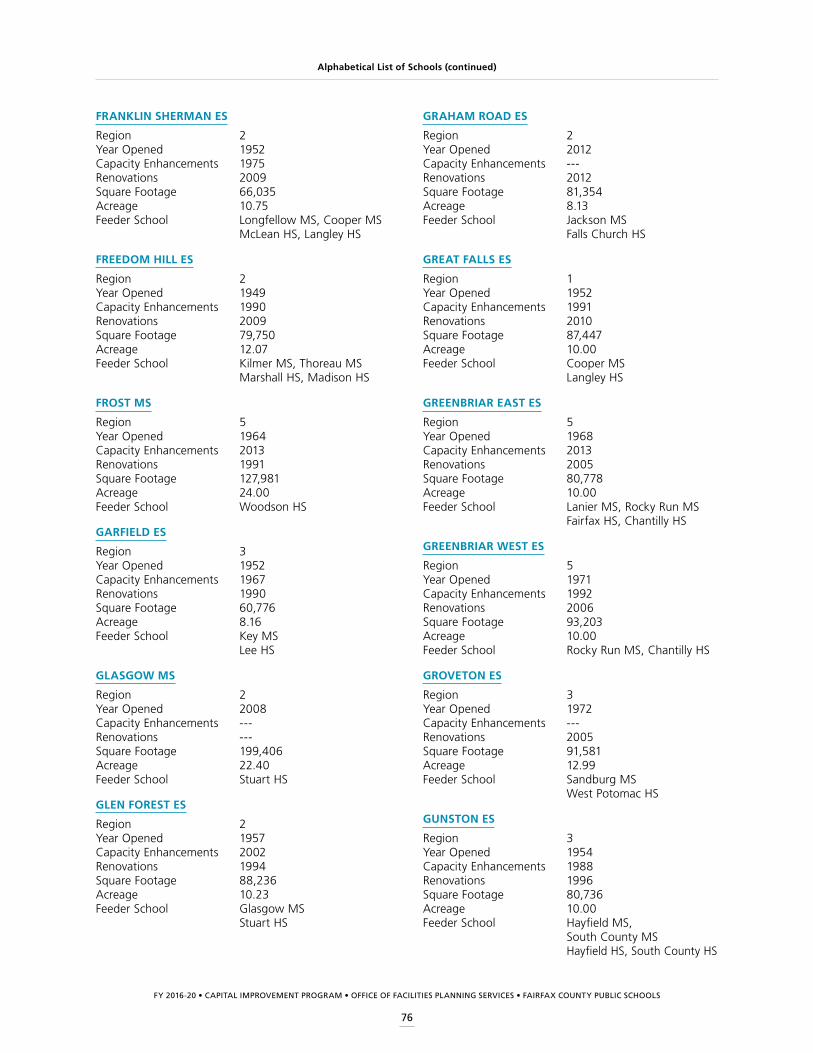
FY 2016-20 • CAPITAL IMPROVEMENT PROGRAM • OFFICE OF FACILITIES PLANNING SERVICES • FAIRFAX COUNTY PUBLIC SCHOOLS
76
GRAHAM ROAD ES
Region 2Year Opened 2012Capacity Enhancements ---Renovations 2012Square Footage 81,354Acreage 8.13Feeder School Jackson MS Falls Church HS
GREAT FALLS ES
Region 1Year Opened 1952Capacity Enhancements 1991Renovations 2010Square Footage 87,447Acreage 10.00Feeder School Cooper MS Langley HS
GREENBRIAR EAST ES
Region 5Year Opened 1968Capacity Enhancements 2013Renovations 2005Square Footage 80,778Acreage 10.00Feeder School Lanier MS, Rocky Run MS Fairfax HS, Chantilly HS
GREENBRIAR WEST ES
Region 5Year Opened 1971Capacity Enhancements 1992Renovations 2006Square Footage 93,203Acreage 10.00Feeder School Rocky Run MS, Chantilly HS
GROVETON ES
Region 3Year Opened 1972Capacity Enhancements ---Renovations 2005Square Footage 91,581Acreage 12.99Feeder School Sandburg MS West Potomac HS
GUNSTON ES
Region 3Year Opened 1954Capacity Enhancements 1988Renovations 1996Square Footage 80,736Acreage 10.00Feeder School Hayfield MS,
South County MS Hayfield HS, South County HS
FRANKLIN SHERMAN ES
Region 2Year Opened 1952Capacity Enhancements 1975Renovations 2009Square Footage 66,035Acreage 10.75Feeder School Longfellow MS, Cooper MS McLean HS, Langley HS
FREEDOM HILL ES
Region 2Year Opened 1949Capacity Enhancements 1990Renovations 2009Square Footage 79,750Acreage 12.07Feeder School Kilmer MS, Thoreau MS Marshall HS, Madison HS
FROST MS
Region 5Year Opened 1964Capacity Enhancements 2013Renovations 1991Square Footage 127,981Acreage 24.00Feeder School Woodson HS
GARFIELD ES
Region 3Year Opened 1952Capacity Enhancements 1967Renovations 1990Square Footage 60,776Acreage 8.16Feeder School Key MS Lee HS
GLASGOW MS
Region 2Year Opened 2008Capacity Enhancements ---Renovations ---Square Footage 199,406Acreage 22.40Feeder School Stuart HS
GLEN FOREST ES
Region 2Year Opened 1957Capacity Enhancements 2002Renovations 1994Square Footage 88,236Acreage 10.23Feeder School Glasgow MS Stuart HS
Alphabetical List of Schools (continued)

FY 2016-20 • CAPITAL IMPROVEMENT PROGRAM • OFFICE OF FACILITIES PLANNING SERVICES • FAIRFAX COUNTY PUBLIC SCHOOLS
77
HERNDON HS
Region 1Year Opened 1967Capacity Enhancements 1991Renovations 1991Square Footage 304,921Acreage 40.22
HERNDON MS
Region 1Year Opened 1927 Capacity Enhancements 1962 Renovations 1994Square Footage 200,388Acreage 27.30Feeder School Herndon HS
HOLLIN MEADOWS ES
Region 3Year Opened 1965Capacity Enhancements 2001Renovations 1983Square Footage 59,488Acreage 9.65Feeder School Sandburg MS West Potomac HS
HOLMES MS
Region 2Year Opened 1966Capacity Enhancements 1991Renovations 2003Square Footage 158,849Acreage 28.20Feeder School Annandale HS, Edison HS
HUGHES MS
Region 1Year Opened 1980Capacity Enhancements ---Renovations ---Square Footage 130,400Acreage 25.00Feeder School South Lakes HS
HUNT VALLEY ES
Region 4Year Opened 1968Capacity Enhancements 1990Renovations 1995Square Footage 90,187Acreage 13.00Feeder School Irving MS West Springfield HS
HALLEY ES
Region 4Year Opened 1995Capacity Enhancements ---Renovations ---Square Footage 98,900Acreage 20.11Feeder School South County MS South County HS
HAYCOCK ES
Region 2Year Opened 1954Capacity Enhancements 2009Renovations 1990Square Footage 63,362Acreage 10.00Feeder School Longfellow MS McLean HS
HAYFIELD ES
Region 3Year Opened 1966Capacity Enhancements 1992Renovations 2002Square Footage 80,149Acreage 13.13Feeder School Hayfield MS Hayfield HS
HAYFIELD HS
Region 3Year Opened 1968Capacity Enhancements 2002Renovations 2004Square Footage 516,960Acreage 57.50
HAYFIELD MS
Region 3Year Opened 1968Capacity Enhancements 2002Renovations 2004Square Footage 516,960Acreage 57.50Feeder School Hayfield HS
HERNDON ES
Region 1Year Opened 1961Capacity Enhancements 2007Renovations 1991Square Footage 85,396Acreage 14.00Feeder School Herndon MS Herndon HS
Alphabetical List of Schools (continued)

FY 2016-20 • CAPITAL IMPROVEMENT PROGRAM • OFFICE OF FACILITIES PLANNING SERVICES • FAIRFAX COUNTY PUBLIC SCHOOLS
78
KEENE MILL ES
Region 4Year Opened 1961Capacity Enhancements 1990Renovations 1991Square Footage 66,087Acreage 11.49Feeder School Irving MS, Lake Braddock MS West Springfield HS,
Lake Braddock HS
KENT GARDENS ES
Region 2Year Opened 1957Capacity Enhancements 2002Renovations 2003Square Footage 77,900Acreage 10.92Feeder School Longfellow MS McLean HS
KEY MS
Region 3Year Opened 1971Capacity Enhancement ---Renovations 2008Square Footage 221,670Acreage 20.60Feeder School Lee HS
KILMER MS
Region 2Year Opened 1967Capacity Enhancements ---Renovations 2002Square Footage 150,901Acreage 23.40Feeder School Marshall HS, Madison HS
KINGS GLEN ES
Region 4Year Opened 1969Capacity Enhancements 1986Renovations 2001Square Footage 72,702Acreage 8.20Feeder School Lake Braddock MS Lake Braddock HS
KINGS PARK ES
Region 4Year Opened 1964Capacity Enhancements 2013Renovations 1997Square Footage 82,920Acreage 10.10Feeder School Kings Glen ES,
Lake Braddock MS Lake Braddock HS
HUNTERS WOODS ES
Region 1Year Opened 1969Capacity Enhancements 1987Renovations 2003Square Footage 99,787Acreage 11.23Feeder School Hughes MS South Lakes HS
HUTCHISON ES
Region 1Year Opened 1975Capacity Enhancements 1990Renovations 2005Square Footage 106,408Acreage 38.80Feeder School Herndon MS Herndon HS
HYBLA VALLEY ES
Region 3Year Opened 1964Capacity Enhancements 2012Renovations 1989Square Footage 108,950Acreage 10.00Feeder School Sandburg MS West Potomac HS
IRVING MS
Region 4Year Opened 1960Capacity Enhancements 1967Renovations 1994Square Footage 156,838Acreage 20.80Feeder School West Springfield HS, Lee HS
ISLAND CREEK ES
Region 3Year Opened 2003Capacity Enhancements ---Renovations ---Square Footage 98,590Acreage 18.50Feeder School Hayfield MS Hayfield HS
JEFFERSON TECH HS
Region 2Year Opened 1964Capacity Enhancements 1988Renovations 1989Square Footage 264,506Acreage 39.15
Alphabetical List of Schools (continued)

FY 2016-20 • CAPITAL IMPROVEMENT PROGRAM • OFFICE OF FACILITIES PLANNING SERVICES • FAIRFAX COUNTY PUBLIC SCHOOLS
79
LAUREL HILL ES
Region 4Year Opened 2009Capacity Enhancements ---Renovations ---Square Footage 98,590Acreage 8.66Feeder School South County MS South County HS
LAUREL RIDGE ES
Region 4Year Opened 1970Capacity Enhancements 1993Renovations 2005Square Footage 112,320Acreage 12.55Feeder School Robinson MS Robinson HS
LEE HS
Region 3Year Opened 1958Capacity Enhancements 1974Renovations 2005Square Footage 336,068Acreage 25.32
LEES CORNER ES
Region 5Year Opened 1987Capacity Enhancements ---Renovations ---Square Footage 81,843Acreage 11.04Feeder School Franklin MS Chantilly HS
LEMON ROAD ES
Region 2Year Opened 1955Capacity Enhancements 2013Renovations 2003Square Footage 62,225Acreage 12.01Feeder School Kilmer MS, Longfellow MS Marshall HS, McLean HS
LIBERTY MS
Region 4Year Opened 2002Capacity Enhancements ---Renovations ---Square Footage 178,723Acreage 79.86Feeder School Centreville HS
LAKE ANNE ES
Region 1Year Opened 1967Capacity Enhancements 2004Renovations 2011Square Footage 86,200Acreage 10.18Feeder School Hughes MS South Lakes HS
LAKE BRADDOCK HS
Region 4Year Opened 1971Capacity Enhancements ---Renovations 2007Square Footage 604,660Acreage 60.06
LAKE BRADDOCK MS
Region 4Year Opened 1971Capacity Enhancements ---Renovations 2007Square Footage 604,660Acreage 60.06Feeder School Lake Braddock HS
LANE ES
Region 3Year Opened 1995Capacity Enhancements ---Renovations ---Square Footage 98,625Acreage 20.34Feeder School Hayfield MS, Twain MS Hayfield HS, Edison HS
LANGLEY HS
Region 1Year Opened 1965Capacity Enhancements 2008Renovations 1990Square Footage 247,465Acreage 42.86
LANIER MS
Region 5Year Opened 1960Capacity Enhancements 2006Renovations 2008Square Footage 182,589Acreage 19.40Feeder School Fairfax HS
Alphabetical List of Schools (continued)

FY 2016-20 • CAPITAL IMPROVEMENT PROGRAM • OFFICE OF FACILITIES PLANNING SERVICES • FAIRFAX COUNTY PUBLIC SCHOOLS
80
LYNBROOK ES
Region 3Year Opened 1956Capacity Enhancements 2013Renovations 1993Square Footage 88,925Acreage 10.64Feeder School Key MS Lee HS
MADISON HS
Region 1Year Opened 1959Capacity Enhancements 1979Renovations 2005Square Footage 314,342Acreage 31.16
MANTUA ES
Region 5Year Opened 1961Capacity Enhancements 2006Renovations 1997Square Footage 87,681Acreage 11.57Feeder School Frost MS Woodson HS
MARSHALL HS
Region 2Year Opened 1962Capacity Enhancements 2014Renovations 2014Square Footage 369,041Acreage 46.50
MARSHALL ROAD ES
Region 1Year Opened 1961Capacity Enhancements 2009Renovations 1999Square Footage 76,597Acreage 11.00Feeder School Thoreau MS, Jackson MS Madison HS, Oakton HS
MASON CREST ES
Region 2Year Opened 2012Capacity Enhancements ---Renovations ---Square Footage 98,590Acreage 10.91Feeder School Poe MS, Glasgow MS Falls Church HS, Stuart HS
LITTLE RUN ES
Region 5Year Opened 1963Capacity Enhancements 1993Renovations 1993Square Footage 55,085Acreage 10.11Feeder School Frost MS, Lake Braddock MS Woodson HS,
Lake Braddock HS
LONDON TOWNE ES
Region 5Year Opened 1969Capacity Enhancements 2003Renovations 2000Square Footage 92,870Acreage 12.71Feeder School Stone MS Westfield HS
LONGFELLOW MS
Region 2Year Opened 1960Capacity Enhancements 2012Renovations 2012Square Footage 175,793Acreage 17.57Feeder School McLean HS
LORTON STATION ES
Region 3Year Opened 2003Capacity Enhancements ---Renovations ---Square Footage 98,900Acreage 12.81Feeder School Hayfield MS Hayfield HS
LOUISE ARCHER ES
Region 1Year Opened 1939Capacity Enhancements 2006Renovations 1991Square Footage 53,684Acreage 7.64Feeder School Thoreau MS Madison HS
LUTHER JACKSON MS
Region 2Year Opened 1954Capacity Enhancements 2006Renovations 1991Square Footage 154,818Acreage 20.40Feeder School Falls Church HS, Oakton HS
Alphabetical List of Schools (continued)
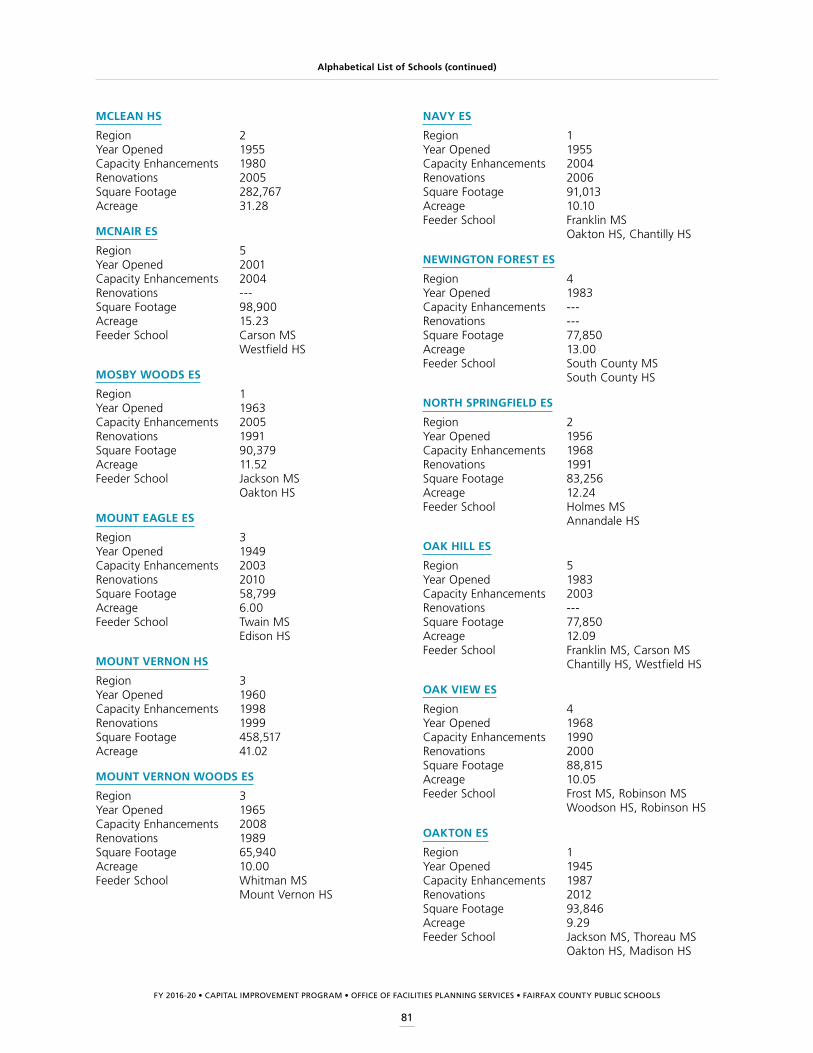
FY 2016-20 • CAPITAL IMPROVEMENT PROGRAM • OFFICE OF FACILITIES PLANNING SERVICES • FAIRFAX COUNTY PUBLIC SCHOOLS
81
NAVY ES
Region 1Year Opened 1955Capacity Enhancements 2004Renovations 2006Square Footage 91,013Acreage 10.10Feeder School Franklin MS
Oakton HS, Chantilly HS
NEWINGTON FOREST ES
Region 4Year Opened 1983Capacity Enhancements ---Renovations ---Square Footage 77,850Acreage 13.00Feeder School South County MS South County HS
NORTH SPRINGFIELD ES
Region 2Year Opened 1956Capacity Enhancements 1968Renovations 1991Square Footage 83,256Acreage 12.24Feeder School Holmes MS Annandale HS
OAK HILL ES
Region 5Year Opened 1983Capacity Enhancements 2003Renovations ---Square Footage 77,850Acreage 12.09Feeder School Franklin MS, Carson MS Chantilly HS, Westfield HS
OAK VIEW ES
Region 4Year Opened 1968Capacity Enhancements 1990Renovations 2000Square Footage 88,815Acreage 10.05Feeder School Frost MS, Robinson MS Woodson HS, Robinson HS
OAKTON ES
Region 1Year Opened 1945Capacity Enhancements 1987Renovations 2012Square Footage 93,846Acreage 9.29Feeder School Jackson MS, Thoreau MS Oakton HS, Madison HS
MCLEAN HS
Region 2Year Opened 1955Capacity Enhancements 1980Renovations 2005Square Footage 282,767Acreage 31.28
MCNAIR ES
Region 5Year Opened 2001Capacity Enhancements 2004Renovations ---Square Footage 98,900Acreage 15.23Feeder School Carson MS Westfield HS
MOSBY WOODS ES
Region 1Year Opened 1963Capacity Enhancements 2005Renovations 1991Square Footage 90,379Acreage 11.52Feeder School Jackson MS Oakton HS
MOUNT EAGLE ES
Region 3Year Opened 1949Capacity Enhancements 2003Renovations 2010Square Footage 58,799Acreage 6.00Feeder School Twain MS Edison HS
MOUNT VERNON HS
Region 3Year Opened 1960Capacity Enhancements 1998Renovations 1999Square Footage 458,517Acreage 41.02
MOUNT VERNON WOODS ES
Region 3Year Opened 1965Capacity Enhancements 2008Renovations 1989Square Footage 65,940Acreage 10.00Feeder School Whitman MS Mount Vernon HS
Alphabetical List of Schools (continued)
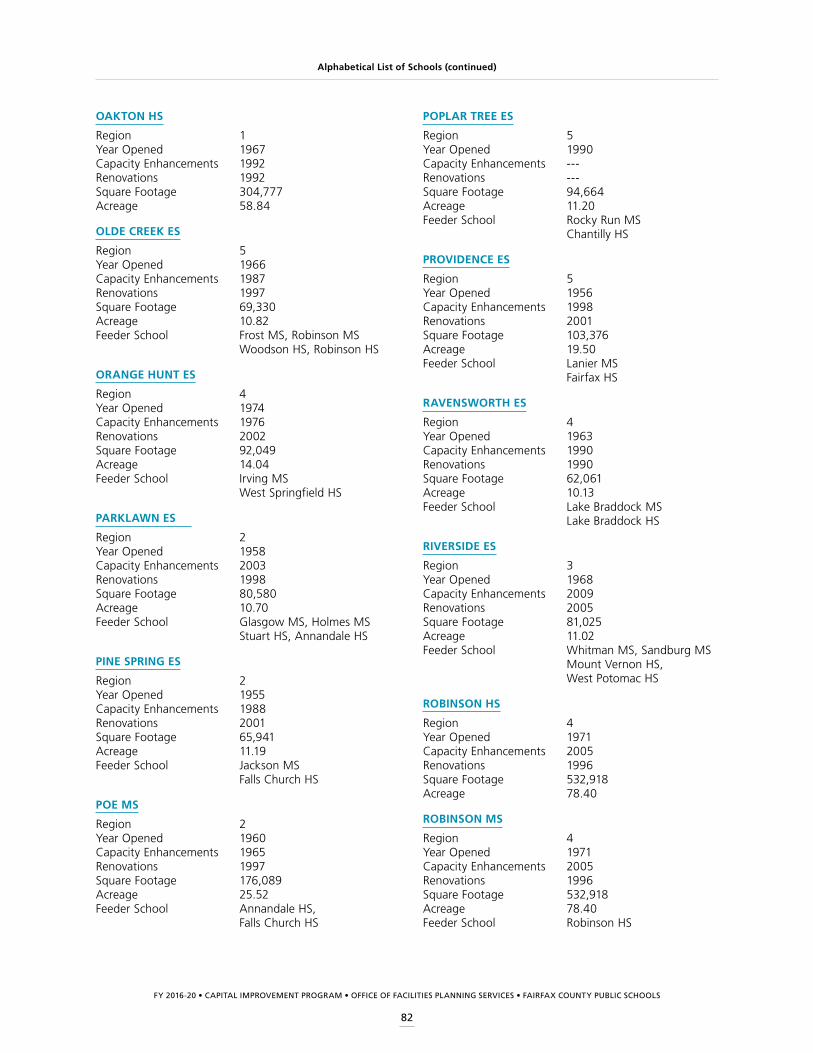
FY 2016-20 • CAPITAL IMPROVEMENT PROGRAM • OFFICE OF FACILITIES PLANNING SERVICES • FAIRFAX COUNTY PUBLIC SCHOOLS
82
POPLAR TREE ES
Region 5Year Opened 1990Capacity Enhancements ---Renovations ---Square Footage 94,664Acreage 11.20Feeder School Rocky Run MS Chantilly HS
PROVIDENCE ES
Region 5Year Opened 1956Capacity Enhancements 1998Renovations 2001Square Footage 103,376Acreage 19.50Feeder School Lanier MS Fairfax HS
RAVENSWORTH ES
Region 4Year Opened 1963Capacity Enhancements 1990Renovations 1990Square Footage 62,061Acreage 10.13Feeder School Lake Braddock MS Lake Braddock HS
RIVERSIDE ES
Region 3Year Opened 1968Capacity Enhancements 2009Renovations 2005Square Footage 81,025Acreage 11.02Feeder School Whitman MS, Sandburg MS Mount Vernon HS,
West Potomac HS
ROBINSON HS
Region 4Year Opened 1971Capacity Enhancements 2005Renovations 1996Square Footage 532,918Acreage 78.40
ROBINSON MS
Region 4Year Opened 1971Capacity Enhancements 2005Renovations 1996Square Footage 532,918Acreage 78.40Feeder School Robinson HS
OAKTON HS
Region 1Year Opened 1967Capacity Enhancements 1992Renovations 1992Square Footage 304,777Acreage 58.84
OLDE CREEK ES
Region 5Year Opened 1966Capacity Enhancements 1987Renovations 1997Square Footage 69,330Acreage 10.82Feeder School Frost MS, Robinson MS Woodson HS, Robinson HS
ORANGE HUNT ES
Region 4Year Opened 1974Capacity Enhancements 1976Renovations 2002Square Footage 92,049Acreage 14.04Feeder School Irving MS West Springfield HS
PARKLAWN ES
Region 2Year Opened 1958Capacity Enhancements 2003Renovations 1998Square Footage 80,580Acreage 10.70Feeder School Glasgow MS, Holmes MS Stuart HS, Annandale HS
PINE SPRING ES
Region 2Year Opened 1955Capacity Enhancements 1988Renovations 2001Square Footage 65,941Acreage 11.19Feeder School Jackson MS Falls Church HS
POE MS
Region 2Year Opened 1960Capacity Enhancements 1965Renovations 1997Square Footage 176,089Acreage 25.52Feeder School Annandale HS,
Falls Church HS
Alphabetical List of Schools (continued)

FY 2016-20 • CAPITAL IMPROVEMENT PROGRAM • OFFICE OF FACILITIES PLANNING SERVICES • FAIRFAX COUNTY PUBLIC SCHOOLS
83
SHREVEWOOD ES
Region 2Year Opened 1966Capacity Enhancements 1998Renovations 1998Square Footage 71,610Acreage 13.42Feeder School Kilmer MS Marshall HS
SILVERBROOK ES
Region 4Year Opened 1988Capacity Enhancements 2001Renovations ---Square Footage 82,675Acreage 13.93Feeder School South County MS South County HS
SLEEPY HOLLOW ES
Region 2Year Opened 1954Capacity Enhancements 1996Renovations 2009Square Footage 73,934Acreage 10.00Feeder School Glasgow MS Stuart HS
SOUTH COUNTY HS
Region 4Year Opened 2005Capacity Enhancements 2007Renovations ---Square Footage 378,000Acreage 69.39
SOUTH COUNTY MS
Region 4Year Opened 2012Capacity Enhancements ---Renovations ---Square Footage 176,900Acreage 37.00Feeder School South County HS
SOUTH LAKES HS
Region 1Year Opened 1978Capacity Enhancements ---Renovations 2008Square Footage 333,750Acreage 60.00
ROCKY RUN MS
Region 5Year Opened 1980Capacity Enhancements ---Renovations ---Square Footage 130,400Acreage 25.20Feeder School Chantilly HS
ROLLING VALLEY ES
Region 4Year Opened 1967Capacity Enhancements 1990Renovations 1998Square Footage 77,801Acreage 10.09Feeder School Irving MS, Key MS West Springfield HS, Lee HS
ROSE HILL ES
Region 3Year Opened 1957Capacity Enhancements 2008Renovations 1994Square Footage 88,382Acreage 11.19Feeder School Hayfield MS, Twain MS Hayfield HS, Edison HS
SANDBURG MS
Region 3Year Opened 1963Capacity Enhancements 1980Renovations ---Square Footage 263,940Acreage 35.24Feeder School West Potomac HS
SANGSTER ES
Region 4Year Opened 1988Capacity Enhancements 1996Renovations ---Square Footage 88,552Acreage 13.90Feeder School Lake Braddock MS, Irving MS Lake Braddock HS,
West Springfield HS
SARATOGA ES
Region 3Year Opened 1989Capacity Enhancements ---Renovations ---Square Footage 103,570Acreage 13.99Feeder School Key MS Lee HS
Alphabetical List of Schools (continued)

FY 2016-20 • CAPITAL IMPROVEMENT PROGRAM • OFFICE OF FACILITIES PLANNING SERVICES • FAIRFAX COUNTY PUBLIC SCHOOLS
84
SUNRISE VALLEY ES
Region 1Year Opened 1979Capacity Enhancements 1980Renovations ---Square Footage 60,700Acreage 14.98Feeder School Hughes MS South Lakes HS
TERRA CENTRE ES
Region 4Year Opened 1980Capacity Enhancements ---Renovations ---Square Footage 69,000Acreage 11.62Feeder School Robinson MS Robinson HS
TERRASET ES
Region 1Year Opened 1977Capacity Enhancements ---Renovations ---Square Footage 70,200Acreage 14.43Feeder School Hughes MS South Lakes HS
THOREAU MS
Region 1Year Opened 1960Capacity Enhancements 1986Renovations 1986Square Footage 115,702Acreage 20.00Feeder School Madison HS, Marshall HS
TIMBER LANE ES
Region 2Year Opened 1955Capacity Enhancements 1988Renovations 1996Square Footage 80,591Acreage 10.14Feeder School Longfellow MS, Jackson MS McLean HS, Falls Church HS
TWAIN MS
Region 3Year Opened 1961Capacity Enhancements 2002Renovations 1998Square Footage 156,225Acreage 23.52Feeder School Edison HS
SPRING HILL ES
Region 1Year Opened 1965Capacity Enhancements 2013Renovations 1996Square Footage 116,682Acreage 13.00Feeder School Cooper MS, Longfellow MS Langley HS, McLean HS
SPRINGFIELD ESTATES ES
Region 3Year Opened 1958Capacity Enhancements 2013Renovations 1989Square Footage 66,620Acreage 10.60Feeder School Key MS Lee HS
STENWOOD ES
Region 2Year Opened 1963Capacity Enhancements 1990Renovations 2012Square Footage 71,213Acreage 10.00Feeder School Kilmer MS, Thoreau MS Marshall HS
STONE MS
Region 5Year Opened 1991Capacity Enhancements ---Renovations ---Square Footage 157,263Acreage 24.83Feeder School Westfield HS
STRATFORD LANDING ES
Region 3Year Opened 1963Capacity Enhancements 2005Renovations 1989Square Footage 60,035Acreage 10.00Feeder School Sandburg MS West Potomac HS
STUART HS
Region 2Year Opened 1959Capacity Enhancements 1979Renovations 2005Square Footage 300,491Acreage 20.94
Alphabetical List of Schools (continued)

FY 2016-20 • CAPITAL IMPROVEMENT PROGRAM • OFFICE OF FACILITIES PLANNING SERVICES • FAIRFAX COUNTY PUBLIC SCHOOLS
85
WAYNEWOOD ES
Region 3Year Opened 1959Capacity Enhancements 2008Renovations 1991Square Footage 59,719Acreage 10.16Feeder School Sandburg MS West Potomac HS
WEST POTOMAC HS
Region 3Year Opened 1960Capacity Enhancements ---Renovations 2001Square Footage 389,012Acreage 44.78
WEST SPRINGFIELD ES
Region 4Year Opened 1964Capacity Enhancements 2012Renovations 1993Square Footage 55,885Acreage 10.03Feeder School Irving MS West Springfield HS, Lee HS
WEST SPRINGFIELD HS
Region 4Year Opened 1966Capacity Enhancements 1990Renovations 1990Square Footage 302,795Acreage 38.62
WESTBRIAR ES
Region 2Year Opened 1965Capacity Enhancements 1985Renovations 2000Square Footage 59,192Acreage 10.03Feeder School Kilmer MS Marshall HS, Madison HS
WESTFIELD HS
Region 5Year Opened 2000Capacity Enhancements 2006 Renovations ---Square Footage 422,298Acreage 76.30
UNION MILL ES
Region 4Year Opened 1986Capacity Enhancements 2013Renovations ---Square Footage 93,414Acreage 13.00Feeder School Liberty MS, Robinson MS Centreville HS, Robinson HS
VIENNA ES
Region 1Year Opened 1921Capacity Enhancements 1987Renovations 2010Square Footage 67,055Acreage 15.19Feeder School Thoreau MS, Kilmer MS Madison HS, Marshall HS
VIRGINIA RUN ES
Region 5Year Opened 1989Capacity Enhancements ---Renovations ---Square Footage 90,800Acreage 20.85Feeder School Stone MS Westfield HS
WAKEFIELD FOREST ES
Region 5Year Opened 1955Capacity Enhancements 1994Renovations 1994Square Footage 65,062Acreage 13.59Feeder School Frost MS Woodson HS
WAPLES MILL ES
Region 1Year Opened 1991Capacity Enhancements ---Renovations ---Square Footage 92,470Acreage 14.10Feeder School Franklin MS Oakton HS
WASHINGTON MILL ES
Region 3Year Opened 1963Capacity Enhancements 2004Renovations 1989Square Footage 61,581Acreage 11.53Feeder School Whitman MS Mount Vernon HS
Alphabetical List of Schools (continued)
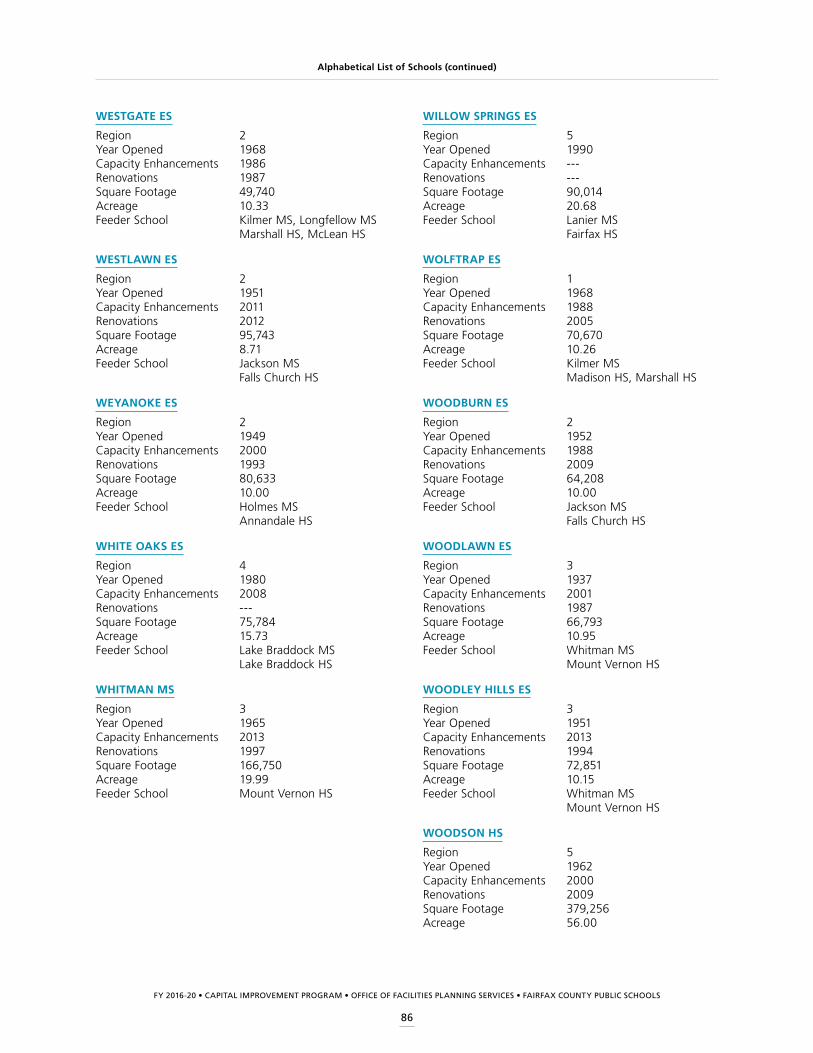
FY 2016-20 • CAPITAL IMPROVEMENT PROGRAM • OFFICE OF FACILITIES PLANNING SERVICES • FAIRFAX COUNTY PUBLIC SCHOOLS
86
WILLOW SPRINGS ES
Region 5Year Opened 1990Capacity Enhancements ---Renovations ---Square Footage 90,014Acreage 20.68Feeder School Lanier MS Fairfax HS
WOLFTRAP ES
Region 1Year Opened 1968Capacity Enhancements 1988Renovations 2005Square Footage 70,670Acreage 10.26Feeder School Kilmer MS Madison HS, Marshall HS
WOODBURN ES
Region 2Year Opened 1952Capacity Enhancements 1988Renovations 2009Square Footage 64,208Acreage 10.00Feeder School Jackson MS Falls Church HS
WOODLAWN ES
Region 3Year Opened 1937Capacity Enhancements 2001Renovations 1987Square Footage 66,793Acreage 10.95Feeder School Whitman MS Mount Vernon HS
WOODLEY HILLS ES
Region 3Year Opened 1951Capacity Enhancements 2013Renovations 1994Square Footage 72,851Acreage 10.15Feeder School Whitman MS Mount Vernon HS
WOODSON HS
Region 5Year Opened 1962Capacity Enhancements 2000Renovations 2009Square Footage 379,256Acreage 56.00
WESTGATE ES
Region 2Year Opened 1968Capacity Enhancements 1986Renovations 1987Square Footage 49,740Acreage 10.33Feeder School Kilmer MS, Longfellow MS Marshall HS, McLean HS
WESTLAWN ES
Region 2Year Opened 1951Capacity Enhancements 2011Renovations 2012Square Footage 95,743Acreage 8.71Feeder School Jackson MS Falls Church HS
WEYANOKE ES
Region 2Year Opened 1949Capacity Enhancements 2000Renovations 1993Square Footage 80,633Acreage 10.00Feeder School Holmes MS Annandale HS
WHITE OAKS ES
Region 4Year Opened 1980Capacity Enhancements 2008Renovations ---Square Footage 75,784Acreage 15.73Feeder School Lake Braddock MS Lake Braddock HS
WHITMAN MS
Region 3Year Opened 1965Capacity Enhancements 2013Renovations 1997Square Footage 166,750Acreage 19.99Feeder School Mount Vernon HS
Alphabetical List of Schools (continued)

FY 2016-20 • CAPITAL IMPROVEMENT PROGRAM • OFFICE OF FACILITIES PLANNING SERVICES • FAIRFAX COUNTY PUBLIC SCHOOLS
87
Glossary of Terms
Attendance Areas Adjustments
GrandfatheringThis results when School Board policy allows for students in the rising 6th (5th if applicable), 8th, and 12th grades to be exempt from a boundary change so they can finish their last year at their currently assigned elementary, middle, or high school. Transportation is provided for these students. The Board has the authority to extend grandfathering beyond the provisions in the policy.
School Board Policy 8130Provides guidance in the evaluation of proposed boundary changes. The following examples of these factors are not presented in priority order. Any or all of these factors may be relevant in a particular consolidation, redistricting, or assignment plan:
• proximity of schools to student residences
• projected school enrollment and capacity
• walking distances
• busing times and costs
• walking and busing safety
• natural and man-made geographic features
• the impact on neighborhoods
• school feeder alignments
• contiguous school attendance areas
• long-range capital plans
• socioeconomic characteristics of school populations
• distribution of programs and resources
• overall impact on families and students; and comparative long-term costs.
Adjustments shall be made without respect to magisterial districts or postal addresses and, whenever possible, shall not affect the same occupied dwellings any more often than once in three years. The consideration of these factors and such adjustments shall involve affected communities to the extent reasonable.
Budget
Capital BudgetThis budget provides for school construction projects which include new construction, renovations, capacity enhancements, site acquisitions, and additions. The primary source of funding for capital budget is the sale of bonds authorized by the voters in the bond referendum.
Capital Improvement Program (CIP)The CIP is a planning document used as a basis to determine the timing and size of proposed bond referenda to be placed before the voters of Fairfax County. The primary source of funding for school construction projects is the sale of bonds authorized by the voters in these referenda.
Operating BudgetThis budget provides for the day-to-day operations and maintenance of the schools and is funded primarily by county and state funds.
Capacity
CapacityThe number of students a building can support when restrictions of the program of studies are applied.
Capacity DashboardA program that calculates capacity of each school based on the programs that currently are offered at the school and its comparison to the core capacity of the school. It includes information about projected enrollments of the school, number of temporary classrooms, and other facilities information. This program is available on the FCPS website at http://www.fcps.edu/fts/dashboard/index.shtml.
Capacity UtilizationPercentage of capacity that is being utilized by a building based on the building’s program capacity and the number of enrolled students.
Design CapacityCapacity based on a specific use as designed for each space in the school.
Fiscal Year (FY)The period from July 1 to June 30 of the following year (for example: FY 2016 is the period from July 1, 2015, through June 30, 2016).
OvercrowdingA school is considered overcrowded when the enrollment of the school is higher than its capacity.
Program CapacityCapacity based on an actual use for each space in the school.
Student Yield RatioA ratio that is derived by dividing number of students by number of housing units by type in an existing development. This ratio helps in determining student cohort from existing housing types which gives a fair estimate of student yields from future developments. For example a housing development with 20 townhomes and 5 elementary school students will have a student yield ratio of 0.25 students per townhome.
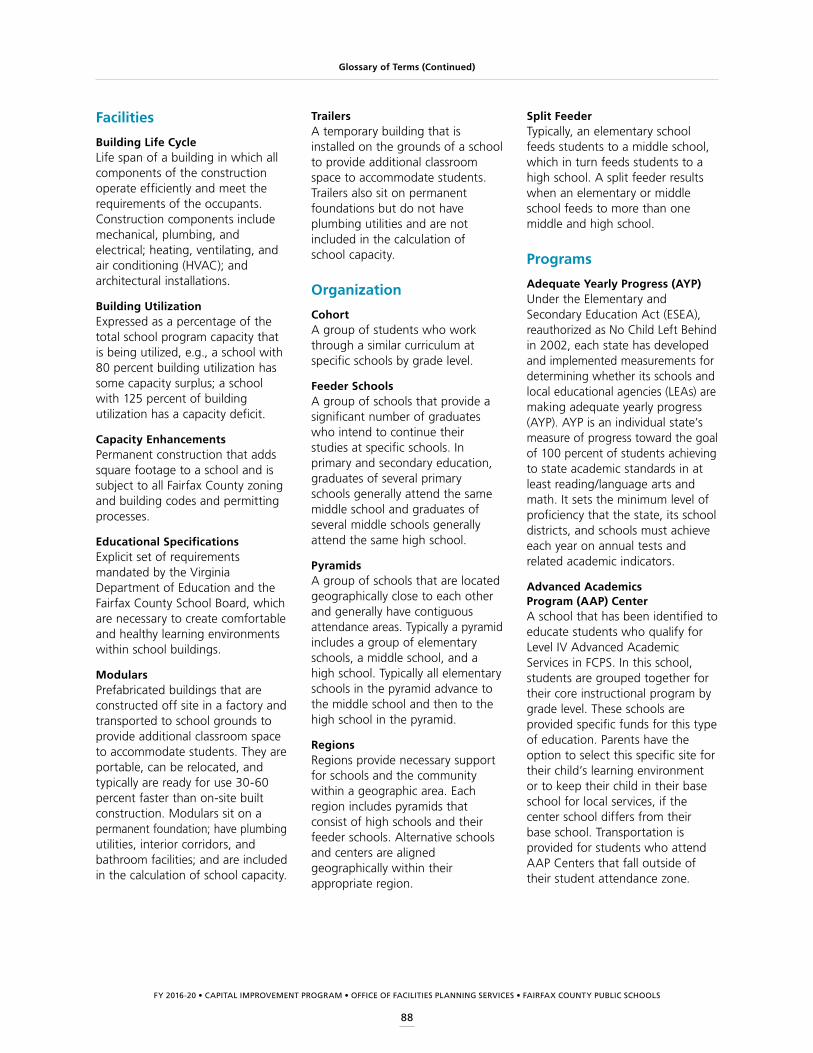
FY 2016-20 • CAPITAL IMPROVEMENT PROGRAM • OFFICE OF FACILITIES PLANNING SERVICES • FAIRFAX COUNTY PUBLIC SCHOOLS
88
Glossary of Terms (Continued)
Facilities
Building Life CycleLife span of a building in which all components of the construction operate efficiently and meet the requirements of the occupants. Construction components include mechanical, plumbing, and electrical; heating, ventilating, and air conditioning (HVAC); and architectural installations.
Building UtilizationExpressed as a percentage of the total school program capacity that is being utilized, e.g., a school with 80 percent building utilization has some capacity surplus; a school with 125 percent of building utilization has a capacity deficit.
Capacity EnhancementsPermanent construction that adds square footage to a school and is subject to all Fairfax County zoning and building codes and permitting processes.
Educational SpecificationsExplicit set of requirements mandated by the Virginia Department of Education and the Fairfax County School Board, which are necessary to create comfortable and healthy learning environments within school buildings.
ModularsPrefabricated buildings that are constructed off site in a factory and transported to school grounds to provide additional classroom space to accommodate students. They are portable, can be relocated, and typically are ready for use 30-60 percent faster than on-site built construction. Modulars sit on a permanent foundation; have plumbing utilities, interior corridors, and bathroom facilities; and are included in the calculation of school capacity.
TrailersA temporary building that is installed on the grounds of a school to provide additional classroom space to accommodate students. Trailers also sit on permanent foundations but do not have plumbing utilities and are not included in the calculation of school capacity.
Organization
CohortA group of students who work through a similar curriculum at specific schools by grade level.
Feeder SchoolsA group of schools that provide a significant number of graduates who intend to continue their studies at specific schools. In primary and secondary education, graduates of several primary schools generally attend the same middle school and graduates of several middle schools generally attend the same high school.
PyramidsA group of schools that are located geographically close to each other and generally have contiguous attendance areas. Typically a pyramid includes a group of elementary schools, a middle school, and a high school. Typically all elementary schools in the pyramid advance to the middle school and then to the high school in the pyramid.
RegionsRegions provide necessary support for schools and the community within a geographic area. Each region includes pyramids that consist of high schools and their feeder schools. Alternative schools and centers are aligned geographically within their appropriate region.
Split FeederTypically, an elementary school feeds students to a middle school, which in turn feeds students to a high school. A split feeder results when an elementary or middle school feeds to more than one middle and high school.
Programs
Adequate Yearly Progress (AYP)Under the Elementary and Secondary Education Act (ESEA), reauthorized as No Child Left Behind in 2002, each state has developed and implemented measurements for determining whether its schools and local educational agencies (LEAs) are making adequate yearly progress (AYP). AYP is an individual state’s measure of progress toward the goal of 100 percent of students achieving to state academic standards in at least reading/language arts and math. It sets the minimum level of proficiency that the state, its school districts, and schools must achieve each year on annual tests and related academic indicators.
Advanced Academics Program (AAP) CenterA school that has been identified to educate students who qualify for Level IV Advanced Academic Services in FCPS. In this school, students are grouped together for their core instructional program by grade level. These schools are provided specific funds for this type of education. Parents have the option to select this specific site for their child’s learning environment or to keep their child in their base school for local services, if the center school differs from their base school. Transportation is provided for students who attend AAP Centers that fall outside of their student attendance zone.
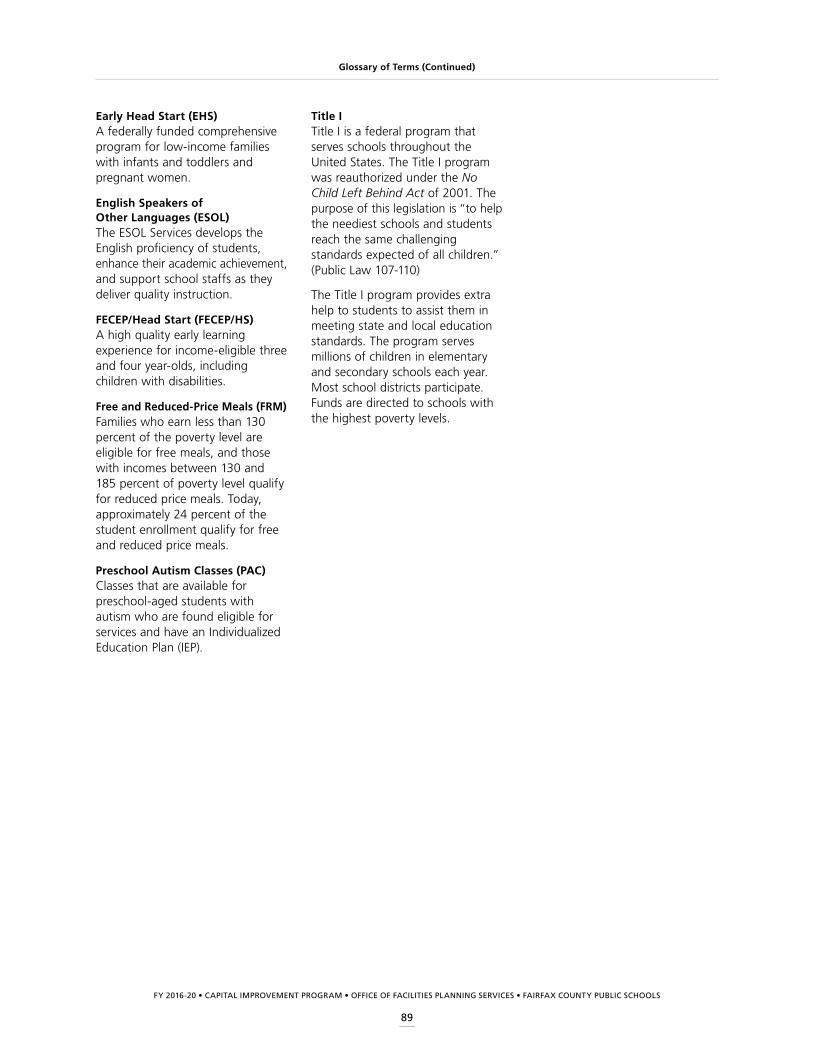
FY 2016-20 • CAPITAL IMPROVEMENT PROGRAM • OFFICE OF FACILITIES PLANNING SERVICES • FAIRFAX COUNTY PUBLIC SCHOOLS
89
Glossary of Terms (Continued)
Early Head Start (EHS)A federally funded comprehensive program for low-income families with infants and toddlers and pregnant women.
English Speakers of Other Languages (ESOL)The ESOL Services develops the English proficiency of students, enhance their academic achievement, and support school staffs as they deliver quality instruction.
FECEP/Head Start (FECEP/HS)A high quality early learning experience for income-eligible three and four year-olds, including children with disabilities.
Free and Reduced-Price Meals (FRM)Families who earn less than 130 percent of the poverty level are eligible for free meals, and those with incomes between 130 and 185 percent of poverty level qualify for reduced price meals. Today, approximately 24 percent of the student enrollment qualify for free and reduced price meals.
Preschool Autism Classes (PAC)Classes that are available for preschool-aged students with autism who are found eligible for services and have an Individualized Education Plan (IEP).
Title ITitle I is a federal program that serves schools throughout the United States. The Title I program was reauthorized under the No Child Left Behind Act of 2001. The purpose of this legislation is “to help the neediest schools and students reach the same challenging standards expected of all children.” (Public Law 107-110)
The Title I program provides extra help to students to assist them in meeting state and local education standards. The program serves millions of children in elementary and secondary schools each year. Most school districts participate. Funds are directed to schools with the highest poverty levels.

FY 2016-20 • CAPITAL IMPROVEMENT PROGRAM • OFFICE OF FACILITIES PLANNING SERVICES • FAIRFAX COUNTY PUBLIC SCHOOLS
90


Fairfax County Public Schools, Department of Facilities and Transportation ServicesOffice of Facilities Planning Services • 8115 Gatehouse Road, Falls Church, VA 22042