adoption of business intelligent dashboard and decision...
TRANSCRIPT

i
ADOPTION OF BUSINESS INTELLIGENT DASHBOARD AND DECISION
MAKING AT KENYA POWER
JANE WAKONYO NJUGUNA
D61/63070/2011
A RESEARCH PROPOSAL SUBMITTED IN PARTIAL FULFILLMENT
OF THE REQUIREMENTS FOR AWARD OF MASTER OF BUSINESS
ADMINISTRATION DEGREE, SCHOOL OF BUSINESS,
UNIVERSITY OF NAIROBI
NOVEMBER 2013

ii
DECLARATION
I Jane Wakonyo Njuguna, declare that this is my original work and has never been submitted by
anyone to any examination body for grading.
NAME: Jane Wakonyo Njuguna
REG NO: D61/63070/2011
SIGNATURE: ………………………..
DATE:………………………………….
This project has been submitted to the University of Nairobi with the approval of the project
supervisor.
SUPERVISOR: Dr K. Litondo
SIGNATURE:……………………………
DATE:……………………………………..

iii
DEDICATION
This thesis is dedicated to my parents, who taught me that the best kind of knowledge to have is
that which is learned for its own sake.To my husband for the support and encouragement though
out my studies To my brothers and sisters for their encouragement,prayers and support.To my
supervisor for sacrifice and dedication she made in terms of reviewing my work. Finally to our
Almighty Father for his guidance, Grace, Mercy and blessing.

iv
ACKNOWLEDGMENT
I would like to appreciate institutions, groups and individuals that immensely contributed to the
success of this research proposal for it were not for their contribution and support the study could
not have been successful.Special mention goes to university of Nairobi that offered an
opportunity for the course.
More thanks to my University supervisor Dr. Kate Litondo for her academic and professional
guidance throughout my research proposal period.
v
ABSTRACT
Kenya Power has been and continues to be on the front line in embracing ICT and investing
heavily in it to ensure that it meets it goals and objectives. Efficient internal process contribute
much towards the growth and success of any organization.As an organization grows,the amount
of data required in an organization also becomes massive.Collecting and analyzing vast quantities
of data can be a tedious process.Lack of availability of data in right form at the right time can
result in delayed decision making.
The main objective of the study was to examine the benefits of business intelligence
dashboard,challenges of BI dashboard system and performance implications of the new system in
Kenya Power. A descriptive survey was carried out with questionnaire being used togather
information. Staff from this Kenya Power filled in and returned the questionnaires Qualitative
data was received and analyzed using the computer programs and statistical programs.
The finding from the research show that BI dashboard system has had a major impact in the
company and it continues to influence the business processes in Kenya Power in a positive way,
although there are few serious challenges that need to be addressed.

vi
TABLE OF CONTENTS
DECLARATION ......................................................................................................................... ii
DEDICATION ............................................................................................................................ iii
ACKNOWLEDGMENT ............................................................................................................. iv
ABSTRACT ................................................................................................................................ v
TABLE OF CONTENTS ............................................................................................................ vi
LIST OF TABLES .................................................................................................................... viii
LIST OF FIGURES .................................................................................................................... ix
LIST OF ABBREVIATIONS....................................................................................................... x
CHAPTER ONE: INTRODUCTION ........................................................................................... 1
1.1 Background of the Study ........................................................................................................ 1
1.1.1 Business Intelligence Dashboard .....................................................................................1
1.1.2 Kenya Power ..................................................................................................................4
1.2 Statement of the Problem ....................................................................................................... 5
1.3 Objective of the Study ........................................................................................................... 6
1.4 Important of the Study ............................................................................................................ 7
CHAPTER TWO: LITERATURE REVIEW................................................................................ 8
2.0 INTRODUCTION .................................................................................................................. 8
2.1 ICT Adoption ......................................................................................................................... 8
2.2 ICT Adoption and challenges of implementing a new system ................................................. 9
2.3 Theoretical Framework ........................................................................................................ 10
2.4 Business Intelligence Dashboard System .............................................................................. 11
2.5 Benefits of the Business Intelligence System ........................................................................ 14
2.6 Challenges Facing the Business Intelligence Dashboard ....................................................... 15
2.7 The Conceptual Framework.................................................................................................. 16
CHAPTER THREE: RESEARCH METHODOLOGY ............................................................... 17
3.0 Introduction .......................................................................................................................... 17
3.1 Research Design ................................................................................................................... 17
3.2 Population ............................................................................................................................ 17
3.3 Sample Design ..................................................................................................................... 18

vii
3.4 Data Collection .................................................................................................................... 18
3.5 Data Analysis ....................................................................................................................... 18
CHAPTER FOUR: RESEARCH FINDING ............................................................................... 20
4.0 Introduction .......................................................................................................................... 20
4.1 Data Analysis ....................................................................................................................... 20
4.2 General information ............................................................................................................. 20
4.2.1 Age of respondents ....................................................................................................... 20
4.2.2 Gender .......................................................................................................................... 21
4.2.3 Education level of the respondents .............................................................................. 21
4.2.4 Organization Status ....................................................................................................... 21
4.3 Factors affecting adoption of BI Dashboard system. ............................................................ 23
4 .4 Benefits of Dashboard ......................................................................................................... 23
4 .5 Challenges of BI Dashboard System. ................................................................................... 26
4.6 Decision making process ...................................................................................................... 28
4.6.1 Decision making process improved by use of BI dashboard. ......................................... 29
4.6.2 Objectives of Dashboard been accomplished by use of BI dashboard. ........................... 29
4.7 Regression Analysis ......................................................................................................... 29
CHAPTER FIVE: SUMMARY, CONCLUSION AND RECOMMENDATIONS ..................... 32
5.0 Introduction .......................................................................................................................... 32
5.1 Summary .............................................................................................................................. 32
5.1.1 Conclusion .................................................................................................................... 32
5.1.2 Recommendations ......................................................................................................... 33
5.1.3 Limitations.................................................................................................................... 34
5.1.4 Recommendation for further research............................................................................ 34
REFERENCES .......................................................................................................................... 36
APPENDIX 1............................................................................................................................. 38
QUESTIONNAIRE ............................................................................................................... 38
APPENDIX 2: SCHEDULE AND BUDGET ............................................................................. 41

viii
LIST OF TABLES
Table 3.1 : Population and Samples …………………………………………………….…17 Table 4.1 : Age………………………………………….……………………………….…21 Table 4.2 : Gender……………………………………………………………………….…21 Table 4.3 : Organization…………………………………………..…………………….…22 Table 4.4 : Integration of BI sysytem with the existing system…………………..……..…22 Table 4.5 : Effect of BI dashboard adoption …………………………………………....…23 Table 4.6 : Benefits of Dashboard……………………………………………………….…23 Table 4.7 : Challenges of BI Dashboard system……………………………………..…….26 Table 4.8 : Decision making process…………………………………………………….…28 Table 4.9 : Decision making process…………………………………………………….…28 Table 4.10 : Objactives of dashboard have been accomplished……………………….….…29 Table 4.11 : Regression model summary……………………………………………………29 Table 4.12 : Annova test……………………………………………………………….….…30 Table 4.13 : Coefficients………………………………..………………………………..….31

ix
LIST OF FIGURES
Fig 1. Components of a Data Warehouse adopted from Kreonke, (2006)……………………….12 Fig 2. Adopted BI Process Loshin, 2003………………………………………………………….13 Fig 3. Conceptual Framework (as cited by Ford and Richardson 1994)………………………….16 Fig 4. Benefits of Dashboard……………………………………………………………………...24 Fig 5. Challenges of BI Dashboard system……………………………………………………….26 Fig 6. Decision making process………………………………………………………...……..….28
x
LIST OF ABBREVIATIONS
BI : Business Intelligence
ICT : Information Communication Technology
KPLC: Kenya Power and Lighting Company
GDP : Gross Domestic Product
TAM : Technology Acceptance Model
CEO : Chief Executive Officer
KPI : Key Performance Indicators
IT : Information Technology
IS : Information Systems
ETL : Extraction, Transformation and loading
PU : Perceived Usefulness
PEOU : Perceived Ease of Use
1
CHAPTER ONE: INTRODUCTION
1.1 Background of the Study
The flow of the information within the organization determines the success of the organization
Davenport; Prusak,( 1998). Organizations struggle to collect data and retrieve information for
making crucial decisions.The large quantities of data collected is very helpful for operations
within organizations, but hardly compliant for use in decision making about business strategies
and objectives Davenport ; Prusak, (1998).Decisions in organizations are made by human beings
and not the system hence presentation of data plays a very important role in any decision making
process Malik (2005).
The use of different systems in marketing, finance, customer service, design and construction,
store, etc have made the decision making process easy to a certain extent but cannot be effectively
used for overall decision making. Another problem is existence of operational data which is
readily available but cannot quickly be used to spot trends in the organization. For proper decision
making on overall organization strategies and objectives, the organization has to integrate
information from all the systems in various departments. This is because managers should be in a
position to review new customer connection per branch, per region and the overall connection
Malik (2005).Due to the wide spread of data in different incompatible format and structures the
use of dashboard becomes useful.
1.1.1 Business Intelligence Dashboard
A business intelligence (BI) dashboard is a data visualization tool that displays the current status
of metrics and key performance indicators (KPIs) for an enterprise. Dashboards consolidate and
arrange numbers, metrics and sometimes performance scorecards on a single screen. They may be
tailored for a specific role and display metrics targeted for a single point of view or department.
The essential features of a BI dashboard product include a customizable interface and the ability
to pull real-time data from multiple sources.Stacey Barr,(2010).
Business intelligence(BI)is the process of taking large amounts of data, analyzing that data, and
presenting in a high level set of reports that condense the essence of that data into the basis of
business actions, enabling management to make fundamental daily business decisions Stackowiak
et al (2007). BI as way and method of improving business performance by providing powerful
assists for executive decision maker to enable them to have actionable information at hand Cui et
2
al, (2007). BI tools are seen as technology that enables the efficiency of business operation by
providing an increased value to the enterprise information and hence the way this information is
utilized.
In business, dashboards are the emerging new face of business intelligence. Dashboard helps an
organization to consolidate information about the strength of a business, department, branches,
and individual, in a graphical format that is concise and easy to read. Dashboard comes with
different colors and shape, it contain names like performance dashboard, executive dashboard,
balanced score card, KPL metric summary or corporate dashboard. The goal will showcase the
fact in a way that empowers the user to make a more intelligent decision based on better
information Lamantia (2011).
Dashboard can be individualized, that is be specific to one person and focus on the individual
pieces of data that their need to do their job Kianoff (2010).Dashboards are interactive, easier to
set up and update to changing business needs, and much more flexible to use. This, plus their
ability to present data and information at both a summary and detailed level, makes them one of
the most powerful tools in the business user’s kit. Dashboard should be implemented so that it
gets used and so that the decision makers employing it can act on the information the Dashboard
presents. Data that becomes information in concepts is a powerful force to align people in terms
of what you want to achieve, keep track of what the organization is performing and how you can
collect the bad trends in an organization. BI is required to encompass analytics as well as the
processes and technologies used for collecting managing and reporting decision oriented data and
information Davenport; Harris (2007). BI as the act of capturing raw data then transforming and
combining that data into information that can be proactively be used to improve an organization
Steadman (2003).
Intelligence is explained as the actionable information about customers, competition, market
situation or any other factor in the external environment. Using the right analysis techniques and
interpretation information can be turned into actionable intelligence Sawka (1996). Business
intelligence supports defining of the fundamental direction of the organization by analyzing and
reporting data Kroenke (2006). BI applications running on large databases might cause difficulties
while reading directly from the operational database and it can cause slowing down of the

3
application, errors might occur due to missing or wrong format of data. This call for a different
database that will be an extraction from the operational database used in preparation for the BI
this leads to the introduction of data warehousing that is done in three steps that is the extraction,
transformation and loading ETL Kroenke (2006).Extraction program will be used to retrieve data
from a variety of heterogeneous operational databases, transformation of the data that is needed
for providing the inconsistency of all data in the data warehouse. The process of extraction,
transformation and loading is important for the BI processes as they are used to link to the source
data Kroenke (2006).The use of the data warehouse can only be beneficial to the computer literate
users. The main problem that the organization faces is decision making while navigating though
the huge data warehouse and correlating the information. For this to happen, the organization has
to depend on the IT specialists to give the information price (2006).
BI dashboard will solve this problem by consolidating and making information available on a
single screen. BI dashboard enables business users to have complete control over how they
manage the data while at the same time IT can be involved in technology integration, maintenance
and support. This will results in faster and better decisions price(2006) the quality of decision
made depend on the quality of data. Data from dashboard comes from multiple source including
data warehouse, spreadsheet, internal application and stand alone application (Farcot, Kades).
According to Hurwitz;associates, (2005), organizations that depend on the data ware and
standalone database meet less than 50 percent of the business requirement and most companies
that incorporate data warehouse and the external application to the database achieve better results.
About 95 percent of the IT executive’s surveys have recommended dashboard as a tool to offer
consistency, reliability and accuracy important for decision making capability Hurwitz (2005)
Dashboards help organizations make better business decisions. The way in which they are created
is not trivial and attention must be paid to the details. Employing visual design standards and
principles are important, but are only part of the journey it requires proper planning to address
what users need to see, where the data is coming from, how soon it can be delivered, and ensuring
that it is accurate and consistent. O Velcu-Laitinen (2012). Lack of a clear and focused vision
regarding which metrics such as Key Performance Indicators (KPIs) are important enough to be
displayed in the dashboard, which means users ultimately do not find the dashboard useful from a

4
practical standpoint Valerie Logan.The problems associated with accessing, transforming,
aggregating, and delivering data from transactional databases, multiple sources or non structured
sources often result in incomplete or inaccurate dashboard metrics John Kitchen. Lack of collect
and timely information can be a pitfall for dashboards Ken Kaufman June 14, (2010).
1.1.2 Kenya Power
Kenya Power is a limited liability company which transmits, distributes and retails electricity to
customers throughout Kenya. Kenya Power is a public company and is listed at the Nairobi Stock
Exchange (NSE). Kenya Power was incorporated in 1922 as East Africa Power And Lighting
Company (EAP&L) and was later rename Kenya Power &Lighting Company Ltd in 1983 after
the dissolution of the East African community. During the Re branding exercise done recently the
name changed to Kenya Power. Kenya Power has been and continues to be on the front line in
embracing ICT and investing heavily in IT to ensure that it meets its goals and objectives of
providing first class world power that delights its customers. ICT innovations have helped the
company greatly in its endeavor to reduce cost and increase efficiency. Kenya power has 58
branches and eleven divisions that use different systems to perform their duties. This has lead to
massive increase in data thus becoming difficult for the executive to go through all the data to
make quick decisions and be able to monitor the changing trend in the organization. Due to these
factors Kenya Power has opted to the implementation the business intelligence dashboard system
to help the executive make use of the growing data for easy analysis and quick decision making.
Dashboard have triggered the whole organization to start thinking and living a performance
culture.BI Dashboard has helped Kenya power to Create awareness of business driver and
progress towards set goals though the mission analysis readership meeting (MSR). Matters arising
are opened up to the core and the teams seeking lasting solutions together. Alignment
accountability top down, across functions and roles through the mission analysis alignment
process are achieved. This has led to team work positively and interdependences becoming
clearer. Due to mission planning operational level in the regions has released tangible gains and
this has led to empowerment of teams to move fast and focus on the right thing. Reporting and
data mining are the main components of BI operational business application such us customer
information, meter information, new connection, power interruptions and payment of electricity
bills read from and write data to the operational database. Adding of customer details in the

5
database does not need high level decisions to achieve. Management in the tactical and strategic
level makes use of the BI application to improve the decision making Kroenke(2006). Kenya
Power is motivated by strategic and economic growth for it to opt for the introduction of the
business intelligence dashboard for easy and quick decision making. Due to availability massive
data which cannot be easily accessed and quickly analyzed during decision making, the use of
different systems which are in different platforms and formats has lead Kenya Power management
to be faced with a problem of determining the performance of each branch and identifying the
trends in the market.
1.2 Statement of the Problem Implementation of new innovations has become an important part of doing business in order to
take advantage of the new and improved way of doing things and bring about required change in
order to remain competitive in the market. The implementation of new innovation will only be
successful if it has been accepted and gets the approval of entire organization Dawson
(1994).Change can sometimes cause a lot of upheaval and stress. In situations where an ICT
Innovation is to be implemented, an overhaul of how processes are undertaken and a staff
restructuring maybe required. This may affect all the dynamics of the organization.
Implementation of any new innovation has a percentage risk of failure Lau Kuang (1998). The
change in technology will change the socio-cultural and technical dimensions of the organization
Lau don Lau don( 1998).
Business intelligence dashboard is one such innovation however no known study to the researcher
has so far been done to evaluate the system at Kenya Power. Studies that have been done on the
use of ICT at Kenya power include: A study to investigate the effects of the perceived ICT service
quality and its effects on customer satisfaction at the Kenya Power and Lighting Company
(KPLC), which is now Kenya power done by Audit Report No. 6/(2005- 6), on Customer creation
Nairobi. This implies that increase in the ICT service delivery lead to improvement of customer
satisfaction. To enhance customer satisfaction, there is need to increase ICT service delivery at
KPLC. The study was done to determine use of an appropriate ICT which will be of great value
because it will help the KPLC to improve their services and also the ICT service providers to re
evaluate the suitability of their ICT systems to users. The study recommended that KPLC to put

6
more emphasis on perceived service quality in order to enhance customer satisfaction.The study is
related to the study as it show the impotance of ICT to the success of the organisation.
Study done by Antti Pasanen (2009) on factors influencing implementation of ICT system in
energy sector, the study focused on KPLC and Ken gen. Implementation of ICT results to a major
change for the organization Antti Pasanen (2009). The findings of the study serve to provide
insights into why some of the ICT projects succeed and others fail Pasanen A (2009).The study
sought to determine the major factors that influence the implementation of ICT projects in the
Kenya's energy sector Parastatol in Nairobi factors cited that should have been included in the
implementation of ICT projects in The Energy State parastatals based on the opinion of the
respondent included, inadequate training,skills of the implementers, expert consultant’s selection
and post implementation of reviews support. Similarly the perceived lack of confidence in the
workability of the technology, saboteurs of the project development process and external natural
disasters were factor cited affecting the success of ICT project implementation. This study shows
that ICT innovation is continuously being adopted in Kenya. Many companies like Kenya Power
have adopted new innovation in order to improve their business processes. BI dashboard system
is one such innovation.The study is trying to answer the following two main questions, firstly has
KenyaPower met it intended goals of improving the decision making in kenya power? Secondly
to what extent has Kenya power adopted BI Dashboard system?
1.3 Objective of the Study The general objective of the study is to evaluate the BI dashboard at Kenya Power specifically to:
Determine extent to which Kenya power has adopted BI Dashboard system.
Determine the effect of Business Intelligence dashboard system for decision making in Kenya
Power.
Determine the benefits of adoption of Business Intelligence Dashboard system in Kenya Power.
Establish challenges of Business Intelligence Dashboard system adoption at Kenya Power.

7
1.4 Important of the Study Dashboard provides an interface that aids managers and executives in getting data immediately
from various divisions and branches, in a similar format and makes it more accessible. Due to the
application ease of use and availability of different capabilities like customization, graphs
presentation and color display. This will help facilitate the decision making process. Owing to
these findings Kenya Power can guide the entire energy sectors in Kenya in adopting the BI
systems for easy decision making. The study will be useful as a reference point for future
implementation of other ICT systems in Kenya power.This study is the first of its kind in Kenya.
There are no studies that have investigated use of business intelligence in Kenya Power. The
findings will therefore advance knowledge on the benefits, challenges of BI for decision making.
The study can be used by researchers, academicians, and students to advance further research on
the topic.

8
CHAPTER TWO: LITERATURE REVIEW
2.0 INTRODUCTION The literature review surveys past studies that have been done on Business Intelligence
Dashboard and established the theoretical foundations of the issues to be investigated by the
study. The literature review mainly captures the theoretical framework surrounding the concept,
concept of business intelligence dashboard system, implementing a BI dashboard system, and
critical review of the benefits and challenges affecting the adoption of BI dashboard system.
2.1 ICT Adoption ICT is the Information and Communication Technology network. ICT is today used to carry
information at phenomenal speeds Wong(2001). Operation of an organization and Society in
recent years has been based on the use of computers and technology.Computers and technology
has become fundamental to most function Kroeker;Yonck (2010).The use of these great speeds
has enabled people to transfer massive quantities of data in a very short time hence encouraging
advancement in a number of ways. These advancements in information transfer through use of
computers will increase communication and transactions within business cycles and this has
helped eliminate regional boundaries Jalava; Pohjola, (2001). The use of ICT in many diverse
sectors of the society has lead to growth of production and revenue Basu; Ferald (2008). The
increase of this infiltration of ICT in the business world has further been enabled by the internet
Chinn ;Fairlie (2007).
Studies show that ICT has brought significant change and has impacted the world in a number of
ways, i.e. poverty alleviation, economic productivity and sustainable development
Madon,(2000),Pur(2007),Walsham(2001). The cost of doing business has been reduced by ICT in
the international and transnational arena Rangan ,Sengul, (2009). While the use of computers and
their connections is necessary for socio-economic development, Hinson and Sorensen, (2006) a
more comprehensive or inclusive use of ICT have been necessary in most parts of the world Price
(2006). The reason being more than just for development issues, ICT has also enabled
multinational corporations to transfer knowledge with greater ease Rangan ; Sengu(2009). This
ease in communication has contributed to increased GDP growth Altig ; Rupert (1999). This has

9
also been seen as the ability to multitask Aral;Brynjoltsson; Van Alstyne(2006). Organizations
can be reshaped and reformulated internally, as well as reorganized the interrelations within the
companies and also with other organization in the same network Burt ; Taylor( 2000).Corporation
can use networks to disseminate information and convey important management information
Castells(1996);Quinn(1992). The ability to reformat information, calculate, store, retrieve
essential data is also enabled by ICT Mcloughlin (1999). ICT is being used in all sectors of the
economy including the non profit organization Burt; Taylor(2006) this utilization of ICT was
displayed in the 2008 US presidential campaign Cardoso; Cunha;Nascimento (2004).
2.2 ICT Adoption and challenges of implementing a new system Information System implementation in an organization can be unsuccessful if the process is not
approached properly Lyytinen ; Hirschheim (1987). Implementation of a system is the sum total
of activities that are required to make a new technology operational and assist in its smooth
adoption Laudon;Laudon(1988). Changes are inevitable while implementation of new ICT
systems Davis ; Olson (1985). This results to a complete change in the staffing structures in some
organizations Robey (1996),Eason(1988),Sahay.Resistance to change has been experienced in
some cases and this has led to problems in the implementation process of a new innovation.
Innovations in organization can be rejected or lead to job related stress (Lorenzi ; Riley(2003).
There are factors to consider when determining the success or failure of a IS innovation (Lucas
1981).
There are some issues that come up to prevent successful implementation. Issues like company’s
internal socio-cultural dynamics, the interrelationship of the members of the organization and how
receptive they are to the new innovation form part of the concerns. The lack of proper information
flow or communication leads to prevention of successful implementation because some people
may not appreciate the new innovation. The implementation process should be undertaken as a
team effort in order to create ownership of the new innovation, lack of this leads to failure. The
key stakeholders of the new innovation should be involved in the whole process so they can give
their input, exclusion can lead to implementation problems. Managerial inadequacies or
incapability have been shown to lead to new innovation failure. Resistance to change is another

10
key factor leading to failure of implementation of new systems. Lack of ownership of the new
system has led to the system being ignored or rejected completely Davies (2002).
It is therefore necessary that the above obstacles and pre-existing conditions are clearly
understood, this will go a long way in overcoming them Bodtker, Jameson (2001). In addition to
this, the state of mind of the participants should be understood and taken into consideration in
order to overcome these obstacles Barki,Hartwick (2001). There should be a discussion to analyze
managerial and interpersonal conflicts that can affect the result of the project. There are five
models that help to combat such conflicts. They are asserting, compromise, accommodating,
avoiding and problem solving. They help in working through the social dynamics that can be
there in system development Newman, Robey (1992). The causes of stress should be identified in
order to resolve problems that come up when dealing with the participants Mumford (2003). It is
useless working on the conflicts without first getting to know what could be the root cause. If
proper information is lacking at the very start it will hinder any progress in solving the conflicts
Ljungström , Klefsjö (2002). In order for the organization to achieve ultimate goal of self
improvement, barriers that can stop the new system processes and change in the way jobs are
undertaken must be identified and removed Ciborra , Andreu (2001).
2.3 Theoretical Framework There are various theories in IT/IS. However, only one is applicable to the concept of business
intelligence dashboard under study. The Technology Acceptance Model (TAM) is an information
systems (IS) theory adapted from the Theory of Reasoned Action (TRA).The Theory of
Acceptance Model (TAM) is one of the most widely applied Information Systems (IS) theories
that is grounded in the psychological theory, the Theory of Reasoned Action, which explains the
users’ intention to perform a behavior Davis et al., (1989). Davis, (1996) TAM is the users’
behavioral intention to use an IT. The behavioral intention is influenced by Perceived Usefulness
(PU), the degree to which users using a system believe that it would improve their performance,
and Perceived Ease of Use (PEOU), the degree to which users of a system perceive it to be
effortless. PEOU influences PU. Some researchers argue that the influence of PEOU on
behavioral intention is task related and have suggested careful task specifications as additions to
TAM
11
As a result, there are numerous expansions to TAM that can be investigated. For example, the role
of individual characteristics that influence cognition, such as affect, computer playfulness and
personal willingness to try out a new IS Djamasbi et al (2010).There is evidence that affect is a
necessary component of rational decision making Damasio, (1994), Slovic et al.,(2007). Affect
helps individuals to eliminate the alternative solutions that don’t feel right, so that it remains a
manageable subset of possible solutions. Therefore, a rational decision maker goes through a
combined sequence of cognitive and affective processes. However, other studies showed the
independence of affect from cognition, indicating that there may be situations of affective
stimulus that do not require cognitive appraisal Slovic et al., (2007). Affect is defined as an
individual’s moods and emotions George,(1989).Unlike volatile emotions; moods are more
pervasive and enduring. These characteristics make moods more suitable affective framework for
studying cognitive processes in organizational context, such is the use of IS innovations. There
are different mood categories, such as positive, neutral and negative.
The theory show how positive mood theory has effects on positive mood on use of dashboards.
According to this theory, being in a positive mood influences how the thoughts are organized and
accessed. Being in a positive mood, it enables decision makers to be more flexible in their
cognitive process PU and PEOU and may be more inclined to use decision support systems to
make informative decisions. The study will use the TAM theory this is because of its ability to
explain how Personality traits as an effect on use of technology hence the acceptance of the
system of technology.
2.4 Business Intelligence Dashboard System As company gain a strong global presence, information utilized by different groups of people that
included stakeholders, managers, customers and several others. Executives and managers spend a
large amount of time scanning for information and making decisions Vedder, Vanecek, Guynes,
& Cappel, (1999). There are several variables involved that affect the human decision making
process. Some of the variables that significantly influence the decisions made by humans are race,
religion, personality, age and education Ford,Richardson, (1994).Depending upon the area of
work, decisions made by managers may vary. This led to the evolution of the data centralization
phase Hoffmann, (2007).Data warehouses and data marts first appeared to provide a centralized

12
system for accessing data and making tactical decisions. The main goal of a business intelligence
system is to support the decision making process.
Fig 1. Components of a Data Warehouse adopted from Kroenke, (2006)
A B C D
The above diagram explain the process of BI dashboard system. Component A explain the
different source of data from the different systems used in kenya power,B explain the collection
point where all the data is stored.Data in the warehouse is of different format that calls for data
mining where the use of Analysis tools is applied,after the analysis data is displayed in a format
that a busy manager can analyse and help to alignment the KPI of the organisation.
Increasing globalization and rapid decentralization of organisations have created the need to
recognize market trends and collect information about competitors Hsu,Jeffrey (2004). This
allows the company to swiftly react to change in market conditions due internet age. Efficient
information processing is a decisive factor in maintaining an advantage over the competitors. Due
to continuous innovations in data processing, more and more information is stored in a more
detailed format. As a result there is a need to both reduce and structures this data so it can be
analyzed meaningfully Vedder, Vanecek, Guynes, , Cappel.
Operational
Databases
Other Internal data
External Data
Data warehouse
(All data is
collected here)
Business intelligence
tool (Data mining)
Business intelligence
Dashboard
(Decision making)

13
Decision makers in modern, globally operating enterprises frequently realized that their survival
needs on the effectiveness use of the information Miller, Thomas D. Queisser,(2009).
Unfortunately the information is often spread across many systems and sometime many countries,
thus making effective use of the information is extremely difficult. This is the challenge that a
modern BI is trying to address P Suchánek,(2010). Extensive solutions are required to cover the
entire process, from retrieval of the source data to its analysis. Organisations are concerned with
the Meta data across the organisation M Soderlund, (1990). In addition, there is a need to
consolidate and create homogenous global master data, as well as massive amount of transaction
data in differing degree of aggregation KX Gou, (2007). In a heterogeneous system landscape, the
challenge lies in the extraction and preparation of consolidated transaction data and master data
from different source systems. The increasing demand for high quality business information
means that in addition to integrated data collection process, detailed data analysis and multimedia
presentation options are required J.E. Boritz, (2007).BI relies on data that comes from the source
systems, but this information cannot be easily used for targeted analysis. This means that data
must first be homogenized Bannan , Karen, (2005).The data is then stored in a data warehouse
component of the BI. Analyzing this information require a strong and flexible reporting tools that
helps to better understanding the organisation information and create knowledge. The knowledge
helps the organisation to define /redefine its business strategy and support the business processes
derived from it Steve Williams and Nancy Williams.
Fig 2. Adopted BI Process Loshin, 2003).
Level of abstraction
Size of data
Knowledge and
Intelligence
Information
Data

14
2.5 Benefits of the Business Intelligence System BI helps in business analysis in that it provides the information that management needs to make
sound business decisions, increase company net revenue and decrease of the operating margins
Gou KX (2007). These is achieved by lowering of customer service which the BI aids at
identifying causes of customer reward programs and identifying causes of customer loss through
data analysis. Analysis of markets products and customer demographics data enable more
sufficient application of target market programs Eckerson (2006). BI system support the increases
in market share by enabling better understanding and execution of the business plan to enable
increase on sales. Better operational efficiencies though better understanding of the operational
data Chaudhuri , Dayal (1997).Adaptation of business intelligence provide end to end solutions,
in that it provide a seamless process that translates vision into action for teams and individuals
Hurwitz (2005).
Managing strategic risk is one of the most challenging aspects of an organization. Identifying and
mitigating risk from a portfolio perspective is complicated and often resource intensive. As a
result, companies have opted to use of dashboard to provide a useful way to view data and
information.The outcome display includes single metric, graphical trend analysis, capacity
gauges, geographical maps, percentage share, Stoplights and variance comparisons. Dashboard
design allows presentation of complex relationships and performance metrics in a format that is
easily understandable and digestible by time pressured managers Ballou,Heitger,Laura Donnell.
Collaboration and information sharing become easy this is due to the commenting feature for
indicators that enables quick communication Chowdhary P. The alerting feature of the Dashboard
makes it easy for business users to monitor the key performance areas and to be proactively
notified of conditions that require follow up Pauwels K (2008). Data can be viewed in multiple
ways without rebuilding the dashboard this is provided by the interactions and prompts features
that provide the support K Pauwels (2008). Completion of task can be achieved with minimum
number of click, if one needs more information the user can prompt selections in Dashboards to
provide additional information that enables users to decide which item to click in the user
interface before they actually click. This information includes KPI gauges and range colors that
appear for each selection M Elias (2011).Dashboards can display key performance indicators in
one place to help users monitor information throughout an enterprise Dolan JG (2013).

15
Coordinating the look and feel of your dashboard and indicators is easier than ever Ryan
Goodman.
Though dashboard the executive are enable to outline a clear vision, purposes and values of the
whole company that is tricked down to the most junior staff in the company. Through the
implementation of dashboard, CEO objectives and the KPIs set by the board then cascaded to the
organization which leads to the alignment with those of the regions, functions and individual’s
objectives and KPIs. Individual performance planning and development is possible though the
performance reviews conducted by managers which include values, development plans, careers
aspirations, career and success Njoroge, (2012).Dashboards enable talents reviews, by panels
which both rate and calibrate individual performance and potentials. Successions plan can be
established and the key roles for each individual. Action plans is easy to establish and addressing
of the talent gaps, this function help the human resource identify the gaps and enable the
department to coming up with the best candidate suited without going through a demanding
exercise. Dashboard will help the company in agreement on the key measures of success and
enable tracking of the business progress and trends.
(http://www.kplc.co.ke).
2.6 Challenges Facing the Business Intelligence Dashboard Technical skills and training can be limited. The majority decision makers are not power users.
Redesigning and streamlining functionality over different sets of tools to make the features more
obvious is neither cost effective nor an efficient use of skilled IT resources Wind (2005). Pauwels
et al (2009). The degree of needed interaction can vary. Because the roles and the skills of
decision makers can cover such a wide range, some are comfortable using and working with BI
tools independently, while others require significantly more initial and on-going support Debus et
al (2003) (Pauwels et al (2009)
Getting BI in the hands of all users is difficult there are concerns over whether current BI tools
could be tailored to meet the needs of all the different types of users and divisions Information
overload Cleverley (2001), DeBusk , Brown, & Killough (2003). Too much information can make
the dashboard look cluttered and can easily distract the users and the Complex user interface
Collier, Marini & Minsker (2008). Dashboards are generally meant for executives and managers
who normally have no time to learn a new Technology Eshraghi (2008). Security is also an

16
essential element while implementing a dashboard. Viewers target and role based security should
be provided to ensure data integrity Kaplan , Norton (1992).
2.7 The Conceptual Framework To clarify the concept of the fundamental effects of business intelligence dashboard
implementation in Kenya Power, it is essential to understand the conceptual framework, show the
interplay between the independent variables and the dependent variables Eckerson, (2006).The
independent variable is a property of an observable fact, which in turn affects others i.e. the
dependent variables Mugendi, (2003).
Fig 3. Conceptual Framework (as cited by Ford and Richardson 1994)
Independent variables Dependent variables
The independent variables which are the challenges of Dashboard have a effect on dependent
variable that is the decision making process and the personal characters can contribute or affect
the decision making process.
Complex user interface
Information overload
Availability of the system
Data accurancy
Decision making as a result of BI
Dashboard.
Personal characteristics
Age
Education
Gender

17
CHAPTER THREE: RESEARCH METHODOLOGY
3.0 Introduction This chapter will detail how the research will be undertaken. Research design consists of the
master plan that lays out the set of decision which details the methodology of the collection and
analysis of data Mathooko (2007).
3.1 Research Design A descriptive research design will be used. This implies that the study will be descriptive in
nature. The data will be collected from the members or the population but use of the survey
research to describe existing phenomena through interviews on the individual’s attitude, behavior,
perception and firsthand experience. The quantitative data will be utilized for this study. The
status of various variables will be examined. The reliability of the data from this type of
population will be more reliable Mugenda and Mugenda,( 2003). This descriptive research will
help bring out a more accurate, reliable and increase validity of the systematic description of BI
dashboard in Kenya Power.
3.2 Population
Table 3.1: Population and Samples
The population being targeted is the Nairobi region branches in Kenya Power. The branches are
headed by business branch heads. The branches in Nairobi are Nairobi south, Nairobi west
Strata
Strata size Proportion % Sample size
Manager 3 1% 1
Engineer / Technician 140 42% 15
Customer service/relation officer 100 30% 15
Clerks /accountants 50 15% 10
Other officers 42 12% 9
Total 335 100% 50

18
Nairobi north; the branches have different division that is marketing, Transmission, Distribution,
Customer Relation, store, Finance, and Security. The branches consist of chief manager, chief
Engineer for each division, Engineers, Technicians and Clerks. The target population will be 335
officers. This are the staff direct involved in the new system.
3.3 Sample Design The researcher will be interested in Nairobi owing the fact that BI dashboard have only been
implemented in the major branches in Kenya the study will focus on Nairobi due to the logistical
and financial constraints. The sampling method will be the stratified random sampling. A sample
of 50 staff members will be used that is 15% of the target population.
3.4 Data Collection The instrument of data collection will be semi structured questionnaires. The self completing, five
stage questionnaire will be used to address the research objectives. Ther first section will be about
personal details of the respondents,second section will be about effect of BI Dashboard ,third will
be benefits of the BI Dashboard,fouth one will be on the challenges of Dashboard and the fiveth
will be on the decision making process.The respondents are staff members from Nairobi region
who use the system and make decisions using the system.
3.5 Data Analysis Data to be collected will be analyzed for both descriptive and inferential statistics. The choice of
descriptive statistics will be necessary for systematic summarizing of all the data to be collected
and be represented using statistical measures such as central tendency, tables and graphs. SPSS
software will be used to compute descriptive statistics for all the questions under investigation
and inferential statistics will be used to determine the benefits and challenges affecting the
adoption of BI Dashboard for decision making, with specific reference to Kenya Power.
To determine the relationship between adoptions, personal characteristics and determinants of
decision making process a simple regression model will be used. The following regression model
will be used to determine the effect of BI dashboard on decision making at Kenya power.

19
Y=a1+a2 x2+a3x3+e
variable for:
Y= Decision making
X2 = Business intelligent dashboard
X3= Personal characteristic e = error

20
CHAPTER FOUR: RESEARCH FINDING
4.0 Introduction This chapter discusses data analysis process, presents results, discusses the findings of adoption of
business intellegence system at Kenya Power. The research also establishes effects of adoption of
business intellegence system, discusses benefits of adpotion of the system, challenges facing
adpotion of business intelligence dashboard system and closes with an examination of the
decision making process.
4.1 Data Analysis All questionnaires were administered, completed and collected for analysis. Completed
questionnaires were entered into an SPSS data frame for processing. Analysis was done by
determining the descriptive statistics in terms of frequency and percentages. With regard to the
individual characteristics of the respondents such as age, gender, marital status, level of
education, employment status and job position. Using SPSS, computations for the responses to
the adoption, benefits, challenges and decision making process were also computed. The findings
are presented in the form of frequency tables, pie charts and graphs.
4.1 Background Information
Through a follow-up strategy involving telephone calls, reminder e-mails and texts, over a 14 day
period, the researcher succeeded in obtaining responses from all the respondents sampled. The
response rate was 100% and all questionnaires administered were collected and processed. To
establish the personal characteristics of the respondents; age, gender, level of education,
organization status, dashboard adoption, benefits of dashboard, challenges of dashboard and
decision making process were surveyed.
4.2 General information
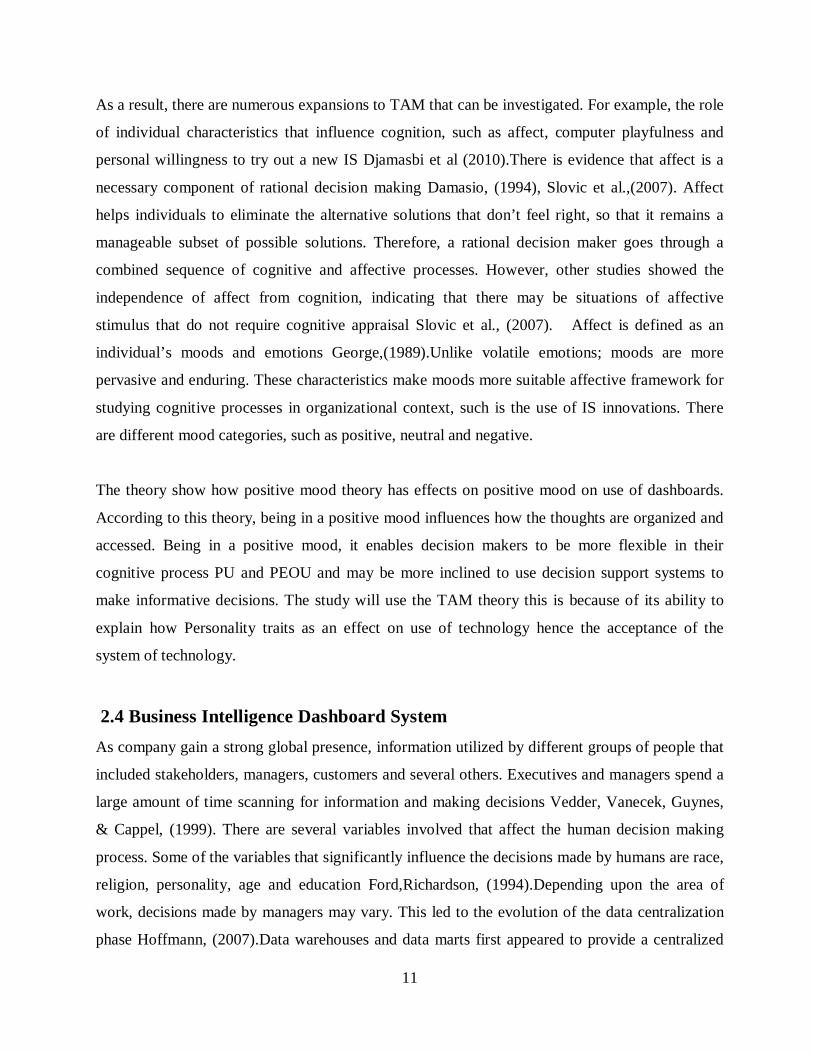
4.2.1 Age of respondents With regard to age, results indicate that a majority of the respondents were over 40 years. The age
bracket; 36-40 years accounted for 30% of the sample population and 16% of the employees were
21
31-35 years. Only 12% of the respondents were below 30 years old. Kenya Power being a public
institution, it is evidence that it takes time to grow to the management level.
Table 4.1: Age
4.2.2 Gender Out of 50 respondents, 30 were men who represented 60% while 20 were women or 40%. More
men are in the top management where the system is mostly used.This is also related to the fact
that most staff are over 40 years which is the age blacket of the management level.
Table 4.2: Gender
Frequency Percent Cumulative Percent
Male 30 60 60
Female 20 40 100
Total 50 100
4.2.3 Education level of the respondents Of the respondents surveyed majority were post graduate and university graduates (36%), 30%
had Masters Degrees, while only 22% had M.D/PhD qualifications. Those with high school level
of education constituted the lower cadre staff who were 12% of the survey. Dashboard system is
mostly used by the top managers of the organization where funds are available to further their
studies.
4.2.4 Organization Status
Stratified sampling had been used to create population categories. Executive level represents the
Chief Managers and then Managers, Senior Standard level represents the engineers and
Age Range
Frequency Percent Cumulative Percent
Valid Less than 30 yrs 6 12 12
31-35 yrs 8 16 28
36-40 yrs 15 30 58
More than 40 yrs 21 42 100
Total 50 100

22
technicians, Standard level represent the system and Contract represents the clerks whos work is
to enter the data into the system. The research sought to establish the distribution of the
respondents with respect to various job positions at Kenya Power. The findings indicate that the
majority 54% was in senior standard level, 18% in executive, 16% in standard and 12% in
contract. The research was able to establish that decision making in Kenya Power is done by the
top management.
Table 4.3 :Organization status
Frequency Percent Cumulative Percent
Executive level 9 18 18
Senior standard level 27 54 72
Standard level 8 16 88
Contract level 6 12 100
Total 50 100
4.2.5 Integration of BI system within the existing system
Integration with the existing system means the data mining of information from all systems at
Kenya Power so that dashboard can achieve 100% real time display.
60% of the population agreed BI dashboard system has intergated well with the existing sytems
used by the other department at Kenya Power,while 40% of the staff feel that the system does not
integrate well and more needs to be done.
Table 4.4 Integration of BI system with the existing system
Frequency Percent Cumulative Percent
Yes 30 60 60
No 20 40 100
Total 50 100

23
4.3 Factors affecting adoption of BI Dashboard system. The researcher investigated whether the following factors have affected the BI Dashboard
adoption. Respondents were supposed to state whether they strongly agree, agree, undecided,
disagree or strongly disagree. When the mean is closer to 1 with a small standard deviation this
implies that the respondents strongly agree. When the mean is closer to 4 this implies that most
respondent disagree. The standard deviation indicates how dispersed the responses were across
the different options. The respondents strongly agreed that the dashboard system helps the
organization motor its strategic plan. Spotting of the trends is possible with a mean of 1.4
implying that the respondents strongly agreed.
Table 4.5 :Effect of BI dashboard adoption
MEAN STD.DEV
Would you use dashboard to motor strategic plan progress 1.32 0.683329185
Does the Dashboard help to spot trends 1.4 0.494871659
Interactive nature of the Dashboards 1.42 0.498569382
Are you able to get Actionable insights 2 0.404061018
Is the dashboard visually appealing 1.5 0.707106781
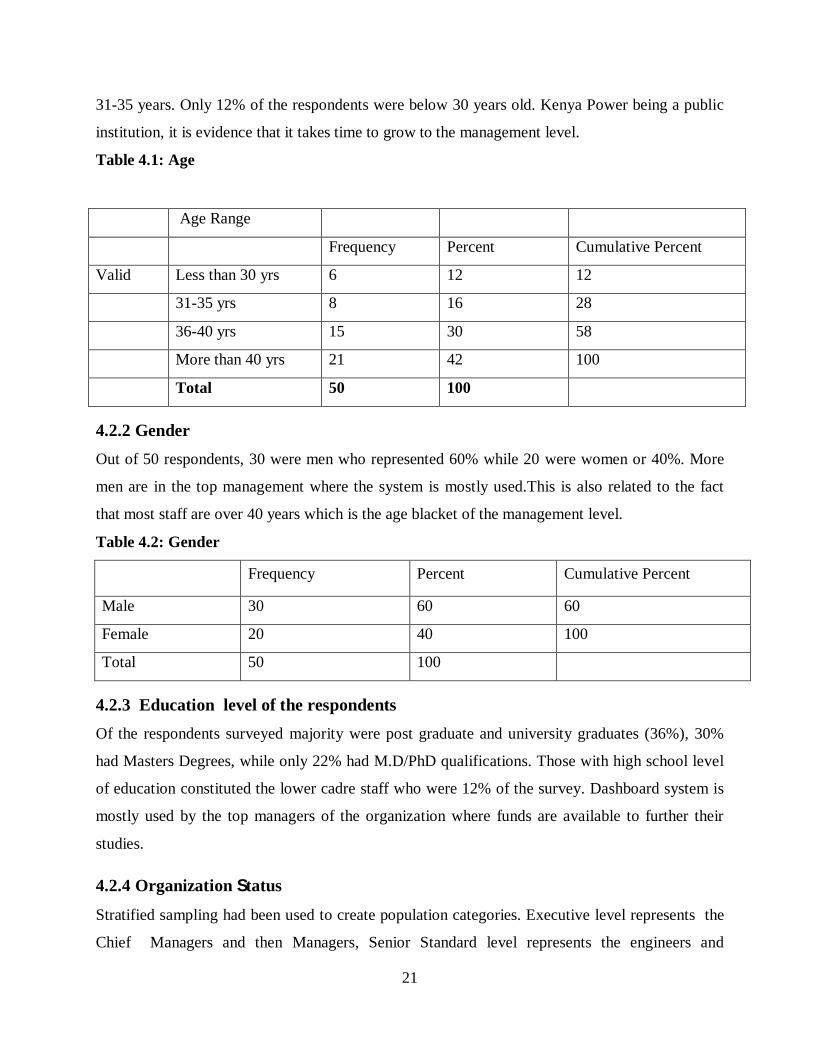
4 .4 Benefits of Dashboard To establish the benefits of dashboard, the researcher asked questions pertaining to improvement
of data accurancy, increased efficiency in the business process, improved customer service,
intergration of the process, alignment of the vision mission and values, performance reviews, goal
management, coordinate goal achievement, security of the system, can the system display data in
different format and if the system be used to make the development plan by Kenya Power.
The table below tabulates all the responses to the questions
24
Table 4.6: Benefits of Dashboard
Figure 4: Benefits of Dashboard
Strongly
agree
Agree Undeci
ded
Disag
ree
Strongly
disagree
Improve Accuracy of data 30.0 6.0 20.0 40.0 4.0
Increasing efficiency in the business process 28.0 48.0 6.0 14.0 4.0
Improved customer service 36.0 24.0 14.0 20.0 6.0
Integration of seamless process 20.0 44.0 20.0 10.0 6.0
Align vision, purpose and values 60.0 24.0 10.0 2.0 4.0
Performance reviews 36.0 54.0 2.0 4.0 4.0
Goal management 50.0 32.0 12.0 4.0 2.0
Co-ordinate goal achievement 22.0 54.0 18.0 4.0 2.0
The entire new system is secure 42.0 36.0 14.0 4.0 4.0
Dashboard I use can show data in different ways 40.0 42.0 2.0 12.0 4.0
Dashboard allows me to extensively drill down data 34.0 38.0 20.0 6.0 2.0
Dashboard can show data at different granularity of
time 28.0 48.0 12.0 10.0 2.0
Does dashboard provides better business
development plans 14.0 52.0 22.0 4.0 8.0

25
Improved accurancy of data was one of the cited benefits of dashboard system for decision
making. According to the finding, majorty of the respondants agreed that the system has lead to
data accurancy to some extent with 30% strongly agreeing, 6% agree, 20% not sure and 44% not
agreeing that data accurancy is achieved with the system. Dashbaord system improves efficiency
in decision making by the management.
According to respondent, users strongly agree that the system efficiency is achieaved with 76%
holding this opinion. Kenya Power’s core value is customer first and this contributed to the
introduction of the dashboard system. The users agreed that the system helps to achieve customer
satisfaction. Intergration of a seamless process is one of the advantages of intelligent dashboard.
Out of the respondents 66% agreed that it is possible to intergrate the many systems at Kenya
Power,20% were undecided and 16% in disagreement. For Kenya Power to achive its goal, the
mission, vision and values must be upheld. The users agree that this have been achieaved with
84% in agreement and 6% not in agreement.
Goal management was one of the benefits of dashboard system, the users believed that with the
use of system the company is able to manage its goals with only 6% not in agreement.
Coordination of the goal management is among the many advantages of the BI dashboard the
users agree with 18% undecided and 76% in agreement. Security of a system is very important for
any orgazanition. BI dashboard being a web based system, the users agree that the system is
secure with 76% in agreement and 14% of the users not sure if the system is secure.
The users of the system also agree that the dashboard can be used to show data in different
formats the feature is most important to managers for decision making. A good number of the
staff agreed with 2% not sure and 16% not in agreement.
Respondents agreed BI Dashboard system can be used by managers to drill down the data that is
presented in the system with 72% in agreement and 20% not sure. When the users were asked if
dashboard can be used to show information at different times, the user agreed with 76% of the
user in concurrence.
There was a general agreement that BI dashboard can be a tool for development planning. That is
the management is able to come up with a strategic plan for a period of 5 year which is measured
every month. 68% of the users agreed, 22% of them were undecided and 12% thought that it not
possible to make plan with dashboard system.
The graph below shows the distribution of responses on the benefits of dashboard system.

26
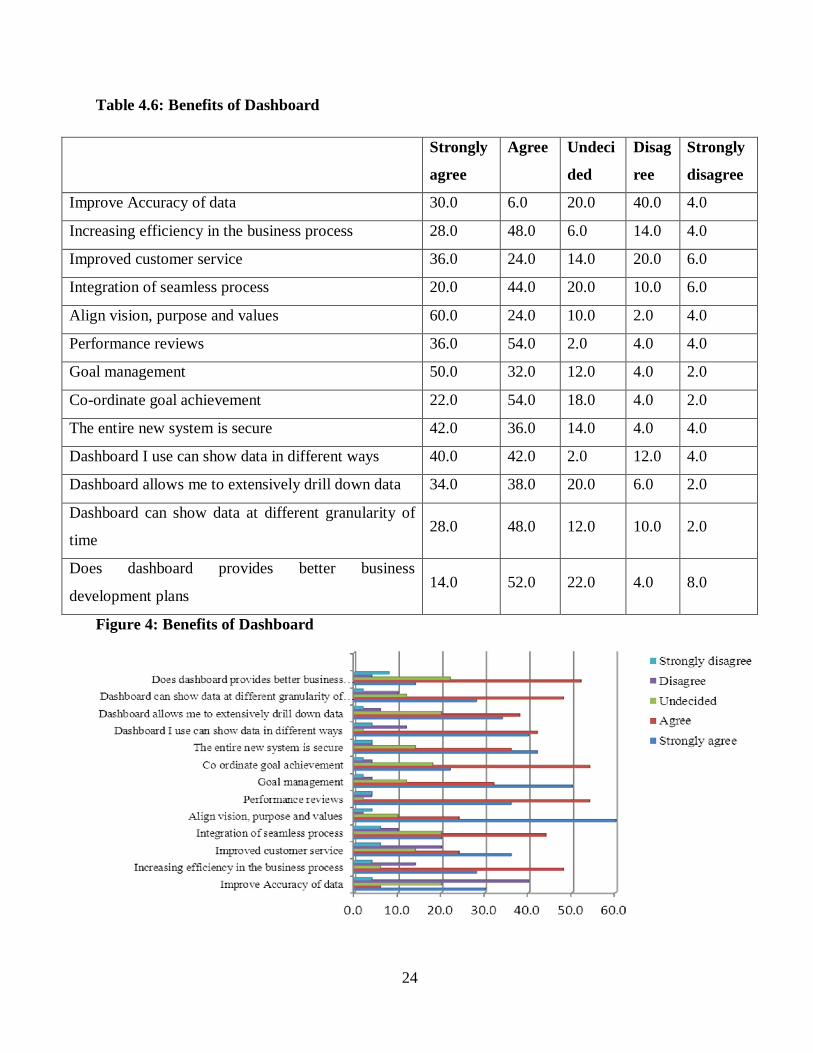
4 .5 Challenges of BI Dashboard System. To establish the challenges of dashoard system, the researcher asked questions pertaining to cost
effectiveness, security of data displayed, time saving for busy managers, design issues that affect
the quality of decision making, system resistance by the users , completeness of data, how easy is
it to change the KPI, how well are users trained on the capability of the system and if data
displayed on dashboard is complete. The table below tabulates all the responses to the questions.
Table 4.7:Challenges of BI Dashboard system
Strongly
agree
Agree Undecided Disagree Strongly
disagree
1. Cost effectiveness 16.0 38.0 20.0 12.0 14.0
2. Security of Data 22.0 40.0 22.0 16.0 0.0
3. Time saving 24.0 36.0 26.0 12.0 2.0
4. Design issues affect the quality of
decision making 18.0 46.0 28.0 6.0 2.0
5. system resistance by employees 36.0 46.0 10.0 4.0 4.0
6. Data in the dashboard is complete 32.0 16.0 22.0 20.0 10.0
7. Easily change the key performance
indicators 24.0 30.0 26.0 18.0 2.0
8. User Training 18.0 42.0 18.0 6.0 16.0
9. Data in the dashboard is up to date 22.0 20.0 16.0 30.0 12.0
27
Figure 5:Challenges of BI Dashboard system
BI dashboard system is a cost effective tool for decision making at Kenya Power, majority of
respondents agree that the system is cost effective with 16% strongly agreeing, 38% agree, 20%
not sure and 26% think that the system is not cost effective. Concerning data security of the
system, users agree it is a challenge. With regard to time saving when using the system the users
are in agreement. When the respondent was asked about the design issues if it has affected the
decision making of the organization the users agreed that improvement must be done on the
system with 64% in agreement while the rest were not aware. The users agreed that there was
system resistance and this have affected the adoption of the new system at Kenya Power with
86% in agreement and only 8% not agreeing. Concering the completeness of the information
presented in the dashboard system the users disagree with the fact that the data is not complete
with 32% strongly agreeing, 16% agree, 22% not sure and 30% not agreeing that it is a challenge.
There was a concern about how easily the key performance indicators can be changed.
Respondents agreed with 26% not being aware if that was possible and 54% being in agreement
that with the use of system KPI can be traced.The results showed that majority of respondents
agreed that user training must be done. This is evidence by the so many undecided factors on the
respondant meaning that the staff are either ignorant or are resisting the system with total of

28
undecided and agree being 78%. On the contrary, the respondents disagreed that data in the
dashboard is up to date, with 42% not agreeing and 16% not decided.
4.6 Decision making process Dashboard is used more frequently by higher management and non technical people. Dashboard
assist in the decision making process it is also a great tool for communication as it keeps
information transparent thoughout the organization at all times. Users acknowledged that
dashboard keep everyone in the organization constantly informed about the different processes
and action plan being understaken in various departments.
However the staff strongly agree that data accurancy act as a major hindrance to decision making
process. This is attributed to the fact that data is gethered from different systems in the
organization and when the system do not intergrate well with dashboard, the accurancy of the
information is complimised.
Table4.8 :Decision making process
Frequency Percent Cumulative Percent
Complex user interface 4 8 8
Information overload 6 12 20
Accuracy of the data 36 72 92
Availability of the system 4 8 100
Total 50 100
Figure 6: Decision making process

29
4.6.1 Decision making process improved by use of BI dashboard. Dashboards are very visual in that you do not need to see the data inside for you to make a
decision. To the higher management it is very important. Their prefer to see this as compared to
data. For the technical team it does not matter if you give them data or dashboard because they
can visualize and analyze the data. If data is moved around in the company from one analyst to
manager, its integrity can be lost, this is why the dashboard becomes important in decision
making.
Table 4.9 :Decision making process
Frequency Percent Valid Percent
Yes 38 76.0 76.0
No 12 24.0 24.0
Total 50 100.0 100.0
4.6.2 Objectives of Dashboard been accomplished by use of BI dashboard. The objectives of the implementation was achieved, users deal with humongous amount of data
and real time data is needed at every particlar time. 68% of the users agree that the objective was
met but 32% of the staff thought that becouse of the huge expenditure for the company and the
training involved the objective was not meant.
Table 4.10:Objectives of dashboard have been accomplished
Frequency Percent Cumulative Percent
Yes 34 68 68
No 16 32 100
Total 50 100
4.7 Regression Analysis
A multivariate regression model was applied to determine the relative importance and the
relationship between the independent variables and performance (dependent variable), in regard to
the prepaid system in Kenya Power. The regression model was as follows

30
Model summary
Table 4.11:Regression model summary
Model
Summary
Model R R Square Adjusted R Square Std. Error of the Estimate
1 0.636 0.4046 0.18906 0.389
Predictors: (Constant), Improve Accuracy of data: Increasing efficiency in the business process:
Improved customer service: Integration of seamless process: Align vision, purpose and values:
Performance reviews: Goal management: Co-ordinate goal achievement: The entire new system is
secure: Dashboard I use can show data in different ways: Dashboard allows me to extensively
drill down data: Dashboard can show data at different granularity of time: Does dashboard
provides better business development plans
R2 =0.40 meaning that 40% of the variations in the dependent variable decision making can be
explained by all the dependent variables
Table 4.12: Anova test
Model
Sum of
Squares df Mean Square F Sig.
1 Regression 3.686 13 .284 1.879 0.068
Residual 5.434 36 .151
Total 9.120 49
Hypothesis that the independent variable in the model have no effect on decision making is
rejected since the p-value <1.

31
Table 4.13 : Coefficients
Model
Unstandardized
Coefficients
Standardized
Coefficients t Sig.
B Std. Error Beta
1 (Constant) .872 .387 2.254 .030
Dashboard improve accuracy .006 .051 .020 .128 .899
Increase efficiency in the
business process .070 .064 .183 1.103 .277
Improve customer service .098 .052 .301 1.873 .069
Integration of a seamless
process -.065 .064 -.166 -1.014 .317
Align vision mission purpose
and values .015 .065 .036 .231 .819
Performance reviews .149 .070 .328 2.126 .040
Goal management -.110 .073 -.244 -1.506 .141
Coordinate goal achievement -.011 .083 -.022 -.131 .897
Entire new system secure -.017 .063 -.041 -.268 .790
Can the system show data in
different ways -.075 .066 -.197 -1.130 .266
Does it all extensively drill
down of data .149 .063 .342 2.354 .024
Can u get data in different
granularity of time -.074 .065 -.171 -1.144 .260
Does it make better business
development plans .027 .062 .065 .435 .666
Improved customer service increases the probability of decision making using the BI dashboard
system by 30% (t=1.873). Performance reviews increase the probability of decision making using
the BI system by 32% (2.126). The capability of a dashboard to extensively drill down data
increases decision making by 34%.

32
CHAPTER FIVE: SUMMARY, CONCLUSION AND RECOMMENDATIONS
5.0 Introduction This chapter presents the summary of the paper, conclusions drawn, and the recommendations of
the study. The chapter begins with a brief summary of the purpose of the study, research
objectives, methodology and a summary of major findings, before presenting the conclusion and
recommendations.
5.1 Summary
This study sought to investigate BI adoption at Kenya Power . The exploration was guided by the
following objectives,the extent to which Kenya Power has adopted BI Dashboard system, effect
of Business Intelligence dashboard system for decision making at Kenya Power, benefits of
adoption of Business Intelligence Dashboard system at Kenya Power and the challenges of
Business Intelligence Dashboard system adoption at Kenya Power. The study shows that the aims
the company was wanted to accomplish have been realized to a large extent and the new BI
dashboard system has improved decision making.
The study also clearly indicated that the major challenges the company is urgently required to
address are; completeless of the data which means without the complete data the decision made
will not be a true reflection of the status of the organization, data accurancy and intergration of the
dashboard with the other systems at Kenya Power. The respondents agree that there are quite a
number of other challenges in the implementition process although they are of the opinion that
these are minor and can easily be resolved if they are addressed promptly.
5.1.1 Conclusion The findings of the research support the notion that, objective of the company in implementing
the new dashbord system have been achieved although a lot more needs to be done. Shifting from
manual system of analyzing data to the use of the sytem was well calculated and the benefits are
gradually being realized as improvement goes on. There are few challenges but these are minimal
considering the larger picture of the benefits and decision making improvement that have so far
been achieved. The study has also shown that Kenya Power has successfully implemented the
33
new system within a short time without the usual adoption problems that come with new
innovation. Kenya Power employees who were the focus of the study have accepted the changes
though with some users resisting. They agree that more requires to be done, especially the data
accurancy improvement and training on the new system to eliminate the undecided factor.
Dashboard assist in the decision making process it is also a great tool for communication as it
keeps information transparent thoughout the organization at all times. Users acknowledged that
dashboard keep everyone in the organization constantly informed about the different processes
and action plan being understaken in various departments.
5.1.2 Recommendations ICT department is required to create more awareness of the new system especially among the
users. Feedback mechanism from the users should be estamblished so as to identify the challenges
facing new innovation and rectify them quickly. The challenges should be anticipated and
resolved quickly before they become problematic to users. More staff should be introduced and
trained on how to use the system to increase the usability and have more people on board to help
the company realize it strategic plan.
Kenya power should focus more on improving customer service as the findings clearly indicate
that improved customer service increases the probability of decision making using the BI
dashboard system. This is because Kenya Power is a customer based and by use of BI system,
better and quick decisions are made.
From the findings, performance reviews should be encouraged more often because they have an
impact in the success of the system. The MSR that are normally conducted to review the
performance should be taken more seriously and all the stake holders should be involved in
setting up the missions and measures of the organisation.
From the research, the dashboard system enables the users to extensively drill down the data and
this contributes to the overall success of the system and decision making. This means that the
organization should intergrate all the systems to the dashboard for the availability of the data. All
users should also be encouraged to use the system to increase efficiency.
From the findings individual performance planning and development is possible though the
performance reviews conducted by managers which include values, development plans, careers
aspirations and career success. Dashboards will enable talents reviews by panels which both rate
34
and calibrate individual performance and potentials. Succession plans and key roles for each
individual can be established.
5.1.3 Limitations The study had a number of limitations. Respondents were at first fearful about giving out
information about the new system since they were unsure where the information was to be used.
This contributed to the delay of the research. Majority of the respondents were very busy owing to
the facts that most of the users are in the top management who have very tight schedules. This
lead to the respondent not been dedicated and taking the questionaire seriously. This had a
negative impact on the research since one cannot get the feelings of all the paticipants.
The research had to be undertaken during working hours which caused a lot of inconveniences to
the respondents who worked in diffect departments and some even in differnet regions.
Financial constain was another factor that affected my research, since one had to keep on calling
the users to remind them and also moving from one region to another inorder to collect the
questionnaire.
5.1.4 Recommendation for further research The challenges like accurancy of data need to be studied more in order to ensure they are
resolved. This should be done by intergrating all the processes in Kenya Power into one system .
Due to this, measures should be put to enforce data integrity.
Market studies should be carried out to analyze the needs of the staff so as to get a system that
best suits them and any upgraded versions available. This will also prevent the users from having
so many system where us their can just have one system that perform all the tasks.
Kenya Power should have studies focusing on other countries that have already implemented this
system in order to avoid making the same mistakes and have a better system that is up-to-date.this
is to avoid the organization from having to implement so many system all a system becoming
obsolete after a very short time.

35
Since BI dashboard can be used as a tool for development planning. This enables the management
to come up with a strategic plan for a 5 year period which is measured every month. This means
alot of training on perfornace should be done and factory visits should be encouraged so that the
organization can compare the challenges and hence identify where they went wrong.

36
REFERENCES Adam, F. & Humphreys, P. (2008). Encyclopedia of Decision Making and Decision Support.
London, Information Science References
Ballou, D. P., & Tayi, G. K. (1999). Enhancing Data Quality In Data Warehouse Environments.
Communication of the ACM. Vol.42/No.1
Bresnahan, T, Brynjolfsson, E, Hitt L. (2002). Information Technology, Workplace Organisation
and the Demand for Skilled Labour. Quartely Journal of Economics, Oxford.
Bui T., Sroka H., Stanek S. Goluchowski J., (Eds ). Publisher of the Karol Adamiecki University
of Economics, Karol Adamiecki University of Economics, Katowice.
D.L., Thompson R.L.(1995). Task Technology Fit and Individual Performance, MIS, vol. 19
Eckerson, W. W. (2005). Performance dashboards. DM REVIEW, 15(11), 26
Gartner, Joseph Feiman & Neil, M (2010)
Gray, P. (2003) Business intelligence a new name or the Future of DSS in DSS in the Uncertainty
of the Goodhue. Utrecht. 21st European Conference on Information Systems.
Herring J. P. (1999). Key Intelligence Topics, a process to identify and define intelligence needs,
in Competitive Intelligence Review, Vol. 10(2).
http://www.kplc.co.ke).
Judith H, F. Halper. (2005). Dashboards Enabling Insight and Action. Waltham. Hurwitz and
Associates.
Kenya Power and Lighting Company. (2006, May). Audit Report No. 6/2005- 6, on Customer
creation. Nairobi: KPLC publication.
Malik, S, (2005). Enterprise dashboards design and best practices, Ed.1. New Jersey. Wiley,
Mugenda, and Mugenda, (2003). Readings in Research Method Quantitative and Qualitative
Approaches. Nairobi. Africa Centre for Technology Studies.
Mike S, (2003), Practical Business Intelligence for Associations & Non Profit Organizations, p.
1-6. Les Silverman. Mikinsey & Company.
Negash S. and Gray P., (2008). Business Intelligence, Handbook on Decision Support Systems 2,
International Handbooks on Information Systems, Chapter VII, Springer Berlin Heidelberg.
Pitt, L. F., Watson, R. T., & Kavan, C. B. (1995). Service quality: A measure of information
systems effectiveness. MIS Quarterly, 19(2): 173-188.

37
Swan, J, Newell, S, Scarbrough, H. and Hislop, D. (1999) Knowledge Management and
Innovation. Vol. 3 Iss: 4. MCB UP Ltd
Shaft, T. M., & Vessey, I. (2006). The role of cognitive fit in the relationship between software
comprehension and modifications. Management Information Systems Quarterly, 30(1), 29–55.
Schiff, Craig, (2007), Fact vs. Fiction in Performance Management, Business Intelligence.
Stacey B, (2010) 7 Small Business Dashboard Design Dos and Don'ts Barr. Ayrshire.
Vitt, E., Luckevich, M. et al. (2002). Business Intelligence Making Better Decisions viewed on
http://www.juiceanalytics.com
White H, M. and White horn, M (1999). Business Intelligence the IBM Solution, Data ware
housing and OLAP. London, Springer-Verlag.
Whiting, R. (2003). Business Intelligence Buck IT Spending Slowdown, Tech Web, viewed on
http://business.highbeam.com.

38
APPENDIX 1
QUESTIONNAIRE This questionnaire is purely an academic research tool for the completion of the dissertation. It is
designed to investigate the Adoption of Business Intelligent Dashboard and Decision Making.
There is no correct or incorrect answer for each question. Therefore, please answer as honestly as
possible. All information provided will be treated with anonymity and confidentiality. The survey
result will strictly be used for academic purposes.
Thank you very much for your cooperation and participation.
Section A: Demographic Information
Age
Less than 30 years 31-35 years 36-40 years More than 40 years
Gender
Male Female
Level of Education
High School College/Undergraduate (BA/BS) Masters Degree
M.D/PhD
Organization Status
Executive Senior standard
Standard Contract
1.Has the new system integrated well with the existing system?
Yes No

39
Section B: Has the following affected the BI Dashboard Adoption
How as the following affected the adoption of Dashboard? Tick where appropriate
Strongly agree (1) Agree (2) undecided (3) Disagree (4) Strongly disagree (5)
Section C: Benefits of Dashboard
Has the Dashboard accomplished its goals? Tick where appropriate.
Strongly agree (1) Agree (2) undecided (3) Disagree (4) Strongly disagree (5)
Benefits 1 2 3 4 5
Improve Accuracy of data
Increasing efficiency in the business process
Improved customer service
Integration of seamless process
Align vision, purpose and values
Performance reviews
Effect of Dashboard adoption 1 2 3 4 5
Would you use dashboard to monitor strategic plan
progress?
Does the dashboard help to Spot Trends?
Interactive nature of the Dashboards
Are you able to get Actionable Insights?
Is the dashboard visually appealing?
Any other factors (list below)
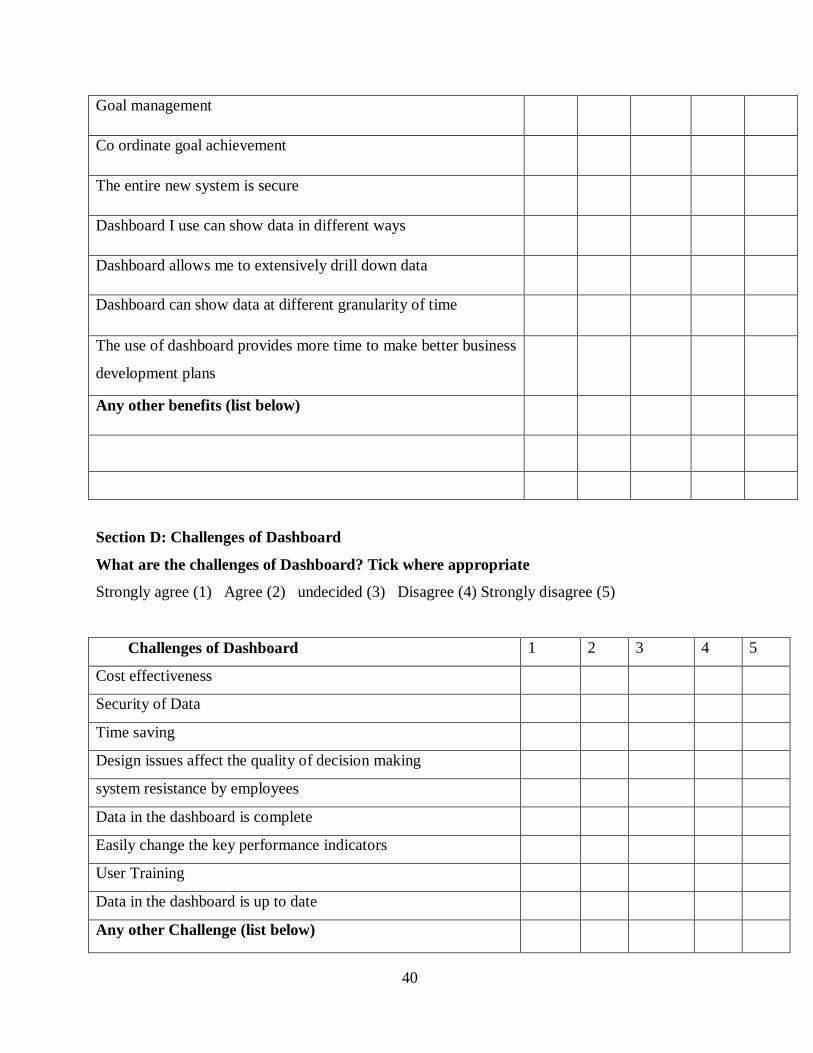
40
Goal management
Co ordinate goal achievement
The entire new system is secure
Dashboard I use can show data in different ways
Dashboard allows me to extensively drill down data
Dashboard can show data at different granularity of time
The use of dashboard provides more time to make better business
development plans
Any other benefits (list below)
Section D: Challenges of Dashboard
What are the challenges of Dashboard? Tick where appropriate
Strongly agree (1) Agree (2) undecided (3) Disagree (4) Strongly disagree (5)
Challenges of Dashboard 1 2 3 4 5
Cost effectiveness
Security of Data
Time saving
Design issues affect the quality of decision making
system resistance by employees
Data in the dashboard is complete
Easily change the key performance indicators
User Training
Data in the dashboard is up to date
Any other Challenge (list below)

41
APPENDIX 2: SCHEDULE AND BUDGET SCHEDULE OF WORK
EVENT
TIMELINE
Preparation of proposal
To March 5th 2013
Correction of the proposal
March 10th to July 15th
Seeking necessary authorization
July 15th to July 23rd
Proposal presentation
26th July 2013
Correction on proposal
1st August to 22nd August
Approval of proposal for data collection 22nd August 2013
Data collection
September 1st 10th
Data analysis
September 11th to 15th
Writing and submission of report
September 16th to 20th
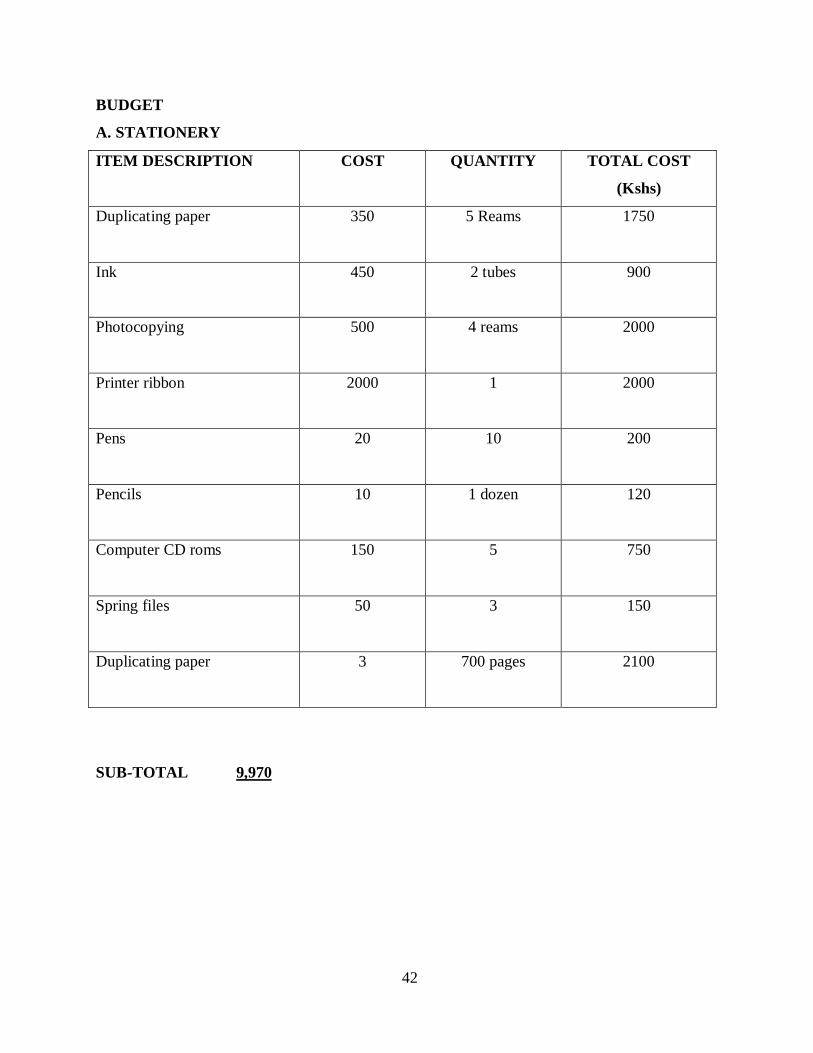
42
BUDGET
A. STATIONERY
ITEM DESCRIPTION COST
QUANTITY
TOTAL COST
(Kshs)
Duplicating paper
350
5 Reams
1750
Ink 450 2 tubes 900
Photocopying
500
4 reams
2000
Printer ribbon
2000
1
2000
Pens
20
10
200
Pencils
10
1 dozen
120
Computer CD roms
150
5
750
Spring files
50
3
150
Duplicating paper
3
700 pages
2100
SUB-TOTAL 9,970

43
B: REPORT PREPARATION
Laser printing of report (150 pages) @ 50/= 7500
Photocopying 3 copies of the report (450 pages ) @ 5/=
2250
Binding of the first 6 copies of report @ 200/=
1200
Laser printing of the final copy (150 pages0 @ 50/=
7500
Photocopying 5 copies final report 750 pages @5/=
3750
SUB-TOTAL 22,200
GRAND TOTAL 32,170