adsorption equilibrium, kinetics and thermodynamics … · journal of american science 2010;6(6)...
TRANSCRIPT

Journal of American Science 2010;6(6)
http://www.americanscience.org [email protected] 267
Adsorption Equilibrium, kinetics and thermodynamics of methylene blue from aqueous solutions using biopolymer oak sawdust
composite
M.M. Abd El-Latif1, Amal M. Ibrahim2, M.F. El-Kady1
1. Fabrication Technology Department, Institute of advanced technology and New Materials, Mubarak City for
Scientific Research and Technology Applications, Alexandria, Egypt 2. Surface Chemistry and Catalysis Laboratory, Physical Chemistry Department, National Research Center, Cairo,
Egypt
Abstract: Oak sawdust (OSD), furniture industrial waste was chemically treated with 0.1N NaOH to give hydrolyzed oak sawdust (HOSD) which was immobilized on alginate biopolymer. Hydrolyzed oak sawdust composite (HOSDC) was utilized as low-cost adsorbent to remove basic dye (methylene blue, MB) from aqueous solution. HOSD and HOSDC were characterized by using Scanning electron microscope (SEM), thermo gravimetric analysis (TGA) and infrared spectrometer analysis (FTIR). The adsorption of (MB), whose isotherms are modeled according to Langmuir, Freundlich and Temkin, were studied at a variety of physical and chemical conditions. The data fitted very well with Freundlich isotherm. Batch adsorption models, based on the assumption of pseudo-first-order, pseudo-second-order and intraparticle diffusion mechanism, showed that kinetic data follow closely pseudo-second-order and intraparticle diffusion. In addition, various thermodynamic parameters, such as standard Gibbs free energy (∆G◦), standard enthalpy (∆H◦), standard entropy (∆S◦), and the activation energy (Ea) were calculated. The adsorption process of MB dye onto HOSDC was found to be spontaneous and endothermic process. Furthermore, a single-stage batch adsorber was designed for the removal of methylene blue by HOSDC based on the equilibrium data obtained. [Journal of American Science 2010;6(6):267-283]. (ISSN: 1545-1003). Keywords: Methylene blue; Sorption isotherms; Kinetics; thermodynamics; Sawdust; Binding polymers.
1. Introduction
The discharge of dyes in the environment is worrying for both toxicological and esthetical reasons [1]. Industries such as textile, leather, paper, plastics, etc., are some of the sources for dye effluents [2]. It is estimated that more than 100,000 commercially available dyes with over 7×10⁵ tones of dyestuff produced annually [3]. Although MB is used in some medical treatments, and in dying textile, it can cause eye injury for both human and animals. On inhalation, it can give rise to short periods of rapid or difficult breathing while ingestion through the mouth produces a burning sensation and may cause nausea, vomiting, profuse sweating, diarrhea, gastritis, mental confusion and methemoglobinemia [4, 5]. Thus, the removal of MB from industrial effluents has become one of the major environmental concerns.
A range of conventional treatment technologies for dye removal have been investigated extensively, such as biological treatment, adsorption, chemical oxidation, coagulation, and reverse osmosis [6, 7]. However, most of the above methods suffer from one or more limitations and none of them are successful in completely removing the color from wastewater. The removal of dyes and organics in an economic way remains an important problem,
although a number of systems have been developed with adsorption techniques. Adsorption was found to be superior to other techniques for water re-use in terms of initial cost, simplicity of design, ease of operation and insensitivity to toxic substances [8, 9]. Activated carbon adsorption is highly effective for removing dyes and pigments [10], it is often too expensive to be used in developing countries; the use of low-cost adsorbents, such as clay minerals [11], bottom and fly ash [12–14], fungi [15], waste materials from agriculture representing an essential target for these countries [16–20]. Also a number of studies in the last years focused on the adsorption of some dyes (acid, basic, reactive, and metal complex) on sawdust of different woods: beech [21–24], rubber wood [25], walnut and cherry tree, pine [26–28], cedar [29], clay–wood sawdust mixture [30], Indian rosewood [31], treated sawdust[32],spruce sawdust magnetically modified [33,34], charred [35] and oak [36,37]. Oak sawdust, alkali treated oak sawdust and acid treated oak sawdust were utilized successfully for the removal of basic dye from aqueous solutions [36] but still some difficulties in its removal from the wastewater.

Journal of American Science 2010;6(6)
http://www.americanscience.org [email protected] 268
In order to overcome the handling problem, biopolymer binding polymers for the granulation of (HOSD) have a number of advantages such as simplicity of preparation procedure and excellent physicochemical properties [38]. Alginic acid is a biopolymer having carboxyl groups capable of forming complexes with divalent cations such as Ca2+ and Ba2+. Thus the prominent immobilizing ability of alginic acid and alginates seems to be effective for the granulation of (HOSD), and this granulation method has a number of advantages such as simplicity for preparation, high content of active component (HOSD), high porosity, easy to be separated from the wastewater [38].
The objective of this study is to immobilize the HOSD into the porous matrices of alginate gel polymer in order to employ the granulated composite (HOSDC) for the removal of methylene blue (MB) from aqueous solution. The effects of various operating parameters such as solution pH, adsorbent dose, binding polymer, initial dye concentration, contact time, agitation speed and temperature on MB adsorption were investigated. Adsorption isotherms and kinetics of the sorption process were studied. Also various thermodynamic parameters were calculated. Further, a single-stage batch adsorber was designed for the removal of methylene blue by HOSDC based on the equilibrium data obtained. 2. Materials and methods 2.1. Materials
The structure of a cationic MB dye, C16H18N3SCl.3H2O, supplied from (NICE CHEMICALS Pvt. Ltd., COCHIN) is shown in Fig.1. The stock dye solution was prepared by dissolving 1g of methylene blue in 1000ml distilled water to obtain 1000mg/L dye used for preparing different initial dye concentrations. For hydrolyzed sawdust throughout the experiment, a sodium hydroxide solution was used. For pH adjustment throughout the experiment, hydrochloric acid and/or sodium hydroxide solutions were used as necessary. Sodium alginate (NaALG) with a high viscosity (2% solution= 14000cP) was supplied from (Sigma-Aldrich company). Sodium alginate linear unbranched polymers containing β-(1 4)-linked D-mannuronic acid (M) and α-(1 4)-linked L-guluronic acid (G) is shown in Fig.(2). Calcium Chloride (CaCl2) was supplied from Riedel-de Hean. 2.2. Adsorbent preparation and characterization
Oak sawdust, was used as an adsorbent for the removal of methylene blue, was obtained from a local furniture manufacturing company, as a suitable source for full-scale/industrial applications. OSD was washed with distilled water to remove the water-
soluble impurities and surface adhered particles, dried in a digital dryer of (Carbolite, Aston lane, Hope Sheffield, 5302RP, England) for twenty four hours at 105°C to get rid of the moisture and other volatile impurities and sieved using sieve analyzer (AS200 Retsch, Germany) to different particle size ranges 45- 500µm. The material after sieving in the range 125-250 µm was isolated and placed in a conical flask contains 0.1N NaOH solution at a liquid to solid ratio of 10:1 with 200 rpm agitation speed using orbital shaker (yellow line Os10 Control, Germany) for four hours at room temperature. The excess alkaline solutions were decanted, and the alkaline HOSD was washed continuously with distilled water until the pH of the washing water became less than 8 using pH meter (Denver Instrument Co., U.S.A.). HOSD was characterized using FTIR, SEM and TGA techniques. Figure 1. Structure of Methlyene Blue Figure 2. Sodium alginate structure 2.3. Preparation of HOSDC The preparation procedure for hydrolyzed oak sawdust –calcium alginate composite was carried out as follow (Fig.3): a viscous NaALG weighted amount solution was dissolved in distilled water to form 1.25 wt% solutions; the hydrolyzed oak sawdust was added to the alginate to form a mixture of 2.5:1 HOSD-alginate with good mixing by vigorous stirring. Here the mixing ratio was defined as mass (g) of HOSD to the mass (g) of NaALG. The formed mixture was added drop wise by peristaltic pump at flow rate 0.5 ml/s with tube 2.79 mm internal diameter to 3% CaCl2 solution with stirring at room temperature to form spherical shape after overnight standing. They were separated from calcium chloride solution, washed with distilled water, dried at 50ºC and finally stored in sealed vessel. The dried composite was used for detailed studies. The prepared composite was characterized using FTIR,
Journal of American Science 2010;6(6)
http://www.americanscience.org [email protected] 269
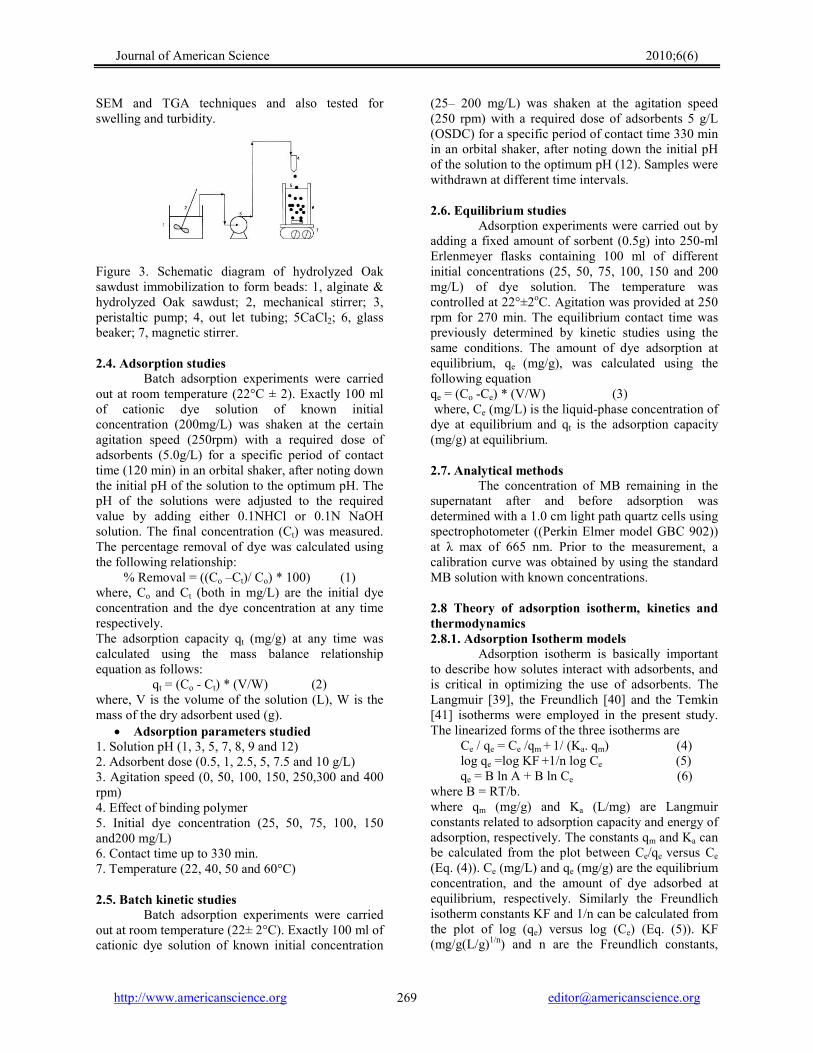
SEM and TGA techniques and also tested for swelling and turbidity. Figure 3. Schematic diagram of hydrolyzed Oak sawdust immobilization to form beads: 1, alginate & hydrolyzed Oak sawdust; 2, mechanical stirrer; 3, peristaltic pump; 4, out let tubing; 5CaCl2; 6, glass beaker; 7, magnetic stirrer. 2.4. Adsorption studies
Batch adsorption experiments were carried out at room temperature (22°C ± 2). Exactly 100 ml of cationic dye solution of known initial concentration (200mg/L) was shaken at the certain agitation speed (250rpm) with a required dose of adsorbents (5.0g/L) for a specific period of contact time (120 min) in an orbital shaker, after noting down the initial pH of the solution to the optimum pH. The pH of the solutions were adjusted to the required value by adding either 0.1NHCl or 0.1N NaOH solution. The final concentration (Ct) was measured. The percentage removal of dye was calculated using the following relationship:
% Removal = ((Co –Ct)/ Co) * 100) (1) where, Co and Ct (both in mg/L) are the initial dye concentration and the dye concentration at any time respectively. The adsorption capacity qt (mg/g) at any time was calculated using the mass balance relationship equation as follows:
qt = (Co - Ct) * (V/W) (2) where, V is the volume of the solution (L), W is the mass of the dry adsorbent used (g).
• Adsorption parameters studied 1. Solution pH (1, 3, 5, 7, 8, 9 and 12) 2. Adsorbent dose (0.5, 1, 2.5, 5, 7.5 and 10 g/L) 3. Agitation speed (0, 50, 100, 150, 250,300 and 400 rpm) 4. Effect of binding polymer 5. Initial dye concentration (25, 50, 75, 100, 150 and200 mg/L) 6. Contact time up to 330 min. 7. Temperature (22, 40, 50 and 60°C) 2.5. Batch kinetic studies
Batch adsorption experiments were carried out at room temperature (22± 2°C). Exactly 100 ml of cationic dye solution of known initial concentration
(25– 200 mg/L) was shaken at the agitation speed (250 rpm) with a required dose of adsorbents 5 g/L (OSDC) for a specific period of contact time 330 min in an orbital shaker, after noting down the initial pH of the solution to the optimum pH (12). Samples were withdrawn at different time intervals. 2.6. Equilibrium studies
Adsorption experiments were carried out by adding a fixed amount of sorbent (0.5g) into 250-ml Erlenmeyer flasks containing 100 ml of different initial concentrations (25, 50, 75, 100, 150 and 200 mg/L) of dye solution. The temperature was controlled at 22°±2oC. Agitation was provided at 250 rpm for 270 min. The equilibrium contact time was previously determined by kinetic studies using the same conditions. The amount of dye adsorption at equilibrium, qe (mg/g), was calculated using the following equation qe = (Co -Ce) * (V/W) (3) where, Ce (mg/L) is the liquid-phase concentration of dye at equilibrium and qt is the adsorption capacity (mg/g) at equilibrium. 2.7. Analytical methods
The concentration of MB remaining in the supernatant after and before adsorption was determined with a 1.0 cm light path quartz cells using spectrophotometer ((Perkin Elmer model GBC 902)) at λ max of 665 nm. Prior to the measurement, a calibration curve was obtained by using the standard MB solution with known concentrations. 2.8 Theory of adsorption isotherm, kinetics and thermodynamics 2.8.1. Adsorption Isotherm models
Adsorption isotherm is basically important to describe how solutes interact with adsorbents, and is critical in optimizing the use of adsorbents. The Langmuir [39], the Freundlich [40] and the Temkin [41] isotherms were employed in the present study. The linearized forms of the three isotherms are Ce / qe = Ce /qm + 1/ (Ka. qm) (4) log qe =log KF +1/n log Ce (5) qe = B ln A + B ln Ce (6) where B = RT/b. where qm (mg/g) and Ka (L/mg) are Langmuir constants related to adsorption capacity and energy of adsorption, respectively. The constants qm and Ka can be calculated from the plot between Ce/qe versus Ce (Eq. (4)). Ce (mg/L) and qe (mg/g) are the equilibrium concentration, and the amount of dye adsorbed at equilibrium, respectively. Similarly the Freundlich isotherm constants KF and 1/n can be calculated from the plot of log (qe) versus log (Ce) (Eq. (5)). KF (mg/g(L/g)1/n) and n are the Freundlich constants,

Journal of American Science 2010;6(6)
http://www.americanscience.org [email protected] 270
which are indicators of adsorption capacity and adsorption intensity, respectively [42]. The Temkin isotherm [41] has generally been applied in the form given by Eq. (6). Therefore, by plotting qe versus ln Ce (Eq. (6)), enables the determination of the constants A and B. B is the Temkin constant related to heat of sorption (J/mol), A is the Temkin isotherm constant (L/g), R the gas constant (8.314 J/mol K), b is Temkin isotherm constant and T the absolute temperature (K). 2.8.2. Kinetics models
The most common models used to fit the kinetic sorption experiments are Lagergren’s pseudo-first-order model (Eq. (7)) [43] and pseudo- second-order model (Eq. (8)) [44] were used: ln(qe − qt ) = ln qe − k1t (7) t/ qt = 1/ k2q
2e + t / qe (8)
where qe (mg/g) and qt (mg/g) are the amount of dye adsorbed at equilibrium and at time t, respectively. k1 (min−1) and k2 (gmg−1 min) are the pseudo-first-order and pseudo-second order adsorption rate constants, respectively. 2.8.3. Intraparticle diffusion model
In order to investigate the mechanism of the MB adsorption onto HOSDC, intraparticle diffusion-based mechanism was studied. The most commonly used technique for identifying the mechanism involved in the adsorption process is by fitting an intraparticle diffusion plot. It is an empirically found functional relationship, common to the most adsorption processes, where uptake varies almost proportionally with t1/2 rather than with the contact time t. According to the theory proposed by Weber and Morris [45]: qt = kidt
1/2 + Ci (9) where kid (mg g−1 min1/2), the rate parameter of stage i, is obtained from the slope of the straight line of qt versus t1/2. Ci is the intercept which are proportional to the extent of boundary layer thickness [46]. 2.8.4. Thermodynamics studies
Thermodynamic parameters were evaluated to confirm the adsorption nature of the present study. The thermodynamic constants, Gibbs free energy change (∆G◦), enthalpy change (∆H◦) and, entropy change (∆S◦) were calculated to evaluate the thermodynamic feasibility and the spontaneous nature of the process. The change in enthalpy (∆H◦) and entropy (∆S◦) are calculated using the van’t Hoff [47, 48]: ln kc = ∆S◦ /R-∆H◦ /RT (10) where kc = Fe/(1 - Fe), and Fe = (Co - Ce)/ Co; is the fraction adsorbed at equilibrium, while T is the temperature in degree K and R is the gas constant
[8.314 J/mol K)]. From the slope and the intercept of van’t Hoff plots, the values of ∆H◦ and ∆S◦ were computed The Gibbs free energy change (∆G◦) was calculated using the following equation [49]: ∆G◦ = -RT lnkc (11)
The magnitude of activation energy (Ea) gives an idea about the type of adsorption which is mainly diffusion-controlled processes or chemical reaction processes. Energies of activation below 42 kJ mol_1 generally indicate diffusion-controlled processes and higher values represent chemical reaction processes [50–53]. This is because the temperature dependence of the pore diffusivity is relatively weak. Here, the diffusion process refers to the movement of the solute to an external surface of adsorbent and not diffusivity of material along micropore wall surfaces in a particle [54]. Energy of activation, Ea, was calculated according to a relationship between Ea and ∆H◦ for reactions in solution using the following equation [55]: Ea =∆H◦ + RT (12) 3. Results and discussion 3.1. Characterization of adsorbing material. 3.1.1. Thermogravimetric analysis TGA
The thermal stability of HOSD and HOSDC were evaluated by Thermo Gravimetric Analysis TGA using Thermo Gravimetric Analyzer Shimadzu TGA-50 Japan. Fig. (4-a) showed the TGA of HOSD, the main step began at 32oC and ended at 98oC is attributed to the loss of surface adsorbed water in HOSD structure and the weight loss is 6.12% the second main step began at 220oC and ended at 774oC is corresponding to loss of all the organic constituents in the HOSD. Fig. (4-b) showed the TGA pattern of the prepared HOSDC which contained three main steps. The first step began at 23oC and ended at 132oC which was explained by the removal of external water molecules together with degradation of alginate chain and it is interpreted with second degradation temperature due to elimination of side-groups of polymer [56]. The third step is obviously due to the complete loss of the organic components and it started at 395oC and ended at 657oC [57]. 3.1.2. FTIR analysis FTIR analysis was performed on both HOSD and HOSDC using Fourier transfer for infrared spectrophotometer FTIR-8400 S Shimadzu, Japan. The saponification process of the wood fiber using base cause increase of the cation sorption capacity of wood fiber which could be explained by production of carboxylate groups instead of ester groups which can bind cations as shown in the following Eq. (13) [58]:

Journal of American Science 2010;6(6)
http://www.americanscience.org [email protected] 271
500 1500 2500 3500
wavenumber cm-1
Tra
nsm
itance
%
HOSDC
HOSD
R'COOR + H2O+ OH-→RCOO-+R'OH+ H2O (13)
The IR bands consisted of four regions: the broad hydrogen band (3200–3600 cm-1), C–H stretching region (2800–3000 cm-1), carbonyl group stretching region (1550–1750 cm-1), and fingerprint bands (below1550 cm-1). In finger print region absorption cannot clearly be assigned to any particular vibration because they correspond to complex interacting vibration systems. It can be observed from Fig.5 that the region between 1800 and 3500 cm_1 presents two major band centered at about 3420 cm_1 (the H-bonded OH group) and at 2921 cm-1 (the C–H stretching of the CH2 groups).this band shows markedly decrease in composite pattern which may be devoted to the restriction of stretching vibration of CH2 groups due to composite formation. The region between 1500 and 1800 cm-1 is a special range to evaluate the degree of saponification since this represents the carbonyl and double bond region [59–61]. As had been published by many authors [56, 57, 59–61], the wave number of the carboxyl acid groups in the organic compounds is approximately 1740 cm-
1. While the band wave number of the carboxylate ion groups is about 1620 cm-1. In this range, there are two bands centered at 1654 and 1749 cm-1, one of them at 1749 cm-1 and this band disappeared in composite and this could be explained by masking of carboxylic group by the presence of alginate structure, the other band exists in both HOSD and HOSDC at 1654 cm-1. 3.1.3. Scanning Electron Microscope SEM
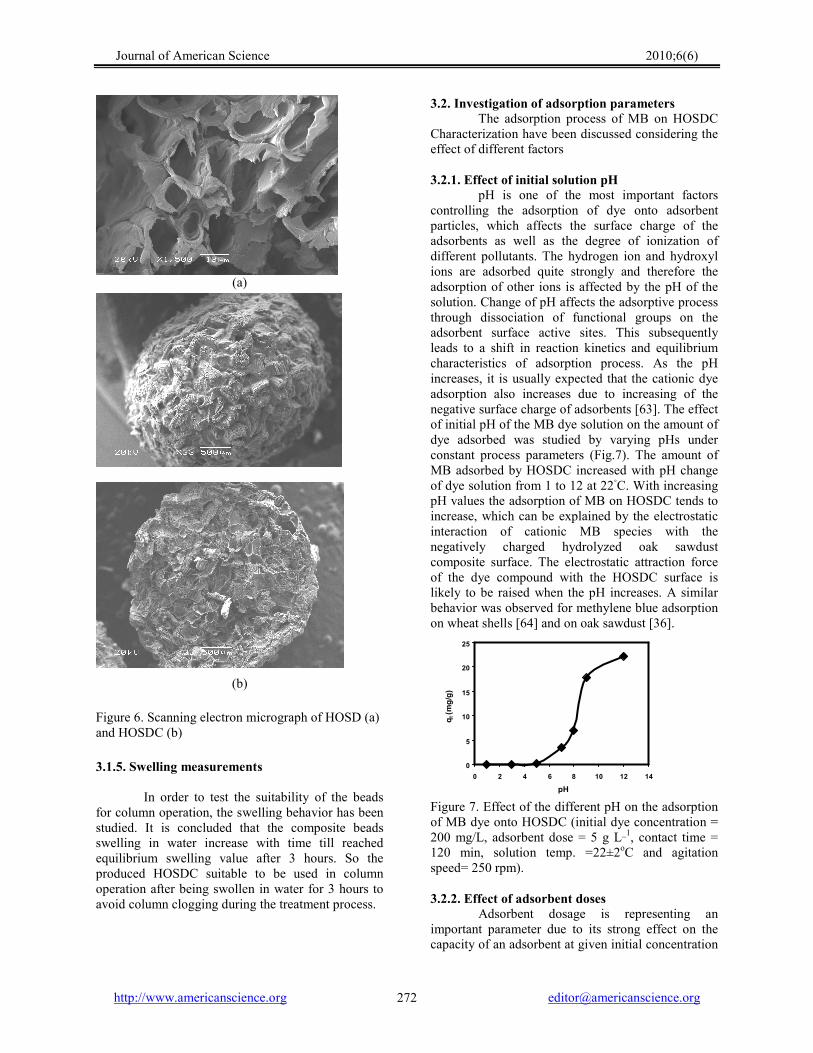
The morphology of HOSD and the prepared composite were investigated using Jeol JSM-6360 LA analytical Scanning Electron Microscope SEM. The samples were stocked over a holder and sprayed with gold. The samples were scanned to identify the structure and estimate the diameter of the composite. SEM photographs (Fig.6.a) show thin plant boundary walls due to the treatment and also a widening in the cavities which may explain the high efficiency of the treated Oak sawdust. It was shown in Fig. 6.b. that the composite prepared from HOSD and alginate mixture has almost uniform porosity with average pore diameter range 135 µm. The diameter of the composite beads ranged from 3-3.5 mm. 3.1.4. Turbidity measurements as a factor in mechanical strength
The beads produced from oak sawdust with alginate exhibited rubber like elastic properties, alginate improved the surface properties, reduced the tendency to agglomerate [62]. Although it is well known that alginate has bad mechanical properties, the mechanical properties of the composite were studied to determine its availability for the column operations. It is obvious, from water turbidity
measurements after stirring for different time intervals, that the beads of the prepared composite have excellent mechanical strength under stirring for 65 hours at 1000 rpm.
02468
1012
0 200 400 600 800 1000 1200Temperature (oC)
TG
A
(mg
)
HOSD
(a)
0
2
4
6
8
10
0 200 400 600 800 1000Temperature (oC)
TG
A (
mg
)
HOSDC
(b)
Figure 4. Thermogravemetric analysis of HOSD (a) and HOSDC (b)
Figure 5. FTIR Spectra of HOSD and HOSDC
Journal of American Science 2010;6(6)
http://www.americanscience.org [email protected] 272
(a)
(b)
Figure 6. Scanning electron micrograph of HOSD (a) and HOSDC (b)
3.1.5. Swelling measurements In order to test the suitability of the beads for column operation, the swelling behavior has been studied. It is concluded that the composite beads swelling in water increase with time till reached equilibrium swelling value after 3 hours. So the produced HOSDC suitable to be used in column operation after being swollen in water for 3 hours to avoid column clogging during the treatment process.
3.2. Investigation of adsorption parameters The adsorption process of MB on HOSDC
Characterization have been discussed considering the effect of different factors 3.2.1. Effect of initial solution pH
pH is one of the most important factors controlling the adsorption of dye onto adsorbent particles, which affects the surface charge of the adsorbents as well as the degree of ionization of different pollutants. The hydrogen ion and hydroxyl ions are adsorbed quite strongly and therefore the adsorption of other ions is affected by the pH of the solution. Change of pH affects the adsorptive process through dissociation of functional groups on the adsorbent surface active sites. This subsequently leads to a shift in reaction kinetics and equilibrium characteristics of adsorption process. As the pH increases, it is usually expected that the cationic dye adsorption also increases due to increasing of the negative surface charge of adsorbents [63]. The effect of initial pH of the MB dye solution on the amount of dye adsorbed was studied by varying pHs under constant process parameters (Fig.7). The amount of MB adsorbed by HOSDC increased with pH change of dye solution from 1 to 12 at 22◦C. With increasing pH values the adsorption of MB on HOSDC tends to increase, which can be explained by the electrostatic interaction of cationic MB species with the negatively charged hydrolyzed oak sawdust composite surface. The electrostatic attraction force of the dye compound with the HOSDC surface is likely to be raised when the pH increases. A similar behavior was observed for methylene blue adsorption on wheat shells [64] and on oak sawdust [36]. Figure 7. Effect of the different pH on the adsorption of MB dye onto HOSDC (initial dye concentration = 200 mg/L, adsorbent dose = 5 g L_1, contact time = 120 min, solution temp. =22±2oC and agitation speed= 250 rpm). 3.2.2. Effect of adsorbent doses
Adsorbent dosage is representing an important parameter due to its strong effect on the capacity of an adsorbent at given initial concentration
0
5
10
15
20
25
0 2 4 6 8 10 12 14
pH
qt (m
g/g
)

Journal of American Science 2010;6(6)
http://www.americanscience.org [email protected] 273
of the adsorbate. Fig. 8 shows that the increase in adsorbent dosage from 0.5 to 10 g/L resulted in a decrease of uptake capacity from 53.51 to 11.37 mg/g.
The adsorption capacity was found to be high at low dosages. Many factors can contribute to this adsorbent concentration effect. The most important factor is that adsorption sites remain unsaturated during the adsorption reaction. This decrease in adsorption capacity with the increase in the adsorbent dosage is mainly attributed to the non-saturation of the adsorption sites during the adsorption process [65, 66].This result confirms the previously studies concerning the removal of unwanted materials from aqueous solution by sawdust [35]. Figure.8. Effect of adsorbent dose on the adsorption of MB dye onto HOSDC (initial dye concentration =200 mg/L, contact time = 120 min, pH= 12, solution temp. = 22 ±2OC and agitation speed = 250 rpm) 3.2.3. Agitation speed
Agitation is an important parameter in sorption phenomena, which has a serious action on the distribution of the solute in the bulk solution and the formation of the external boundary film. The effect of agitation speed (in rpm) on the up take capacity of the original dye concentration was investigated in Fig. 9. The up take capacity seemed to be affected by the agitation speed for values between 0 and 250 rpm, thus confirming that the influence of external diffusion on the sorption kinetic control plays a significant role. Also it is clear that while increasing mixing rate from 250 to 400 rpm, uptake capacity (qt mg/g) decreased from 22.4 to 11.92 mg/g. This decrease in uptake capacity (qt mg/g) may be attributed to an increase desorption tendency of dye molecules and/or having similar speed of adsorbent particles and adsorbate ions (i.e. the formation of a more stable film around the adsorbent particles). This desorption tendency may be attributed to high mixing speed which means more energy input and higher shear force causing break of bounds between MB and the adsorbent . This also indicates that a 250 rpm shaking rate is sufficient to assure that all the surface binding sites are made readily
available for dye uptake. Then the effect of external film diffusion on adsorption rate can be assumed to be not significant. The results were in agreement with Batzias F.A., and D.K. Sidiras [24]. Figure 9. Effect of agitation speed on the adsorption of MB dye onto HOSDC (initial dye concentration =200 mg/L, contact time = 120 min, pH= 12, solution temp. = 22 ±2OC and adsorbent dose=5g/L) 3.2.4. Binding polymer
The effect of binding polymer on the dye removal has been studied as show in Fig. 10. The alginate matrix has low efficiency toward MB removal. On the other hand, the presence of the polymer matrix decrease the percentage dye removal than the free HOSD which may be due to some of the composite area is now not available. The percentage removal decreased from 89.7% to 72.75% after 270 min, upon using composite beads instead of free HOSD. However the adsorption rate decreased through the first adsorption hour may be due to the diffusion limitation of dyes through the composite beads to reach the active adsorption sites (hydrolyzed oak sawdust). As the mean reason for such research is to overcome handling problems of classic adsorbents such as sawdust by converting them into composites. Although the polymeric composite sawdust has lower removal efficiency than sawdust but the advantage of using the composite make this difference disregarded. Figure 10. Effect of binding polymer on the percentage dye removal (initial dye concentration =200 mg/L contact time up to 330 min, pH= 12, solution temp. = 22 ±2OC and agitation speed = 250 rpm).
0
10
20
30
40
50
60
0 2 4 6 8 10 12 14
Adsoebent dose (g/L)
q t (m
g/g)
0
5
10
15
20
25
0 100 200 300 400
Agitation speed(rpm)
qt
(mg/g
)
Journal of American Science 2010;6(6)
http://www.americanscience.org [email protected] 274
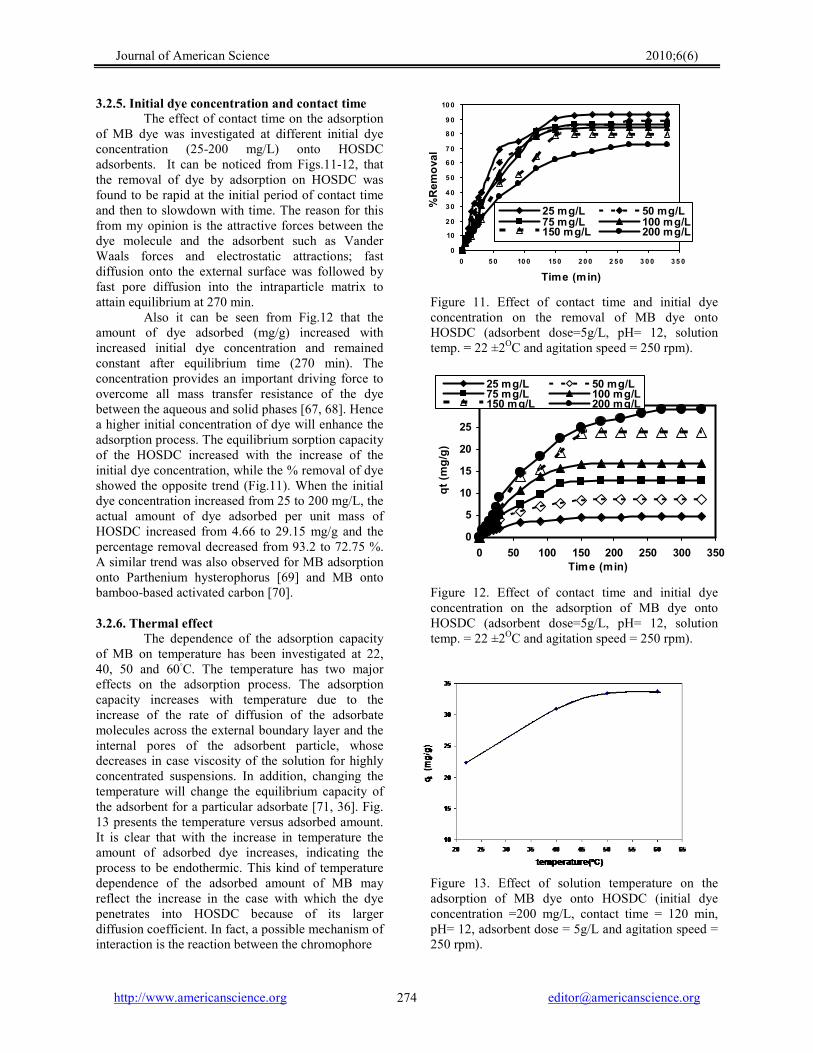
3.2.5. Initial dye concentration and contact time The effect of contact time on the adsorption
of MB dye was investigated at different initial dye concentration (25-200 mg/L) onto HOSDC adsorbents. It can be noticed from Figs.11-12, that the removal of dye by adsorption on HOSDC was found to be rapid at the initial period of contact time and then to slowdown with time. The reason for this from my opinion is the attractive forces between the dye molecule and the adsorbent such as Vander Waals forces and electrostatic attractions; fast diffusion onto the external surface was followed by fast pore diffusion into the intraparticle matrix to attain equilibrium at 270 min.
Also it can be seen from Fig.12 that the amount of dye adsorbed (mg/g) increased with increased initial dye concentration and remained constant after equilibrium time (270 min). The concentration provides an important driving force to overcome all mass transfer resistance of the dye between the aqueous and solid phases [67, 68]. Hence a higher initial concentration of dye will enhance the adsorption process. The equilibrium sorption capacity of the HOSDC increased with the increase of the initial dye concentration, while the % removal of dye showed the opposite trend (Fig.11). When the initial dye concentration increased from 25 to 200 mg/L, the actual amount of dye adsorbed per unit mass of HOSDC increased from 4.66 to 29.15 mg/g and the percentage removal decreased from 93.2 to 72.75 %. A similar trend was also observed for MB adsorption onto Parthenium hysterophorus [69] and MB onto bamboo-based activated carbon [70]. 3.2.6. Thermal effect
The dependence of the adsorption capacity of MB on temperature has been investigated at 22, 40, 50 and 60◦C. The temperature has two major effects on the adsorption process. The adsorption capacity increases with temperature due to the increase of the rate of diffusion of the adsorbate molecules across the external boundary layer and the internal pores of the adsorbent particle, whose decreases in case viscosity of the solution for highly concentrated suspensions. In addition, changing the temperature will change the equilibrium capacity of the adsorbent for a particular adsorbate [71, 36]. Fig. 13 presents the temperature versus adsorbed amount. It is clear that with the increase in temperature the amount of adsorbed dye increases, indicating the process to be endothermic. This kind of temperature dependence of the adsorbed amount of MB may reflect the increase in the case with which the dye penetrates into HOSDC because of its larger diffusion coefficient. In fact, a possible mechanism of interaction is the reaction between the chromophore
Figure 11. Effect of contact time and initial dye concentration on the removal of MB dye onto HOSDC (adsorbent dose=5g/L, pH= 12, solution temp. = 22 ±2OC and agitation speed = 250 rpm). Figure 12. Effect of contact time and initial dye concentration on the adsorption of MB dye onto HOSDC (adsorbent dose=5g/L, pH= 12, solution temp. = 22 ±2OC and agitation speed = 250 rpm). Figure 13. Effect of solution temperature on the adsorption of MB dye onto HOSDC (initial dye concentration =200 mg/L, contact time = 120 min, pH= 12, adsorbent dose = 5g/L and agitation speed = 250 rpm).
0
10
20
30
40
50
60
70
80
90
100
0 50 100 150 200 2 50 3 00 35 0
Time (min)
%R
emova
l
25 mg/L 50 mg/L75 mg/L 100 mg/L150 mg/L 200 mg/L
0
5
10
15
20
25
30
0 50 100 150 200 250 300 350Time (min)
qt (m
g/g
)
25 mg/L 50 mg/L75 mg/L 100 mg/L150 mg/L 200 mg/L

Journal of American Science 2010;6(6)
http://www.americanscience.org [email protected] 275
groups such as alcoholic, carbonylic and phenolic of the HOSDC and the cationic group in the dye molecule; such a reaction could be favored at higher temperatures. Hydrogen bond can occur between OH groups of HOSDC and nitrogen atom of dye; electrostatic attractive forces between cationic dye ions and the surface of HOSDC as depending on pH [72]. 3.3. Isotherm analysis
Equilibrium data, commonly known as adsorption isotherms, are basic requirements for the design of adsorption systems [73]. In this work, the equilibrium data for MB on hydrolyzed oak sawdust composite were modeled with the Langmuir, Freundlich and Temkin models. The linear plot of specific adsorption (Ce / qe) against the equilibrium concentration (Ce), (Fig. 14) shows that the adsorption obeys the Langmuir model. The Langmuir constants qm and Ka were determined from the slope and intercept of the plot and are presented in Table 1. The value of the correlation coefficient (R2 = 0.97 obtained from Langmuir expression indicates that Langmuir expression provided a good linearity.
The essential characteristics of the Langmuir isotherm can be expressed in terms of a dimensionless constant separation factor RL that is given by the following equation [74]: RL = 1/ (1+ Ka Co) (14) where C0 (mg/L) is the initial concentration of adsorbate, and Ka (L/mg) is Langmuir constant. The value of RL indicates the shape of the isotherm which is unfavorable (RL > 1), linear (RL = 1), favorable (0 < RL < 1), or irreversible (RL = 0). The RL values for the adsorption of MB onto HOSDC (Table 2) are observed to be in the range 0–1, indicating that the adsorption was a favorable process. The equilibrium data were further analyzed using the linearized form of Freundlich isotherm, by plotting log qe versus log Ce (Fig. 15). The calculated Freundlich isotherm constants (KF, n) and the corresponding coefficient of correlation, R2 are shown in Table 1.
The coefficient of correlation is (R2 = 0.99) which expressing an agreement with the experimental data of MB on HOSDC. The result shows that the value of n is greater than unity (n = 1.818) indicating that the dye is favorably adsorbed on HOSDC. This is in great agreement with the findings regarding to RL value. The magnitude of Freundlich constant indicates easy uptake of MB from aqueous solution. The adsorption data for MB on HOSDC were analyzed by a regression analysis to fit the Temkin isotherm model (Fig. 16). The parameters of Temkin model as well as the correlation coefficient are listed in Table 1. The coefficient of correlation was (R2 = 0.83) showing the poorest fit to the experimental
adsorption equilibrium data. Considering that Langmuir isotherm assumes a monolayer coverage and uniform activity distribution on the adsorbent surface, this is an expected result. But adsorption of methylene blue is quite a complex process, probably forming multi layers and even closing some of the pores. Also, a variation of sorption activity is expected with surface coverage.
So it can be conclude that the Freundlich isotherm model was more suitable for the experimental data than other isotherms because of the high value of correlation coefficient (R2 = 0.99). A similar result was reported for MB adsorption on granular and powdered activated carbon [75].
Figure.14. Langmuir isotherm plot for adsorption of MB dye onto HOSDC. Figure 15. Freundlich isotherm plot for adsorption of MB dye onto HOSDC. Figure 16. Temkin isotherm plot for adsorption of MB dye onto HOSDC.
y = 0.026x + 0.4853R2 = 0.9657
0
0 . 5
1
1 . 5
2
0 1 0 2 0 3 0 4 0 5 0 6 0
ce (mg/L)c e
/qe
y = 0.5495x + 0.5368R2 = 0.9888
0 . 5
0 . 7
0 . 9
1. 1
1. 3
1. 5
1. 7
0 0 .5 1 1.5 2
log ce
log q
e
y = 7.2298x - 2.9616R2 = 0.8304
0
5
10
15
20
25
30
0 0.5 1 1.5 2 2.5 3 3.5 4 4.5
ln ce
qe (m
g/g
)

Journal of American Science 2010;6(6)
http://www.americanscience.org [email protected] 276
Table 1. Isotherms parameters for removal of MB on HOSDC.
Isotherms Parameters Value Langmuir
qm (mg/g) 38.46 ka (L/mg) 0.0536 R2 0.97
Freundlich
KF(mg/g(L/g)1/n) 3.442 1/n 0.55 R2 0.99
Temkin
A (L/g) 0.664 B (J/mol) 7.23 R2 0.83
Table 2. RL values for different concentrations
Dye concentration (mg/L) Value of RL 25 0.427 50 0.272 75 0.199 100 0.157 150 0.111 200 0.085
3.4. Adsorption kinetics
Adsorption is a physiochemical process that involves the mass transfer of a solute (adsorbate) from the liquid phase to the adsorbent surface. A study of kinetics of adsorption is desirable as it provides information about the mechanism of adsorption, which is important for efficiency of the process. The applicability of the pseudo-first order and pseudo-second-order was tested for the adsorption of MB onto HOSDC. The best-fit model was selected based on the linear regression correlation coefficient, R2, values.
The kinetics of MB adsorption on HOSDC was studied at different initial concentrations. Using Eq. (7), ln (qe − qt) versus t was plotted at different MB concentrations and is shown in Fig. 17.The Lagergren first-order rate constant (k1) and qe,cal determined from the model are presented in Table 3 along with the corresponding correlation coefficients. In spite of correlation coefficients R2 ≥ 0.88 for all initial MB concentrations studied, the first order kinetic models is not suitable for the data, as is shown in Fig.17. which indicates that ln (qe − qt) is slightly increased after 180 min. The first order model clearly does not fit in the region when the time is larger than 180 min. Therefore, the experimental kinetic data were further analyzed using the pseudo-second-order model. By plotting t/qt against t for different initial MB concentrations (Fig. 18), a straight line was obtained in all cases and using Eq. (8) the second order rate constant (k2) and qe were
determined from the plots. The qe,cal values along with correlation coefficients for the pseudo-second-order models are shown in Table 3.It can be noticed that k2 decreases with increasing initial MB concentration.
The decrease in the rate of MB removal with increasing initial MB concentration may be due to decreasing MB diffusivity as a result of the association of dye molecules to form bulky aggregates which becomes more pronounced at high dye concentration [76]. The model fits the kinetic data very well with R2 ≥0.94, which is better than pseudo-first, order kinetic (Table 3). These results suggest that the adsorption of MB on HOSDC may be best described by the pseudo-second-order kinetic model with high correlation coefficients.A number of authors have reported pseudo-second-order kinetics for adsorption of methylene blue on wheat shells [77], palygorskite [78] and dehydrated wheat bran carbon [5].
The half-adsorption time, t0.5, is defined as the time required for the adsorption to take up half as much HOSDC as its equilibrium value. The half-adsorption time is often used as a measure of the adsorption rate and was calculated using the following equation [79]: t0.5 = 1/ k2 qe (15) The diffusion coefficient largely depends on the surface properties of adsorbents. The diffusion coefficient for the intra particle transport of different initial concentrations of MB were also calculated using the following relationship [80]: t0.5 =0.03ro
2 /D (16) where t0.5 is the half life in seconds as calculated from Eq. (15), ro the radius of the adsorbent particle in centimeters and D is the diffusion coefficient value in cm2/s. In these calculations, it has been assumed that the solid phase consists of spherical particles with an average radius between the radii corresponding to upper- and lower-size fractions. The value of ro was calculated to be 1.625×10⁻¹ cm for HOSDC samples. Calculated values of t0.5 and D are given in Tables 3. Pore diffusion coefficient was found to be in the order of 10-7 cm2 s-1 as illustrated in table 3, which indicating that the rate-controlling step is mainly pore diffusion [45,81-82] because the overall rate of the removal process is controlled by whichever is the slowest process.
The pseudo-first-order and pseudo-second-order kinetic models could not identify the diffusion mechanism. Thus the kinetic results were then analyzed by using the intraparticle diffusion model. Fig. 19 represents the dependence of the amount of the dye adsorbed at time t (qt ) on the square root of time(t0.5) this dependence had been used before by Weber and Moris [45] to investigate intraparticle

Journal of American Science 2010;6(6)
http://www.americanscience.org [email protected] 277
diffusion mechanism. For intraparticle diffusion model, Ho [83] pointed out that it is essential for the qt versus t0.5plots to go though the origin if the intraparticle diffusion is the sole rate-limiting step. The intraparticle diffusion plots are given in Figure 19 for different initial MB concentration. The linearity of the plots demonstrated that intraparticle diffusion played a significant role in the uptake of MB by HOSDC. In the present study, any plot did not pass through the origin. This indicates that although intraparticle diffusion was involved in the adsorption process, it was not the sole rate-controlling step. This also confirms that adsorption of MB on the adsorbent was a multi-step process, involving adsorption on the external surface and diffusion into the interior [84].
From the previous figure, the sorption process tends to be followed by two phases. It was found that an initial linear portion ended with a smooth curve followed by a second linear portion. The two phases in the intraparticle diffusion plot suggest that the sorption process proceeds by surface sorption and the intraparticle diffusion. The initial curved portion of the plot indicates boundary layer effect while the second linear portion is due to intraparticle or pore diffusion. The slope of second linear portion of the plot has been defined as the intraparticle diffusion parameter ki2 [85]. Table 4 shows the corresponding model fitting parameters, indicating the adsorption mechanism follows the intraparticle diffusion process. It was found that the values of ki2 increased with increasing initial MB concentration. The driving force of diffusion is very important for adsorption processes. Generally, the driving force changes with the adsorbate concentration in the bulk solution. The increase of adsorbate concentration results in an increase of the driving force, which will increase the diffusion rate of MB [86].On the other hand, the intercept of the plot reflects the boundary layer effect. Larger the intercept, greater is the contribution of the surface sorption in the rate-limiting step. The calculated intraparticle diffusion coefficient ki2 value at different initial dye concentrations was shown in Table 4. 3.5. Adsorption mechanism
The prediction of the rate-limiting step is an important factor to be considered in sorption process. For solid–liquid sorption process, the solute transfer process was usually characterized by either external mass transfer (boundary layer diffusion) or intraparticle diffusion or both. The mechanism for the removal of MB by adsorption may be assumed to involve the following steps [87]:
1. Migration of dye from the bulk of the solution to the surface of adsorbent.
2. Diffusion of dye through the boundary layer to the surface of adsorbent.
3. Adsorption of dye at an active site on the surface of adsorbent.
4. Intraparticle diffusion of dye into the interior pore structure of adsorbent.
The boundary layer resistance will be affected by the rate of adsorption and increase in contact time, which will reduce the resistance and increase the mobility of dye during adsorption [77]. Figure 17. First-order plots of MB dye adsorption onto HOSDC. Figure 18. Second-order plots of MB dye adsorption onto HOSDC Figure 19. Intra-particle diffusion plots of MB dye adsorption onto HOSDC
- 6
- 5
- 4
- 3
- 2
- 1
0
1
2
3
4
0 30 6 0 9 0 120 150 180 2 10 24 0 27 0 30 0 330
Time (min)ln
(q
e-q)
25 mg/L 50 mg/L75 mg/L 100 mg/L150 mg/L 200 mg/L
0102030405060708090
100
0 30 60 90 120
150
180
210
240
270
300
330
Time (min)
t/q
t (m
in.g
/mg)
25 mg/L 50 mg/L75 mg/L 100 mg/L150 mg/L 200 mg/L
0
5
1 0
1 5
2 0
2 5
3 0
1 . 5 6 . 5 1 1 . 5 1 6 . 5 2 1 . 5
t0.5 (min0.5 )
qt (
mg/g
)
25 mg/L 50 mg/L75 mg/L 100 mg/L150 mg/L 200 mg/L

Journal of American Science 2010;6(6)
http://www.americanscience.org [email protected] 278
3.6. Thermodynamics studies The thermodynamic parameters for the
sorption of MB onto HOSDC at various temperatures were calculated and listed in Table 5. The values of ∆H◦ and ∆S◦ have been computed from the slope and the intercept of the plot of ln kc vs. 1/T (Fig. 20) which gives a straight line with acceptable coefficient of determination (R2), while the Gibbs free energy change ∆G◦ was calculated using eq. (11). The value of ∆H◦ was positive, indicated that the adsorption reaction was endothermic. The positive value of ∆S◦ shows that increasing randomness at the solid/liquid interface during the adsorption of MB on HOSDC. The negative values of ∆G◦ indicate the spontaneous nature of adsorption with a high preference of methylene blue onto HOSDC. The decrease in the negative value of ∆G◦ with an increase in temperature indicates that the adsorption process of methylene blue on HOSDC becomes more favorable at higher temperatures [88]. In this study, the activation energy values were higher than 42kJ mol-1 as presented in Table5 indicating chemically controlled process; also the high values of the activation energy indicated that diffusion is not a limiting factor controlling the rate of adsorption. Consequently, adsorption of MB dye by HOSDC appears to occur by chemisorption Spontaneous and endothermic adsorption has also been reported for the system of basic dyes on tree fern [89], wheat shell [90], and mansonia wood sawdust [91]. Figure 20. Effect of temperature on MB kinetic sorption for HOSDC (initial dye concentration = 200mg/L, adsorbent dose = 5 g/ L, pH =12, contact time = 270 min and agitation speed = 250 rpm). 3.7. Single-stage batch adsorber
Adsorption isotherm studies can also be used to predict the design of single stage batch adsorption systems [92-94]. The schematic diagram for a single-stage adsorption process is shown in Fig. 21. The solution to be treated contains V (L) of water and an initial MB concentration Co (200 mg/L),
which is to be reduced to Ce in the adsorption process. In the treatment stage, the amount ofadsorbent W (g) added is added to solution and the dye concentration on the solid changes from q0 =0 to qe. The mass balance for the dye in the single stage is given by V(Co − Ce) = W(qe − qo) = W qe (15) The Freundlich isotherm data may now be applied to Eq. (15) since the Freundlich isotherm gave well fit to experimental data. W/V= (Co - Ce ) / KF Ce
1/n (16) Fig.22 shows a series of plots derived from
Eq. (16) for the adsorption of MB on the adsorbent and depicts the amount of effluent which can be treated to reduce the MB content by 90, 80, 70, 60 and 50% using various masses of adsorbent. Figure 21. A single-stage batch adsorber. Figure 22. Volume of effluent treated against adsorbent dose for different percentages of MB removal.
y = -5.9843x + 21.37R2 = 0.982
0.7
1.2
1.7
2.2
2.7
3.2
3.7
2.9 3 3.1 3.2 3.3 3.4
1000/T
ln K
C
V, L of solvent Co mg of solute/L of
solvent
qe, mg of solute/g of adsorbent W, g of
adsorbent
qo, mg of solute/g of adsorbent W, g of
adsorbent
V, L of solvent Ce mg of solute/L of
solvent
Journal of American Science 2010;6(6)
http://www.americanscience.org [email protected] 279
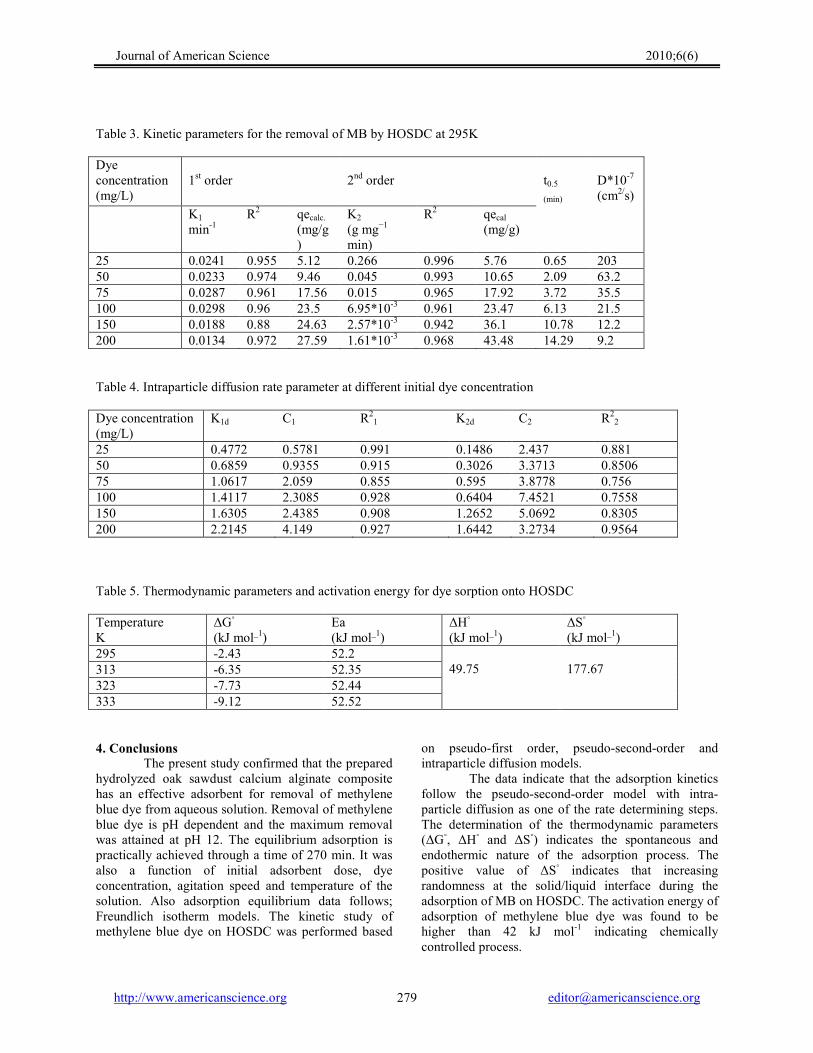
Table 3. Kinetic parameters for the removal of MB by HOSDC at 295K Dye concentration (mg/L)
1st order
2nd order
t0.5
(min)
D*10-7
(cm2/s) K1
min-1 R2 qecalc.
(mg/g)
K2 (g mg−1 min)
R2 qecal
(mg/g)
25 0.0241 0.955 5.12 0.266 0.996 5.76 0.65 203 50 0.0233 0.974 9.46 0.045 0.993 10.65 2.09 63.2 75 0.0287 0.961 17.56 0.015 0.965 17.92 3.72 35.5 100 0.0298 0.96 23.5 6.95*10-3 0.961 23.47 6.13 21.5 150 0.0188 0.88 24.63 2.57*10-3 0.942 36.1 10.78 12.2 200 0.0134 0.972 27.59 1.61*10-3 0.968 43.48 14.29 9.2 Table 4. Intraparticle diffusion rate parameter at different initial dye concentration Dye concentration (mg/L)
K1d C1 R21 K2d C2 R2
2
25 0.4772 0.5781 0.991 0.1486 2.437 0.881 50 0.6859 0.9355 0.915 0.3026 3.3713 0.8506 75 1.0617 2.059 0.855 0.595 3.8778 0.756 100 1.4117 2.3085 0.928 0.6404 7.4521 0.7558 150 1.6305 2.4385 0.908 1.2652 5.0692 0.8305 200 2.2145 4.149 0.927 1.6442 3.2734 0.9564 Table 5. Thermodynamic parameters and activation energy for dye sorption onto HOSDC Temperature K
∆G◦ (kJ mol_1)
Ea (kJ mol_1)
∆H◦
(kJ mol_1) ∆S◦ (kJ mol_1)
295 -2.43 52.2 49.75
177.67 313 -6.35 52.35
323 -7.73 52.44 333 -9.12 52.52 4. Conclusions
The present study confirmed that the prepared hydrolyzed oak sawdust calcium alginate composite has an effective adsorbent for removal of methylene blue dye from aqueous solution. Removal of methylene blue dye is pH dependent and the maximum removal was attained at pH 12. The equilibrium adsorption is practically achieved through a time of 270 min. It was also a function of initial adsorbent dose, dye concentration, agitation speed and temperature of the solution. Also adsorption equilibrium data follows; Freundlich isotherm models. The kinetic study of methylene blue dye on HOSDC was performed based
on pseudo-first order, pseudo-second-order and intraparticle diffusion models.
The data indicate that the adsorption kinetics follow the pseudo-second-order model with intra-particle diffusion as one of the rate determining steps. The determination of the thermodynamic parameters (∆G◦, ∆H◦ and ∆S◦) indicates the spontaneous and endothermic nature of the adsorption process. The positive value of ∆S◦ indicates that increasing randomness at the solid/liquid interface during the adsorption of MB on HOSDC. The activation energy of adsorption of methylene blue dye was found to be higher than 42 kJ mol-1 indicating chemically controlled process.

Journal of American Science 2010;6(6)
http://www.americanscience.org [email protected] 280
Corresponding Author: Associate Prof. .Mona Mahmoud Abd El-Latif M.M.Abd El-Latif, Vice Dean of advanced technology and New Materials institute. Mubarak City for Scientific Research and Technology Applications. Address: Universities and research center District, New Borg El Arab, Alexandria, Egypt. P.O.Box: 21934 Alex. Tel.: +2034593414 Fax: +2034593414 E-mail: [email protected] References 1. M´etivier-Pignon H, Faur-Brasquet C, Cloirec PL.
Adsorption of dyes onto activated carbon cloths: approach of adsorption mechanisms and coupling of ACC with ultra filtration to treat coloured wastewaters, Sep. Purif. Technol. 2003; 31: 3–11.
2. Ravikumar K, Deebika B, Balu K.. Decolourization of aqueous dye solutions by a novel adsorbent: application of statistical designs and surface plots for the optimization and regression analysis, J. Hazard. Mater. 2005; 122: 75–83.
3. Lee JW., Choi SP, Thiruvenkatachari R, Shim WG, Moon H. Evaluation of the performance of adsorption and coagulation processes for the maximum removal of reactive dyes, Dyes Pigm. 2006; 69: 196–203.
4. Ghosh D, Bhattacharyya KG. Adsorption of methylene blue on kaolinite, Appl. Clay Sci. 2002; 20: 295–300.
5. Ozer A, Dursun G. Removal of methylene blue from aqueous solution by dehydrated wheat bran carbon, J. Hazard. Mater. 2007; 146: 262–269.
6. Wang SB, Zhu ZH. Characterization and environmental application an Australian natural zeolite for basic dye removal from aqueous solution, J. Hazard. Mater. 2006: 136: 946–952.
7. Gupta VK, Mittal A, Krishnan L, Gajbe V. Adsorption kinetics and column operations for the removal and recovery of malachite green from wastewater using bottom ash, Sep. Purif. Technol. 2004; 40: 87–96.
8. Meshko V, Markovska L, Mincheva M, Rodrigues AE. Adsorption of basic dyes on granular activated carbon and natural zeolite, Water Res., 2001; 35 (14): 3357–3366.
9. Forgacs E, Cserh´ ati T, Oros G. Removal of synthetic dyes from wastewaters: a review, Environ. Int. 2004; 30: 953–971.
10. Kadirvelu K, Palanival M, Kalpana R, Rajeswari S. Activated carbon from an agricultural by-product for the treatment of dyeing industry
wastewater, Bioresour. Technol., 2000; 74: 263-265.
11. Wang CC, Juang LC, Hsu TC, Lee CK, Lee JF, Huang FC. Adsorption of basic dyes onto montmorillonite, J Colloid Interface Sci. 2004; 273: 80–86.
12. Wang SB, Li H. Dye adsorption on unburned carbon: kinetics and equilibrium, J. Hazard .Mater. 2005; 126: 71–77.
13. Janos P, Buchtova H, Ryznarova M. Sorption of dye from aqueous solution onto fly ash, Water Res. 2003; 37: 4938–4944.
14. Mall ID, Srivastava C, Agarwa NK. Removal of Orange-G and Methyl Violet dyes by adsorption onto bagasse fly ash – kinetic study and equilibrium isotherm analyses, Dyes Pigm. 2006; 69: 210–223.
15. Chander M, Arora DS. Evaluation of some white-rot fungi for their potential to decolourise industrial dyes. Dyes Pigm. 2007; 72: 192–198.
16. Robinson T, Chandran P, Nigam P. Removal of dyes from a synthetic textile dye effluent by biosorption on apple pomace and wheat straw, Water Res. 2002; 36: 2824–2830.
17. Gong R, Jin Y, Chen J, Hu Y, Sun J. Removal of basic dye from aqueous solution by sorption on phosphoric acid modified rice straw, Dyes Pigm., 2007; 73: 332–337.
18. Tsai WT, Chang CY, Lin MC, Chien SF, Sun HF, Hsieh MF. Adsorption of acid dye onto activated carbon prepared from agricultural waste bagasse by ZnCl2 activation, Chemosphere 2001; 45: 51–58.
19. Namasivayam C, Kavitha D. Removal of Congo Red from water by adsorption onto activated carbon prepared from coir pith, an agricultural solid waste, Dyes Pigm. 2002; 54: 47–58.
20. Mittala A, Krishnana L, Gupta VK. Removal and recovery of malachite green from wastewater using an agricultural waste material, de-oiled soya, Sep. Purif. Technol. 2005; 43: 125–33.
21. Batzias FA, Sidiras DK. Dye adsorption by calcium chloride treated beech sawdust in batch and fixed-bed systems, J. Hazard. Mater. 2004; 114: 167–174.
22. Batzias FA, Sidiras DK. Simulation of dye adsorption by beech sawdust as affected by pH, J. Hazard. Mater. 2007; 141: 668–679.
23. Batzias FA, Sidiras DK. Simulation of methylene blue adsorption by salts treated beech sawdust in batch and fixed-bed systems, J. Hazard. Mater. 2007; 149: 8–17.
24. Batzias FA, Sidiras DK. Dye adsorption by prehydrolysed beech sawdust in batch and fixed-bed systems, Bioresour. Technol. 2007; 98: 1053-1062

Journal of American Science 2010;6(6)
http://www.americanscience.org [email protected] 281
25. Kumar VK, Sivanesan S. Isotherms for Malachite Green onto rubber wood (Hevea brasiliensis) sawdust: comparison of linear and non-linear methods, Dyes Pigm. 2007; 72: 124–129.
26. Ferrero F. Dye removal by low cost adsorbents: hazelnut shells in comparison with wood sawdust, J. Hazard. Mater. 2007; 142: 144–152.
27. Ozacar M, Sengil IA. Adsorption of metal complex dyes from aqueous solutions by pine sawdust, Bioresour. Technol. 2005; 96: 791–795.
28. Ozacar M, Sengil IA. A kinetic study of metal complex dye sorption onto pine sawdust, Process Biochem. 2005; 40: 565–572.
29. Hamdaoui O. Batch study of liquid-phase adsorption of methylene blue using cedar sawdust and crushed brick, J. Hazard. Mater. 2006; 135: 264–273.
30. Yeddou N, Bensmaili A. Kinetic models for the sorption of dye from aqueous solution by clay–wood sawdust mixture, Desalination 2005; 185: 499–508.
31. Garg VK, Amita M, Kumar R, Gupta R. Basic dye (methylene blue) removal from simulated wastewater by adsorption using Indian rosewood sawdust: a timber industry waste, Dyes Pigm. 2004; 63: 243–250.
32. Garg VK, Gupta R, Yadav A, Kumar K. Dye removal from aqueous solution by adsorption on treated sawdust, Bioresour. Technol. 2003; 89: 121-124.
33. Chakraborty S, De S, Basu JK, DasGupta S. Treatment of a textile effluent: application of a combination method involving adsorption and nanofiltration, Desalination 2005; 174: 73–85.
34. Safarik I, Safarikova M, Weyda F, Mosiniewicz-Szablewska E, Slawska- Waniewska A. Ferrofluid-modified plant-based materials as adsorbents for batch separation of selected biologically active compounds and xenobiotics, J. Magn. Magn. Mater. 2005; 293: 371–376.
35. Shukla A, Zhang YH, Dubey P, Margrave JL. The role of sawdust in the removal of unwanted materials from water, J. Hazard. Mater. 2002; B95:137–152.
36. Abd El-Latif MM, Ibrahim AM. Adsorption, kinetic and equilibrium studies on removal of basic dye from aqueous solutions using hydrolyzed oak sawdust, Desalination and Water Treatment 2009; 6:252–268.
37. Dulman V, Cucu-Man S, Popa VI. Sorption of some textile dyes by oak wood sawdust, Cell. Chem. Technol. 2002; 36:515–525.
38. Hitoshi M, Mikio S, Kenichi A, Yoshio O. Selective Uptake Of Cesium by ammonium molybdophosphate (AMP)- calcium alginate
composites, J. Nucl. Sci. Technol. 2001; 38: 872-878 .
39. Langmuir I. The constitution and fundamental properties of solids and liquids, J. Am. Chem. Soc. 1916; 38 (11): 2221–2295.
40. Freundlich HMF. Over the adsorption in solution, J. Phys. Chem. 1906; 57:385–470.
41. Temkin M J, Pyzhev V. Recent modifications to Langmuir isotherms, Acta Physiochim. URSS, 1940; 12: 217–222.
42. Ho YS, McKay G. Sorption of dye from aqueous solution by peat, Chem. Eng. J. 1998; 70: 115–124.
43. Lagergren S. About the theory of so-called adsorption of soluble substances, K. Sven. Vetenskapsakad. Handl. 1898; 24 (4): 1–39.
44. Ho YS, McKay G. Sorption of dye from aqueous solution by peat, Chem. Eng. J. 1978; 70: 115–124.
45. Weber WJ, Morris JC. Kinetics of adsorption on carbon from solution, J. Sanitary Eng. Div. Proc. Am. Soc. Civil Eng. 1963; 89: 31–59.
46. Markovska L, Meshko V, Noveski V, Marinovski M. Solid diffusion control of the adsorption of basic dyes onto granularactivated carbon and natural zeolite in fixed bed columns, J. Serbian Chem. Soc. 2001; 66:463-476 .
47. Martell AE, Smith RM. Critical Stability Constants: Inorganic Chemistry IV, Plenum, New York, 1977.
48. Murray JM Dillard JG. The oxidation of cobalt (II) adsorbed on manganese dioxide, Geochim. Cosmochim. Acta, 1979; 43:781-787.
49. Zuhra MG, Bhanger MI, Mubeena A, Farah NT, Jamil RM. Adsorption of methyl parathion pesticide from water using watermelon peels as a low cost adsorbent, Chem. Eng. J. 2008; 138: 616-621.
50. Sparks DL. Kinetics of ionic reactions in clay minerals and soils, Adv. Agron., 1985; 38:231-266.
51. Sparks DL. Kinetics of Soil Chemical Processes, Academic Press, San Diego, CA, 1989, pp. 35-57.
52. Sparks DL. Environmental Soil Chemistry, Academic Press, San Diego, CA, 1995, pp. 267-280.
53. Sparks DL. Kinetics of reactions in pure and mixed system, in: D.L. Sparks, ed., Soil Physical Chemistry, 2nd ed., CRC Press, Boca Raton, FL, 1999, pp. 83-178.
54. Al-Ghouti M, Khraisheh MAM, Ahmad MNM, Allen S. Thermodynamic behaviour and the effect of temperature on the removal of dyes from aqueous solution using modified diatomite: a kinetic study, J. Colloid Interface Sci. 2005; 287:6–13.

Journal of American Science 2010;6(6)
http://www.americanscience.org [email protected] 282
55. Noggle JH. Physical Chemistry, 3rd ed., vol. 11, Harper Collins Publishers, New York, 1996.
56. Roeges NPG. A Guide to the Complete Interpretation of Infrared Spectra of Organic Structures, Wiley and Sons, NY, 1994.
57. Barker B, Owen, NL. Identifying softwoods and hardwoods by infrared spectroscopy, J. Chem. Educ., 1999; 76(12):1706-1709.
58. Tiemann KJ, Gardea-Torresdey JL, Gamez G, Dokken K, Sias S. Use of X-ray absorption spectroscopy and esterification to investigate Cr(III) and Ni(II) ligands in alfalfa biomass, Environ. Sci. Technol. 1999; 33(1):150-154.
59. Chatjigakis AK, Pappas C, Proxenia N, Kalantzi O, Rodis P, Polissiou M. FTIR spectroscopic determination of the degree of esterification of cell wall pectins from stored peaches and correlation to textural changes, Carbohydr. Polym. 1998; 37(4):395-408.
60. Pappas C, Rodis P, Tarantilis PA, Polissiou M. Prediction of the pH in wood by diffuse reflectance infrared Fourier transform spectroscopy, Carbohydr. Polym. 1998; 53(7): 805-809.
61. Inbar Y, Chen Y, Hadar Y. Solid-state C-13 nuclear magnetic-resonance and infrared spectroscopy of composted organic-matter, Soil Sci. Soc. Am. J. 1989; 53(6):1695-1701.
62. Dave R, Madamwar D. Esterification in organic solvents by lipase immobilized in polymer of PVA–alginate–boric acid, Process Biochem. 2006; 41: 951–955.
63. Do˘gan M, Alkan M, Turkyılmaz A, Ozdemir Y. Kinetics and mechanism of removal of methylene blue by adsorption onto perlite, J. Hazard. Mater. 2004; B109:141–148.
64. Bulut Y, Aydın H. A kinetics and thermodynamics study of methylene blue adsorption on wheat shells, Desalination 2006; 194:259–267.
65. Han RP, Zou WH, Zhang ZP, Shi J, Yang JJ. Removal of copper(II) and lead(II) From aqueous solution by manganese oxide coated sand. I. Characterization and kinetic study, J. Hazard. Mater. 2006; 137:384–395.
66. Hsu YC, Chiang CC, Yu MF. Adsorption behaviors of basic dyes on activated clay, Sep. Sci. Technol. 1997; 32:2513–2534.
67. Ho YS, Chiang TH, Hsueh YM. Removal of basic dye from aqueous solutions using tree fern as a biosorbent, Process Biochem. 2005; 40:119–124.
68. Do˘gan M, Alkan M, Demirbas O, Ozdemir Y, Ozmetin C. Adsorption kinetics of maxilon blue GRL onto sepiolite from aqueous solutions, Chem. Eng. J. 2006; 124:89–101
69. Lata H, Grag VK, Gupta RK. Removal of a basic dye from aqueous solution by adsorption using
Parthenium hysterophorus: an agriculturalwaste, Dyes Pigm. 2007; 74:653–658.
70. Hameed BH, Din ATM, Ahmad AL. Adsorption of methylene blue onto bamboo-based activated carbon: kinetics and equilibrium studies, J. Hazard. Mater. 2007; 141:819–825.
71. Alkan M, Do˘gan M, Turhan Y, Demirbas O, Turan P. Adsorption kinetics and mechanism of maxilon blue 5G dye on sepiolite from aqueous solutions, Chem. Eng. J. 2008; 139:213–223.
72. Do˘gan M, Abak H, Alkan M. Adsorption of methylene blue onto hazelnut shell: Kinetics, mechanism and activation parameters, J. Hazard. Mater. 2009; 164:172–181
73. O¨ zer A, Dursun G. Removal of methylene blue from aqueous solution by dehydrated wheat bran carbon, J. Hazard. Mater. 2007; 146:262–269.
74. Hall KR, Eagleton LC, Acrivos A, Vermeulen T. Pore-and solid-diffusion kinetics in fixed-bed adsorption under constant-pattern conditions, I&EC Fundam., 1966; 5:212–223.
75. Yener J, Kopac T, Dogu G, Dogu T. Dynamic analysis of sorption of methylene blue dye on granular and powdered activated carbon, Chem. Eng. J. 2008; 144:400- 406.
76. Vckerstaff T. The Physical Chemistry of dyeing , Interscience Publishing Inc, N.Y 1954.
77. Bulut Y, Aydın H. A kinetics and thermodynamics study of methylene blue adsorption on wheat shells, Desalination 2006; 194:259–267.
78. Al-Futaisi A, Jamrah A, Al-Hanai R. Aspects of cationic dye molecule adsorption to palygorskite, Desalination 2007; 214:327–342.
79. Rauf MA, Bukallah SB, Hamour FA, Nasir AS. Adsorption of dyes from aqueous solutions onto sand and their kinetic behavior, Chem. Eng. J. 2008; 137:238–243.
80. Do˘gan M, Ozdemir Y, Alkan M. Adsorption kinetics and mechanism of cationic methyl violet and methylene blue dyes onto sepiolite, Dyes Pigm. 2007; 75:701–713.
81. Belgin B. Combined removal of zinc(ii) and cadmium(ii) from aqueous solutions by adsorption onto High-Calcium Turkish Fly Ash, Water, Air, and Soil Pollut. 2002; 136:69-92.
82. Poots VJP, McKay G, Healy JJ. Removal of basic dye from effluent using wood as an adsorbent, Water Pollut. Control Fed., 1978; 50:926-943.
83. Ho YS. Removal of copper ions from aqueous solution by tree fern, Water Res. 2003; 37 (10):2323–2330.
84. Bhattacharyya KG, Sharma A. Kinetics and thermodynamics of methylene blue adsorption on Neem (Azadirachta indica) leaf powder, Dyes Pigm. 2005; 65:51–59.
Journal of American Science 2010;6(6)
http://www.americanscience.org [email protected] 283
85. Kumar KV, Kumaran A. Removal of methylene blue by mango seed kernel powder, Biochem. Eng. J. 2005; 27:83–93.
86. Weng C H, Pan YF. Adsorption characteristics of methylene blue from aqueous solution by sludge ash, Colloids Surf. A: Physicochem. Eng. Aspects 2006; 274:154–162.
87. Mathews AP, Weber WJ. Effects of external mass transfer and inler-particle diffusion on adsorption, AIChE Symp. Ser. 1976; 73:91–98.
88. Zaki AB, El-Sheikh MY, Evans J, El-Safty SA. Kinetics and mechanism of the sorption of some aromatic amines onto amberlite IRA-904 anion-exchangeresin, J. Colloid Interf. Sci. 2000; 221:58–63.
89. Ho YS, Chiang TH, Hsueh YM. Removal of basic dye from aqueous solution using tree fern as a biosorbent, Process Biochem. 2005; 40:119–124.
90. Bulut Y, Aydin H. A kinetics and thermodynamics study of methylene blue adsorption on wheat shells, Desalination 2006; 194:259–267.
91. Ofomaja AE, Ho YS. Effect of temperatures and pH on Methyl violet biosorption by mansonia wood sawdust, Bioresour. Technol. 2008; 99:5411–5417.
92. McKay G, Otterburn MS, Aga AJ. Fuller’s earth and fired clay as adsorbents for dye stuffs, Water Air Soil Pollut. 1985; 24:307–322.
93. Alkan M, Kalay B, Dogan M, Demirbas O. Removal of copper ions from aqueous solutions by kaolinite and batch design, J. Hazard. Mater. 2008; 153:867–876.
94. Hameed BH, Mahmoud DK, Ahmad AL. Sorption equilibrium and kinetics of basic dye from aqueous solution using banana stalk waste, J. Hazard. Mater. 2008; 158:499–506.
3/3/2010