adsorption kinetics and thermodynamics of fluoride onto...
TRANSCRIPT

International Journal of ChemTech ResearchCODEN (USA): IJCRGG ISSN : 0974-4290
Vol.4, No.1, pp 165-174, Jan-Mar 2012
Adsorption kinetics and thermodynamics offluoride onto Phyllanthus emblica based
thermally activated carbon
Veeraputhiran V.* and Alagumuthu G.
Chemistry Research Centre, Sri Paramakalyani College, Alwarkurichi – 627412,Tamilnadu, India.
*Corres. Author: [email protected]: +919944825986
Abstract: The sorption of fluoride ion onto Phyllanthus emblica was studied by performing batch kinetic sorptionexperiments. The batch sorption model, based on a pseudo-first-order, pseudo-second-order, Elovich andintraparticle diffusion mechanism, were applied to predict the rate constant of sorption, the equilibrium capacityand the initial sorption rate with the effects of the initial solution fluoride concentration and temperature.Thermodynamic parameters, such as ΔGº, ΔHº, and ΔSº were calculated using adsorption equilibrium constantobtained from the Langmuir isotherm. Results suggested that the fluoride adsorption on Phyllanthus emblica is aspontaneous and endothermic process. Spectral studies like FT-IR, SEM and EDAX were performed to analyze thebinding nature of adsorbent with fluoride.Keywords: Fluoride; Phyllanthus emblica; thermodynamic study; kinetic study.
1. IntroductionAlthough a suitable low concentration of
fluoride in drinking water is beneficial to health, a highconcentration can produce dental and skeletalfluorosis, which has been early recognized in the1930s [1,2]. According to the World HealthOrganization (2008) [3], the acceptable fluorideconcentration is generally in the range of 0.5–1.5mg/L. However, the excess of fluoride in groundwateris found in many regions of the world [4–7]. Exceptfor natural dissolution from geologic formations,significant sources of fluoride in water body are theeffluents from the aluminum smelters, electronicdevice and semiconductor industries [8,9]. It is,therefore, essential that there are technologies forcontrolling the concentrations of fluoride in aqueous
emissions. One effective approach is to use alternativeadsorbents. These are low-cost, often naturallyoccurring, products which have good adsorbentproperties. Many of the adsorbents has been reportedfor best of fluoride removal, such as clay, red mud, flyash, plant materials [10] and nut shell carbons [11,12].
Phyllanthus emblica is the one of the bestavailable cheapest adsorbent, specifically in India. Inthis study, the fluoride removal from aqueous solutionby adsorption onto the activated carbon, which wasderived from Phyllanthus emblica, was investigated.The mechanism, the performance of the fluorideuptake under various initial fluoride concentrationsand temperature were examined in detail.
Veeraputhiran V. et al /Int.J. ChemTech Res.2012,4(1) 166
2. Materials and methods
2.1. Adsorbent preparationThe Phyllanthus emblica sample (powdered
seed), common name, Indian Gooseberry, waspurchased from market. Then the material was dried at378-383K for 24 hours. It was washed with doublydistilled water to remove the free acid and dried at thesame temperature for 3 hours. Later the driedadsorbent was thermally activated in Muffle furnace at1073K (here we avoid acid treatment for charring).The resulting product was cooled to room temperatureand sieved to the desired particle sizes, namely, <53,53 - 106, 106 -150, 150 - 225 and 225 - 305 mesh.Finally, the product was stored in vacuum desiccatorsuntil required.
2.2. Experimental ProceduresBatch adsorption experiments were carried out
at the desired temperature (303, 313, 323 and 333K)on a thermostatic shaker at 200rpm using capped250mL conical flasks. In the adsorption isotherm andkinetic tests, adsorbent (0.75 g) was thoroughly mixedwith aqueous solutions of fluoride (100 mL), withinitial fluoride concentrations (C0) ranging from 2 to10mg/L. The reagents used in this present study are ofanalytical grade. A fluoride ion stock solution (100mg/L) was prepared and other fluoride test solutionswere prepared by subsequent dilution of the stocksolution. Fluoride ion concentration was measuredwith a specific ion selective electrode by use of totalionic strength adjustment buffer II (TISAB II) solutionto maintain pH 5–5.5 and to eliminate the interferenceeffect of complexing ions [10]. The pH of the sampleswas also measured by Orion ion selective equipment.The fluoride concentration retained in the adsorbentphase, qe (mg/g), was calculated according to [13],
( )C Co eqe W-
= ……………..(1)
where qe is the amount of fluoride adsorbed (mg/g);Co and Ce are the initial and residual concentration atequilibrium (mg/L), respectively, of fluoride insolution; and W is the weight (g) of the adsorbent.
2.3. Characterization of sorbentsThe Fourier transform infrared spectra were
recoded using Nicolet 6700, Thermo ElectronicCorporation, USA made spectrophotometer. Thescanning electron microscopy (SEM) and EnergyDispersive X-ray Analysis (EDAX) were performedusing a Philips XL-20 electron microscope.Computations were made using Microcal Origin(Version 6.0) software. The accuracy of fit arediscussed using regression correlation coefficient (r)
and chi-square analysis (SSE). The chi-square statistictest is basically the sum of the square of the differencebetween the experimental data and data obtained bycalculating from the models, with each squareddifference divided by the corresponding data obtainedby calculating from the models. The equivalentmathematical statement [14] is:
2( , )2,
q q me eq me
c-
=å ……….(2)
where qe,m is equilibrium capacity obtained bycalculating from the model (mg/g) and qe isexperimental data of the equilibrium capacity (mg/g).
3. Results and Discussion
3.1. Adsorption KineticsThe kinetic models pseudo first order, pseudo
second order, intra particle diffusion and Elovichmodels are used to analyze the present adsorption datato determine the related kinetic parameters.
Pseudo-first-order kinetic model, theLagergren rate equation, has been the most widelyused rate equation for assigning the adsorption of anadsorbate from a liquid phase since 1898 [15]. Thelinear form of pseudo first order equation isrepresented as
log ( ) log2.303
Lkq q q te et- = - …..(3)
where qe and qt are the amount of fluoride adsorbed atequilibrium (mg/g) and the amount of fluorideadsorbed time t (mg/g), respectively; kL (min-1) is therate constant of pseudo-first order adsorption reaction.The plot of log (qe–qt) versus t should give a straightline (Fig.1) from which rate constant kL and qe can becalculated from the slope and intercept of the plot,respectively. If the plot was found to be linear withgood correlation coefficient, it indicates thatLagergren’s equation is appropriate to fluoridesorption on Phyllanthus embilica. So, the adsorptionprocess is a pseudo-first-order process [15,16]. TheLagergren’s first-order rate constant (kL) and qedetermined from the model are presented in Table 1,along with the corresponding regression correlationcoefficient. It was observed that the pseudo-first-ordermodel did not fit well. It was found that the calculatedqe values did not agree with the experimental qe values(Table 1). This suggests that the adsorption of fluoridedid not follow first-order kinetics.

Veeraputhiran V. et al /Int.J. ChemTech Res.2012,4(1) 167
Fig.1 Pseudo-first-order kinetic fit for fluoride adsorption onto Phyllanthus emblica at room temperature fordifferent initial fluoride concentration.
Table 1. Kinetic parameters for sorption of fluoride on Phyllanthus emblica for various fluorideconcentrations at room temperature.
Initial fluoride concentration (mg/dm3)Kinetic Model Parameters 2.0 4.0 6.0 8.0 10.0
kL (min−1) 0.024 0.046 0.058 0.064 0.055qe (mg/g) 2.142 5.680 9.123 12.160 8.350
r 0.996 0.949 0.966 0.945 0.962 Pseudo-first-order
SSE 0.004 0.051 0.034 0.055 0.038k2 (g/(mg min)) 0.011 0.011 0.010 0.009 0.013h (mg/(g min)) 0.094 0.240 0.377 0.448 0.590r 0.991 0.994 0.995 0.996 0.998
Pseudo-second-order
SSE 0.003 0.009 0.012 0.008 0.003kp (mg/(g min0.5)) 0.186 0.299 0.388 0.444 0.425
C 0.280 0.770 1.179 1.382 1.660r 0.947 0.920 0.905 0.907 0.894
Intra-particlediffusion
SSE 0.013 0.012 0.027 0.031 0.026
α (mg/(g min)) 0.236 0.047 0.006 0.002 0.061β (g/mg) 1.184 0.681 0.512 0.452 0.529r 0.963 0.974 0.972 0.987 0.995
Elovich model
SSE 0.010 0.011 0.017 0.009 0.003

Veeraputhiran V. et al /Int.J. ChemTech Res.2012,4(1) 168
Pseudo-second order model was developed byHo and McKay [17] to describe the adsorption of somemetal ion onto the adsorbent. The linear form of thepseudo-second-order adsorption kinetic rate equationis expressed as
12
2
t tq qk q et e
= + …….. (4)
where qe and qt have the same meaning as mentionedpreviously, and k2 is the rate constant for the pseudo-second-order adsorption reaction (g/mg min). Thevalue of qe and the pseudo-second-order rate constant(k2) can be calculated from the slope and intercept ofthe straight line obtained from the plot of t/qt versus t(Fig.2). It can be seen from Table 1 that the pseudo-second-order model better represented the adsorptionkinetics, suggesting that the adsorption process wascontrolled by chemisorption. A similar result wasreported for the adsorption of fluoride from aqueoussolution onto zirconium impregnated cashew nut shellcarbon [11].
The initial adsorption rate can be obtained as qt/t whent approaches zero:
02
2h k qe= …………… (5)
where h0 is the initial adsorption rate (mg/g min) andthe results are listed in Table 1. It was found that theinitial rate of adsorption increases with increasinginitial fluoride concentration, which would be expecteddue to the increase in driving force at higherconcentration.
Intraparticle Diffusion Model; As the abovekinetic models were not able to identify the diffusionmechanism, thus intraparticle diffusion model basedon the theory proposed by Weber and Morris [18] wastested. It is an empirically found functionalrelationship, common to the most adsorptionprocesses, where uptake varies almost proportionallywith t1/2 rather than with the contact time t. Accordingto this theory:
1 2q k t Ct id= + ……………. (6)
where kid is the intraparticle (pore) diffusion rateconstant (mg/g min0.5) and C is the intercept that givesan idea about the thickness of the boundary layer, is
obtained from the slope of the straight line of qt versust1/2 (Fig. 3). The larger the value of C, the greater theboundary-layer effect. The values of kid, C andregression correlation coefficient, R obtained for theplots are given in Table 1. If intraparticle diffusionoccurs, then qt versus t1/2 will be linear and if the plotpasses through the origin, then the rate limiting processis only due to the intraparticle diffusion. Otherwise,some other mechanism along with intraparticlediffusion is also involved [19]. For intraparticlediffusion plots, the first, sharper region is theinstantaneous adsorption or external surfaceadsorption. The second region is the gradualadsorption stage where intraparticle diffusion is therate limiting. In some cases, the third region exists,which is the final equilibrium stage where intraparticlediffusion starts to slow down due to the extremely lowadsorbate concentrations left in the solutions [19].Referring to Fig. 3, for all initial concentrations, thefirst stage was completed within the first 75min andthe second stage of intraparticle diffusion control wasthen attained. The different stages of rates ofadsorption observed indicated that the adsorption ratewas initially faster and then slowed down when thetime increased. As seen from Fig. 3, the plots were notlinear over the whole time range, implying that morethan one process affected the adsorption. Thus, theadsorption data indicated that the removal of fluoridefrom the aqueous phase onto the studied adsorbent wasa rather complex process, involving both boundary-layer diffusion and intraparticle diffusion.
Elovich Model [20], which is based onchemisorption phenomena, is expressed as in a linearequation [21] as,
( ) ( )1ln lnq tt b abb
= + ………..(7)
where qt is the sorption capacity at time t (mg/g), α isthe initial sorption rate (mg/g min) and β is thedesorption constant (g/mg) during the experiment.From the intercept and slope of the straight lineobtained from the plot of qt versus log t (Fig.4), thevalues for α and β were calculated. From the Table 1,the regression correlation coefficient varied from 0.963to .995 and indicating that the adsorption process isfairly adapting to chemisorption.

Veeraputhiran V. et al /Int.J. ChemTech Res.2012,4(1) 169
Fig.2 Pseudo-second-order kinetic fit for fluoride adsorption onto Phyllanthus emblica at room temperaturefor different initial fluoride concentration.
Fig.3 Plot for constant intra-particle diffusion at different temperature.
Fig.4 Linear plot for Elovich kinetic model for the temperatures 303, 313, 323 and 333K.

Veeraputhiran V. et al /Int.J. ChemTech Res.2012,4(1) 170
3.2 Thermodynamic parametersThermodynamic considerations of an
adsorption process are necessary to conclude whetherthe process is spontaneous or not. The Gibbs freeenergy change, ΔGº, is an indication of spontaneity ofa chemical reaction and therefore is an importantcriterion for spontaneity. Both energy and entropyfactors must be considered in order to determine theGibbs free energy of the process. Reactions occurspontaneously at a given temperature if ΔGº is anegative quantity. The free energy of an adsorption,considering the adsorption equilibrium constant Ka isgiven by the following equation,
0lnG RT KD ° = - ……….. (8)where ΔG° is the standard free energy change(kJ/mol), T is the absolute temperature (K) and R isuniversal constant (8.314 Jmol–1K–1). The sorptiondistribution coefficient K0 for the sorption reaction wasdetermined from the slope of the plot ln (qe/Ce) againstCe at different temperatures and extrapolating to zeroCe[10].
The sorption distribution coefficient may beexpressed in terms of ΔH° and ΔS° as a function oftemperature:
0ln H SKRT RD ° D °
= + …….(9)
where ΔH° is the standard enthalpy change (kJ/mol)and ΔS° is standard entropy change (kJmol–1K–1).While simplifying the Eq. (9) with ΔGº, it becomes,
G H T SD °=D °- D ° ……(10)
A plot of ΔGº versus temperature, T, will be linear andthe values of ΔH° and ΔS° are determined fromt heslope and intercept of the plot (Fig. 5). The parameterΔGº for the adsorption process using the Ka from theLangmuir isotherm is shown in Table 2. The values ofΔGº calculated using the Ka were negative for theadsorption of fluoride onto Phyllanthus emblica at alltemperatures. The negative values confirm thefeasibility of the process and the spontaneous nature ofthe adsorption.
The values of ΔGº,were found to decrease−1.546 to −2.556 kJ/mol using the equilibriumconstant, Ka. The decrease in the negative value of ΔGºwith an increase in temperature indicates that theadsorption process of fluoride on Phyllanthus emblicaactivated carbon becomes more favorable at highertemperatures [10]. The values of ΔH° and ΔS°calculated from the plot of ΔGº versus T were given as8.802 kJ/mol and 0.0342 J/mol K, respectively. Thevalue of ΔH° was positive, indicating that theadsorption reaction was endothermic. The positivevalue of ΔS° reflects the affinity of the adsorbent forthe fluoride. Spontaneous and endothermic adsorptionhave also been reported for the system of fluoride onvaries shell carbons [11,12].
Fig.5 Plot of Gibbs free energy change ΔG°, versus temperature T.
Veeraputhiran V. et al /Int.J. ChemTech Res.2012,4(1) 171
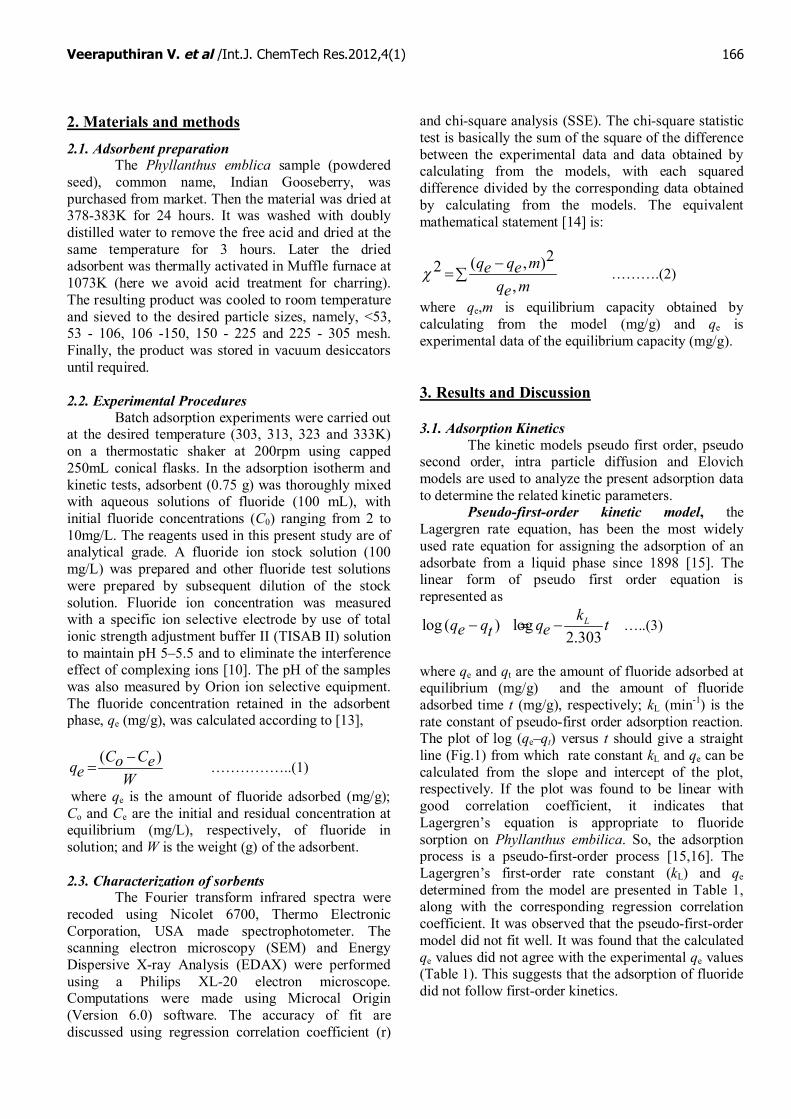
Table 2. Thermodynamic parameters of fluoride sorption on Phyllanthus emblica.
Fig.6 SEM image of thermally activated Phyllanthus emblica
S.No ThermodynamicParameters
Temperature(K)
ThermodynamicValues
1 ΔGº (kJ/mol) 303 -1.546313 -1.900323 -2.289333 -2.556
2 ΔHº (kJ/mol) 8.8023 ΔSº (J/(mol K)) 0.0342

Veeraputhiran V. et al /Int.J. ChemTech Res.2012,4(1) 172
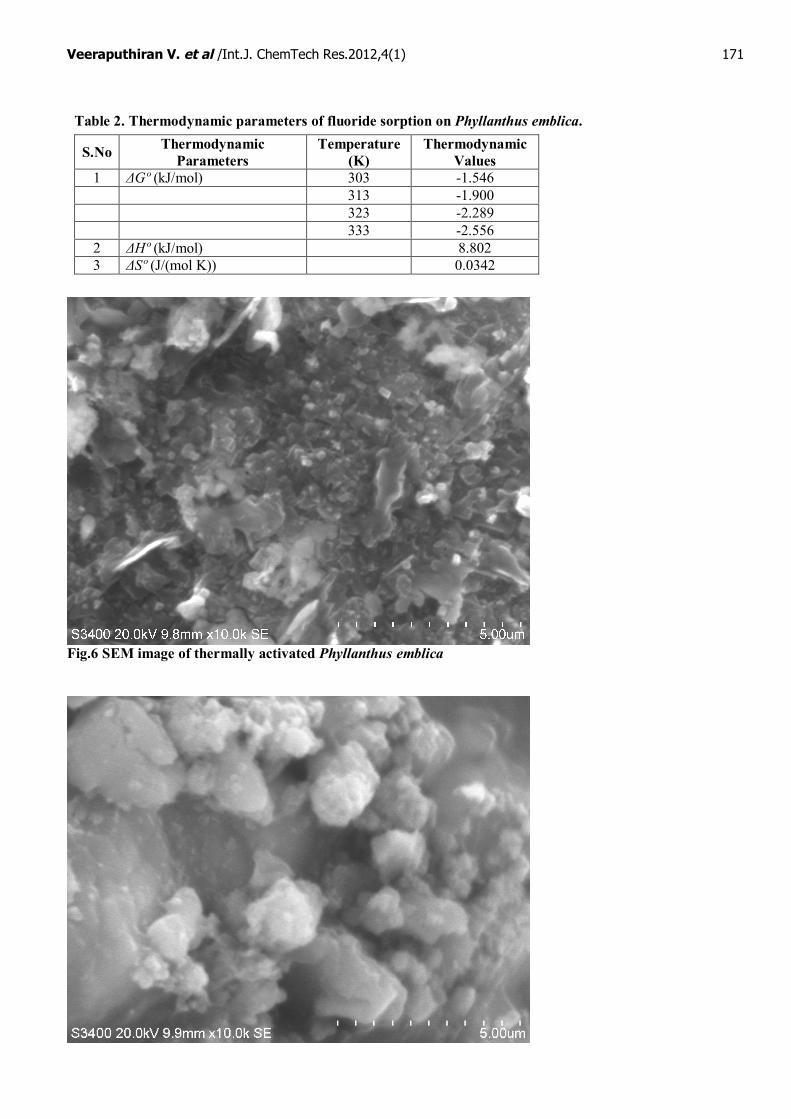
Fig.7 Scanning Electron Microscope view of fluoride treated thermally activatedPhyllanthus emblica adsorbent
Fig.8 EDAX pattern of thermally activated Phyllanthus emblica
Fig.9 EDAX pattern of fluoride treated thermally activated Phyllanthus emblica
Veeraputhiran V. et al /Int.J. ChemTech Res.2012,4(1) 173
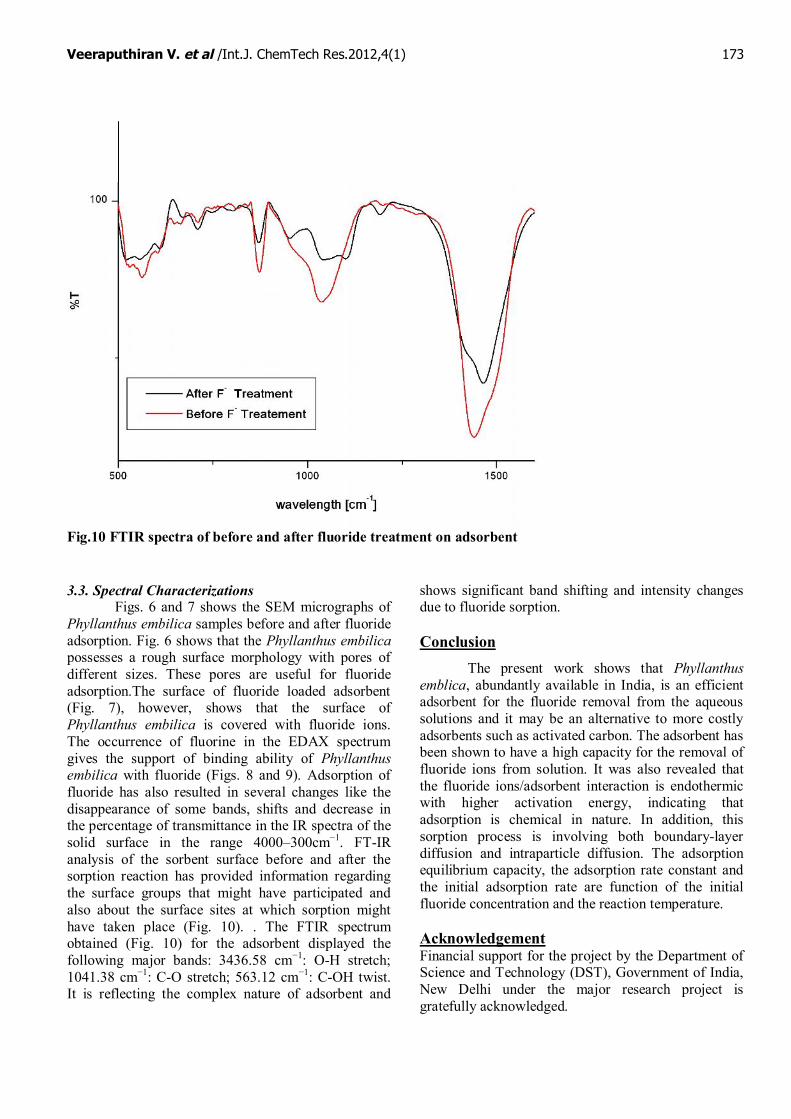
Fig.10 FTIR spectra of before and after fluoride treatment on adsorbent
3.3. Spectral CharacterizationsFigs. 6 and 7 shows the SEM micrographs of
Phyllanthus embilica samples before and after fluorideadsorption. Fig. 6 shows that the Phyllanthus embilicapossesses a rough surface morphology with pores ofdifferent sizes. These pores are useful for fluorideadsorption.The surface of fluoride loaded adsorbent(Fig. 7), however, shows that the surface ofPhyllanthus embilica is covered with fluoride ions.The occurrence of fluorine in the EDAX spectrumgives the support of binding ability of Phyllanthusembilica with fluoride (Figs. 8 and 9). Adsorption offluoride has also resulted in several changes like thedisappearance of some bands, shifts and decrease inthe percentage of transmittance in the IR spectra of thesolid surface in the range 4000–300cm−1. FT-IRanalysis of the sorbent surface before and after thesorption reaction has provided information regardingthe surface groups that might have participated andalso about the surface sites at which sorption mighthave taken place (Fig. 10). . The FTIR spectrumobtained (Fig. 10) for the adsorbent displayed thefollowing major bands: 3436.58 cm−1: O-H stretch;1041.38 cm−1: C-O stretch; 563.12 cm−1: C-OH twist.It is reflecting the complex nature of adsorbent and
shows significant band shifting and intensity changesdue to fluoride sorption.
ConclusionThe present work shows that Phyllanthus
emblica, abundantly available in India, is an efficientadsorbent for the fluoride removal from the aqueoussolutions and it may be an alternative to more costlyadsorbents such as activated carbon. The adsorbent hasbeen shown to have a high capacity for the removal offluoride ions from solution. It was also revealed thatthe fluoride ions/adsorbent interaction is endothermicwith higher activation energy, indicating thatadsorption is chemical in nature. In addition, thissorption process is involving both boundary-layerdiffusion and intraparticle diffusion. The adsorptionequilibrium capacity, the adsorption rate constant andthe initial adsorption rate are function of the initialfluoride concentration and the reaction temperature.
AcknowledgementFinancial support for the project by the Department ofScience and Technology (DST), Government of India,New Delhi under the major research project isgratefully acknowledged.

Veeraputhiran V. et al /Int.J. ChemTech Res.2012,4(1) 174
References
[1]. P.H. Phillips, “Plasma phosphatase in dairy cowssuffering from fluorosis”, Science, Vol. 76, pp.239–240, 1932.
[2]. H.T. Dean, “Action of fluorides upon humanteeth”, The Scientific Monthly, vol. 43, pp. 91–192, 1936.
[3]. WHO, Guidelines for Drinking Water Quality,World Health Organization, Geneva, 2008.
[4]. C.S. Zhu, G.L. Bai, X.L. Liu, and Y. Li,“Screening high-fluoride and high-arsenicdrinking waters and surveying endemic fluorosisand arsenic in Shaanxi province in westernChina”, Water Research, Vol. 40, pp. 3015–3022, 2006.
[5]. V. Veeraputhiran, and G. Alagumuthu, “A reporton fluoride distribution in drinking water”,International Journal of Environmental Sciences,vol. 1, no. 4, pp. 558-566, 2010.
[6]. G. Viswanathan, A. Jaswanth, S.Gopalakrishnan, and S. Siva ilango, “Mapping offluoride endemic areas and assessment offluoride exposure”, Science of the TotalEnvironment, vol.407, no.5, pp. 1579–1587,2008.
[7]. G. Alagumuthu, and M. Rajan, “Monitoring offluoride concentration in ground water ofKadayam block of Tirunelveli district, India”,Rasayan Journal of Chemistry, vol.4, pp. 757-765, 2008.
[8]. A.K.M. Arnesen, G. Abrahamsen, G. Sandvik,and T. Krogstad, “Aluminium-smelters andfluoride pollution of soil and soil solution inNorway”, Science of the Total Environment, vol.163, pp. 39–53, 1995.
[9]. M.J. Haron, and W.M.Z.W. Yunus, “Removal offluoride ion from aqueous solution by a cerium-poly (hydroxamic acid) resin complex”, Journalof Environ. Sciences Health Part A-Toxic/Hazardous Substance EnvironmentalEnggineering, vol. 36, pp. 727–734, 2001.
[10]. G. Alagumuthu, V. Veeraputhiran, and R.Venkataraman, “Fluoride sorption usingCynodon dactylon based activated carbon”,Hemijska industrija, vol. 65, no. 1,pp. 23-35,2011.
[11]. G. Alagumuthu, and M. Rajan, “Equilibrium andkinetics of adsorption of fluoride onto zirconiumimpregnated cashew nut shell carbon”, ChemicalEngineering Journal, vol. 158, pp. 451–457,2010.
[12]. G. Alagumuthu, and M. Rajan, “Kinetic andequilibrium studies on fluoride removal byzirconium (IV) – impregnated ground nutshellcarbon”, Hemijska industrija, vol. 64, no. 4, pp.295–304, 2010.
[13]. M.G. Sujana, H.K. Pradhan, and S. Anand,“Studies on sorption of some geomaterials forfluoride removal from aqueous solutions”,Journal of Hazardous Materials, vol. 161, pp.120 – 125, 2009.
[14]. Y.S. Ho, “Selection of optimum sorptionisotherm”, Carbon, vol. 42, pp. 2113 – 2130,2004.
[15]. S. Lagergren, “About the theory of so-calledadsorption of soluble substances”, KungligaSvenska Vetenskapsakademiens Handlingar, vol.24, no. 4, pp. 1–39, 1898.
[16]. Y.S. Ho, and G. McKay, “The sorption of lead(II) ions on peat”, Water Research, vol.33, pp.578–584, 1999.
[17]. Y.S. Ho, and G. McKay, “Sorption of dye fromaqueous solution by peat”, Chemical EngineeringJournal, vol. 70, pp. 115–124, 1998.
[18]. W.J. Weber, and J.C. Morris, “Kinetics ofadsorption on carbon from solution”, Journal ofSanitary Engineering Division, American Societyof Chemical Engineering, vol. 89, pp. 31–59,1963.
[19]. W.H. Cheung, Y.S. Szeto, and G. McKay,“Intraparticle diffusion processes during acid dyeadsorption onto chitosan”, BioresourceTechnology, vol. 98, pp. 2897–2904, 2007.
[20]. M. J. D. Low, “Kinetics of chemisorption ofgases on solids”, Chemical Reviews, vol. 60, pp.267–312, 1960.
[21]. G. Alagumuthu, V. Veeraputhiran, and M. Rajan,“Comments on Fluoride removal from waterusing activated and MnO2-coated Tamarind Fruit(Tamarindus indica) shell: Batch and columnstudies”, Journal of Hazardous Materials, vol.183, pp. 956-957, 2010.
*****