adult adult attitudes toward the militarydmdc report no. 2002-023 may 2002 adult attitudes toward...
TRANSCRIPT

DMDC Report No. 2002-023May 2002
Adult Adult Attitudes Toward the Military
Poll Two

For additional copies of this report,contact:
Defense Technical Information CenterATTN: DTIC-BRR
Defense Document Information Center8725 John J. Kingman Rd., Suite #0944
Ft. Belvoir, VA 22060-6218
(703) 767-8274
Ask for Report by ADA-xxxxxxxxx

DMDC Report No. 2002-023 May 2002
Adult Attitudes Toward the Military: Poll Two
Amie K. Wang Wirthlin Worldwide
James A. Hoskins
Wirthlin Worldwide
Mary E. Strackbein Wirthlin Worldwide
Anita R. Lancaster
Defense Manpower Data Center
Barbara J. George Defense Manpower Data Center
Sean M. Marsh
Defense Manpower Data Center
Defense Manpower Data Center 1600 Wilson Boulevard, Suite 400, Arlington, VA 22209-2593

ADULT POLL 2 2
ACKNOWLEDGMENTS
This project was performed on behalf of the Office of the Under Secretary of Defense for Personnel and Readiness. The authors appreciate the generous support and valuable advice and counsel provided by both Dr. W.S. Sellman, Director for Accession Policy, and Vice Admiral Patricia A. Tracey, Assistant Secretary of Defense for Military Manpower and Personnel Policy. We are also indebted to Ms. Elaine E. Sellman, Ms. Carol F. Rosenhoch and Mr. James E. McCloud, Defense Manpower Data Center, for their assistance in the preparation of this report for publication.

ADULT POLL 2 3
TABLE OF CONTENTS
1. Introduction and Report Organization ..................................................5 2. Executive Summary ..............................................................................7 3. Background Information.......................................................................11 4. Research Methodology .........................................................................13 5. Detailed Findings ..................................................................................15
• Demographic Profile of Respondents ...................................................15 • Impressions of the Military...................................................................17 • Advice About Options After High School............................................22 • Favorability of the Military...................................................................27 • Knowledge of the Military ...................................................................29 • Multivariate Analysis............................................................................33
6. Appendix A - Sample Design and Implementation ..............................A-1 7. Appendix B - Questionnaire .................................................................B-1

ADULT POLL 2 4
TABLES AND FIGURES
Table 1: Children’s Ages..............................................................................................................15 Table 2: Age Distribution of Immediate Family Members With Military Experience ................16 Table 3: Age Distribution of Extended Family Members With Military Experience ..................16 Table 4: Age Distribution of Others With Military Experience...................................................16 Table 5: Youth-Related Employment...........................................................................................17 Figure 1: Confidence in Institutions ..............................................................................................18 Figure 2: Impressions of the Military: Those Who Join ...............................................................19 Figure 3: Impressions of the Military: Those Who Stay...............................................................21 Figure 4: Likelihood To Recommend Options After High School................................................23 Figure 5: Advice About Options After High School .....................................................................24 Figure 6: Advice About Military Service ......................................................................................25 Figure 7: Positive or Negative Military Advice.............................................................................27 Figure 8: Favorability of Military Branches ..................................................................................28 Figure 9: Favorabiltiy of Military Components.............................................................................29 Figure 10: Knowledge of the Military .............................................................................................30 Table 6: Knowledge (Believability) of Military Benefits and Opportunities...............................31 Figure 11: Factor Analysis...............................................................................................................34 Table 7: Factor Loadings Rotated Component Matrix .................................................................35 Table 8: Summary Statistics for Ordered Probit Model Model Summary ...................................37 Table 9: Ordered Probit Estimates: Likelihood of Encouraging Youth To Join the Military .....38 Table 10: Factors Affecting the Likelihood To Give Advice: Simulation Results .......................39 Table 11: Weighting Variables...........................................................................................………A-4 Table 12: Age .................................................................................................................................A-5 Table 13: Race/Ethnicity ................................................................................................................A-5 Table 14: Education........................................................................................................................A-5
ADULT POLL 2 5
1. INTRODUCTION AND REPORT ORGANIZATION Introduction During Fiscal Year 2000, the Department of Defense expanded its market research efforts to (1) understand attitudes of key audiences toward the military, in general, and military service, specifically, and (2) develop research-based communications strategies and recommendations for each market. The Defense Manpower Data Center (DMDC) was responsible for this research. A two-pronged research approach was undertaken: (1) qualitative research – in-depth, values laddering interviews with the major recruiting markets (e.g., parents, educators, youth, Service members) to determine their attitudes toward the military, their recommendations to youth regarding post-high school options, and research-based message strategies that would resonate with each market; and (2) quantitative research – short, multi-year polls with recruitment-aged youth and adult Americans. The purpose of this report is to present results of polls conducted with adult Americans to collect timely information on their attitudes about the military, knowledge of the military and advice they give to youth about options after high school. The research was conducted at the request of the Deputy Assistant Secretary of Defense for Military Personnel Policy, Vice Admiral P. A. Tracey, and the Director for Accession Policy, Dr. W. S. Sellman. Report Organization The report is organized into the following main sections: • The Executive Summary contains an overview of the background of the study and presents key
findings from the Adult Attitudes Toward the Military: Poll Two • The Background Information section contains a historical perspective on the Department of
Defense’s recruitment advertising and market research programs. • The Research Methodology section provides details on the design of the research conducted.
Research findings are reviewed in the Detailed Findings section. • Appendix A includes specifics on the sample design and implementation information. • Appendix B includes the Adult Attitudes Toward the Military: Poll Two (Adult Poll 2)
Interview Guide.

ADULT POLL 2 6

ADULT POLL 2 7
2. EXECUTIVE SUMMARY The Department of Defense’s (DoD) is conducting a series of adult polls focused on attitudes of those who influence youth about the military and their likelihood to recommend military service to youth. Adult Poll 2 looked at adult impressions of the military, advice given to youth about options after high school, how favorable they were towards the military, and their knowledge of the military. Adult Poll 2 was conducted using computer assisted telephone interviews (CATI) during the period of September 28 – October 6, 2001. Data were weighted by age, race/ethnicity and education to the August 2001 Current Population Survey to mirror the population of American adults ages 22 to 85 years old. Impressions of the Military and Those Who Serve Adults were first asked to rate their confidence in US organizations and institutions including:
• Firefighters • US Military • American Red Cross • National Guard • Reserves • Presidency • Police • Church/organized religion • US Supreme Court
• FBI • Public schools • Congress • CIA • Air travel • Television news • Newspapers • Financial markets
Following the events of September 11th, American adults reported a higher level of confidence in their leaders and social institutions, particularly the military. When asked to rate their level of confidence for several institutions in American society, a majority of adults said they had “a great deal/quite a lot” of confidence in the U.S. Military (89%), second only to firefighters (97%). At the time of Adult Poll 2, the American Red Cross closely followed the military with 87 percent confidence. Other military-related groups also received high confidence scores. The National Guard and Reserves followed at 81 percent and 78 percent, respectively. Media, including television news (37%) and newspapers (36%), and financial markets (36%) were ranked lowest. To distinguish between perceptions of those who join the military and those who stay and make it a career, adults were asked to rate how well the following series of statements described each group. • They want education and training • They are patriotic • They want to serve their country • They are brave and courageous • They are loyal
• They are respected • They are dedicated to duty and devoted • They want military benefits • They are trustworthy and honorable • They want job security offered by the military

ADULT POLL 2 8
• They are goal oriented • They are intelligent • They are looking for direction • They are poorly paid • They are educated • They will be [are] working in jobs
that fit them • They need discipline
• They will be [are] working in jobs they enjoy • They are authoritative • They are looking for travel • They are not as qualified as recruits [service
members] used to be • They have no other options • They are people I feel sorry for • They are selfish • They are foolish
Top-of-mind responses indicated adults’ views of the two groups were positive. The statements rated most descriptive of the average person who joins the military were want education and training, are patriotic, want to serve their country, are brave and courageous, loyal and respected. Similarly, the average person who stays in the military and makes it a career was most described as are patriotic, want to serve their country, are loyal and are dedicated to duty and devoted. The statements rated least descriptive of those who join and those who stay in the military tended to be more negative in nature. For example, the statements rated least descriptive of those joining the military were they are not as qualified as recruits used to be, they have no other options, they are people I feel sorry for, they are selfish and they are foolish. Not surprisingly, adults were more likely to say that people who join versus those who stay are looking for direction, need discipline, and have no other options. Similarly, characteristics that adults said better described career military members included: they are working in careers they enjoy, they are authoritative, and they are working in careers that fit them. About three-quarters of adults said that their current image of those who join the military and those who stay would have a positive effect on their recommendation of military service as an option for youth after high school. Advice About Options After High School While the majority of adults associated positive feelings with the military and its members, when asked about their likelihood to advise youth on options after graduating from high school, joining the military ranked last, tied with getting a full-time job. More than eight out of 10 adults reported being very likely or likely to encourage youth to obtain further education after high school. Ninety-four percent (94%) would recommend attending a 4-year college or university and 84 percent would recommend attending a trade, technical, vocational or community college. Two-thirds of adults said they would recommend joining a Military Service (66%) or getting a full-time job (64%). When asked whether they gave advice, in general, to youth about post-high school options in the past year, a third or less of the adult population indicated they had done so. Respondents who indicated they had given advice to a youth were asked whether or not that advice was given to:
• Your son • Your daughter
• Your brother or sister • Your cousin
ADULT POLL 2 9
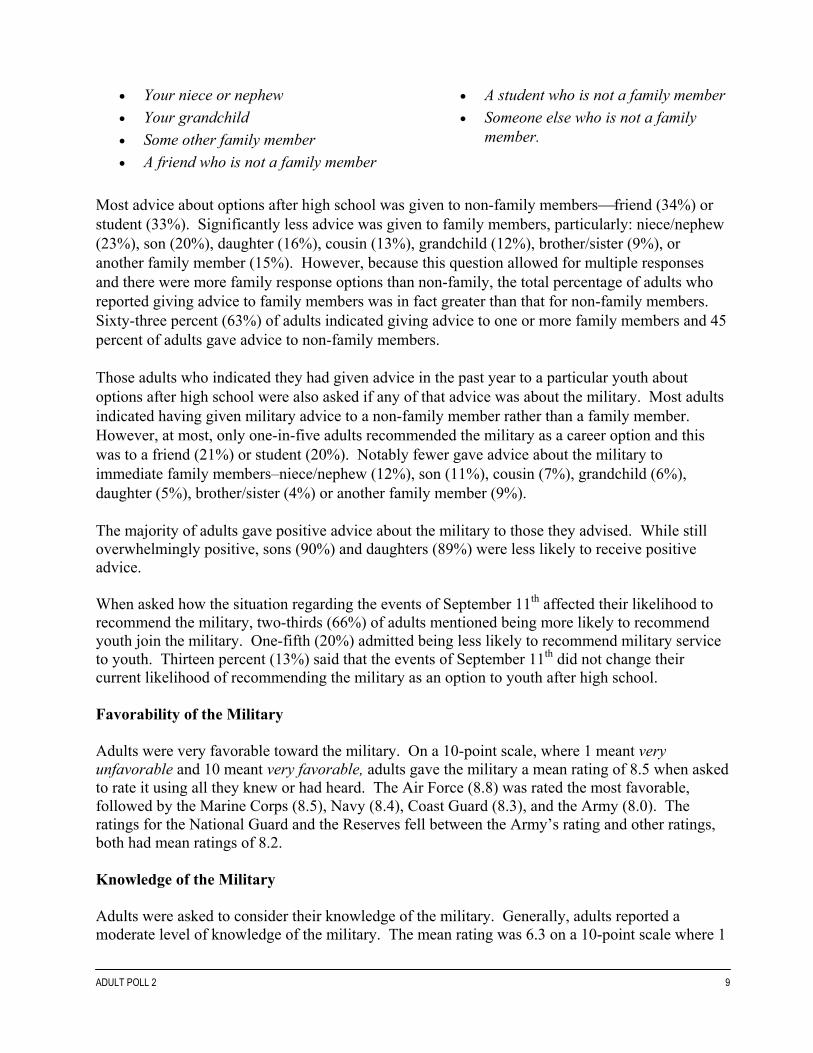
• Your niece or nephew • Your grandchild • Some other family member • A friend who is not a family member
• A student who is not a family member • Someone else who is not a family
member.
Most advice about options after high school was given to non-family membersfriend (34%) or student (33%). Significantly less advice was given to family members, particularly: niece/nephew (23%), son (20%), daughter (16%), cousin (13%), grandchild (12%), brother/sister (9%), or another family member (15%). However, because this question allowed for multiple responses and there were more family response options than non-family, the total percentage of adults who reported giving advice to family members was in fact greater than that for non-family members. Sixty-three percent (63%) of adults indicated giving advice to one or more family members and 45 percent of adults gave advice to non-family members. Those adults who indicated they had given advice in the past year to a particular youth about options after high school were also asked if any of that advice was about the military. Most adults indicated having given military advice to a non-family member rather than a family member. However, at most, only one-in-five adults recommended the military as a career option and this was to a friend (21%) or student (20%). Notably fewer gave advice about the military to immediate family members–niece/nephew (12%), son (11%), cousin (7%), grandchild (6%), daughter (5%), brother/sister (4%) or another family member (9%). The majority of adults gave positive advice about the military to those they advised. While still overwhelmingly positive, sons (90%) and daughters (89%) were less likely to receive positive advice. When asked how the situation regarding the events of September 11th affected their likelihood to recommend the military, two-thirds (66%) of adults mentioned being more likely to recommend youth join the military. One-fifth (20%) admitted being less likely to recommend military service to youth. Thirteen percent (13%) said that the events of September 11th did not change their current likelihood of recommending the military as an option to youth after high school. Favorability of the Military Adults were very favorable toward the military. On a 10-point scale, where 1 meant very unfavorable and 10 meant very favorable, adults gave the military a mean rating of 8.5 when asked to rate it using all they knew or had heard. The Air Force (8.8) was rated the most favorable, followed by the Marine Corps (8.5), Navy (8.4), Coast Guard (8.3), and the Army (8.0). The ratings for the National Guard and the Reserves fell between the Army’s rating and other ratings, both had mean ratings of 8.2. Knowledge of the Military Adults were asked to consider their knowledge of the military. Generally, adults reported a moderate level of knowledge of the military. The mean rating was 6.3 on a 10-point scale where 1
ADULT POLL 2 10
meant not at all knowledgeable and 10 meant extremely knowledgeable. To measure adults’ knowledge about military service, interviewees were asked to evaluate the following list of true statements and rate each on a 10-point scale where 1 meant not at all believable and 10 meant extremely believable. The mean ratings are shown parenthetically. • Service in the military provides an opportunity to serve our country in a meaningful way (9.0). • Service in the military builds values such as duty, honor, courage, respect and loyalty (8.8). • The military fosters the development of qualities such as discipline, self-reliance, confidence
and maturity (8.8). • The military participates in things other than war, such as humanitarian relief, firefighting and
drug treatment (8.5). • The military allows people to learn responsibility and leadership at an earlier age than most
civilian jobs (8.5). • Military installations are self-contained communities with gyms, restaurants, stores, theaters,
houses of worship, social activities and support services (8.2). • The military currently offers over 140 career paths that new recruits can choose from (8.2). • The military offers a tuition assistance program that pays up to 75% of the cost of tuition or
other expenses up to $3500 per year for service members (8.1). • 60% of the courses taught in the military school are certified for college credit (8.0). • In 1999, over 30,000 active-duty military service members earned college degrees (7.8). • The military is diverse – 37% of the military is made up of minorities (7.8). • The military offers 30 days of paid vacation per year (7.7). • New recruits can earn up to $50,000 for college (7.4). • There are approximately 300 military schools that teach skills in over 10,000 courses (7.3). • 88% of military jobs have comparable civilian jobs (7.3). • More and more housing for enlisted personnel is college style dormitory rooms, not the open
barracks of old (7.2). • People coming into the military have access to email from their barracks and housing so that
they can easily communicate with family and friends (6.9). • The military will repay up to $65,000 in federal student loans for new recruits (6.5). • The military offers a program that allows recruits to complete a 2-year college degree before
entering basic training (6.5). The statements rated most believable focused on dimensions of service and character building and were more general in nature: 1) service in the military provides an opportunity to serve our country in a meaningful way, 2) service in the military builds values such as duty, honor, courage, respect and loyalty, and 3) the military fosters the development of qualities such as discipline, self-reliance, confidence and maturity. Those statements adults viewed as least believable were specific in nature: 1) the military will repay up to $65,000 in federal student loans for new recruits and 2) the military offers a program that allows recruits to complete a 2-year college degree before entering basic training.

ADULT POLL 2 11
3. BACKGROUND INFORMATION The Department of Defense’s (DoD) is conducting a series of adult polls focused on attitudes of those who influence youth about the military and their likelihood to recommend military service to youth. Adult Poll 2 looked at adult impressions of the military, advice given to youth about options after high school, how favorable they were towards the military, and their knowledge of the military. The series of adult polls was initiated as a direct result of the Secretary of Defense’ comprehensive evaluation of the Department’s recruitment advertising programs in 19991. A team of advertising consultants reviewed components of the recruitment-advertising program–market research, creative approaches, media tactics, contract management and program oversight. The consultants recommended that the Department initiate “quick polling” or tracking capabilities that would: • provide more frequent input to the decision process; • produce fast turnaround of results; • generate new and creative data to support advertising objectives–both message development
and targeting potential; and • respond to policy issues that senior leaders might have. This poll represents the second wave of the new “quick polling” capability, developed in response to the advertising review.
1 Bozel/Eskew, Murphy, Pintauk, Gautier, & Hudome. (2002). A report on the Armed Services recruitment advertising. Santa Monica, CA: RAND.

ADULT POLL 2 12
ADULT POLL 2 13
4. RESEARCH METHODOLOGY A total of 1,253 American adults, ages 22 to 85, were interviewed through computer assisted telephone interviews (CATI) during the period of September 28 to October 6, 2001. The interview averaged 27 minutes in length. Final data included in this poll were weighted by age, race/ethnicity and education according to the August 2001 Current Population Survey.2 Random digit dialing methodology was used to ensure that every working telephone number had an equal chance of being selected. A more detailed description of the sampling methodology can be found in Appendix A. Specific topics covered in this poll were as follows: • Measure of confidence in various institutions; • Measure of opinions of various characteristics of people who join the military and people who
stay in the military as a career; • Evaluation of likelihood to give advice about options after high school; • Determination of whom adults advise about options after high school and how often military
advice is given; • Measure of favorability toward the military, in general, and the branches and components, in
specific; • Measure of knowledge of the military; • Measure of the effect on giving advice about the military, given the events of September 11,
2001; and • Demographics such as military household status, race, ethnicity, income, education and
occupation. Interviews were conducted during the evening and weekend hours appropriate to the time zone in which the respondent lived. Specifically, interviews were conducted from 5 pm through 10 pm respondent time Sunday through Friday, and 10 am through 6 pm on Saturdays. The fieldwork took place from the Wirthlin Worldwide telephone centers located in Orem, Utah and Grand Rapids, Michigan. Because of the speed at which polls are conducted and the rate at which surveys are completed, it is often necessary to set quotas (the minimum number of completed surveys) for geographic areas in an attempt to obtain a representative sample. Therefore, soft quotas or targets for the minimum number of surveys to be completed were established by gender, race/ethnicity, and geographic region.
2 Bureau of the Census. (2002). Current Population Survey. Washington DC: Author. Available: http://www.bls.census.gov/cps

ADULT POLL 2 14

ADULT POLL 2 15
5. DETAILED FINDINGS Demographic Profile of Respondents The final data were weighted by age, education, and race/ethnicity to the 2001 Current Population Survey. Detailed information on sample design and weighting can be found in Appendix A. The adult audience in this poll included adults ages 22 to 85. Soft quotas (a target for the minimum number of surveys to be completed) were placed on geography, gender, and race/ethnicity. Gender The gender ratio skewed slightly female, with 47 percent men and 53 percent women. Children Status Eight out of ten (80%) American adults had an average of 2.6 children living in the household. Roughly two-thirds (67%) of this population had children ages 27 and younger. The age distribution among children ages 27 and younger in the households included in this research was fairly even.
Table 1
Children’s Ages Age Weighted %
Up to 5 years 31% 6-10 years 35% 11-15 years 30% 16-20 years 30% 21-27 years 30%
Military Association Only one percent of the adults interviewed were serving in the Armed Forces in the fall of 2001, although 16 percent reported having previously served. Among those with military experience, a significant majority had been in the active-duty military (86%), one-fifth (20%) served in the Reserves and 11 percent served in the National Guard. Three-quarters (76%) of adults indicated having immediate family (parents, children, siblings, grandparents and in-laws) who served in the military. Table 2 displays the distribution of ages of immediate family who served in the military.

ADULT POLL 2 16
Table 2
Age Distribution of Immediate Family Members With Military Experience
Weighted % Age 1 2 3+
18-25 years 13% 3% 4% 26-40 years 21% 10% 7% 41-60 years 27% 11% 16% 61+ years 28% 11% 10%
Additionally, roughly two-thirds (65%) of the population reported having extended family who served in the military. Table 3 displays the distribution of ages of extended family members with military experience.
Table 3
Age Distribution of Extended Family Members With Military Experience Weighted %
Age 1 2 3+ 18-25 years 18% 7% 7% 26-40 years 25% 13% 15% 41-60 years 18% 11% 20% 61+ years 12% 9% 20%
Aside from knowing family members with military experience, eight out of ten (79%) adults personally knew someone else who served in the military. Similarly, Table 4 shows the distribution of ages of those other than family members with military service. A greater percentage knew three or more non-family members (compared to immediate and extended family members) who served in the military in each age category.
Table 4
Age Distribution of Others With Military Experience Weighted %
Age 1 2 3+ 18-25 years 15% 10% 24% 26-40 years 19% 14% 35% 41-60 years 13% 9% 30% 61+ years 6% 5% 23%

ADULT POLL 2 17
Youth-Related Employment One-fifth (19%) of American adults reported holding positions of youth leadership and six percent were employed as teachers, counselors or administrators in a community college or high school [Table 5].
Table 5
Youth-Related Employment Youth Leader Weighted %
Youth leader (net) 19% Youth sports coach 6%
Employer of people under 21 4% Member of the clergy 4%
Other 7% Teacher/Counselor/Administrator Weighted %
Community college 4% High school 2%
Impressions of the Military To explore adults’ top-of-mind impressions of the military, adults were asked the following questions:
• Please tell me how much confidence [a great deal, quite a lot, some, very little] you have in each of the following institutions in American society.
• For each of the following statements, please tell me how well you think it describes the average person joining the military today. Please use a scale from 1 to 10 where 1 means does not describe at all and 10 means describes completely.
• Please continue to think about the image you currently have of the average person joining the United States Military. Would this image have a positive effect, a negative effect or have no effect at all on your recommending military service as an option for youth after high school?
• For each of the following statements, please tell me how well you think it describes the average person who stays in the military and makes it a career. Please use a scale from 1 to 10 where 1 means does not describe at all and 10 means describes completely.
• For each of the following statements, please tell me how well you think it describes the average person who stays in the military and makes it a career. Please use a scale from 1 to 10 where 1 means does not describe at all and 10 means describes completely.

ADULT POLL 2 18
Confidence in American Institutions As a likely result of the events of September 11th, American adults reported a higher level of confidence in their leaders and social institutions, particularly the military. When asked to rate their level of confidence in several institutions in American society, a majority of adults said they had “a great deal/quite a lot” of confidence in the military (89%), second only to firefighters (97%). At the time of Adult Poll 2, the American Red Cross closely followed with 87 percent. Other military-related groups also received high confidence scores. The National Guard and Reserves followed at 81 percent and 78 percent, respectively. Media, including television news (37%) and newspapers (36%), and financial markets (36%) were ranked lowest [Figure 1]. Those adults who indicated the most confidence in the military tended to be White males and adults with less than a college degree. Additionally, men were more likely than women to have greater confidence in air travel, and financial markets. Conversely, women were more apt to express confidence in the church or organized religion, television news, and newspapers. Adults 55 years and older, compared to those younger than 55, reported greater confidence in the National Guard and air travel, but were less likely to have confidence in the Red Cross. Adults older than 55 had a greater likelihood than those ages 22 to 35 to have more assurance in the Presidency and police. Those ages 22 to 35 were more likely than adults ages 36 years and older to express confidence in the CIA, newspapers and financial markets. Conversely, adults ages 36 and older were more likely than adults ages 22 to 35 to indicate greater confidence in firefighters and the church. Those with less than a college degree were more likely than those with a higher education to have confidence in the military, National Guard, Reserves, Presidency, church, and television news.
Figure 1
Now I am going to read you a list of institutions in American society. Please tell me how much confidence you, yourself have in each one. Would you say you have a great deal, quite a lot, some or very little confidence in this institution?
Confidence in Institutions
97%89%
87%81%
78%75%
68%66%
63%61%
53%52%
50%48%
37%36%36%
0% 20% 40% 60% 80% 100%
FirefightersM ilitary
American Red CrossNational Guard
ReservesPresidency
PoliceChurch/organized religion
U.S. Supreme CourtT he FBI
Public schoolsCongress
T he CIAAir travel
T elevision newsNewspapers
Financial markets
Percent answering “A Great Deal/Quite a Lot”
ADULT POLL 2 19
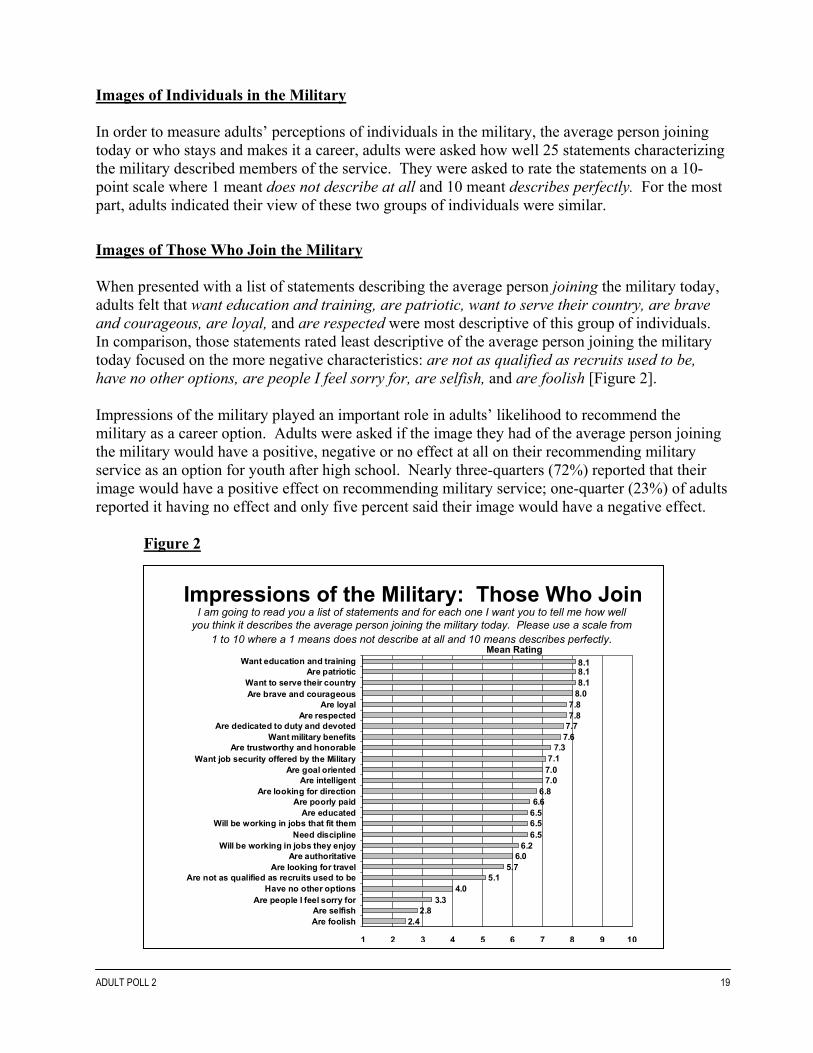
Images of Individuals in the Military In order to measure adults’ perceptions of individuals in the military, the average person joining today or who stays and makes it a career, adults were asked how well 25 statements characterizing the military described members of the service. They were asked to rate the statements on a 10-point scale where 1 meant does not describe at all and 10 meant describes perfectly. For the most part, adults indicated their view of these two groups of individuals were similar.
Images of Those Who Join the Military When presented with a list of statements describing the average person joining the military today, adults felt that want education and training, are patriotic, want to serve their country, are brave and courageous, are loyal, and are respected were most descriptive of this group of individuals. In comparison, those statements rated least descriptive of the average person joining the military today focused on the more negative characteristics: are not as qualified as recruits used to be, have no other options, are people I feel sorry for, are selfish, and are foolish [Figure 2]. Impressions of the military played an important role in adults’ likelihood to recommend the military as a career option. Adults were asked if the image they had of the average person joining the military would have a positive, negative or no effect at all on their recommending military service as an option for youth after high school. Nearly three-quarters (72%) reported that their image would have a positive effect on recommending military service; one-quarter (23%) of adults reported it having no effect and only five percent said their image would have a negative effect. Figure 2
Impressions of the Military: Those Who JoinI am going to read you a list of statements and for each one I want you to tell me how well
you think it describes the average person joining the military today. Please use a scale from1 to 10 where a 1 means does not describe at all and 10 means describes perfectly.
2.42.8
3.34.0
5.15.7
6.06.2
6.56.56.56.6
6.87.07.07.1
7.37.67.77.87.8
8.08.18.18.1
1 2 3 4 5 6 7 8 9 10
Are foolishAre selfish
Are people I feel sorry forHave no other options
Are not as qualified as recruits used to beAre looking for travel
Are authoritativeWill be working in jobs they enjoy
Need disciplineWill be working in jobs that fit them
Are educatedAre poorly paid
Are looking for directionAre intelligent
Are goal orientedWant job security offered by the Military
Are trustworthy and honorableWant military benefits
Are dedicated to duty and devotedAre respected
Are loyalAre brave and courageousWant to serve their country
Are patrioticWant education and training
Mean Rating

ADULT POLL 2 20
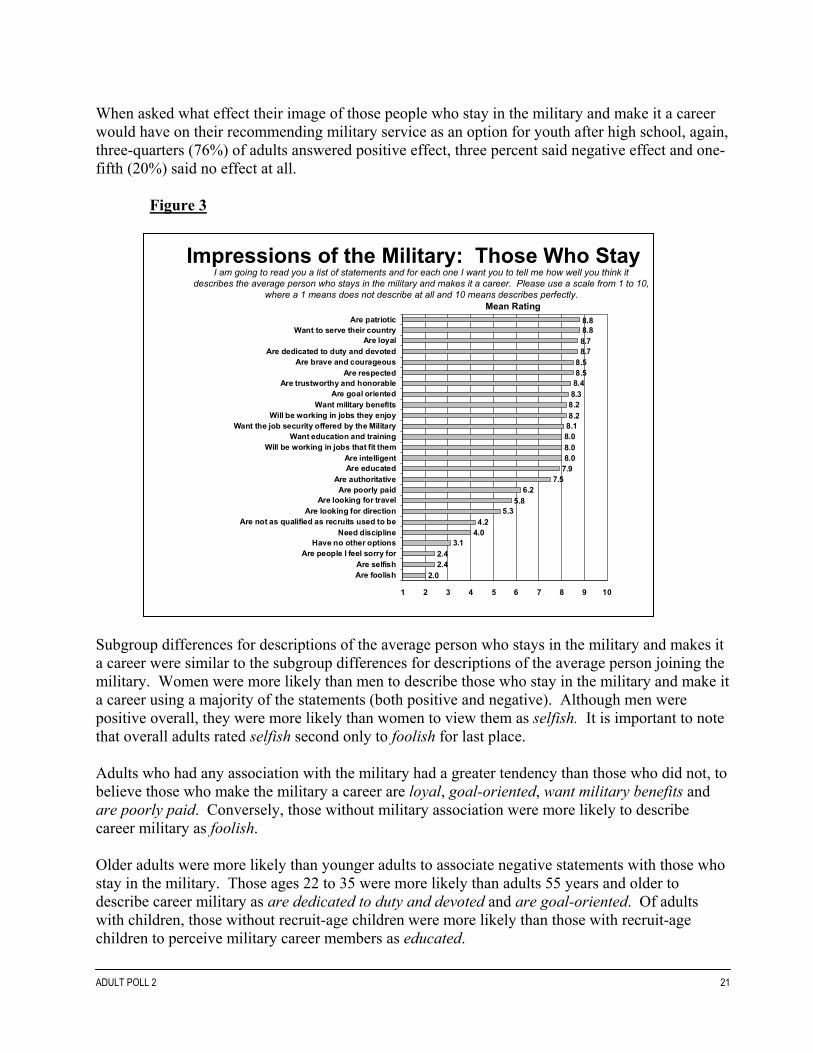
Closer inspection of subgroups revealed that women had a greater tendency than men to say nearly all the statements listed were more descriptive of the average person joining the military today. Men were more likely than women to describe those who join as selfish. Additionally, older adults (55 and older) were more likely than younger adults (ages 22 to 54) to describe the average recruit more negatively: need discipline, not as qualified as recruits used to be, people I feel sorry for, are selfish, and are foolish. Conversely, younger adults were more likely than older adults to describe those who join the military today as are respected. Those ages 22 to 35 years were more likely than adults 36 years and older to say that recruits were authoritative and goal-oriented. Adults without military association (never personally served in the military or knew of family that served in the military) were more likely than those associated with the military personally or through family members to describe the average recruit as are trustworthy and honorable and will be working in jobs they enjoy. Adults associated with the military were more likely to say that recruits were poorly paid. Finally, data indicated that those with less than a college degree and those from a household with income less than $40,000 a year consistently rated all the items higher than those with more education and a higher level of income. Consistently higher responses on both positive and negative images of people joining the military may indicate that those with more education and a higher level of income use the scale differently than those with less education and income. Images of Those Who Stay in the Military and Make it a Career Using the same list of statements to describe the average person who stays in the military making it a career, the highest rated characteristics for this group paralleled those that describe the average person joining the military: are patriotic, want to serve their country, are loyal and are dedicated to duty and devoted. Those statements rated least descriptive of the career military personnel were: are foolish, are selfish, are people I feel sorry for, have no other options, and need discipline. While the ranking of the individual attributes and characteristics were fairly comparable for the two types of military members, it is not surprising to find that adults were more likely to say that most of the characteristics were more descriptive of career military personnel than of those just now joining. Adults indicated that career military personnel were better described by the positive attributes and not as well described by the more negative attributes [Figure 3].
ADULT POLL 2 21
When asked what effect their image of those people who stay in the military and make it a career would have on their recommending military service as an option for youth after high school, again, three-quarters (76%) of adults answered positive effect, three percent said negative effect and one-fifth (20%) said no effect at all.
Figure 3
Impressions of the Military: Those Who StayI am going to read you a list of statements and for each one I want you to tell me how well you think it
describes the average person who stays in the military and makes it a career. Please use a scale from 1 to 10,where a 1 means does not describe at all and 10 means describes perfectly.
2.02.42.4
3.14.04.2
5.35.8
6.27.5
7.98.08.08.08.18.28.28.38.48.58.5
8.78.78.88.8
1 2 3 4 5 6 7 8 9 10
Are foolishAre selfish
Are people I feel sorry forHave no other options
Need disciplineAre not as qualified as recruits used to be
Are looking for directionAre looking for travel
Are poorly paidAre authoritative
Are educatedAre intelligent
Will be working in jobs that fit themWant education and training
Want the job security offered by the MilitaryWill be working in jobs they enjoy
Want military benefitsAre goal oriented
Are trustworthy and honorableAre respected
Are brave and courageousAre dedicated to duty and devoted
Are loyalWant to serve their country
Are patrioticMean Rating
Subgroup differences for descriptions of the average person who stays in the military and makes it a career were similar to the subgroup differences for descriptions of the average person joining the military. Women were more likely than men to describe those who stay in the military and make it a career using a majority of the statements (both positive and negative). Although men were positive overall, they were more likely than women to view them as selfish. It is important to note that overall adults rated selfish second only to foolish for last place. Adults who had any association with the military had a greater tendency than those who did not, to believe those who make the military a career are loyal, goal-oriented, want military benefits and are poorly paid. Conversely, those without military association were more likely to describe career military as foolish. Older adults were more likely than younger adults to associate negative statements with those who stay in the military. Those ages 22 to 35 were more likely than adults 55 years and older to describe career military as are dedicated to duty and devoted and are goal-oriented. Of adults with children, those without recruit-age children were more likely than those with recruit-age children to perceive military career members as educated.

ADULT POLL 2 22
Finally, data again indicated that those with less than a college degree and those from a household with income less than $40,000 a year consistently rated all items (positive and negative) higher than those with more education and a higher level of income. This may indicate that the two groups use the scale differently. Advice About Options After High School To better understand the role adult Americans play in giving advice to youth–who is giving advice, to whom and how often the advice is given–the following questions were asked: • Suppose a youth came to you for advice about what to do after high school. How likely [very
likely, likely, nether likely nor unlikely, unlikely, very unlikely] is it that you would encourage him or her to attend a four-year college or university, attend a trade, technical, vocational or community college, join a military service, or get a full-time job?
• Did you give advice in the last year to any of the following people about options after high school?
• If yes, was any of that advice you gave about the military? • If yes, was the advice about the military positive or negative? Advice About Four Post-High School Options When asked what advice they would give to a youth graduating from high school, more adults mentioned being very likely or likely to encourage youth to obtain further education: attending a 4-year college or university (94%) and/or a trade, technical, vocational or community college (84%). Two-thirds of adults would recommend joining a military service (66%) and/or getting a full-time job (64%). Results from Adult Poll 2 were not significantly different from those observed in Adult Poll 1 for options after high school with the exception of an eight percentage increase of those who would recommend getting a full-time job (64% in Adult Poll 2 vs. 56% in Adult Poll 1) [Figure 4]. Adults ages 36 and older compared to younger adults, those with less education compared to those with higher education, and adults from households with lower levels of income versus adults earning higher incomes were more likely to recommend the military as an option after high school. Similar subgroup differences were found for recommending trade, technical, vocational or community college. Those more likely to encourage youth to get a full-time job after high school were more likely to be men compared to women, those ages 55 and older compared to those ages 22 to 54, and those with less than a college degree and who earn less than $40,000 compared to those who have a college education or more and those with an income of $40,000 or higher.

ADULT POLL 2 23
Figure 4
Likelihood To Recommend Options AfterHigh School
Suppose a youth came to you for advice about what to do after high school.How likely is it that you would encourage him or her to…
56%
65%
84%
91%
64%
66%
84%
94%
0% 20% 40% 60% 80% 100%
Get a full-time job
Join a military service such as the Army,Navy, Marine Corps, Air Force or Coast
Guard
Attend a trade, technical, vocational orcommunity college
Attend a four-year college or un iversity
Wave 2Wave 1
n= 1,253 (Wave 2)n= 1,109 (Wave 1)
Percent Answering “Very Likely or Likely”
Advice Given About Options After High-School When asked whether they gave advice to youth about post-high school options in the year prior to when the poll was conducted, a third or less of the adult population indicated they had done so. Each respondent who indicated they had given advice to a youth was then asked whether or not that advice was given to:
• Your son • Your daughter • Your brother or sister • Your cousin • Your niece or nephew • Your grandchild
• Some other family member • A friend who is not a family
member • A student who is not a family
member • Someone else who is not a family
member
Most advice about options after high school was given to non-family members: friend (34%) or student (33%). Significantly less advice was given to family members, particularly: niece/nephew (23%), son (20%), daughter (16%), cousin (13%), grandchild (12%), brother/sister (9%), or another family member (15%) [Figure 5]. However, because this question allowed for multiple responses and there were more family response options than non-family, the total percentage of adults who reported giving advice to family members was in fact greater than that for non-family members. Sixty-

ADULT POLL 2 24
three percent (63%) of adults indicated giving advice to one or more family members and 45 percent of adults gave advice to non-family members. Figure 5
Advice About Options After High SchoolDid you give advice in the last year to any of the following people about options
after high school?
19%
33%
34%
15%
9%
12%
13%
16%
20%
23%
0% 10% 20% 30% 40% 50%
Other (non-family member)
Student (non-family member)
Friend (non-family member)
Other Family M ember
Brother/Sister
Grandchild
Cousin
Daughter
Son
Niece/Nephew
n= 1,253
Percent “Yes”

ADULT POLL 2 25
Advice About Military Service Those adults who indicated they had given advice in the past year to a particular youth about options after high school were also asked if any of that advice was about the military. More adults indicated having given military advice to a non-family member rather than a family member. However, while the largest percentage, only 24 percent of adults gave advice about the military as an option after high school to a friend. Notably fewer gave advice about the military to immediate family members: niece/nephew (12%), son (11%), cousin (7%), grandchild (6%), daughter (5%), brother/sister (4%) or another family member (9%) [Figure 6].
Figure 6
Advice About Military ServiceWas any of that advice about the military? If yes, who?
2%
5%
3%
4%
8%
9%
13%
20%
21%
9%
4%
5%
6%
7%
11%
12%
0% 5% 10% 15% 20% 25% 30%
Other (non-family member)
Student (non-family member)
Friend (non-family member)
Other Family Member
Brother/Sister
Daughter
Grandchild
Cousin
Son
Niece/Nephew
Wave 2Wave 1
Percent “Yes” of Entire Sample
n=1,253 (Wave 2)n=1,109 (Wave 1)
Question sequences were not identical. Military advice questions were also asked on Adult Adult Poll 1, but comparisons are not made in this report because the question sequences for advice about military service on Adult Poll 2 differ from those on Adult Poll 1. In Adult Poll 1, adults were first asked whether they had given advice about military service to anyone in the past year and then asked to whom they had given advice. However, the second part of the question sequence did not ask explicitly about advice they had given regarding the military. In Adult Poll 2, the sequence was reversed and respondents were first asked to whom they had given advice about options after high school and then asked if any of the advice was about the military. These distinctions are important to keep in mind when interpreting Figure 6.

ADULT POLL 2 26
Overall, adults who were more likely to give military advice to family members tended to be: • ages 36 to 54 compared to those ages 22 to 35; • those with incomes of $80,000 or less versus those with higher incomes; • adults with less than a college degree compared to those with a college degree or
higher; and • adults who reported greater knowledge of and favorability toward the military
compared to those who expressed a lesser knowledge of and favorability toward the military.
Subgroups that were more likely to give military advice to non-family members tended to be: • women versus men; • ages 36 to 54 compared to those ages 55 and older; • adults in positions of youth leadership compared to non-youth leaders; • those with military association (had personally served or knew of family/others who
served in the military) compared to those without any military association (had never served or did not know of family/others who served in the military); and
• adults who reported greater knowledge of and favorability toward the military compared to those who expressed a lesser knowledge of and favorability toward the military.
The majority of adults provided positive advice about the military to those they had advised [Figure 7]. While still overwhelmingly positive, sons (89%) and daughters (88%) were less likely to have received positive advice.

ADULT POLL 2 27
Figure 7
Positive or Negative Military AdviceWas the advice about the military positive or negative?
3%
2%
2%
2%
8%
8%
4%
3%
3%
96%
94%
95%
96%
88%
89%
93%
93%
95%
96%
0% 20% 40% 60% 80% 100%
Other (non-family member)
Friend (non-family member)
Student (non-family member)
Other Family Member
Daughter
Son
Cousin
Grandchild
Niece/Nephew
Brother/Sister
PositiveNegative
n= 53
n= 157
n= 80
n= 100
n= 158
n= 72
n= 121
n= 264
n= 284
n= 169
Percent “Yes” of Those Who GaveMilitary Advice To….
When asked how the situation regarding the World Trade Center and the Pentagon affected their likelihood to recommend the military, two-thirds (66%) of adults mentioned being more likely to recommend youth joining the military. One-fifth (20%) said they were less likely to recommend military service to youth. Thirteen percent (13%) said that the events of September 11th would not change their current likelihood of recommending the military as an option to youth after high school. Favorability of the Military Favorablity of the Military Branches On a 10-point scale, where 1 meant very unfavorable and 10 meant very favorable using all they knew or had heard about the military, adults gave the military a high mean rating of 8.5. Of the military branches, the Air Force (8.8) was rated most favorable and the Army (8.0) was rated least favorable. The Marine Corps (8.5), Navy (8.4) and Coast Guard (8.3) were positioned in between [Figure 8]. In general, adults 55 years and older compared to those younger in age, adults who earn less than $40,000 compared to those who earn $40,000 or more, and those who have less than a college degree versus those who hold a college degree or more were inclined to be more favorable toward the military overall. Analysis of attitude differences among men and women toward each Service revealed that women generally had a more favorable view of the Air Force, Coast Guard and Army than men. In general, adults ages 55 and older were more likely than those in the younger age groups to have a greater favorability

ADULT POLL 2 28
of all branches of the military. Adults with less education were more prone to view all the branches of the military more favorably than those with a college degree. Similarly, adults who earn less than $40,000 were more likely than those who have a higher household income to have a more favorable view of all military branches and components, except the Air Force and Marine Corps.
Figure 8
Favorability of Military BranchesUsing all that you know or have heard about the military/various branches of military,please rate the military/each branch using a 10-point scale where a 1 means veryunfavorable and 10 means very favorable.
8.08.38.48.58.88.5
123456789
10
MilitaryOverall
AirForce
MarineCorps
Navy CoastGuard
Armyn= 1,253
Very unfavorable
Very favorable
Favorablity of the National Guard and Reserves Adults, using all they knew or had heard, rated their favorability of the National Guard and the Reserves each at an 8.2 mean rating on a 10-point scale, where 1 meant very unfavorable and 10 meant very favorable [Figure 9]. The National Guard and Reserve components’ favorability ratings were somewhat lower than those of all Military branches except the Army. Women had a more favorable view of the National Guard and Reserves than did men. The mean rating for the Reserves was higher for adults ages 55 and older than for those ages 22 to 35. Additionally, those with less education and who earn a lower annual income, were more favorable of both the National Guard and the Reserves than those with more education and from households with higher levels of income.

ADULT POLL 2 29
Figure 9
Favorability of Military ComponentsUsing all that you know or have heard about the military/components of the military, please rate the military/components of the military using a 10-point scale where a 1 means very unfavorable and 10 means very favorable.
8.28.28.5
1
2
3
4
5
6
7
8
9
10
Military Overall National Guard Reserv es
n= 1,253
Very unfavorable
Very favorable
Knowledge of the Military In general, most American adults felt they had a modest level of knowledge about the military. When asked to rate their level of knowledge of the military, the mean rating was 6.3 on a scale of 1 to 10, where 1 meant not at all knowledgeable and 10 meant extremely knowledgeable [Figure 10]. Fewer than one in six (16%) said they were extremely knowledgeable about the military (a rating of 9 or 10). Most adults considered themselves very to somewhat knowledgeable of the military, rating it either a 7-8 (34%) or 5-6 (33%). Relatively few said they had little or no knowledge of the military. In subgroup analysis, data revealed that men felt more knowledgeable about the military than did women. Additionally, the average rating was higher for those with military association (i.e., adults who had served in the military and those with immediate and extended family members who had served in the military) compared to those without military association. Similarly the average rating was higher for those adults who expressed greater favorability toward the military compared to those who indicated lesser favorability.

ADULT POLL 2 30
Figure 10
Knowledge of the MilitaryPlease use a scale from 1 to 10 where 1 means not at all knowledgeable and 10 means extremely knowledgeable. Please tell me how knowledgeable you are about the United States Military.
n= 1,253
16%
34% 33%
10% 8%
0%
10%
20%
30%
40%
50%
9-10 7-8 5-6 3-4 1-2
Not at all knowledgeable
Extremely knowledgeable
mean
6.3
12345678910
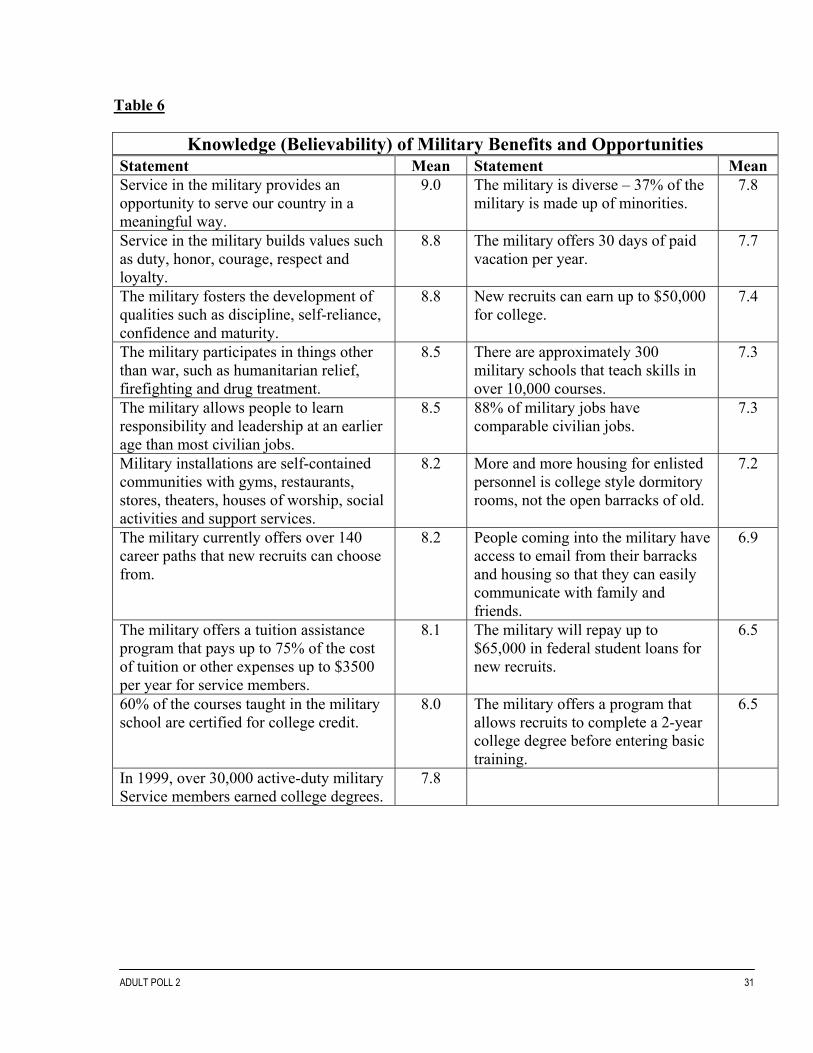
To measure adults’ knowledge about military service on a more specific level, adults were asked to evaluate a list of true statements about the military and rate how much they believed each statement on a 10-point scale where 1 meant not at all believable and 10 meant extremely believable. The statements that were rated most believable of the military focused on dimensions of service and character building and were more general in nature [Table 6]. The three statements that adults viewed the most believable were: service in the military provides an opportunity to serve our country in a meaningful way; service in the military builds values such as duty, honor, courage, respect and loyalty; and the military fosters the development of qualities such as discipline, self-reliance, confidence and maturity.
Those statements adults viewed as least believable of the military were more specific in nature and were: people coming into the military have access to email from their barracks and housing so that they can easily communicate with family and friends; the military will repay up to $65,000 in federal student loans for new recruits; and the military offers a program that allows recruits to complete a 2-year college degree before entering basic training.
ADULT POLL 2 31
Table 6
Knowledge (Believability) of Military Benefits and Opportunities Statement Mean Statement Mean Service in the military provides an opportunity to serve our country in a meaningful way.
9.0 The military is diverse – 37% of the military is made up of minorities.
7.8
Service in the military builds values such as duty, honor, courage, respect and loyalty.
8.8 The military offers 30 days of paid vacation per year.
7.7
The military fosters the development of qualities such as discipline, self-reliance, confidence and maturity.
8.8 New recruits can earn up to $50,000 for college.
7.4
The military participates in things other than war, such as humanitarian relief, firefighting and drug treatment.
8.5 There are approximately 300 military schools that teach skills in over 10,000 courses.
7.3
The military allows people to learn responsibility and leadership at an earlier age than most civilian jobs.
8.5 88% of military jobs have comparable civilian jobs.
7.3
Military installations are self-contained communities with gyms, restaurants, stores, theaters, houses of worship, social activities and support services.
8.2 More and more housing for enlisted personnel is college style dormitory rooms, not the open barracks of old.
7.2
The military currently offers over 140 career paths that new recruits can choose from.
8.2 People coming into the military have access to email from their barracks and housing so that they can easily communicate with family and friends.
6.9
The military offers a tuition assistance program that pays up to 75% of the cost of tuition or other expenses up to $3500 per year for service members.
8.1 The military will repay up to $65,000 in federal student loans for new recruits.
6.5
60% of the courses taught in the military school are certified for college credit.
8.0 The military offers a program that allows recruits to complete a 2-year college degree before entering basic training.
6.5
In 1999, over 30,000 active-duty military Service members earned college degrees.
7.8

ADULT POLL 2 32
Differences were found in subgroup analyses. Men were significantly more likely than women to believe that the military offers the following benefits: • Military installations are self-contained communities with gyms, restaurants, stores,
theaters, houses of worship, social activities and support services. • The military currently offers over 140 career paths that new recruits can choose
from. • The military is diverse – 37% of the military is made up of minorities. • The military offers 30 days of paid vacation per year. • New recruits can earn up to $50,000 for college. • There are approximately 300 military schools that teach skills in over 10,000 courses. • More and more housing for enlisted personnel is college style dormitory rooms, not
the open barracks of old. • The military offers a program that allows recruits to complete a 2-year college
degree before entering basic training. In general, adult Americans ages 22-54 compared to those 55 and older, had a greater tendency to rate a majority of the military benefits higher. In contrast, those ages 36 years and older were more likely than those ages 22 to 35 to believe that service in the military provides an opportunity to serve our country in a meaningful way. Those ages 36 to 54 were more likely than younger adults (22-35) to perceive that service in the military builds values and allows people to learn responsibility. Compared to those ages 55 and older, adults ages 36 to 54 also had a greater likelihood to believe the military: • allows people to learn responsibility. • Military installations are self-contained communities with gyms, restaurants, stores,
theaters, houses of worship, social activities and support services. • 60% of the courses taught in the military school are certified for college credit. Adults with less than a college degree were more likely than those with at least a bachelor’s degree to believe service in the military provides an opportunity to serve our country in a meaningful way, service in the military builds values such as duty, honor, courage, respect and loyalty, the military fosters the development of qualities such as discipline, self-reliance, confidence and maturity, and the military allows people to learn responsibility and leadership at an earlier age than most civilian jobs. The higher educated segment was more likely to believe that the military offers over 140 career paths that new recruits can choose from, military installations are self-contained communities, offers a tuition assistance program, the military is diverse, and that people coming into the military have access to email from their barracks.Where significant differences were identified among different levels of income earners, data showed that adults with incomes of $40,000 or more were more likely than those earning less than $40,000 to believe the statements describing the military. Adults who reported having served in the military or knew of family members who had served in the military were considerably more likely than those without any military association or experience to believe the following to be true:

ADULT POLL 2 33
• Service in the military provides an opportunity to serve our country in a meaningful way.
• The military participates in things other than war, such as humanitarian relief, firefighting, and drug enforcement.
• Military installations are self-contained communities with gyms, restaurants, stores, theaters, houses of worship, social activities and support services.
• The military offers a tuition assistance program that pays up to 75% of the cost of tuition or other expenses up to $3500 per year for service members.
• In 1999, over 30,000 active-duty Military Service members earned college degrees. • The military is diverse – 37% of the military is made up of minorities. • The military offers 30 days of paid vacation per year. • More and more housing for enlisted personnel is college style dormitory rooms, not
the open barracks of old. • The military offers a program that allows recruits to complete a 2-year college
degree before entering basic training. Adults who considered themselves to be more knowledgeable about the military were also more strongly convinced that the military offers all the opportunities mentioned. Similarly, adults who considered themselves to be more favorable toward the military were more convinced of the opportunities, with the exception of having access to email from the barracks and offering a program that allows recruits to complete a 2-year college degree before entering basic training. Multivariate Analysis To gain further insight into the key drivers of giving advice to joining the military, multivariate analysis based on unweighted data, consisting of two phases, was performed. • Phase 1: A factor analysis was conducted on 25 image statements to reduce them to a
manageable number of dimensions mapping people’s perceptions of the military. • Phase 2: An ordered probit regression model was developed using the identified
dimensions and other survey variables, to explain likelihood to give advice to join the military.
Factor analysis attempts to identify underlying variables, or factors, that explain the pattern of correlations within a set of observed variables. Factor analysis is often used in data reduction to identify a small number of factors that explain most of the variance observed in a much larger number of manifest variables. The factor analysis was conducted using the list of 25 image statements about the military. All valid cases were used (n=1253). Non-response items were assigned a mean value, to ensure inclusion of cases with missing values on any of the variables used in the model. Five factors emerged from the analysis. Figure 11 shows four of these dimensions were significant. The fifth factor was not considered in further analysis. These factors represented the four dominant themes by which adults characterized the military.

ADULT POLL 2 34
Figure 11
Factor Analysis Factor 1: Patriots • Patriotic • Want to serve the country • Respected • Loyal • Dedicated and devoted • Brave and courageous • Trustworthy and honest • Goal oriented
Factor 2: Benefits and Opportunities • Looking to travel • Want military benefits • Want the job security • Want education and training • Looking for direction
Factor 3: Last Resort • No other options • Selfish • Foolish • People I feel sorry for • Not as qualified as recruits
used to be
Factor 4: Fitting Job • Intelligent • Educated • Authoritative • Work in jobs they enjoy • Work in jobs that fit them
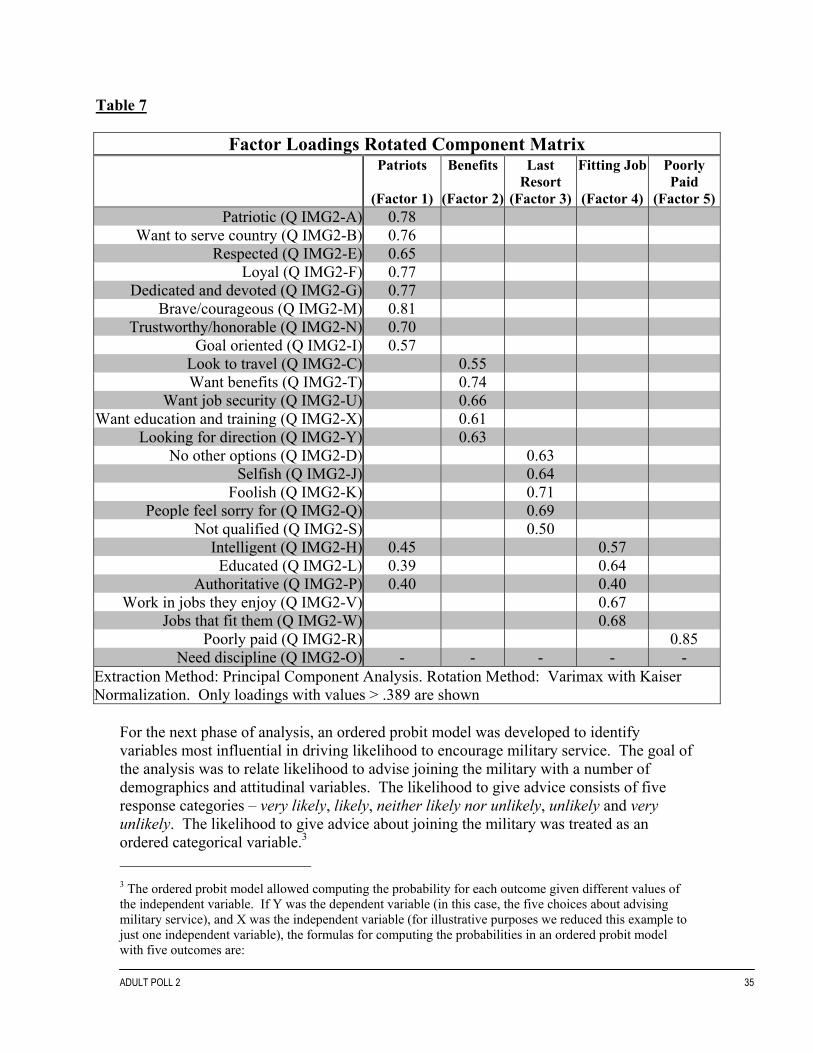
The first image factor characterized the military as Patriots -- courageous, patriotic, and trustworthy. The second image factor related to perceived benefits, such as travel, and job security. A third characterized the military as a last resort for of employment – foolish, or selfish people. The fourth image illustrated the military as educated, intelligent, and with a job that fits them. Table 7 is a table of factor loadings. Most items had high loadings, indicating a strong relationship with the underlying dimensions. Three items (intelligent, educated, and authoritative) loaded in two dimensions; however, for the purpose of this analysis, they were considered indicators of Factor 4 only.
ADULT POLL 2 35
Table 7
Factor Loadings Rotated Component Matrix
Patriots
(Factor 1)
Benefits
(Factor 2)
Last Resort
(Factor 3)
Fitting Job
(Factor 4)
Poorly Paid
(Factor 5)Patriotic (Q IMG2-A) 0.78
Want to serve country (Q IMG2-B) 0.76 Respected (Q IMG2-E) 0.65
Loyal (Q IMG2-F) 0.77 Dedicated and devoted (Q IMG2-G) 0.77
Brave/courageous (Q IMG2-M) 0.81 Trustworthy/honorable (Q IMG2-N) 0.70
Goal oriented (Q IMG2-I) 0.57 Look to travel (Q IMG2-C) 0.55 Want benefits (Q IMG2-T) 0.74
Want job security (Q IMG2-U) 0.66 Want education and training (Q IMG2-X) 0.61
Looking for direction (Q IMG2-Y) 0.63 No other options (Q IMG2-D) 0.63
Selfish (Q IMG2-J) 0.64 Foolish (Q IMG2-K) 0.71
People feel sorry for (Q IMG2-Q) 0.69 Not qualified (Q IMG2-S) 0.50
Intelligent (Q IMG2-H) 0.45 0.57 Educated (Q IMG2-L) 0.39 0.64
Authoritative (Q IMG2-P) 0.40 0.40 Work in jobs they enjoy (Q IMG2-V) 0.67
Jobs that fit them (Q IMG2-W) 0.68 Poorly paid (Q IMG2-R) 0.85
Need discipline (Q IMG2-O) - - - - - Extraction Method: Principal Component Analysis. Rotation Method: Varimax with Kaiser Normalization. Only loadings with values > .389 are shown
For the next phase of analysis, an ordered probit model was developed to identify variables most influential in driving likelihood to encourage military service. The goal of the analysis was to relate likelihood to advise joining the military with a number of demographics and attitudinal variables. The likelihood to give advice consists of five response categories – very likely, likely, neither likely nor unlikely, unlikely and very unlikely. The likelihood to give advice about joining the military was treated as an ordered categorical variable.3 3 The ordered probit model allowed computing the probability for each outcome given different values of the independent variable. If Y was the dependent variable (in this case, the five choices about advising military service), and X was the independent variable (for illustrative purposes we reduced this example to just one independent variable), the formulas for computing the probabilities in an ordered probit model with five outcomes are:

ADULT POLL 2 36
For the ordered probit model, about 1000 simulations were drawn of the main and ancillary parameters. Those sets of simulated parameters were then used to obtain quantities of interest, such as the probability of giving advice to join the military for different levels of the explanatory variables. The Monte Carlo method was used for simulations to allow for the estimation of correct confidence intervals.
Likelihood to give advice was regressed on a set of 16 relevant variables:
1. Age, measured in years, from young to old.
2. Being a member of the Armed Forces (currently or in the past). This new variable was coded 0 for non-members, and 1 for members.
3. Household income, measured on a 7-point scale, from less than $25,000 to $100,000 or more.
4. Level of education, measured in a 9-point scale, ranging from less than high school degree to doctorate degree.
5. Gender, coded 0 for women and 1 for men.
6. Race, coded as a set of two dummy variables: Hispanics and African-Americans. Caucasians and Others were used as a base category in the model. Therefore, coefficients for Hispanics and African-Americans indicate whether differences with Caucasians and Others are significant or not.
7. Overall favorability, measured on a 10-point scale ranging from very unfavorable to very favorable.
8. Likelihood to advise going to college after high school. This variable consisted of five categories (very unlikely, unlikely, neither likely nor unlikely, likely, and very likely).
9. Likelihood to advise getting a full-time job. This variable consisted of five categories (very unlikely, unlikely, neither likely nor unlikely, likely, and very likely).
10. Likelihood to advise going to a community college or technical school. This variable consisted of five categories (very unlikely, unlikely, neither likely nor unlikely, likely, and very likely).
11. Factor 1 - Patriots. This variable was computed as the average score for those mentioning the items belonging to Factor 1 (see Table with factor loadings above).
Pr(yi = 1 / xi) = Φ (τ1 - α - βxi) Pr(yi = 2 / xi) = Φ (τ2 - α - βxi) - Φ (τ1 - α - βxi) Pr(yi = 3 / xi) = Φ (τ3 - α - βxi) - Φ (τ2 - α - βxi) Pr(yi = 4 / xi) = Φ (τ4 - α - βxi) - Φ (τ3 - α - βxi) Pr(yi = 5 / xi) = 1 - Φ (τ4 - α - βxi) where Φ is the c.d.f. function, and the τ’s are thresholds or cutpoint values.
As a general rule, the probability for any observed outcome y = m given xi is:
Pr(yi = m / xi) = Φ (τm - α - βxi) - Φ (τm-1 - α - βxi)

ADULT POLL 2 37
12. Factor 2 - Benefits. This variable was computed as the average score for those mentioning the items belonging to Factor 2 (see Table with factor loadings above).
13. Factor 3 – Last Resort. This variable was computed as the average score for those mentioning the items belonging to Factor 3 (see Table with factor loadings above).
14. Factor 4 – Fitting Job. This variable was computed as the average score for those mentioning the items belonging to Factor 4 (see Table with factor loadings above).
15. Knowledge of five topics: the military allows people to learn responsibility (qkw1g), builds values (qkw1l), fosters development of discipline (qkw1m), and provides opportunity to serve the country (qkw1n).
16. Likelihood to recommend joining the military due to the September 11th attack, ranging from very likely, to not likely.
Tables 8 and 9 show summary statistics and the ordered probit estimates for the model based on the likelihood to give advice to join the military. The coefficients measure the impact of each independent variable on the dependent variable (likelihood to give advice) after controlling by other factors entered in the equation.
Table 8
Summary Statistics for Ordered Probit Model
Model Summary Number of obs=1143
LR chi-square(20)=412.56 Prob > chi square=0
Log likelihood=-1433.7768 Pseudo R2=0.1258

ADULT POLL 2 38
Table 9
Ordered Probit Estimates: Likelihood of Encouraging Youth To Join the Military
Advice about Joining the Military Coef. Std. Err. z P>|z| Patriotic (Factor 1) -0.07 0.03 -2.49 0.01 Benefits (Factor 2) 0.04 0.02 1.75 0.08
Last Resort (Factor 3) 0.11 0.03 3.83 0.00 Fitting Job (Factor 4) -0.07 0.02 -3.02 0.00
Advice attending college -0.06 0.04 -1.29 0.20 Advice getting a job 0.09 0.02 3.69 0.00
Advice attending community college 0.20 0.04 5.47 0.00 Overall favorability 0.15 0.03 5.49 0.00 Learns responsibility 0.06 0.02 2.68 0.01
Builds values 0.06 0.03 2.00 0.05 Fosters discipline -0.03 0.03 -0.83 0.41
Provides opportunity to serve country 0.04 0.03 1.56 0.12 Age 0.00 0.00 1.70 0.09
More likely to recommend due to recent events -0.34 0.04 -7.83 0.00 Male -0.07 0.07 -1.01 0.32
Hispanic 0.37 0.12 2.95 0.00 African-American -0.11 0.11 -0.97 0.33
Current or previous member of the military 0.37 0.10 3.71 0.00 Education 0.00 0.02 -0.24 0.81
Income -0.03 0.02 -1.43 0.15 cutpoint 1 1.21 0.42 cutpoint 2 2.00 0.42 cutpoint 3 2.57 0.42 cutpoint 4 3.97 0.42
Ancillary Parameters
Table 10 displays the proportion of adults likely to advise joining the military when low and high values for each of the independent variables are considered, holding all other factors constant. Percentage differences are presented too, allowing changes to be simulated on the likelihood to give advice when manipulating each of the driving factors. The results indicated that characterizing the military through the fitting job factor (intelligent, educated, authoritative, fitting and enjoy), being more favorable toward the military, recommending a community college, learning responsibility, building values, having had a personal experience in the military and being Hispanic all had a positive impact on giving advice to join the military.

ADULT POLL 2 39
In this regard, the largest positive effect on advice corresponds to Factor 4 “Fitting Job,” whereas being courageous, Factor 1 “Patriots, ” has a strong, negative effect (after controlling by other variables). It is important to note that a simple, bivariate relationship exists between Factor 1 and ‘advice,’ and that it is positive. In this relationship, when people think about being courageous as something positive, there are also additional factors that underlie those perceptions. It might be the indirect effect of those things that make this variable look positive. However, after factoring out other questions entered in the model, the relationship becomes negative. To this effect, the perception may be that a consequence of being courageous in the military encompasses possible danger. Table 10 shows that the percentage of people very likely to give advice increased from seven to thirty percent, when Factor 4 “Fitting Job” went from a low to a high value. Three variables—builds values, learns responsibility and Hispanic—each had a significant, positive effect on the likelihood to give advice to join the military, increasing the very likely option by an 11 percent margin each. (Notice that modeled values do not necessarily match.)
Table 10
Factors Affecting the Likelihood To Give Advice: Simulation Results Very unlikely Unlikely Neither Likely Very likely
Likelihood to Advise Joining the Military
- +
% D
iffer
ence
- + %
Diff
eren
ce
- +
% D
iffer
ence
- +
% D
iffer
ence
- +
% D
iffer
ence
Patriots (Factor 1) 1 5 4 6 15 9 11 19 8 50 48 -2 32 13 -19 Benefits and opportunities (Factor 2) 5 3 -3 15 10 -5 19 16 -4 47 51 4 13 21 8 Last resort (Factor 3) 2 9 6 9 20 10 15 21 6 51 42 -9 22 9 -14 Fitting job (Factor 4) 11 1 -10 22 6 -16 22 12 -10 38 51 12 7 30 23
Advice attending college - - - - - - - - - - - - - - -
Advice getting a job 5 2 -3 15 10 -6 20 15 -4 47 51 4 13 21 9
Advice attending community college 11 2 -9 22 9 -13 22 15 -7 38 51 13 6 23 16
Overall favorability 23 2 -22 29 8 -20 21 14 -7 25 51 27 2 24 22
Learns responsibility 8 3 -6 19 10 -9 21 16 -5 42 51 9 9 20 11 Builds values 10 3 -7 20 10 -10 21 16 -5 41 51 10 8 20 11 Fosters discipline - - - - - - - - - - - - - - - Provides opportunity to serve country - - - - - - - - - - - - - - - Age 4 2 -2 13 9 -4 18 15 -3 49 51 2 15 22 7 Less likely to recommend due to 9/11 2 9 7 9 20 11 15 22 7 51 41 -10 23 -23 Male - - - - - - - - - - - - - - - Hispanic 4 2 -2 12 7 -5 17 13 -5 50 51 1 17 28 11 African-American - - - - - - - - - - - - - - - Served or member of the military 4 2 -2 13 7 -5 18 13 -5 50 51 2 16 27 11 Education - - - - - - - - - - - - - - -
Inde
pend
ent v
aria
bles
with
sign
ifica
nt im
pact
Income 3 4 1 10 13 3 16 18 2 51 49 -2 20 16 -4

ADULT POLL 2 40

ADULT POLL 2 A-1
6. APPENDIX A SAMPLE DESIGN AND IMPLEMENTATION
Sample Design According to the 1990 Census, there were 87.1 million telephone households in the United States. About 70% of these households were directory-listed. However, each year, about 20 percent of American households move, so that 12 percent to 15 percent of the residential numbers in a typical directory are disconnected, reducing directory-based surveys to project to only 56 million telephone households. Approximately 30 percent of telephone households in the U.S. have unlisted numbers. Samples drawn entirely from directories, and “plus-one” techniques based on directory seed numbers often significantly under-represent unlisted households. To overcome these barriers to obtaining representative random samples, a random digit dialing (RDD) methodology is required. For the adult poll implementation, the sample was purchased from Survey Sampling, Inc.® (SSI). SSI gives a detailed description of their sampling products in “Random Digit Dial Telephone Sampling Methodology.” Creation of the Random Digit Database SSI starts with a computer file of over 64 million directory-listed households. This file of directory-listed telephone numbers was subjected to an extensive cleaning using area code and exchange data regularly obtained from Bellcore and additional databases. The validation process ensures that all exchanges are currently valid, assigned to the correct area code, and fall within an appropriate set of ZIP Codes. Each exchange was assigned to a single county. Nationally, about 72 percent of all assigned exchanges appear to fall totally within single county boundaries. For those exchanges that overlap county and/or state lines, the exchanges were assigned to the county with the highest number of listed residents within the exchange. This assignment prevented overrepresentation of these exchanges. SSI samples are generated using a database of “working blocks.” A block (also known as a 100-bank or a bank) is a set of 100 contiguous numbers identified by the first two digits of the last four digits of a telephone number. For example, in the telephone number 255-4200, “42” is the block. A block is termed to be working if one or more listed telephone numbers are found in that block. SSI updates its database at approximately 6-week intervals. Updates were done according to geographic section following the schedule below in 2001: Section 1: Northeast and Mid-Atlantic, January 1, 2001, June 17, 2001 and December 2,
2001 Section 2: South, February 11, 2001, and July 29, 2001

ADULT POLL 2 A-2
Section 3: Midwest, March 25, 2001 and September 9, 2001 Section 4: Northwest and West, May 6, 2001 and October 21, 2001
Sample Stratification All SSI samples are generated using stratified sampling procedures. Stratified sampling divides the population of sampling units into sub-populations called strata. A separate sample is then selected from the sampling units in each stratum. SSI stratifies its database by county. Prior to sample selection, the sample was allocated proportionally across all strata in the defined geography using several frame adjustment options. The sampling frame determines the way a sample is distributed across geography at the county level. SSI offers five different measurement of size (MOS) stratification frames for its random digit samples; however, SSI’s “estimated number of telephone households” is the recommended frame for apportioning Random B samples. The technique used to generate the sample for this study was Random B and is described below. Telephone household estimates are calculated by subtracting Census non-telephone household counts from current household estimates. Sample units were allocated to each county in proportion to its share of telephone households. Samples were first systematically stratified to each county in the survey area in proportion to the sampling frame selected. After a geographic area was defined as a combination of counties, the sum of the estimated telephone households or requested frame value was calculated and divided by the desired sample size to produce a sampling interval. Sample Selection Once allocated, SSI selects the sample using one of the following approaches: 1) Random B, 2) Random A and 3) Epsem. Random B was used for the adult polls although Random A was used for the youth polls. Descriptions of the three sample selection approaches follow. Random B is a term used by SSI to denote samples of random numbers distributed across all eligible blocks in proportion to their density of listed telephone households. All blocks within a county are organized in ascending order by area code, exchange, and block number. Once the quota has been allocated to all counties in the frame, a sampling interval is calculated by summing the number of listed residential numbers in each eligible block within the county and dividing that sum by the number of sampling points assigned to the county. From a random start between zero and the sampling interval, blocks are systematically selected in proportion to their density of listed households. Once a block has been selected, a 2-digit number is systematically selected in the range 00-99 and is appended to the exchange and block to form a 10-digit telephone number.

ADULT POLL 2 A-3
Random A is an SSI term denoting samples of random numbers systematically selected with equal probability across all eligible blocks. All blocks within a county are organized in ascending order by area code, exchange, and block number. Once the quota has been allocated to all the counties in the frame, a sampling interval is calculated for each county by summing all the eligible blocks in the county and dividing that sum by the number of sampling points assigned to the county. From a random start between zero and the sampling interval, blocks are systematically selected from each county. Once a block has been selected, a 2-digit number is systematically selected in the range 00-99 and is appended to the exchange and block, to form a 10-digit telephone number. Epsem Samples (equal probability of selection method) are single stage, equal probability samples of all possible 10-digit telephone numbers in blocks with one or more listed telephone numbers. The Working Phones Rate (WPR) for an epsem sample is on average 50 percent, but can range from 30 percent to 70 percent depending on the size and nature of the geographic area and local telephone number assignment practices. Epsem sampling uses a total active blocks frame and Random A sampling methodology. A sample of random numbers is systematically selected with equal probability across all blocks containing one or more listed numbers, which distributes the sample across counties in proportion to their share of total active blocks. Epsem samples have the following characteristics: • Minimum block size is 1. • Business numbers cannot be replaced, but can be flagged. • Number protection is unavailable. A Random B sample with three working blocks that eliminated business numbers and protected selected numbers was used for this study. Random B samples are samples of random numbers distributed across all eligible blocks in proportion to their density of listed telephone numbers. These samples are convenient for “quick polling” techniques. Because these samples are selected from blocks according to their density of listed telephone households, there is a possibility that highly unlisted areas may be underrepresented. However, the tradeoff is in efficiency. A 65 percent working phone rate was expected with this Random B sample. The sample for this study had three or more working blocks4. Blocks with two or fewer “working” numbers were not included for the following reasons: 1. On average, they contain 55 percent bad records. (For random B sample, it is
approximately 30 percent bad.)
4 A block (also known as a 100-bank or a bank) is a set of 100 contiguous numbers identified by the first two digits of the last four digits of a telephone number. For example, in the telephone number 255-4200, "42" is the block. A block is termed to be working if one or more listed telephone numbers are found in that block.

ADULT POLL 2 A-4
2. These blocks often contain faulty phone numbers such as numbers that are actually typographical errors in the phone books.
3. There aren't a great number of functioning telephone numbers in the one and two working blocks. While these blocks comprise 3.8% of “active” blocks, they contain only 0.1% of the listed numbers.
Sample Geography Interviews were conducted in all 50 states plus the District of Columbia. Weighting Information Demographic Profile of Population Final data were weighted by age, education and race/ethnicity according to the August 2001 Current Population Survey5 [Table 11].6.
Table 11
Weighting Variables Variable August
2001 CPS Age
22-27 years 11.67% 28-40 years 28.49% 41-58 years 36.43% 59-76 years 18.37% 77+ years 5.05%
Education High school or less 47.35%
Some college 26.44% College degree or more 26.21%
Race/Ethnicity Non-Hispanic White 73.21% Non-Hispanic Black 11.50% Non-Hispanic Other 4.73%
Hispanic 10.57%
5 Bureau of the Census. (2002). Current Population Survey. Washington DC: Author. Available: http://www.bls.census.gov/cps 6 Final data were weighted by race/ethnicity in Adult Poll 2, rather than separately by race and ethnicity as was done in Adult Poll 1.

ADULT POLL 2 A-5
Table 12 displays the weighted and unweighted subgroup sample sizes by age and Table 13 displays the same counts by race/ethnicity.
Table 12
Age Age Unweighted n Weighted n Weighted %
22-27 years 133 146 12%28-40 years 371 357 28%41-58 years 511 456 36% 59-76 years 193 230 18%
77+ 45 63 5%TOTAL 1,253 1,253 100%
Table 13
Race/Ethnicity
Race/Ethnicity Unweighted n Weighted n Weighted % Non-Hispanic White 979 917 73%Non-Hispanic Black 115 144 11%Non-Hispanic Other 63 59 5%
Hispanic 96 132 11%TOTAL 1,253 1,253 100%
Table 14 displays sample sizes by current education level.
Table 14
Education Education Unweighted n Weighted n Weighted %
High school or less 315 594 47%Some college 500 331 26%
College degree or more 438 328 26%TOTAL 1,253 1,253 100%
Handling of Cell Phone Numbers There were 103,830 residential and business exchanges in the United States at the time the sample for this poll was pulled. Additionally, there were 18,491 exchanges dedicated to wireless use. SSI treats these numbers as business numbers and does not include them in RDD sample pulls.

ADULT POLL 2 A-6
Replicates For this poll, the sample was identified and released in replicates (representative stand-alone mini-samples). When using a replicate system, the interviewers did not need to dial the entire sample as each replicate was representative of the entire sample. All replicates loaded were closed out and dialed until exhausted. A sample record was considered “exhausted” once it had obtained a final disposition, such as disconnected, complete, or refusal, or once the maximum number of attempts had been made on the sample. To guard against too many “extra” interviews, the size of the replicates was reduced as the interview period drew to a close. Quotas and Thresholds Because of the speed at which polls are conducted and the rate at which surveys are completed, it is often necessary to set quotas, or the minimum number of completed for each area. This is done to help ensure a representative sample is obtained. Therefore, soft quotas, or a target for the minimum number of surveys to be complete, were placed on each region. Additionally, soft quotas were placed on race/ethnicity. To increase the likelihood of reaching respondents, interviews were conducted during the evening and weekend hours. This meant interviewing took place over a slightly longer timeframe. Therefore, the following “guides” for each region were set in place:
New England (4.95%) Connecticut, Maine, Massachusetts, New Hampshire, Rhode Island, Vermont
Mid-Atlantic (17.10%) Delaware, DC, Maryland, New Jersey, New York, Pennsylvania, West Virginia
Great Lakes (17.79%) Illinois, Indiana, Michigan, Minnesota, Ohio, Wisconsin
Farm Belt (5.09%) Iowa, Kansas, Missouri, Nebraska, North Dakota, South Dakota
Outer South (23.15%) Florida, Kentucky, North Carolina, Oklahoma, Tennessee, Texas, Virginia
Deep South (9.46%) Alabama, Arkansas, Georgia, Louisiana, Mississippi, South Carolina
Mountain (6.46%) Arizona, Colorado, Idaho, Montana, Nevada, New Mexico, Utah, Wyoming
Pacific (16.00%) California, Oregon, Washington, Hawaii and Alaska Thresholds, rather than quotas, were set on race and ethnicity. The following questions were used to determine ethnicity and race: Ethnicity: Do you consider yourself to be of Hispanic, Latino or Spanish origin?
Race: Do you consider yourself to be (1) White, (2) Black or African American, (3)
Asian [Includes Chinese, Japanese, Filipino, Korean, Vietnamese, Asian

ADULT POLL 2 A-7
Indian, or other Asians], (4) American Indian or (5) Alaska Native, Native Hawaiian or other Pacific Islander or (6) Other, Hispanic only?
Survey Implementation Screening Each household was screened for adults ages 22 to 85. If there was more than one person in the household who met those criteria, the respondent in the household with the most recent birthday prior to the interview date was selected. There was no within household substitution of the designated respondent, even if the designated respondent did not qualify for the interview. Callback Procedure One initial call and a maximum of three callbacks were allowed. If a household was not reached after four calls, another randomly selected household was substituted. The following was the scheme for dialing four attempts per record. Within three to four days of loading a replicate, all sample records were dialed one time. The only records that had a second or higher attempt made on them before a first attempt was made on all new replicate records were the definite or indefinite appointments and a busy line. “Definite” and “indefinite” appointments are instances where a respondent either gives an interviewer a specific time to call or a general time to call. Busy line records were dialed again at a default time of 20 minutes later and only after this follow-up try did it count as one attempt.

ADULT POLL 2 A-8
All sample records not assigned a final disposition or set as appointments went into a general sample queue and were released by the following algorithm:
(last day - now) W= ------------------------ (X - (times tried - 1))
X - This number was 10 due to the number of times sample records were to be attempted. “W” is the acceptable window where the next appointment was scheduled. The following formula was then applied:
r = rand() / W appt_t = (now + r) * 60
The rand () function returns a multiplicative random number, which has been ceded by the number of seconds elapsed since January 1st, 1970. This is then taken by modulus W to get a random daypart within the window. The result was then added to the current time and performed a unit conversion to get appt_t in terms of seconds. This result was checked against a list of valid appointment times for weekdays, Saturday and Sunday. If the record fell within the accepted dayparts for these days, interviewers continued to dial the record; otherwise, the formula was applied until numbers were released. Depending upon sample type for attempts three and four, records were moved into a special dialing queue, which was released at the specified extended respondent dialing times. Sample records that reached the maximum four attempts were moved to an inactive queue where they were not accessible to the interviewers. Refusal Conversion An active program of refusal conversion was used. All initial refusals were put into a queue to be worked by a group of interviewer specialists, trained and experienced in refusal conversion. Up to an additional three call backs, conducted at different times and days, were made. If a household was not reached after three calls or if a second refusal occurred, a “hard” refusal was recorded on the final disposition. Experience shows that approximately eight percent of the competed interviews will come from refusal conversions.

APPENDIX B
ADULT POLL 2 B-1
ADULT POLL 2 INTERVIEW GUIDE
Notes for Users This document is annotated to show variable names and data values. There are also
“Notes for Users” when simpler annotation was not possible. The strikethroughs show where the data values differ from those shown in the questionnaire. Yellow highlighting is used to indicate inserted text. There are two variables in the dataset not shown in this document: ID (a unique identifier) and WT (the analysis weight).
PROJECTED TIME: 31 MINUTES - RESPONDENTS AGED 22- 85 ACTUAL TIME: 27 MINUTES - RESPONDENTS AGED 22- 85 GENERAL INSTRUCTIONS Target Audience: Each household will be screened for adults aged 22 and older. If there is more than one
person in the household who meets those criteria, we will select the respondent in the household over 22 with the most recent birthday prior to the interview date. There will be no within household substitution of the designated respondent, even if the designated respondent does not qualify for the interview.
Field Dates: Pre-test September 25-26, 2001 Launch study on September 27, 2001 Complete interviewing on October 8, 2001 Administration Dates: September 26-October 6, 2001 Length: This interview should last approximately 25 minutes. Geography: 100% United States - including Alaska, Hawaii and the District of Columbia Sample Size: N=1250 adult Americans aged 22 and older (70% incidence) Actual Sample Size: N=1253 Quotas: GENDER: 52% Female, 48% Male RACE/ETHNICITY: Thresholds (According to the Profile of General Demographic
Characteristics, 2000 Census of Population and Housing, US Department of Commerce): White 77.1% Black or African American 12.9% American Indian and Alaskan Native 1.5% Asian 4.2% Native Hawaiian and Other Pacific Islander 0.3% Some Other Race 6.6% Hispanic or Latino (of any race) 12.5%

APPENDIX B
ADULT POLL 2 B-2
QSPMARK REGION: Soft quotas on 8-point geo-code
1 New England (4.95%) Connecticut, Maine, Massachusetts, New Hampshire, Rhode Island, Vermont
2 Mid-Atlantic (17.10%) Delaware, DC, Maryland, New Jersey, New York, Pennsylvania, West Virginia
3 Great Lakes (17.79%) Illinois, Indiana, Michigan, Minnesota, Ohio, Wisconsin
4 Farm Belt (5.09%) Iowa, Kansas, Missouri, Nebraska, North Dakota, South Dakota
5 Outer South (23.15%) Florida, Kentucky, North Carolina, Oklahoma, Tennessee, Texas, Virginia
6 Deep South (9.46%) Alabama, Arkansas, Georgia, Louisiana, Mississippi, South Carolina
7 Mountain (6.46%) Arizona, Colorado, Idaho, Montana, Nevada, New Mexico, Utah, Wyoming
8 Pacific (16.00%) California, Oregon, Washington, Hawaii and Alaska
Sample: Random B sample, with minimum of three working blocks. All samples will be screened
for business numbers. Dialing Procedures: Interviews will be conducted during the evening and weekend hours. The fieldwork will
take place from our in-house telephone centers located in Orem, Utah and Grand Rapids, MI and will utilize computer assisted telephone interviewing (CATI).
Callback Procedures: Plan an initial call and maximum of three callbacks. If a household is not reached after four
calls, we will substitute another randomly selected household. Callbacks will be scheduled on different days, different times of the day and in different weeks.
Refusal Conversion: All initial refusals are put into a queue to be worked by a group of interviewer specialists,
trained and experienced in refusal conversion. Up to an additional three call backs, conducted at different times and days, will be made. If a household is not reached after three calls or if a second refusal occurs, a “hard” refusal will be recorded on the final disposition. Experience shows that approximately 10% of the completed interviews will come from refusal conversions.
Pre-test: We will conduct a pre-test of the survey instrument on September 25-26, 2001 in our Orem,
Utah telephone facility. We will conduct 30 interviews. If the pretest interviews go smoothly and no revisions are made to the questionnaire, they will be included in the final data set.

APPENDIX B
ADULT POLL 2 B-3
SCREENER AND INTRODUCTION 11.05 QUESTION POINTS, 3.7 MINUTES SCREENER QINTRO1 INTRO 1: Hello, I'm ______________________ of Wirthlin Worldwide, a national research firm and
I'm calling for a study that is being conducted for the United States Government to learn about Americans’ attitudes and perceptions of the United States military. For quality purposes, my supervisor may monitor this call. (DO NOT PAUSE) [1 QP]
. (SAS/SPSS numeric missing) QGPA GPA. Could I speak with a member of this household who is between the ages of 22 and 85 and has
had the most recent birthday, please? [0.5QP] 1 Yes 2 No, respondent isn’t available 3 No, there isn’t a respondent (living) in the household who is between the ages of 22 and 85 4 No, you can’t talk to the person
IF GPA=1, WAIT UNTIL RESPONDENT GETS ON THE PHONE AND READ INTRO2. IF GPA=2, ARRANGE CALLBACK IF GPA=3, CODE AS INELIGIBLE, THANK AND TERMINATE IF GPA=4, CODE AS REFUSAL, THANK AND TERMINATE QINTRO2 INTRO2 Hello, I'm ______________________ of Wirthlin Worldwide, a national research firm and
I'm calling for a study that is being conducted for the United States Government to learn about Americans’ attitudes and perceptions of the United States military. For quality purposes, my supervisor may monitor this call. (DO NOT PAUSE) [1 QP]
. (SAS/SPSS numeric missing) QPRIV1 PRIV1. All information you provide is protected under the Privacy Act of 1974. Your identity will not
be released for any reason and your participation is voluntary. You are entitled to a copy of the Privacy Act Statement. Would you like a copy of this statement? [1QP]
1 YES, RECORD MAILING ADDRESS 2 NO 99 DK/REF
QS1 S1. Could you please tell me your age? [1QP]
1 RECORD ANSWER 99 DK/REF

APPENDIX B
ADULT POLL 2 B-4
[IF S1 < 22 OR S1 > 85 ASK GPA] QS2 S2. For research purposes, may I please verify your gender? [1QP]
1 Male 2 Female
QDEM10; RACE_ETH DEM10. Do you consider yourself to be of Hispanic, Latino or Spanish origin? [1QP]
1 Yes, Mexican, Mexican American, Chicano, Puerto Rican, Cuban, or other
Spanish/Hispanic/Latino origin. 2 No 99 DK/REF
Notes for users RACE_ETH (4 Categories, recoded from QDEM10 & QDEM111-QDEM118) 1 White Non-Hispanic 2 Black Non-Hispanic 3 Hispanic 4 Other, Non-Hispanic ODEM111-ODEM118; QDEM111-QDEM118; RACE_ETH (See DEM10 above) DEM 11 I’m going to read a list of racial categories. Please select one or more to describe your race.
Are you…[READ PUNCHES 1-5.] [NOTE: If respondent says “Don’t Know” or doesn’t mention a punch below, SAY: “Which of the following race categories do you most closely identify with?”] CODE UP TO 5 RESPONSES] [1 QP]
1 Yes 0 No
QDEM111 1 White QDEM112 2 Black or African-American QDEM113 3 American Indian or Alaskan Native QDEM114 4 Asian (e.g., Asian Indian, Chinese, Filipino, Japanese, Korean,
Vietnamese) QDEM115 5 Native Hawaiian or Other Pacific Islander (e.g., Samoan, Guamanian or Chamorro) QDEM116 6 [DO NOT READ] Other HISPANIC ONLY (Mexican, Mexican
American, Chicano, Puerto Rican, Cuban, or other Spanish/Hispanic/Latino origin.))
7 REF [THANK AND TERMINATE] 8 Don’t know [THANK & TERMINATE] QDEM117 Don’t know /Refused QDEM118 Not Applicable
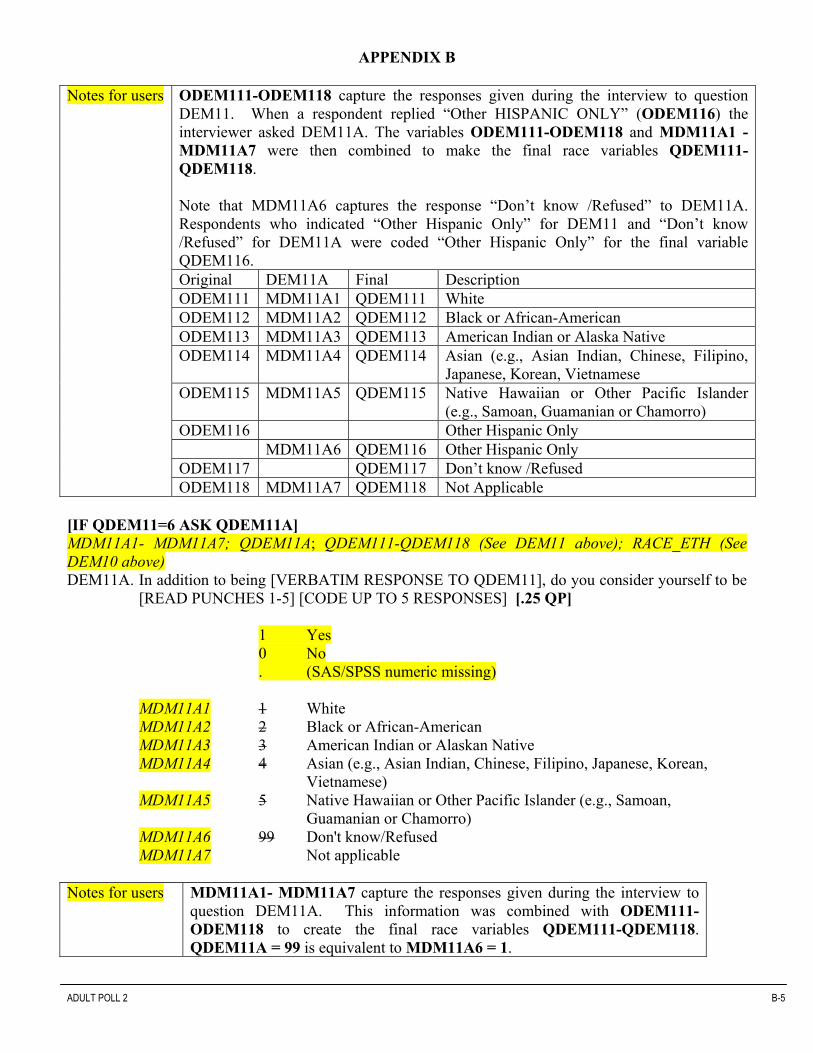
APPENDIX B
ADULT POLL 2 B-5
Notes for users ODEM111-ODEM118 capture the responses given during the interview to question
DEM11. When a respondent replied “Other HISPANIC ONLY” (ODEM116) the interviewer asked DEM11A. The variables ODEM111-ODEM118 and MDM11A1 - MDM11A7 were then combined to make the final race variables QDEM111-QDEM118. Note that MDM11A6 captures the response “Don’t know /Refused” to DEM11A. Respondents who indicated “Other Hispanic Only” for DEM11 and “Don’t know /Refused” for DEM11A were coded “Other Hispanic Only” for the final variable QDEM116.
Original DEM11A Final Description ODEM111 MDM11A1 QDEM111 White ODEM112 MDM11A2 QDEM112 Black or African-American ODEM113 MDM11A3 QDEM113 American Indian or Alaska Native ODEM114 MDM11A4 QDEM114 Asian (e.g., Asian Indian, Chinese, Filipino,
Japanese, Korean, Vietnamese ODEM115 MDM11A5 QDEM115 Native Hawaiian or Other Pacific Islander
(e.g., Samoan, Guamanian or Chamorro) ODEM116 Other Hispanic Only MDM11A6 QDEM116 Other Hispanic Only ODEM117 QDEM117 Don’t know /Refused
ODEM118 MDM11A7 QDEM118 Not Applicable [IF QDEM11=6 ASK QDEM11A] MDM11A1- MDM11A7; QDEM11A; QDEM111-QDEM118 (See DEM11 above); RACE_ETH (See DEM10 above) DEM11A. In addition to being [VERBATIM RESPONSE TO QDEM11], do you consider yourself to be
[READ PUNCHES 1-5] [CODE UP TO 5 RESPONSES] [.25 QP]
1 Yes 0 No . (SAS/SPSS numeric missing)
MDM11A1 1 White MDM11A2 2 Black or African-American MDM11A3 3 American Indian or Alaskan Native MDM11A4 4 Asian (e.g., Asian Indian, Chinese, Filipino, Japanese, Korean,
Vietnamese) MDM11A5 5 Native Hawaiian or Other Pacific Islander (e.g., Samoan,
Guamanian or Chamorro) MDM11A6 99 Don't know/Refused MDM11A7 Not applicable
Notes for users MDM11A1- MDM11A7 capture the responses given during the interview to
question DEM11A. This information was combined with ODEM111-ODEM118 to create the final race variables QDEM111-QDEM118. QDEM11A = 99 is equivalent to MDM11A6 = 1.

APPENDIX B
ADULT POLL 2 B-6
QS3 S3. Do you have any children? [1QP]
1 Yes 2 No 99 Don't know/Refused
[IF S3=1 ASK S4] QS4 S4. And how many children do you have? [0.8QP]
RECORD ANSWER 98 NO CHILDREN 99 Don't know/Refused . (SAS/SPSS numeric missing)
[IF S4>0, ASK S5] [IF RESPONDENT HAS CHILDREN] QS5 S5. Are any of your children 27 and younger? [0.8QP]
1 Yes 2 No 99 Don't know/Refused . (SAS/SPSS numeric missing)

APPENDIX B
ADULT POLL 2 B-7
[IF S5 = 1, ASK S6] [IF RESPONDENT HAS CHILDREN AGED 27 AND YOUNGER] QS6; MQS6A1- MQS6A30 S6. What are their ages? [DO NOT READ RESPONSE OPTIONS] [Please record ALL ages,
each separated by a comma, (i.e. 2, 5, 7, 12)] [0.7QP]
1 NO CHILDREN 27 AND YOUNGER 2 Yes (QS6)_______________ (ENTER NUMERIC RANGE, 0-27) 99 Don't know/Refused
Ages given as responses to QS6 = 2 were coded into categories (MQS6A1- MQS6A30). Variable Name 1 = Yes 0 = No
Description
MQS6A1 Less Than 1 MQS6A2 1 Year Old MQS6A3 2 Years Old MQS6A4 3 Years Old MQS6A5 4 Years Old MQS6A6 5 Years Old MQS6A7 6 Years Old MQS6A8 7 Years Old MQS6A9 8 Years Old MQS6A10 9 Years Old MQS6A11 10 Years Old MQS6A12 11 Years Old MQS6A13 12 Years Old MQS6A14 13 Years Old MQS6A15 14 Years Old MQS6A16 15 Years Old MQS6A17 16 Years Old MQS6A18 17 Years Old MQS6A19 18 Years Old MQS6A20 19 Years Old MQS6A21 20 Years Old MQS6A22 21 Years Old MQS6A23 22 Years Old MQS6A24 23 Years Old MQS6A25 24 Years Old MQS6A26 25 Years Old MQS6A27 26 Years Old MQS6A28 27 Years Old MQS6A29 Don’t Know/Refused
Note to users
MQS6A30 Not Applicable
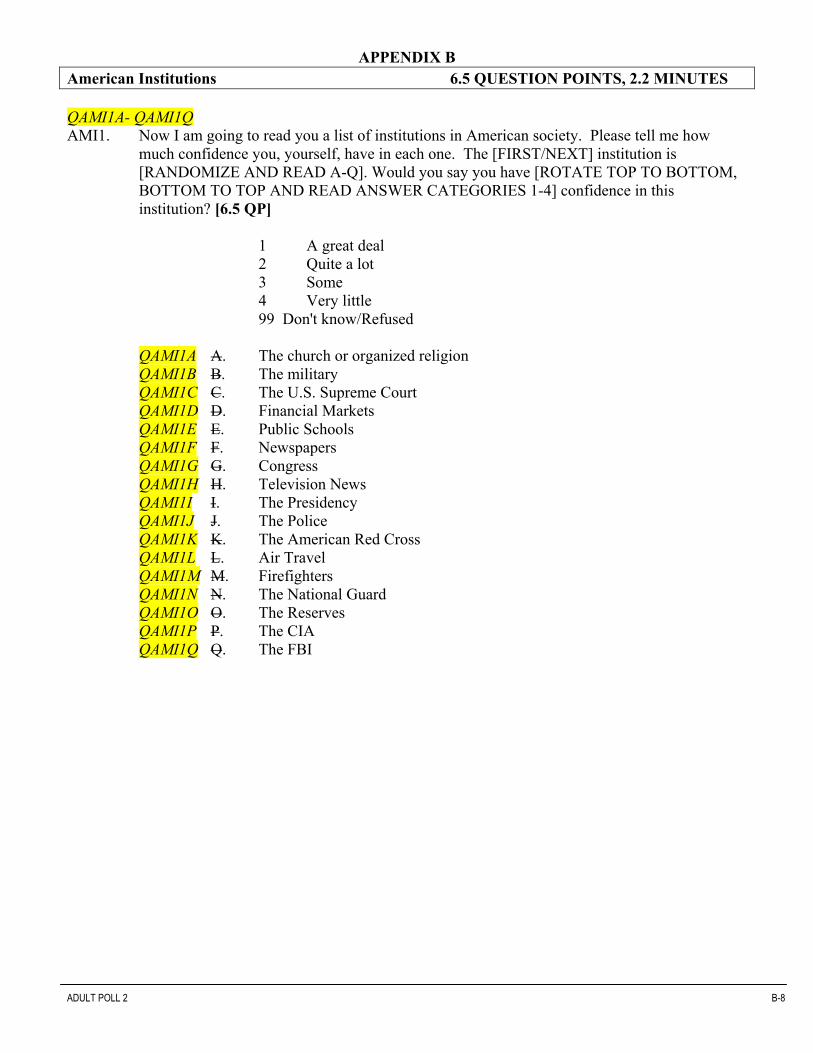
APPENDIX B
ADULT POLL 2 B-8
American Institutions 6.5 QUESTION POINTS, 2.2 MINUTES QAMI1A- QAMI1Q AMI1. Now I am going to read you a list of institutions in American society. Please tell me how
much confidence you, yourself, have in each one. The [FIRST/NEXT] institution is [RANDOMIZE AND READ A-Q]. Would you say you have [ROTATE TOP TO BOTTOM, BOTTOM TO TOP AND READ ANSWER CATEGORIES 1-4] confidence in this institution? [6.5 QP]
1 A great deal 2 Quite a lot 3 Some 4 Very little 99 Don't know/Refused
QAMI1A A. The church or organized religion QAMI1B B. The military QAMI1C C. The U.S. Supreme Court QAMI1D D. Financial Markets QAMI1E E. Public Schools QAMI1F F. Newspapers QAMI1G G. Congress QAMI1H H. Television News QAMI1I I. The Presidency QAMI1J J. The Police QAMI1K K. The American Red Cross QAMI1L L. Air Travel QAMI1M M. Firefighters QAMI1N N. The National Guard QAMI1O O. The Reserves QAMI1P P. The CIA QAMI1Q Q. The FBI
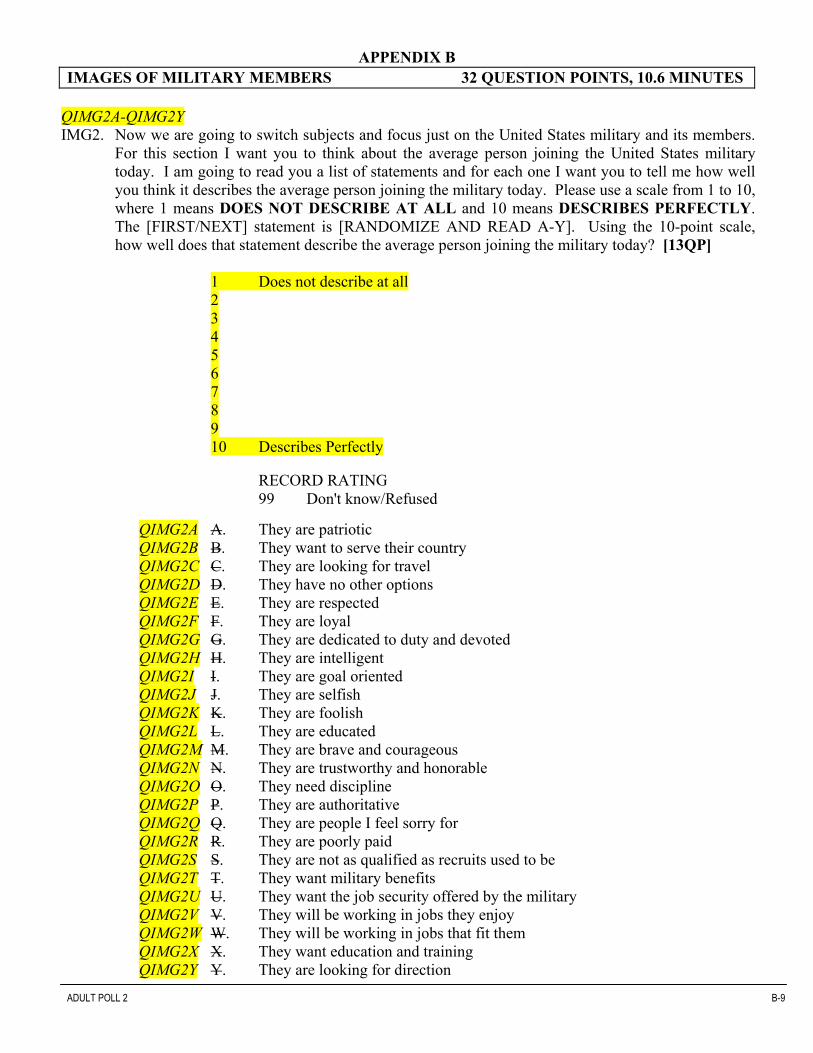
APPENDIX B
ADULT POLL 2 B-9
IMAGES OF MILITARY MEMBERS 32 QUESTION POINTS, 10.6 MINUTES
QIMG2A-QIMG2Y IMG2. Now we are going to switch subjects and focus just on the United States military and its members.
For this section I want you to think about the average person joining the United States military today. I am going to read you a list of statements and for each one I want you to tell me how well you think it describes the average person joining the military today. Please use a scale from 1 to 10, where 1 means DOES NOT DESCRIBE AT ALL and 10 means DESCRIBES PERFECTLY. The [FIRST/NEXT] statement is [RANDOMIZE AND READ A-Y]. Using the 10-point scale, how well does that statement describe the average person joining the military today? [13QP]
1 Does not describe at all 2 3 4 5 6 7 8 9 10 Describes Perfectly
RECORD RATING 99 Don't know/Refused
QIMG2A A. They are patriotic QIMG2B B. They want to serve their country QIMG2C C. They are looking for travel QIMG2D D. They have no other options QIMG2E E. They are respected QIMG2F F. They are loyal QIMG2G G. They are dedicated to duty and devoted QIMG2H H. They are intelligent QIMG2I I. They are goal oriented QIMG2J J. They are selfish QIMG2K K. They are foolish QIMG2L L. They are educated QIMG2M M. They are brave and courageous QIMG2N N. They are trustworthy and honorable QIMG2O O. They need discipline QIMG2P P. They are authoritative QIMG2Q Q. They are people I feel sorry for QIMG2R R. They are poorly paid QIMG2S S. They are not as qualified as recruits used to be QIMG2T T. They want military benefits QIMG2U U. They want the job security offered by the military QIMG2V V. They will be working in jobs they enjoy QIMG2W W. They will be working in jobs that fit them QIMG2X X. They want education and training QIMG2Y Y. They are looking for direction

APPENDIX B
ADULT POLL 2 B-10
QIMG2AA IMG2AA. Please continue to think about the image you currently have of the average person joining the
United States Military. Would this image have a positive effect, a negative effect or have no effect at all on your recommending military service as on option for youth after high school?
[NOTE TO INTERVIEWER: If respondent says that they don’t recommend to youth either in general, or about the military, then ask “if you were to recommend that a youth consider joining the military after high school, would your current image of the average person joining the military today have an effect on that recommendation?”][1QP]
1 Positive 2 Negative 3 Has no effect 99 Don't know/Refused
IMG2A HAS BEEN DELETED

APPENDIX B
ADULT POLL 2 B-11
QIMG3A-QIMG3Y IMG3. Now we are going to switch subjects again and focus only on the people who stay in the
military and make it a career. I am going to read you a list of statements and for each one I want you to tell me how well you think it describes the average person who stays in the military and makes it a career. Please use a scale from 1 to 10, where 1 means DOES NOT DESCRIBE AT ALL and 10 means DESCRIBES PERFECTLY. The [FIRST/NEXT] statement is [RANDOMIZE AND READ A-Y]. Using the 10-point scale, how well does that statement describe the average person who stays in the military and makes it a career? [13QP]
1 Does not describe at all 2 3 4 5 6 7 8 9 10 Describes Perfectly
RECORD RATING 99 Don't know/Refused
QIMG3A A. They are patriotic QIMG3B B. They want to serve their country QIMG3C C. They are looking for travel QIMG3D D. They have no other options QIMG3E E. They are respected QIMG3F F. They are loyal QIMG3G G. They are dedicated to duty and devoted QIMG3H H. They are intelligent QIMG3I I. They are goal oriented QIMG3J J. They are selfish QIMG3K K. They are foolish QIMG3L L. They are educated QIMG3M M. They are brave and courageous QIMG3N N. They are trustworthy and honorable QIMG3O O. They need discipline QIMG3P P. They are authoritative QIMG3Q Q. They are people I feel sorry for QIMG3R R. They are poorly paid QIMG3S S. They are not as qualified as recruits used to be QIMG3T T. They want military benefits QIMG3U U. They want the job security offered by the military QIMG3V V. They will be working in jobs they enjoy QIMG3W W. They will be working in jobs that fit them QIMG3X X. They want education and training QIMG3Y Y. They are looking for direction

APPENDIX B
ADULT POLL 2 B-12
QIMG3AA IMG3AA. Please continue to think about the current image you have of the average person who stays in
the military and makes it a career. Would this image have a positive effect, a negative effect or have no effect at all on your recommending military service as an option for youth after high school?
[NOTE TO INTERVIEWER: If respondent says that they don’t recommend to youth either in general, or about the military, then ask “if you were to recommend that a youth consider joining the military after high school, would your current image of the average person who stays in the military and makes it a career have an effect on that recommendation?”][1QP]
1 Positive 2 Negative 3 Has no effect 99 Don't know/Refused

APPENDIX B
ADULT POLL 2 B-13
ADVICE ABOUT/SUPPORT FOR THE MILITARY 13.1 QUESTION POINTS, 4.3 MINUTES QADV2A- QADV2D ADV2. I would like to talk about the choices that young people have after high school. Suppose a
youth you know came to you for advice about what do after high school. How likely is it that you would encourage him or her to [RANDOMIZE AND READ A-D] [2QP]
1 Very likely 2 Likely 3 Neither likely nor unlikely 4 Unlikely 5 Very unlikely
99 Don't know/Refused
QADV2A A. Join a military service such as the Army, Navy, Marine Corps, Air Force, or Coast Guard QADV2B B. Attend a four-year college or university QADV2C C. Get a full-time job QADV2D D. Attend a trade, technical, vocational or community college
[READ LIST][ROTATE TOP TO BOTTOM, BOTTOM TO TOP]
QADV4A – QADV4H; QADV4J – QADV4K ADV4. Did you give advice in the last year to [READ A-K] about options after high school? Please
answer Yes, No, or Not Applicable. [3.5QP] [INTERVIEWER NOTE: REMIND THE RESPONDENT THAT WE ARE TALKING ABOUT ADVICE GIVEN IN THE PAST YEAR.] [RANDOMIZE LIST AND READ A-F, H-J]
[NOTE TO CATI TECH: For each ADV4 option that gets a “yes” response, we want to follow it up immediately with ADV5 and ADV6, then return to next ADV4 option] [IF THE RESPONDENT HAS, FOR EXAMPLE, MORE THAN ONE SON, ASK THEM TO RESPOND FOR THE ONE THAT THEY MOST RECENTLY TALKED TO ABOUT MILITARY SERVICE.]
1 Yes 2 No 3 Not Applicable
99 Don't know/Refused QADV4A A. Your Son QADV4B B. Your Daughter QADV4C C. Your Brother or Sister QADV4D D. Your Niece or Nephew QADV4E E. Your Grandchild QADV4F F. Your Cousin QADV4G G. Some other family member QADV4H H. A Friend who is not a family member QADV4J I. A Student who is not a family member QADV4K J. Someone else who is not a family member

APPENDIX B
ADULT POLL 2 B-14
[CATI - PLEASE NOTE OPTION I - A STUDENT WHO IS A FAMILY MEMBER HAS BEEN DELETED]
[IF ADV4=1, ASK ADV5] QADV5A – QADV5H; QADV5J – QADV5K ADV5. Was any of the advice that you gave about the military? [3.8 QP]
1 Yes 2 No 3 Not Applicable 99 Don't know/Refused
. (SAS/SPSS numeric missing) QADV5A A. Your Son QADV5B B. Your Daughter QADV5C C. Your Brother or Sister QADV5D D. Your Niece or Nephew QADV5E E. Your Grandchild QADV5F F. Your Cousin QADV5G G. Some other family member QADV5H H. A Friend who is not a family member QADV5J I. A Student who is not a family member QADV5K J. Someone else who is not a family member
[IF ADV5=1, ASK ADV6] QADV6A – QADV6H; QADV6J – QADV6K ADV6. Was the advice about the military positive or negative? [3.85QP]
1 Positive 2 Negative 3 Both positive and negative 99 Don't know/Refused . (SAS/SPSS numeric missing)
QADV6A A. Your Son QADV6B B. Your Daughter QADV6C C. Your Brother or Sister QADV6D D. Your Niece or Nephew QADV6E E. Your Grandchild QADV6F F. Your Cousin QADV6G G. Some other family member QADV6H H. A Friend who is not a family member QADV6J I. A Student who is not a family member QADV6K J. Someone else who is not a family member

APPENDIX B
ADULT POLL 2 B-15
FAVORABILITY 4 QUESTION POINTS, 1.3 MINUTES QFAV1 FAV1. Using all that you know or have heard about the military, please rate the military using a 10
point scale where 1 means VERY UNFAVORABLE and 10 means VERY FAVORABLE. How would you rate your favorability of the U.S. Military? [1QP]
1 Very Unfavorable 2 3 4 5 6 7 8 9 10 Very Favorable
RECORD RATING 99 Don't know/Refused
QFAV2A- QFAV2E FAV2. Using all that you know or have heard about the various branches of the military, please rate
each branch using a 10 point scale where 1 means VERY UNFAVORABLE and 10 means VERY FAVORABLE. How would you rate your favorability of the [RANDOMIZE AND READ A-E]? [2QP]
1 Very Unfavorable 2 3 4 5 6 7 8 9 10 Very Favorable
RECORD RATING 99 Don't know/Refused
QFAV2A A. Air Force QFAV2B B. Army QFAV2C C. Coast Guard QFAV2D D. Marine Corps QFAV2E E. Navy

APPENDIX B
ADULT POLL 2 B-16
QFAV3A- QFAV3B FAV3 Now, using all that you know or have heard, please rate the United States National Guard and
Reserves using a 10 point scale where 1 means VERY UNFAVORABLE and 10 means VERY FAVORABLE. How would you rate your favorability of the [RANDOMIZE AND READ A-B]? [1QP]
1 Very Unfavorable 2 3 4 5 6 7 8 9 10 Very Favorable
RECORD RATING 99 Don't know/Refused
QFAV3A 1. Reserves QFAV3B 2. National Guard

APPENDIX B
ADULT POLL 2 B-17
KNOWLEDGE OF MILITARY 11.5 QUESTION POINTS, 3.8 MINUTES QS7 S7. Let’s talk about your knowledge of the military. Please use a scale from 1 to 10 where 1
means NOT AT ALL KNOWLEDGEABLE and 10 means EXTREMELY KNOWLEDGEABLE. Please tell me how knowledgeable you are about the United States Military. [1QP]
1 Not At All Knowledgeable 2 3 4 5 6 7 8 9 10 Extremely Knowledgeable
RECORD ANSWER (1=Not at all knowledgeable, etc.)
99 Don't know/Refused

APPENDIX B
ADULT POLL 2 B-18
QKW1A-QKW1S KW1. Now I would like to read to you some statements that pertain to military service. For each
statement, I would like you to tell me to what degree the statement is believable. Please use a scale from 1 to 10 where 1 means NOT AT ALL BELIEVABLE and 10 means EXTREMELY BELIEVABLE. The [FIRST/NEXT] statement is [RANDOMIZE AND READ A-S]. Using the 10-point scale, how believable would you say this statement is?
[NOTE TO INTERVIEWER: EVERY 5 OR 6 STATEMENTS REMIND THE RESPONDENT
THAT THEY ARE RATING THE BELIEVABILITY OF THE STATEMENT] [10.5QP]
1 Not At All Believable 2 3 4 5 6 7 8 9 10 Extremely Believable 99 Don't know/Refused
QKW1A A. In 1999, over 30,000 active-duty military service members earned college degrees. QKW1B B. The military offers a tuition assistance program that pays up to 75% of the cost of tuition or other expenses up to $3500 per year for service members. QKW1C C. There are approximately 300 military schools that teach skills in over 10,000
courses. QKW1D D. 60% of the courses taught in the military schools are certified for college credit. QKW1E E. 88% of military jobs have comparable civilian jobs. QKW1F F. The military currently offers over 140 career paths that new recruits can choose from. QKW1G G. The military allows people to learn responsibility and leadership at an earlier age than most civilian jobs. QKW1H H. The military is diverse – 37% of the military is made up of minorities. QKW1I I. More and more of the housing for enlisted personnel is college style dormitory-rooms, not the open barracks of old. QKW1J J. The military offers 30 days of paid vacation a year. QKW1K K. Military installations are self-contained communities; with gyms, restaurants, stores, theaters, houses of worship, social activities, and support services. QKW1L L. Service in the military builds values such as duty, honor, courage, respect and loyalty. QKW1M M. The military fosters the development of qualities such as discipline, self- reliance, confidence and maturity. QKW1N N. Service in the military provides an opportunity to serve our country in a meaningful way. QKW1O O. The military participates in things other than war, such as humanitarian relief, firefighting, and drug enforcement. QKW1P P. People coming into the military have access to e-mail from their barracks and housing so they can easily communicate with family and friends.

APPENDIX B
ADULT POLL 2 B-19
QKW1Q Q. New recruits can earn up to $50,000 dollars for college. QKW1R R. The military will repay up to $65,000 in federal student loans for new recruits. QKW1S S. The military offers a program that allows recruits to complete a two-year college degree before entering basic training.

APPENDIX B
ADULT POLL 2 B-20
DEMOGRAPHICS FOR ALL RESPONDENTS 16.75 QUESTION POINTS, 5.6 MINUTES ASK ALL
And now I just have a few last questions for research purposes. QDEM1 DEM1. What is the highest level of school you have completed or the highest degree you have received?
[READ LIST, ACCEPT SINGLE RESPONSE] [1QP] 1 Less than High School 2 High School Graduate - Diploma or Equivalent (GED) 3 Some College But No Degree 4 Associate Degree - Occupation / Vocational 5 Associate Degree - Academic Program 6 Bachelor’s Degree (e.g., BA, AB or BS) 7 Master’s Degree (e.g., MA, MS, MEng, MEd, NSW) 8 Professional School Degree (e.g., MD, DDS, DVM) 9 Doctorate Degree (e.g., PhD, EdD) 99 Don't know/Refused [DO NOT READ]
QDEM2A DEM2A. Are you currently a member of the armed forces? [1QP]
1 Yes 2 No 99 Don't know/Refused
[IF DEM2A > 1 ASK DEM2C] QDEM2C DEM2C. Have you ever served as a member of the armed forces? [1QP]
1 Yes 2 No 99 Don't know/Refused . (SAS/SPSS numeric missing)
[IF DEM2A=1 OR DEM2C=1, ASK DEM2B] QDEM2B1- QDEM2B5 DEM2B. Is that active-duty, guard or reserves? [ACCEPT MULTIPLE RESPONSES] [0.5QP] 1 Yes 0 No
QDEM2B1 1 Active Duty QDEM2B2 2 Guard QDEM2B3 3 Reserves QDEM2B4 99 Don't know/Refused QDEM2B5 Not applicable

APPENDIX B
ADULT POLL 2 B-21
QDEM2D DEM2D. Is anyone in your immediate family - parents, children, siblings, grandparents, in-laws –
currently a member of or have served in the armed forces? [1QP] 1 Yes 2 No 99 Don't know/Refused
[IF DEM2D=1 ASK DEM2DA] QDEM2DAA-QDEM2DAD DEM2DA. Thinking of these people, how many are between the ages of [READ A-D]? [1 QP]
RECORD ANSWER 98 The person(s) is deceased - DO NOT READ 99 Don't know/Refused . (SAS/SPSS numeric missing)
QDEM2DAA A. 18 to 25 years old QDEM2DAB B. 26 to 40 years old QDEM2DAC C. 41 to 60 years old QDEM2DAD D. 61 years old and over
QDEM2E DEM2E. Is anyone in your extended family - cousins, aunts, uncles, nieces, nephews - currently a
member of or have served in the armed forces? [1QP]
1 Yes 2 No 99 Don't know/Refused
[IF DEM2E=1 ASK DEM2EA] QDEM2EAA-QDEM2EAD DEM2EA. Thinking of these people, how many are between the ages of [READ A-D]? [.75 QP]
RECORD ANSWER 98 The person(s) is deceased - DO NOT READ 99 Don't know/Refused . (SAS/SPSS numeric missing)
QDEM2EAA A. 18 to 25 years old QDEM2EAB B. 26 to 40 years old QDEM2EAC C. 41 to 60 years old QDEM2EAD D. 61 years old and over

APPENDIX B
ADULT POLL 2 B-22
QDEM2F DEM2F. Do you personally know of anyone else, other than a family member who is currently a
member of or have served in the armed forces? [1 QP]
1 Yes 2 No 99 Don't know/Refused
[IF DEM2F=1 ASK DEM2FA] QDEM2FAA-QDEM2FAD DEM2FA. Thinking of these people, how many are between the ages of [READ A-D]? [.5 QP]
RECORD ANSWER 98 The person(s) is deceased - DO NOT READ 99 Don't know/Refused . (SAS/SPSS numeric missing)
QDEM2FAA A. 18 to 25 years old QDEM2FAB B. 26 to 40 years old QDEM2FAC C. 41 to 60 years old QDEM2FAD D. 61 years old and over
QDEM3 DEM3. What is your total annual household income? [READ LIST, ACCEPT SINGLE
RESPONSE] [1QP]
1 Less than $25,000 2 $25,000 but less than $30,000 3 $30,000 but less than $40,000 4 $40,000 but less than $60,000 5 $60,000 but less than $80,000 6 $80,000 but less than $100,000 7 $100,000 OR MORE 99 Don't know/Refused [DO NOT READ]
QDEM4 DEM4. Please tell me whether you are currently…[READ LIST, ACCEPT SINGLE RESPONSE]
[1QP]
1 Single and have never been married 2 Widowed 3 Separated 4 Divorced 5 Married 99 Don't know/Refused

APPENDIX B
ADULT POLL 2 B-23
QDEM6A DEM6A. Does the current situation related to the World Trade Center and the Pentagon make you more
likely or does it make you less likely to recommend military service as an option for youth? [1QP]
1 More likely 2 Doesn’t change the likelihood (DO NOT READ) 3 Less likely 99 Don't know/Refused
QDEM7A1-QDEM7A6
DEM7A. Are you currently employed in a high school or a community college as a teacher, guidance counselor or administrator? [NOTE TO INTERVIEWER: HIGH SCHOOL IS GRADES 9-12] [1QP]
1 Yes 0 No
QDEM7A1 1 Yes, High School QDEM7A2 2 Yes, Community College QDEM7A3 3 No QDEM7A4 Other QDEM7A5 99 Don't know/Refused QDEM7A6 Not Applicable
ODEM81-ODEM88; QDEM81-QDEM811 DEM8. Are you a youth leader in any way? For example, are you a youth sports coach, a member of
the clergy, scout leader, or an employer of people under the age of 21? [1QP]
1 Yes 0 No
ODEM81 1 Yes, youth sports coach ODEM82 2 Yes, member of the clergy ODEM83 3 Yes, scout leader ODEM84 4 Yes, employer of people under the age of 21 ODEM85 5 Yes, other, specify ODEM86 6 No ODEM87 99 Don't know/Refused ODEM88 Not Applicable

APPENDIX B
ADULT POLL 2 B-24
Notes for users Original Final
(after recoding ODEM85, other, specify)
Description
ODEM81 QDEM81 Yes, youth sports coach ODEM82 QDEM82 Yes, member of the clergy ODEM83 Yes, scout leader
QDEM83 Yes, scout leader/Other Service Leader ODEM84 QDEM84 Yes, employer of people under the age of 21
QDEM85 Yes, church youth leader/teacher QDEM86 Yes, school teacher/aid/tutor
QDEM87 Yes, Mentoring program ODEM85 QDEM88 Yes, other ODEM86 QDEM89 No ODEM87 QDEM810 Don't know/Refused
ODEM88 QDEM811 Not applicable ODEM9; QDEM9 DEM9. What is your occupation? [DO NOT READ CHOICES] [2QP]
1 Computer and Mathematical Occupations 2 Architecture and Engineering Occupations 3 Life, Physical, and Social Science Occupations 4 Community and Social Services Occupations 5 Legal Occupations 6 Education, Training, and Library Occupations 7 Arts, Design, Entertainment, Sports, and Media Occupations 8 Healthcare Practitioners and Technical Occupations 9 Healthcare Support Occupations 10 Protective Service Occupations 11 Food Preparation and Serving Related Occupations 12 Building and Grounds Cleaning and Maintenance Occupations 13 Personal Care and Service Occupations 14 Sales and Related Occupations 15 Office and Administrative Support Occupations 16 Farming, Fishing, and Forestry Occupations 17 Construction and Extraction Occupations 18 Installation, Maintenance, and Repair Occupations 19 Production Occupations 20 Transportation and Material Moving Occupations 21 Military Specific Occupations 22 Homemaker/Housewife/Househusband 23 Retired 24 Unemployed 25 Other, specify _________________ 99 Don't know/Refused

APPENDIX B
ADULT POLL 2 B-25
Notes for users Original Final
(after recoding ODEM9=25, other, specify)
Description
ODEM9=1 QDEM9=1 Computer and Mathematical Occupations ODEM9=2 QDEM9=2 Architecture and Engineering Occupations ODEM9=3 QDEM9=3 Life, Physical, and Social Science Occupations ODEM9=4 QDEM9=4 Community and Social Services Occupations ODEM9=5 QDEM9=5 Legal Occupations ODEM9=6 QDEM9=6 Education, Training, and Library Occupations ODEM9=7 QDEM9=7 Arts, Design, Entertainment, Sports, and Media
Occupations ODEM9=8 QDEM9=8 Healthcare Practitioners and Technical Occupations ODEM9=9 QDEM9=9 Healthcare Support Occupations
ODEM9=10 QDEM9=10 Protective Service Occupations ODEM9=11 QDEM9=11 Food Preparation and Serving Related Occupations ODEM9=12 QDEM9=12 Building and Grounds Cleaning and Maintenance
Occupations ODEM9=13 QDEM9=13 Personal Care and Service Occupations ODEM9=14 QDEM9=14 Sales and Related Occupations ODEM9=15 QDEM9=15 Office and Administrative Support Occupations ODEM9=16 QDEM9=16 Farming, Fishing, and Forestry Occupations ODEM9=17 QDEM9=17 Construction and Extraction Occupations ODEM9=18 QDEM9=18 Installation, Maintenance, and Repair Occupations ODEM9=19 QDEM9=19 Production Occupations ODEM9=20 QDEM9=20 Transportation and Material Moving Occupations ODEM9=21 QDEM9=21 Military Specific Occupations
QDEM9=22 Student QDEM9=23 Self-Employed QDEM9=24 Disabled
ODEM9=22 QDEM9=25 Homemaker/Housewife/Househusband ODEM9=23 QDEM9=26 Retired ODEM9=24 QDEM9=27 Unemployed ODEM9=25 QDEM9=28 Other
ODEM9=99 QDEM9=99 Don't know/Refused DEM12. For research purposes only, please tell me your street address and zip code? Do you know
your ZIP plus four? [9-digit ZIP code is preferred] [1QP] [RECORD STREET ADDRESS] [RECORD ZIP CODE]

APPENDIX B
ADULT POLL 2 B-26
[ASK DEM13 IF QPRIV1=1] DEM13. So that we may send you the copy of the Privacy Act of 1974 and for research purposes please tell me your address.
[RECORD STREET ADDRESS] [RECORD STATE] [RECORD CITY] [RECORD ZIP CODE]
DEM14. FIPS CODE ____ ____ ____ ____ ____ DEM15. ZIP CODE [FROM SAMPLE] ____ ____ ____ ____ ____
DEM16. May I please have your first name in case my supervisor needs to verify that this interview actually took place?
Thank you very much for your time.

REPORT DOCUMENTATION PAGE Form Approved OMB No. 0704-0188
Public reporting burden for this collection of information is estimated to average 1 hour per response, including the time for reviewing instructions, searching existing data sources, gathering and maintaining the data needed, and completing and reviewing the collection of information. Send comments regarding this burden estimate or any other aspect of this collection of information, including suggestions for reducing the burden, to Washington Headquarters Services, Directorate for Information Operations and Reports, 1215 Jefferson Davis Highway, Suite 1204, Arlington, VA 22202-4302, and to the Office of Management and Budget, Paperwork Reduction Project (0704-0188), Washington, DC 20503.
1. AGENCY USE ONLY (Leave blank)
2. REPORT DATE April, 2002
3. REPORT TYPE AND DATES COVERED Final
4. TITLE AND SUBTITLE Adult Attitudes Toward the Military: Poll Two
5. FUNDING NUMBERS
GS-23F-9819H
6. AUTHOR (S) Amie K. Wang, James A. Hoskins, Mary E. Strackbein, Anita R. Lancaster, Barbara J. George, & Sean M. Marsh
7. PERFORMING ORGANIZATION NAMES (S) AND ADDRESS (ES) Wirthlin Worldwide 1920 Association Drive, Suite 500 Reston, VA 20191
8. PERFORMING ORGANIZATION REPORT NUMBER
9. SPONSORING/MONITORING AGENCY NAMES(S) AND ADDRESS(ES) Defense Manpower Data Center 1600 Wilson Blvd., Suite 400 Arlington, VA 22209
10. SPONSORING/MONITORING AGENCY REPORT NUMBER DMDC Report No. 2002-023
11. SUPPLEMENTARY NOTES
12a. DISTRIBUTION/AVAILABILITY STATEMENT Open Release
12b. DISTRIBUTION CODE Unlimited Distribution
13. ABSTRACT (Maximum 200 words) The Department of Defense’s (DoD) is conducting a series of adult polls focused on attitudes of those who influence youth about the military and their likelihood to recommend military service to youth. Adult Poll Two looked at adult impressions of the military, advice given to youth about options after high school, how favorable they were towards the military, and their knowledge of the military. Adult Poll Two was conducted using computer assisted telephone interviews (CATI) during the period of September 28 – October 6, 2001. Data were weighted by age, race/ethnicity and education to the August 2001 Current Population Survey to mirror the population of American adults ages 22 to 85 years old.- 14. SUBJECT TERMS military advertising, adult attitudes toward the military,
15. NUMBER OF PAGES 75
Postsecondary choices, military recruiting 16. PRICE CODE
17. SECURITY CLASSIFICATION OF REPORT Unclassified
18. SECURITY CLASSIFICATION OF THIS PAGE Unclassified
19. SECURITY CLASSIFICATION OF ABSTRACT Unclassified
20. LIMITATION OF ABSTRACT
SAR
NSN 7540-01-280-5500 Standard Form 298 (Rev. 2-89) Prescribed by ANSI Std 239-18