adult obesity in scotland: patterns and trends
TRANSCRIPT

Adult Obesity in Scotland: Patterns and Trends (2014 Data)

Overweight and Obesity Among Adults
More than 6 out of 10 Scots were overweight and obese (65%)
Adult – Aged 16+Overweight & Obese – BMI 25+ kg/m²
Source: Scottish Health Survey 20142

Overweight and Obesity Among Adults
Almost 7 out of 10 men were overweight or obese (69%)
More than 6 out of 10 women were overweight or obese (61%)
Adult – Aged 16+Overweight & Obese – BMI 25+ kg/m²
Source: Scottish Health Survey 20143

Obesity Among Adults
More than 1 out of 4 Scots were obese (28%)
Adult – Aged 16+Obese – BMI 30+ kg/m²
Source: Scottish Health Survey 20144

Obesity Among Adults
More than 2 out of 10 men were obese (26%)
Almost 3 out of 10 women were obese (29%)
Adult – Aged 16+Obese – BMI 30+ kg/m²
Source: Scottish Health Survey 20145

Adult BMI
28% of all adults were obese, with a further 37% overweight
Adult – Aged 16+
Source: Scottish Health Survey 2014
2%
33%
37%
28%
All Adults
Less than 18.5/Underweight18.5 to less than 25/Healthy Weight25 to less than 30/Overweight30+/Obese
6

2%
37%
32%
29%
Women
Adult BMI by Gender
More women than men were within a healthy weight range Obesity prevalence was higher for women
Adult – Aged 16+
Source: Scottish Health Survey 2014
2%
29%
43%
26%
Men
7

Adult BMI by Age
Healthy weight was most prevalent in 16-24 year olds, and least prevalent in 65-74 year olds
Source: Scottish Health Survey 2014
16-24 25-34 35-44 45-54 55-64 65-74 75+0%
10%
20%
30%
40%
50%
60%
Less than 18.5/Underweight
18.5 to less than 25/Healthy Weight
25 to less than 30/Overweight
30+/Obese
Age Group
Perc
enta
ge o
f Pop
ulati
on
8

Trend in Overweight and Obesity Prevalence Among Adults
Between 2008 and 2014, the prevalence of overweight and obesity fluctuated between 64% and 66%
Adult – Aged 16+Overweight & Obese – BMI 25+ kg/m²
Source: Scottish Health Survey 20149
Data available only for 2003
2003 2004 2005 2006 2007 2008 2009 2010 2011 2012 2013 20140%
5%
10%
15%
20%
25%
30%
35%
40%
45%
50%
55%
60%
65%
70%
BMI 25+/Overweight and Obese
Year
Perc
enta
ge o
f Adu
lts

Trend in Overweight and Obesity Prevalence Among Adults
Prevalence of overweight and obesity rose in both men and women, although a smaller percentage of women had a BMI of over 25 kg/m² than men
Adult – Aged 16+Overweight & Obese – BMI 25+ kg/m²
Source: Scottish Health Survey 201410
20032005
20072009
20112013
0%5%
10%15%20%25%30%35%40%45%50%55%60%65%70%
Men
BMI 25+/Overweight and Obese
Year
Perc
enta
ge o
f Men
20032005
20072009
20112013
0%5%
10%15%20%25%30%35%40%45%50%55%60%65%70%
Women
BMI 25+/Overweight and Obese
Year
Perc
enta
ge o
f Wom
enData available only for 2003

Trend in Obesity Prevalence Among Adults
Obesity prevalence increased between 2003 and 2008, but remained relatively steady between 2008 and 2014
Adult – Aged 16+Obese – BMI 30+ kg/m²
Source: Scottish Health Survey 201411
Data available only for 2003
2003 2004 2005 2006 2007 2008 2009 2010 2011 2012 2013 20140%
5%
10%
15%
20%
25%
30%
35%
40%
45%
50%
55%
60%
65%
70%
BMI 30+/Obese
Year
Perc
enta
ge o
f Adu
lts

Trend in Obesity Prevalence Among Adults
Prevalence of obesity increased in both men and women, although a smaller percentage of men were obese than women
Adult – Aged 16+Obese – BMI 30+ kg/m²
Source: Scottish Health Survey 201412
20032004
20052006
20072008
20092010
20112012
20132014
0%5%
10%15%20%25%30%35%40%45%50%55%60%65%70%
Men
BMI 30+/Obese
Year
Perc
enta
ge o
f Men
20032004
20052006
20072008
20092010
20112012
20132014
0%5%
10%15%20%25%30%35%40%45%50%55%60%65%70%
Women
BMI 30+/Obese
Year
Perc
enta
ge o
f Wom
enData available only for 2003

Adult Obesity Prevalence by Age - Men vs. Women
16-24 25-34 35-44 45-54 55-64 65-74 75+0%
5%
10%
15%
20%
25%
30%
35%
40%
MenWomen
Age Group
Perc
enta
ge O
bese
More than 3 in 10 men aged 65-74 were obese (35%) In the same age group, 37% of women were obese
Obese – BMI 30+ kg/m²
Source: Scottish Health Survey 201413

Adult Obesity Prevalence by Income
Around 33% of people in the bottom two income quintiles were obese, compared to 22% in the top income quintile
Adult – Aged 16+Obese – BMI 30+ kg/m² Income Measure is Equivalised Household Income
Source: Scottish Health Survey 201414
Top Quintile ( > = £49400)
4th Quintile ( > = £ 31967 < £ 49400)
3rd Quintile ( > = £ 22100 < £ 31967)
2nd Quintile ( > = £14322 < £22100)
Bottom quintile ( > = £0 < £14322)
0%
5%
10%
15%
20%
25%
30%
35%
40%
BMI 30+/Obese
Equivalised Income Quintile
Perc
enta
ge O
bese

Adult Obesity Prevalence by Income - Men vs. Women
31% of men in the fourth income quintile were obese, compared to 23% in the top quintile
37% of women in the bottom income quintile were obese, compared to 20% in the top quintileAdult – Aged 16+
Obese – BMI 30+ kg/m² Income Measure is Equivalised Household Income
Source: Scottish Health Survey 201415
Top Quintile ( > = £49400)
4th Quintile ( > = £ 31967 < £ 49400)
3rd Quintile ( > = £ 22100 < £ 31967)
2nd Quintile ( > = £14322 < £22100)
Bottom quintile ( > = £0 < £14322)
0%
5%
10%
15%
20%
25%
30%
35%
40%
MenWomen
Equivalised Income Quintile
Perc
enta
ge O
bese

Adult Obesity Prevalence by Area Deprivation
32% of adults in the most deprived quintile were obese, compared to 22% in the least deprived quintile
Source: Scottish Health Survey 2014
Adult – Aged 16+Obese – BMI 30+ kg/m²
16
Area Deprivation Measure is Scottish Index of Multiple Deprivation 2012
Least deprived 4 3 2 Most deprived0%
5%
10%
15%
20%
25%
30%
35%
40%
BMI 30+/Obese
SIMD Deprivation Quintile
Perc
enta
ge O
bese

28% of men in the most deprived quintile were obese compared to 22% in the least deprived quintile
37% of women in the most deprived quintile were obese compared to 21% in the least deprived quintile
Least deprived 4 3 2 Most deprived0%
5%
10%
15%
20%
25%
30%
35%
40%
MenWomen
SIMD Deprivation Quintile
Perc
enta
ge O
bese
Source: Scottish Health Survey 2014
Adult – Aged 16+Obese – BMI 30+ kg/m²
17
Area Deprivation Measure is Scottish Index of Multiple Deprivation 2012
Adult Obesity Prevalence by Area Deprivation - Men vs. Women

Adult Mean Waist Circumference
The mean waist circumference of both men and women increased between 2003 and 2012/13
95cm 97cm 86cm 89cm
2003 2003 2012/13
Adult – Aged 16+
Source: Scottish Health Survey 201418
2012/13

Adult Raised Waist Circumference
The prevalence of raised waist circumference has been consistently higher among women than among men
28% 33% 39% 50%
2003 20032012/13 2012/13
Adult – Aged 16+Raised WC is 102cm+ for men and 88cm+ for women
Source: Scottish Health Survey 201419
2003 2004 2005 2006 2007 2008/2009 2010/2011 2012/2013 0%
10%
20%
30%
40%
50%
60%
Men (%)Women (%)
Year
Perc
enta
ge w
ith R
aise
d W
aist
Circ
umfe
renc
e
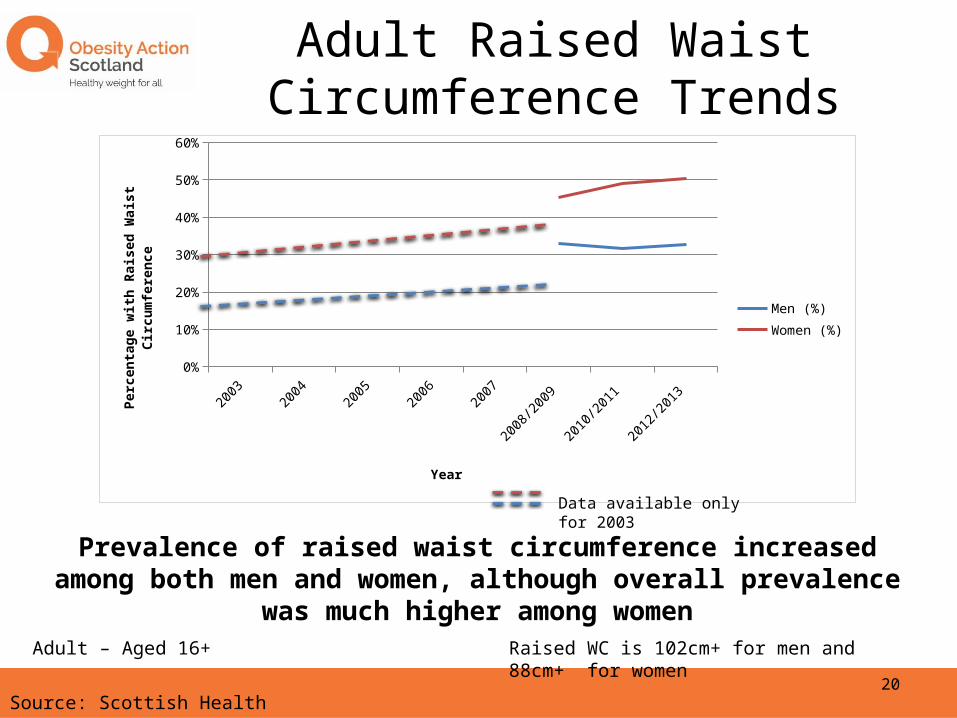
Adult Raised Waist Circumference Trends
Prevalence of raised waist circumference increased among both men and women, although overall prevalence was much higher among women
Raised WC is 102cm+ for men and 88cm+ for womenAdult – Aged 16+
Source: Scottish Health Survey 201420
Data available only for 2003

Source:The Scottish Government, (2015). The Scottish Health Survey 2014. www.gov.scot/Publications/2015/09/6648

@obesityactionsc0141 221 6072
232-242 St. Vincent Street, Glasgow, G2 5RJ