adult steelhead assessment 2014 by: jg.. co-op angler 2014 (a partnership in science between the...
TRANSCRIPT

Adult Steelhead Assessment 2014
By: JG.

Co-op Angler 2014 (A partnership in science between the Ontario Ministry of Natural Resources
and the North Shore Steelhead Association)
Introduction
• Five steelhead assessment projects were conducted during the spring of 2014.
• They are: A) McIntyre River Steelhead Population Assessment B) Portage Creek Steelhead Population Assessment C) Cypress River Steelhead Population Assessment D) McVicar Creek Steelhead Population Assessment E) Co-op Angler Study• All studies were conducted in partnership with the North
Shore Steelhead Association (NSSA) and the Ontario Ministry of Natural Resources (OMNR).

Steelhead Assessment 2014 (A partnership between MNR and the NSSA)
Methods
A) McIntyre River Steelhead Population Assessment Four experienced anglers biologically sampled, fin clipped and tagged adult steelhead they captured while angling during the
spring spawning migration (May and June). ( Figures 1 and 2)
B) Portage Creek Steelhead Population Assessment Anglers from the NSSA angled, biologically sampled, fin clipped and tagged adult steelhead during the spring spawning migration (May and June) ( Figures 1 and 2)
C) Cypress River Steelhead Population Assessment Three experienced anglers biologically sampled and fin clipped and tagged adult steelhead they captured while angling during the
spring spawning migration (May and June)). (Figure 1)
D) McVicar Creek Steelhead Population Assessment Two experienced anglers biologically sampled and fin clipped and tagged adult steelhead they captured while angling during the
spring spawning migration (May and June). ( Figure 1)
E) Co-op Angler Anglers from the North Shore Steelhead Association received sampling kits (tape, glove, knife, envelopes and instructions) and biologically sampled their steelhead catches (fork length, sex, and scale samples) from north shore tributaries during the spring (Figures 1 and 3). Scientific permits were issued by MNR.
The population estimates were based on a ‘Petersen Population Estimate’. Adult steelhead are fin clipped in year one and recaptured in year two. The repeat spawners with fin clips in year two complete the formula. (Figure 4)
Life history data is extracted from the scale sample (Figure 5) and summarized on an Excel spread sheet (Figure 6)

Collecting the data
Sample Kit Measuring length
Gender (male or female ?) Scale Sample
Figure: 1

Portage Creek Clipping, tagging and Sampling
2010 289 sampled and tagged (white Floy MNR 44000, Adipose clipped)2011 211 sampled and tagged (copper Floy MNR 43000, Left Ventral clipped) 2012 150 sampled and tagged (yellow Floy MNR 49000, Right Pectoral clipped)2013 96 sampled and tagged (purple Floy MNR 31000, Front Dorsal clipped)2014 31 sampled and tagged (white Floy MNR 44000, Right Ventral clipped)
McIntyre River Clipping and Sampling
2011 410 sampled, Front Dorsal clip, Sampling: Fork length, sex and scale sample, tag2012 341 sampled, Front Anal clip, Sampling: Fork length, sex and scale sample, tag2013 242 sampled, Adipose clip, Sampling: Fork Length, sex and scale sample, tag2014 101 sampled, Front Dorsal clip, Sampling: Fork Length, sex and scale sample
Adult Steelhead Sampling
Figure: 2

Co-op Angler Sampling by Tributary 2014
Basin Tributary Sample Size
A Thunder Bay Whitefish River 78
Neebing River 115
McIntyre River 101
McVicar Creek 144
Wild Goose Creek 17
Blind Creek 26
others 8
B Black Bay Portage Creek 31
Coldwater Creek 26
Wolf River/ B. sturgeon 7
C Nipigon to Marathon Jackpine River 103
Cypress River 184 Steel River 12
Others Nipigon to Marathon 10
Book trout samples 15 Figure: 3

Petersen Population Estimate
Number of Fish Clipped in Year #1 X Repeat Spawners in Year # 2 / by Clips from Year # 1 Captured in Year # 2
Example :250 marked in Year #1150 Repeat Spawners Year # 230 Marked fish from Year # 1 Captured in Year #2
250 X 150 ------------ = 1259 +- 95 % Confidence30
Figure: 4

Life History Extrapolation
First Stream Year
Second Stream Year
First Lake Year, First Spawn
Second Lake Year, Second Spawn
Third Lake Year, Third Spawn
Steelhead Scale: Age 5 years (2 stream, 3 lake, 3rd spawn)
Figure: 5
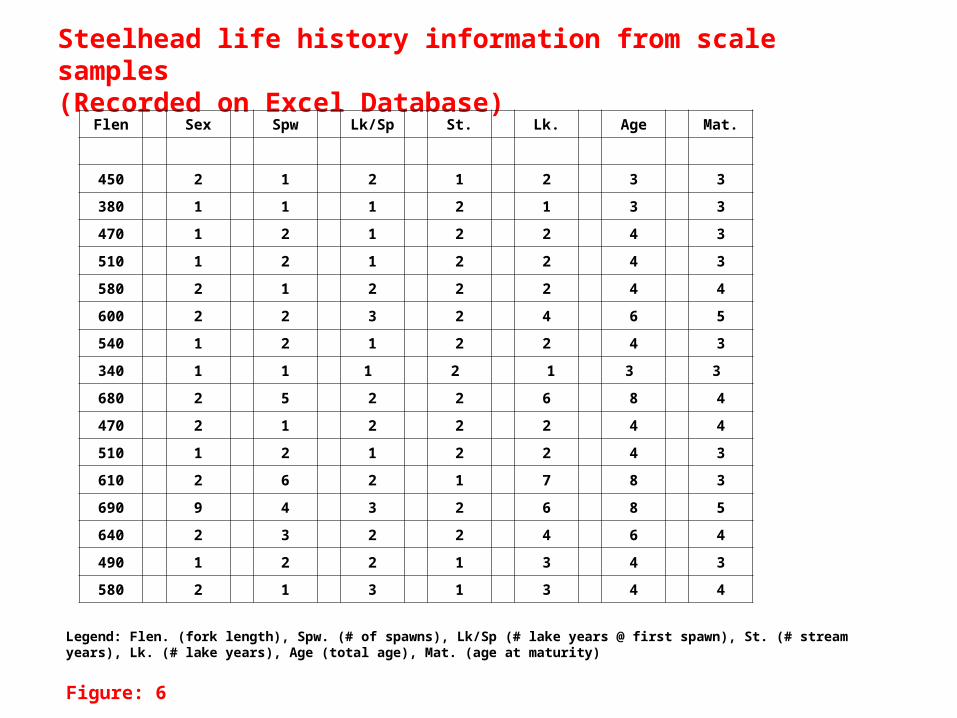
Steelhead life history information from scale samples (Recorded on Excel Database)
Legend: Flen. (fork length), Spw. (# of spawns), Lk/Sp (# lake years @ first spawn), St. (# stream years), Lk. (# lake years), Age (total age), Mat. (age at maturity)
Flen Sex Spw Lk/Sp St. Lk. Age Mat.
450 2 1 2 1 2 3 3
380 1 1 1 2 1 3 3
470 1 2 1 2 2 4 3
510 1 2 1 2 2 4 3
580 2 1 2 2 2 4 4
600 2 2 3 2 4 6 5
540 1 2 1 2 2 4 3
340 1 1 1 2 1 3 3
680 2 5 2 2 6 8 4
470 2 1 2 2 2 4 4
510 1 2 1 2 2 4 3
610 2 6 2 1 7 8 3
690 9 4 3 2 6 8 5
640 2 3 2 2 4 6 4
490 1 2 2 1 3 4 3
580 2 1 3 1 3 4 4
Figure: 6

Steelhead, Thunder Bay TributariesAge Structure 2014
2(12) 3(11) 4(10) 5(09) 6(08) 7(07) 8(06) 9(05)
Age (year of birth)
0
10
20
30
40
50
60
Pe
rce
nt
of
To
tal
Whitefish N=77
Neebing N=115
McIntyre N=100
McVicar N=143
Lake Shore N=43

Steelhead, Black Bay Tributaries
Age Structure 2014
2(12) 3(11) 4(10) 5(09) 6(08) 7(07) 8(06) 9(05) 10(04)
Age (year of birth)
0
10
20
30
40
50
Pe
rce
nt
of
To
t al
Black Bay Tribs. N=32
Portage N=31

Steelhead, Nipigon Bay Tributaries
Age Structure 2014
2(12) 3(11) 4(10) 5(09) 6(08) 7(07) 8(06) 9(05) 10 (04)
Age (year of birth)
0
10
20
30
40
50
Pe
rce
nt
of
To
t al
Jackpine N=100
Cypress N=182

Smolting HistoryNumber of Stream Years
1 2 3
Number of Stream Years
0
20
40
60
80
100
Pe
rce
nt
of
To
tal
Kam
Neebing
McIntyre
McVicar
Number of Stream Years
1 2 3
Number of Stream Years
0
20
40
60
80
100
Pe
rce
nt
of
To
tal
Portage
Coldwater
Wolf
Number of Stream Years
1 2 3
Number of Stream Years
0
20
40
60
80
100
Pe
rce
nt
of
To
tal
Jackpine
Cypress
Prairie

Steelhead Maturity Age at first spawning
2 3 4 5
Age at First Spawning
0
10
20
30
40
50
60
70
Pe
rce
nt
of
To
tal
Portage
Coldwater
Wolf/Black Sturgeon
Age at First Spawning
2 3 4 5 6
Age at First Spawning
0
10
20
30
40
50
60
70
Pe
rce
nt
of
To
tal
Kam
Neebing
McIntyre
McVicar
Age at First Spawning
2 3 4 5 6
Age at First Spawning
0
10
20
30
40
50
60
70
Pe
rce
nt
of
To
t al
Jackpine
Cypress
Prairie

Repeat Spawners
Lake Superior Steelhead
Number of Spawning Events 2014
Legend note: Whitefish R= 49% (total percent of repeat spawners for each river)
M 2 3 4 5 6 7
Age
0
10
20
30
40
50
60
70
80
Pe r
cent
of T
ota l
Whitefish R=49%
Neebing R=55%
McIntyre R=58%
McVicar R=60%
Lake Shore Dr. R=30%
Coldwater R=69%
Portage R=79%
Jackpine R=67%
Cypress R=60%

Weight and Age of your Steelhead
Figure A Length to Weight
• A 60 cm. (24”) steelhead weighs 2.5 kg. or 5.5 Lbs.
• A 75 cm. (30”) steelhead weighs 3.8 kg or 8.5 Lbs.
Figure B
Fork Length to Age
• A 50 cm. (20”) steelhead is 3 years old• A 70 cm. (28”) steelhead is 7 years old
Fig. A
Fig. B
Lake Superior SteelheadWeight for Length Categories
Note: 2.54 cm = 1 in ; 1 kg = 2.2 lb
35 40 45 50 55 60 65 70 75 80
Fork Length (cm)
0
1
2
3
4
5
Weig
ht
(kg
)
Lake Superior SteelheadFork Length at Age
Note: This is s general guide. Growth will vary considerably with maturity, stream life and feeding behavior.
0 2 3 4 5 6 7 8 9 10 11
Age in Years
0
10
20
30
40
50
60
70
80
Avera
ge F
ork
Len
gth
(cm
)

McIntyre, Portage Creek Population Trends These two graphs indicate the trends in adult steelhead population size up to the present time. Figure A is the McIntyre River, Thunder Bay, Figure B is Portage Creek, Black Bay. Figure A - McIntyre River adult steelhead population maintained it’s size at over 2000 from 2010 to 2012 decreasing to 1400 in 2013 - A minimal size limit of 1 over 69 cm was enacted for the spring 1999. This regulation has shown positive results with an increase in population size, and recruitment of juveniles Figure B - Portage Creek were closed to angling in 1994. - From 1994 to to 2004 adult population increased from 800 to over 2000 - From 2007 to 2013 the adult population decreased to an estimate of 500 individuals - the lower numbers of adult steelhead in Black Bay tributaries can be contributed to the increase in yellow perch and Walleye. - Figure 7 illustrates the decrease in steelhead survival following the perch and walleye increases from 2005 to the present
Fig. A
Fig. B
Steelhead, Portage Creek Adult Population Estimates 1991-2013
91 92 93 94 95 96 97 98 99 0 1 2 3 4 5 6 7 8 9 10 11 12 13
Year
200
400
600
800
1000
1200
1400
1600
1800
2000
2200
Nu
mb
er
of
Ad
ult
s
Steelhead, McIntyre River Adult Population Estimates 1999-2013
Note: 1999 to 2004 (Counting Fence), 2008 to 2013 (Petersen est. )
99 0 1 3 4 5 6 7 8 9 10 11 12 13
Year
200
400
600
800
1000
1200
1400
1600
1800
2000
2200
2400
2600
2800
Nu
mb
er
of
Ad
ult
s

Steelhead, Portage Creek
Number of Age Three Adults 1991-2014
91 92 93 94 95 96 97 98 99 0 1 2 3 4 5 6 7 8 9 10 11 12 13 14
Year of Capture
0
200
400
600
800
1000
Nu
mb
er
at
Ag
e T
hre
e
Figure 7

Summary Thunder Bay• In both 2013 and 2014 we had late springs that delayed the steelhead spawning migration well into May• High flows decreased angler success.• The McIntyre River steelhead population characteristics can be used to index the health of other Thunder bay
tributaries• In the McIntyre River the strong year classes of 2007 to 2009 are declining (natural mortality) resulting in a
decreased population size in 2013 from what we estimated in 2010 to 2012.• The 2011 year class (age three years….30 to 45 cm) appears to be strong in Thunder Bay tributaries and
should increase the population size over the next few years as it fully recruits into the spawning population.
Black Bay• Portage Creek’s adult steelhead population can be used to to index the health of Black Bay tributaries.• Since 2004 survival of juvenile steelhead to maturity has declined in Portage Creek as illustrated in Figure 7• The decline has been observed by anglers in all Black Bay tributaries ie. Wolf, Coldwater and Black Sturgeon
Rivers• The decline in steelhead numbers coincided with a dramatic increase in yellow perch and walleye in Black
Bay
Nipigon East• Tributaries from Nipigon to Marathon had a late spawning migrations that began in mid May and continued
into into early June• High flows decreased angling success• 2009, 2010 and 2011 year classes in the Jackpine R. and Cypress R. appear strong and both river appear to
have healthy adult populations• The adult population for the Cypress River was estimated to be 1500 to 2000 individuals

Acknowledgements The author of this report would like to thank the following persons and groups for all their hard work in making these projects successful.
McIntyre River Population StudyRandy Beamish, Wes Bender, Keith Ailey and Terry Kosolowski
Portage Creek Population StudyTom Kleinboeck (DFO). Mike Deschamps and Davis Viehbeck (OMNR) and NSSA membership
Cypress River Population StudyWes Bender. Keith Ailey, Terry Kosolowski
McVicar CreekNorm Stieh and Kyle Stratton
Co-op Angler Steelhead Data CollectionThanks to all the steelheaders that collected the data.
Aging and Data Management: Jon Tost, NSES
Funding: NSSA., Lake Superior Upper Great lakes Management Unit (OMNR)
Corporate Sponsorship:Enterprise Rent-A-Car and Normark Inc., Canada
Web Site: Frank Edgson

A Partnership in Science