advance-nebraska annual report
TRANSCRIPT

University of Nebraska-Lincoln 21 Canfield Lincoln, NE 68588-0433 Phone: 402-472-3304 FAX: 402-472-6276 Email: [email protected]
ADVANCE-Nebraska Annual Report For Period June 1, 2011-May 1, 2012


CONTENTS Section I. Summary of Project Activities, 2011-2012 ......................................................... 3
Section II. Project Participants .......................................................................................... 5
A. Project Participants ................................................................................................... 5
B. Other Organizations as Partners ............................................................................... 6
C. Other Collaborators and Contacts ............................................................................. 7
III. Activities and Findings .............................................................................................. 10
A. Major research and education activities of the project ............................................. 10
1. Activities that Promote Goal 1: to hire more women STEM faculty ........................ 10
2. Activities that Promote Goal 2: increase retention and support of women STEM faculty into positions of leadership ........................................................................... 13
3. Activities that Promote Goals 1 and 2: Activities that Address Goals 1 and 2: increase hiring and improve retention of women STEM faculty ................................. 15
4. Activities that Promote Goal 3: to conduct research on the formal and informal networks of STEM faculty. ........................................................................................ 17
5. Additional Activities.............................................................................................. 19
B. Major findings resulting from these activities. ......................................................... 22
1. Findings from Activities that Promote Goal 1: to hire more women STEM faculty .. 22
2. Findings from Activities that Promote Goal 2: increase retention and support women STEM faculty into positions of leadership ................................................................. 24
3. Findings from Activities that Promote Goals 1 and 2: Activities that Address Goals 1 and 2: increase hiring and improve retention of women STEM faculty ...................... 30
4. Findings from Activities that Promote Goal 3: to conduct research on the formal and informal networks of STEM faculty. .......................................................................... 36
5. Findings from Additional Activities ....................................................................... 42
C. Opportunities for training and development provided by project .............................. 43
D. Outreach activities project has undertaken. ............................................................ 43
Section IV. Publications and Products ............................................................................ 44
A. Journal Publications ............................................................................................... 44
B. Books and Other One-Time Publications ................................................................. 44
C. Internet Dissemination ........................................................................................... 44
D. Other Specific Products .......................................................................................... 45
Section V. Contributions ................................................................................................ 45
A. Contributions within Discipline ............................................................................... 45
B. Contributions to Other Disciplines .......................................................................... 46
C. Contributions to Human Resource Development ..................................................... 46
D. Contributions to Resources for Research and Education ......................................... 47
E. Contributions Beyond Science and Engineering ...................................................... 46VI. Appendices ............................................................................................................... 47

A. ADVANCE-Nebraska Programmatic Activities and Outcomes, 2008-2011 .................48
B. External Evaluator Report, A and B....................................................................76, 81
C. Institutional Recommendations & Bridge Period ...................................................... 86
D. Department Data Sheets ......................................................................................... 93
E. Report on NSF Indicators .......................................................................................126
F. ADVANCE-Nebraska E-News Sample ......................................................................154
G. Best Practices, Faculty Recruitment, Development and Retention draft ..................157
H. Data Collection Process and Analysis of Nonresponse: Faculty Network and Workload
Study 2011 .........................................................................................................194
I. Conceptual Model for Faculty Networks and Workload Study ..................................227J. Calendar of Events .................................................................................................229

SECTION I. SUMMARY OF PROJECT ACTIVITIES, 2011-2012 This year, UNL joined the Committee on Institutional Cooperation (the Big Ten),
providing us with a new set of peers for comparison. ADVANCE-Nebraska moved from the Office of Research and Economic Development (ORED) back into the Senior Vice Chancellor’s Office (Academic Affairs) in response to the recommendation of the Third Year Site Visit review team. We added a post-doctoral researcher to assist with data analysis, funded by ORED. Dr. Susan Fritz moved into the President of the UN system’s office and was replaced as Administrative Co-Director by Dr. Nancy Busch, head of ADVANCE’s Internal Evaluation Team.
Analysis of our toolkit (STEM faculty demographic) data indicate:
The proportion of women in UNL STEM faculty applicant pools has increased by 71% from 2007 (pre-ADVANCE) to 2011.
An increase in the proportion of women in applicant pools has resulted in an increased number of women hired at UNL.
31% of UNL STEM hires were women in 2011, compared to 19% pre-ADVANCE.
However, UNL STEM applicant pools remain below national rates of PhD’s awarded to women in corresponding disciplines.
Comparing UNL to our peers in the CIC: UNL has a higher proportion of women at the assistant professor level, but the representation of women overall in UNL STEM departments lags behind that of other CIC institutions (15% vs. 19%).
UNL hiring of STEM assistant professor women has increased, but hiring women at associate and full ranks remains flat, while men STEM faculty are hired at all ranks.
I. Recruitment Activities Dual Career Program
ADVANCE-Nebraska assisted in four hires in four departments. Two are new hires (Adams in Food Science and Othman in Biological Systems Engineering) from 28 positions open in our 24 target departments.
ADVANCE-Nebraska further assists in the recruitment of all new STEM faculty by meeting with candidates during campus visits to discuss work-life balance policies and other attractions at UNL and in Lincoln.
Other Activities to Support Recruitment of Excellent Diverse Faculty to UNL
Workshop for 31 search committee members, “Interrupting Bias in the Search Process” by Dr. Joyce Yen of the University of Washington’s ADVANCE program.
Three visits to search committee chairs to disseminate Best Practices
National Academy of Sciences member Dr. Geraldine Richmond, Chemistry, brought to campus as a Showcase Visitor.
Recruitment Ambassador: Angela Pannier of Civil Engineering sought potential applicants for new Head of CE at a national conference
II. Retention and Promotion Activities Dual Career Program
Two dual career opportunity hires for retention of women STEM faculty (Bartelt-Hunt in Civil Engineering and Brisson in the School of Biological Sciences).
ADVANCE Faculty Committee accomplishments
From bi-monthly meetings, draft of Best Practices for Faculty Recruitment, Development and Retention, A Guide for Colleges and Departments
Workshop for STEM Department Chairs
1
Data Breakfast with 21 STEM chairs provides an opportunity for STEM department chairs to review ADVANCE data on UNL demographics.
Deans and Chair Luncheon with presentation by Dr. Ann Austin, “Fostering Supportive and Productive Academic Workplaces for a Diverse Faculty: Strategies for Change and Success”.
Workshops for Faculty and Other Events
Professional development events and opportunities for informal networking:
New STEM Women Faculty Breakfast,
National Academy of Sciences member Dr. Geraldine Richmond provided a workshop, “Don’t Ask, Don’t Get: Women and Negotiation” for 38 faculty from 22 units.
Conversations 2.0, a dinner and night of professional development with three panels of experts to each address concerns of each rank of faculty for 42 faculty from 15 units.
Writing Retreat for twelve faculty from seven units.
Webinar, “Women’s Leadership: 6 Critical Skills to Advance Your Career” for 37 faculty at two locations in Lincoln, one in Omaha, and one in Scottsbluff.
Mary Deane Sorcinelli spoke on “Mutual Mentoring: Moving Beyond One-Size-Fits-All Mentoring” for 17 faculty from ten units.
E-News disseminated weekly.
Celebrations
Dr. Judy Walker, Professor of Mathematics, became chair of the Mathematics Department in the College of Arts and Sciences at UNL
The School of Biological Sciences received the Chancellor’s ADVANCE Initiative Award for 2012
III. Research Activities
Second wave of data collection of Faculty Networks and Workload Survey completed and analysis begun
Climate survey data reveal:
o On average, under-represented minorities (women and non-white men) report worse department climates.
o Faculty members who have greater network integration within their tenure home department report more positive climate perceptions and a greater desire to remain at UNL.
o Women compared to men (white and nonwhite) are much more likely to lack local integration (i.e., have many direct ties) within department friendship and research networks.
o Departments where faculty section off into subgroups within a department (i.e., many interactions are occurring among a subgroup of faculty members and fewer occurring with faculty outside of the subgroup) can lead to more positive climate perceptions and higher organizational commitment
o Segregated departments have poor climate perceptions and low organizational commitment. Segregated departments have ties that remain along demographic lines.
Grant proposal to Elsevier Foundation’s New Scholars Program funded ($45,000)
2

SECTION II. PROJECT PARTICIPANTS
A. PROJECT PARTICIPANTS
Participant Name Project Role More than 160
Hours
Ellen Weissinger
Principal investigator and Senior Vice Chancellor
for Academic Affairs. She is responsible for
ADVANCE Project oversight. She represents the project to the larger University of Nebraska
community, providing oversight and insights into
campus implementation and resources to assist in
achieving project goals, and foster coordination
among colleges and units.
No
Mary Anne Holmes
Co-PI Holmes is the director of ADVANCE-
Nebraska, directing all programming, establishing
and implementing the dual-career program,
responding to evaluation data. Holmes has been a
catalyst at the forefront of facilitating and delineating dual career arrangements up front, at
the time of the letter of offer, in collaboration with
department chairs, deans, and the SVCAA office
that is responsible for academic appointments.
She is co-PI on the NSF GAIN PAID grant and a
participant on the AWIS AWARDS PAID grant.
Yes
Julia McQuillan
Co-PI on the ADVANCE grant, Co-Director of the
Bureau of Social Research, and Professor of
Sociology. McQuillan serves as liaison among the
co-PIs, the evaluation team, and the research
component. In addition, she is collaborating on research papers from the ADVANCE data.
Yes
Timothy Wei
Co-PI and College of Engineering Dean, serves as a
lead representative from the College of Engineering
to implement ADVANCE-Nebraska activities in the College and to disseminate project information.
No
David Manderscheid
Co-PI and Dean of the College of Arts & Sciences,
serves as the lead representative from the College
to implement ADVANCE-Nebraska activities in the
College and to disseminate project information.
No
Jill Hochstein
Senior Personnel, Program Manager for ADVANCE-
Nebraska. Jill is responsible for logistics, budget
and finance, and day-to-day operation of the
ADVANCE-Nebraska office.
She manages and coordinates activities including
committee meetings, programs, and presentations
along with providing administrative support to the
office and ADVANCE committees. She coordinates materials for the ADVANCE website and
publications, and maintains the mailing list, and
Yes
3

database for dual-career hires.
Evelyn Jacobsen
Senior Personnel, and ADVANCE-Nebraska
Academic Administrative Director, serves as the day-to-day liaison between the ADVANCE-
Nebraska office and the Office of the Senior Vice
Chancellor for Academic Affairs (OSVCAA).
No
Nancy Busch
Senior Personnel, Associate Dean and Professor of
University Libraries, directs the ADVANCE-Nebraska internal evaluation team by working
with internal collaborators, UNL’s Survey,
Statistics, and Psychometric Core Facility (SSP),
the Bureau of Sociological Research (BOSR), and
Institutional Research and Planning (IRP) to coordinate evaluation for the program.
No
Mindy Anderson-
Knott
Senior Personnel, Assistant Director of the Survey,
Statistics and Psychometrics Core Facility,
coordinates all data management and specific data
collection of surveys, exit interviews, formative assessment, and all project evaluations and
ongoing data collection used to evaluate the
project’s progress. She oversees the design and
administration of surveys to evaluate the
effectiveness of the activities and initiatives of
ADVANCE-Nebraska and prepares reports. She also directed the collection, analysis, and write-up
of data on the climate survey.
Yes
Christina Falci
Senior Personnel and Assistant Professor of
Sociology leading the research of a network analysis study to advance the basic understanding
of the organizational structures influencing
promotion and retention of women in STEM
departments.
Yes
Dan Hoyt
Chair of Sociology, Director of UNL's Survey, Statistics, and Psychometric Core Facility (SSP);
provides consultation to ADVANCE-Nebraska
internal evaluation team on the quality and
methods of social and behavioral science research.
No
Patricia Wonch Hill
Postdoctoral Research Associate; conducts data
analysis and contributes to reports produced by
the ADVANCE-Nebraska internal evaluation team,
as well as contributes to publications,
dissemination of research and grant writing.
yes
Michelle Johnston Technician, provides support to several different
evaluation projects, checking and analyzing data
and preparing reports.
No
B. OTHER ORGANIZATIONS AS PARTNERS
4

Organization Role
UNL Bureau of Sociological Research
(BOSR) A research division of the Department of
Sociology, the BOSR provides ADVANCE-Nebraska methodological consulting and
research survey services.
UNL Institutional Research and Planning
(IRP) IRP maintains, manages, and reports
information on students, faculty and staff,
academic programs, national and peer institutions, higher education trends, and
agency data; helping ADVANCE-Nebraska
collect and analyze institutional data.
UNL Survey, Statistics, and Psychometric Core Facility (SSP)
SSP provides consultation to ADVANCE-Nebraska on survey research, statistical, and
psychometric applications to support their
research initiatives.
UNL Equity, Access and Diversity (EAD) Provides data on applicant pools.
UNL Office of the Senior Vice Chancellor of
Academic Affairs (SVCAA) Provides data on tenure and promotion; dual
career hire facilitation; new hire letters of
offer; exit data.
Institute of Agricultural and Natural
Resources (IANR) Provides data on tenure and promotion and
new hire letters of offer.
C. OTHER COLLABORATORS AND CONTACTS
A. MISCELLANEOUS COLLABORATORS AND CONTACTS
Participant Role
Ronald Yoder
Associate Vice Chancellor of the Institute of
Agriculture and Natural Resources,
represents the perspective of the institute and the field of agriculture and natural resources
and oversees implementation of the project in
the institute and its allied units.
Linda Crump
Assistant to the Chancellor, and Director of the Equity, Access & Diversity Programs at
UNL; consults on appropriate policy for
faculty searches and procedures.
Judy Joy
Representative from Institutional Research
and Planning, serve as liaison between IRP, the ADVANCE Evaluation Team, and the IAB
and provides quick and efficient data access.
William J. Nunez
Associate to the Chancellor and Director of
the Office of Institutional Research and Planning; assisted with salary and space
studies.
5
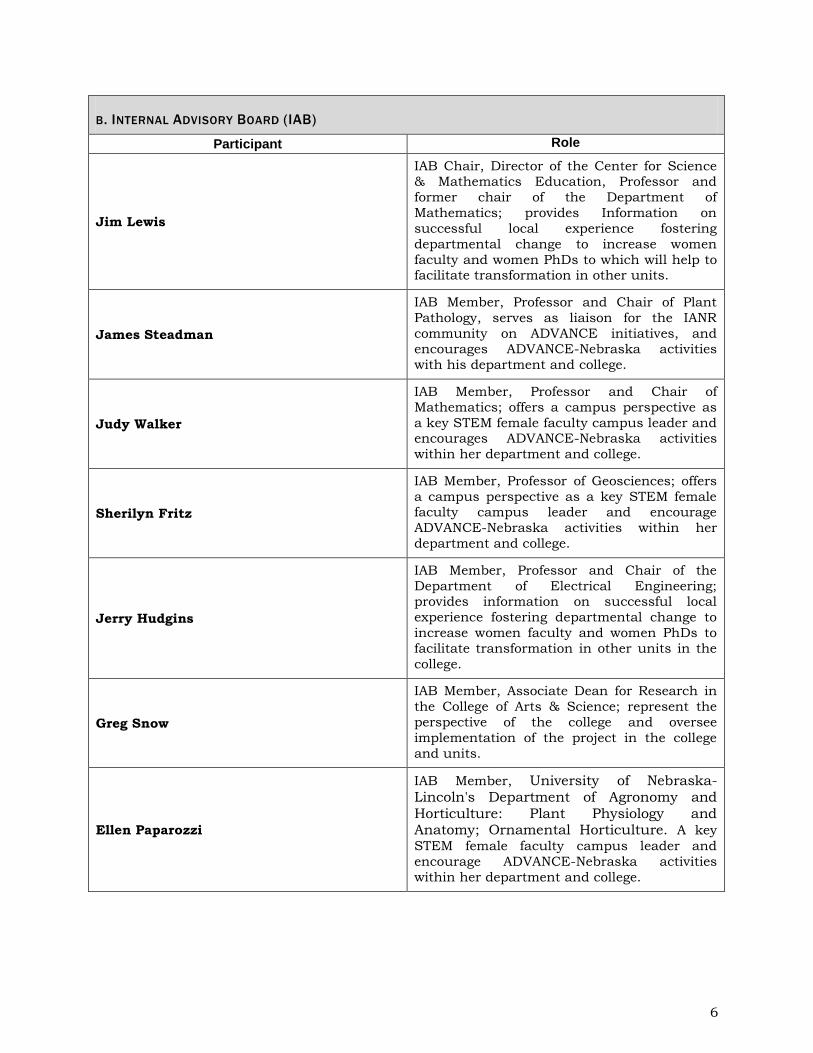
B. INTERNAL ADVISORY BOARD (IAB)
Participant Role
Jim Lewis
IAB Chair, Director of the Center for Science & Mathematics Education, Professor and
former chair of the Department of
Mathematics; provides Information on
successful local experience fostering
departmental change to increase women
faculty and women PhDs to which will help to facilitate transformation in other units.
James Steadman
IAB Member, Professor and Chair of Plant
Pathology, serves as liaison for the IANR
community on ADVANCE initiatives, and encourages ADVANCE-Nebraska activities
with his department and college.
Judy Walker
IAB Member, Professor and Chair of
Mathematics; offers a campus perspective as
a key STEM female faculty campus leader and encourages ADVANCE-Nebraska activities
within her department and college.
Sherilyn Fritz
IAB Member, Professor of Geosciences; offers
a campus perspective as a key STEM female faculty campus leader and encourage
ADVANCE-Nebraska activities within her
department and college.
Jerry Hudgins
IAB Member, Professor and Chair of the
Department of Electrical Engineering; provides information on successful local
experience fostering departmental change to
increase women faculty and women PhDs to
facilitate transformation in other units in the
college.
Greg Snow
IAB Member, Associate Dean for Research in
the College of Arts & Science; represent the
perspective of the college and oversee
implementation of the project in the college
and units.
Ellen Paparozzi
IAB Member, University of Nebraska-Lincoln's Department of Agronomy and Horticulture: Plant Physiology and Anatomy; Ornamental Horticulture. A key
STEM female faculty campus leader and
encourage ADVANCE-Nebraska activities
within her department and college.
6
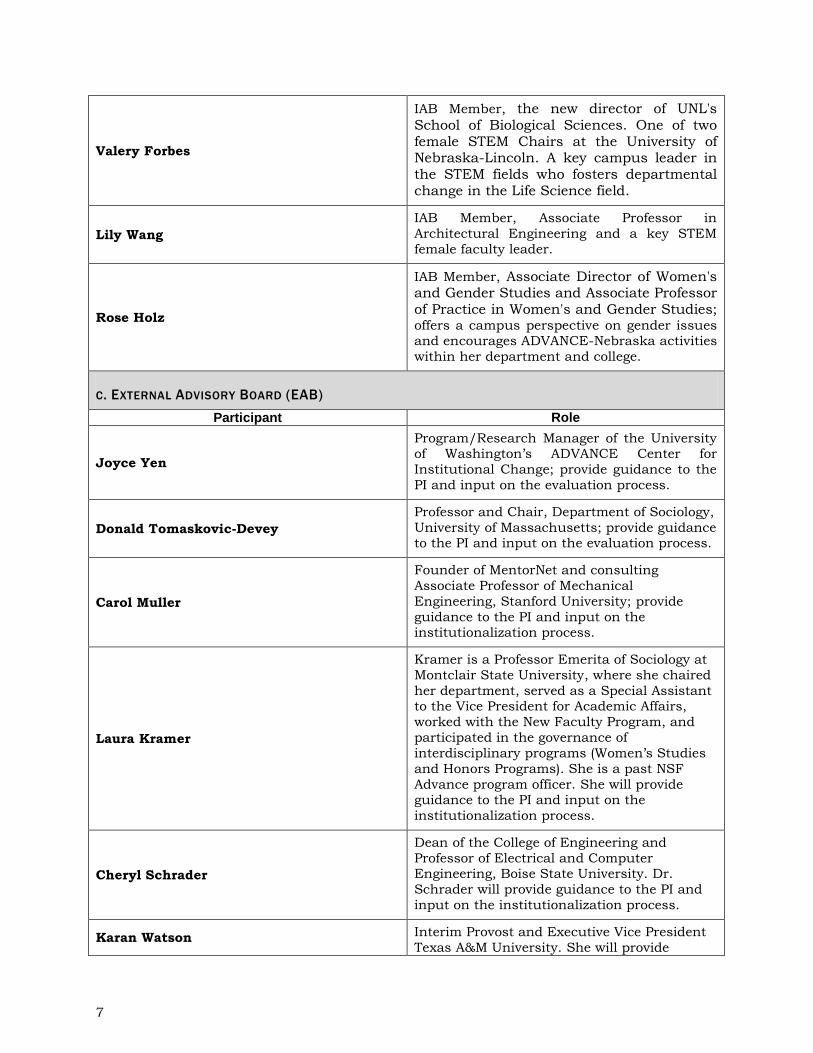
Valery Forbes
IAB Member, the new director of UNL's School of Biological Sciences. One of two female STEM Chairs at the University of Nebraska-Lincoln. A key campus leader in the STEM fields who fosters departmental change in the Life Science field.
Lily Wang
IAB Member, Associate Professor in
Architectural Engineering and a key STEM
female faculty leader.
Rose Holz
IAB Member, Associate Director of Women's and Gender Studies and Associate Professor of Practice in Women's and Gender Studies; offers a campus perspective on gender issues and encourages ADVANCE-Nebraska activities
within her department and college.
C. EXTERNAL ADVISORY BOARD (EAB)
Participant Role
Joyce Yen
Program/Research Manager of the University of Washington’s ADVANCE Center for
Institutional Change; provide guidance to the
PI and input on the evaluation process.
Donald Tomaskovic-Devey
Professor and Chair, Department of Sociology,
University of Massachusetts; provide guidance to the PI and input on the evaluation process.
Carol Muller
Founder of MentorNet and consulting
Associate Professor of Mechanical
Engineering, Stanford University; provide
guidance to the PI and input on the institutionalization process.
Laura Kramer
Kramer is a Professor Emerita of Sociology at
Montclair State University, where she chaired
her department, served as a Special Assistant to the Vice President for Academic Affairs,
worked with the New Faculty Program, and
participated in the governance of
interdisciplinary programs (Women’s Studies
and Honors Programs). She is a past NSF
Advance program officer. She will provide guidance to the PI and input on the
institutionalization process.
Cheryl Schrader
Dean of the College of Engineering and
Professor of Electrical and Computer Engineering, Boise State University. Dr.
Schrader will provide guidance to the PI and
input on the institutionalization process.
Karan Watson Interim Provost and Executive Vice President
Texas A&M University. She will provide
7

guidance to the PI and input on the
institutionalization process.
SECTION III. ACTIVITIES AND FINDINGS
A. MAJOR RESEARCH AND EDUCATION ACTIVITIES OF THE PROJECT
1. ACTIVITIES THAT PROMOTE GOAL 1: TO HIRE MORE WOMEN STEM FACULTY
A. DUAL CAREER PROGRAM
A formal dual career program has been established through the ADVANCE-Nebraska office and is a hallmark of the grant. For the current academic year, there were 28 positions open among our 24 target departments. Letters explaining ADVANCE’s Dual Career program were sent to 66 short-list candidates for these positions. Nine responded with dual career opportunities between July 1, 2011 and April 30, 2012 for seven of the open positions (i.e. two opportunities for each of two positions). Four of these nine are partners of faculty already on campus and so are recruitment opportunities. Among the other six, three received offers for the position. Two of these have accepted the position at UNL, with a position for their partner. The other is currently in negotiation. Of the four couples already on campus, one partner has accepted a position at UNL and the other two are currently in negotiation.
Among the four dual career opportunities to retain a faculty member already on campus, Dr. Huihui Xu was hired by the College of Engineering in the Biological Systems Engineering Department as an Assistant Professor in August, 2011. She is the wife of Dr. Shadi Othman, who is a current faculty member in Biological Systems Engineering at UNL. Dr. Xu arrived in the spring semester as a Showcase visitor under the ADVANCE-Nebraska program. The program will pay ¼ of Dr.Xu’s salary for the next three years. That portion will be picked up by UNL at the end of the three years.
Dr. Gerrard Adams was hired by the Institute of Agricultural and Natural Resources in the Plant Pathology Department as an Associate Professor of Practice in November 2011. He is the spouse of Dr. Heather Hallen-Adams, an Associate Professor in Food Science also already on campus. ADVANCE-Nebraska will fund 0.5 FTE for Dr. Adams for 3.5 years.
Two additional new faculty who are partnered to faculty members already on campus are in the process of negotiating offers for dual career positions: Dr. George Hunt is in the process of reviewing a contract for a Professor of Practice position in the College of Engineering in the Civil Engineering Department. He is the husband of Dr. Shannon Bartelt-Hunt, an Associate Professor in Civil Engineering and recent CAREER grant awardee. This will be the first Professor of Practice appointment in the College of Engineering. The faculty of the College are currently amending their by-laws to include PoP’s as faculty members, transitioning from Lecturer positions. PoP positions offer a clearer career path for the faculty who hold them: there are three ranks for PoP’s, as for tenure-leading faculty: assistant, associate and full. Our other two target colleges, Arts and Sciences and IANR, adopted these positions prior to ADVANCE.
Dr. Ryan Bickel is also in the process of reviewing a contract for a Professor of Practice position, cross-appointed in the College of Arts & Sciences and IANR, in the School of Biological Sciences (A&S) and the Department of Entomology (IANR). He is the husband of Dr. Jenn Brisson, an Assistant Professor in the School of Biological Sciences. ADVANCE
8
and the colleges are still working on the details of their appointments, but both have accepted positions within UNL.
Faculty who will be hired through last year’s searches who have dual career partners are still in negotiation. Two of these have accepted positions at UNL; all partners are still in negotiation. ADVANCE-Nebraska paid for the interview visits for two of these partners.
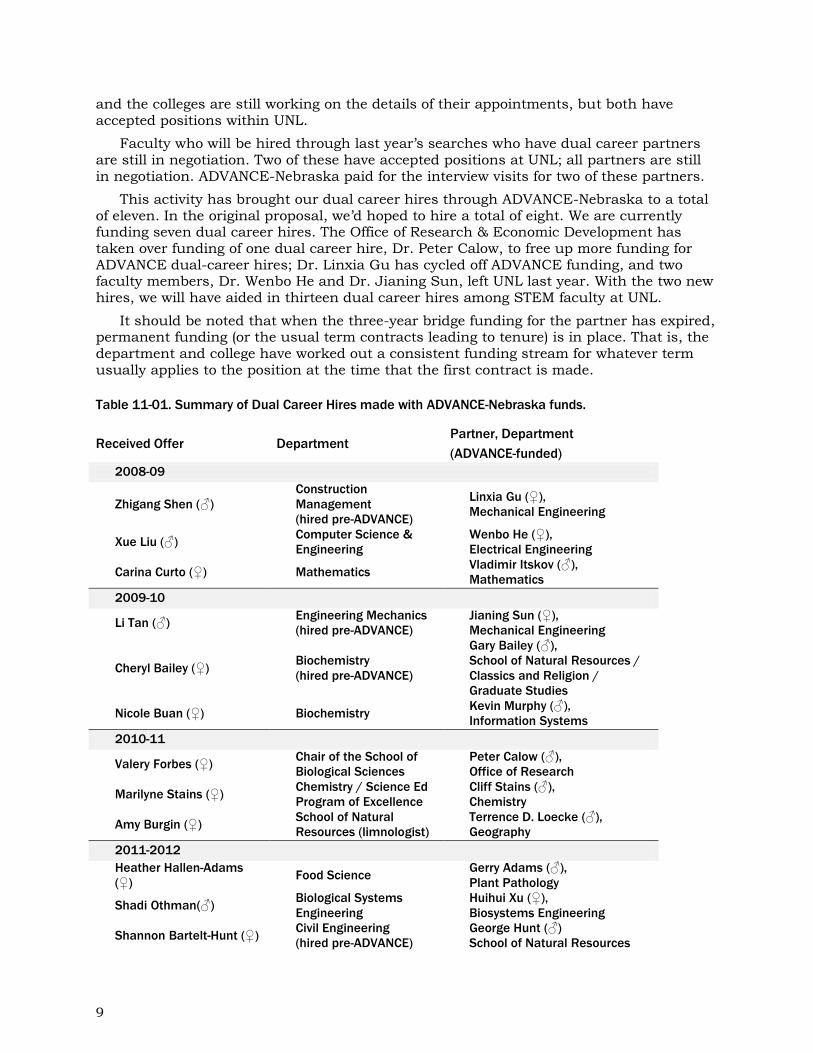
This activity has brought our dual career hires through ADVANCE-Nebraska to a total of eleven. In the original proposal, we’d hoped to hire a total of eight. We are currently funding seven dual career hires. The Office of Research & Economic Development has taken over funding of one dual career hire, Dr. Peter Calow, to free up more funding for ADVANCE dual-career hires; Dr. Linxia Gu has cycled off ADVANCE funding, and two faculty members, Dr. Wenbo He and Dr. Jianing Sun, left UNL last year. With the two new hires, we will have aided in thirteen dual career hires among STEM faculty at UNL.
It should be noted that when the three-year bridge funding for the partner has expired, permanent funding (or the usual term contracts leading to tenure) is in place. That is, the department and college have worked out a consistent funding stream for whatever term usually applies to the position at the time that the first contract is made.
Table 11-01. Summary of Dual Career Hires made with ADVANCE-Nebraska funds.
Received Offer Department Partner, Department
(ADVANCE-funded)
2008-09
Zhigang Shen (♂)
Construction
Management
(hired pre-ADVANCE)
Linxia Gu (♀),
Mechanical Engineering
Xue Liu (♂) Computer Science &
Engineering
Wenbo He (♀),
Electrical Engineering
Carina Curto (♀) Mathematics Vladimir Itskov (♂),
Mathematics
2009-10
Li Tan (♂) Engineering Mechanics
(hired pre-ADVANCE)
Jianing Sun (♀),
Mechanical Engineering
Cheryl Bailey (♀) Biochemistry
(hired pre-ADVANCE)
Gary Bailey (♂),
School of Natural Resources /
Classics and Religion /
Graduate Studies
Nicole Buan (♀) Biochemistry Kevin Murphy (♂),
Information Systems
2010-11
Valery Forbes (♀) Chair of the School of
Biological Sciences
Peter Calow (♂),
Office of Research
Marilyne Stains (♀) Chemistry / Science Ed
Program of Excellence
Cliff Stains (♂),
Chemistry
Amy Burgin (♀) School of Natural
Resources (limnologist)
Terrence D. Loecke (♂),
Geography
2011-2012
Heather Hallen-Adams
(♀) Food Science
Gerry Adams (♂),
Plant Pathology
Shadi Othman(♂) Biological Systems
Engineering
Huihui Xu (♀),
Biosystems Engineering
Shannon Bartelt-Hunt (♀) Civil Engineering
(hired pre-ADVANCE)
George Hunt (♂)
School of Natural Resources
9
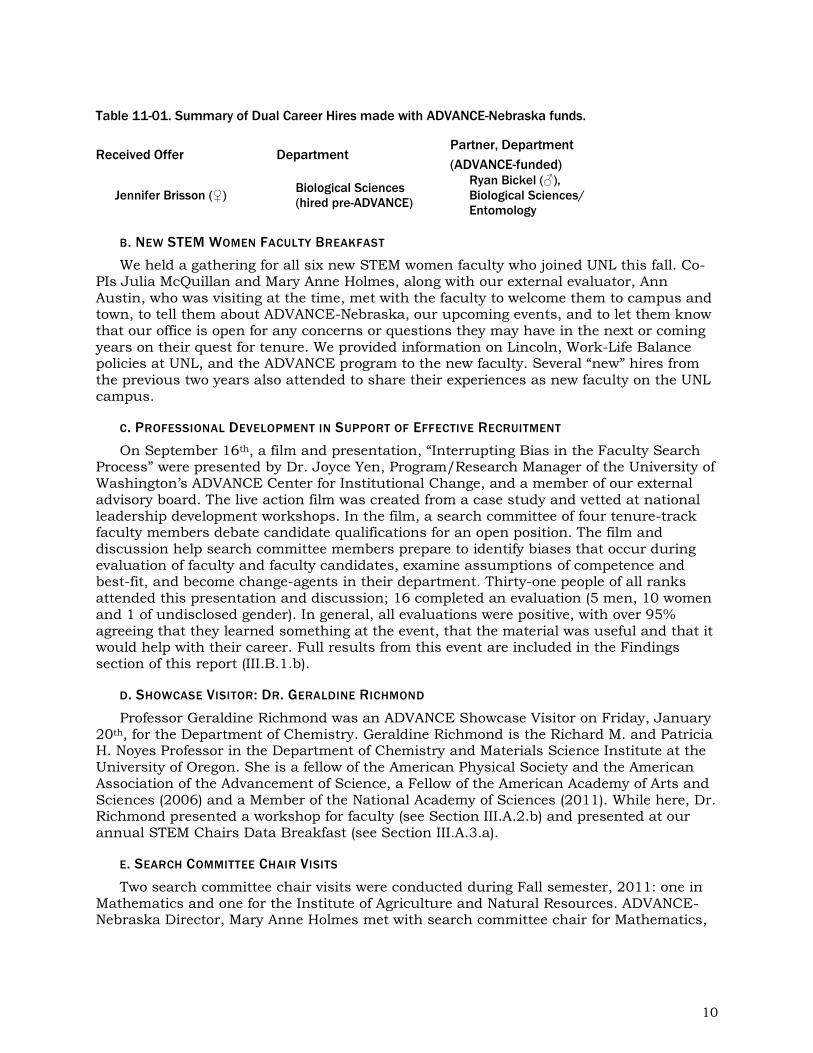
Table 11-01. Summary of Dual Career Hires made with ADVANCE-Nebraska funds.
Received Offer Department Partner, Department
(ADVANCE-funded)
Jennifer Brisson (♀) Biological Sciences
(hired pre-ADVANCE)
Ryan Bickel (♂),
Biological Sciences/
Entomology
B. NEW STEM WOMEN FACULTY BREAKFAST
We held a gathering for all six new STEM women faculty who joined UNL this fall. Co-PIs Julia McQuillan and Mary Anne Holmes, along with our external evaluator, Ann Austin, who was visiting at the time, met with the faculty to welcome them to campus and town, to tell them about ADVANCE-Nebraska, our upcoming events, and to let them know that our office is open for any concerns or questions they may have in the next or coming years on their quest for tenure. We provided information on Lincoln, Work-Life Balance policies at UNL, and the ADVANCE program to the new faculty. Several “new” hires from the previous two years also attended to share their experiences as new faculty on the UNL campus.
C. PROFESSIONAL DEVELOPMENT IN SUPPORT OF EFFECTIVE RECRUITMENT
On September 16th, a film and presentation, “Interrupting Bias in the Faculty Search Process” were presented by Dr. Joyce Yen, Program/Research Manager of the University of Washington’s ADVANCE Center for Institutional Change, and a member of our external advisory board. The live action film was created from a case study and vetted at national leadership development workshops. In the film, a search committee of four tenure-track faculty members debate candidate qualifications for an open position. The film and discussion help search committee members prepare to identify biases that occur during evaluation of faculty and faculty candidates, examine assumptions of competence and best-fit, and become change-agents in their department. Thirty-one people of all ranks attended this presentation and discussion; 16 completed an evaluation (5 men, 10 women and 1 of undisclosed gender). In general, all evaluations were positive, with over 95% agreeing that they learned something at the event, that the material was useful and that it would help with their career. Full results from this event are included in the Findings section of this report (III.B.1.b).
D. SHOWCASE VISITOR: DR. GERALDINE RICHMOND
Professor Geraldine Richmond was an ADVANCE Showcase Visitor on Friday, January 20th, for the Department of Chemistry. Geraldine Richmond is the Richard M. and Patricia H. Noyes Professor in the Department of Chemistry and Materials Science Institute at the University of Oregon. She is a fellow of the American Physical Society and the American Association of the Advancement of Science, a Fellow of the American Academy of Arts and Sciences (2006) and a Member of the National Academy of Sciences (2011). While here, Dr. Richmond presented a workshop for faculty (see Section III.A.2.b) and presented at our annual STEM Chairs Data Breakfast (see Section III.A.3.a).
E. SEARCH COMMITTEE CHAIR VISITS
Two search committee chair visits were conducted during Fall semester, 2011: one in Mathematics and one for the Institute of Agriculture and Natural Resources. ADVANCE-Nebraska Director, Mary Anne Holmes met with search committee chair for Mathematics,
10
Dr. Sri Iyengar on October 24. Jill Hochstein put together a packet for distribution to search committee members with:
What ADVANCE is, why NSF thinks this issue is important (the data)
Where we are trying to make an improvement:
o Recruitment: broad ad (too late for this search); letters of invitation to apply;
Best Practices document
o Evaluation: rubrics for evaluation
o Dual Career assistance – the letter we send to short-list candidates, how
ADVANCE’s dual career works
o The Interview: promotional material on UNL and Lincoln
Evelyn Jacobson, Administrative Director for ADVANCE-Nebraska, met with the Institute of Agriculture and Natural Resources (IANR) search chairs on October 31. Many of them had positions that were in the final stages of the search, but took the prepared packets to distribute to all the departments. Department statistics were of interest to many of the chairs.
F. RECRUITMENT AMBASSADORS
Dr. Angela K. Pannier from UNL Biological Systems Engineering (BSE) went to the Institute of Biological Engineering (IBE) Meeting in Indianapolis, IN. She had three objectives for her IBE trip: 1) To chair a technical session (Tissue and Cellular Engineering); 2) To present a talk (Alginate hydrogels as a three-dimensional extracellular matrix for in vitro elongation of porcine embryos); and 3) To recruit a diverse pool of candidates for the open Department Head position for BSE. Pannier connected with 5 individuals for the department head position and one of those individuals provided her with a list of 12 additional individuals to invite to apply. A personal letter was sent from the Head of the Search Committee (Milford Hanna) to these 12 people (5 of whom are women faculty members) asking them to submit an application. Two of those contacted did apply, and one person is considered to be one of the strongest candidates. They just began reviewing applications and are creating their short list.
2. ACTIVITIES THAT PROMOTE GOAL 2: INCREASE RETENTION AND SUPPORT OF WOMEN STEM FACULTY
INTO POSITIONS OF LEADERSHIP
A. NEW STEM WOMAN CHAIR IN MATHEMATICS
Dr. Judy Walker, Professor of Mathematics, became the second woman STEM chair in UNL’s Arts & Sciences College history beginning in January, 2012. Dr. Walker has served on ADVANCE’s Internal Advisory Board since the program began and was one of our Paths to Success Luncheon Series Speakers our first year. In addition to her accomplishments in the field of mathematics, Dr. Walker has been a key organizer for the annual Nebraska Conference for Undergraduate Women in Mathematics, now in its 14th year. This conference aims to retain undergraduate women in math by providing a place to showcase their expertise and to interact with more senior women in mathematics.
B. WRITING RETREAT, MAY, 2011
Twelve people attended the 2011 Writing Retreat, two men and ten women. The following departments were represented: Agronomy & Horticulture, Animal Science, Earth & Atmospheric Sciences, School of Biological Sciences, School of Veterinary Medicine & Biomedical Sciences, Sociology, and University Libraries. Professors of all ranks (Assistant, Associate and Full) attended. The retreat was held on city campus in UNL Library.
11

C. PROGRAMMING EVENTS FOR STEM FACULTY
On September 8th, ADVANCE-Nebraska kicked off the new semester with Conversations 2.0, a workshop of multiple panel discussions with a range of topics that focused on faculty at each rank. Forty-two faculty attended, including five senior UNL faculty panelists. Following welcoming remarks by Ellen Weissinger and Ronnie Green, a panel and breakout sessions were held. The panel and breakout sessions addressed topics related to tenure, promotion, and leadership. Some of the topics included:
A good start to reach tenure – setting up a lab, tackling teaching, maintaining a publishing stream
Maintaining Momentum to Full Professor – strategies for staying on course – building an international reputation, work-life balance, while maintaining progress towards full professor
Staying engaged as a Full Professor – how can I best serve the University, nominating colleagues for awards, considering leadership opportunities
Department Chairs as Key Campus Leaders- facilitating social connections among department members, work/life balance policies, facilitating success among faculty members, continuous searching mode, extra efforts for excellence through diversity.
In general, all of evaluations were positive, with over 90% agreeing that the material was useful and that it would help with their career. Full results from this event are included in the Findings section of this report (III.B.2.a.b.i).
On November 16th, a webinar entitled, "Women's Leadership: Six Critical Skills to Advance Your Career" was hosted by the ADVANCE team at three locations across the UN campus (City Campus Union, East Campus Ag Hall, and Peter Kiewit in Omaha), and one location 400 miles west of Lincoln in Scottsbluff, NE at an Extension Center. Thirty-seven people attended. The training offered suggestions on how to dodge and avoid victim thinking and acting, what women can do to increase emotional intelligence and maturity, how to jump-start positive attitudes and increase productivity, and how to acquire powerful techniques to keep toxic people and thoughts out. In general, all of evaluations were positive, with over 90% agreeing that the material was useful and that it would help with their career. Full results from this event are included in the Findings section of this report (III.B.2.b.ii).
Professor Geraldine Richmond was an ADVANCE Showcase Visitor on Friday, January 20th. While at UNL, she also led a workshop, “Don’t Ask, Don’t Get: Women and Negotiation” with over 50 people registered. The topics discussed were a subset of the material covered in the COACh2 workshops. Thirty-eight people of various ranks attended the workshop; 29 completed an evaluation (all women). In general, all evaluations were positive, with all (100%) agreeing that they learned something useful at the event, that the material was useful and that it would help with their career. Full results from the workshop are included in the Findings section of this report (III.B.2.b.iii).
Mary Deane Sorcinelli visited the UNL campus on March 7th, and gave a talk to UNL faculty entitled “Mutual Mentoring: Moving Beyond One-Size-Fits-All Mentoring”. Sorcinelli’s presentation focused on the emergence of a new, more flexible approach to mentoring in which faculty build a network of “multiple mentors” who can address a variety of career competencies. She identified potential roadblocks to success in an academic career, exploring both traditional and emerging models of mentoring. She discussed how to “map” your own mentoring networks and discussed best practices for mentoring, including how to be your own best mentor. Seventeen people of all academic ranks attended the event; 15 completed an evaluation (4 men and 11 women). In general, all evaluations were positive, with all (100%) agreeing that the material was useful and that it would help with their
12

career. Full results from this event are included in the Findings section of this report (III.B.2.b.iv).
C. E-NEWS AND WEBSITE
We continue to disseminate information on new studies relating to women in STEM via E-News (See Appendix VI. F. for an example). At least a dozen different people on campus, and about half a dozen off campus, send us articles that they would like to see featured in E-News. E-News is released weekly by the program manager, Jill Hochstein. We continue to modify and add information to the ADVANCE-Nebraska website at http://advance.unl.edu. We migrated to the new university content management system this year, which eases updating of files across the website.
3. ACTIVITIES THAT PROMOTE GOALS 1 AND 2: ACTIVITIES THAT ADDRESS GOALS 1 AND 2: INCREASE
HIRING AND IMPROVE RETENTION OF WOMEN STEM FACULTY
A. DATA BREAKFAST WITH STEM CHAIRS
A Data Discussion Breakfast was held on January 20th with twenty-one UNL STEM Department Chairs. ADVANCE-Nebraska’s Postdoctoral Research Associate, Trish Wonch Hill, lead the presentation, along with Professor Julia McQuillan and evaluation lead researcher, Mindy Anderson-Knott. We were fortunate to have Dr. Geraldine Richmond visiting campus. She provided the chairs a summary of survey data that her team has collected nationwide as part of a larger study funded by several federal agencies and the American Chemical Society. The survey had two targets: STEM department chairs and heads, and STEM women faculty. It probed the differences in perceptions of STEM women’s lived experiences from the perceptions of their department chairs.
Chairs were provided with Departmental Data sheets prepared for each of our target departments by the ADVANCE-Nebraska evaluation team. These sheets provided our most recent data on the gender composition, both pre- and post-ADVANCE (2005-2008 and 2009-2011), of:
the department applicant pools
current total faculty
the proportion of women in Tenured/Tenure-track positions in their departments and
the average proportion of women faculty in their peer departments at Committee on Institutional Cooperation (CIC) institutions.
UNL joined the CIC, the “Big Ten”, this year.
Graphs of the data provided the trend in the proportion of women in all filled STEM Assistant Professor searches between 2005 and 2011.
In addition, each Department with recent hires was provided data on the proportion of women in their filled Assistant professor searches from pre- and post-ADVANCE Nebraska. Graphic display allowed comparison of the proportion of women in their applicant pools for their most recent search compared to NSF PhD recipient rates for their discipline.
Chairs were asked to compare their own data to similar departments at UNL, to the CIC, and to NSF data on doctoral degrees granted by field. Chairs then participated in small group discussions with other chairs in their colleges. All then filled out a worksheet to describe their numbers and how they interpreted them, to clarify what they think is their Department’s greatest strength in recruiting and retaining excellent and diverse faculty, and to share some of their best practices in creating a positive departmental climate.
13

We also gathered feedback from chairs on whether they felt the data were informative and/or if they had suggestions for peer data comparisons in the future with either the NSF or CIC data, as departments among the institutions do not always match perfectly (e.g., some institutions may combine Mathematics and Statistics, whereas others split these into two departments). Currently, we have been working to update these data with two additional UNL departments based on feedback from chairs at this Breakfast.
The Department Data Sheets have also been used in discussions with search committee chairs in IANR and A&S STEM departments, and will be presented to the College of Engineering department chairs. The datasheets are available in Appendix VI.D.
B. CHANCELLOR’S ADVANCE INITIATIVE AWARD
The call for the 2nd annual Chancellor’s ADVANCE Initiative Award went out in October to select another department at the University that met the goals of ADVANCE-Nebraska, to: 1) Increase the number of STEM women on the UNL faculty, and 2) Increase the retention of women STEM faculty and support their promotion into positions of professional leadership by increasing informal networking and professional development opportunities. We received four applications from the School of Biological Sciences and from the departments of Civil Engineering, Mathematics, and Chemistry.
The annual Chancellor’s ADVANCE Initiative Award was awarded on February 9, 2012 to the School of Biological Sciences. The award carries a $1,000 prize for the department to further the work of ADVANCE. The department has successfully built a faculty that is more representative of the female-male ratio in the discipline by implementing a proactive hiring policy in the 1990s. Some 37 percent of the school’s faculty are women, up from 10 percent 20 years ago. The school has aggressively pursued a dual-career hiring strategy and half of its female faculty have dual-career partners. The school also has utilized the opportunity-hire strategy to recruit female partners of faculty hired in other disciplines. Currently, 16 of the school’s 45 budgeted or partially budgeted faculty are women.
The school also has worked to help increase the visibility of women scientists by inviting women scientists to present at departmental seminars. Several faculty have leadership roles in ADVANCE-Nebraska initiatives. Several faculty actively mentor junior female faculty and the department’s women have been recognized for their efforts in promoting women in science. For example, Alexandra Basolo, professor, received an “Outstanding Contributions to the Status of Women” award from the UNL Chancellor’s Commission on the Status of Women; Eileen Hebets, associate professor, and Sabrina Russo, assistant professor, received Edgerton Junior Faculty awards from UNL; Basolo, Hebets, Forbes and Zoya Avramova, professor, have served on journal editorial boards. Avramova, Russo, Hebets and Gwen Bachman, associate professor, have served on National Science Foundation grant proposal review panels. The full article is at http://biosci.unl.edu/biological-sciences-honored-hiring-efforts.
C. ADVANCE FACULTY COMMITTEE
The ADVANCE Faculty Committee met twice monthly during the Academic year. The major accomplishment of the committee was to finalize a complete draft of the "Best Practices for Faculty Recruitment, Development and Retention, a Guide for Colleges and Departments at UNL". The content for the guide was gathered from published sources as well as the collective experiences of members of the Faculty Committee. In December 2011, The BP guide was submitted to the Office of Equal Access and Diversity for review and editorial comments. In January 2012, the committee met to explore ways to promote the Best Practice Procedures at UNL. Invitations were sent to meet with each of three vice chancellors, Ellen Weissinger (Senior Vice Chancellor of Academic Affairs and PI on
14
ADVANCE-Nebraska), Ronnie Green (Institute of Agriculture and Natural Resources), and Prem Paul (Research and Economic Development). The meeting with Dr. Paul took place on March 30, 2012 where Dr. Paul was supportive of the document. Meetings with Dr. Weissinger and Dr. Green are scheduled for April 27 and 30. The IAB discussed the BP document at their meeting on April 24. The IAB enthusiastically supported the BP document and encouraged the committee to use this document to help guide changes to existing processes and procedures.
The ADVANCE Faculty Committee is also concerned with fostering a collegial community for women faculty in STEM fields. To begin this process and to seek the advice of the broader UNL community, a series of brown bag lunches were scheduled for Spring Semester, 2012. Three brown bag lunches have been held with small but increasing attendance. The last brown bag lunch of the semester is scheduled for May 8, 2012.
Members of the faculty committee also served on recruitment committees for faculty and students. Among these are those seeking chairs for the Departments of Civil Engineering, Chemical and Biomolecular Engineering, and Statistics. Other ADVANCE Faculty committee members serve on the graduate recruitment committees in their respective departments. This places individuals with experience in best practices to recruit women in STEM in position to assist in the recruitment processes.
Personnel changes for 2011-2012 included: loss of Merlin Lawson, Earth and Atmospheric Sciences to retirement; loss of Tracy Frank, Earth and Atmospheric Sciences and Xiao Cheng Zeng, Chemistry, to Faculty Development Leave (sabbatical). In their
stead, the following faculty have joined the Committee: Anrea Cupp, Professor, Animal Sciences; Jack Morris, Professor, School of Biological Sciences; Sheila Purdem, Professor, Animal Sciences; and Anu Subramanian, Professor, Chemical and Biomolecular Engineering.
D. DEANS AND CHAIR LUNCHEON: FOSTERING CHANGE
UNL’s external evaluator, Ann Austin, gave a luncheon talk to fifteen STEM Deans and Chairs entitled “Fostering Supportive and Productive Academic Workplaces for a Diverse Faculty: Strategies for Change and Success”. This lunch seminar was an opportunity for STEM Chairs/Heads and faculty members to consider strategic approaches to organizational change and the nurturing of organizational environments supportive of a diverse faculty. Drawing on research on academic work and workplaces, as well as an NSF-ADVANCE-funded study of 19 universities that have had National Science Foundation ADVANCE Institutional Transformation awards, the seminar highlighted an overall framework for creating environments that encourage faculty productivity, satisfaction, and morale. Dr. Austin focused particularly on the role of departmental leaders in creating contexts that are conducive to the success of all faculty members.
4. ACTIVITIES THAT PROMOTE GOAL 3: TO CONDUCT RESEARCH ON THE FORMAL AND INFORMAL
NETWORKS OF STEM FACULTY.
A. ON-GOING RESEARCH AND DISSEMINATION
Members of the Faculty Network and Work Survey (FNWS) research team (Falci, Watanabe and McQuillan) have submitted two research manuscripts this past year entitled “Disconnected in the Ivory Tower: An Exploratory Study of Gender and Race Differences in STEM Faculty Networks” and “Department Climate and Faculty Job Satisfaction in STEM Disciplines: Explaining Differences by Race and Gender.” Both of
15

these manuscripts are currently being revised for resubmission to peer-reviewed journals in sociology. The research team has five additional research manuscripts in progress listed below:
Falci, Christina and Megumi Watanabe. “Faculty Network Position and Structure on
Academic Climate Perceptions.”
McQuillan, Julia, Patricia Wonch Hill, Christina Falci, Megumi Watanabe, and Mary Anne
Holmes. “Academic Rank & Faculty Perceptions: Is Higher Better For White Men Only?”
McQuillan, Julia, Christina Falci, and Megumi Watanabe. “Network Structure and
Academic Climates: A Department Level of Analysis.”
Olson, Kristen, Christina Falci and Megumi Watanabe. “Social Isolation and Survey
Nonresponse: An Empirical Evaluation Using Social Network Data”
All of the above in-progress research manuscripts have been presented at various academic conferences in the past year including two papers at the Sunbelt Social Network Conference, one paper at the Midwest Association for Public Opinion Research, and one invited paper at the Eastern Sociological Society Meeting. The FNWS was designed to explore several different research questions at multiple levels of analysis. The FNWS conceptual model (see Appendix VI.I.) provides an orienting frame from which future research manuscripts will be developed and tested using FNWS data.
We have received wave 2 data from the Bureau of Sociological Research. Thus far, we have cleaned the data, identified the final sample that will be used in future statistical analysis, and have preliminary results on climate outcomes. We have also completed our report on the data collection process and nonresponse (see Findings section of this report, III.B.4).
B. FACULTY NETWORKS AND WORKLOAD STUDY: DATA MANAGEMENT AND ANALYSIS
The survey for the Faculty Network and Workload Study (FNWS) was conducted by the Bureau of Sociological Research (BOSR) at the University of Nebraska-Lincoln in March 2011. The survey intended to measure faculty networks, climate perceptions, and faculty productivity. The study design for the FNWS consisted of a mixed mode survey: faculty had the option of filling out the survey on the web or via mail questionnaire.
In fall 2011, we received the data from our second wave of data collection - the Faculty Networks and Workload Study (FNWS) - from the Bureau of Social Research (BOSR). This data effort collection improved on the first wave of data collection, the 2008 pilot study. First, we now have a comparison group of non-STEM faculty because we added an additional 16 social science departments at UNL to the survey sample. Second, expanding from 26 to 42 departments has increased our sample size from about 450 to over 750 faculty members. This will increase our statistical power to explore more research questions. Importantly, we now have considerably more under-represented faculty in our sample. Finally, we combined the network and climate survey into a single survey instrument allowing us to draw sounder inferences on the associations between faculty network structure and academic climate perceptions.
Overall, there was a 73.1% individual response rate. Response rates varied by department and college; the highest college level response rate was 76.6% of the Institute of Agricultural Sciences and Natural Resources (IANR) and the lowest response rate was 60.3% of the College of Engineering. Four out of five colleges had response rates above 70%.
As of spring 2012, the climate data analysis has begun (results are described in the Findings section, III.B.4.b), but the network analysis is still in progress as it is a time-intensive process. The FNWS is a census drawn from the population of STEM and Social
16
and Behavioral Science departments at the University of Nebraska Lincoln. Because this is not a random sample, tests of statistical significance are not necessary.
Part of this past year has been spent cleaning the FNWS data (i.e., finding and correcting errors in the data), recoding variables and developing indices, creating adjacency matrices from the network question, and using social network analysis to create numerous measures of network structure at the individual and department level. We also wrote an extensive Data Collection Process and Analysis of Nonresponse Report (see Appendix VI.H.) that details the survey implementation protocol, issues that arose in the process of data collection, and the results from numerous statistical analyses assessing differences in faculty response rates across frame characteristics (e.g., race, gender, rank). Overall, the FNWS survey was a very successful data collection effort. Working in consultation with experts in survey research methodology (Jolene Smyth and Kristen Olsen) at UNL, we attained a 75% individual level response rate overall (559 out of 744 faculty). More importantly, the relational response rate within each department is above 85% for all but three departments in the study. This high relational response rate is necessary for conducting the type of social network analysis we wish to pursue with FNWS data.
During this past year, we have also replicated preliminary findings from the 2008 pilot study. Some but not all of our previously reported findings were replicated in the FNWS. Specifically, we find that clustering of faculty both within research or friendship networks is associated with departments that have an overall positive climate and greater organizational commitment by faculty. Our prior findings suggested that clustering within friendship networks was detrimental to department climates. At an individual level, we find that being integrated both locally (i.e., have more direct ties to other faculty) and globally (i.e., having extensive indirect connections to other faculty – through other faculty in the department) is associated with more positive climate perceptions and higher organizational commitment. The direct connections, however, manifest a stronger association.
5. ADDITIONAL ACTIVITIES
A. PERSONNEL CHANGES
Patricia Wonch Hill was added to the team on July 1, 2011 as a Postdoctoral Research Associate. Funding for Dr. Hill is being provided by the UNL Office of Research and Economic Development (Dr. Prem Paul, our former PI, is Vice Chancellor for ORED). On becoming familiar with core ADVANCE goals, data, and reports, she is PI on a funded grant proposal through the Elsevier Foundation’s New Scholars Program to fund a Big Ten STEM writing retreat June 17th through the 21st, 2012. Dr. Hill has helped to compile and analyze case study data on 2010-11 STEM hires as part of the evaluation efforts, and attended a week-long GAIN (Geoscience Academics in the Northeast) writing retreat with Mary Anne Holmes to hone her grant writing skills and observe first-hand how a successful writing retreat is conducted.
Currently Dr. Hill’s work focuses on data analysis for priority ADVANCE-related publications and institutionalization-related summary reports, dual career analysis and summary for the dual career program. Her funding will extend for fiscal year 2012-2013 through the ADVANCE, the Office of Research and Economic Development, and the Elsevier Foundation’s New Scholars Program.
Other personnel changes that have affected the ADVANCE-Nebraska program include: Dr. Ellen Weissinger, Vice Chancellor of Academic Affairs has become the new PI of the ADVANCE-Nebraska grant. Dr. Nancy Busch, head of the ADVANCE evaluation team at
17

UNL, has become an Administrative Co-Director after the departure of Dr. Susan Fritz, who has taken a promotion into the Central Administration offices of the University of Nebraska system. In addition, Dr. Evelyn Jacobson started her new position as chair of Modern Languages in August. She remains with the ADVANCE program as an Administrative co-director, along with Dr. Busch.
B. EXTERNAL EVALUATOR
Ann Austin, ADVANCE-Nebraska’s external evaluator, visited Nebraska three times this academic year. During her August visit, she met with the evaluation team and various leaders across campus focusing on 4 areas of discussion: 1. Methods to translate data into reports and publishable articles, 2. Institutionalization Perceptions: talking to stakeholders, 3. Moving forward the next two years; how to answer the long-range questions, what's transferable after ADVANCE and, 4. Pulling data together for dual career publications. Ann was also able to attend the New Women in STEM faculty breakfast that was held by ADVANCE-Nebraska in the city union while she was here. Her report is included in Appendix VI. B.
Dr. Austin visited again Nebraska January 16 – 18th, 2012 and met with Ellen Weissinger, Senior Vice Chancellor for Academic Affairs, the ADVANCE leadership team, and the evaluation team to work on an institutionalization plan and bridge period until the end of the grant. Her report with accompanying recommendations is included in Appendix VI. C. This will help ensure that the efforts and successes of ADVANCE-Nebraska move forward into an appropriate and effective institutional plan.
C. STEM DEPARTMENTAL CHANGES
Engineering Mechanics and Mechanical Engineering merged into a single Department. In addition, the majority of faculty in the Department of Industrial and Management Systems Engineering were incorporated into this department as well (six faculty out of eight). This changes the total number of STEM Departments from 26 to 24.
D. PROGRESS TOWARDS INSTITUTIONALIZATION
Ann Austin made a series of visits to UNL over the course of year four (August, January and March) to help ADVANCE-Nebraska create a plan for Institutionalization. The results are provided in a summary report titled, “Institutionalization Recommendations” (Appendix VI.C.)and the more comprehensive, “Programmatic Activities and Outcomes 2008-2011” (see Appendix VI. A) To date, the recommendations have been shared with the co-Pi’s, the Internal Advisory Board and the External Advisory Board. In addition, we have plans to share these documents with Institutional leadership in the future.
The six recommendations outlined in the plan are:
1. Institutionalize regular data collection, reports and discussions of data with department chairs, heads, and college deans.
2. Institute professional development for faculty to support effective recruitment. 3. Continue commitment to dual career hiring by maintaining a designated program
and promoting a positive dual career culture. 4. Offer on-going professional development for faculty focused on career stage needs. 5. Offer on-going leadership development for faculty. 6. Promote regular social events and social spaces on campus.
All programmatic planning within the ADVANCE-Nebraska Program will be done in connection with the SVCAA Office to bridge the institutionalization of initiatives in the coming year. The following timeline outlines activities planned for the remaining period of ADVANCE-Nebraska’s NSF funding, with reference to the six major recommendations:
18

Spring/Summer, 2012
Sponsor the UNL Writing Retreat (Professional Development)
Promote the Elsevier Foundation-funded CIC Writing Retreat (Professional Development)
Charge ADVANCE-Nebraska faculty committee to suggest ideas for future professional development specific to career stages (Professional Development)
Fall, 2012
Offer a symposium to share results from the UNL network and climate study to administrators and faculty (Share data) September 2012
Conduct focus groups with associate and full professor STEM women about climate, leadership, and other related issues to frame program planning (Professional Development)
Offer a workshop on effective recruitment practices for chairs and search committees based on ADVANCE-Nebraska faculty committee materials (Recruitment) Fall 2012
Spring, 2013
Repeat the UNL network and climate survey (Evaluation)
Share and discuss institutional and comparison data with department chairs (Share Data)
Sponsor the UNL Writing Retreat (Professional Development) Each Semester
Continue to institutionalize the University’s commitment to a dual career program that supports strategic efforts to explore and, when possible, implement dual career opportunities (Dual Career)
Offer professional development events for faculty at all career stages. Suggested events include initiating bi-monthly informal lunches, inviting external speakers to address climate and culture issues (Professional Development)
Promote social events and spaces by hosting university-wide events, encouraging departments to host events and create social spaces, and highlight department social events in the “E-News” or other university communications (Social Events)
E. PROGRAM MANAGEMENT
An Internal Advisory Board meeting was held on November 10th. Our principal topic evolved to discuss what parts of the ADVANCE program are working best and should be continued beyond the life of the grant and in what form, given that the Chancellor has pledged $90,000 per year for five years beyond the life of the grant. The Dual Career Program had strong support. Faculty development programs also had strong support.
Another Internal Advisory Board meeting was held April 24, 2012 and will be discussed in next year’s annual report. The agenda includes a discussion of the Programmatic Activities and Outcomes, the ADVANCE Faculty Committee’s Best Practices for Faculty Recruitment and Retention Document, and a budget update.
F. GRANT PROPOSAL SUBMISSIONS
A key task for the Postdoctoral Research Associate was to seek out and apply for funding opportunities to support the goals of ADVANCE-Nebraska. So far, two grant proposals have been submitted and one has been funded. The first proposal was for a UNL Big Ten (CIC) STEM Writing Retreat and was proposed to the Elsevier Foundation’s New
19

Scholars Program. This proposal was submitted in September 2011, and awarded January 2012 ($45,000). The writing retreat will be held June 17th through the 22nd at UNL. We currently have 25 registrants: seven from UNL, and the rest from Illinois, Michigan, Wisconsin, Ohio, Florida and Washington. The second grant proposal was submitted as a supplemental writing retreat for Social Scientists working on issues related to women in STEM. This was submitted to the American Sociological Association's Fund for Advancing the Discipline grant ($7,000) and was declined.
In addition, white papers are currently being drafted to fund additional proposals related to ADVANCE-Nebraska goals. Dr. Christina Falci is working on a proposal to conduct Network Analysis among International faculty with collaborator Dr. Kathrin Zippel. In addition, she is seeking external funding for a Postdoctoral Researcher who will analyze existing data from the FNWS survey related to how Department Network structures impact productivity and satisfaction for STEM faculty.
B. MAJOR FINDINGS RESULTING FROM THESE ACTIVITIES.
1. FINDINGS FROM ACTIVITIES THAT PROMOTE GOAL 1: TO HIRE MORE WOMEN STEM FACULTY
A. DUAL CAREER PROGRAM
Nationwide, STEM women faculty are more likely to be partnered with another STEM faculty member or professional than men, more likely to have a professional partner than their non-STEM women faculty colleagues. This is true at UNL as well (Figure 1). Data from the UNL Faculty Networks survey reveal that approximately 91% of current STEM faculty at UNL identify as having a spouse or partner. Fifty nine percent of those have a partner that either has, or is working on, an advanced degree (PhD or Masters) or professional degree (JD, MD, etc.).
Although STEM men faculty are much more likely than women faculty to have a partner or spouse (95% vs. 84%), STEM women faculty at UNL are much more likely than men faculty to have a partner who has or is seeking an advanced or professional degree (75% vs. 56%, Figure 1). In comparison, we find no difference between non-STEM men and women faculty at UNL in the proportion with a partner or spouse having or seeking an advanced degree (64% for both men and women).
Figure 1.
B. PROFESSIONAL DEVELOPMENT IN SUPPORT OF EFFECTIVE RECRUITMENT
Joyce Yen presented “Interrupting Bias in the Faculty Search Process” on September 16, 2011. Dr. Yen is the program/research manager of the University of Washington’s
56% 64%
75%
64%
0%
20%
40%
60%
80%
STEM* Non-STEM
Percent Partnered Faculty with Potential Dual Career Opportunity by Gender
STEM vs. Non-STEM
Men
Women
20
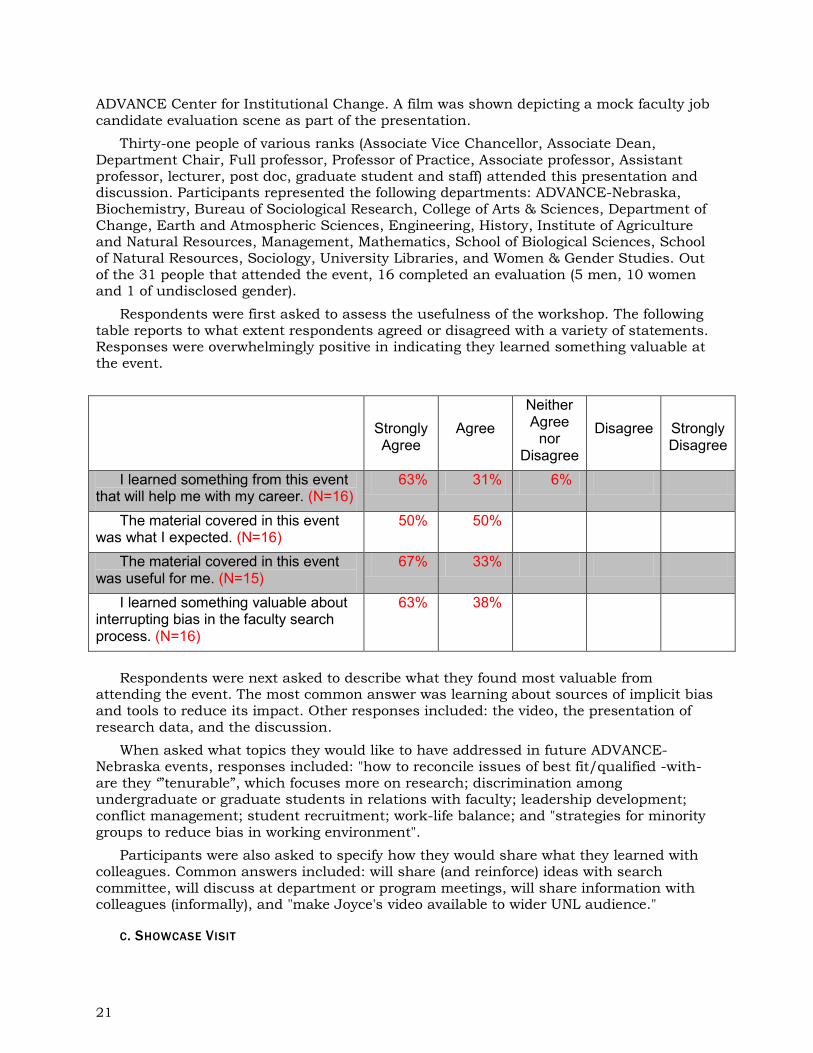
ADVANCE Center for Institutional Change. A film was shown depicting a mock faculty job candidate evaluation scene as part of the presentation.
Thirty-one people of various ranks (Associate Vice Chancellor, Associate Dean, Department Chair, Full professor, Professor of Practice, Associate professor, Assistant professor, lecturer, post doc, graduate student and staff) attended this presentation and discussion. Participants represented the following departments: ADVANCE-Nebraska, Biochemistry, Bureau of Sociological Research, College of Arts & Sciences, Department of Change, Earth and Atmospheric Sciences, Engineering, History, Institute of Agriculture and Natural Resources, Management, Mathematics, School of Biological Sciences, School of Natural Resources, Sociology, University Libraries, and Women & Gender Studies. Out of the 31 people that attended the event, 16 completed an evaluation (5 men, 10 women and 1 of undisclosed gender).
Respondents were first asked to assess the usefulness of the workshop. The following table reports to what extent respondents agreed or disagreed with a variety of statements. Responses were overwhelmingly positive in indicating they learned something valuable at the event.
Strongly Agree
Agree
Neither Agree
nor Disagree
Disagree
Strongly Disagree
I learned something from this event that will help me with my career. (N=16)
63% 31% 6%
The material covered in this event was what I expected. (N=16)
50% 50%
The material covered in this event was useful for me. (N=15)
67% 33%
I learned something valuable about interrupting bias in the faculty search process. (N=16)
63% 38%
Respondents were next asked to describe what they found most valuable from
attending the event. The most common answer was learning about sources of implicit bias and tools to reduce its impact. Other responses included: the video, the presentation of research data, and the discussion.
When asked what topics they would like to have addressed in future ADVANCE-Nebraska events, responses included: "how to reconcile issues of best fit/qualified -with-are they ‘”tenurable”, which focuses more on research; discrimination among undergraduate or graduate students in relations with faculty; leadership development; conflict management; student recruitment; work-life balance; and "strategies for minority groups to reduce bias in working environment".
Participants were also asked to specify how they would share what they learned with colleagues. Common answers included: will share (and reinforce) ideas with search committee, will discuss at department or program meetings, will share information with colleagues (informally), and "make Joyce's video available to wider UNL audience."
C. SHOWCASE VISIT
21
Search committee chair focus group participants prior conducted early in the ADVACE-Nebraska program expressed the importance of bringing in potential candidates to showcase UNL. The demand for showcase visitor funding has been relatively low, but the impact of this strategy has been significant: of the four showcase visitors funded by ADVANCE-Nebraska, one STEM woman was hired as an Assistant Professor in fall, 2011 in Biological Systems Engineering.
D. SEARCH COMMITTEE CHAIR VISITS
This was the first time Dr. Iyengar of Mathematics chaired a search committee. Dr. Iyengar had not heard of nor thought of writing letters to people to ask their students to apply, one of the strategies ADVANCE-Nebraska promotes to diversify applicant pools. Dr. Iyengar had also not heard of ADVANCE’s dual career program, but knew that Carina Curto and Vladimir Itskov were hired as a dual career couple in his department. He appreciated hearing that ADVANCE takes care of this issue so the search committee need not think about it. Dr. Iyengar would like his short-list candidates to meet with Holmes to talk about ADVANCE, the dual career program, and the positive aspects of UNL and of Lincoln, and to see another building besides Avery. He appreciated knowing there was someone he could ask if questions arose about the interview process.
The IANR meeting was also fruitful. The Agronomy and Horticulture Department mentioned that the pool percentage would not reflect the availability of women in various sub-disciplines of the primary field. The search committee chair for Natural Resources, Don Wilhite, said that he has been working to schedule a meeting of CIC heads to see if they can identify departments to which SNR would be comparable to assess whether his pools reflect national availability of STEM women.
E. RECRUITMENT AMBASSADORS
The Department of Civil Engineering had three Recruitment Ambassadors this year, which resulted in several contacts and a list of five potential female candidates. The applicant review process is currently underway. While there has been little demand for Recruitment Ambassador funding from ADVANCE-Nebraska, search committee focus group participants stressed the importance of always networking, and the majority of search committee and department chairs (62%) reported in a survey that they are talking to potential candidates at conferences. Moreover, our surveys show departments that discussed how to recruit women at faculty meetings were significantly more likely to plan to talk to candidates at conferences/meetings in future. This strategy appears to be valued more in non-STEM fields. While most STEM respondents (80%) from the Recruit and Retain Series pretest found talking to candidates at conferences somewhat useful, none (0%) found it very useful, compared to 42% of non-STEM faculty reporting it to be very useful.
2. FINDINGS FROM ACTIVITIES THAT PROMOTE GOAL 2: INCREASE RETENTION AND SUPPORT WOMEN
STEM FACULTY INTO POSITIONS OF LEADERSHIP
A. WRITING RETREAT, MAY, 2011
Twelve people attended the 2011 Writing Retreat, two men and ten women. The following departments were represented: Agronomy & Horticulture, Animal Science, Earth & Atmospheric Sciences, School of Biological Sciences, School of Veterinary Medicine & Biomedical Sciences, Sociology, and University Libraries. Professors of all ranks (Assistant, Associate and Full) attended.
22
Three evaluations were received for the writing retreat. All said that they either agreed or strongly agreed that they learned something valuable about writing. Responses were more neutral (with respondents selecting either agree or neither agree nor disagree) when asked whether the material covered was what they expected, whether the material was useful for them, and whether they learned anything that will help with their career.
Participants found the most valuable thing about the retreat to be the quiet time to write. Additional answers included being able to informally meet colleagues over lunch, learning about campus resources from one another, learning about how faculty in other departments "get things done," and making significant progress on a writing project.
When asked what topics they would like to have addressed in future ADVANCE-Nebraska events, one respondent said they would like a "go to" list of campus resources. Another respondent said they would prefer to use all allotted time at the writing retreat to write independently.
Participants were also asked how they plan on sharing what they learned with their colleagues, and to specify how ADVANCE-Nebraska can help them do this. One respondent said "having/organizing regular writing retreats." Another respondent said they would talk to their department chair. The third respondent said, "The book “How to Write a Lot” [by Paul Silva, distributed to each participant] provides a simple but effective rule to help increase output."
Two respondents learned about the writing retreat via e-mail (one of those from an email announcement), and one learned about it from their department chair. All respondents attended the writing retreat because they needed to write a paper they've been working on, as opposed to the need to write a grant proposal.
One participant commented, "Great to have a quiet place away from my office to work. Liked the informal lunch where I had a chance to hear about what others in the group were doing. The [great?] info was ‘old hat.’"
B. PROGRAMMING EVENTS FOR STEM FACULTY
i. Conversations 2.0 A dinner and night of professional development was offered for UNL STEM faculty and
administrators on September 8, 2011. Forty-two people of various ranks (Vice Chancellor, Dean, Associate Dean, Department Chair, Full professor, Associate professor, Assistant professor, post doc and staff) attended this event. Participants represented the following departments: Academic Affairs, ADVANCE-Nebraska, Biochemistry, Center for Science, Mathematics & Computer Education, Chemistry, Civil Engineering, College of Arts & Sciences, Earth and Atmospheric Sciences, Electrical Engineering, Engineering, Food Science & Technology, Institute of Agriculture and Natural Resources, Mathematics, Office of Research, Plant Pathology, School of Biological Sciences, School of Natural Resources, School of Veterinary Medicine & Biomedical Sciences, Sociology, Statistics, Teaching, Learning & Teacher Education, and University Libraries. Out of the 42 people that attended the event, 20 completed an evaluation (6 men and 14 women).
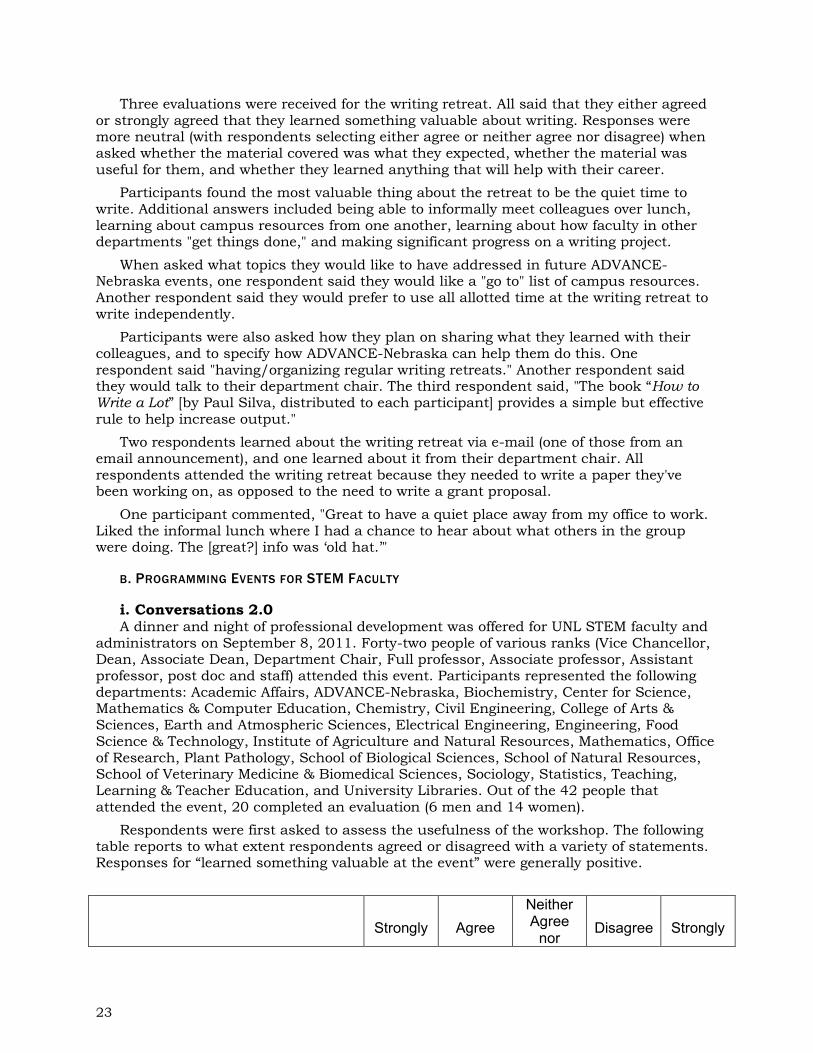
Respondents were first asked to assess the usefulness of the workshop. The following table reports to what extent respondents agreed or disagreed with a variety of statements. Responses for “learned something valuable at the event” were generally positive.
Strongly
Agree Neither Agree
nor
Disagree
Strongly
23

Agree Disagree Disagree I learned something from this event
that will help me with my career. (N=20) 40% 55% 5%
The material covered in this event was what I expected. (N=20)
45% 35% 20%
The material covered in this event was useful for me. (N=20)
40% 50% 10%
I learned something valuable from the opening panel. (N=19)
37% 42% 16% 5%
I learned something valuable from the breakout session. (N=20)
45% 40% 15%
Respondents were next asked to describe what they found most valuable from attending the event. The most common answers were: networking with other faculty (particularly junior faculty), and hearing the perspective of others (especially senior faculty). Participants found the breakout sessions to be particularly valuable. Other responses included: time management strategies, career preparation, authorship expectations, strategies for working with students, lab safety, and the importance of scheduled writing.
When asked what topics they would like to have addressed in future ADVANCE-Nebraska events, the most common answers were mentoring (how to mentor students and junior faculty, and how to seek mentors), strategies for advising students, and dual career issues (how to ensure both parties have fulfilling careers).
Participants were also asked to specify how they would share what they learned with colleagues. Common answers included: would share information at meetings, share in one-on-one conversations or interactions with others (including colleagues, graduate students and post docs), and would share with young faculty members. Other answers included: convey ideas to promotion & tenure committee, "encourage the department to create a sample tenure portfolio," encourage colleagues to attend "Conversations" in the future, and invite junior faculty to lunch.
ii. Women’s Leadership Webinar On November 16th, a webinar entitled, "Women's Leadership: Six Critical Skills to
Advance Your Career" was hosted by the ADVANCE team at 4 locations across the UN campus: East Campus in Lincoln, City Campus in Lincoln, the Peter Kiewit Center in Omaha, and the Extension office in Scottsbluff. Thirty-seven people attended.
Respondents were first asked to assess the usefulness of the workshop. The following table reports to what extent respondents agreed or disagreed with a variety of statements. Responses were positive in reference to having learned something that will help with their career, and the material presented being useful for them. Most respondents agreed that the material covered was what they expected.
N=23 Strongly Agree
Agree
Neither Agree
nor Disagree
Disagree
Strongly Disagree
I learned something from this event 30% 61% 9%
24
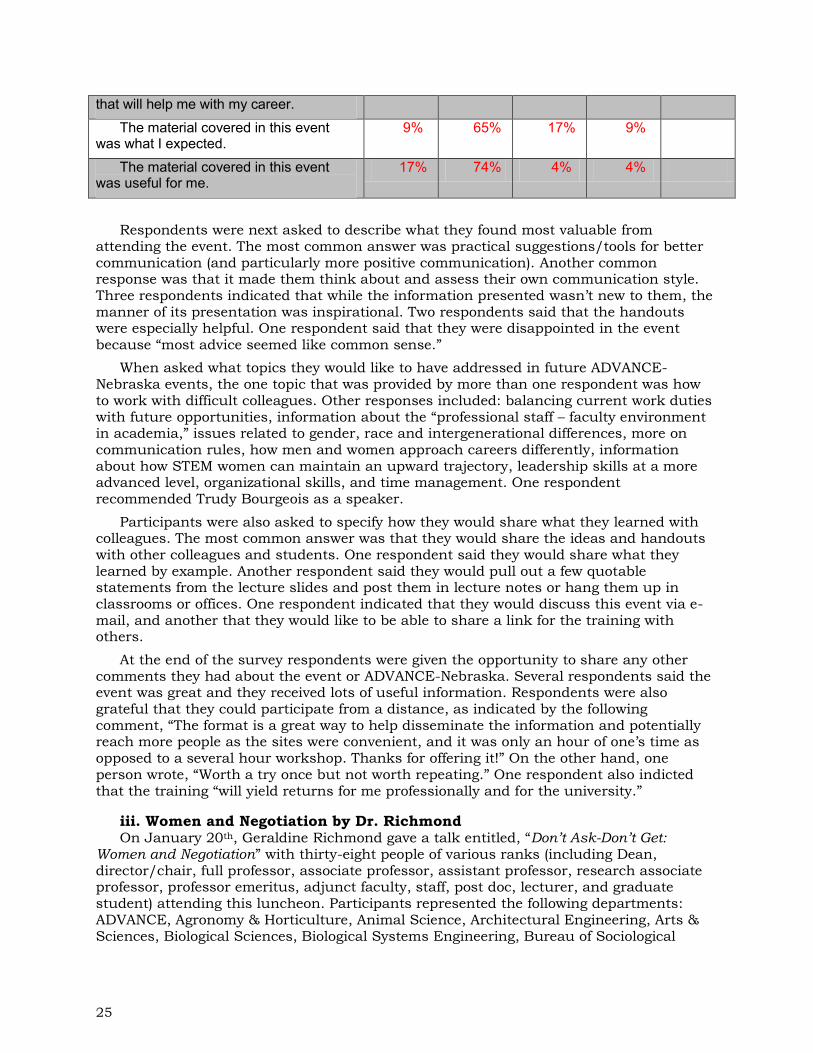
that will help me with my career.
The material covered in this event was what I expected.
9% 65% 17% 9%
The material covered in this event was useful for me.
17% 74% 4% 4%
Respondents were next asked to describe what they found most valuable from attending the event. The most common answer was practical suggestions/tools for better communication (and particularly more positive communication). Another common response was that it made them think about and assess their own communication style. Three respondents indicated that while the information presented wasn’t new to them, the manner of its presentation was inspirational. Two respondents said that the handouts were especially helpful. One respondent said that they were disappointed in the event because “most advice seemed like common sense.”
When asked what topics they would like to have addressed in future ADVANCE-Nebraska events, the one topic that was provided by more than one respondent was how to work with difficult colleagues. Other responses included: balancing current work duties with future opportunities, information about the “professional staff – faculty environment in academia,” issues related to gender, race and intergenerational differences, more on communication rules, how men and women approach careers differently, information about how STEM women can maintain an upward trajectory, leadership skills at a more advanced level, organizational skills, and time management. One respondent recommended Trudy Bourgeois as a speaker.
Participants were also asked to specify how they would share what they learned with colleagues. The most common answer was that they would share the ideas and handouts with other colleagues and students. One respondent said they would share what they learned by example. Another respondent said they would pull out a few quotable statements from the lecture slides and post them in lecture notes or hang them up in classrooms or offices. One respondent indicated that they would discuss this event via e-mail, and another that they would like to be able to share a link for the training with others.
At the end of the survey respondents were given the opportunity to share any other comments they had about the event or ADVANCE-Nebraska. Several respondents said the event was great and they received lots of useful information. Respondents were also grateful that they could participate from a distance, as indicated by the following comment, “The format is a great way to help disseminate the information and potentially reach more people as the sites were convenient, and it was only an hour of one’s time as opposed to a several hour workshop. Thanks for offering it!” On the other hand, one person wrote, “Worth a try once but not worth repeating.” One respondent also indicted that the training “will yield returns for me professionally and for the university.”
iii. Women and Negotiation by Dr. Richmond On January 20th, Geraldine Richmond gave a talk entitled, “Don’t Ask-Don’t Get:
Women and Negotiation” with thirty-eight people of various ranks (including Dean, director/chair, full professor, associate professor, assistant professor, research associate professor, professor emeritus, adjunct faculty, staff, post doc, lecturer, and graduate student) attending this luncheon. Participants represented the following departments: ADVANCE, Agronomy & Horticulture, Animal Science, Architectural Engineering, Arts & Sciences, Biological Sciences, Biological Systems Engineering, Bureau of Sociological
25
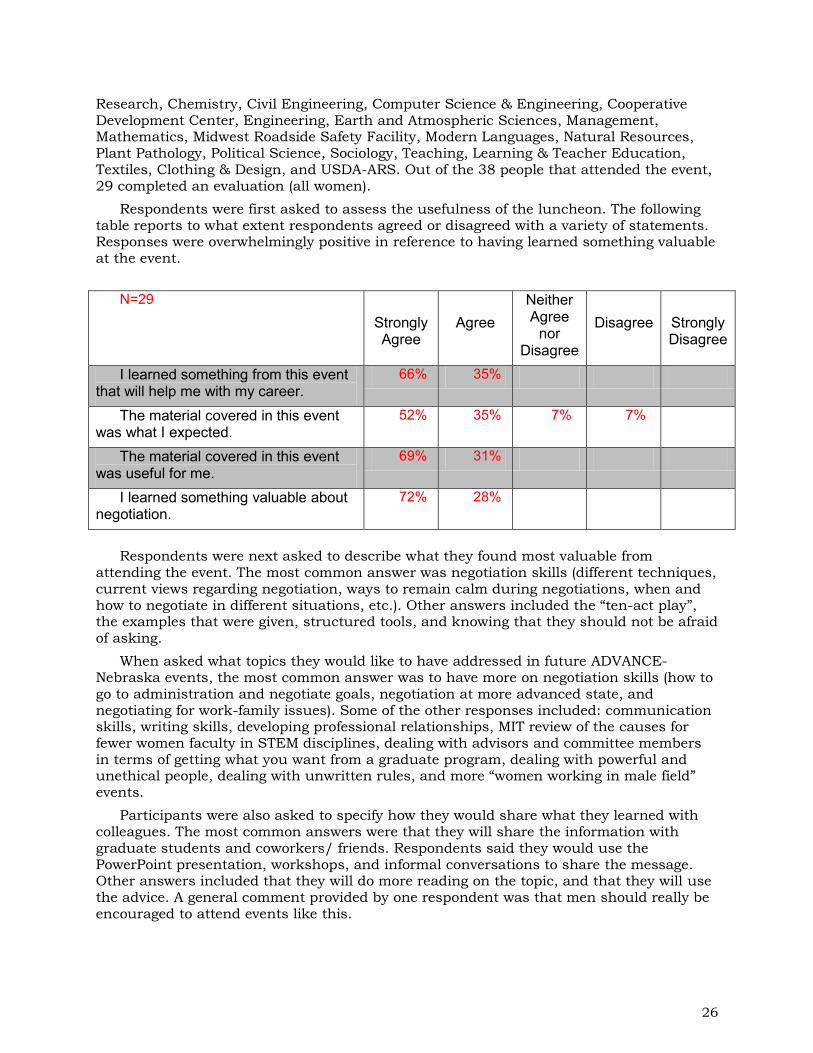
Research, Chemistry, Civil Engineering, Computer Science & Engineering, Cooperative Development Center, Engineering, Earth and Atmospheric Sciences, Management, Mathematics, Midwest Roadside Safety Facility, Modern Languages, Natural Resources, Plant Pathology, Political Science, Sociology, Teaching, Learning & Teacher Education, Textiles, Clothing & Design, and USDA-ARS. Out of the 38 people that attended the event, 29 completed an evaluation (all women).
Respondents were first asked to assess the usefulness of the luncheon. The following table reports to what extent respondents agreed or disagreed with a variety of statements. Responses were overwhelmingly positive in reference to having learned something valuable at the event.
N=29
Strongly Agree
Agree Neither Agree
nor Disagree
Disagree
Strongly Disagree
I learned something from this event that will help me with my career.
66% 35%
The material covered in this event was what I expected.
52% 35% 7% 7%
The material covered in this event was useful for me.
69% 31%
I learned something valuable about negotiation.
72% 28%
Respondents were next asked to describe what they found most valuable from
attending the event. The most common answer was negotiation skills (different techniques, current views regarding negotiation, ways to remain calm during negotiations, when and how to negotiate in different situations, etc.). Other answers included the “ten-act play”, the examples that were given, structured tools, and knowing that they should not be afraid of asking.
When asked what topics they would like to have addressed in future ADVANCE-Nebraska events, the most common answer was to have more on negotiation skills (how to go to administration and negotiate goals, negotiation at more advanced state, and negotiating for work-family issues). Some of the other responses included: communication skills, writing skills, developing professional relationships, MIT review of the causes for fewer women faculty in STEM disciplines, dealing with advisors and committee members in terms of getting what you want from a graduate program, dealing with powerful and unethical people, dealing with unwritten rules, and more “women working in male field” events.
Participants were also asked to specify how they would share what they learned with colleagues. The most common answers were that they will share the information with graduate students and coworkers/ friends. Respondents said they would use the PowerPoint presentation, workshops, and informal conversations to share the message. Other answers included that they will do more reading on the topic, and that they will use the advice. A general comment provided by one respondent was that men should really be encouraged to attend events like this.
26

iv. Mutual Mentoring by Dr. Sorcinelli Seventeen people of various ranks (Full professor, Associate professor, Assistant
professor, lecturer and staff) attended the Mutual Mentoring event offered by Mary Deanne Sorcinelli on March 7, 2012.
Participants represented the following departments: Animal Science, Architectural Engineering, Biochemistry, Biological Systems Engineering, Chemistry, ISU/UNL Cooperative Veterinary Medicine Education Program, Mathematics, School of Biological Sciences, Sociology, and Women & Gender Studies. Out of the 17 people that attended the event, 15 completed an evaluation (4 men and 11 women).
Respondents were first asked to assess the usefulness of the workshop. The following table reports to what extent respondents agreed or disagreed with a variety of statements. Responses were overwhelmingly positive in reference to having learned something valuable at the event.
N=15 Strongly
Agree Agree Neither
Agree nor
Disagree
Disagree Strongly Disagree
I learned something from this event that will help me with my career.
47% 53%
The material covered in this event was what I expected.
60% 27% 13%
The material covered in this event was useful for me.
47% 53%
I learned something valuable about mentoring.
60% 40%
Respondents were next asked to describe what they found most valuable from attending the event. The most common answers were: learning about unique ways of mentoring, participating in the open discussion (hearing the experiences and thoughts of others), information about funding opportunities, and discussion of a university-level mentoring program. Additional answers included: the importance of mentoring, the parallels between mentoring and networking, mentoring as career-building, problem solving or being proactive in mentorship, and thinking about people outside of UNL who could serve as teaching mentors.
When asked what topics they would like to have addressed in future ADVANCE-Nebraska events, the most common answers revolved around mentoring (how an academic would mentor scientists not going into academia, info on developing mentor programs, mentoring graduate students, addressing specific mentoring issues associated with work-life balance for women, and training department heads and full professors on how to mentor). Three respondents indicated they would like the topic of work-life balance addressed. Other answers included: development of associate professors, jump-starting a stalled research program, a workshop of resources for UNL faculty, career advancement, writing skills, improving promotion and tenure practices, how to motivate students, a full workshop on negotiation, and male versus female salaries.
27

Participants were also asked to specify how they would share what they learned with colleagues. The most common answer was that they will share with a specific group or committee (e.g. department head & faculty meeting, Chancellor's Commission on the Status of Women, and Teaching Mentoring group). Other respondents said that they will share information informally with colleagues and graduate students. Additional answers included: will work with faculty and department head to implement the programs, will set up off-campus lunches with women Engineering faculty, and will approach "new pre-tenure faculty about developing a professional development plan using start-up funds."
C. E-NEWS AND WEBSITE
Faculty and external constituents receive a weekly e-newsletter with information on current research and opportunities related to the advancement of STEM women. The ADVANCE-Nebraska website is updated with presentations, policy information, and other relevant documentation. The website averages about 58 visits per week, with an average of four minutes per visit. Forty percent of visits are direct traffic visitors, 38% are from referring sites, and 22% are from search engines. Information about ADVANCE-Nebraska is also disseminated at ADVANCE events, in promotional materials (e.g., bookmark), and in Department and Search Committee visits. Post-event evaluations indicate that the majority of participants (at all types of events) have consistently learned about ADVANCE-Nebraska events from email announcements. Participants also reported learning something valuable about ADVANCE-Nebraska at the events.
3. FINDINGS FROM ACTIVITIES THAT PROMOTE GOALS 1 AND 2: ACTIVITIES THAT ADDRESS GOALS 1
AND 2: INCREASE HIRING AND IMPROVE RETENTION OF WOMEN STEM FACULTY
A. DATA BREAKFAST WITH STEM CHAIRS
A Data Discussion breakfast was held on January 20th with twenty-one people of primarily chair rank attended this event. Participants represented the following departments: ADVANCE office, Animal Science, Agronomy & Horticulture, Biochemistry, Biological Sciences, Chemistry, Civil Engineering, Computer Science, Geosciences, Electrical Engineering, Engineering, Entomology, Food Science & Technology, IANR, Mathematics, Natural Resources, and Physics & Astronomy. Out of the 21 people that attended the event, 11 completed an evaluation (8 men, 2 women and 1 of undisclosed gender).
Respondents were first asked to assess the usefulness of the workshop. The following table reports to what extent respondents agreed or disagreed with a variety of statements. Responses were generally positive in reference to having learned something valuable at the event.
N=11
Strongly Agree
Agree Neither Agree
nor Disagree
Disagree
Strongly Disagree
I learned something from this event that will help me with my career.
18% 64% 18%
The material covered in this event was what I expected.
18% 64% 18%
The material covered in this event was 55% 46%
28

useful for me. I learned something valuable about department, campus and national women faculty recruitment and retention trends.
73% 18% 9%
Respondents were next asked to describe what they found most valuable from
attending the event. The most common answer was the data presented (CIC comparison, overall national data trends, and department data). Other answers included: the speaker’s (Dr. Geraldine Richmond) presentation, information on how comparison data are collected, interacting with other STEM chairs, issues dealing with hiring, recruiting, and retention of women as minorities, the opportunity to give feedback on challenges experienced, and the knowledge that chairs and women faculty often hold very different perceptions.
When asked what topics they would like to have addressed in future ADVANCE-Nebraska events, responses included: factors influencing success of applicants in the pool, how to close the gap between chairs and women faculty perceptions, issues related to specific disciplines, more specific issues related to UNL, and a discussion of how the mentoring needs of female and male faculty differ.
Participants were also asked to specify how they would share what they learned with colleagues. The most common answer was that they will share data at a faculty meeting. Other answers provided were that they will share data with the chair and will discuss with their executive committee.
In addition, a promising anecdotal finding was discovered in one of the STEM Departments. Following the data breakfast with department chairs, Earth and Atmospheric Sciences began a Nominations and Fellowships Committee to nominate colleagues for awards. Three faculty received awards/chairs at UNL this year as a result.
B. ADVANCE FACULTY COMMITTEE
Draft of the Best Practices Faculty Recruitment, Development, and Retention document (Appendix VI.G.)
C. ADVANCE TOOLKIT: UNL DEMOGRAPHIC DATA FOR STEM DEPARTMENTS
At UNL, the representation of STEM women faculty is slowly improving, but still lags the national pool. This improvement is due in part to an increase in the number of women in applicant pools and in the successful placement of dual career partners. Perceptions of climate vary among STEM faculty men and women of different ranks, with men generally reporting more satisfaction.
The impact of ADVANCE-Nebraska and other institutional efforts on recruitment is assessed by examining changes in the representation of women in UNL STEM departments and their applicant pools. In addition, UNL data are compared to national rates of PhDs awarded to women and to tenured and tenure-track faculty at peer institutions.
1. UNL Data
i. Applicant Pools
The proportion of women in UNL STEM faculty applicant pools has increased by 71% from 2007 to 2011. Figure 2 shows the proportion of women in UNL STEM faculty
applicant pools for the 22 departments that filled an assistant professor position between 2005 and 2011. Searches that remain open or that were closed are not included because
29

the applicant pools might still be changing, or the search may have ended before all potential applicants applied. Faculty searches above the assistant professor level and those for non-tenure faculty are also excluded. The change in the proportion of women in the assistant professor applicant pool increased positively from 2005 to 2011 by approximately 1.4 percentage points each year.
Figure 2.
ii. Hiring Stages There is a greater proportion of women at the short list and hired stages than in the
applicant pool, suggesting that an increase in the proportion of women in the applicant pool will result in an increased number of women hired at UNL. Figure 3 shows the proportion of women in each phase of the hiring process among filled assistant professor searches between 2006 and 2011. The proportion of women on the short list is much higher than that of the applicant pool. While the increase is less extreme, the proportion of women hired is greater than that of the applicant pool as well. Since ADVANCE-Nebraska began in September 2008, there have been increases in the proportion of women in the applicant pool, on the short list, and of faculty ultimately hired. There is a greater than 60% increase in the proportion of women hired by year three of ADVANCE-Nebraska when compared to pre-ADVANCE-Nebraska data; in 2007, 19% of UNL STEM hires were women, compared with 31% in 2011.
0.00
0.05
0.10
0.15
0.20
0.25
0.30
2005-0611 Searches
2006-0715 Searches
2007-0816 Searches
2008-0916 Searches
2009-1013 Searches
2010-114 Searches
Pre-ADVANCE Post-ADVANCE
Proportion of Women in Applicant Pools Filled Assistant Professor Positions
All UNL STEM Departments
%
30

Figure 3.
iii. UNL STEM Tenure & Tenure-Track Faculty Over Time As suggested by Figure 3, increases in the proportion of women in the applicant pool
ultimately result in increases in the number of tenured and tenure-track women faculty; however, change in the proportion of current faculty takes time. Figure 4 shows that the proportion of UNL STEM tenured and tenure-track women in all 26 STEM departments increased from 2005 to 2011, but it is a small increase.
Figure 4.
2. Peer Comparison Data In 2011, UNL joined the Committee on Institutional Cooperation (CIC), which includes
12 universities (most are also associated with the Big 10 conference). Data were gathered from these institutions to serve as peer comparison data for tenure and tenure-track
15%
23%
14% 17%
21%
36%
18%
24%
0%
10%
20%
30%
40%
applicants short list declined eitherinterview or offer
hired
Proportion of Women in Hiring Stages - Filled Assistant Professor Positions - All UNL STEM
Departments
Pre-ADVANCE (2006/07-2007/08) Post-ADVANCE (2008/09-2010/11)
31

faculty representation. The proportion of women receiving PhDs, as reported by NSF, is used for national comparison data.
i. National PhD Comparisons Figure 6 compares the average proportion of women applicants in UNL STEM searches
from 2009-2011 to the national percentage of women receiving PhD’s in 2002, 2005, and 2008 (National Science Foundation, NSF, data). The most recent PhD data are not used because of the tendency for graduate students to spend several years in post-doctoral positions. To ensure appropriate comparisons, the PhD rates only include the disciplines included in the searches for those years. UNL STEM applicant pools are well below national rates of PhD’s awarded to women in corresponding disciplines; however, this varies greatly by discipline as shown in appendix B.
Figure 5.
ii. CIC Peer Comparisons by Rank Figure 6 compares the proportion of tenured and tenure-track women in 16 UNL STEM
departments in 2009-10 and the average of their CIC comparison departments (Northwestern and University of Chicago were excluded). To ensure confidentiality, only UNL departments with similar departments in three or more CIC institutions were included. Overall, UNL has a larger proportion of women at the assistant professor level, but the representation of women overall in UNL STEM departments lags behind that of other CIC institutions (15% vs. 19%). Again, this varies by discipline as well.
Figure 6.
32
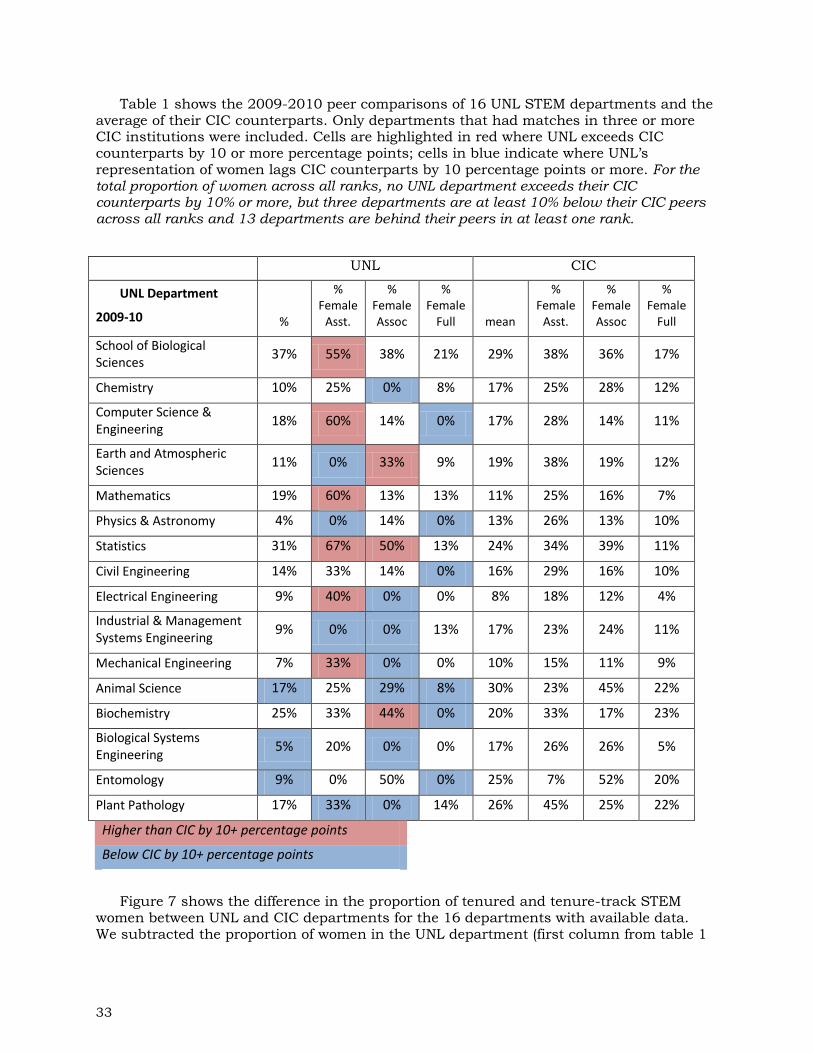
Table 1 shows the 2009-2010 peer comparisons of 16 UNL STEM departments and the average of their CIC counterparts. Only departments that had matches in three or more CIC institutions were included. Cells are highlighted in red where UNL exceeds CIC counterparts by 10 or more percentage points; cells in blue indicate where UNL’s representation of women lags CIC counterparts by 10 percentage points or more. For the total proportion of women across all ranks, no UNL department exceeds their CIC counterparts by 10% or more, but three departments are at least 10% below their CIC peers across all ranks and 13 departments are behind their peers in at least one rank.
UNL CIC
UNL Department
2009-10 %
% Female
Asst.
% Female Assoc
% Female
Full mean
% Female
Asst.
% Female Assoc
% Female
Full
School of Biological Sciences
37% 55% 38% 21% 29% 38% 36% 17%
Chemistry 10% 25% 0% 8% 17% 25% 28% 12%
Computer Science & Engineering
18% 60% 14% 0% 17% 28% 14% 11%
Earth and Atmospheric Sciences
11% 0% 33% 9% 19% 38% 19% 12%
Mathematics 19% 60% 13% 13% 11% 25% 16% 7%
Physics & Astronomy 4% 0% 14% 0% 13% 26% 13% 10%
Statistics 31% 67% 50% 13% 24% 34% 39% 11%
Civil Engineering 14% 33% 14% 0% 16% 29% 16% 10%
Electrical Engineering 9% 40% 0% 0% 8% 18% 12% 4%
Industrial & Management Systems Engineering
9% 0% 0% 13% 17% 23% 24% 11%
Mechanical Engineering 7% 33% 0% 0% 10% 15% 11% 9%
Animal Science 17% 25% 29% 8% 30% 23% 45% 22%
Biochemistry 25% 33% 44% 0% 20% 33% 17% 23%
Biological Systems Engineering
5% 20% 0% 0% 17% 26% 26% 5%
Entomology 9% 0% 50% 0% 25% 7% 52% 20%
Plant Pathology 17% 33% 0% 14% 26% 45% 25% 22%
Higher than CIC by 10+ percentage points
Below CIC by 10+ percentage points
Figure 7 shows the difference in the proportion of tenured and tenure-track STEM women between UNL and CIC departments for the 16 departments with available data. We subtracted the proportion of women in the UNL department (first column from table 1
33
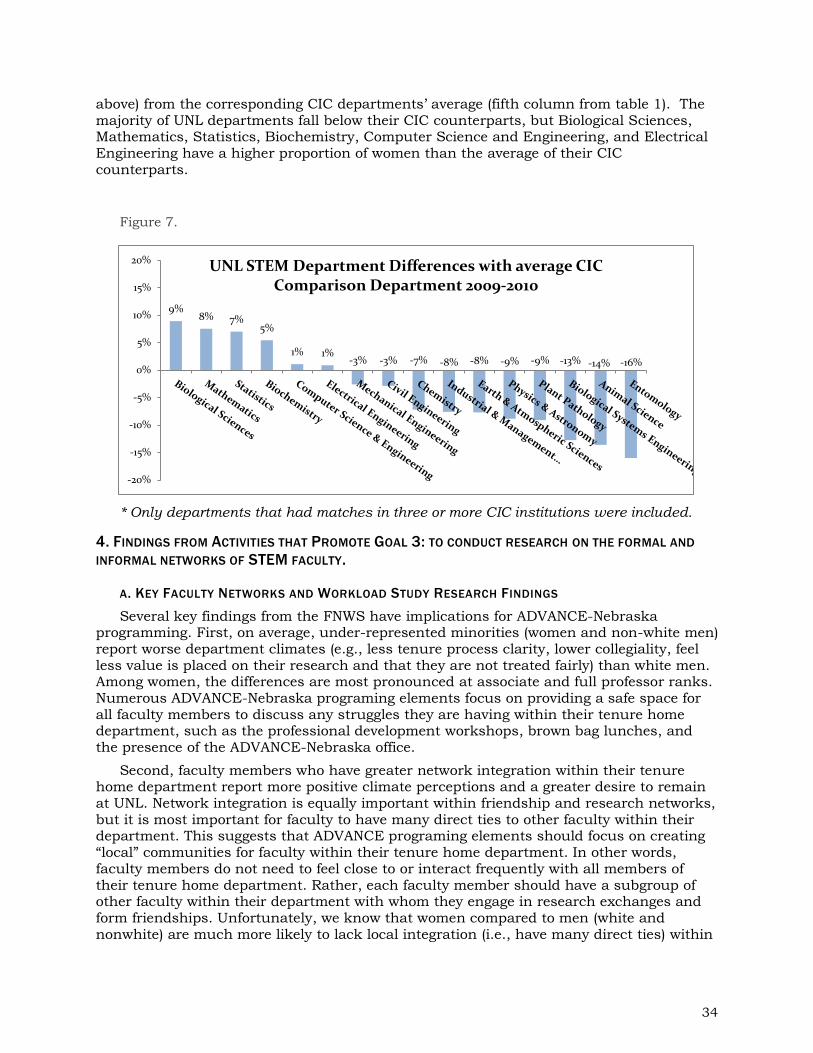
above) from the corresponding CIC departments’ average (fifth column from table 1). The majority of UNL departments fall below their CIC counterparts, but Biological Sciences, Mathematics, Statistics, Biochemistry, Computer Science and Engineering, and Electrical Engineering have a higher proportion of women than the average of their CIC counterparts.
Figure 7.
* Only departments that had matches in three or more CIC institutions were included.
4. FINDINGS FROM ACTIVITIES THAT PROMOTE GOAL 3: TO CONDUCT RESEARCH ON THE FORMAL AND
INFORMAL NETWORKS OF STEM FACULTY.
A. KEY FACULTY NETWORKS AND WORKLOAD STUDY RESEARCH FINDINGS
Several key findings from the FNWS have implications for ADVANCE-Nebraska programming. First, on average, under-represented minorities (women and non-white men) report worse department climates (e.g., less tenure process clarity, lower collegiality, feel less value is placed on their research and that they are not treated fairly) than white men. Among women, the differences are most pronounced at associate and full professor ranks. Numerous ADVANCE-Nebraska programing elements focus on providing a safe space for all faculty members to discuss any struggles they are having within their tenure home department, such as the professional development workshops, brown bag lunches, and the presence of the ADVANCE-Nebraska office.
Second, faculty members who have greater network integration within their tenure home department report more positive climate perceptions and a greater desire to remain at UNL. Network integration is equally important within friendship and research networks, but it is most important for faculty to have many direct ties to other faculty within their department. This suggests that ADVANCE programing elements should focus on creating “local” communities for faculty within their tenure home department. In other words, faculty members do not need to feel close to or interact frequently with all members of their tenure home department. Rather, each faculty member should have a subgroup of other faculty within their department with whom they engage in research exchanges and form friendships. Unfortunately, we know that women compared to men (white and nonwhite) are much more likely to lack local integration (i.e., have many direct ties) within
9% 8% 7%
5%
1% 1% -3% -3% -7% -8% -8% -9% -9% -13% -14% -16%
-20%
-15%
-10%
-5%
0%
5%
10%
15%
20% UNL STEM Department Differences with average CIC Comparison Department 2009-2010
34

department friendship and research networks. This has serious implications for the continued retention of women at UNL in STEM.
Thus far, ADVANCE programming has primarily provided ways for faculty to connect with one another across departments. A future programing element will be to work with specific departments to develop ways to help chairs identify isolated faculty and devise plans to increase the network integration of all faculty within a department, whether through research or friendship connections.
A third major finding from a department-level analysis provides further evidence to support ADVANCE-Nebraska programing elements should target network integration. Specifically, we find that departments where faculty section off into subgroups within a department (i.e., many interactions are occurring among a subgroup of faculty members and fewer occurring with faculty outside of the subgroup) can lead to more positive climate perceptions and higher organizational commitment. Thus, faculty should be encouraged to find local tightknit grouping of research collaborators or support providers within their department. Department chairs can pay attention to whether or not each faculty member has a local “home” within their department. There is an important caveat, however, to this general recommendation. Specifically, the local clusters or subgroups of faculty cannot be segregated across gender and race. In other words, each local cluster should contain both represented (i.e., white men) and underrepresented faculty (i.e., women and nonwhite men) within the cluster.
The fourth major finding indicates that segregated departments have poor climate perceptions and low organizational commitment. Segregated departments have ties that remain along demographic lines. The graph below on the left shows a segregated department. Most of the network ties within the department occur among faculty with similar demographic characteristics. For example, if the blue dots represent men and the green dots represent women, then most ties are occurring between men or between women and very few ties occur across gender. In contrast, the graph below and to the right shows an integrated department, where there are numerous network ties across actors with different demographic attributes.
We find the following results pertaining to segregation and faculty outcomes: a) within
research exchange networks racial segregation is associated with worse department climates and lower organizational commitment; b) within friendship networks gender segregation is associated with worse department climates and lower organizational commitment; and, c) segregation across academic rank is not associated with climate or commitment. ADVANCE-Nebraska programming elements have been successful at increasing the number of underrepresented faculty in STEM. If, however, these underrepresented faculty end up in a departments with clear segregation of network connections across race or gender lines, then it is unlikely that these “new” faculty will be
Segregated Department
Integrated Department
35

satisfied or retained. Again, future ADVANCE-Nebraska programing elements will need to work with department chairs to ensure that local clustering with friendship or research networks does not segregate along race and gender lines.
B. KEY CLIMATE RESEARCH FINDINGS
i. Department Climate Figure 8 shows the mean scores for positive department climate for UNL STEM faculty
by gender and rank. Positive department climate is a scale created from five variables ranging from 1 to 5 (5=strong agreement), faculty were asked how strongly they agreed or disagreed with the following statements: a) “Faculty in my department are supportive,” b) “Faculty in my department enjoy working together” c) “Faculty in my department spend time getting to know one another,” d) “Faculty in my department are sometimes rude to one another,” e) “Tension among faculty in my department make it uncomfortable working here.” The latter two variables were reverse coded. The scale on positive department climate has a good reliability as indicated by a chronbach’s alpha of .86, with all variables loading onto one latent construct at above .7, explaining 64% of the variance in a single latent construct.
In general, satisfaction with department varies by both gender and rank: women are less satisfied at higher rank and men are more satisfied at full professor rank.
Figure 8.
ii. Clarity of the Tenure Process Figure 9 shows the mean scores for clarity of the tenure process for UNL STEM faculty
by rank and gender. Clarity of the tenure process is a scale comprising three variables. Faculty were asked on a scale of 1 to 6 (1=Very Unclear, 6=Very Clear) to what extent are each of the following aspects of tenure and promotion in your tenure home department clear or unclear; a) “The body of academic work considered,” b) “Academic work performance expectations (i.e., quantity and quality of the work, c) “The steps involved in the process.” The scale on clarity of the tenure process on department work/family balance climate has a very good reliability with a chronbach’s alpha of .90, and all of the factor loadings above .7, explaining 84% of the variance in a single latent construct.
Associate professors (both men and women) perceive the tenure process the least clear compared to assistant and full professors. The only notable gender difference is found
4.12
3.53
3.89
3.62
4.37
4.19
1.0 1.5 2.0 2.5 3.0 3.5 4.0 4.5 5.0
Full Men (N=202)
Full Women (N=15)
Associate Men (N=69)
Associate Women (N=26)
Assistant Men (N=71)
Assistant Women (N=31)
UNL Positive Department Climate by Rank and Gender 2011
36

among full professors, with women perceiving the tenure process as less clear. It is notable that faculty who most recently went through the tenure process, associate professors, find it the least clear.
Figure 9.
iii. Workload Fairness Figure 10 shows the mean scores for perception of workload fairness for UNL STEM
faculty by rank and gender. Workload fairness distribution comprises four variables that ask faculty to rank fairness from 1 to 5 (1=Very Unfair, 5=Very fair), within their tenure home department how fair is the following; a) “Rotation of service committee assignments,” b) “Evaluation of faculty performance,” c) “Distribution of faculty salaries,” d) “Distribution of department resources.” The fair resource distribution scale has good reliability with chronbach’s alpha of .85, with factor loadings at .7 or above, and 69% of the variance explained in a single latent construct.
A linear trend is found among women faculty, with assistant professors perceiving workload as the most fair, and full professors as the least fair. Full professor men perceive workload distribution to be the most fair compared to all other groups.
Figure 10.
4.89
4.53
4.27
4.28
4.56
4.58
1.0 1.5 2.0 2.5 3.0 3.5 4.0 4.5 5.0 5.5 6.0
Full Men (N=203)
Full Women (N=15)
Associate Men (N=69)
Associate Women (N=25)
Assistant Men (N=71)
Assistant Women (N=31)
UNL Clarity of Tenure Process by Rank and Gender 2011
4.50
3.56
3.91
3.71
4.35
4.26
1.0 1.5 2.0 2.5 3.0 3.5 4.0 4.5 5.0
Full Men (N=177)
Full Women (N=12)
Associate Men (N=54)
Associate Women (N=23)
Assistant Men (N=55)
Assistant Women (N=22)
UNL Workload Fairness by Rank and Gender 2011
37
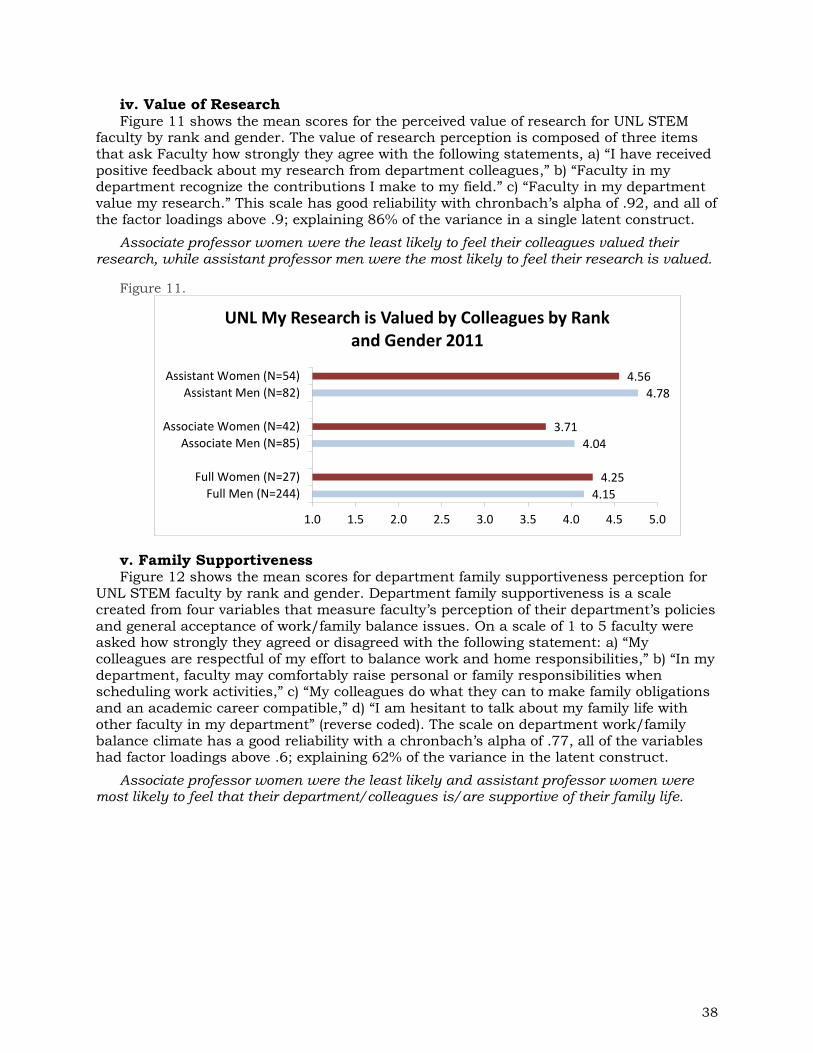
iv. Value of Research Figure 11 shows the mean scores for the perceived value of research for UNL STEM
faculty by rank and gender. The value of research perception is composed of three items that ask Faculty how strongly they agree with the following statements, a) “I have received positive feedback about my research from department colleagues,” b) “Faculty in my department recognize the contributions I make to my field.” c) “Faculty in my department value my research.” This scale has good reliability with chronbach’s alpha of .92, and all of the factor loadings above .9; explaining 86% of the variance in a single latent construct.
Associate professor women were the least likely to feel their colleagues valued their research, while assistant professor men were the most likely to feel their research is valued.
Figure 11.
v. Family Supportiveness Figure 12 shows the mean scores for department family supportiveness perception for
UNL STEM faculty by rank and gender. Department family supportiveness is a scale created from four variables that measure faculty’s perception of their department’s policies and general acceptance of work/family balance issues. On a scale of 1 to 5 faculty were asked how strongly they agreed or disagreed with the following statement: a) “My colleagues are respectful of my effort to balance work and home responsibilities,” b) “In my department, faculty may comfortably raise personal or family responsibilities when scheduling work activities,” c) “My colleagues do what they can to make family obligations and an academic career compatible,” d) “I am hesitant to talk about my family life with other faculty in my department” (reverse coded). The scale on department work/family balance climate has a good reliability with a chronbach’s alpha of .77, all of the variables had factor loadings above .6; explaining 62% of the variance in the latent construct.
Associate professor women were the least likely and assistant professor women were most likely to feel that their department/colleagues is/are supportive of their family life.
4.15
4.25
4.04
3.71
4.78
4.56
1.0 1.5 2.0 2.5 3.0 3.5 4.0 4.5 5.0
Full Men (N=244)
Full Women (N=27)
Associate Men (N=85)
Associate Women (N=42)
Assistant Men (N=82)
Assistant Women (N=54)
UNL My Research is Valued by Colleagues by Rank and Gender 2011
38

Figure 12.
vi. Desire to Stay Faculty ratings regarding their desire to stay at UNL are given in Figure 13. The Stay at
UNL scale comprises four variables that ask faculty to rank on a scale of 1 to 5 (5=strong agreement) how much they agree or disagree with the following statements; “I would be happy to spend the rest of my career in this department,” b) “It would take a lot to get me to leave this department,” c) “I have seriously considered leaving this department,” d) “If I could leave this department right now, I would. The latter two variables were reverse coded. The “stay at UNL” scale has a very good reliability with chronbach’s alpha of .9, with factor loadings at .8 or above, and 78% of the variance explained in a single latent construct.
Again, there is a linear trend among women faculty, with assistant professors being the most likely to plan to stay at UNL and full professor women to be the least likely. Associate professor men are less likely than other male faculty to want to stay.
Figure 13.
vii. Reasons to Leave UNL Figure 14 shows the response of UNL STEM men and women faculty to the question:
“To what extent, if at all, have you considered the following reasons to leave UNL…”. Results are the proportion of respondents who said they considered a reason for leaving either ‘to some extent’ or ‘to a great extent’. On average, men (in blue) were more likely than
3.74 3.76
3.57 3.32
3.71 3.88
1.0 1.5 2.0 2.5 3.0 3.5 4.0 4.5 5.0
Full Men (N=243)Full Women (N=27)
Associate Men (N=81)Associate Women (N=41)
Assistant Men (N=81)Assistant Women (N=53)
UNL Department Family Supportiveness by Rank and Gender 2011
4.29
3.25
3.78
3.59
4.53
4.18
1.0 1.5 2.0 2.5 3.0 3.5 4.0 4.5 5.0
Full Men (N=199)
Full Women (N=15)
Associate Men…
Associate…
Assistant Men…
Assistant Women…
Plan to Stay at UNL by Rank and Gender 2011
39

women (in red) to consider leaving UNL due to retirement, but women were more likely than men to consider leaving UNL to find a more supportive work environment, to increase time for research, to move closer to family, or to improve a partner’s employment and work family balance.
Figure 14.
In general, all of these scales are highly correlated. Faculty who view their department positively, who feel the tenure process is clear and who feel their colleagues value their research and their efforts at balancing work/life obligations, are more likely to want to stay at UNL. In summary, the climate data suggest senior women faculty are the least satisfied. Focus groups with associate and full professor women are planned for fall 2012 to investigate this phenomenon further.
5. FINDINGS FROM ADDITIONAL ACTIVITIES
PROGRESS TOWARDS INSTITUTIONALIZATION
Several useful initiatives evolved from institutionalization discussions among the external evaluator Ann Austin and the ADVANCE leaders (e.g. Ellen Weissinger, Evelyn Jacobson, Nancy Busch, the IAB, the EAB, co-PIs). For example, the ADVANCE Faculty Committee has created a comprehensive “Best Practices” document to guide departments on hiring and mentoring faculty as well as running departments in a way that facilitates excellence through diversity. In addition, the Senior Vice Chancellor has created a new position in her office – an Associate Vice Chancellor for Faculty – to continue to make ADVANCE efforts part of everyday UNL practices.For examples of the kind of programming
50%
39%
46%
46%
28%
45%
48%
18%
48%
32%
49%
53%
50%
50%
25%
63%
65%
19%
51%
16%
0% 10% 20% 30% 40% 50% 60% 70%
Different Area of Country
Work Family Balance
Partner's Job
Move Closer to Family
Non-Academic Job
Increase Reaserch Time
More Supportive Work Environment
Improve Tenure/Promotion Prospects
Increase Salary
Retire
UNL STEM Response: "To what extent, if at all, have you considered the following reasons to leave UNL" by Gender
Female Male
40

that should continue for faculty development, please see Appendix VI.A., ADVANCE-Nebraska Programmatic Activities & Outcomes.
C. OPPORTUNITIES FOR TRAINING AND DEVELOPMENT PROVIDED BY PROJECT
Six professional development opportunities were available to faculty during the last year that covered a range of topics including recruiting, tenure, promotion, mentorship, negotiations, data interpretation, and leadership.
Dr. Patricia Hill was added as a Post-Doc on the project. She attended a writing retreat and presented at a conference. She has gained experience in manuscript writing, grant proposal writing, data analysis, and report writing. Dr. Hill submitted two grant proposals and was successfully awarded a grant from the Elsevier Foundation. Her assigned mentor is Dr. Nancy Busch and she receives further mentoring from project personnel Julia McQuillan, Mindy Anderson-Knott, and Mary Anne Holmes.
Megumi Watanabe is the graduate research assistant on the project and has gained numerous skills working on ADVANCE: data management and analysis, social network methods, writing research manuscripts for peer reviewed journals, questionnaire development, tracking of survey response, and analysis of survey non-response.
Dr. Christina Falci developed and is currently teaching a semester-long graduate level course on social network analysis, emphasizing its theoretical, methodological, and substantive foundations. Nine students are taking the seminar from five different departments across the university. Also, three faculty members at UNL, who are interested in using social network analysis in their own research, attend the class on a regular basis.
D. OUTREACH ACTIVITIES PROJECT HAS UNDERTAKEN.
Dr. Julia McQuillan, co-PI, co-organized and attended the GENDER, SCIENCE, and ORGANIZATIONS WRITING WORKSHOPs at the American Sociological Association Meeting in Las Vegas in August 2011 on the day before the Sociologists for Women in Society meeting in St. Petersburg in February, 2012. She is also working with Laura Kramer and Kathrin Zippel on organizing another workshop in August, 2012 the day before the American Sociological Association meeting. These workshops focus on current projects, writing proposals, and possible collaborative projects related to research associated with NSF-funded ADVANCE projects.
Dr. Mary Anne Holmes, co-PI and program Director, and the chair of the ADVANCE Faculty Committee, Dr. Concetta DiRusso (professor of Biochemistry) were invited to speak at the UNL Faculty Senate on January 10, 2012 to disseminate information about ADVANCE-Nebraska’s goals and accomplishments. This invitation arose from a Senator joining the ADVANCE Faculty Committee, Dr. Sheila Seaman, professor of Animal Science. Holmes provided some statistics on STEM women and explained how ADVANCE-Nebraska addresses dual career issues and professional development for STEM faculty. DiRusso discussed the work of the Committee, its development of the Best Practices document, and workshops it conducts to address implicit bias.
Holmes and McQuillan were invited by the chair of the History Department in the College of Arts & Sciences to lead a discussion with their search committee on best practices for achieving a diverse applicant pool and reducing the impact of implicit bias when evaluating applications. The chair of the search committee attended Joyce Yen’s presentation and encouraged the department chair to engage us. As of this writing, the final candidate is not yet selected, but the department chair, Will Thomas, has told us that the applicant pool was much larger and broader than that of their last search and had
41

many excellent candidates. Approximately 12 faculty of a total of 29 in the department attended our presentation.
Holmes informally advised members of the ADVANCE-IT proposal-writing teams for the Missouri University of Science and Technology and for Auburn University as they wrote their proposals for the Round 6 submission (Dr. Franca Oboh and Dr. Donna Sollie, respectively). She agreed to serve on their External Advisory Boards if the projects were funded, and/or follow up on ways to improve proposals for re-submission if they were not.
Mindy Anderson-Knott helped the University of South Florida with their data management plan for a proposal they submitted for an IT grant.
Holmes served as a panelist on the ADVANCE IT proposal review panel in January, 2012. In addition, Holmes served as a panel moderator for the Convening of Global Experts on Rethinking the Future of the STEM Workplace, co-sponsored by the Association for Women in Science (AWIS) and the Elsevier Foundation. Holmes presented on the Writing Retreat for the Big 10 (CIC) that was funded by Elsevier’s New Scholars Program, as well as moderated a panel on work-life issues.
Holmes served on the proposal review panel for the North Dakota State University’s ADVANCE-IT program, for their Climate and Gender Equity Research Grant program.
Holmes and Committee member Melanie Simpson serve as liaisons for ADVANCE to the Chancellor’s Commission on the Status of Women (CCSW). Simpson is the chair of the Faculty Subcommittee of the CCSW. Information is disseminated in both directions at monthly meetings of the Faculty Subcommittee and monthly meetings of the full Commission. In addition, Holmes serves as liaison for ADVANCE to the system President’s Gender Equity Commission.
SECTION IV. PUBLICATIONS AND PRODUCTS
A. JOURNAL PUBLICATIONS
Holmes, M.A., 2011. Dual Career Faculty Appointments: a successful model from ADVANCE-Nebraska. American Geophysical Union Fall Meetings, San Francisco, CA, December 2011.
Holmes, M.A., J. McQuillan, J., Hochstein, J., N. Busch, M. Anderson-Knott, C. Falci and E. Jacobsen, 2011. Dual Career Faculty Appointments: a successful model from ADVANCE-Nebraska. ADVANCE PI Meeting, Alexandria, VA. November, 2011.
Watanabe, Megumi and Christina Falci, 2012. “Data Collection Process and Analysis of Nonresponse: Faculty Network and Workload Study (2011)”. Report of wave two survey nonresponse, ADVANCE-Nebraska Program, University of Nebraska-Lincoln, January 2012.
B. BOOKS AND OTHER ONE-TIME PUBLICATIONS
None this year.
C. INTERNET DISSEMINATION
Our website, advance.unl.edu, is continually updated with information on upcoming programming events, program recordings or materials disseminated (when permission is
42

granted), copies of our E-News, and other items of interest to the ADVANCE and wider UNL community. This year the website was changed to a new server and content management system with a university system-wide change.
As discussed in “Activities”, above, we continue to disseminate information on new studies relating to women in STEM via E-News. At least a dozen different people on campus, and about half a dozen off campus, send us articles that they would like to see featured in E-News. E-News is released weekly by the program manager, Jill Hochstein. We migrated to the new UNL CMS system this year, which eases updating of files across the website.
D. OTHER SPECIFIC PRODUCTS
The ADVANCE Faculty Committee’s one-page Best Practices for Recruitment and Retention continues to be disseminated by the UNL Office of Equity, Access and Diversity, the office that oversees all searches at UNL. A pdf copy of the Best Practices is available online at our website.
SECTION V. CONTRIBUTIONS
A. CONTRIBUTIONS WITHIN DISCIPLINE
Julia McQuillan and Trish Wonch-Hill presented at the Eastern Sociological Society on February 25, 2012. Their talk was entitled “Academic Rank & Faculty Perceptions: Is Higher Better For White Men Only?” Dr. McQuillan was an invited speaker for the panel. This panel on gender, race and academic STEM departments was part of a “Mini-conference” on Women in STEM. Their talk helped to push Sociologists to think beyond factors that influence hiring members of underrepresented groups and to think about the experiences once in the academy. In addition, their work advanced prior qualitative studies that show that women full professors are less satisfied by showing that the pattern is supported by a survey of the entire population. In addition, they showed the complexities of considering different underrepresented groups because minority men had patterns that were different from women (combined ethnicities because of small samples). Demonstrating that promotion does not guarantee an increase in satisfaction, we suggest the need to examine how academic workplaces are structure that “fit” the experiences of white men better than those from other gender/race groups.
Holmes presented a poster at the ADVANCE-PI meeting in Alexandria, VA and at the American Geophysical Union in San Francisco on the Dual Career program.
Holmes and DiRusso were interviewed by a reporter from the student newspaper, The Daily Nebraskan, on January 30, 2012. The article, titled UNL uses ADVANCE-Nebraska to attract more women to STEM fields, can be found here: http://www.dailynebraskan.com/news/unl-uses-advance-nebraska-to-attract-more-women-to-stem-fields-1.2691816#.T0utTfVSm-1.
Watanabe, Kristen Olson and Christina Falci presented a paper at the Midwest Association for Public Opinion Research entitled “Social Isolation and Survey Nonresponse: An Empirical Evaluation Using Social Network Data” in November 2011. Watanabe also presented a paper entitled “Gender and Race Differences in STEM Faculty Job Satisfaction: The Role of Departmental Climate” at the American Sociological Association Annual Meeting.
Christina Falci and Megumi Watanabe presented two papers at the American Sociological Conference in August 2011. These talks were entitled “Gender and Race
43

Differences in STEM Faculty Job Satisfaction: The Role of Departmental Climate” and “Gender and Isolation in the Ivory Tower: Insights from Social Network Analysis of Science, Technology, Engineering and Math Departments.” Falci and Watanabe met several other ADVANCE scholars who are engaged in network research.
Megumi Watanabe, Kristen Olson and Christina Falci presented a paper at the Midwest Association for Public Opinion Research entitled “Social Isolation and Survey Nonresponse: An Empirical Evaluation Using Social Network Data” on November 15, 2011. In this research, we show that network size (measured by in-degree) is associated with nonresponse to the climate survey.
The self-report data of the FNWS presented at these conferences provide evidence of marginalization of faculty from underrepresented groups. These data reveal that there are more connections among white men compared to other groups, which provides confirmation of the subjective experiences of faculty. These findings suggest that there is a “white male” academy that is different from the academy that women experience and minority men experience. These findings also suggest avenues for change that could enhance the work-life experiences and connections of all faculty that should enhance retention and productivity.
The ADVANCE Faculty Committee’s one-page Best Practices for Recruitment and Retention continues to be disseminated by the UNL Office of Equity, Access and Diversity, the office that oversees all searches at UNL. A pdf copy of the Best Practices is available online at our website.
B. CONTRIBUTIONS TO OTHER DISCIPLINES
Sociology is not a target department in our project, but members of the Sociology department have been deeply involved in it. Through their involvement they have sought to translate some of the successes with women in STEM to women in Sociology.
A grant proposal was submitted to the American Sociological Association’s Funds for Advancing the Discipline awards (ASA FAD). The proposal was for a week-long retreat to facilitate individual and collaborative research on race and gender representation in Science, Technology, Engineering and Mathematics (STEM) fields. We are capitalizing on momentum generated by one-day writing retreats for Sociologists affiliated with NSF ADVANCE projects and addressing the need for multi-institution collaborative research to dramatically move research on the importance and persistent problem of slow progress in diversifying the STEM professorate. The proposal was submitted on December 15th, 2011 and was declined, but we will continue to pursue grants in order to facilitate and capitalize on the collaborations created by the one-day writing retreats, the GAIN writing retreats, and the UNL and Big 10 (Elsevier-funded) writing retreats.
The Sociologists on our NSF grant have been giving conference presentations and submitting articles to the field of Sociology with an emphasis on social networks and gender/race social inequality.
C. CONTRIBUTIONS TO HUMAN RESOURCE DEVELOPMENT
The ADVANCE Faculty Committee built upon their “Best Practices for Recruiting Faculty” document and this year created a draft of an overall “Best Practices” document for departments to enhance faculty recruitment, retention, and promotion. This document was a collective effort and has gone through several iterations. Currently the committee is vetting the “Best Practices” document with University leaders. Already the Equity, Access and Diversity director has provided feedback. The pertinent Vice Chancellors (for Research, Academic Affairs and the Institute of Agricultural and Natural Resources) are
44

scheduled for meetings with the Committee to discuss the document. The goal is to have this document disseminated to all department chairs, publically available on the University Web page, part of department chair development, and for use by the new Associate Vice Chancellor for Faculty.
The dual career process at UNL is integrated with the Human Resources processes. This has helped to improve documentation for faculty hiring in the software UNL uses, “People Admin” by adding questions on where applicants learned about the ad. Through the process of working with departments and department chairs on dual career hiring, we have been able to help departments see the importance of spousal/partner accommodation for enhancing the likelihood of hiring top candidates.
Finally, we see the writing retreats as a powerful addition to the tools available at the University for enhancing faculty success. Faculty members are the core human resource at a University. We have scheduled time on campus for teaching and for service related committees, but faculty members often struggle to protect their time to write journal articles, book chapters and grant proposals. The competing demands from service and teaching are often even greater for women. Therefore the writing retreats provide valuable dedicated time for writing. During the meal times the retreats also provide useful opportunities for faculty to share ideas on how to enhance publishing and career success. Finally, the article and grant writing expertise provide helpful information for making the most of writing time.
HIRING OF NEW ASSOCIATE VICE CHANCELLOR FOR ACADEMIC AFFAIRS
The Senior Vice Chancellor for Academic affairs created a new position in the Senior Vice Chancellor for Academic Affairs office “for faculty”. We consider this position as a great way to institutionalize ADVANCE efforts. We will now have a dedicated administrator who is focused on recruiting, retaining, and promoting faculty, enhancing Department chair skills, and maintaining a focus on the needs of all faculty for successful careers.
D. CONTRIBUTIONS TO RESOURCES FOR RESEARCH AND EDUCATION
The Vice Chancellor for Research and Economic Development has partnered with ADVANCE-Nebraska to hire a post-doctoral researcher, Patricia Wonch-Hill, to work with the evaluation, research, and leadership teams to craft publications to disseminate the work of ADVANCE-Nebraska. Dr. Wonch-Hill is being mentored by Dr. Nancy Busch of the ADVANCE leadership team and by Dr. McQuillan. She has written one successful grant proposal and is in the process of writing proposals for federal funding.
Megumi Watanabe is a doctoral graduate student of Dr. Christina Falci and is conducting research with Dr. Falci in Faculty Network and Workload Satisfaction. This collaboration has already led to several abstracts and one publication by Megumi.
The Writing Retreats offered by ADVANCE-Nebraska provide an opportunity for faculty to network and share information in an intense but informal manner on work-life balance, progressing ones academic career, discovering and using campus resources, and potentially developing future collaborations.
Dr. Christina Falci has developed and conducted a course on Network Analysis, SOCI 862, Advanced Research Methods. The goal of the course is for students to acquire a sufficient grasp of key network concepts; perform basic network analyses and graph visualization; and investigate the application of social network analysis in empirical research within sociology and related disciplines. There are twelve students enrolled.
In the fall of 2011 Dr. Julia McQuillan developed a seminar (SOC 902) in Social Psychology that focused on the persistence of social inequality. One third of the class
45

readings and sessions were dedicated to women in STEM fields. Another third were dedicated to social network processes that contribute to inclusion or exclusion of diverse workgroup members.
Dr. Mary Anne Holmes guest lectures in two Women’s and Gender Studies Courses, sharing ADVANCE research with undergraduates in WMNS 385, Women, Gender and Science, and with both graduate and undergraduate students in WMNS 485 - Feminist Theories, Feminists' Perspectives.
Dr. Holmes and Dr. McQuillan have also been involved in the “Gender and Science Matters” group of the Women and Gender Studies Program funded by the Arts & Sciences Dean’s office. This group is developing new courses, supporting speaker series, and is seeking a new hire for a joint appointed position for someone who studies gender and science.
E. CONTRIBUTIONS BEYOND SCIENCE AND ENGINEERING As discussed above in “III.D. Outreach Activities”, Holmes and McQuillan were invited
by the chair of the History Department in the College of Arts & Sciences to present to their search committee on best practices for achieving a diverse applicant pool and reducing the impact of implicit bias when evaluating applications. The chair of the search committee attended Joyce Yen’s presentation and encouraged the department chair to engage us. As of this writing, the final candidate is not yet selected, but the department chair, Will Thomas, has told us that the applicant pool was much larger and broader than that of their last search and had many excellent candidates. Approximately 12 faculty of a total of 29 in the department attended our presentation.
Members of the ADVANCE team have presented posters or oral presentations on the Dual Career program at the ADVANCE PI meetings, the Council of Colleges of Arts and Sciences, at two national geosciences conferences and at the Dual Career Conference. The provost from the University of Massachusetts-Amherst has requested information from us on the dual career program, to begin efforts at that institution to more formalize addressing dual career issues.
46

VI. APPENDICES
A. ADVANCE-NEBRASKA PROGRAMMATIC ACTIVITIES AND OUTCOMES, 2008-2011
47

ADVANCE-Nebraska Programmatic Activities and Outcomes, 2008-2011 ADVANCE-Nebraska Evaluation Team
PROGRAM GOALS
1. Increase the number of women STEM faculty.
2. Increase the retention of women STEM faculty and support their promotion into positions of professional leadership.
3. Conduct innovative research on what organizational structures
(networks) and relationships best support the academic success of women STEM faculty, and what factors contribute to the development of supportive networks.
48

Portrait of STEM Faculty at UNL At UNL, the representation of STEM women faculty is slowly improving, but still lags the national pool. This improvement is due in part to an increase in the number of women in applicant pools and in the successful placement of dual career partners. Perceptions of climate vary among STEM faculty men and women of different ranks, with men generally reporting more satisfaction. This report summarizes the representation of STEM women faculty at UNL over time, the strategies that have been implemented since ADVANCE-Nebraska was funded in 2008, what has been learned from the first three years of implementation, and offers recommendations.
UNL STEM Search Process Over Time The impact of ADVANCE-Nebraska and other institutional efforts on recruitment is assessed by examining changes in the representation of women in UNL STEM departments and their applicant pools. In addition, UNL data are compared to national rates of PhDs awarded to women and to tenured and tenure-track faculty at peer institutions.
Applicant Pools The proportion of women in UNL STEM faculty applicant pools has increased by 71% from 2007 to 2011. Figure 1 shows the proportion of women in UNL STEM faculty applicant pools for the 22 departments that filled an assistant professor position between 2005 and 2011. Searches that remain open or that were closed are not included because the applicant pools might still be changing, or the search may have ended before all potential applicants applied. Faculty searches above the assistant professor level and those for non-tenure faculty are also excluded. The change in the proportion of women in the assistant professor applicant pool increased positively from 2005 to 2011 by approximately 1.4 percentage points each year. Figure 1.
49

Hiring Stages There is a greater proportion of women at the short list and hired stages than in the applicant pool, suggesting that an increase in the proportion of women in the applicant pool will result in an increased number of women hired at UNL. Figure 2 shows the proportion of women in each phase of the hiring process among filled assistant professor searches between 2006 and 2011. The proportion of women on the short list is much higher than that of the applicant pool. While the increase is less extreme, the proportion of women hired is greater than that of the applicant pool as well. Since ADVANCE-Nebraska began in September 2008, there have been increases in the proportion of women in the applicant pool, on the short list, and of faculty ultimately hired. Over a 60% increase in the proportion of women hired is found when comparing the baseline year to year three of ADVANCE-Nebraska; in 2007, 19% of UNL STEM hires were women, compared with 31% in 2011. Figure 2.
0.00 0.05 0.10 0.15 0.20 0.25 0.30
2005-06 11 Searches
2006-07 15 Searches
2007-08 16 Searches
2008-09 16 Searches
2009-10 13 Searches
2010-11 4 Searches
Pre-ADVANCE Post-ADVANCE
Proportion of Women in Applicant Pools Filled Assistant Professor Positions
All UNL STEM Departments
%
15%
23%
14% 17%
21%
36%
18%
24%
0%
10%
20%
30%
40%
applicants short list declined either interview or offer
hired
Proportion of Women in Hiring Stages - Filled Assistant Professor Positions - All UNL STEM
Departments
Pre-ADVANCE (2006/07-2007/08) Post-ADVANCE (2008/09-2010/11)
50

UNL STEM Tenure & Tenure-Track Faculty Over Time As suggested by figure 2, increases in the proportion of women in the applicant pool ultimately result in increases in the number of tenured and tenure-track women faculty; however, change in the proportion of current faculty takes time. Figure 3 shows that the proportion of UNL STEM tenured and tenure-track women in all 26 STEM departments increased from 2005 to 2011, but it is a small increase. Figure 3.
Flux Charts Flux charts were created to graphically display changes in representation of women among UNL STEM faculty. Figures 4 and 5 show the number of UNL STEM women and men faculty by rank in 2006 and 2009. The figures also show attrition (arrows exiting the first column), promotions (diagonal arrows), and new hires (arrows entering the second column). Attrition rates between 2006 and 2009 show that women were leaving at higher rates at the full professor rank than men (20% vs. 14%), but at lower rates at associate (13% vs. 17%) and assistant (0% vs. 13%). A smaller proportion of women than men were promoted during this time, but the difference was greater for promotion to full (13% vs. 24%) than for promotion to associate (39% vs. 43%). No women (0%) were hired at the full professor rank, while 13 men were hired at this rank between 2006 and 2009. One of the twelve (8%) hires at the associate rank, only one was a woman. A much higher proportion of women
51

were hired at the assistant rank, with 19 (30%) women hired during this time period. Figure 4.
Figure 5.
52

Peer Comparison Data In 2011, UNL joined the Committee on Institutional Cooperation (CIC), which includes 12 universities (most are also associated with the Big 10 conference). Data were gathered from these institutions to serve as peer comparison data for tenure and tenure-track faculty representation. The proportion of women receiving PhDs, as reported by NSF, is used for national comparison data.
National PhD Comparisons Figure 6 compares the average proportion of women applicants in UNL STEM searches from 2009-2011 to the national percentage of women receiving PhD’s in 2002, 2005, and 2008 (National Science Foundation, NSF, data). The most recent PhD data are not used because of the tendency for graduate students to spend several years in post-doctoral positions. To ensure appropriate comparisons, the PhD rates only include the disciplines included in the searches for those years. UNL STEM applicant pools are well below national rates of PhD’s awarded to women in corresponding disciplines; however, this varies greatly by discipline as shown in appendix B. Figure 6.
CIC Peer Comparisons by Rank Figure 7 compares the proportion of tenured and tenure-track women in 16 UNL STEM departments in 2009-10 and the average of their CIC comparison departments (Northwestern and University of Chicago were excluded). To ensure confidentiality, only UNL departments with similar departments in three or more CIC institutions were included. Overall, UNL has a larger proportion of women at the assistant professor level, but the representation of women overall in UNL STEM departments lags behind that of other CIC institutions (15% vs. 19%). Again, this varies by discipline as well. Figure 7.
53
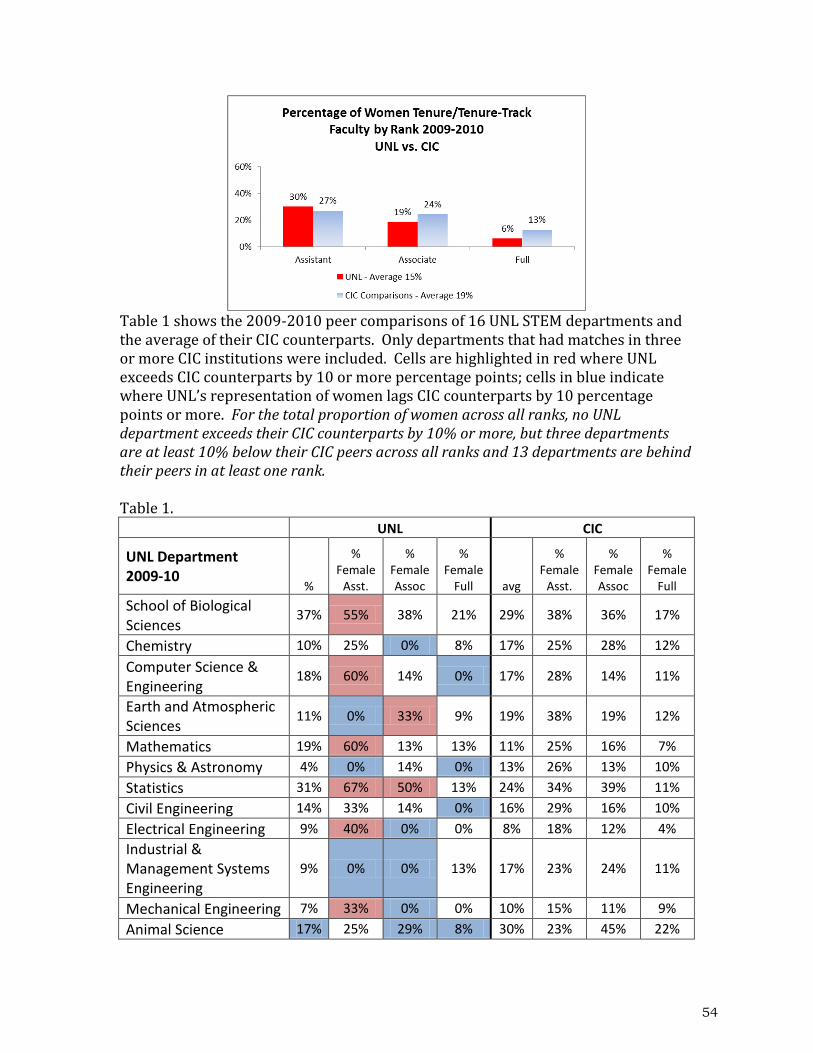
Table 1 shows the 2009-2010 peer comparisons of 16 UNL STEM departments and the average of their CIC counterparts. Only departments that had matches in three or more CIC institutions were included. Cells are highlighted in red where UNL exceeds CIC counterparts by 10 or more percentage points; cells in blue indicate where UNL’s representation of women lags CIC counterparts by 10 percentage points or more. For the total proportion of women across all ranks, no UNL department exceeds their CIC counterparts by 10% or more, but three departments are at least 10% below their CIC peers across all ranks and 13 departments are behind their peers in at least one rank. Table 1. UNL CIC
UNL Department 2009-10
%
% Female
Asst.
% Female Assoc
% Female
Full avg
% Female
Asst.
% Female Assoc
% Female
Full
School of Biological Sciences
37% 55% 38% 21% 29% 38% 36% 17%
Chemistry 10% 25% 0% 8% 17% 25% 28% 12%
Computer Science & Engineering
18% 60% 14% 0% 17% 28% 14% 11%
Earth and Atmospheric Sciences
11% 0% 33% 9% 19% 38% 19% 12%
Mathematics 19% 60% 13% 13% 11% 25% 16% 7%
Physics & Astronomy 4% 0% 14% 0% 13% 26% 13% 10%
Statistics 31% 67% 50% 13% 24% 34% 39% 11%
Civil Engineering 14% 33% 14% 0% 16% 29% 16% 10%
Electrical Engineering 9% 40% 0% 0% 8% 18% 12% 4% Industrial & Management Systems Engineering
9% 0% 0% 13% 17% 23% 24% 11%
Mechanical Engineering 7% 33% 0% 0% 10% 15% 11% 9%
Animal Science 17% 25% 29% 8% 30% 23% 45% 22%
54

Biochemistry 25% 33% 44% 0% 20% 33% 17% 23%
Biological Systems Engineering
5% 20% 0% 0% 17% 26% 26% 5%
Entomology 9% 0% 50% 0% 25% 7% 52% 20%
Plant Pathology 17% 33% 0% 14% 26% 45% 25% 22%
Higher than CIC by 10+ percentage points Below CIC by 10+ percentage points
Figure 8 shows the difference in the proportion of tenured and tenure-track STEM women between UNL and CIC departments for the 16 departments with available data. The majority of UNL departments fall below their CIC counterparts, but Biological Sciences, Mathematics, Statistics, Biochemistry, Computer Science and Engineering, and Electrical Engineering have a higher proportion of women than the average of their CIC counterparts.
Figure 8.
UNL Climate Data 2011
The survey for the Faculty Network and Workload Study (FNWS) was conducted by the Bureau of Sociological Research (BOSR) at the University of Nebraska-Lincoln in March 2011. The survey intended to measure faculty networks, climate perceptions, and faculty productivity. The study design for the FNWS consisted of a mixed mode survey: faculty had the option of filling out the survey on the web or via mail questionnaire. Overall, there was a 75.1% individual response rate. Response rates varied by department and college; four out of five colleges had response rates above 70%. The FNWS is a census drawn from the population of STEM and Social and Behavioral Science departments at the University of Nebraska Lincoln. Because this is not a random sample, tests of statistical significance are not necessary.
9% 8% 7%
5%
1% 1% -3% -3% -7% -8% -8% -9% -9% -13% -14% -16%
-20%
-15%
-10%
-5%
0%
5%
10%
15%
20% UNL STEM Department Differences with average CIC Comparison Department 2009-2010
55

Department Climate Figure 9 shows the mean scores for positive department climate for UNL STEM faculty by gender and rank. Positive department climate is a scale created out of five variables ranging from 1 to 5 (5=strong agreement), faculty were asked how strongly they agreed or disagreed with the following statements: a) “Faculty in my department are supportive,” b) “Faculty in my department enjoy working together” c) “Faculty in my department spend time getting to know one another,” d) “Faculty in my department are sometimes rude to one another,” e) “Tension among faculty in my department make it uncomfortable working here.” The latter two variables were reverse coded. The scale on positive department climate has a good reliability as indicated by a chronbach’s alpha of .86, with all variables loading onto one latent construct at above .7, explaining 64% of the variance in a single latent construct. In general, satisfaction with department varies by both gender and rank: women are less satisfied at higher rank and men are more satisfied at higher rank. Figure 9.
Clarity of the Tenure Process Figure 10 shows the mean scores for clarity of the tenure process for UNL STEM faculty by rank and gender. Clarity of the tenure process is a scale comprised of three variables. Faculty were asked on a scale of 1 to 6 (1=Very Unclear, 6=Very Clear) to what extent are each of the following aspects of tenure and promotion in your tenure home department clear or unclear; a) “The body of academic work considered,” b) “Academic work performance expectations (i.e., quantity and quality of the work, c) “The steps involved in the process.” The scale on clarity of the tenure process on department work/family balance climate has a very good reliability with a chronbach’s alpha of .90, and all of the factor loadings above .7, explaining 84% of the variance in a single latent construct. Associate professors (both men and women) perceive the tenure process the least clear compared to assistant and full professors. The only notable gender difference
4.12 3.53
3.89 3.62
4.37 4.19
1.0 1.5 2.0 2.5 3.0 3.5 4.0 4.5 5.0
Full Men (N=202) Full Women (N=15)
Associate Men (N=69) Associate Women (N=26)
Assistant Men (N=71) Assistant Women (N=31)
UNL Positive Department Climate by Rank and Gender 2011
56

is found among full professors, with women perceiving the tenure process as less clear. It is notable that faculty who most recently went through the tenure process find it the least clear. Figure 10.
Workload Fairness Figure 11 shows the mean scores for perception of workload fairness for UNL STEM faculty by rank and gender. Workload fairness distribution is comprised of four variables that ask faculty to rank fairness from 1 to 5 (1=Very Unfair, 5=Very fair), within their tenure home department how fair is the following; a) “Rotation of service committee assignments,” b) “Evaluation of faculty performance,” c) “Distribution of faculty salaries,” d) “Distribution of department resources.” The fair resource distribution scale has good reliability with chronbach’s alpha of .85, with factor loadings at .7 or above, and 69% of the variance explained in a single latent construct. A linear trend is found among women faculty, with assistant professors perceiving workload as the most fair, and full professors as the least fair. Full professor men perceive workload distribution to be the most fair compared to all other groups. Figure 11.
4.89 4.53
4.27 4.28
4.56 4.58
1.0 1.5 2.0 2.5 3.0 3.5 4.0 4.5 5.0 5.5 6.0
Full Men (N=203) Full Women (N=15)
Associate Men (N=69) Associate Women (N=25)
Assistant Men (N=71) Assistant Women (N=31)
UNL Clarity of Tenure Process by Rank and Gender 2011
57

Value of Research Figure 12 shows the mean scores for the perceived value of research for UNL STEM faculty by rank and gender. The value of research perception is comprised of three items that ask Faculty how strongly they agree with the following statements, a) “I have received positive feedback about my research from department colleagues,” b) “Faculty in my department recognize the contributions I make to my field.” c) “Faculty in my department value my research.” This scale has good reliability with chronbach’s alpha of .92, and all of the factor loadings above .9; explaining 86% of the variance in a single latent construct. Associate professor women were the least likely to feel their colleagues valued their research, while assistant professor men were the most likely to feel their research is valued. Figure 12.
4.50 3.56
3.91 3.71
4.35 4.26
1.0 1.5 2.0 2.5 3.0 3.5 4.0 4.5 5.0
Full Men (N=177) Full Women (N=12)
Associate Men (N=54) Associate Women (N=23)
Assistant Men (N=55) Assistant Women (N=22)
UNL Workload Fairness by Rank and Gender 2011
4.15 4.25
4.04 3.71
4.78 4.56
1.0 1.5 2.0 2.5 3.0 3.5 4.0 4.5 5.0
Full Men (N=244) Full Women (N=27)
Associate Men (N=85) Associate Women (N=42)
Assistant Men (N=82) Assistant Women (N=54)
UNL My Research is Valued by Colleagues by Rank and Gender 2011
58
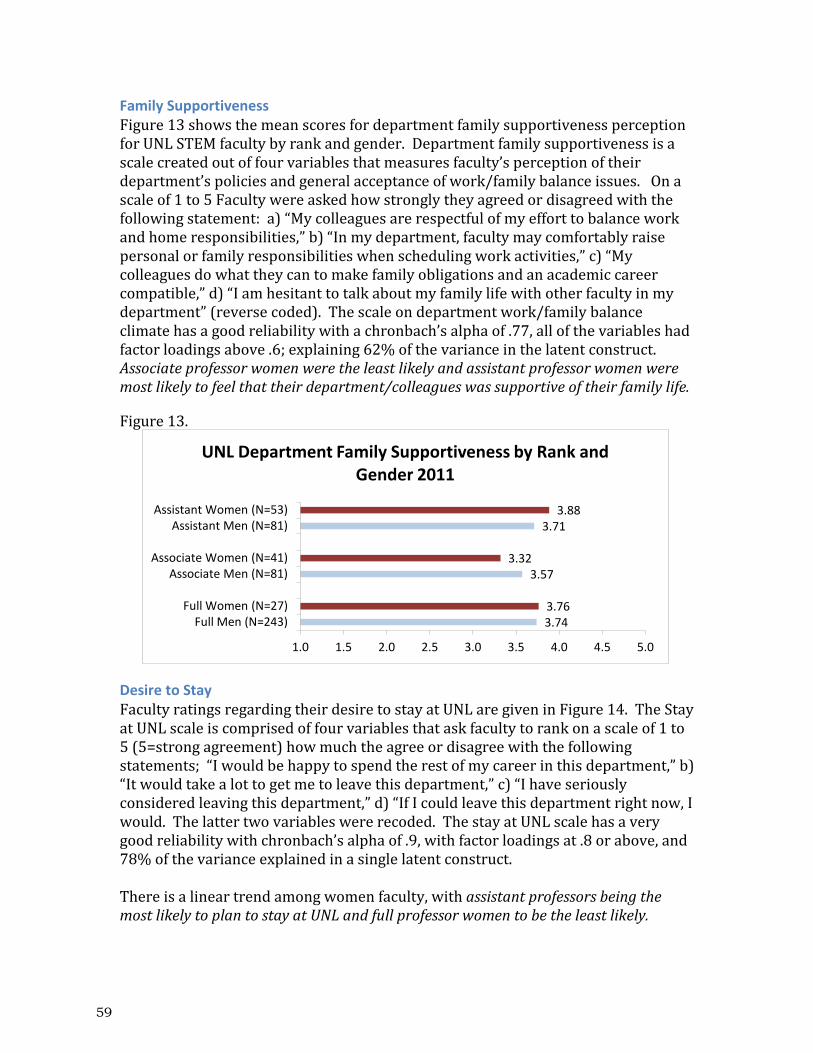
Family Supportiveness Figure 13 shows the mean scores for department family supportiveness perception for UNL STEM faculty by rank and gender. Department family supportiveness is a scale created out of four variables that measures faculty’s perception of their department’s policies and general acceptance of work/family balance issues. On a scale of 1 to 5 Faculty were asked how strongly they agreed or disagreed with the following statement: a) “My colleagues are respectful of my effort to balance work and home responsibilities,” b) “In my department, faculty may comfortably raise personal or family responsibilities when scheduling work activities,” c) “My colleagues do what they can to make family obligations and an academic career compatible,” d) “I am hesitant to talk about my family life with other faculty in my department” (reverse coded). The scale on department work/family balance climate has a good reliability with a chronbach’s alpha of .77, all of the variables had factor loadings above .6; explaining 62% of the variance in the latent construct. Associate professor women were the least likely and assistant professor women were most likely to feel that their department/colleagues was supportive of their family life. Figure 13.
Desire to Stay Faculty ratings regarding their desire to stay at UNL are given in Figure 14. The Stay at UNL scale is comprised of four variables that ask faculty to rank on a scale of 1 to 5 (5=strong agreement) how much the agree or disagree with the following statements; “I would be happy to spend the rest of my career in this department,” b) “It would take a lot to get me to leave this department,” c) “I have seriously considered leaving this department,” d) “If I could leave this department right now, I would. The latter two variables were recoded. The stay at UNL scale has a very good reliability with chronbach’s alpha of .9, with factor loadings at .8 or above, and 78% of the variance explained in a single latent construct. There is a linear trend among women faculty, with assistant professors being the most likely to plan to stay at UNL and full professor women to be the least likely.
3.74 3.76
3.57 3.32
3.71 3.88
1.0 1.5 2.0 2.5 3.0 3.5 4.0 4.5 5.0
Full Men (N=243) Full Women (N=27)
Associate Men (N=81) Associate Women (N=41)
Assistant Men (N=81) Assistant Women (N=53)
UNL Department Family Supportiveness by Rank and Gender 2011
59

Figure 14.
Reasons to Leave UNL Figure 15 shows the response of UNL STEM men and women faculty to the question: “To what extent, if at all, have you considered the following reasons to leave UNL…”. Results are the proportion of respondents who said they considered a reason for leaving either ‘to some extent’ or ‘to a great extent’. On average, men (in blue) were more likely than women (in red) to consider leaving UNL due to retirement, but women were more likely than men to consider leaving UNL to find a more supportive work environment, to increase time for research, to move closer to family, or to improve a partner’s employment and work family balance. Figure 15.
4.29
3.25
3.78
3.59
4.53
4.18
1.0 1.5 2.0 2.5 3.0 3.5 4.0 4.5 5.0
Full Men (N=199)
Full Women (N=15)
Associate Men …
Associate …
Assistant Men …
Assistant Women …
Plan to Stay at UNL by Rank and Gender 2011
60
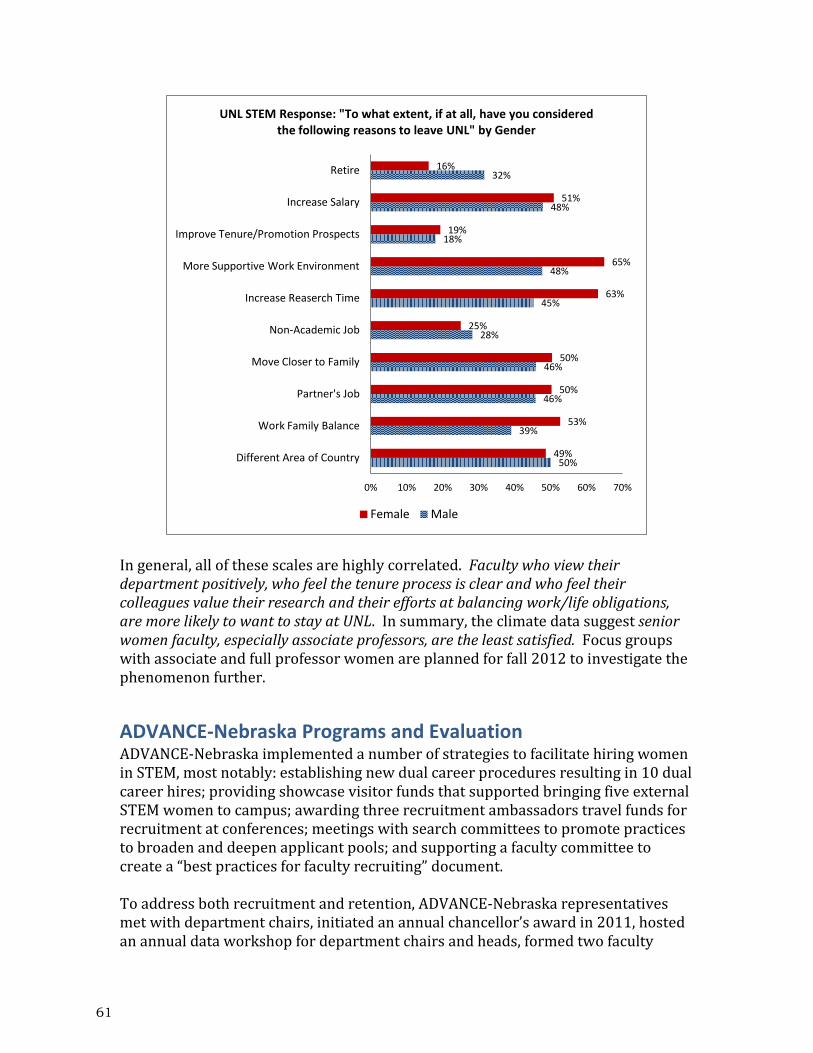
In general, all of these scales are highly correlated. Faculty who view their department positively, who feel the tenure process is clear and who feel their colleagues value their research and their efforts at balancing work/life obligations, are more likely to want to stay at UNL. In summary, the climate data suggest senior women faculty, especially associate professors, are the least satisfied. Focus groups with associate and full professor women are planned for fall 2012 to investigate the phenomenon further.
ADVANCE-Nebraska Programs and Evaluation ADVANCE-Nebraska implemented a number of strategies to facilitate hiring women in STEM, most notably: establishing new dual career procedures resulting in 10 dual career hires; providing showcase visitor funds that supported bringing five external STEM women to campus; awarding three recruitment ambassadors travel funds for recruitment at conferences; meetings with search committees to promote practices to broaden and deepen applicant pools; and supporting a faculty committee to create a “best practices for faculty recruiting” document. To address both recruitment and retention, ADVANCE-Nebraska representatives met with department chairs, initiated an annual chancellor’s award in 2011, hosted an annual data workshop for department chairs and heads, formed two faculty
50%
39%
46%
46%
28%
45%
48%
18%
48%
32%
49%
53%
50%
50%
25%
63%
65%
19%
51%
16%
0% 10% 20% 30% 40% 50% 60% 70%
Different Area of Country
Work Family Balance
Partner's Job
Move Closer to Family
Non-Academic Job
Increase Reaserch Time
More Supportive Work Environment
Improve Tenure/Promotion Prospects
Increase Salary
Retire
UNL STEM Response: "To what extent, if at all, have you considered the following reasons to leave UNL" by Gender
Female Male
61

committees (that later combined), and disseminated information on UNL’s excellent work-life balance policies through electronic newsletters, the website, and brochures. In addition, during the first three years, ADVANCE-Nebraska hosted 31 professional and leadership development events related to recruitment or retention of STEM women faculty at UNL, including a “Paths to Success” luncheon series, a group-mentoring Conversations series, professional development workshops, and writing retreats. On average at each event there were approximately 12 STEM faculty, 8 non-STEM faculty and 3 administrators, resulting in 161 individual STEM and 96 non-STEM faculty and administrators participating (for comparison purposes, there were 545 total STEM faculty in 2011/12). The third goal was addressed through the innovative network and climate study, which started in 2008 and has provided new insights regarding the importance of research and social connections for retaining STEM faculty. The results from this research are disseminated within the UNL community and beyond via professional conference presentations and publications.
Professional Development to Support Effective Recruitment ADVANCE-Nebraska offered seven recruitment events in years two and three open to STEM faculty, and one event for department chairs. Most STEM departments participated, with 20 of the 26 STEM departments having at least one attendee, 11 departments had 10% or more of their faculty attend at least one recruitment event, and six departments had over 20% (Chemistry, Earth and Atmospheric Sciences, Engineering Mechanics, Mechanical Engineering, Entomology and Plant Pathology). Fifty-four percent of STEM department chairs attended at least one recruitment event. Strong satisfaction was found among those who attended. Nearly all (98%) of those who attended year 3 recruitment-focused events agreed that the material covered was useful and 89% agreed that they learned something useful about the topic being covered.
“I almost did not attend today thinking this info would not pertain to me. I am glad I attended!” (Open-end quote from recruitment-focused event)
Response from the Recruit and Retain Series for department chairs in year two was also overwhelmingly positive, with 91% reporting that they learned information that will improve how their department searches for faculty. Most also reported liking the event structure, with 25% preferring shorter, more focused sessions on specific topics, and 16% preferring to read about research on faculty recruitment. The three presentations that were selected as the most useful from the Recruit and Retain Series were: “Regenerating the Faculty Workforce: Focusing on Pre-Tenure Faculty” by Cathy Trower (36%), the Cornell Interactive Theatre Ensemble (33%) and “What UNL Faculty Value Most About Working at UNL” by Julia McQuillan (25%). This suggests that external speakers and learning from UNL data are valued most by attendees. Participants also expressed interest in learning more about recruitment
62

from other avenues, with 93% reporting that learning about strategies of other departments would be helpful, and 80% think comparing UNL data to national PhD data is useful. Several significant differences in respondents’ likelihood to use recommended strategies for recruitment were found between pre/post surveys administered before and after the Recruit and Retain Series. Faculty who attended at least one Recruit and Retain Series event changed their intentions to be more likely to incorporate the following strategies: 1) Inviting showcase speakers, 2) Writing a broad job ad, 3) Contacting candidates directly, 4) Asking colleagues at other institutions to encourage students to apply, 5) Advertising on internet, 6) Advertising in outlets directed to women, and 7) Advertising in outlets directed to minorities. The largest change was for “increases in intentions to advertise in outlets directed to women and minorities” . According to a department and search committee chair survey, those who reported that they had not had any contact with the ADVANCE-Nebraska office or participated in ADVANCE-Nebraska activities had a strong positive relationship between dissatisfaction with the number of women in the applicant pool and the likelihood they would try a recommended recruitment strategy for future searches. This indicates that this survey may have been an intervention itself, providing strategies and solutions to department chairs and search committee chairs who were dissatisfied with the proportion of women in their applicant pools, and thus indicating a high likelihood of using the strategies indicated in the survey questions. Additionally, approximately 80% of search committee and department chairs reported learning about recommended recruitment strategies from colleagues, and those who reported learning from colleagues were significantly more likely to report that their search committee specifically discussed recruiting women in their most recent search. Combined, these findings indicate that there are several effective avenues for sharing information on recruitment strategies, including word of mouth from colleagues and surveying. In addition to formal events, ADVANCE-Nebraska offered professional development to support effective recruitment though other mechanisms, including showcase visitors, recruitment ambassadors, the distribution of a two page faculty search process best practices document, and informal meetings with department and search committee chairs. The informal meetings began in year three and have not yet been evaluated. Search committee chair focus group participants expressed the importance of bringing in potential candidates to showcase UNL. The demand for showcase visitor funding has been relatively low, but the impact of this strategy has been shown through the hiring of one of the visitors. Of the four showcase visitors funded by ADVANCE-Nebraska, one was hired in fall, 2011 (Biological Systems Engineering). This suggests that funding for this strategy may not be imperative (there are other
63

funding opportunities for guest speakers), but departments need to be encouraged to use their external speaker/colloquia budgets for recruitment. Similarly, there has been little demand for recruitment ambassador funding from ADVANCE-Nebraska. Focus group participants stressed the importance of always networking, and the majority of search committee and department chairs (62%) reported in a survey that they are talking to potential candidates at conferences. Moreover, surveys show departments that discussed how to recruit women were significantly more likely to plan to talk to candidates at conferences/meetings in future. This strategy appears to be valued more in non-STEM fields. While most STEM respondents (80%) from the Recruit and Retain Series pretest found talking to candidates at conferences somewhat useful, none (0%) found it very useful, compared to 42% of non-STEM faculty reporting it to be very useful. Again, this is a strategy that may not require additional funding, but needs to be emphasized as an effective strategy for recruiting a diverse and excellent applicant pool by faculty who attend conferences. The best practices document that was developed by the ADVANCE-Nebraska faculty committee is institutionalized and currently distributed to all search committee chairs by the Office of Equity, Access, and Diversity (EAD). The impact of this document will be evaluated in the summative evaluation.
Application and Effectiveness of ADVANCE-Nebraska Recruitment Strategies A number of specific recruitment strategies are recommended by ADVANCE-Nebraska through the various forms of professional development. The strategies are being used to various degrees, with different degrees of impact and perceived importance. The majority of search committee and department chairs surveyed are contacting potential candidates directly (81%), asking colleagues from other institutions to encourage students to apply (76%), talking to potential candidates at conferences (62%), advertising in prestigious journals (57%), advertising in discipline-specific journals (62%), advertising on internet sites (57%), and emailing listserves (52%). The following strategies were reported to be especially useful: advertising in discipline-specific journals or newsletters (61%), advertising on internet sites (44%), e-mailing listserves with the job ad (44%), and contacting potential candidates directly through letters, phone calls, emails, etc. (44%). Most departments are planning to incorporate many of the recommended strategies in their next search. Surveys show that the vast majority plan for their next search to: talk to potential candidates at conferences (100%), advertise on internet sites (95%), ask colleagues from other institutions to encourage students to apply (94%), email listserves (94%), contact potential candidates directly (90%), advertise in discipline-specific journals (90%), invite faculty who advise grad students as speakers (89%), invite potential candidates as showcase visitors (84%), and to write broad ads (75%).
64

Search committee and department chairs who used recommended strategies in their last search were significantly more likely to use the same methods again in their next search for the following activities: 1) Contacting individuals directly through letters, phone calls, emails, 2) Showcasing UNL by inviting Faculty who advise graduate students to campus as speakers, 3) Showcasing UNL by inviting potential candidates to campus as speakers. Thus, these strategies were viewed favorably by departments after implementation, and may become institutionalized recruitment practices within their departments. The search committee and department chair survey shows that relatively few departments are advertising in outlets targeted toward minorities, even though focus group participants emphasized the importance of doing so. Less than a quarter specifically advertised in outlets directed to women (24%), advertised in outlets directed to minorities (10%), or recruited from institutions not usually targeted (14.3%). In comparison, surveys of department chairs showed that non-STEM departments were more likely to advertise in outlets targeted toward minorities, with 86% of non-STEM already doing this or reporting being very likely to, compared to only 40% of STEM. In focus groups, UNL search committee chairs reported that they believe the personal touch is the most effective method to recruit a diverse applicant pool, including direct contact with both potential candidates and with advising faculty of graduate students. Direct contact is a critical technique in recruiting STEM women to UNL. Among applicants from 2010-11 UNL STEM tenure and tenure-track positions who made the short list, women were more likely to report learning about the position via “word of mouth,” with 28% of women reporting this, compared to only13% of men. While most search committee and department chairs agree that direct contact is an effective recruitment strategy, survey open-ended comments reveal that some did not employ direct contact because they thought the search process would not be equal since target individuals would be contacted. Furthermore, the 2010 individual search committee meetings indicated there is a lack of awareness on some search techniques; for example, one department was unaware that potential candidates could be contacted directly and encouraged to apply.
“We reviewed active recruitment strategies with the group who were surprised to learn that they could contact potential candidates directly and encourage them to apply.” (Quote from search committee meeting notes)
This reinforces the need to inform departments on legal and effective ways to recruit a diverse and excellent applicant pool. Search committees that discuss how to recruit a diverse pool initiate an overall active recruitment effort and increase the number of strategies used according to department and search committee chair surveys. Over half of search committee
65

chairs specifically discussed how to recruit women into their applicant pool for their last search (57%). Those who reported talking about recruiting women were significantly more likely to have done the following other strategies in their most recent search: 1) talk to potential candidates at professional conferences or meetings (V=.375, p<.10), 2), contact candidates directly (V=.514, p<.05), 3) ask colleagues from other institutions to encourage students to apply (V=.471, p<.05), and 4) write broadly defined job advertisements (V=.627, p<.10). Nationally, writing a broadly defined job advertisement has been shown to increase the diversity of the applicant pool. At UNL, there is little evidence to support that writing a broad job advertisement has its intended benefit across all STEM fields, but it may work for some disciplines. About half of the participants from the search committee and department chair survey reported writing a broadly defined job advertisement in their last search. STEM chairs were significantly more likely than non-STEM to report narrow job advertisements as more useful, with 80% reporting narrow as very or somewhat useful, compared to only 33% of non-STEM (Recruit & Retain Series pretest). While not significant (p=.149), non-STEM chairs reported writing broad advertisements as more useful than STEM (58% of non-STEM reported very or somewhat useful, compared to only 20% of STEM). To test the hypothesis that writing broad job advertisements increases the proportion of women in the applicant pool, the job advertisements were coded for filled assistant professor searches between 2005-2011. Job advertisements were coded as narrow (25%), middle (47%), or broad (29%). On a three point scale, where 3 is broad and 1 is narrow, the College of Engineering (COE) job ads were coded as most broad (2.5), followed by the 2.02 for the Institute for Agriculture and Natural Resources (IANR), and 1.85 for Arts and Sciences (A&S).
Job ads that were written broadly had bigger applicant pools (r=.202). But, bigger applicant pools did not mean more women. There was a negative association between the size of the applicant pool and the proportion of women, as applicant pool size increased, the proportion of women in the applicant pool decreased (r=-.181). College moderates this, however. For STEM A&S, as job ads were written more broadly, the proportion of women in the applicant pool increased (r=.303). The reverse was true for the COE, as job ads became more narrow the proportion of women in the applicant pool increased (r=-.310). There was no association between narrow or broadly written job advertisements for STEM IANR.
Within department trends in job advertisements (either becoming more broad, more narrow, or staying the same over time) revealed that broader ads do not account for increases in the proportion of women in the applicant pool.
66
Sharing of Comparison Data The ADVANCE-Nebraska evaluation team gathered comparison data from national and peer sources and then presented the data to department chairs in January 2011 and 2012. Nearly all attendees found the event useful and learned something valuable from the data discussion. The need for reviewing comparison data is evident in that a survey of department chairs and search committee chairs, showed that over 40% thought that the number of women in their applicant pool was representative of the proportion of women with PhD’s and one-third (33%) reported that they ‘Didn’t know’. According to the applicant pool data, all (100%) of the searches that took place during that time period had applicant pools that were under-represented (on average, they were 16% below the PhD rates). This suggests that departments inaccurately perceive their applicant pools as representative. Furthermore, those who reported that they didn’t know if their pool was representative were just as likely to report being satisfied with the number of women in their applicant pool as those who said their pool was proportionate. Those who think their pool is representative and those who don’t know aren’t likely to change how searches are conducted if they are already satisfied with their pools. Respondents who thought their pool was representative of eligible women were significantly less likely to use some recommended strategies, such as asking their colleagues to have their students apply and/or to email listservs about the job (p<.10). Informed faculty may be more inclined to use extra recruitment efforts to meet goals based on comparison data.
Retention Focused Professional Development There were 4 retention-focused professional development events offered in year one and 14 events in year two, which were primarily presented through the Paths to Success Luncheon series. The series was changed in year three to a Conversation Series, which included 8 events. In total, 26 retention-focused events were offered in ADVANCE-Nebraska’s first three years. Distractions from home as reported in the climate survey showed an interesting impact on attendance at ADVANCE events. For women, as the number of hours spent on home and family increases, the likelihood to attend an ADVANCE event increased. For men, as the number hours spent on home and family increases, the likelihood to attend an ADVANCE event decreased. Nearly all attendees (94%) agreed or strongly agreed that the material covered was useful. The events that received the highest ratings of usefulness were the COACh workshops and the Conversation Series event addressing teaching challenges. Overall, the vast majority (79%) reported that they would be very likely to attend another ADVANCE-Nebraska event. The primary reason for attending was because it was an interesting or useful topic, but other common reasons were the opportunity to meet new colleagues, opportunity for professional advancement, and to learn about ADVANCE-Nebraska.
67

One goal of the retention events was to promote networking with colleagues. Across all events, about half (51%) reported meeting colleagues with whom they will develop a closer professional relationship, and 69% reported that the time spent networking with colleagues was valuable. Strong agreement with reports of meeting colleagues was found most often among the writing retreat participants in year one, Bonnie Coffey’s presentations, and the Judy Walker and Allison McKay Paths to Success luncheons. The strongest agreement with regard to the value of time spent networking was reported from the Walker, McKay, and Shellman luncheons, Bonnie Coffey’s presentation in year 2, the COACh workshop in year two, and the second writing retreat. One of the goals of the Recruit and Retain Chair Workshop Series offered in the fall of 2009 was to offer new ideas to help retain faculty. The vast majority of participants of this series (86%) agreed or strongly agreed that they learned new ideas for retention. The majority (88%) also felt that their department should do more to foster social and research connections.
Dual Career A formal dual career program was established through the ADVANCE-Nebraska office and is a hallmark of the grant.
“The most positive activity of the UNL ADVANCE project toward transformation appears to be the Dual Career program. Site visit interviewees at all levels--from junior faculty to deans--spoke positively about this program. Their positive responses provide support for the ‘positive buzz’ about which the ADVANCE project team spoke.” (UNL Third Year Site Visit Report, NSF)
Prior to the formalization of the ADVANCE-Nebraska dual career program, search committee chair focus groups revealed that the dual career issue is the number one problem in hiring.
“I do want to say I had never heard of this two body-spousal hire; spouse issues are huge in hiring and I don’t know… I don’t think our university does a very good job handling them and being able to accommodate spouses, and we’ve lost several people because of that. “ (Quote from focus group)
In addition, survey open-ended comments reinforced this notion in that department and search committee chairs cited the dual career issue as the biggest challenge to hiring women. The focus groups further explained some of the issues associated with dual careers. They mentioned that the timing of dual career is problematic if a dual career is not made aware until after an offer is made. They felt facilitating dual career hires was an extra burden on search committee chairs, and that it’s problematic when dual career status is known to search committee members when evaluating candidates (if perceived as a burden may change perceptions of
68
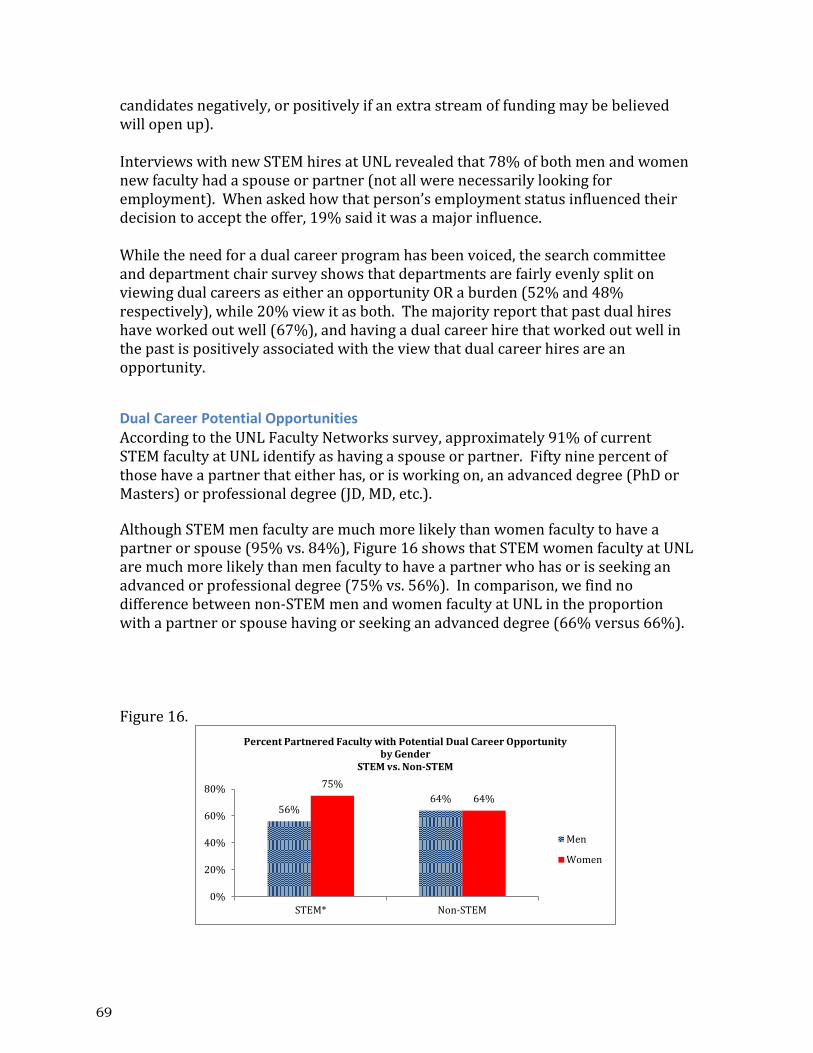
candidates negatively, or positively if an extra stream of funding may be believed will open up). Interviews with new STEM hires at UNL revealed that 78% of both men and women new faculty had a spouse or partner (not all were necessarily looking for employment). When asked how that person’s employment status influenced their decision to accept the offer, 19% said it was a major influence. While the need for a dual career program has been voiced, the search committee and department chair survey shows that departments are fairly evenly split on viewing dual careers as either an opportunity OR a burden (52% and 48% respectively), while 20% view it as both. The majority report that past dual hires have worked out well (67%), and having a dual career hire that worked out well in the past is positively associated with the view that dual career hires are an opportunity.
Dual Career Potential Opportunities According to the UNL Faculty Networks survey, approximately 91% of current STEM faculty at UNL identify as having a spouse or partner. Fifty nine percent of those have a partner that either has, or is working on, an advanced degree (PhD or Masters) or professional degree (JD, MD, etc.). Although STEM men faculty are much more likely than women faculty to have a partner or spouse (95% vs. 84%), Figure 16 shows that STEM women faculty at UNL are much more likely than men faculty to have a partner who has or is seeking an advanced or professional degree (75% vs. 56%). In comparison, we find no difference between non-STEM men and women faculty at UNL in the proportion with a partner or spouse having or seeking an advanced degree (66% versus 66%). Figure 16.
56% 64%
75% 64%
0%
20%
40%
60%
80%
STEM* Non-STEM
Percent Partnered Faculty with Potential Dual Career Opportunity by Gender
STEM vs. Non-STEM
Men
Women
69

Application of UNL Dual Career Process Figures 17 and 18 show the outcomes of the 66 STEM searches from 2008-2010. The ADVANCE-Nebraska office received the names of short list candidates for a subset of 39 searches, and sent letters to the corresponding 153 short list candidates. Within the 16 searches where a dual career opportunity was identified, 12 of the candidates who received an offer had dual career spouses. ADVANCE-Nebraska assisted with interviewing six of the candidates. Four of the six couples accepted the offers. Figure 18 shows that twenty-five people in 16 searches had a dual career opportunity, or 16% of all people contacted on the shortlist (N=153) and 41% of all searches (N=39). Of the searches with any dual career opportunity, 50% (N=8) had more than one candidate with a dual career spouse. The process has evolved over time and currently the EAD office sends all approved short lists to the ADVANCE-Nebraska office, and after verifying the names with search committee chairs, a letter is sent notifying the candidates of the dual career program. Figure 17. Figure 18.
As awareness of the dual career program increased, male faculty members already at UNL contacted the ADVANCE-Nebraska office with potential STEM women dual career opportunities. This resulted in three new STEM women hires at UNL. There was an additional nine dual career retention opportunities identified among current STEM women faculty at UNL, generally among assistant professors hired just prior to the start of ADVANCE Nebraska. Of the nine opportunities to retain STEM women by hiring their partners, three were successful. Including dual career hires from new searches and those aimed at retaining faculty already here, there have been 10 dual career hires total since the inception of ADVANCE-Nebraska, 8 are still at UNL as of Fall 2011.
Research on Networks of STEM Faculty
The survey for the Faculty Network and Workload Study (FNWS) was conducted by the Bureau of Sociological Research (BOSR) at the University of Nebraska-Lincoln in March 2011. The survey intended to measure faculty networks, climate perceptions, and faculty productivity. The study design for the FNWS consisted of a mixed mode
70

survey: faculty had the option of filling out the survey on the web or via mail questionnaire. Overall, there was a 75.1% individual response rate. More importantly, the relational response rate within each department is above 85% for all three departments in the study. This high relational response rate is necessary for conducting the type of social network analysis we wish to pursue with FNWS data.
The spring 2011 FNWS data collection improved on many of the limitations from the first wave of data collection (the 2008 pilot study). First, we now have a comparison group of non-STEM faculty because we added an additional 16 social science departments at UNL to the survey sample. Second, expanding from 26 to 42 departments has increased our sample size from about 450 to over 750 faculty members. This will increase our statistical power to explore more research questions. Importantly, we now have considerably more under-represented faculty in our sample. Finally, we combined the network and climate survey into a single survey instrument allowing us to draw sounder inferences on the associations between faculty network structure and academic climate perceptions.
Networking Findings Several key findings from the numerous research manuscripts being written have implications for ADVANCE-Nebraska programming. First, on average under-represented minorities (women and non-white men) report worse department climates (e.g., less tenure process clarity, lower collegiality, feel less value is placed on their research and that they are not treated fairly) than white men. Among women, the differences are most pronounced among associate and full professors. Numerous ADVANCE-Nebraska programing elements focus on providing a safe space for all faculty members to discuss any struggles they are having within their tenure home department, such as the professional development workshops and the presence of the ADVANCE-Nebraska Office. Second, faculty members who have greater network integration within their tenure home department report more positive climate perceptions and a greater desire to remain at UNL. Network integration is equally important within friendship and research networks, but it is most important for faculty to have many direct ties to other faculty within their department. This suggests that ADVANCE programing elements should focus on creating “local” communities for faculty within their tenure home department. In other words, faculty members do not need to feel close to or interact frequently with all members of their tenure home department. Rather, each faculty member should have a subgroup of other faculty within their department with whom they engage in research exchanges and form friendships. Unfortunately, we know that women compared to men (white and nonwhite) are much more likely to lack local integration (i.e., have many direct ties) within department friendship and research networks. This has serious implications for the continued retention of women at UNL in STEM. Thus far, advance programming has
71

primarily provided ways for faculty to connect with one another across departments. A future programing element will be to work with specific departments to develop ways to help chairs identify isolated faculty and devise plans to increase the network integration of all faculty within a department, whether through research or friendship connections. A third major finding from a department level analysis provides further evidence to support the above recommended ADVANCE-Nebraska programing elements targeted at network integration. Specifically, we find that departments where faculty section off into subgroups within a department (i.e., many interactions are occurring among a subgroup of faculty members and fewer occurring with faculty outside of the subgroup) can lead to more positive climate perceptions and higher organizational commitment. Thus, faculty should be encouraged to find local tightknit grouping of research collaborators or support providers within their department. Department chairs can pay attention to whether or not each faculty member has a local “home” within their department. There is an important caveat, however, to this general recommendation. Specifically, the local clusters or subgroups of faculty cannot be segregated across gender and race. In other words, each local cluster should contain both represented (i.e., white men) and underrepresented faculty (i.e., women and nonwhite men) within the cluster. The fourth major finding indicates that segregated departments have poor climates perceptions and low organizational commitment. Segregated departments have ties that remain along demographic lines. The graph below on the left shows a segregated department. Most of the network ties within the department occur among faculty with similar demographic characteristics. For example, if the blue dots represent men and the green dots represent women, then most ties are occurring between men or between women and very few ties occur across gender. In contrast, the graph below and to the right shows an integrated department, where there are numerous network ties across actors with different demographic attributes.
We find the following results pertaining to segregation and faculty outcomes: a) within research exchange networks racial segregation is associated with worse department climates and lower organizational commitment; b) within friendship networks gender segregation is associated with worse department climates and
72

lower organizational commitment; and, c) segregation across academic rank is not associated with climate or commitment. ADVANCE-Nebraska programming elements have been very successful at increasing the number of underrepresented faculty in STEM. If, however, these underrepresented faculty end up in a departments with clear segregation of network connections across race or gender lines, then it is unlikely that these “new” faculty will be satisfied or retained. Again, future ADVANCE-Nebraska programing element will need to work with department chairs to ensure that local clustering with friendship or research networks does not segregate along race and gender lines.
Research Publications and Presentations Core members of the network research team (Falci, Watanabe and McQuillan) have submitted two research manuscripts in years 3 and 4 entitled “Disconnected in the Ivory Tower: An Exploratory Study of Gender and Race Differences in STEM Faculty Networks” and “Department Climate and Faculty Job Satisfaction in STEM Disciplines: Explaining Differences by Race and Gender.” Both of these manuscripts are currently being revised for resubmission to peer-reviewed journals in sociology. The research team has four additional research manuscripts in progress listed below:
• Falci, Christina and Megumi Watanabe. “Faculty Network Position and Structure on Academic Climate Perceptions.”
• McQuillan, Julia, Patricia Wonch Hill, Christina Falci, Megumi Watanabe, and Mary Anne Holmes. “Academic Rank & Faculty Perceptions: Is Higher Better For White Men Only?”
• McQuillan, Julia, Christina Falci, and Megumi Watanabe. “Network Structure and Academic Climates: A Department Level of Analysis.”
• Olson, Kristen, Christina Falci and Megumi Watanabe. “Social Isolation and Survey Nonresponse: An Empirical Evaluation Using Social Network Data.”
Research findings have also been shared within the UNL community and at a number of conferences through poster and paper presentations. Thus far, three presentations were given to the UNL community. In year 2, Falci shared preliminary findings from the pilot study at a chairs and directors workshop. In year 3, Falci and McQuillan each gave a results presentation to UNL faculty and administrators entitled “UNL STEM Faculty Networks and Climate” and “Perceptions of Climate and Connectivity among UNL STEM Faculty.” Another “results” presentation to the UNL community is planned for Fall 2012. Overall, the network research team has given three invited panel presentations and seven poster, roundtable or paper presentations at regional and national conferences. In year two, Falci, Watanabe, McQuillan, and Holmes presented a poster “STEM Faculty Network Marginalization within Departments by Gender and Race” at the NSF ADVANCE Conference in October 2009. Christina Falci presented “The Effects of a Faculty Member’s Location within Department Research, Friendship and Committee Networks on Climate Perceptions” as an invited panel
73

presentation at the Pacific Sociological Association Annual Meeting in April 2010. Megumi Watanabe presented “Gender and Race Differences in Job Satisfaction and Commitment among STEM Faculty: The Influence of Network Integration and Work-Family Balance" in April 2010 at the Midwest Sociological Society Annual Meeting. In year three, Falci gave a roundtable presentation entitled “Gender and Race Differences in STEM Faculty Job Satisfaction: The Role of Departmental Climate” at the American Sociological Association Annual Meeting in August 2010.. Falci also gave an invited panel paper entitled “Network Diversity, Climate and Productivity by Gender and Race” at the 2010 ADVANCE-PI meeting. In year four, Watanabe presented a paper at the Midwest Association for Public Opinion Research entitled “Social Isolation and Survey Nonresponse: An Empirical Evaluation Using Social Network Data” in November 2011. . The same author presented “Gender and Race Differences in STEM Faculty Job Satisfaction: The Role of Departmental Climate” at the American Sociological Association Annual Meeting. McQuillan gave an invited panel presentation entitled “STEM faculty Experiences by Gender, Race and Rank” at the Eastern Sociological Society Annual Meeting. Two papers were presented by Christina Falci and Megumi Watanabe at the Sunbelt Social Networks Conference in March 2012. These talks were entitled “Faculty Network Position and Structure on Academic Climate Perceptions” and “The Network Structure of Academic Departments and Climate Perceptions.” Falci and Watanabe met several other ADVANCE scholars who are engaged in network research at these conferences. Finally, several graduate students in the Department of Sociology are currently working with the network and climate survey data. Two Sociology Masters Theses were published in 2010 using networking data collected for ADVANCE-Nebraska. Megumi Watanabe’s "Gender and Race Differences in Job Satisfaction and Commitment among STEM Faculty: The Influence of Network Integration and Work-Family Balance" and Yan Wang’s “Explaining Race and Gender Differences in Perceived Clarity in the Tenure Review Process.” One Masters Thesis is in progress and another graduate student has begun working on research this spring.
Recommendations Recommendation 1: Institutionalize regular data collection, reports and discussions of data with department chairs, heads, and college deans.
Surveys of UNL department and search chairs show that many inaccurately perceive that their department’s recent applicant pools reflect the proportion of women available for hire. But comparisons of the proportion of women in UNL applicant pools with proportions of women in comparison to national PhD data show that UNL STEM search pools under-represent women. Furthermore, chairs that thought their pool was representative were significantly less likely to use diversity-
74

enhancing recruitment strategies compared to chairs with more accurate perceptions. According to multiple surveys of UNL STEM department chairs, reviewing current comparison data and discussing the data with UNL colleagues helped to define appropriate diversity goals and provide useful strategies for meeting them.
Recommendation 2: Institute professional development to support effective recruitment.
Surveys of UNL STEM faculty show they are eager to learn how to be more effective in hiring excellent faculty members who reflect the diversity of available talent and that they are receptive to learning relevant strategies. Moreover, ADVANCE-Nebraska recruitment event pre- and post-tests showed that faculty who attended increased their reported use of strategies designed to draw a diverse, excellent pool. Surveys also indicate that departments implementing diversity-enhancing strategies in past searches are likely to continue using those strategies for future searches. Evidence from post-event evaluations, search surveys, and the external evaluator, suggests that the most effective strategy for improving how UNL conducts effective faculty recruitment is to use multiple modes of communication targeted particularly toward department chairs and members of search committees, and to also engage all faculty members in participation in continuous long-range efforts to recruit faculty.
Recommendation 3: Continue commitment to dual career hiring by maintaining a designated program and promoting a positive dual career culture. Focus groups conducted with search committee chairs and conversations with department chairs identified dual careers as the number one barrier in hiring STEM women, primarily due to difficulty with the timing and uncertainty of the process of facilitating dual career hires. The ADVANCE-Nebraska office has successfully addressed these issues for STEM hires as noted by the NSF third year ADVANCE-Nebraska site visit report. According to survey data, half of UNL STEM departments view dual career hires as a burden; however, past positive dual career experiences make department members more likely to see dual career hiring as an opportunity. Evidence from focus groups, surveys, and successes from the current dual career program suggests that the continued commitment to dual career hiring should include the following elements: 1) a designated office with responsibility to contact short-list candidates directly and facilitate communication among key players (deans, department chairs) of dual career opportunities to reduce the burden on departments, 2) contact with candidates should begin immediately after short lists are finalized to allow adequate time for the possibility of a successful dual career hire, and 3) past dual career hire successes should be highlighted to both job applicants and current faculty to establish a culture committed to supporting dual career couples at UNL.
75

B. EXTERNAL EVALUATOR REPORT
ADVANCE – University of Nebraska
REPORT FROM THE EXTERNAL EVALUATOR
Ann E. Austin
September 6, 2011
This report is based on my visit to the University of Nebraska from Wednesday, August 17- Friday, August 19, 2011, in my role as External Evaluator for the ADVANCE Project. Part of my preparation for the visit included reviewing recent annual UNL ADVANCE reports, the Third-Year Site Visit Report, and the UNL response to the Site Visit Report. I also met by telephone prior to the visit with Dr. Nancy Busch, Dr. Mary Ann Holmes, Ms. Mindy Anderson-Knott, and Ms. Jill Hochstein to discuss specific goals for this visit, which included the following:
1) Work with institutional and ADVANCE Project leaders to consider how to move
toward the institutionalization phase of the Project;
2) Work with the ADVANCE Internal Evaluation Team to review their work to date and
assist them in establishing priorities within their work (including consideration of
publishing plans and consideration of evaluation work to continue as the university
moves toward institutionalizing aspects of the ADVANCE work);
3) Consider the most productive ways, over the next few years, to use my time and
involvement as the External Evaluator with the UNL ADVANCE Project.
The schedule for my visit included: dinner with Academic Administrative
Director/Evaluation Leader Nancy Busch and Internal Evaluator Mindy Anderson-Knott; a lunch meeting with Co-P.I.s Mary Anne Holmes and Julia McQuillan; extensive time with the Evaluation Team (Nancy Busch, Mindy Anderson-Knott, and Trish Wonch-Hill) as well as an extensive meeting alone with Mindy Anderson-Knott; a meeting with Concetta DiRusso, ADVANCE-Nebraska Faculty Committee Chair; a meeting with Jim Lewis, Internal Advisory Board Chair; attendance at an ADVANCE Breakfast Reception for new STEM women faculty; and a meeting with Senior Vice Chancellor Ellen Weissinger, as well as ADVANCE Academic Administrative Directors Evelyn Jacobson and Nancy Busch.
This report is organized to address the three goals for this visit. I shared and discussed
key points in the report during the visit. I. Moving toward Institutionalization
Over the past year, the ADVANCE-Nebraska leadership team has been discussing the path toward institutionalizing key elements of their program. Recognizing these efforts and based on my conversations as described above, I believe several steps make strategic sense as university and ADVANCE leaders consider the future. I discussed these suggestions with relevant institutional and ADVANCE leaders during the visit and summarize them here:
Begin the Process of Institutionalization Now
76

Ensuring that efforts that have been supported by a grant have viability and impact beyond the life of the grant requires thoughtful planning well before funding ends. Thus, I was pleased to see that senior university administrators and ADVANCE Project leaders were already engaged in considering possible steps toward institutionalizing key aspects of ADVANCE-Nebraska. This visit provided opportunity for moving forward the planning and discussions about possible options.
One step toward institutionalization is to acknowledge and celebrate accomplishments to date. With the Third-Year Review accomplished and various programs and policies well-established, the timing is right in the next several months for ADVANCE-NEBRASKA to highlight and celebrate achievements and goals that have been met. My interviews with faculty members and administrators in STEM units indicate that there is a sense that ADVANCE endeavors have been productive and useful. A celebration would serve to focus further and more extensively the attention of the campus on important ADVANCE principles, goals, and achievements, as well as to honor the leaders who have worked hard to develop the project and coordinate its programs and initiatives. A celebration also signals the importance of the work to the institution and paves the way for ongoing efforts.
In further developing plans for institutionalization, I suggest that university and project leaders develop clear and specific responses to three key questions:
What does UNL want to accomplish by the end of the grant? How does ADVANCE-
Nebraska connect with key institutional priorities?
What are the goals for institutionalization when the grant ends in two years?
What specific steps, actions, and accomplishments must occur in the next 24
months to ensure that plans for institutionalization are met?
Situate the Work and Future of ADVANCE within the Context of Critically Important University Goals
The work of ADVANCE relates closely to the important institutional goal of ensuring a superb university faculty. This goal is particularly important in light of the university’s plans to recruit and hire a number of faculty members (due to both retirements and expansion) within the near future. To achieve its missions, the university must seek the highest quality faculty—women and men. The ADVANCE project is an excellent resource to the university, since ADVANCE has identified and developed strategies for recruiting, supporting, and retaining excellent faculty members with diverse characteristics and talents. Furthermore, the ADVANCE Project has been instrumental in supporting the professional growth of department chairs and search committee chairs as leaders who understand the importance of tapping into the full range of talent available to academe and the barriers that can obstruct that goal, and are knowledgeable about strategies for recruiting, hiring, and supporting women faculty members, particularly in STEM fields. The university will be well served to build on and continue the programs and policies developed and highlighted through ADVANCE-Nebraska in service to the important university goal of recruiting and retaining excellent women and men faculty in STEM fields as well as other disciplines and fields.
Part of the process of institutionalizing ADVANCE accomplishments is to ensure that all deans and other institutional leaders understand that ADVANCE goals are directly linked with and support key institutional goals. Senior leaders are in a position to make clear to deans and chairs that they are accountable for helping to advance the institution’s goals of attracting, hiring, and retaining a diverse and talented faculty, including excellent women scholars.
77
Suggested Structure
Conversations and emerging ideas among project and institutional leaders suggest that an appropriate permanent home for ADVANCE activities would be within the Office of the Senior Vice Chancellor. I suggest that specific administrators reporting to the Senior Vice Chancellor be charged with coordinating and supervising ADVANCE-related projects and endeavors as the institutionalization process continues before and after the end of funding. The interests of the university would be served by adapting ADVANCE activities and programs not only for STEM departments but for departments across the whole university.
Based on my assessment of the programs and initiatives that ADVANCE-Nebraska has developed, coupled with the issues that the university will need to address as it seeks to recruit, hire, and support significant numbers of new faculty members in the coming decade, I recommend that ADVANCE work, as it is embedded and institutionalized into the larger university goals for hiring and supporting an excellent and diverse faculty, be organized around three themes. These themes build directly on work the ADVANCE project has been doing at UNL while providing an organizing framework that could be workable after funding has concluded:
Theme 1: Recruiting Excellent and Diverse New Faculty. Within this theme
would be support and education for search committee chairs and committees
across the university, development of resources to ensure thorough search
strategies that reach diverse pools of talented women as well as men, and ongoing
commitment and support for the Dual Career Policy (a policy reported by some
chairs and faculty members to be one of the most important aspects of the
ADVANCE Project).
Theme 2: Supporting and Retaining Faculty through Professional
Development. This theme would involve ongoing efforts to support faculty success
and growth through the kinds of workshops and seminars that have been
developed through the ADVANCE Project to encourage faculty career development
(including the writing workshops) and the networking-type activities that ADVANCE
has developed (i.e., the New Faculty Women’s Breakfast).
Theme 3: Leadership Development. ADVANCE-Nebraska has developed
workshops and resources to support department chairs and deans in encouraging
supportive, inclusive academic workplace environments and collegial relationships.
Other universities are finding that leadership development, particularly for
department chairs, is a sound investment. Chairs are at the front lines in
encouraging inclusive search processes and fostering departmental climates that
are welcoming and supportive. Thus, I recommend continuing programming for
leadership development that builds on and expands on the work of the UNL
ADVANCE Project to date.
II. Recommendations to the Evaluation Team
The discussion with the Evaluation Team and then the second meeting with Mindy Anderson-Knott focused on prioritizing the work of this team in the coming year. We reviewed the list of publications that the Evaluation Team is planning and as a group
78

discussed those to prioritize. For high priority publications, we also brainstormed possible publication venues.
The Evaluation Team has been very thorough in its data gathering. I recommend that the Evaluation Team use the fall to focus on completing data analysis. Recognizing the need for prioritizing the time allocation of the Evaluation Team, I would suggest that beginning further studies be held off until data already collected are analyzed and prepared in report (or article) form. Completed studies will provide useful scholarly support for decision-making about future steps connected with ADVANCE programs. We had specific discussion about the plans for research on Search Committee cases. I recommended that this study be delayed until fall, 2012, in order to provide time for the analysis of data already collected.
Since the Evaluation Team has gathered a great deal of data about many aspects of the ADVANCE Project and its impact, I suggested that the team pursue the following process to help move their data into forms that will be most helpful to the university: 1) List the questions they are trying to answer. 2) Consider what data they have collected that will aid in answering these questions. 3) Drawing on data analysis, develop findings and interpretations in response to the questions posed. 4) Organize a retreat or meeting with deans, department chairs, and others to discuss the implications of the findings for the campus. 5) Identify other questions the answers to which would help in making decisions to increase the impact of ADVANCE initiatives and/or to adapt or institutionalize ADVANCE initiatives.
In our discussions about a meeting or retreat with institutional leaders to discuss the relevance, usefulness, and applicability of key findings from the evaluation work, I suggested that Evaluation Team members develop plans for strategic presentation of the findings they have developed. That is, too much data or too many detailed findings can be overwhelming and can obfuscate some key issues. Thus, I would suggest that the Evaluation Team think strategically about what findings to present in a retreat and what form to use to present those data. Possible forms include statements of conclusion supported by key findings, or short cases that illustrate key findings supported by the data. Deans and chairs might then discuss questions raised by evaluation results or implications for practice suggested.
A similar process could be used by the Research Team for moving their findings about networks, for example, to useful discussion about implications for practice. The findings about networks could be the basis for stimulating excellent discussion at a leadership workshop on strategies or approaches chairs might consider for fostering collegial interactions or enhancing the collegiality within their units.
As the Evaluation Team makes decisions about allocating their time, I recommend that they focus on data analysis and developing findings in three areas:
The search and hiring process
Climate and relationship issues
Career stage issues, including issues pertaining to retention and promotion
III. Suggestions for External Reviewer’s Work over the Coming Two Years
My work over the past few years with the UNL ADVANCE Program has included both traditional evaluation work and consultative work, based on data collection. I suggest that
79

this two-focused approach continue. That is, I believe I can be helpful in providing consultative support to ADVANCE leaders and university senior leaders as the ADVANCE project continues over the next two years. In particular, I can provide suggestions in regard to the institutionalization process. Sometimes the eye of an outsider can bring fresh insights and perspectives. My consultative advice is always grounded in and informed by careful reading of all written materials relevant to ADVANCE-Nebraska and conversations, interviews, and focus groups with individuals providing various perspectives on the ADVANCE Project.
I also believe I can be useful in continuing to interact with the Internal Evaluation Team. As the Team answers its evaluation questions, I would be happy to review reports of findings. Also, as the Team explores ways to present key findings to members of the campus community in order to discuss implications, I would be glad to discuss process issues as well as to discuss possible implications and applications based on the study findings.
During Year 5, I should conduct an overall summative evaluation of the work that has been accomplished and its impact. This type of evaluation would require me to review findings and key reports from the Internal Evaluation Team and to conduct extensive interviews with ADVANCE leaders, institutional leaders, and faculty members involved in ADVANCE initiatives. This work would result in a final summative report.
80
ADVANCE – University of Nebraska
REPORT FROM THE EXTERNAL EVALUATOR/ CONSULTANT
Ann E. Austin
March 11, 2012
This report summarizes highlights and offers recommendations based on my visits to the University of Nebraska in January and March, 2012, in my role as External Evaluator for the ADVANCE Project.
HIGHLIGHTS AND SUMMARY OF THE JANUARY 16-18 VISIT
This visit involved meetings with the following: Drs. Nancy Busch, Mindy Anderson-Knott, Trish Hill, Evelyn Jacobson, Julia McQuillan, and Christina Falci, and Senior Vice Chancellor Ellen Weissinger and Dr. Lance Perez in the Senior Vice Chancellor’s Office.
The overall theme of the visit was “using evaluation to inform campus transformation.” The meetings focused on the following issues, topics, and tasks:
1. Meetings with members of the Leadership and Evaluation Teams focused on
lessons learned from ADVANCE-Nebraska concerning recruitment and retention,
based on evaluation findings. After discussing evaluation data and findings, we
outlined a document that highlighted project goals, accomplishments, key
evaluation conclusions, and a set of recommendations for the future. Additionally,
we identified specific actions steps recommended for the “bridge period” from early
2012 to the end of the grant period. Dr. Anderson-Knott took this work and
prepared a written document which was forwarded to SVCAA Weissinger.
2. Along with Drs. Busch and Jacobson, I met with SVCAA Weissinger to discuss
accomplishments and the future of ADVANCE-Nebraska:
a. The conversation focused on the university’s plan to expand hires in the
next few years, ways in which a commitment to diversity serves the
university’s goals to hire excellent faculty members, and ways in which
strategies developed through ADVANCE can contribute to these institutional
goals.
b. The conversation also focused on transitioning ADVANCE into the SVCAA’s
Office (including the plans to appoint an Associate Vice Chancellor who
would focus on faculty issues, including recruitment and retention), and the
process of expanding ADVANCE efforts to all faculty (not only STEM women).
We also briefly discussed the benefits of including leadership development in
the portfolio of the new Associate Vice Chancellor.
c. Another topic focused on possible formats and agenda items for an early
spring External Advisory Board meeting. Seeking the EAB’s advice about
institutionalizing ADVANCE efforts into the central administration can
provide useful insights from experienced ADVANCE leaders.
81

3. I met with Drs. Julia McQuillan and Christina Falci, and doctoral student Megumi,
to discuss publications and future grant possibilities that would build on the
current research. We also discussed some of the practical implications of the
research and ways to use research findings to guide conversations on campus.
HIGHLIGHTS AND SUMMARY OF THE MARCH 4-7 VISIT
This visit included meetings with Senior Vice Chancellor for Academic Affairs Ellen Weissinger, other members of the Vice Chancellor’s Office, the Leadership and Evaluation Teams, and the Faculty Committee. I also presented a workshop for Department Chairs and introduced to UNL my long-time collaborator Dr. Mary Deane Sorcinelli, Associate Provost at UMass Amherst. She shared ideas about innovative approaches to mentoring. Summaries of specific meetings follow:
Meeting with Evaluation Team
We reviewed the documents developed in January outlining accomplishments, evaluation findings, recommendations, and suggested “bridge period” action steps. We created a succinct follow-up document organized around the six recommendations and providing suggested short-term (bridge period) action steps and long-term action steps.
Meeting with Christina Falci
This meeting, requested by Dr. Falci, focused on possible interpretations, based on higher education literature and research, of various findings from the network study. In particular, we were discussing possible advantages and disadvantages of patterns of faculty connections that involve a few strong connections as compared to many weak connections. Dr. Falci indicated that the conversation helped her think in new ways about some of her data, which will aid in the interpretation and sharing of the findings.
Summative Evaluation Planning
I met with the Evaluation Team several times during the visit to develop plans for the summative evaluation of ADVANCE-Nebraska. We agreed that the key questions to organize the evaluation will be:
What have been the outcomes and impact of ADVANCE-Nebraska?
What factors have contributed to institutional change, in service to ADVANCE
goals?
What have been the barriers or challenges to institutional change?
To what extent are the accomplishments sustainable?
What lessons have been learned through ADVANCE-Nebraska?
To answer these questions, the external evaluation plan will focus on perceptions and attitudes of individuals (deans, chairs, senior leaders, faculty members), as well as evidence of organizational change of various kinds (e.g., structural, symbolic, political, and human resource-oriented). To prepare the final evaluation, I will conduct interviews and focus groups on campus, and also will review results from the internal evaluation reports. Mindy Anderson-Knott will assist with the sampling process for the external evaluation, and Jill Hochstein will assist with scheduling for interviews and focus groups. IRB approval will be needed both at UNL and MSU.
The timeline:
82

By the end of Spring, 2013, the Internal Evaluation team will have completed its
reports, including surveys of Search Committee Chairs and Department Chairs,
interviews with new hires, and focus groups with associate and full professors.
I will collect data in spring, 2013 and by fall, 2013, the External Evaluation report
will be completed (Nancy Busch and Evelyn Jacobson are checking on whether
these dates work with final NSF due dates).
Evelyn and Nancy also are checking with NSF about the nature of any final report
expected from ADVANCE-Nebraska leaders.
Meeting with the Senior Vice Chancellor for Academic Affairs
This meeting consisted of Ellen Weissinger, Nancy Busch, Evelyn Jacobson, and myself. We spent some time reviewing the recommendations for building on ADVANCE-Nebraska in the short-term (i.e., bridge period until the end of the grant), and the long-term (i.e., under the guidance of the new AVCAA). The discussion also focused on planning for the External Advisory Board meeting scheduled for the following day.
Meeting with the Faculty Committee
Mary Deane Sorcinelli, Associate Provost for Faculty Development at UMass Amherst, and I met with the Faculty Committee to discuss their “Best Practices” document on recruitment and retention of women STEM faculty. Many useful and strategic ideas have been included in this document. Getting Department Chairs and others to review and use the document will be critically important if it is to have an impact. Thus, we discussed possible ways to bring attention and invite interest and use of the document. These ideas included: (1) developing cases for use in workshops with Chairs that would lead them into exploration and consideration of ideas in the Best Practices document; (2) hosting a workshop for new Chairs that includes discussion of strategies in the document; (3) very short podcasts for dissemination to Chairs and Deans that might highlight specific strategies and suggestions for Best Practices. The Faculty Committee plans to meet with several of the Vice Chancellors to learn about their ideas about supporting the recruitment and retention of women STEM faculty and to discuss suggestions from the committee. We discussed several key points that could be addressed in such meetings: attention to diversity supports the institution’s commitment to excellence; Deans and Chairs are very important in conveying institutional commitment to creating environments that support the success of a diverse faculty; many strategies that help recruit and support women STEM faculty are not costly.
Meeting with Representatives of the Chancellor’s Commission on the Status of Women
Mary Deane Sorcinelli and I met with Melanie Simpson and Anne Duncan, representatives from the Chancellor’s Commission, and discussed innovative approaches to mentoring. Specifically, we discussed the mutual mentoring program developed at UMass Amherst, and the impact and outcomes of that program. They were very excited to learn about this approach that goes beyond traditional one-on-one mentoring arrangements.
Breakfast Meeting with the SVCAA and Associate Vice Chancellors
This was an informal discussion that included a number of topics. Of particular interest was the discussion of innovative approaches to mentoring. Mary Deane Sorcinelli provided a short description of the Mutual Mentoring Program at UMass (which includes
83

opportunities for departments and for individual faculty members to propose plans for mentoring that are directly relevant to the needs of those making the proposal). This discussion seemed to be of strong interest.
Presentations
Mary Deane Sorcinelli, Associate Provost for Faculty Development at UMass Amherst, facilitated a workshop entitled “Mutual Mentoring: Moving beyond One-Size-Fits-All Mentoring.” The workshop explained how UMass Amherst conducted research on the needs of early career faculty, and, based on the findings, developed an approach to mentoring that responds to the particular needs of individual faculty members and within specific departments. UMass offers opportunities for departments and other groups of faculty members to develop grant proposals for ways they would like to create mentoring networks. Individual faculty members also can submit grant proposals for supporting the creation of mentoring networks and for specific support relevant to the individual’s needs in achieving career success. This workshop seemed to be very well-received, with participants suggesting that Dr. Sorcinelli should return to meet specifically with Department Chairs and Deans.
I facilitated a lunch workshop for Department Chairs and established faculty members entitled “Fostering Supportive and Productive Academic Workplaces for a Diverse Faculty: Strategies for Change and Success.” The workshop was organized around a framework, based on research, of key elements within academic workplaces that, when present, relate to important outcomes--faculty satisfaction, organizational commitment, retention, and productivity. These elements include respect, equity, autonomy, professional development, collegiality, and flexibility.
External Advisory Board Meeting
I attended the EAB meeting and observed the comments, suggestions, and requests made by EAB members. Dr. Weissinger referred the EAB to the report they had been sent concerning overall accomplishments, and explained that, with substantial hiring opportunities on the horizon, the university can learn from the lessons and impact of ADVANCE. EAB members offered various perspectives and suggestions during the discussion. They also requested that they be provided with the following information: (1) data and information at the college levels, and, where possible, departmental information, on the recruitment, retention, and leadership opportunities for women faculty; (2) information on the interventions and strategies of ADVANCE-Nebraska and the related impact and outcomes. Dr. Weissinger indicated that such information will be provided and suggested a follow-up meeting, focused on specific topics, be held in the coming months.
RECOMMENDATIONS
Based on my meetings and conversations, as well as my knowledge of the institutional environment at UNL and the work of the ADVANCE Project, I offer the following suggestions and recommendations:
Advertising the AVC Position: I suggest special attention be given to spreading the
word about the nature and importance of the new AVC position and inviting
nominations of or applications from appropriate candidates. I know the position
has been posted. However, as I talked with various people, I learned that some
think there is already someone for whom the position is being slated; thus, interest
in applying or making nominations may be diminished. I suggest that strong effort
be made to publicize to the campus that this is an open position that could be very
exciting and that will be very important to the university, and that nominations and
applications are encouraged.
84

External Advisory Board (EAB): I recommend a thank you follow-up letter be sent to
the EAB. It can indicate that Mindy Anderson-Knott, internal evaluator, will be
sending the requested information. I also recommend considering the possibility of
an in-person EAB meeting in the fall. Most of the EAB members are experienced
administrators and/or very knowledgeable about strategies for diversifying the
faculty. Providing an opportunity for them to talk through and offer suggestions
could be very useful, especially as the new AVC develops the agenda for that office.
I also think such a meeting would provide the occasion to share more fully the
strategies and programs that have been developed at UNL and the extensive
internal evaluation and research activities that have occurred. Furthermore, the
data they are interested in reviewing will be easier to discuss in person than over
the phone.
Bridge Period/Short-Term Suggested Action Steps: I believe the action steps
recommended in the document submitted to the SVCAA for the bridge period (i.e.,
now until the end of the grant) are very important in order to maintain the
momentum already established through ADVANCE activities and programs. I hope
these recommended activities and programs will be approved so that active
programming continues this spring and next fall. With approval from the SVC, I
would hope that Mary Anne Holmes would take an active role in carrying out the
programming and Nancy Busch and Evelyn Jacobson would provide administrative
coordination.
Faculty Committee: My observation is that this committee is trying to build on its
previous work and make a useful and significant contribution to the university. At
present, the committee is compiling “Best Practices” regarding recruitment and
retention and seeking ways to disseminate these ideas widely. However, (whether
accurate or not) the committee members feel they are operating without a clear
charge. I suggest that a specific written charge, signed by the AVC or the new
Associate Vice Chancellor, be given to this committee for the coming year (the
bridge period). The commitment of the members of this committee can be used
more fully in service to the university goals of attracting and hiring a large number
of new faculty members. A possible charge might be to explore career stage issues
in relationship to appropriate faculty development opportunities and approaches.
Mentoring: There is wide-spread interest in the innovative mentoring ideas
explained by Dr. Sorcinelli. I suggest that she be invited to visit again in the fall,
particularly to meet with Chairs and Deans and with the new AVC to discuss
innovative mentoring ideas.
Supporting the New Academic Vice Chancellor for Faculty: In the coming year, I
would be happy to meet with the new AVC to discuss ideas pertaining to faculty
recruitment, retention, and faculty development, as well as approaches to
leadership development. With plans to expand the faculty significantly, UNL has the
opportunity to be a national leader and exemplar in regard to strategies for
recruiting and supporting an excellent and diverse faculty. Mary Deane Sorcinelli
85

might also be invited to join in such discussions, as she is a national leader in faculty development.
86

Appendix C. Institutional Recommendations and Bridge Period
Prepared by the Advance‐NE Evaluation Team, January 2012
ADVANCE‐Nebraska Summary Report 2012
OverviewofADVANCE‐NebraskaThe ADVANCE‐Nebraska Program, which began in 2008, is funded by a five‐year grant from the National Science Foundation to support UNL’s institutional goals to attract and retain a diverse, excellent faculty.
ProgramGoals1. Increase the number of women STEM faculty.
2. Increase the retention of women STEM faculty and support their promotion into positions of
professional leadership.
3. Conduct innovative research on what organizational structures (networks) and relationships best support the academic success of women STEM faculty, and what factors contribute to the development of supportive networks.
ProgramActivitiesADVANCE‐Nebraska implemented a number of strategies to facilitate hiring women in STEM, most notably: establishing new dual career procedures resulting in 10 dual career hires; providing showcase visitor funds that supported bringing five external STEM women to campus; awarding three recruitment ambassadors travel funds for recruitment at conferences; meetings with search committees to promote practices to broaden and deepen applicant pools; and supporting a faculty committee to create a “best practices for faculty recruiting” document. To address both recruitment and retention, ADVANCE‐ Nebraska representatives met with department chairs, initiated an annual chancellor’s award in 2011, hosted an annual data workshop for department chairs and heads, formed two faculty committees (that later combined), and disseminated information on UNL’s excellent work‐life balance policies through electronic newsletters, the website, and brochures. In addition, from 2008 through 2011, ADVANCE‐ Nebraska hosted 31 professional and leadership development events related to recruitment or retention of STEM women faculty at UNL, including a “Paths to Success” luncheon series, a group‐mentoring Conversations series, professional development workshops, and writing retreats. On average at each event there were approximately 12 STEM faculty, 8 non‐STEM faculty and 3 administrators, resulting in 161 individual STEM and 96 non‐STEM faculty and administrators participating. The third goal was addressed through the innovative network and climate study, which started in 2008 and has provided new insights regarding the importance of research and social connections for retaining STEM faculty. The results from this research are disseminated within the UNL community and beyond via professional conference presentations and publications.
KeyFindingsfromADVANCE‐NebraskaEvaluation The representation of women in UNL STEM applicant pools has increased by 71% from 2007 to
2011, but the representation in 2011 remains 11 percentage points below the national PhD pool. These findings suggest that increased recruitment efforts are having an impact but need to continue.
87

Prepared by the Advance‐NE Evaluation Team, January 2012
In 2011, 31% of UNL STEM hires were women, compared with 19% in 2007. This increase can be attributed to the increase at the applicant pool stage.
Overall, UNL STEM departments have a smaller representation of women faculty than their CIC counterparts, but this varies by rank (UNL is higher among assistant professors) and department (range is from 9% above to 16% below CIC peers).
Women are underrepresented as STEM department chairs and heads compared to men, but improvements were recently made with the placement of two College of Arts and Sciences STEM women department chairs in 2011.
STEM women are not significantly more likely than men to exit UNL, but they are less satisfied and are more likely to want to leave UNL. They are more likely than men to want to leave for the following reasons: to find a more supportive work environment, to increase research time, and for their partner’s job.
RecommendationsThe following recommendations outline action steps to integrate ADVANCE‐Nebraska goals with the SVCAA in support of the university’s goals for excellence, diversity, and growth in the faculty. The recommendations focus on best practices, supported by data collected and analyzed by the ADVANCE‐Nebraska evaluation team, and developed in consultation with the external evaluator. A suggested timeline for the next 18 months is also provided.
Enhancerecruitmentofadiverse,excellentfaculty
Recommendation1:Institutionalizeregulardatacollection,reportsanddiscussionsofdatawithdepartmentchairs,heads,andcollegedeans.
Surveys of UNL department and search chairs show that many inaccurately perceive that their department’s recent applicant pools reflect the proportion of women available for hire. But comparisons of the proportion of women in UNL applicant pools with proportions of women in comparison national PhD data show that UNL STEM search pools under‐represent women. Furthermore, chairs that thought their pool was representative were significantly less likely to use some diversity‐enhancing recruitment strategies compared to chairs with more accurate perceptions. According to multiple surveys of UNL STEM department chairs, reviewing current comparison data and discussing the data with UNL colleagues helped to define appropriate diversity goals and provide useful strategies for meeting them.
Recommendation2:Instituteprofessionaldevelopmenttosupporteffectiverecruitment.
Surveys of UNL STEM faculty show they are eager to learn how to be more effective in hiring excellent faculty members who reflect the diversity of available talent and that they are receptive to learning relevant strategies. Moreover, ADVANCE‐Nebraska recruitment event pre‐ and post‐tests showed that faculty who attended increased their reported use of strategies designed to draw a diverse, excellent pool. Surveys also indicate that departments implementing diversity‐enhancing strategies in past searches are likely to continue using those strategies for future searches. Evidence from post‐event evaluations, search surveys, and the external evaluator, suggests that the most effective strategy for improving how UNL conducts effective faculty recruitment is to use multiple modes of communication targeted particularly
88

Prepared by the Advance‐NE Evaluation Team, January 2012
toward department chairs and members of search committees, and to also engage all faculty members in participation in continuous long‐range efforts to recruit faculty.
Recommendation3:Continuecommitmenttodualcareerhiringbymaintainingadesignatedprogramandpromotingapositivedualcareerculture.
Focus groups conducted with search committee chairs and conversations with department chairs identified dual careers as the number one barrier in hiring, primarily due to difficulty with the timing and uncertainty of the process of facilitating dual career hires. The ADVANCE‐Nebraska office has successfully addressed these issues for STEM hires as noted by the NSF third year ADVANCE‐Nebraska site visit report. According to survey data, half of UNL STEM departments view dual career hires as a burden; however, past positive dual career experiences make department members more likely to see dual career hiring as an opportunity. Evidence from focus groups, surveys, and successes from the current dual career program suggests that the continued commitment to dual career hiring should include the following elements: 1) a designated office with responsibility to contact candidates directly and facilitate communication of dual career opportunities to reduce the burden on departments, 2) contact with candidates should begin immediately after short lists are finalized to allow adequate time for the possibility of a successful dual career hire, and 3) past dual career hire successes should be highlighted to both job applicants and current faculty to establish a culture committed to supporting dual career couples at UNL.
Creatingaculturethatsupportsadiverse,excellentfaculty
Recommendation4:Offeron‐goingprofessionaldevelopmentfocusedoncareerstageneeds.
The UNL network and climate study reveals that UNL STEM women at all ranks have lower climate satisfaction, smaller networks, and are more likely to want to leave UNL than STEM men, with tenured women being the least satisfied and most likely to leave. Providing professional development sensitive to gender issues and focused on career‐stage needs will result in faculty that are more productive and have more organizational commitment (Gappa, Austin and Trice, 2007). In event evaluations, half of professional development participants said that they met a colleague with whom they will develop a closer professional relationship. The UNL network and climate study shows that establishing more professional relationships among faculty leads to greater collegiality, consensus of department culture, and more research collaborations. Faculty connections are also important to retention.
Recommendation5:Offeron‐goingleadershipdevelopment.
Evidence from UNL institutional data, surveys, and reviews of published research on higher education demonstrates the need for and usefulness of leadership development targeting deans, chairs, and tenured faculty. Institutional data shows the need for ongoing leadership development because turnover occurs frequently in leadership positions. The small number of women in STEM departments in leadership positions suggests particular attention needs to be paid to this group. Leadership development allows faculty to explore career options and
89
Prepared by the Advance‐NE Evaluation Team, January 2012
provides the university more faculty to draw upon to fill leadership roles (Gappa, Austin and Trice (2007).
Recommendation6:Promoteregularsocialeventsandsocialspacesoncampus.
According to the UNL network and climate study, faculty with more social connections have higher climate satisfaction and are more likely to want to remain at UNL. Surveys show that the vast majority of department chairs recognize this need and feel that their departments should do more to foster social connections. To fully address the development of social connections on campus, social events should be offered at the university level and departments should be provided guidance on how to incorporate social events and spaces within their departments.
90
Appendix C, continued: Bridge Period Recommendations
Prepared by the Advance‐NE Evaluation Team, January 2012
ADVANCE‐Nebraska Bridge Period February 2012‐August 2013
The following timeline outlines suggested activities for the remaining period of ADVANCE‐Nebraska NSF funding, organized in reference to the six major recommendations listed above. It is imperative that all planning within the ADVANCE‐Nebraska Program be done in connection with the SVCAA Office to bridge the institutionalization of initiatives. A cohesive set of initiatives needs to be formalized as part of regular business operations (institutionalized). We recommend discussions with relevant University actors to create a clear plan and branding for post ADVANCE‐Nebraska faculty professional development. To truly have an impact on the University, it is important to plan for the expansion of efforts beyond STEM departments.
Programmingalreadyplannedandinprocess Host a Celebration event to commend ADVANCE‐Nebraska achievements and provide an
opportunity for networking among faculty. (Social Event) February 2012
Offer a mentoring workshop to enhance the skills of chairs and tenured faculty. (Leadership Development) March 2012
Sponsor the UNL Writing Retreat. (Professional Development) May 2012
Promote the Elsevier funded CIC Writing Retreat. (Professional Development) June 2012
Offer a symposium to share results from the UNL network and climate study to administrators and faculty. (Share data) September 2012
Repeat the UNL network and climate survey. (Evaluation) March 2013
Suggestedprogramming Continue to institutionalize the University’s commitment to a dual career program that
supports strategic efforts to explore and, when possible, implement dual career opportunities. (Dual Career)
Charge ADVANCE‐Nebraska faculty committee to suggest ideas for future professional development specific to career stages. (Professional Development) Spring 2012
Establish a group, representing all faculty at UNL, to plan a Leadership Development Program. A needs assessment should be included as part of the group’s efforts. The program should target deans, chairs, and tenured faculty. (Leadership Development) Spring 2012
Conduct focus groups with associate and full professor STEM women about climate, leadership, and other related issues to frame program planning. (Professional Development) Spring 2012
Offer professional development events for faculty at all career stages. Suggested events include initiating bi‐monthly informal lunches, inviting external speakers such as Scott Page, author of “The Difference: How the Power of Diversity Creates Better Groups, Firms, Schools, and Societies,” or an acting group such as the Cornell Players or similar troupes from Missouri, Michigan, or Utah to address climate and culture issues. (Professional Development) Spring 2012, Fall 2012, Spring 2013
Promote social events and spaces by hosting university‐wide events, encouraging departments to host events and create social spaces, and highlight department social events in the “e‐news” or other university communications. (Social Events) Spring 2012, Fall 2012, Spring 2013
Offer a workshop on effective recruitment practices for chairs and search committees based on ADVANCE‐Nebraska faculty committee materials. (Recruitment) Fall 2012
91

ADVANCE‐Nebraska Bridge Period February 2012‐August 2013
Prepared by the Advance‐NE Evaluation Team, January 2012
Share and discuss institutional and comparison data with department chairs. (Share Data) Spring 2013
Sponsor the UNL Writing Retreat. (Professional Development) Summer 2013
92

UNL STEM Data Sheet
UNL STEM Over Time Figure 1.
Figure 1 shows the percentage of women in STEM applicant pools for the 22 departments who filled an assistant professor position between 2005 and 2011 per PeopleAdmin as of Sept 15, 2011 (data is not available before 2005). Searches for non-tenure faculty, or searches for individuals above the assistant professor level are excluded, as well as closed searches and searches that remain open. In general, the percentage of women in the assistant professor filled applicant pool has increased positively from 2005 to 2011. Figure 2.
Figure 2 shows the proportion of STEM tenured/tenure-track women in all 26 STEM Departments from 2005 to 2011. There is a modest increase between 2006-2007 and 2007-2008, but the representation of women in STEM at UNL has changed little since 2005.
93
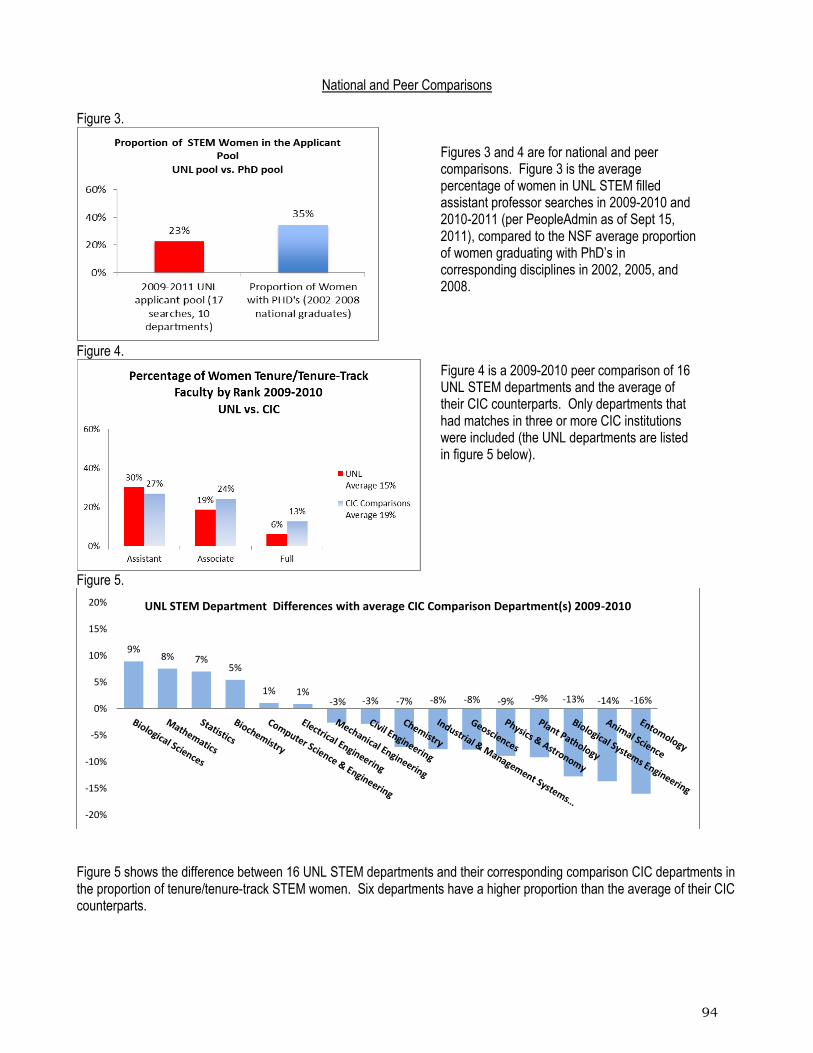
National and Peer Comparisons Figure 3.
Figure 4.
Figures 3 and 4 are for national and peer comparisons. Figure 3 is the average percentage of women in UNL STEM filled assistant professor searches in 2009-2010 and 2010-2011 (per PeopleAdmin as of Sept 15, 2011), compared to the NSF average proportion of women graduating with PhD’s in corresponding disciplines in 2002, 2005, and 2008. Figure 4 is a 2009-2010 peer comparison of 16 UNL STEM departments and the average of their CIC counterparts. Only departments that had matches in three or more CIC institutions were included (the UNL departments are listed in figure 5 below).
Figure 5.
Figure 5 shows the difference between 16 UNL STEM departments and their corresponding comparison CIC departments in the proportion of tenure/tenure-track STEM women. Six departments have a higher proportion than the average of their CIC counterparts.
9% 8% 7%
5%
1% 1% -3% -3% -7% -8% -8% -9% -9% -13% -14% -16%
-20%
-15%
-10%
-5%
0%
5%
10%
15%
20% UNL STEM Department Differences with average CIC Comparison Department(s) 2009-2010
94

UNL STEM Dual Career Data UNL Dual Career Process Figures 6 and 7 show the outcomes of the 66 STEM searches from 2008-2010.,The ADVANCE-Nebraska office received the names of short list candidates for a subset of 39 searches, and sent letters to the corresponding 153 short list candidates. Within the 16 searches where a dual career opportunity was identified, 12 of the candidates who received an offer had dual career spouses. ADVANCE-Nebraska assisted with interviewing six of the candidates. Four of the six couples accepted the offers. Figure 7 shows that twenty-five people in 16 searches had a dual career opportunity, or 16% of all people contacted on the shortlist (N=153) and 41% of all searches (N=39). Of the searches with any dual career opportunity, 50% (N=8) had more than one candidate with a dual career spouse. The process has evolved over time and currently the EAD office sends all approved short lists to the ADVANCE-Nebraska office, and after verifying the names with search committee chairs, a letter is sent notifying the candidates of the dual career program. Figure 6. Figure 7.
As awareness of the dual career program increased, male faculty members already at UNL contacted the ADVANCE-Nebraska office with potential STEM women dual career opportunities. This resulted in three new STEM women hires at UNL. There were an additional nine dual career retention opportunities identified among current STEM women faculty at UNL, generally among assistant professors hired just prior to the start of ADVANCE Nebraska. Of the nine opportunities to retain STEM women by hiring their partners, three were successful. Including dual career hires from new searches and those aimed at retaining faculty already here, there have been 10 dual career hires total since the inception of ADVANCE-Nebraska, 8 are still at UNL as of Fall 2011. STEM Dual Career Potential According to the UNL Faculty Networks survey, approximately 91% of STEM faculty at UNL identify as having a spouse or partner. Fifty nine percent of those have a partner that either has, or is working on, an advanced degree (PhD or Masters) or professional degree (JD, MD, etc.). Figure 8.
Although STEM men faculty are much more likely than women faculty to have a partner or spouse (95% vs. 84%, p,>.01), Figure 8 shows that STEM women faculty at UNL are much more likely than men faculty to have a partner who has or is seeking an advanced or professional degree (75% vs. 56%, p<.01). In comparison, we find no difference between non-STEM men and women faculty at UNL in the proportion with a partner or spouse having or seeking an advanced degree (66% versus 66%, p=.539).
56% 64%
75%
64%
0%
20%
40%
60%
80%
STEM* Non-STEM
Percent Partnered Faculty with Potential Dual Career Opportunity by Gender
STEM vs. Non-STEM
Men
Women
95

UNL STEM Climate Data
Figure 9.
We created a scale that summarizes faculty views of their department’s climate. Figure 9 shows the scale mean scores for UNL STEM faculty by gender and rank. At all ranks men have higher average climate scores than women, but the difference is largest among full professors. The Positive Department Climate Scale was created by averaging responses to five variables ranging from 1 to 5 (5=strong agreement). The following items comprise the scale: a) “Faculty in my department are supportive,” b) “Faculty in my department enjoy working together” c) “Faculty in my department spend time getting to know one another,” d) “Faculty in my department are sometimes rude to one another,” e) “Tension among faculty in my department make it uncomfortable working here.”
We used several variables from the climate survey to measure the desire to stay at UNL. Mean scores by gender and rank are provided in Figure 10. Similar to the climate scale, mean scores for men are higher than for women at all ranks, but the difference is largest among full professors. The Stay at UNL scale is comprised of four variables that ask faculty about agreement or disagreement with the following statements on a scale from 1 to 5 (5=strong agreement): “I would be happy to spend the rest of my career in this department,” b) “It would take a lot to get me to leave this department,” c) “I have seriously considered leaving this department,” d) “If I could leave this department right now, I would.”
Figure 10.
Figure 11.
Figure 11 shows the response of UNL STEM men and women faculty to the question: “To what extent, if at all, have you considered the following reasons to leave UNL . . .”. Results are the proportion of respondents who said they considered a reason for leaving either ‘to some extent’ or ‘to a great extent’. On average, men were more likely than women to consider leaving UNL due to retirement, but women were more likely than men to consider leaving UNL to find a more supportive work environment, to increase time for research, to move closer to family, or to improve a partner’s employment. There were no significant gender differences on considering to leave UNL based on improving salary, tenure and promotion, non-academic jobs, work family balance or seeking out to live in a different area of the country.
4.12
3.53
3.89
3.62
4.37
4.19
1.0 2.0 3.0 4.0 5.0
Full Men (N=202)
Full Women (N=15)
Associate Men (N=69)
Associate Women (N=26)
Assistant Men (N=71)
Assistant Women (N=31)
UNL STEM Positive Department Climate by Rank and Gender 2011
4.29
3.25
3.78
3.59
4.53
4.18
1.0 2.0 3.0 4.0 5.0
Full Men (N=199)
Full Women (N=15)
Associate Men (N=69)
Associate Women (N=26)
Assistant Men (N=69)
Assistant Women (N=30)
UNL STEM Want to Stay at UNL by Rank and Gender 2011
0% 20% 40% 60% 80%
Different Area of Country
Work Family Balance
Partner's Job*
Move Closer to Family*
Non-Academic Job
Increase Reaserch Time*
More Supportive Work Environment*
Improve Tenure/Promotion Prospects
Increase Salary
Retire*
UNL STEM Response: "To what extent, if at all, have you considered the following reasons to leave UNL" by Gender
96

COLLEGE OF ARTS & SCIENCES
THE PERCENTAGE OF WOMEN COMPARED TO NATIONAL AND PEER DATA APPLICANT POOL AND FACULTY POOL
Figure 1 . Figure 2.
Figures 1 and 2 are for national and peer comparisons. Figure 1 is the average percentage of women in UNL STEM filled assistant professor searches in 2009-2010 and 2010-2011 (per PeopleAdmin as of Sept 15, 2011), compared to the NSF average proportion of women graduating with PhD’s in corresponding disciplines in 2002, 2005, and 2008. The proportion of PhD’s varies across years because it only includes the disciplines equivalent to the UNL departments with a search that year to provide the most accurate comparisons. Figure 2 is a 2009-2010 peer comparison of UNL A&S departments and the average of their CIC counterparts. Only departments that had matches in three or more CIC institutions were included, or all seven STEM departments in the College of Arts and Sciences (Biological Sciences, Chemistry, Earth and Atmospheric Sciences, Mathematics, Physics and Astronomy and Statistics).
CHANGE OVER TIME IN THE PROP0RTION OF WOMEN 2005-2011 APPLICANT POOL AND FACULTY POOL
Figure 3 . Figure 4.
Figures 3 and 4 are the college’s data over time, pre- and post-ADVANCE. The percentages in figure 3 are the percent women in the applicant pool for filled assistant professor positions (per PeopleAdmin as of Sept 15, 2011) averaged for all searches between 2005-2008 and 2009-2011. Table 4 is the average percent of tenured/tenure-track women faculty in the college averaged over the same 3 years, pre- and post-ADVANCE.
14% 19%
28% 33%
0%
20%
40%
60%
2009-2010 3 Departments
2010-2011 1 Department
Percentage of STEM Women in the Applicant Pool - UNL vs. NSF PhD
Most Recent Filled Assistant Professor Search
NSF Proportion of Women with PHD's (2002-2008 average)
38%
23%
9%
31% 24%
11%
0%
20%
40%
60%
Assistant Associate Full
Percentage of Women Tenure/Tenure-Track Faculty by Rank 2009-2010
UNL vs. CIC
UNL - STEM A&S - Average 19%
CIC Comparison - Average 19%
17% 20%
0%
20%
40%
60%
Pre-ADVANCE 2005-2008 (15 searches)
Post-ADVANCE 2009-2011 (10 searches)
Percentage of Women in the Filled Assistant Professor Applicant Pool
Average
16% 18%
0%
20%
40%
60%
X=4 Pre-ADVANCE 2005-2008
X=5 Post-ADVANCE 2009-2011
Percentage of Women Tenure/Tenure-Track Faculty Average
97

UNL STATISTICS DATA SHEET
THE PERCENTAGE OF WOMEN COMPARED TO NATIONAL AND PEER DATA
Figure 1 Figure 2
Figures1 and 2 are for national and peer comparisons. Figure 1 is the average percentage of women in the department’s filled assistant professor search from the most recent year for which data are available, compared to the NSF average proportion of women graduating with PhD’s in corresponding disciplines in 2002, 2005, and 2008. The following are the NSF PhD disciplines used for comparison purposes, along with their 2008 percentages (unless otherwise noted): Biometrics/biostatistics (65.3%), Mathematical Statistics (46.5%), Statistics (54.5% in 2005). Figure 2 is a 2009-2010 peer comparison with the average of the following departments from ten CIC institutions: Statistics, Biostatistics.
CHANGE OVER TIME IN THE PERCENTAGE OF WOMEN 2005-2011, APPLICANT POOL AND FACULTY POOL
Figure 3 Figure 4
Figures 3 and 4 are the department’s data over time, pre- and post-ADVANCE. The percentages in figure 3 are the percent women in the applicant pool for filled assistant professor positions (per PeopleAdmin as of Sept 15, 2011) averaged for all searches between 2005-2008 and 2009-2011. Figure 4 is the average percent of tenured/tenure-track women faculty in the department averaged over the same 3 years, pre- and post-ADVANCE.
28%
50%
0%
20%
40%
60%
Most Recent Filled Assistant Professor
Search Year 2006-2007
NSF Proportion of Women with PHD's
(2002-2008 average)
Percentage of Women in the Applicant Pool - UNL vs. NSF PhD
67%
50%
13%
34% 39%
11%
0%
20%
40%
60%
80%
Assistant Associate Full
Percentage of Women Tenure/Tenure-Track Faculty by Rank 2009-2010
UNL vs. CIC
UNL Statistics - Average 30% CIC Comparison - Average 24%
98

UNL PHYSICS & ASTRONOMY DATA SHEET
THE PERCENTAGE OF WOMEN COMPARED TO NATIONAL AND PEER DATA
Figure 1 Figure 2
Figures1 and 2 are for national and peer comparisons. Figure 1 is the average percentage of women in the department’s filled assistant professor search from the most recent year for which data are available, compared to the NSF average proportion of women graduating with PhD’s in corresponding disciplines in 2002, 2005, and 2008. The following are the NSF PhD disciplines used for comparison purposes, along with their 2008 percentages (unless otherwise noted): Astronomy (25.0%), Physics (18.5%). Figure 2 is a 2009-2010 peer comparison with the average of the following departments from ten CIC institutions: Physics, Astronomy, Materials Science, Materials Engineering, Elementary Particle Physics, Engineering Physics/Applied Physics, Physical Sciences, Astrophysics.
CHANGE OVER TIME IN THE PERCENTAGE OF WOMEN 2005-2011, APPLICANT POOL AND FACULTY POOL
Figure 3 Figure 4
Figures 3 and 4 are the department’s data over time, pre- and post-ADVANCE. The percentages in figure 3 are the percent women in the applicant pool for filled assistant professor positions (per PeopleAdmin as of Sept 15, 2011) averaged for all searches between 2005-2008 and 2009-2011. Figure 4 is the average percent of tenured/tenure-track women faculty in the department averaged over the same 3 years, pre- and post-ADVANCE.
7% 20%
0%
20%
40%
60%
Most Recent Filled Assistant Professor
Search Year 2009-2010
NSF Proportion of Women with PHD's
(2002-2008 average)
Percentage of Women in the Applicant Pool - UNL vs. NSF PhD
0%
14%
0%
26%
13% 10%
0%
20%
40%
60%
Assistant Associate Full
Percentage of Women Tenure/Tenure-Track Faculty by Rank 2009-2010
UNL vs. CIC
UNL Physics and Astronomy - Average 4%
CIC Comparison - Average 13%
8% 8%
0%
20%
40%
60%
1 search Pre-ADVANCE 2005-2008
2 searches Post-ADVANCE 2009-2011
Percentage of Women in the Filled Assistant Professor Applicant Pool Average
9% 4%
0%
20%
40%
60%
X=2 Pre-ADVANCE 2005-2008
X=1 Post-ADVANCE 2009-2011
Percentage of Women Tenure/Tenure-Track Faculty Average
99

UNL MATHEMATICS DATA SHEET
THE PERCENTAGE OF WOMEN COMPARED TO NATIONAL AND PEER DATA
Figure 1 Figure 2
Figures1 and 2 are for national and peer comparisons. Figure 1 is the average percentage of women in the department’s filled assistant professor search from the most recent year for which data are available, compared to the NSF average proportion of women graduating with PhD’s in corresponding disciplines in 2002, 2005, and 2008. The following are the NSF PhD disciplines used for comparison purposes, along with their 2008 percentages (unless otherwise noted): Mathematics (30.9%). Figure 2 is a 2009-2010 peer comparison with the average of the following departments from ten CIC institutions: Mathematics.
CHANGE OVER TIME IN THE PERCENTAGE OF WOMEN 2005-2011, APPLICANT POOL AND FACULTY POOL
Figure 3 Figure 4
Figures 3 and 4 are the department’s data over time, pre- and post-ADVANCE. The percentages in figure 3 are the percent women in the applicant pool for filled assistant professor positions (per PeopleAdmin as of Sept 15, 2011) averaged for all searches between 2005-2008 and 2009-2011. Figure 4 is the average percent of tenured/tenure-track women faculty in the department averaged over the same 3 years, pre- and post-ADVANCE.
21% 29%
0%
20%
40%
60%
Most Recent Filled Assistant Professor
Search Year 2009-2010
NSF Proportion of Women with PHD's
(2002-2008 average)
Percentage of Women in the Applicant Pool - UNL vs. NSF PhD
60%
13% 13% 25%
16% 7%
0%
20%
40%
60%
80%
Assistant Associate Full
Percentage of Women Tenure/Tenure-Track Faculty by Rank 2009-2010
UNL vs. CIC
UNL Mathematics - Average 19%
CIC Comparison - Average 11%
23% 21%
0%
20%
40%
60%
1 search Pre-ADVANCE 2005-2008
2 searches Post-ADVANCE 2009-2011
Percentage of Women in the Filled Assistant Professor Applicant Pool Average
15% 18%
0%
20%
40%
60%
X=5 Pre-ADVANCE 2005-2008
X=7 Post-ADVANCE 2009-2011
Percentage of Women Tenure/Tenure-Track Faculty Average
100
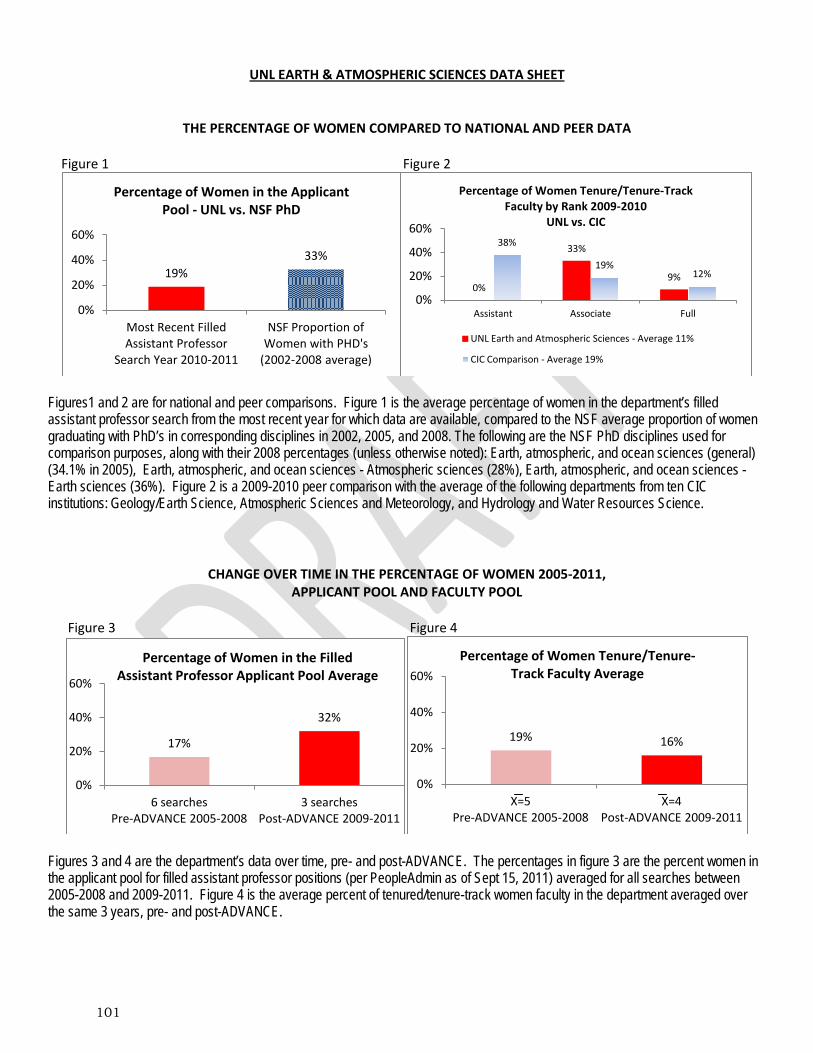
UNL EARTH & ATMOSPHERIC SCIENCES DATA SHEET
THE PERCENTAGE OF WOMEN COMPARED TO NATIONAL AND PEER DATA
Figure 1 Figure 2
Figures1 and 2 are for national and peer comparisons. Figure 1 is the average percentage of women in the department’s filled assistant professor search from the most recent year for which data are available, compared to the NSF average proportion of women graduating with PhD’s in corresponding disciplines in 2002, 2005, and 2008. The following are the NSF PhD disciplines used for comparison purposes, along with their 2008 percentages (unless otherwise noted): Earth, atmospheric, and ocean sciences (general) (34.1% in 2005), Earth, atmospheric, and ocean sciences - Atmospheric sciences (28%), Earth, atmospheric, and ocean sciences - Earth sciences (36%). Figure 2 is a 2009-2010 peer comparison with the average of the following departments from ten CIC institutions: Geology/Earth Science, Atmospheric Sciences and Meteorology, and Hydrology and Water Resources Science.
CHANGE OVER TIME IN THE PERCENTAGE OF WOMEN 2005-2011, APPLICANT POOL AND FACULTY POOL
Figure 3 Figure 4
Figures 3 and 4 are the department’s data over time, pre- and post-ADVANCE. The percentages in figure 3 are the percent women in the applicant pool for filled assistant professor positions (per PeopleAdmin as of Sept 15, 2011) averaged for all searches between 2005-2008 and 2009-2011. Figure 4 is the average percent of tenured/tenure-track women faculty in the department averaged over the same 3 years, pre- and post-ADVANCE.
19% 33%
0%
20%
40%
60%
Most Recent Filled Assistant Professor
Search Year 2010-2011
NSF Proportion of Women with PHD's
(2002-2008 average)
Percentage of Women in the Applicant Pool - UNL vs. NSF PhD
0%
33%
9%
38%
19% 12%
0%
20%
40%
60%
Assistant Associate Full
Percentage of Women Tenure/Tenure-Track Faculty by Rank 2009-2010
UNL vs. CIC
UNL Earth and Atmospheric Sciences - Average 11%
CIC Comparison - Average 19%
17%
32%
0%
20%
40%
60%
6 searches Pre-ADVANCE 2005-2008
3 searches Post-ADVANCE 2009-2011
Percentage of Women in the Filled Assistant Professor Applicant Pool Average
19% 16%
0%
20%
40%
60%
X=5 Pre-ADVANCE 2005-2008
X=4 Post-ADVANCE 2009-2011
Percentage of Women Tenure/Tenure-Track Faculty Average
101

Contact ADVANCE-NE evaluation team Trish Hill [email protected] or Mindy Anderson-Knott [email protected] for questions.
UNL COMPUTER SCIENCE & ENGINEERING DATA SHEET
THE PERCENTAGE OF WOMEN COMPARED TO NATIONAL AND PEER DATA
Figure 1 Figure 2
Figures1 and 2 are for national and peer comparisons. Figure 1 is the average percentage of women in the department’s filled assistant professor search from the most recent year for which data are available, compared to the NSF average proportion of women graduating with PhD’s in corresponding disciplines in 2002, 2005, and 2008. The following are the NSF PhD disciplines used for comparison purposes, along with their 2008 percentages (unless otherwise noted): Computer Sciences (22.4%). Figure 2 is a 2009-2010 peer comparison with the average of the following departments from ten CIC institutions: Information Science/Studies, Computer and Information Sciences, Computer Science, Computer Engineering.
CHANGE OVER TIME IN THE PERCENTAGE OF WOMEN 2005-2011, APPLICANT POOL AND FACULTY POOL
Figure 3 Figure 4
Figures 3 and 4 are the department’s data over time, pre- and post-ADVANCE. The percentages in figure 3 are the percent of women in the applicant pool for filled assistant professor positions (per PeopleAdmin as of Sept 15, 2011) averaged for all searches between 2005-2008 and 2009-2011. Figure 4 is the average percent of tenured/tenure-track women faculty in the department averaged over the same 3 years, pre- and post-ADVANCE.
20% 21%
0%
20%
40%
60%
Most Recent Filled Assistant Professor
Search Year 2008-2009
NSF Proportion of Women with PHD's
(2002-2008 average)
Percentage of Women in the Applicant Pool - UNL vs. NSF PhD
60%
14%
0%
28% 14% 11%
0%
20%
40%
60%
80%
Assistant Associate Full
Percentage of Women Tenure/Tenure-Track Faculty by Rank 2009-2010
UNL vs. CIC
UNL Computer Science and Engineering - Average 18%
CIC Comparison - Average 17%
14% 20%
0%
20%
40%
60%
2 searches Pre-ADVANCE 2005-2008
1 search Post-ADVANCE 2009-2011
Percentage of Women in the Filled Assistant Professor Applicant Pool Average
13% 16%
0%
20%
40%
60%
X=3 Pre-ADVANCE 2005-2008
X=4 Post-ADVANCE 2009-2011
Percentage of Women Tenure/Tenure-Track Faculty Average
102

UNL CHEMISTRY DATA SHEET
THE PERCENTAGE OF WOMEN COMPARED TO NATIONAL AND PEER DATA
Figure 1 Figure 2
Figures1 and 2 are for national and peer comparisons. Figure 1 is the average percentage of women in the department’s filled assistant professor search from the most recent year for which data are available, compared to the NSF average proportion of women graduating with PhD’s in corresponding disciplines in 2002, 2005, and 2008. The following are the NSF PhD disciplines used for comparison purposes, along with their 2008 percentages (unless otherwise noted): Chemistry (34.2%). Figure 2 is a 2009-2010 peer comparison with the average of the following departments from ten CIC institutions.
CHANGE OVER TIME IN THE PERCENTAGE OF WOMEN 2005-2011, APPLICANT POOL AND FACULTY POOL
Figure 3
Figure 3 is the average percent of tenured/tenure-track women faculty in the department averaged over the same 3 years, pre- and post-ADVANCE.
13%
34%
0%
20%
40%
60%
Most Recent Filled Assistant Professor
Search Year 2009-2010
NSF Proportion of Women with PHD's
(2002-2008 average)
Percentage of Women in the Applicant Pool - UNL vs. NSF PhD
25%
0% 8%
25% 28%
12%
0%
20%
40%
60%
Assistant Associate Full
Percentage of Women Tenure/Tenure-Track Faculty by Rank 2009-2010
UNL vs. CIC
UNL Chemistry - Average 10%
CIC Comparison - Average 17%
6% 10%
0%
20%
40%
60%
X=1 Pre-ADVANCE 2005-2008
X=2 Post-ADVANCE 2009-2011
Percentage of Women Tenure/Tenure-Track Faculty Average
103

COLLEGE OF ENGINEERING
THE PERCENTAGE OF WOMEN COMPARED TO NATIONAL AND PEER DATA APPLICANT POOL AND FACULTY POOL
Figure 1 . Figure 2.
Figures 1 and 2 are for national and peer comparisons. Figure 1 is the average percentage of women in UNL STEM filled assistant professor searches in 2007-2008 and 2008-2009 (per PeopleAdmin as of Sept 15, 2011), compared to the NSF average proportion of women graduating with PhD’s in corresponding disciplines in 2002, 2005, and 2008. The proportion of PhD’s varies across years because it only includes the disciplines equivalent to the UNL departments with a search that year to provide the most accurate comparisons. Figure 2 is a 2009-2010 peer comparison of UNL COE departments and the average of their CIC counterparts. Only departments that had matches in three or more CIC institutions were included, which is limited to 4 departments (Civil Engineering, Electrical Engineering, Industrial and Management Systems Engineering, and Mechanical Engineering).
CHANGE OVER TIME IN THE PROP0RTION OF WOMEN 2005-2011, APPLICANT POOL AND FACULTY POOL
Figure 3. Figure 4.
Figures 3 and 4 are the college’s data over time, pre- and post-ADVANCE. The percentages in figure 3 are the percent women in the applicant pool for filled assistant professor positions (per PeopleAdmin as of Sept 15, 2011) averaged for all searches between 2005-2008 and 2009-2011. Table 4 is the average percent of tenured/tenure-track women faculty in the college averaged over the same 3 years, pre- and post-ADVANCE.
11% 12% 16% 19%
0%
20%
40%
60%
2007-2008 2 Departments
2008-2009 2 Departments
Percentage of STEM Women in the Applicant Pool - UNL vs. NSF PhD
Recently Filled Assistant Professor Searches
NSF Proportion of Women with PHD's (2002-2008 average)
27%
4% 3%
21% 16%
8%
0%
20%
40%
60%
Assistant Associate Full
Percentage of Women Tenure/Tenure-Track Faculty by Rank 2009-2010
UNL vs. CIC
UNL - College of Engineering - Average 10%
CIC Comparison - Average 13%
14% 12%
0%
20%
40%
60%
Pre-ADVANCE 2005-2008 (5 searches)
Post-ADVANCE 2009-2011 (2 seraches)
Percentage of Women in the Filled Assistant Professor Applicant Pool
Average
9% 11%
0%
20%
40%
60%
X=1 Pre-ADVANCE 2005-2008
X=1 Post-ADVANCE 2009-2011
Percentage of Women Tenure/Tenure-Track Faculty Average
104
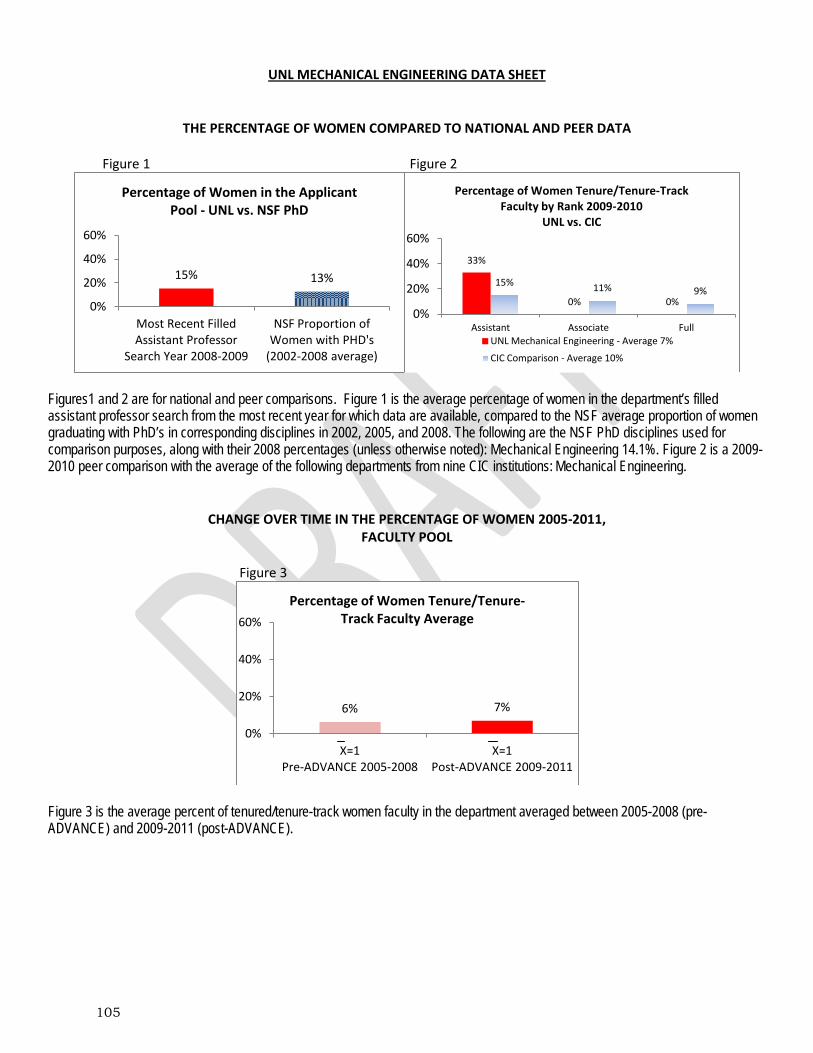
UNL MECHANICAL ENGINEERING DATA SHEET
THE PERCENTAGE OF WOMEN COMPARED TO NATIONAL AND PEER DATA
Figure 1 Figure 2
Figures1 and 2 are for national and peer comparisons. Figure 1 is the average percentage of women in the department’s filled assistant professor search from the most recent year for which data are available, compared to the NSF average proportion of women graduating with PhD’s in corresponding disciplines in 2002, 2005, and 2008. The following are the NSF PhD disciplines used for comparison purposes, along with their 2008 percentages (unless otherwise noted): Mechanical Engineering 14.1%. Figure 2 is a 2009-2010 peer comparison with the average of the following departments from nine CIC institutions: Mechanical Engineering.
CHANGE OVER TIME IN THE PERCENTAGE OF WOMEN 2005-2011, FACULTY POOL
Figure 3
Figure 3 is the average percent of tenured/tenure-track women faculty in the department averaged between 2005-2008 (pre-ADVANCE) and 2009-2011 (post-ADVANCE).
15% 13%
0%
20%
40%
60%
Most Recent Filled Assistant Professor
Search Year 2008-2009
NSF Proportion of Women with PHD's
(2002-2008 average)
Percentage of Women in the Applicant Pool - UNL vs. NSF PhD
33%
0% 0%
15% 11% 9%
0%
20%
40%
60%
Assistant Associate Full
Percentage of Women Tenure/Tenure-Track Faculty by Rank 2009-2010
UNL vs. CIC
UNL Mechanical Engineering - Average 7%
CIC Comparison - Average 10%
6% 7%
0%
20%
40%
60%
X=1 Pre-ADVANCE 2005-2008
X=1 Post-ADVANCE 2009-2011
Percentage of Women Tenure/Tenure-Track Faculty Average
105

UNL INDUSTRIAL AND MANAGEMENT SYSTEMS ENGINEERING DATA SHEET
THE PERCENTAGE OF WOMEN COMPARED TO NATIONAL AND PEER DATA
Figure 1 Figure 2
Figures1 and 2 are for national and peer comparisons. Figure 1 is the average percentage of women in the department’s filled assistant professor search from the most recent year for which data are available, compared to the NSF average proportion of women graduating with PhD’s in corresponding disciplines in 2002, 2005, and 2008. The following are the NSF PhD disciplines used for comparison purposes, along with their 2008 percentages (unless otherwise noted): Industrial/Manufacturing Engineering (28.5%). Figure 2 is a 2009-2010 peer comparison with the average of the following departments from seven CIC institutions: Industrial Engineering, Engineering, Industrial Technology/Technician.
CHANGE OVER TIME IN THE PERCENTAGE OF WOMEN 2005-2011, FACULTY POOL
Figure 3
Figure 3 is the average percent of tenured/tenure-track women faculty in the department averaged between 2005-2008 (pre-ADVANCE) and 2009-2011 (post-ADVANCE).
25%
0%
20%
40%
60%
Most Recent Filled Assistant Professor
Search
NSF Proportion of Women with PHD's
(2002-2008 average)
Percentage of Women in the Applicant Pool - UNL vs. NSF PhD
No Data 0% 0%
13% 23% 24%
11%
0%
20%
40%
60%
Assistant Associate Full
Percentage of Women Tenure/Tenure-Track Faculty by Rank 2009-2010
UNL vs. CIC
UNL Industrial and Systems Management - Average 9%
CIC Comparison - Average 17%
18% 9%
0%
20%
40%
60%
X=2 Pre-ADVANCE 2005-2008
X=1 Post-ADVANCE 2009-2011
Percentage of Women Tenure/Tenure-Track Faculty Average
106

UNL ENGINEERING MECHANICS DATA SHEET
THE PERCENTAGE OF WOMEN COMPARED TO NATIONAL DATA
Figure 1
Figure 1 is the average percentage of women in the department’s filled assistant professor search from the most recent year for which data are available, compared to the NSF average proportion of women graduating with PhD’s in corresponding disciplines in 2002, 2005, and 2008. The following are the NSF PhD disciplines used for comparison purposes, along with their 2008 percentages (unless otherwise noted): Engineering Mechanics (7% in 2005).
CHANGE OVER TIME IN THE PERCENTAGE OF WOMEN 2005-2011, FACULTY POOL
Figure 2
Figure 2 is the average percent of tenured/tenure-track women faculty in the department averaged between 2005-2008 (pre-ADVANCE) and 2009-2011 (post-ADVANCE).
7% 11%
0%
20%
40%
60%
Most Recent Filled Assistant Professor
Search Year 2007-2008
NSF Proportion of Women with PHD's
(2002-2008 average)
Percentage of Women in the Applicant Pool - UNL vs. NSF PhD
12% 11%
0%
20%
40%
60%
X=1 Pre-ADVANCE 2005-2008
X=1 Post-ADVANCE 2009-2011
Percentage of Women Tenure/Tenure-Track Faculty Average
107

UNL ELECTRICAL ENGINEERING DATA SHEET
THE PERCENTAGE OF WOMEN COMPARED TO NATIONAL AND PEER DATA
Figure 1 Figure 2
Figures1 and 2 are for national and peer comparisons. Figure 1 is the average percentage of women in the department’s filled assistant professor search from the most recent year for which data are available, compared to the NSF average proportion of women graduating with PhD’s in corresponding disciplines in 2002, 2005, and 2008. The following are the NSF PhD disciplines used for comparison purposes, along with their 2008 percentages (unless otherwise noted): Electrical Engineering (13.4% in 2005). Figure 2 is a 2009-2010 peer comparison with the average of the following departments from nine CIC institutions: Electrical and Electronics Engineering, Electrical/Electronic and Communications Engineering Technology.
CHANGE OVER TIME IN THE PERCENTAGE OF WOMEN 2005-2011, FACULTY POOL
Figure 3
Figure 3 is the percent of tenured/tenure-track women faculty in the department averaged between 2005-2008 (pre-ADVANCE) and 2009-2011 (post-ADVANCE).
20% 13%
0%
20%
40%
60%
Most Recent Filled Assistant Professor
Search Year 2006-2007
NSF Proportion of Women with PHD's
(2002-2008 average)
Percentage of Women in the Applicant Pool - UNL vs. NSF PhD
40%
0% 0%
18% 12%
4%
0%
20%
40%
60%
Assistant Associate Full
Percentage of Women Tenure/Tenure-Track Faculty by Rank 2009-2010
UNL vs. CIC
UNL Electrical Engineering - Average 9%
CIC Comparison - Average 8%
4% 11%
0%
20%
40%
60%
X=1 Pre-ADVANCE 2005-2008
X=2 Post-ADVANCE 2009-2011
Percentage of Women Tenure/Tenure-Track Faculty Average
108

UNL CONSTRUCTION SYSTEMS DATA SHEET
THE PERCENTAGE OF WOMEN COMPARED TO NATIONAL DATA
Figure 1
Figure 1 is the average percentage of women in the department’s filled assistant professor search from the most recent year for which data are available, compared to the NSF average proportion of women graduating with PhD’s in corresponding disciplines in 2002, 2005, and 2008. The following are the NSF PhD disciplines used for comparison purposes, along with their 2008 percentages (unless otherwise noted): Civil Engineering (20.2%).
CHANGE OVER TIME IN THE PERCENTAGE OF WOMEN 2005-2011, FACULTY POOL
Figure 2
Figure 2 is the average percent of tenured/tenure-track women faculty in the department averaged between 2005-2008 (pre-ADVANCE) and 2009-2011 (post-ADVANCE).
21%
0%
20%
40%
60%
Most Recent Filled Assistant Professor
Search
NSF Proportion of Women with PHD's
(2002-2008 average)
Percentage of Women in the Applicant Pool - UNL vs. NSF PhD
No Data
3% 9%
0%
20%
40%
60%
X=0 Pre-ADVANCE 2005-2008
X=1 Post-ADVANCE 2009-2011
Percentage of Women Tenure/Tenure-Track Faculty Average
109
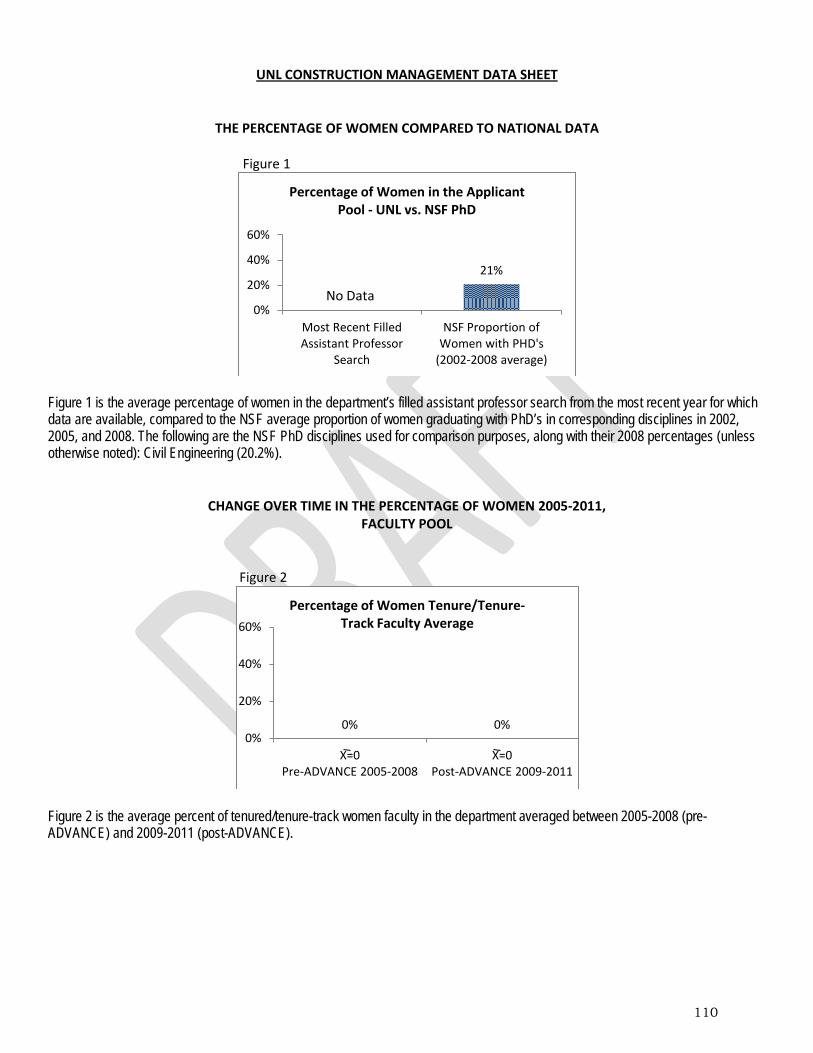
UNL CONSTRUCTION MANAGEMENT DATA SHEET
THE PERCENTAGE OF WOMEN COMPARED TO NATIONAL DATA
Figure 1
Figure 1 is the average percentage of women in the department’s filled assistant professor search from the most recent year for which data are available, compared to the NSF average proportion of women graduating with PhD’s in corresponding disciplines in 2002, 2005, and 2008. The following are the NSF PhD disciplines used for comparison purposes, along with their 2008 percentages (unless otherwise noted): Civil Engineering (20.2%).
CHANGE OVER TIME IN THE PERCENTAGE OF WOMEN 2005-2011, FACULTY POOL
Figure 2
Figure 2 is the average percent of tenured/tenure-track women faculty in the department averaged between 2005-2008 (pre-ADVANCE) and 2009-2011 (post-ADVANCE).
21%
0%
20%
40%
60%
Most Recent Filled Assistant Professor
Search
NSF Proportion of Women with PHD's
(2002-2008 average)
Percentage of Women in the Applicant Pool - UNL vs. NSF PhD
No Data
0% 0% 0%
20%
40%
60%
X=0 Pre-ADVANCE 2005-2008
X=0 Post-ADVANCE 2009-2011
Percentage of Women Tenure/Tenure-Track Faculty Average
110

UNL COMPUTER AND ELECTRONICS ENGINEERING DATA SHEET
THE PERCENTAGE OF WOMEN COMPARED TO NATIONAL DATA
Figure 1
Figure 1 is the average percentage of women in the department’s filled assistant professor search from the most recent year for which data are available, compared to the NSF average proportion of women graduating with PhD’s in corresponding disciplines in 2002, 2005, and 2008. The following are the NSF PhD disciplines used for comparison purposes, along with their 2008 percentages (unless otherwise noted): Computer Engineering (17.6%).
CHANGE OVER TIME IN THE PERCENTAGE OF WOMEN 2005-2011, FACULTY POOL
Figure 2
Figure 2 is the department’s average percentage of tenured/tenure-track women faculty averaged over time, pre- and post-ADVANCE (2005-2008 and 2009-2011 respectively).
14%
0%
20%
40%
60%
Most Recent Filled Assistant Professor
Search
NSF Proportion of Women with PHD's
(2002-2008 average)
Percentage of Women in the Applicant Pool - UNL vs. NSF PhD
No Data
10% 10%
0%
20%
40%
60%
X=1 Pre-ADVANCE 2005-2008
X=1 Post-ADVANCE 2009-2011
Percentage of Women Tenure/Tenure-Track Faculty Average
111

UNL CIVIL ENGINEERING DATA SHEET
THE PERCENTAGE OF WOMEN COMPARED TO NATIONAL AND PEER DATA
Figure 1 Figure 2
Figures1 and 2 are for national and peer comparisons. Figure 1 is the average percentage of women in the department’s filled assistant professor search from the most recent year for which data are available, compared to the NSF average proportion of women graduating with PhD’s in corresponding disciplines in 2002, 2005, and 2008. The following are the NSF PhD disciplines used for comparison purposes, along with their 2008 percentages (unless otherwise noted): Electrical Engineering (13.4% in 2005). Figure 2 is a 2009-2010 peer comparison with the average of the following departments from nine CIC institutions: Electrical and Electronics Engineering, Electrical/Electronic and Communications Engineering Technology.
CHANGE OVER TIME IN THE PERCENTAGE OF WOMEN 2005-2011, FACULTY POOL
Figure 3
Figure 3 is the percent of tenured/tenure-track women faculty in the department averaged between 2005-2008 (pre-ADVANCE) and 2009-2011 (post-ADVANCE).
15% 21%
0%
20%
40%
60%
Most Recent Filled Assistant Professor
Search Year 2007-2008
NSF Proportion of Women with PHD's
(2002-2008 average)
Percentage of Women in the Applicant Pool - UNL vs. NSF PhD
33%
14%
0%
29%
16% 10%
0%
20%
40%
60%
Assistant Associate Full
Percentage of Women Tenure/Tenure-Track Faculty by Rank 2009-2010
UNL vs. CIC
UNL Civil Engineering - Average 14% CIC Comparison - Average 16%
8% 15%
0%
20%
40%
60%
X=2 Pre-ADVANCE 2005-2008
X=3 Post-ADVANCE 2009-2011
Percentage of Women Tenure/Tenure-Track Faculty Average
112
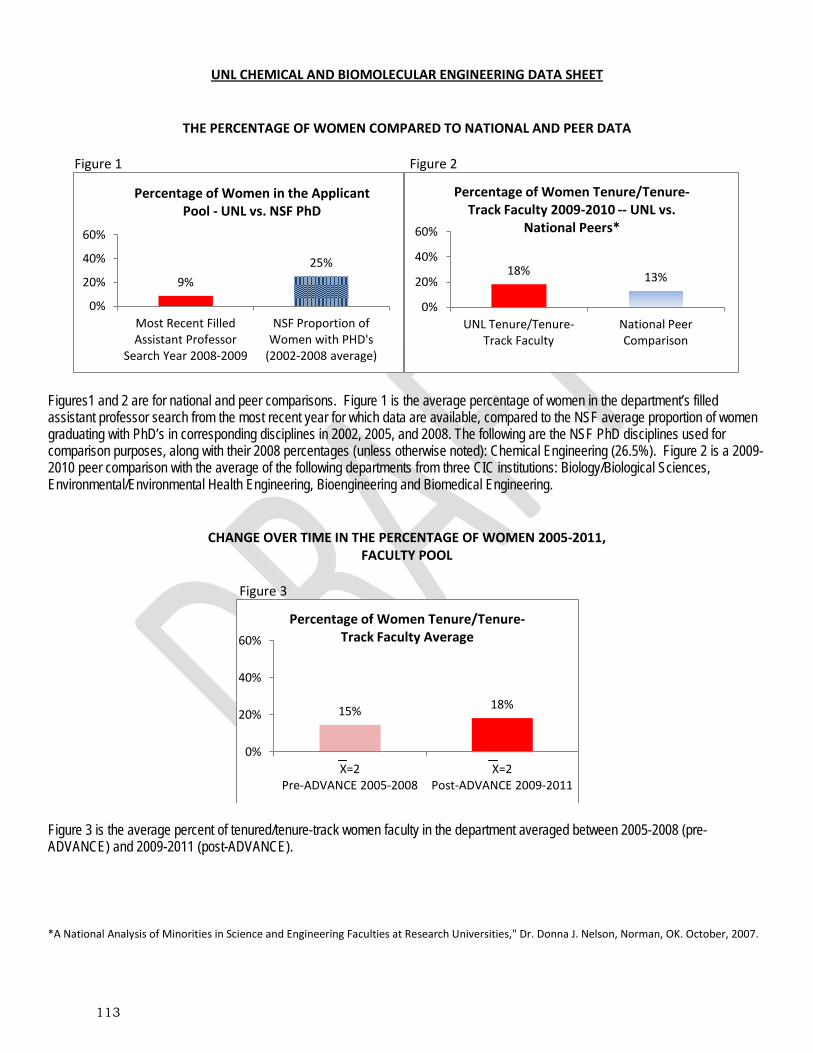
UNL CHEMICAL AND BIOMOLECULAR ENGINEERING DATA SHEET
THE PERCENTAGE OF WOMEN COMPARED TO NATIONAL AND PEER DATA
Figure 1 Figure 2
Figures1 and 2 are for national and peer comparisons. Figure 1 is the average percentage of women in the department’s filled assistant professor search from the most recent year for which data are available, compared to the NSF average proportion of women graduating with PhD’s in corresponding disciplines in 2002, 2005, and 2008. The following are the NSF PhD disciplines used for comparison purposes, along with their 2008 percentages (unless otherwise noted): Chemical Engineering (26.5%). Figure 2 is a 2009-2010 peer comparison with the average of the following departments from three CIC institutions: Biology/Biological Sciences, Environmental/Environmental Health Engineering, Bioengineering and Biomedical Engineering.
CHANGE OVER TIME IN THE PERCENTAGE OF WOMEN 2005-2011, FACULTY POOL
Figure 3
Figure 3 is the average percent of tenured/tenure-track women faculty in the department averaged between 2005-2008 (pre-ADVANCE) and 2009-2011 (post-ADVANCE).
*A National Analysis of Minorities in Science and Engineering Faculties at Research Universities," Dr. Donna J. Nelson, Norman, OK. October, 2007.
9%
25%
0%
20%
40%
60%
Most Recent Filled Assistant Professor
Search Year 2008-2009
NSF Proportion of Women with PHD's
(2002-2008 average)
Percentage of Women in the Applicant Pool - UNL vs. NSF PhD
18% 13%
0%
20%
40%
60%
UNL Tenure/Tenure-Track Faculty
National Peer Comparison
Percentage of Women Tenure/Tenure-Track Faculty 2009-2010 -- UNL vs.
National Peers*
15% 18%
0%
20%
40%
60%
X=2 Pre-ADVANCE 2005-2008
X=2 Post-ADVANCE 2009-2011
Percentage of Women Tenure/Tenure-Track Faculty Average
113

UNL ARCHITECTURAL ENGINEERING DATA SHEET
THE PERCENTAGE OF WOMEN COMPARED TO NATIONAL DATA
Figure 1
Figure 1 is the average percentage of women in the department’s filled assistant professor search from the most recent year for which data are available, compared to the NSF average proportion of women graduating with PhD’s in corresponding disciplines in 2002, 2005, and 2008. The following are the NSF PhD disciplines used for comparison purposes, along with their 2008 percentages (unless otherwise noted): Civil Engineering (20.2%).
CHANGE OVER TIME IN THE PERCENTAGE OF WOMEN 2005-2011, APPLICANT POOL AND FACULTY POOL
Figure 2 Figure 3
Figures 2 and 3 are the department’s data over time, pre- and post-ADVANCE. The percentages in figure 2 are the percent women in the applicant pool for filled assistant professor positions (per PeopleAdmin as of Sept 15, 2011) averaged for all searches between 2005-2008 and 2009-2011. Figure 3 is the average percent of tenured/tenure-track women faculty in the department averaged over the same 3 years, pre- and post-ADVANCE.
21%
0%
20%
40%
60%
Most Recent Filled Assistant Professor
Search
NSF Proportion of Women with PHD's
(2002-2008 average)
Percentage of Women in the Applicant Pool - UNL vs. NSF PhD
No Data
13% 12%
0%
20%
40%
60%
5 searches (3 Departments)
Pre-ADVANCE 2005-2008
2 searches (2 Departments)
Post-ADVANCE 2009-2011
Percentage of Women in the Filled Assistant Professor Applicant Pool Average
19% 27%
0%
20%
40%
60%
X=2 Pre-ADVANCE 2005-2008
X=3 Post-ADVANCE 2009-2011
Percentage of Women Tenure/Tenure-Track Faculty Average
114

UNL STEM IANR
THE PERCENTAGE OF WOMEN COMPARED TO NATIONAL AND PEER DATA APPLICANT POOL AND FACULTY POOL
Figure 1. Figure 2.
Figures 1 and 2 are for national and peer comparisons. Figure 1 is the average percentage of women in UNL STEM filled assistant professor searches in 2009-2010 and 2010-2011 (per PeopleAdmin as of Sept 15, 2011), compared to the NSF average proportion of women graduating with PhD’s in corresponding disciplines in 2002, 2005, and 2008. The proportion of PhD’s varies across years because it only includes the disciplines equivalent to the UNL departments with a search that year to provide the most accurate comparisons. Figure 2 is a 2009-2010 peer comparison of STEM UNL IANR departments and the average of their CIC counterparts. Only departments that had matches in three or more CIC institutions were included, which limited is to (Animal Science, Biochemistry, Biological Systems Engineering, Entomology and Plant Pathology).
CHANGE OVER TIME IN THE PROP0RTION OF WOMEN 2005-2011, APPLICANT POOL AND FACULTY POOL
Figure 3. Figure 4.
Figures 3 and 4 are the college’s data over time, pre- and post-ADVANCE. The percentages in figure 3 are the percent women in the applicant pool for filled assistant professor positions (per PeopleAdmin as of Sept 15, 2011) averaged for all searches between 2005-2008 and 2009-2011. Table 4 is the average percent of tenured/tenure-track women faculty in the college averaged over the same 3 years, pre- and post-ADVANCE.
25% 30%
36% 45%
0%
20%
40%
60%
2009-2010 4 departments
2010-2011 2 departments
Percentage of STEM Women in the Applicant Pool - UNL vs. NSF PhD
Recently Filled Assistant Professor Searches
NSF Proportion of Women with PHD's (2002-2008 average)
22% 25%
4%
27% 33%
18%
0%
20%
40%
60%
Assistant Associate Full
Percentage of Women Tenure/Tenure-Track Faculty by Rank 2009-2010
UNL vs. CIC
UNL - STEM IANR - Average 14%
CIC Comparison - Average 24%
16% 22%
0%
20%
40%
60%
Pre-ADVANCE (23 searches)
Post-ADVANCE (19 searches)
Percentage of Women in the Filled Assistant Professor Applicant Pool
Average
14% 14%
0%
20%
40%
60%
X=3 Pre-ADVANCE 2005-2008
X=3 Post-ADVANCE 2009-2011
Percentage of Women Tenure/Tenure-Track Faculty Average
115
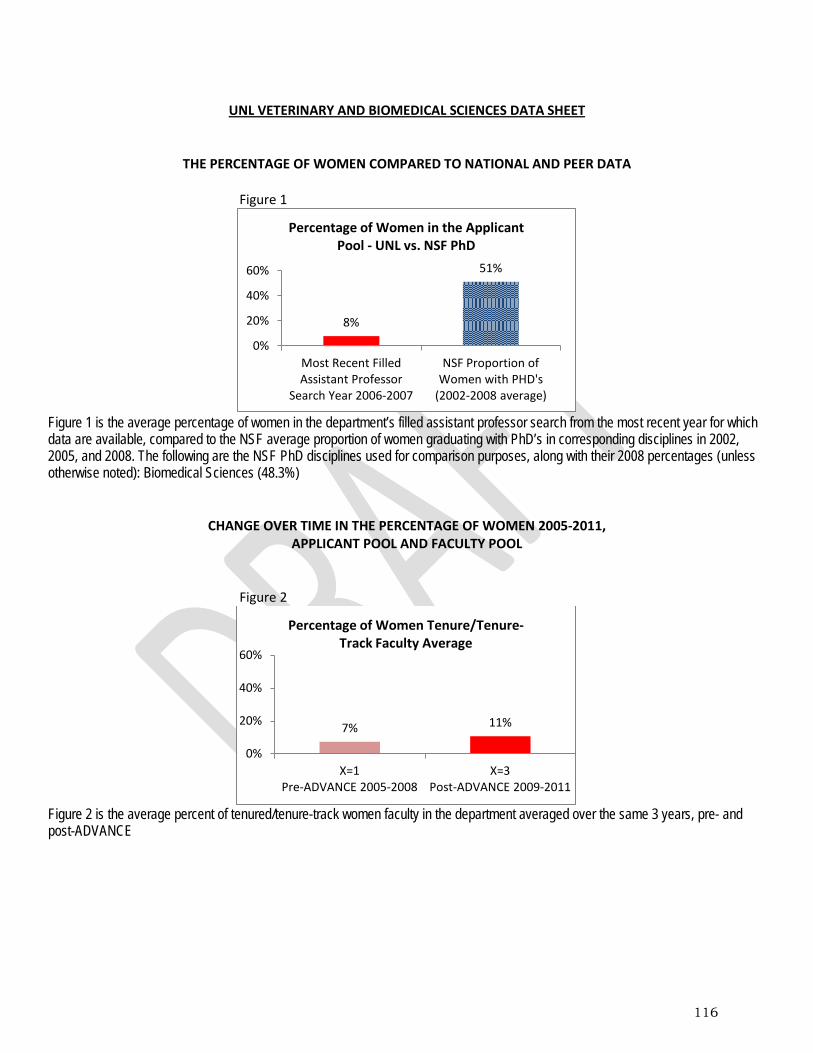
UNL VETERINARY AND BIOMEDICAL SCIENCES DATA SHEET
THE PERCENTAGE OF WOMEN COMPARED TO NATIONAL AND PEER DATA
Figure 1
Figure 1 is the average percentage of women in the department’s filled assistant professor search from the most recent year for which data are available, compared to the NSF average proportion of women graduating with PhD’s in corresponding disciplines in 2002, 2005, and 2008. The following are the NSF PhD disciplines used for comparison purposes, along with their 2008 percentages (unless otherwise noted): Biomedical Sciences (48.3%)
CHANGE OVER TIME IN THE PERCENTAGE OF WOMEN 2005-2011, APPLICANT POOL AND FACULTY POOL
Figure 2
Figure 2 is the average percent of tenured/tenure-track women faculty in the department averaged over the same 3 years, pre- and post-ADVANCE
8%
51%
0%
20%
40%
60%
Most Recent Filled Assistant Professor
Search Year 2006-2007
NSF Proportion of Women with PHD's
(2002-2008 average)
Percentage of Women in the Applicant Pool - UNL vs. NSF PhD
7% 11%
0%
20%
40%
60%
X=1 Pre-ADVANCE 2005-2008
X=3 Post-ADVANCE 2009-2011
Percentage of Women Tenure/Tenure-Track Faculty Average
116
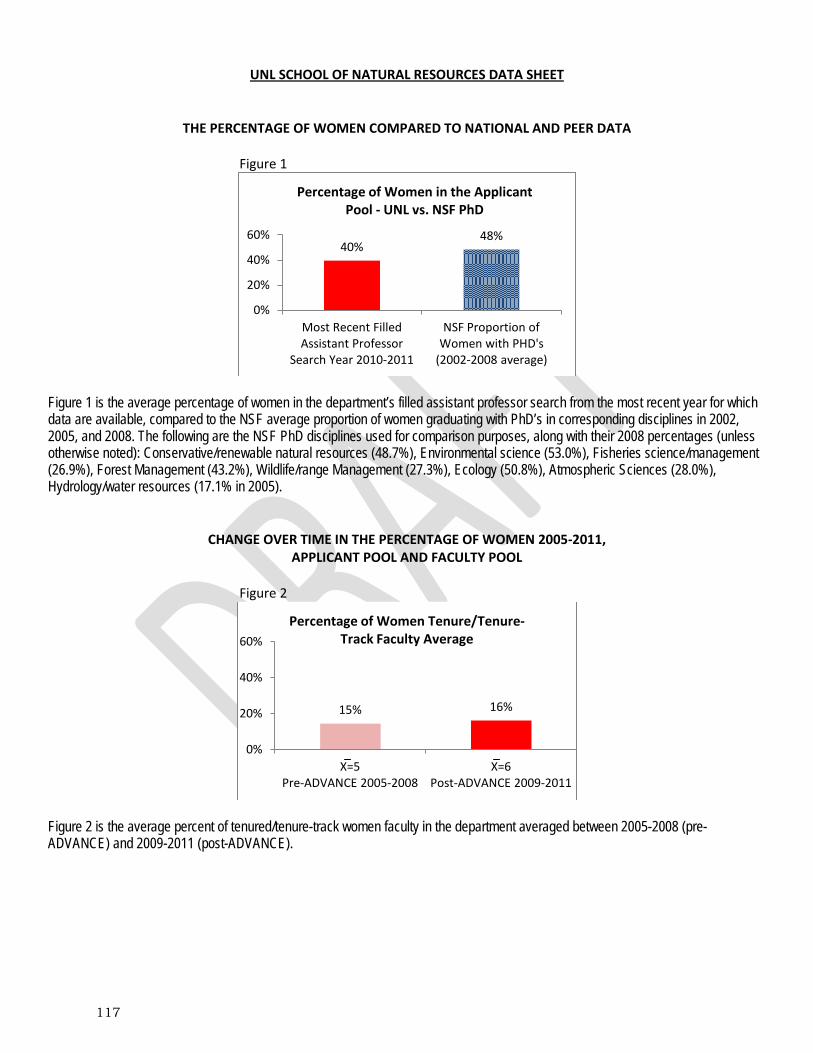
UNL SCHOOL OF NATURAL RESOURCES DATA SHEET
THE PERCENTAGE OF WOMEN COMPARED TO NATIONAL AND PEER DATA
Figure 1
Figure 1 is the average percentage of women in the department’s filled assistant professor search from the most recent year for which data are available, compared to the NSF average proportion of women graduating with PhD’s in corresponding disciplines in 2002, 2005, and 2008. The following are the NSF PhD disciplines used for comparison purposes, along with their 2008 percentages (unless otherwise noted): Conservative/renewable natural resources (48.7%), Environmental science (53.0%), Fisheries science/management (26.9%), Forest Management (43.2%), Wildlife/range Management (27.3%), Ecology (50.8%), Atmospheric Sciences (28.0%), Hydrology/water resources (17.1% in 2005).
CHANGE OVER TIME IN THE PERCENTAGE OF WOMEN 2005-2011, APPLICANT POOL AND FACULTY POOL
Figure 2
Figure 2 is the average percent of tenured/tenure-track women faculty in the department averaged between 2005-2008 (pre-ADVANCE) and 2009-2011 (post-ADVANCE).
40% 48%
0%
20%
40%
60%
Most Recent Filled Assistant Professor
Search Year 2010-2011
NSF Proportion of Women with PHD's
(2002-2008 average)
Percentage of Women in the Applicant Pool - UNL vs. NSF PhD
15% 16%
0%
20%
40%
60%
X=5 Pre-ADVANCE 2005-2008
X=6 Post-ADVANCE 2009-2011
Percentage of Women Tenure/Tenure-Track Faculty Average
117

UNL PLANT PATHOLOGY DATA SHEET
THE PERCENTAGE OF WOMEN COMPARED TO NATIONAL AND PEER DATA
Figure 1 Figure 2
Figures1 and 2 are for national and peer comparisons. Figure 1 is the average percentage of women in the department’s filled assistant professor search from the most recent year for which data are available, compared to the NSF average proportion of women graduating with PhD’s in corresponding disciplines in 2002, 2005, and 2008. The following are the NSF PhD disciplines used for comparison purposes, along with their 2008 percentages (unless otherwise noted): Plant Pathology under Biological Sciences (41.9% in 2005), Plant Pathology under Agricultural Sciences (49.2%). Figure 2 is a 2009-2010 peer comparison with the average of the following departments from seven CIC institutions: Botany/Plant Pathology, Plant Pathology/Phytopathology.
CHANGE OVER TIME IN THE PERCENTAGE OF WOMEN 2005-2011, APPLICANT POOL AND FACULTY POOL
Figure 3
Figure 3 is the percent of tenured/tenure-track women faculty in the department averaged between 2005-2008 (pre-ADVANCE) and 2009-2011 (post-ADVANCE).
16%
34%
0%
20%
40%
60%
Most Recent Filled Assistant Professor
Search Year 2007-2008
NSF Proportion of Women with PHD's
(2002-2008 average)
Percentage of Women in the Applicant Pool - UNL vs. NSF PhD
33%
0%
14%
45%
25% 22%
0%
20%
40%
60%
Assistant Associate Full
Percentage of Women Tenure/Tenure-Track Faculty by Rank 2009-2010
UNL vs. CIC
UNL Plant Pathology - Average 17%
CIC Comparison - Average 26%
16% 14%
0%
20%
40%
60%
X=2 Pre-ADVANCE 2005-2008
X=2 Post-ADVANCE 2009-2011
Percentage of Women Tenure/Tenure-Track Faculty Average
118

UNL FOOD SCIENCE AND TECHNOLOGY DATA SHEET
THE PERCENTAGE OF WOMEN COMPARED TO NATIONAL AND PEER DATA
Figure 1
Figure 1 is the average percentage of women in the department’s filled assistant professor search from the most recent year for which data are available, compared to the NSF average proportion of women graduating with PhD’s in corresponding disciplines in 2002, 2005, and 2008. The following are the NSF PhD disciplines used for comparison purposes, along with their 2008 percentages (unless otherwise noted): Food Sciences (50% in 2005).
CHANGE OVER TIME IN THE PERCENTAGE OF WOMEN 2005-2011, APPLICANT POOL AND FACULTY POOL
Figure 2 Figure 3
Figures 2 and 3 are the department’s data over time, pre- and post-ADVANCE. The percentages in figure 2 are the percent women in the applicant pool for filled assistant professor positions (per PeopleAdmin as of Sept 15, 2011) averaged for all searches between 2005-2008 and 2009-2011. Figure 3 is the average percent of tenured/tenure-track women faculty in the department averaged over the same 3 years, pre- and post-ADVANCE.
29%
47%
0%
20%
40%
60%
Most Recent Filled Assistant Professor
Search Year 2009-2010
NSF Proportion of Women with PHD's
(2002-2008 average)
Percentage of Women in the Applicant Pool - UNL vs. NSF PhD
14%
29%
0%
20%
40%
60%
1 search Pre-ADVANCE 2005-2008
1 search Post-ADVANCE 2009-2011
Percentage of Women in the Filled Assistant Professor Applicant Pool Average
17% 15%
0%
20%
40%
60%
X=2 Pre-ADVANCE 2005-2008
X=2 Post-ADVANCE 2009-2011
Percentage of Women Tenure/Tenure-Track Faculty Average
119
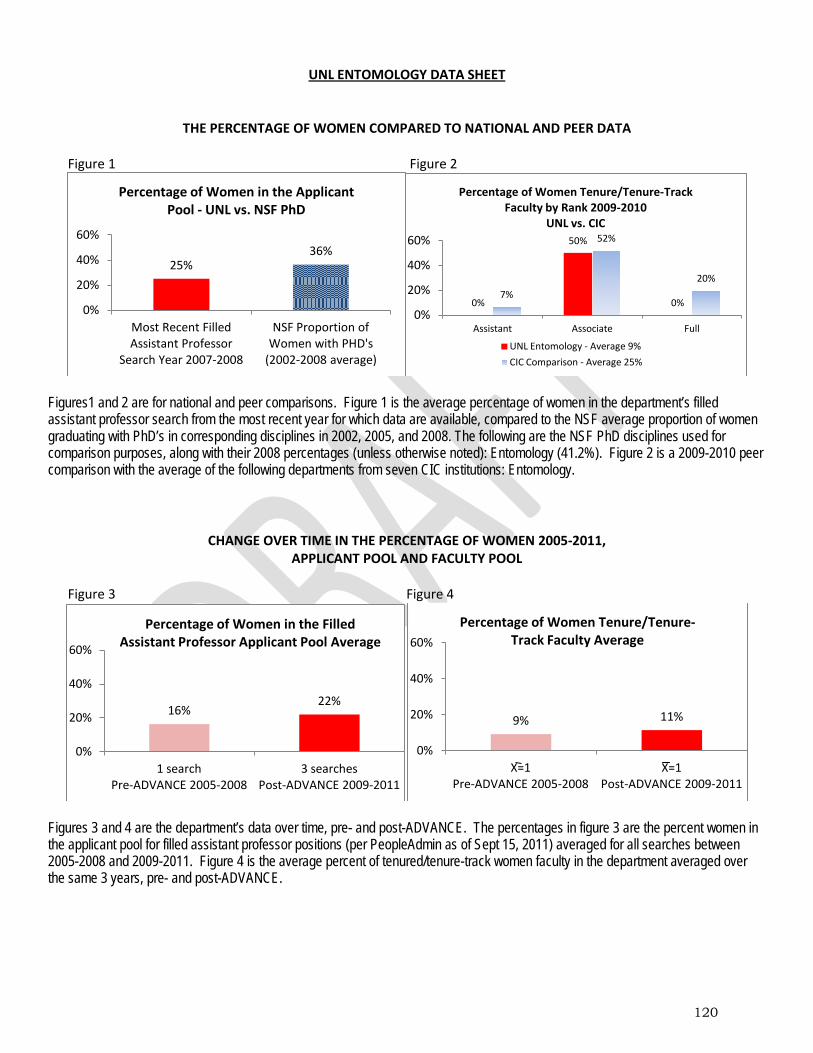
UNL ENTOMOLOGY DATA SHEET
THE PERCENTAGE OF WOMEN COMPARED TO NATIONAL AND PEER DATA
Figure 1 Figure 2
Figures1 and 2 are for national and peer comparisons. Figure 1 is the average percentage of women in the department’s filled assistant professor search from the most recent year for which data are available, compared to the NSF average proportion of women graduating with PhD’s in corresponding disciplines in 2002, 2005, and 2008. The following are the NSF PhD disciplines used for comparison purposes, along with their 2008 percentages (unless otherwise noted): Entomology (41.2%). Figure 2 is a 2009-2010 peer comparison with the average of the following departments from seven CIC institutions: Entomology.
CHANGE OVER TIME IN THE PERCENTAGE OF WOMEN 2005-2011, APPLICANT POOL AND FACULTY POOL
Figure 3 Figure 4
Figures 3 and 4 are the department’s data over time, pre- and post-ADVANCE. The percentages in figure 3 are the percent women in the applicant pool for filled assistant professor positions (per PeopleAdmin as of Sept 15, 2011) averaged for all searches between 2005-2008 and 2009-2011. Figure 4 is the average percent of tenured/tenure-track women faculty in the department averaged over the same 3 years, pre- and post-ADVANCE.
25% 36%
0%
20%
40%
60%
Most Recent Filled Assistant Professor
Search Year 2007-2008
NSF Proportion of Women with PHD's
(2002-2008 average)
Percentage of Women in the Applicant Pool - UNL vs. NSF PhD
0%
50%
0% 7%
52%
20%
0%
20%
40%
60%
Assistant Associate Full
Percentage of Women Tenure/Tenure-Track Faculty by Rank 2009-2010
UNL vs. CIC
UNL Entomology - Average 9%
CIC Comparison - Average 25%
16% 22%
0%
20%
40%
60%
1 search Pre-ADVANCE 2005-2008
3 searches Post-ADVANCE 2009-2011
Percentage of Women in the Filled Assistant Professor Applicant Pool Average
9% 11%
0%
20%
40%
60%
X=1 Pre-ADVANCE 2005-2008
X=1 Post-ADVANCE 2009-2011
Percentage of Women Tenure/Tenure-Track Faculty Average
120

UNL BIOLOGICAL SYSTEMS ENGINEERING DATA SHEET
THE PERCENTAGE OF WOMEN COMPARED TO NATIONAL AND PEER DATA
Figure 1 Figure 2
Figures1 and 2 are for national and peer comparisons. Figure 1 is the average percentage of women in the department’s filled assistant professor search from the most recent year for which data are available, compared to the NSF average proportion of women graduating with PhD’s in corresponding disciplines in 2002, 2005, and 2008. The following are the NSF PhD disciplines used for comparison purposes, along with their 2008 percentages (unless otherwise noted): Agricultural Engineering (19.1% in 2005), Bioengineering/biomedical engineering (37.5%). Figure 2 is a 2009-2010 peer comparison with the average of the following departments from nine CIC institutions: Bioengineering and Biomedical Engineering, Agricultural Engineering, Environmental/Environmental Health Engineering.
CHANGE OVER TIME IN THE PERCENTAGE OF WOMEN 2005-2011, APPLICANT POOL AND FACULTY POOL
Figure 3
Figure 3 is the average percent of tenured/tenure-track women faculty in the department averaged between 2005-2008 (pre-ADVANCE) and 2009-2011 (post-ADVANCE).
7%
28%
0%
20%
40%
60%
Most Recent Filled Assistant Professor
Search Year 2008-2009
NSF Proportion of Women with PHD's
(2002-2008 average)
Percentage of Women in the Applicant Pool - UNL vs. NSF PhD
20%
0% 0%
26% 26%
5%
0%
20%
40%
60%
Assistant Associate Full
Percentage of Women Tenure/Tenure-Track Faculty by Rank 2009-2010
UNL vs. CIC
Biological Systems Engineering - Average 5%
CIC Comparison - Average 17%
2% 5%
0%
20%
40%
60%
X=0 Pre-ADVANCE 2005-2008
X=1 Post-ADVANCE 2009-2011
Percentage of Women Tenure/Tenure-Track Faculty Average
121
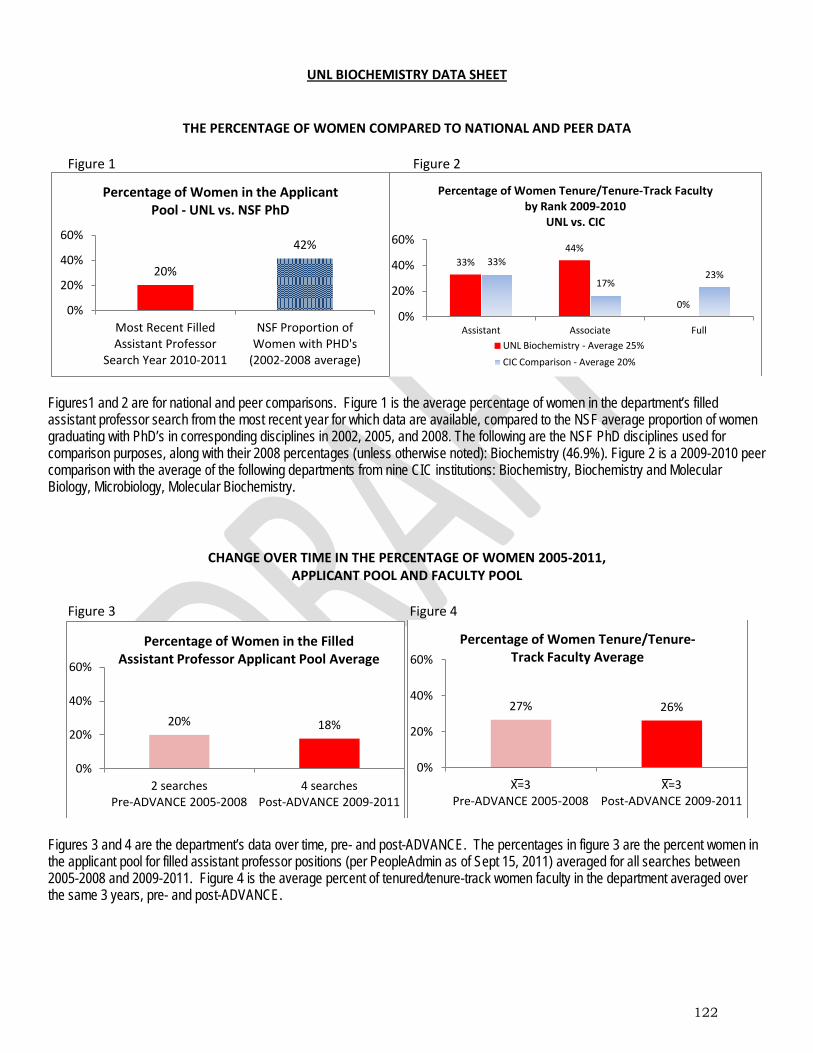
UNL BIOCHEMISTRY DATA SHEET
THE PERCENTAGE OF WOMEN COMPARED TO NATIONAL AND PEER DATA
Figure 1 Figure 2
Figures1 and 2 are for national and peer comparisons. Figure 1 is the average percentage of women in the department’s filled assistant professor search from the most recent year for which data are available, compared to the NSF average proportion of women graduating with PhD’s in corresponding disciplines in 2002, 2005, and 2008. The following are the NSF PhD disciplines used for comparison purposes, along with their 2008 percentages (unless otherwise noted): Biochemistry (46.9%). Figure 2 is a 2009-2010 peer comparison with the average of the following departments from nine CIC institutions: Biochemistry, Biochemistry and Molecular Biology, Microbiology, Molecular Biochemistry.
CHANGE OVER TIME IN THE PERCENTAGE OF WOMEN 2005-2011, APPLICANT POOL AND FACULTY POOL
Figure 3 Figure 4
Figures 3 and 4 are the department’s data over time, pre- and post-ADVANCE. The percentages in figure 3 are the percent women in the applicant pool for filled assistant professor positions (per PeopleAdmin as of Sept 15, 2011) averaged for all searches between 2005-2008 and 2009-2011. Figure 4 is the average percent of tenured/tenure-track women faculty in the department averaged over the same 3 years, pre- and post-ADVANCE.
20%
42%
0%
20%
40%
60%
Most Recent Filled Assistant Professor
Search Year 2010-2011
NSF Proportion of Women with PHD's
(2002-2008 average)
Percentage of Women in the Applicant Pool - UNL vs. NSF PhD
33% 44%
0%
33%
17% 23%
0%
20%
40%
60%
Assistant Associate Full
Percentage of Women Tenure/Tenure-Track Faculty by Rank 2009-2010
UNL vs. CIC
UNL Biochemistry - Average 25%
CIC Comparison - Average 20%
20% 18%
0%
20%
40%
60%
2 searches Pre-ADVANCE 2005-2008
4 searches Post-ADVANCE 2009-2011
Percentage of Women in the Filled Assistant Professor Applicant Pool Average
27% 26%
0%
20%
40%
60%
X=3 Pre-ADVANCE 2005-2008
X=3 Post-ADVANCE 2009-2011
Percentage of Women Tenure/Tenure-Track Faculty Average
122

UNL ANIMAL SCIENCE DATA SHEET
THE PROPORTION OF WOMEN COMPARED TO NATIONAL AND PEER DATA
Figure 1 Figure 2
Figures1 and 2 are for national and peer comparisons. Figure 1 is the average percentage of women in the department’s filled assistant professor search from the most recent year for which data are available, compared to the NSF average proportion of women graduating with PhD’s in corresponding disciplines in 2002, 2005, and 2008. The following are the NSF PhD disciplines used for comparison purposes, along with their 2008 percentages (unless otherwise noted): Animal breeding/genetics (21.4% in 2005), Animal Sciences (45.5%). Figure 2 is a 2009-2010 peer comparison with the average of the following departments from three CIC institutions: Zoology/Animal Biology, Animal Genetics.
CHANGE OVER TIME IN THE PERCENTAGE OF WOMEN 2005-2011, APPLICANT POOL AND FACULTY POOL
Figure 3 Figure 4
Figures 3 and 4 are the department’s data over time, pre- and post-ADVANCE. The percentages in figure 3 are the percent women in the applicant pool for filled assistant professor positions (per PeopleAdmin as of Sept 15, 2011) averaged for all searches between 2005-2008 and 2009-2011. Figure 4 is the average percent of tenured/tenure-track women faculty in the department averaged over the same 3 years, pre- and post-ADVANCE.
32% 33%
0%
20%
40%
60%
Most Recent Filled Assistant Professor
Search Year 2009-2010
NSF Proportion of Women with PHD's
(2002-2008 average)
Percentage of Women in the Applicant Pool - UNL vs. NSF PhD
25% 29%
8%
23%
45%
22%
0%
20%
40%
60%
Assistant Associate Full
Percentage of Women Tenure/Tenure-Track Faculty by Rank 2009-2010
UNL vs. CIC
UNL Animal Science - Average 17% CIC Comparison - Average 30%
17%
32%
0%
20%
40%
60%
5 searches Pre-ADVANCE 2005-2008
3 searches Post-ADVANCE 2009-2011
Percentage of Women in the Filled Assistant Professor Applicant Pool Average
19% 16%
0%
20%
40%
60%
X=5 Pre-ADVANCE 2005-2008
X=4 Post-ADVANCE 2009-2011
Percentage of Women Tenure/Tenure-Track Faculty Average
123
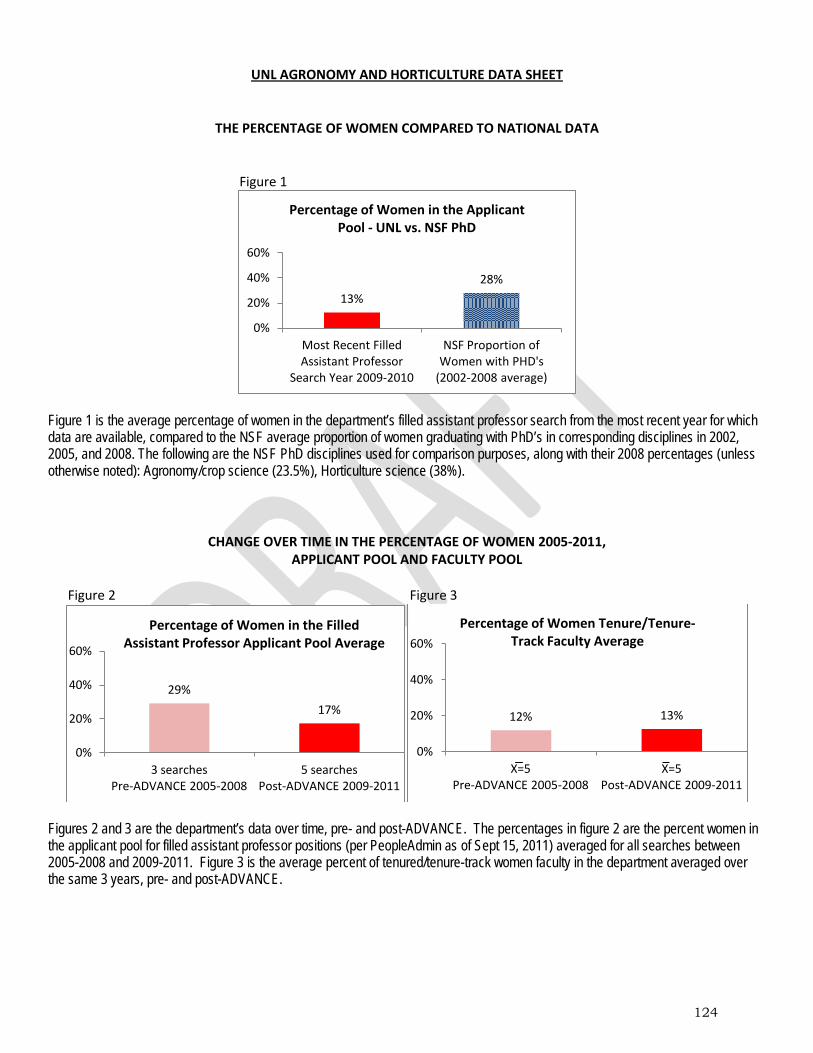
UNL AGRONOMY AND HORTICULTURE DATA SHEET
THE PERCENTAGE OF WOMEN COMPARED TO NATIONAL DATA
Figure 1
Figure 1 is the average percentage of women in the department’s filled assistant professor search from the most recent year for which data are available, compared to the NSF average proportion of women graduating with PhD’s in corresponding disciplines in 2002, 2005, and 2008. The following are the NSF PhD disciplines used for comparison purposes, along with their 2008 percentages (unless otherwise noted): Agronomy/crop science (23.5%), Horticulture science (38%).
CHANGE OVER TIME IN THE PERCENTAGE OF WOMEN 2005-2011, APPLICANT POOL AND FACULTY POOL
Figure 2 Figure 3
Figures 2 and 3 are the department’s data over time, pre- and post-ADVANCE. The percentages in figure 2 are the percent women in the applicant pool for filled assistant professor positions (per PeopleAdmin as of Sept 15, 2011) averaged for all searches between 2005-2008 and 2009-2011. Figure 3 is the average percent of tenured/tenure-track women faculty in the department averaged over the same 3 years, pre- and post-ADVANCE.
13%
28%
0%
20%
40%
60%
Most Recent Filled Assistant Professor
Search Year 2009-2010
NSF Proportion of Women with PHD's
(2002-2008 average)
Percentage of Women in the Applicant Pool - UNL vs. NSF PhD
29%
17%
0%
20%
40%
60%
3 searches Pre-ADVANCE 2005-2008
5 searches Post-ADVANCE 2009-2011
Percentage of Women in the Filled Assistant Professor Applicant Pool Average
12% 13%
0%
20%
40%
60%
X=5 Pre-ADVANCE 2005-2008
X=5 Post-ADVANCE 2009-2011
Percentage of Women Tenure/Tenure-Track Faculty Average
124

E. REPORT ON NSF INDICATORS
125
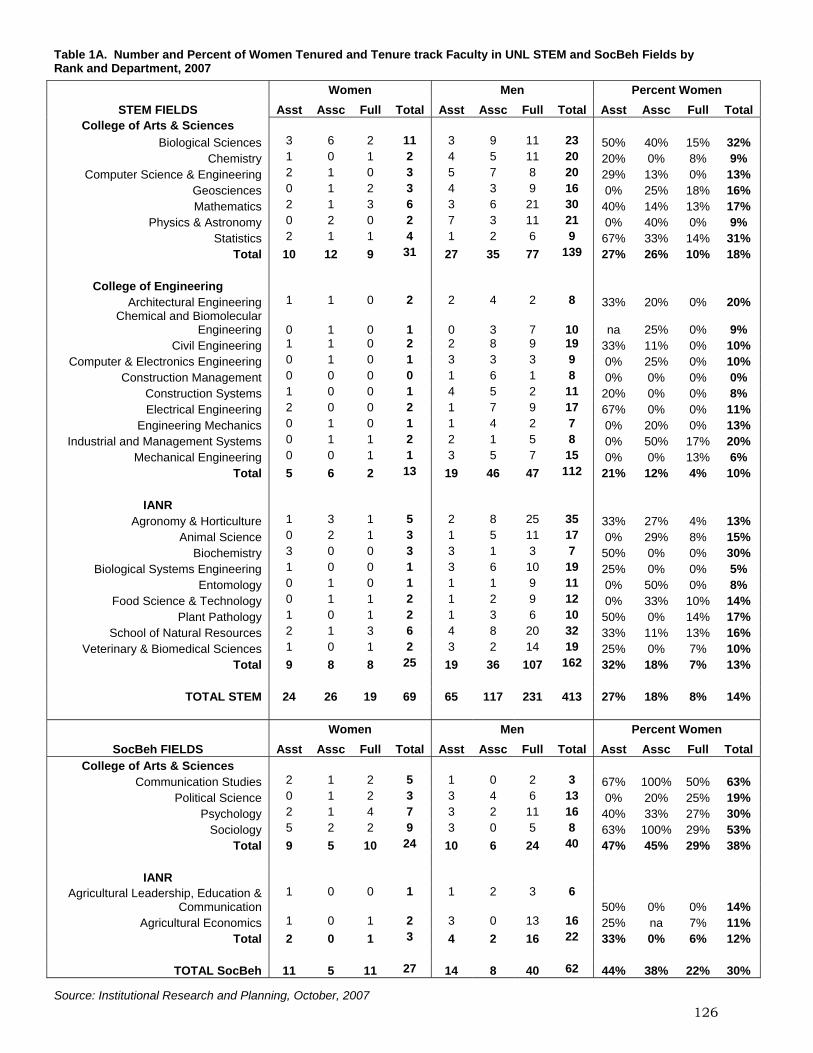
Table 1A. Number and Percent of Women Tenured and Tenure track Faculty in UNL STEM and SocBeh Fields by Rank and Department, 2007 Women Men Percent Women
STEM FIELDS Asst Assc Full Total Asst Assc Full Total Asst Assc Full Total College of Arts & Sciences
Biological Sciences 3 6 2 11 3 9 11 23 50% 40% 15% 32% Chemistry 1 0 1 2 4 5 11 20 20% 0% 8% 9%
Computer Science & Engineering 2 1 0 3 5 7 8 20 29% 13% 0% 13% Geosciences 0 1 2 3 4 3 9 16 0% 25% 18% 16% Mathematics 2 1 3 6 3 6 21 30 40% 14% 13% 17%
Physics & Astronomy 0 2 0 2 7 3 11 21 0% 40% 0% 9% Statistics 2 1 1 4 1 2 6 9 67% 33% 14% 31%
Total 10 12 9 31 27 35 77 139 27% 26% 10% 18%
College of Engineering Architectural Engineering 1 1 0 2 2 4 2 8 33% 20% 0% 20%
Chemical and Biomolecular Engineering 0 1 0 1 0 3 7 10 na 25% 0% 9%
Civil Engineering 1 1 0 2 2 8 9 19 33% 11% 0% 10% Computer & Electronics Engineering 0 1 0 1 3 3 3 9 0% 25% 0% 10%
Construction Management 0 0 0 0 1 6 1 8 0% 0% 0% 0% Construction Systems 1 0 0 1 4 5 2 11 20% 0% 0% 8% Electrical Engineering 2 0 0 2 1 7 9 17 67% 0% 0% 11%
Engineering Mechanics 0 1 0 1 1 4 2 7 0% 20% 0% 13% Industrial and Management Systems 0 1 1 2 2 1 5 8 0% 50% 17% 20%
Mechanical Engineering 0 0 1 1 3 5 7 15 0% 0% 13% 6% Total 5 6 2 13 19 46 47 112 21% 12% 4% 10%
IANR
Agronomy & Horticulture 1 3 1 5 2 8 25 35 33% 27% 4% 13% Animal Science 0 2 1 3 1 5 11 17 0% 29% 8% 15%
Biochemistry 3 0 0 3 3 1 3 7 50% 0% 0% 30% Biological Systems Engineering 1 0 0 1 3 6 10 19 25% 0% 0% 5%
Entomology 0 1 0 1 1 1 9 11 0% 50% 0% 8% Food Science & Technology 0 1 1 2 1 2 9 12 0% 33% 10% 14%
Plant Pathology 1 0 1 2 1 3 6 10 50% 0% 14% 17% School of Natural Resources 2 1 3 6 4 8 20 32 33% 11% 13% 16%
Veterinary & Biomedical Sciences 1 0 1 2 3 2 14 19 25% 0% 7% 10% Total 9 8 8 25 19 36 107 162 32% 18% 7% 13%
TOTAL STEM 24 26 19 69 65 117 231 413 27% 18% 8% 14%
Women Men Percent Women
SocBeh FIELDS Asst Assc Full Total Asst Assc Full Total Asst Assc Full Total College of Arts & Sciences
Communication Studies 2 1 2 5 1 0 2 3 67% 100% 50% 63% Political Science 0 1 2 3 3 4 6 13 0% 20% 25% 19%
Psychology 2 1 4 7 3 2 11 16 40% 33% 27% 30% Sociology 5 2 2 9 3 0 5 8 63% 100% 29% 53%
Total 9 5 10 24 10 6 24 40 47% 45% 29% 38%
IANR Agricultural Leadership, Education &
Communication 1 0 0 1 1 2 3 6
50% 0% 0% 14% Agricultural Economics 1 0 1 2 3 0 13 16 25% na 7% 11%
Total 2 0 1 3 4 2 16 22 33% 0% 6% 12%
TOTAL SocBeh 11 5 11 27 14 8 40 62 44% 38% 22% 30%
Source: Institutional Research and Planning, October, 2007
126

Table 1B. Number and Percent of Women Tenured and Tenure track Faculty in UNL STEM and SocBeh Fields by Rank and Department, 2008 Women Men Percent Women
STEM FIELDS Asst Assc Full Total Asst Assc Full Total Asst Assc Full Total College of Arts & Sciences
Biological Sciences 5 6 2 13 5 8 11 24 50% 43% 15% 35%
Chemistry 1 0 1 2 4 3 11 18 20% 0% 8% 10%
Computer Science & Engineering 2 1 0 3 3 7 9 19 40% 13% 0% 14%
Geosciences 0 1 2 3 4 3 9 16 0% 25% 18% 16%
Mathematics 2 1 3 6 2 6 21 29 50% 14% 13% 17%
Physics & Astronomy 0 1 0 1 8 2 12 22 0% 33% 0% 4%
Statistics 2 1 1 4 1 2 6 9 67% 33% 14% 31%
Total 12 11 9 32 27 31 79 137 31% 26% 10% 19%
College of Engineering
Architectural Engineering 1 1 0 2 2 2 2 6 33% 33% 0% 25% Chemical and Biomolecular
Engineering 0 1 0 1 0 2 7 9 na 33% 0% 10%
Civil Engineering 2 1 0 3 3 7 9 19 40% 13% 0% 14% Computer & Electronics
Engineering 0 1 0 1 2 4 3 9 0% 20% 0% 10%
Construction Management 0 0 0 0 1 6 1 8 0% 0% 0% 0%
Construction Systems 1 0 0 1 3 6 2 11 25% 0% 0% 8%
Electrical Engineering 2 0 0 2 3 5 11 19 40% 0% 0% 10%
Engineering Mechanics 0 1 0 1 2 4 2 8 0% 20% 0% 11% Industrial and Management
Systems 0 0 1 1 2 1 6 9 0% 0% 14% 10%
Mechanical Engineering 0 0 1 1 2 5 7 14 0% 0% 13% 7%
Total 6 5 2 13 20 42 50 112 23% 11% 4% 10%
IANR
Agronomy & Horticulture 0 3 2 5 3 6 24 33 0% 33% 8% 13%
Animal Science 0 2 1 3 2 5 11 18 0% 29% 8% 14%
Biochemistry 1 2 0 3 3 2 4 9 25% 50% 0% 25%
Biological Systems Engineering 1 0 0 1 3 6 10 19 25% 0% 0% 5%
Entomology 0 1 0 1 1 1 9 11 0% 50% 0% 8%
Food Science & Technology 0 1 1 2 2 2 9 13 0% 33% 10% 13%
Plant Pathology 1 0 1 2 1 3 6 10 50% 0% 14% 17%
School of Natural Resources 2 1 3 6 3 7 21 31 40% 13% 13% 16%
Veterinary & Biomedical Sciences 1 1 1 3 5 4 14 23 17% 20% 7% 12%
Total 6 11 9 26 23 36 108 167 21% 23% 8% 13%
TOTAL STEM 24 27 20 71 70 109 237 416 26% 20% 8% 15%
Women Men Percent Women SocBeh FIELDS Asst Assc Full Total Asst Assc Full Total Asst Assc Full Total
College of Arts & Sciences
Communication Studies 2 0 2 4 1 0 2 3 67% na 50% 57%
Political Science 1 1 2 4 3 4 6 13 25% 20% 25% 24%
Psychology 4 1 3 8 3 2 11 16 57% 33% 21% 33%
Sociology 6 3 2 11 3 0 5 8 67% 100% 29% 58%
Total 13 5 9 27 10 6 24 40 57% 45% 27% 40%
IANR Agricultural Leadership,
Education & Communication 2 0 0 2 1 2 3 6 67% 0% 0% 25%
Agricultural Economics 0 1 1 2 1 1 13 15 0% 50% 7% 12%
Total 2 1 1 4 2 3 16 21 50% 25% 6% 16%
TOTAL SocBeh 15 6 10 31 12 9 40 61 56% 40% 20% 34%
Source: Institutional Research and Planning, October, 2008
127

Table 1C. Number and Percent of Women Tenured and Tenure track Faculty in UNL STEM and SocBeh Fields by Rank and Department, 2009 Women Men Percent Women
STEM FIELDS Asst Assc Full Total Asst Assc Full Total Asst Assc Full Total College of Arts & Sciences
Biological Sciences 6 5 3 14 5 8 11 24 55% 38% 21% 37%
Chemistry 1 0 1 2 3 3 12 18 25% 0% 8% 10%
Computer Science & Engineering 3 1 0 4 2 6 10 18 60% 14% 0% 18%
Geosciences 0 1 1 2 4 2 10 16 0% 33% 9% 11%
Mathematics 3 1 3 7 2 7 21 30 60% 13% 13% 19%
Physics & Astronomy 0 1 0 1 5 6 12 23 0% 14% 0% 4%
Statistics 2 1 1 4 1 1 7 9 67% 50% 13% 31%
Total 15 10 9 34 22 33 83 138 41% 23% 10% 20%
College of Engineering
Architectural Engineering 2 1 0 3 3 2 3 8 40% 33% 0% 27% Chemical and Biomolecular
Engineering 0 1 0 1 0 3 7 10 na 25% 0% 9%
Civil Engineering 2 1 0 3 4 6 9 19 33% 14% 0% 14%
Computer & Electronics Engineering 0 1 0 1 2 4 3 9 0% 20% 0% 10%
Construction Management 0 0 0 0 1 7 1 9 0% 0% 0% 0%
Construction Systems 1 0 0 1 3 5 2 10 25% 0% 0% 9%
Electrical Engineering 2 0 0 2 3 6 11 20 40% 0% 0% 9%
Engineering Mechanics 0 1 0 1 2 4 2 8 0% 20% 0% 11% Industrial and Management
Systems 0 0 1 1 1 2 7 10 0% 0% 13% 9%
Mechanical Engineering 1 0 0 1 2 4 7 13 33% 0% 0% 7%
Total 8 5 1 14 21 43 52 116 28% 10% 2% 11%
IANR
Agronomy & Horticulture 0 3 2 5 6 5 25 36 0% 38% 7% 12%
Animal Science 1 2 1 4 3 5 12 20 25% 29% 8% 17%
Biochemistry 1 2 0 3 2 3 4 9 33% 40% 0% 25%
Biological Systems Engineering 1 0 0 1 4 7 10 21 20% 0% 0% 5%
Entomology 0 1 0 1 1 1 8 10 0% 50% 0% 9%
Food Science & Technology 0 1 1 2 3 2 8 13 0% 33% 11% 13%
Plant Pathology 1 0 1 2 2 2 6 10 33% 0% 14% 17%
School of Natural Resources 2 1 3 6 3 7 21 31 40% 13% 13% 16%
Veterinary & Biomedical Sciences 1 1 1 3 8 4 14 26 11% 20% 7% 10%
Total 7 11 9 27 32 36 108 176 18% 23% 8% 13%
TOTAL STEM 30 26 19 75 75 112 243 430 29% 19% 7% 15%
Women Men Percent Women
SocBeh FIELDS Asst Assc Full Total Asst Assc Full Total Asst Assc Full Total
College of Arts & Sciences
Communication Studies 1 1 2 4 2 0 2 4 33% 0% 50% 50%
Political Science 2 1 2 5 4 3 5 12 33% 25% 29% 29%
Psychology 4 1 3 8 5 2 11 18 44% 33% 21% 31%
Sociology 6 3 2 11 3 0 5 8 67% 100% 29% 58%
Total 13 6 9 28 14 5 23 42 48% 55% 28% 40%
IANR Agricultural Leadership, Education
& Communication 2 0 0 2 1 2 2 5 67% 0% 0% 29%
Agricultural Economics 1 1 1 3 1 1 12 14 50% 50% 8% 18%
Total 3 1 1 5 2 3 14 19 60% 25% 7% 21%
TOTAL SocBeh 16 7 10 33 16 8 37 61 50% 47% 21% 35%
Source: Institutional Research and Planning, October, 2009
128
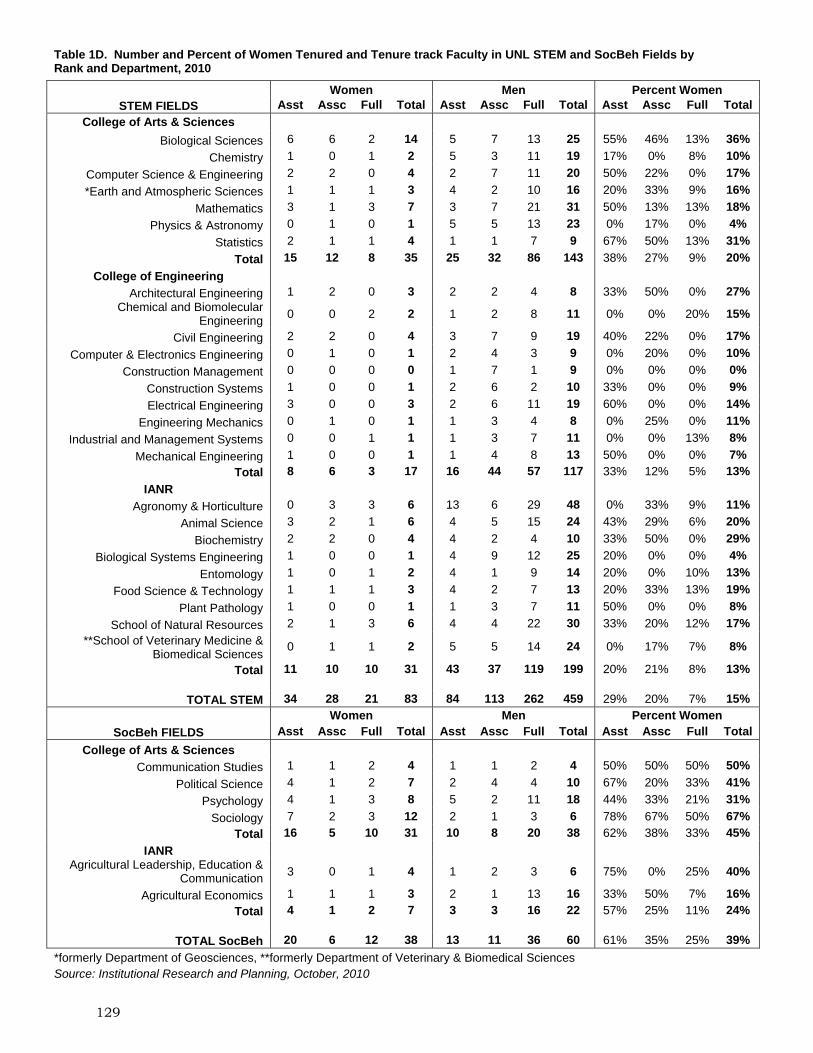
Table 1D. Number and Percent of Women Tenured and Tenure track Faculty in UNL STEM and SocBeh Fields by Rank and Department, 2010
Women Men Percent Women STEM FIELDS Asst Assc Full Total Asst Assc Full Total Asst Assc Full Total
College of Arts & Sciences
Biological Sciences 6 6 2 14 5 7 13 25 55% 46% 13% 36%
Chemistry 1 0 1 2 5 3 11 19 17% 0% 8% 10%
Computer Science & Engineering 2 2 0 4 2 7 11 20 50% 22% 0% 17%
*Earth and Atmospheric Sciences 1 1 1 3 4 2 10 16 20% 33% 9% 16%
Mathematics 3 1 3 7 3 7 21 31 50% 13% 13% 18%
Physics & Astronomy 0 1 0 1 5 5 13 23 0% 17% 0% 4%
Statistics 2 1 1 4 1 1 7 9 67% 50% 13% 31%
Total 15 12 8 35 25 32 86 143 38% 27% 9% 20%
College of Engineering
Architectural Engineering 1 2 0 3 2 2 4 8 33% 50% 0% 27% Chemical and Biomolecular
Engineering 0 0 2 2 1 2 8 11 0% 0% 20% 15%
Civil Engineering 2 2 0 4 3 7 9 19 40% 22% 0% 17%
Computer & Electronics Engineering 0 1 0 1 2 4 3 9 0% 20% 0% 10%
Construction Management 0 0 0 0 1 7 1 9 0% 0% 0% 0%
Construction Systems 1 0 0 1 2 6 2 10 33% 0% 0% 9%
Electrical Engineering 3 0 0 3 2 6 11 19 60% 0% 0% 14%
Engineering Mechanics 0 1 0 1 1 3 4 8 0% 25% 0% 11%
Industrial and Management Systems 0 0 1 1 1 3 7 11 0% 0% 13% 8%
Mechanical Engineering 1 0 0 1 1 4 8 13 50% 0% 0% 7%
Total 8 6 3 17 16 44 57 117 33% 12% 5% 13%
IANR
Agronomy & Horticulture 0 3 3 6 13 6 29 48 0% 33% 9% 11%
Animal Science 3 2 1 6 4 5 15 24 43% 29% 6% 20%
Biochemistry 2 2 0 4 4 2 4 10 33% 50% 0% 29%
Biological Systems Engineering 1 0 0 1 4 9 12 25 20% 0% 0% 4%
Entomology 1 0 1 2 4 1 9 14 20% 0% 10% 13%
Food Science & Technology 1 1 1 3 4 2 7 13 20% 33% 13% 19%
Plant Pathology 1 0 0 1 1 3 7 11 50% 0% 0% 8%
School of Natural Resources 2 1 3 6 4 4 22 30 33% 20% 12% 17%
**School of Veterinary Medicine & Biomedical Sciences
0 1 1 2 5 5 14 24 0% 17% 7% 8%
Total 11 10 10 31 43 37 119 199 20% 21% 8% 13%
TOTAL STEM 34 28 21 83 84 113 262 459 29% 20% 7% 15%
Women Men Percent Women
SocBeh FIELDS Asst Assc Full Total Asst Assc Full Total Asst Assc Full Total
College of Arts & Sciences
Communication Studies 1 1 2 4 1 1 2 4 50% 50% 50% 50%
Political Science 4 1 2 7 2 4 4 10 67% 20% 33% 41%
Psychology 4 1 3 8 5 2 11 18 44% 33% 21% 31%
Sociology 7 2 3 12 2 1 3 6 78% 67% 50% 67%
Total 16 5 10 31 10 8 20 38 62% 38% 33% 45%
IANR Agricultural Leadership, Education &
Communication 3 0 1 4 1 2 3 6 75% 0% 25% 40%
Agricultural Economics 1 1 1 3 2 1 13 16 33% 50% 7% 16%
Total 4 1 2 7 3 3 16 22 57% 25% 11% 24%
TOTAL SocBeh 20 6 12 38 13 11 36 60 61% 35% 25% 39%
*formerly Department of Geosciences, **formerly Department of Veterinary & Biomedical Sciences Source: Institutional Research and Planning, October, 2010
129
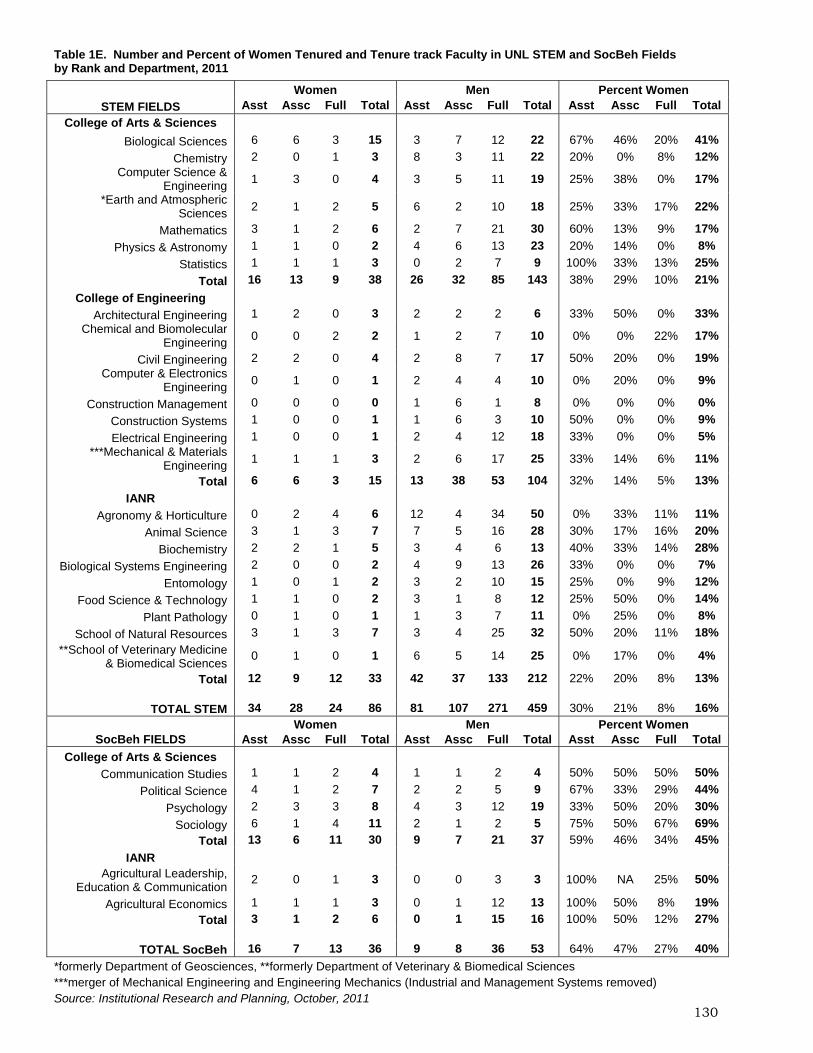
Table 1E. Number and Percent of Women Tenured and Tenure track Faculty in UNL STEM and SocBeh Fields by Rank and Department, 2011
Women Men Percent Women
STEM FIELDS Asst Assc Full Total Asst Assc Full Total Asst Assc Full Total
College of Arts & Sciences
Biological Sciences 6 6 3 15 3 7 12 22 67% 46% 20% 41%
Chemistry 2 0 1 3 8 3 11 22 20% 0% 8% 12% Computer Science &
Engineering 1 3 0 4 3 5 11 19 25% 38% 0% 17%
*Earth and Atmospheric Sciences
2 1 2 5 6 2 10 18 25% 33% 17% 22%
Mathematics 3 1 2 6 2 7 21 30 60% 13% 9% 17%
Physics & Astronomy 1 1 0 2 4 6 13 23 20% 14% 0% 8%
Statistics 1 1 1 3 0 2 7 9 100% 33% 13% 25%
Total 16 13 9 38 26 32 85 143 38% 29% 10% 21%
College of Engineering
Architectural Engineering 1 2 0 3 2 2 2 6 33% 50% 0% 33% Chemical and Biomolecular
Engineering 0 0 2 2 1 2 7 10 0% 0% 22% 17%
Civil Engineering 2 2 0 4 2 8 7 17 50% 20% 0% 19% Computer & Electronics
Engineering 0 1 0 1 2 4 4 10 0% 20% 0% 9%
Construction Management 0 0 0 0 1 6 1 8 0% 0% 0% 0%
Construction Systems 1 0 0 1 1 6 3 10 50% 0% 0% 9%
Electrical Engineering 1 0 0 1 2 4 12 18 33% 0% 0% 5% ***Mechanical & Materials
Engineering 1 1 1 3 2 6 17 25 33% 14% 6% 11%
Total 6 6 3 15 13 38 53 104 32% 14% 5% 13%
IANR
Agronomy & Horticulture 0 2 4 6 12 4 34 50 0% 33% 11% 11%
Animal Science 3 1 3 7 7 5 16 28 30% 17% 16% 20%
Biochemistry 2 2 1 5 3 4 6 13 40% 33% 14% 28%
Biological Systems Engineering 2 0 0 2 4 9 13 26 33% 0% 0% 7%
Entomology 1 0 1 2 3 2 10 15 25% 0% 9% 12%
Food Science & Technology 1 1 0 2 3 1 8 12 25% 50% 0% 14%
Plant Pathology 0 1 0 1 1 3 7 11 0% 25% 0% 8%
School of Natural Resources 3 1 3 7 3 4 25 32 50% 20% 11% 18%
**School of Veterinary Medicine & Biomedical Sciences
0 1 0 1 6 5 14 25 0% 17% 0% 4%
Total 12 9 12 33 42 37 133 212 22% 20% 8% 13%
TOTAL STEM 34 28 24 86 81 107 271 459 30% 21% 8% 16%
Women Men Percent Women SocBeh FIELDS Asst Assc Full Total Asst Assc Full Total Asst Assc Full Total
College of Arts & Sciences
Communication Studies 1 1 2 4 1 1 2 4 50% 50% 50% 50%
Political Science 4 1 2 7 2 2 5 9 67% 33% 29% 44%
Psychology 2 3 3 8 4 3 12 19 33% 50% 20% 30%
Sociology 6 1 4 11 2 1 2 5 75% 50% 67% 69%
Total 13 6 11 30 9 7 21 37 59% 46% 34% 45%
IANR
Agricultural Leadership, Education & Communication
2 0 1 3 0 0 3 3 100% NA 25% 50%
Agricultural Economics 1 1 1 3 0 1 12 13 100% 50% 8% 19%
Total 3 1 2 6 0 1 15 16 100% 50% 12% 27%
TOTAL SocBeh 16 7 13 36 9 8 36 53 64% 47% 27% 40%
*formerly Department of Geosciences, **formerly Department of Veterinary & Biomedical Sciences ***merger of Mechanical Engineering and Engineering Mechanics (Industrial and Management Systems removed) Source: Institutional Research and Planning, October, 2011
130

TABLE 2A. UNL STEM and SocBeh Departmental Gender Composition of Tenure and Non-Tenure Track Faculty, 2007
Tenured and Tenure Track
Non-Tenure Track Non-TT as % of
All
Non-TT as % All Women
STEM Fields All W % W All W % W
College of Arts & Sciences
Biological Sciences 34 11 32% 4 0 0% 11% 0%
Chemistry 22 2 9% 9 2 22% 29% 50%
Computer Science & Engineering 23 3 13% 3 0 0% 12% 0%
Geosciences 19 3 16% 3 1 33% 14% 25%
Mathematics 36 6 17% 12 5 42% 25% 45%
Physics & Astronomy 23 2 9% 2 0 0% 8% 0%
Statistics 13 4 31% 1 1 100% 7% 20%
Total 170 31 18% 34 9 26% 17% 23%
College of Engineering
Architectural Engineering 10 2 20% 1 0 0% 9% 0%
Chemical and Biomolecular Engineering 11 1 9% 1 0 0% 8% 0%
Civil Engineering 21 2 10% 7 1 14% 25% 33%
Computer & Electronics Engineering 10 1 10% 2 1 50% 17% 50%
Construction Management 8 0 0% 3 0 0% 27% na
Construction Systems 12 1 8% 1 0 0% 8% 0%
Electrical Engineering 19 2 11% 2 0 0% 10% 0%
Engineering Mechanics 8 1 13% 1 1 100% 11% 50%
Industrial and Management Systems 10 2 20% 2 0 0% 17% 0%
Mechanical Engineering 16 1 6% 1 1 100% 6% 50%
Total 125 13 10% 21 4 19% 14% 24%
IANR
Agronomy & Horticulture 40 5 13% 5 0 0% 11% 0%
Animal Science 20 3 15% 2 2 100% 9% 40%
Biochemistry 10 3 30% 1 0 0% 9% 0%
Biological Systems Engineering 20 1 5% 1 0 0% 5% 0%
Entomology 12 1 8% 1 0 0% 8% 0%
Food Science & Technology 14 2 14% 0 0 na 0% 0%
Plant Pathology 12 2 17% 0 0 na 0% 0%
School of Natural Resources 38 6 16% 4 2 50% 10% 25%
Veterinary & Biomedical Sciences 21 2 10% 4 0 0% 16% 0%
Total 187 25 13% 18 4 22% 9% 14%
TOTAL STEM 482 69 14% 73 17 23% 13% 20%
Tenured and Tenure Track
Non-Tenure Track Non-TT as % of
All
Non-TT as % All Women
SocBeh Fields All W % W All W % W
College of Arts & Sciences
Communication Studies 8 5 63% 3 2 67% 27% 29%
Political Science 16 3 19% 1 1 100% 6% 25%
Psychology 23 7 30% 10 4 40% 30% 36%
Sociology 17 9 53% 5 3 60% 23% 25%
Total 64 24 38% 19 10 53% 23% 29%
IANR Agricultural Leadership, Education &
Communication 7 1 14% 4 3 75% 36% 75%
Agricultural Economics 18 2 11% 0 0 na 0% 0%
Total 25 3 12% 4 3 75% 14% 50%
TOTAL SocBeh 89 27 30% 23 13 57% 21% 33%
Table excludes visiting faculty. Source: Institutional Research and Planning, October, 2007
131

TABLE 2B. UNL STEM and SocBeh Departmental Gender Composition of Tenure and Non-Tenure Track Faculty, 2008
Tenured and Tenure Track
Non-Tenure Track Non-TT as % of
All
Non-TT as % All Women
STEM Fields All W % W All W % W
College of Arts & Sciences
Biological Sciences 37 13 35% 4 0 0% 10% 0%
Chemistry 20 2 10% 7 2 29% 26% 50%
Computer Science & Engineering 22 3 14% 3 1 33% 12% 25%
Geosciences 19 3 16% 3 1 33% 14% 25%
Mathematics 35 6 17% 11 3 27% 24% 33%
Physics & Astronomy 23 1 4% 4 2 50% 15% 67%
Statistics 13 4 31% 1 1 100% 7% 20%
Total 169 32 19% 33 10 30% 16% 24%
College of Engineering
Architectural Engineering 8 2 25% 1 0 0% 11% 0%
Chemical and Biomolecular Engineering 10 1 10% 1 0 0% 9% 0%
Civil Engineering 22 3 14% 6 2 33% 21% 40%
Computer & Electronics Engineering 10 1 10% 0 0 na 0% 0%
Construction Management 8 0 0% 4 0 0% 33% na
Construction Systems 12 1 8% 1 0 0% 8% 0%
Electrical Engineering 21 2 10% 2 0 0% 9% 0%
Engineering Mechanics 9 1 11% 0 0 na 0% 0%
Industrial and Management Systems 10 1 10% 3 1 33% 23% 50%
Mechanical Engineering 15 1 7% 2 1 50% 12% 50%
Total 125 13 10% 20 4 20% 14% 24%
IANR
Agronomy & Horticulture 38 5 13% 5 0 0% 12% 0%
Animal Science 21 3 14% 2 2 100% 9% 40%
Biochemistry 12 3 25% 1 0 0% 8% 0%
Biological Systems Engineering 20 1 5% 2 0 0% 9% 0%
Entomology 12 1 8% 1 0 0% 8% 0%
Food Science & Technology 15 2 13% 0 0 na 0% 0%
Plant Pathology 12 2 17% 0 0 na 0% 0%
School of Natural Resources 37 6 16% 5 3 60% 12% 33%
Veterinary & Biomedical Sciences 26 3 12% 4 1 25% 13% 25%
Total 193 26 13% 20 6 30% 9% 19%
TOTAL STEM 487 71 15% 73 20 27% 13% 22%
Tenured and Tenure Track
Non-Tenure Track Non-TT as % of
All
Non-TT as % All Women
SocBeh Fields All W % W All W % W
College of Arts & Sciences
Communication Studies 7 4 57% 4 3 75% 36% 43%
Political Science 17 4 24% 1 1 100% 6% 20%
Psychology 24 8 33% 9 5 56% 27% 38%
Sociology 19 11 58% 4 3 75% 17% 21%
Total 67 27 40% 18 12 67% 21% 31%
IANR Agricultural Leadership, Education &
Communication 8 2 25% 3 1 33% 27% 33%
Agricultural Economics 17 2 12% 0 0 na 0% 0%
Total 25 4 16% 3 1 33% 11% 20%
TOTAL SocBeh 92 31 34% 21 13 62% 19% 30%
Table excludes visiting faculty. Source: Institutional Research and Planning, October, 2008
132

TABLE 2C. UNL STEM and SocBeh Departmental Gender Composition of Tenure and Non-Tenure Track Faculty, 2009
Tenured and Tenure Track
Non-Tenure Track Non-TT as % of
All
Non-TT as % All Women
STEM Fields All W % W All W % W
College of Arts & Sciences
Biological Sciences 38 14 37% 3 0 0% 7% 0%
Chemistry 20 2 10% 6 1 17% 23% 33%
Computer Science & Engineering 22 4 18% 2 1 50% 8% 20%
Geosciences 18 2 11% 3 1 33% 14% 33%
Mathematics 37 7 19% 11 4 36% 23% 36%
Physics & Astronomy 24 1 4% 3 1 33% 11% 50%
Statistics 13 4 31% 1 1 100% 7% 20%
Total 172 34 20% 29 9 31% 14% 21%
College of Engineering
Architectural Engineering 11 3 27% 2 1 50% 15% 25%
Chemical and Biomolecular Engineering 11 1 9% 0 0 na 0% 0%
Civil Engineering 22 3 14% 5 1 20% 19% 25%
Computer & Electronics Engineering 10 1 10% 2 1 50% 17% 50%
Construction Management 9 0 0% 3 0 0% 25% na
Construction Systems 11 1 9% 2 0 0% 15% 0%
Electrical Engineering 22 2 9% 2 0 0% 8% 0%
Engineering Mechanics 9 1 11% 0 0 na 0% 0%
Industrial and Management Systems 11 1 9% 2 1 50% 15% 50%
Mechanical Engineering 14 1 7% 5 2 40% 26% 67%
Total 130 14 11% 23 6 26% 15% 30%
IANR
Agronomy & Horticulture 41 5 12% 4 0 0% 9% 0%
Animal Science 24 4 17% 0 0 na 0% 0%
Biochemistry 12 3 25% 1 0 0% 8% 0%
Biological Systems Engineering 22 1 5% 2 0 0% 8% 0%
Entomology 11 1 9% 2 0 0% 15% 0%
Food Science & Technology 15 2 13% 1 1 100% 6% 33%
Plant Pathology 12 2 17% 0 0 na 0% 0%
School of Natural Resources 37 6 16% 6 4 67% 14% 40%
Veterinary & Biomedical Sciences 29 3 10% 5 0 0% 15% 0%
Total 203 27 13% 21 5 24% 9% 16%
TOTAL STEM 505 75 15% 73 20 27% 13% 21%
Tenured and Tenure Track
Non-Tenure Track Non-TT as % of
All
Non-TT as % All Women
SocBeh Fields All W % W All W % W
College of Arts & Sciences
Communication Studies 8 4 50% 6 4 67% 43% 50%
Political Science 17 5 29% 1 0 0% 6% 0%
Psychology 26 8 31% 7 4 57% 21% 33%
Sociology 19 11 58% 3 3 100% 14% 21%
Total 70 28 40% 17 11 65% 20% 28%
IANR Agricultural Leadership, Education &
Communication 7 2 29% 8 2 25% 53% 50%
Agricultural Economics 17 3 18% 0 0 na 0% 0%
Total 24 5 21% 8 2 25% 25% 29%
TOTAL SocBeh 94 33 35% 25 13 52% 21% 28%
Table excludes visiting faculty. Source: Institutional Research and Planning, October, 2009
133

TABLE 2D. UNL STEM and SocBeh Departmental Gender Composition of Tenure and Non-Tenure Track Faculty, 2010
Tenured and Tenure Track
Non-Tenure Track Non-TT as % of
All
Non-TT as % All Women
STEM Fields All W % W All W % W
College of Arts & Sciences
Biological Sciences 39 14 36% 3 0 0% 7% 0%
Chemistry 21 2 10% 7 3 43% 25% 60%
Computer Science & Engineering 24 4 17% 2 1 50% 8% 20%
Geosciences 19 3 16% 2 1 50% 10% 25%
Mathematics 38 7 18% 14 6 43% 27% 46%
Physics & Astronomy 24 1 4% 4 1 25% 14% 50% Statistics 13 4 31% 1 1 100% 7% 20%
Total 178 35 20% 33 13 39% 16% 27% College of Engineering
Architectural Engineering 11 3 27% 7 0 0% 39% 0%
Chemical and Biomolecular Engineering 13 2 15% 0 0 na 0% 0%
Civil Engineering 23 4 17% 3 1 33% 12% 20%
Computer & Electronics Engineering 10 1 10% 2 1 50% 17% 50%
Construction Management 9 0 0% 0 0 na 0% na
Construction Systems 11 1 9% 2 1 50% 15% 50%
Electrical Engineering 22 3 14% 4 1 25% 15% 25%
Engineering Mechanics 9 1 11% 0 0 na 0% 0%
Industrial and Management Systems 12 1 8% 1 1 100% 8% 50%
Mechanical Engineering 14 1 7% 2 1 50% 13% 50% Total 134 17 13% 21 6 29% 14% 26%
IANR Agronomy & Horticulture 54 6 11% 6 1 17% 10% 14%
Animal Science 30 6 20% 1 1 100% 3% 14%
Biochemistry 14 4 29% 1 0 0% 7% 0%
Biological Systems Engineering 26 1 4% 2 0 0% 7% 0%
Entomology 16 2 13% 1 0 0% 6% 0%
Food Science & Technology 16 3 19% 0 0 na 0% 0%
Plant Pathology 12 1 8% 0 0 na 0% 0%
School of Natural Resources 36 6 17% 5 4 80% 12% 40%
Veterinary & Biomedical Sciences 26 2 8% 4 0 0% 13% 0% Total 230 31 13% 20 6 30% 8% 16%
TOTAL STEM 542 83 15% 74 25 34% 12% 23%
Tenured and Tenure Track
Non-Tenure Track Non-TT as % of
All
Non-TT as % All Women
SocBeh Fields All W % W All W % W
College of Arts & Sciences
Communication Studies 8 4 50% 5 4 80% 38% 50%
Political Science 17 7 41% 1 0 0% 6% 0%
Psychology 26 8 31% 6 4 67% 19% 33% Sociology 18 12 67% 4 2 50% 18% 14%
Total 69 31 45% 16 10 63% 19% 24% IANR
Agricultural Leadership, Education & Communication
10 4 40% 4 2 50% 29% 33%
Agricultural Economics 19 3 16% 1 0 0% 5% 0%
Total 29 7 24% 5 2 40% 15% 22%
TOTAL SocBeh 98 38 39% 21 12 57% 18% 24%
Table excludes visiting faculty. Source: Institutional Research and Planning, October, 2010
134

TABLE 2E. UNL STEM and SocBeh Departmental Gender Composition of Tenure and Non-Tenure Track Faculty, 2011
Tenured and Tenure Track
Non-Tenure Track Non-TT as % of
All
Non-TT as % All
Women
STEM Fields All W % W All W % W
College of Arts & Sciences Biological Sciences 37 15 41% 5 3 60% 12% 17%
Chemistry 25 3 12% 7 3 43% 22% 50% Computer Science & Engineering 23 4 17% 2 0 0% 8% 0%
*Earth and Atmospheric Sciences 23 5 22% 3 2 67% 12% 29% Mathematics 36 6 17% 19 7 37% 35% 54%
Physics & Astronomy 25 2 8% 3 1 33% 11% 33% Statistics 12 3 25% 1 1 100% 8% 25%
Total 181 38 21% 40 17 43% 18% 31%
****College of Engineering Architectural Engineering 9 3 33% 13 0 0% 59% 0%
Chemical and Biomolecular Engineering 12 2 17% 2 1 na 14% 33%
Civil Engineering 21 4 19% 2 1 50% 9% 20% Computer & Electronics Engineering 11 1 9% 2 1 50% 15% 50%
Construction Management 8 0 0% 0 0 na 0% na Construction Systems 11 1 9% 1 0 0% 8% 0% Electrical Engineering 19 1 5% 5 1 20% 21% 50%
***Mechanical & Materials Engineering 28 3 11% 1 1 100% 3% 25% Total 119 15 13% 26 5 19% 18% 25%
IANR Agronomy & Horticulture 56 6 11% 9 3 33% 14% 33%
Animal Science 35 7 20% 1 1 100% 3% 13% Biochemistry 18 5 28% 1 0 0% 5% 0%
Biological Systems Engineering 28 2 7% 4 1 25% 13% 33% Entomology 17 2 12% 4 0 0% 19% 0%
Food Science & Technology 14 2 14% 0 0 na 0% 0% Plant Pathology 12 1 8% 0 0 na 0% 0%
**School of Veterinary Medicine & Biomedical Sciences
39 7 18% 5 5 100% 11% 42%
Veterinary & Biomedical Sciences 26 1 4% 5 1 20% 16% 50% Total 245 33 13% 29 11 38% 11% 25%
TOTAL STEM 545 86 16% 95 33 35% 15% 28%
Tenured and Tenure Track
Non-Tenure Track Non-TT as % of
All
Non-TT as % All
Women
SocBeh Fields All W % W All W % W
College of Arts & Sciences Communication Studies 8 4 50% 7 5 71% 47% 56%
Political Science 16 7 44% 1 0 0% 6% 0% Psychology 27 8 30% 4 4 100% 13% 33%
Sociology 16 11 69% 7 3 43% 30% 21% Total 67 30 45% 19 12 63% 22% 29%
IANR Agricultural Leadership, Education &
Communication 6 3 50% 5 1 20% 45% 25%
Agricultural Economics 16 3 19% 1 0 0% 6% 0% Total 22 6 27% 6 1 17% 21% 14%
TOTAL SocBeh 89 36 40% 25 13 52% 22% 27%
*formerly Department of Geosciences, **formerly Department of Veterinary & Biomedical Sciences ***merger of Mechanical Engineering and Engineering Mechanics (Industrial and Management Systems removed) Source: Institutional Research and Planning, October, 2011 (Table excludes visiting faculty.)
135
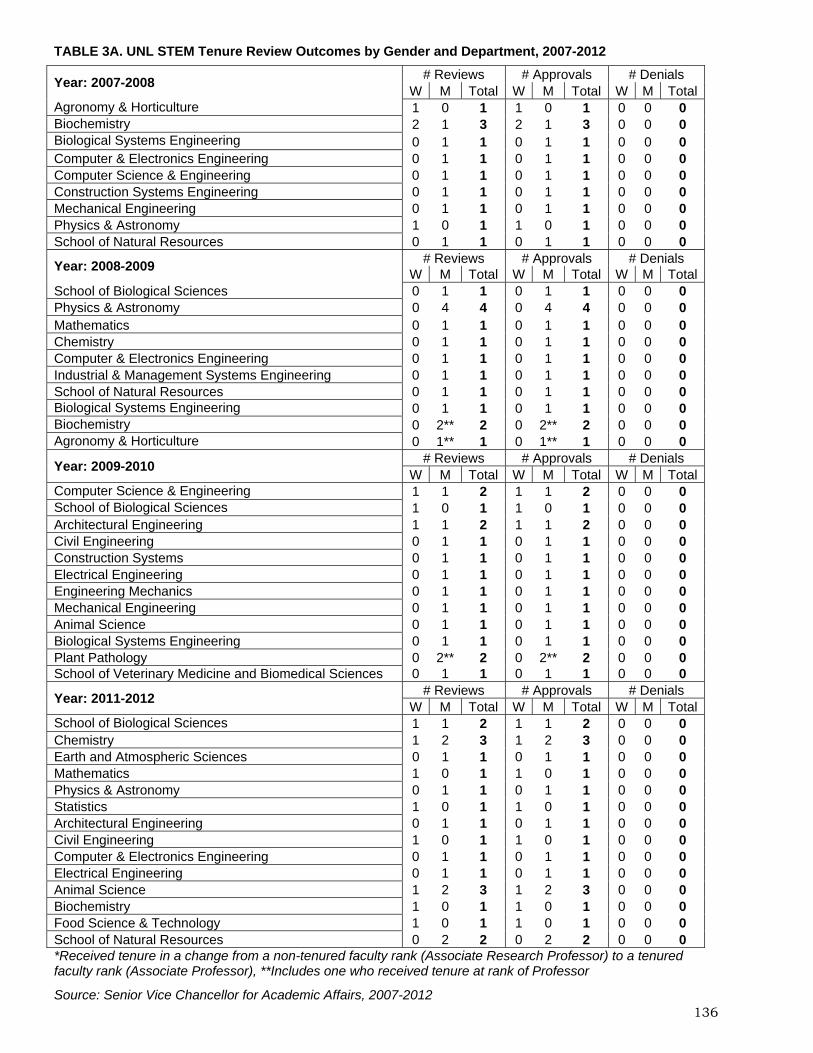
TABLE 3A. UNL STEM Tenure Review Outcomes by Gender and Department, 2007-2012
Year: 2007-2008 # Reviews # Approvals # Denials
W M Total W M Total W M TotalAgronomy & Horticulture 1 0 1 1 0 1 0 0 0 Biochemistry 2 1 3 2 1 3 0 0 0 Biological Systems Engineering 0 1 1 0 1 1 0 0 0 Computer & Electronics Engineering 0 1 1 0 1 1 0 0 0 Computer Science & Engineering 0 1 1 0 1 1 0 0 0 Construction Systems Engineering 0 1 1 0 1 1 0 0 0 Mechanical Engineering 0 1 1 0 1 1 0 0 0 Physics & Astronomy 1 0 1 1 0 1 0 0 0 School of Natural Resources 0 1 1 0 1 1 0 0 0
Year: 2008-2009 # Reviews # Approvals # Denials
W M Total W M Total W M TotalSchool of Biological Sciences 0 1 1 0 1 1 0 0 0 Physics & Astronomy 0 4 4 0 4 4 0 0 0 Mathematics 0 1 1 0 1 1 0 0 0 Chemistry 0 1 1 0 1 1 0 0 0 Computer & Electronics Engineering 0 1 1 0 1 1 0 0 0 Industrial & Management Systems Engineering 0 1 1 0 1 1 0 0 0 School of Natural Resources 0 1 1 0 1 1 0 0 0 Biological Systems Engineering 0 1 1 0 1 1 0 0 0 Biochemistry 0 2** 2 0 2** 2 0 0 0 Agronomy & Horticulture 0 1** 1 0 1** 1 0 0 0
Year: 2009-2010 # Reviews # Approvals # Denials
W M Total W M Total W M TotalComputer Science & Engineering 1 1 2 1 1 2 0 0 0 School of Biological Sciences 1 0 1 1 0 1 0 0 0 Architectural Engineering 1 1 2 1 1 2 0 0 0 Civil Engineering 0 1 1 0 1 1 0 0 0 Construction Systems 0 1 1 0 1 1 0 0 0 Electrical Engineering 0 1 1 0 1 1 0 0 0 Engineering Mechanics 0 1 1 0 1 1 0 0 0 Mechanical Engineering 0 1 1 0 1 1 0 0 0 Animal Science 0 1 1 0 1 1 0 0 0 Biological Systems Engineering 0 1 1 0 1 1 0 0 0 Plant Pathology 0 2** 2 0 2** 2 0 0 0 School of Veterinary Medicine and Biomedical Sciences 0 1 1 0 1 1 0 0 0
Year: 2011-2012 # Reviews # Approvals # Denials
W M Total W M Total W M TotalSchool of Biological Sciences 1 1 2 1 1 2 0 0 0 Chemistry 1 2 3 1 2 3 0 0 0 Earth and Atmospheric Sciences 0 1 1 0 1 1 0 0 0 Mathematics 1 0 1 1 0 1 0 0 0 Physics & Astronomy 0 1 1 0 1 1 0 0 0 Statistics 1 0 1 1 0 1 0 0 0 Architectural Engineering 0 1 1 0 1 1 0 0 0 Civil Engineering 1 0 1 1 0 1 0 0 0 Computer & Electronics Engineering 0 1 1 0 1 1 0 0 0 Electrical Engineering 0 1 1 0 1 1 0 0 0 Animal Science 1 2 3 1 2 3 0 0 0 Biochemistry 1 0 1 1 0 1 0 0 0 Food Science & Technology 1 0 1 1 0 1 0 0 0 School of Natural Resources 0 2 2 0 2 2 0 0 0 *Received tenure in a change from a non-tenured faculty rank (Associate Research Professor) to a tenured faculty rank (Associate Professor), **Includes one who received tenure at rank of Professor
Source: Senior Vice Chancellor for Academic Affairs, 2007-2012 136
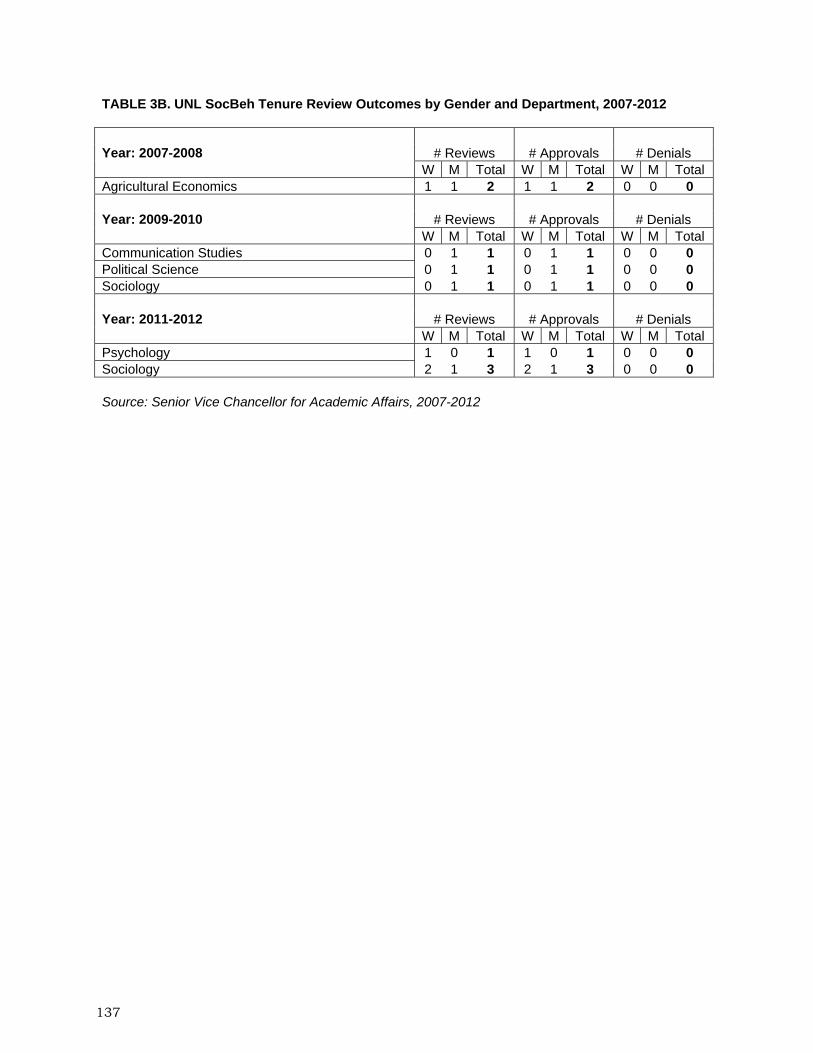
TABLE 3B. UNL SocBeh Tenure Review Outcomes by Gender and Department, 2007-2012
Year: 2007-2008 # Reviews # Approvals # Denials W M Total W M Total W M Total
Agricultural Economics 1 1 2 1 1 2 0 0 0
Year: 2009-2010 # Reviews # Approvals # Denials W M Total W M Total W M Total
Communication Studies 0 1 1 0 1 1 0 0 0 Political Science 0 1 1 0 1 1 0 0 0 Sociology 0 1 1 0 1 1 0 0 0
Year: 2011-2012 # Reviews # Approvals # Denials W M Total W M Total W M Total
Psychology 1 0 1 1 0 1 0 0 0 Sociology 2 1 3 2 1 3 0 0 0
Source: Senior Vice Chancellor for Academic Affairs, 2007-2012
137

TABLE 4A. STEM Promotion Review Outcomes by Gender: Associate to Full Professor, 2007-2012
Year: 2007-2008 # Reviews # Approvals # Denials
W M Total W M Total W M Total Agronomy & Horticulture 1 2 3 1 2 3 0 0 0 Biological Sciences 0 1 1 0 1 1 0 0 0 Biological Systems Engineering 0 1 1 0 1 1 0 0 0 Chemistry 0 1 1 0 1 1 0 0 0 Civil Engineering 0 1 1 0 1 1 0 0 0 Computer Science 0 1 1 0 1 1 0 0 0 Electrical Engineering 0 2 2 0 2 2 0 0 0 Physics 0 2 2 0 2 2 0 0 0 School of Natural Resources 0 3 3 0 3 3 0 0 0 TOTAL 1 14 15 1 14 15 0 0 0
Year: 2008-2009 # Reviews # Approvals # Denials
W M Total W M Total W M Total Biological Sciences 1 1 2 1 1 2 0 0 0 Geosciences 0 1 1 0 1 1 0 0 0 Chemistry 0 1 1 0 1 1 0 0 0 Computer Science & Engineering 0 1 1 0 1 1 0 0 0 Statistics 0 1 1 0 1 1 0 0 0 Civil Engineering 0 1 1 0 1 1 0 0 0 School of Natural Resources 0 2 2 0 2 2 0 0 0 Biochemistry 0 1 1 0 1 1 0 0 0 Agronomy & Horticulture 0 1 1 0 1 1 0 0 0 Plant Pathology 0 1 1 0 1 1 0 0 0 TOTAL 1 11 12 1 11 12 0 0 0
Year: 2009-2010 # Reviews # Approvals # Denials
W M Total W M Total W M Total Computer Science & Engineering 0 1 1 0 1 1 0 0 0 Physics & Astronomy 0 1 1 0 1 1 0 0 0 School of Biological Sciences 0 2 2 0 2 2 0 0 0 Architectural Engineering 0 1 1 0 1 1 0 0 0 Chemical & Biomolecular Engineering 1 1 2 1 1 2 0 0 0 Engineering Mechanics 0 2 2 0 2 2 0 0 0 Mechanical Engineering 0 1 1 0 1 1 0 0 0 Agronomy & Horticulture 0 1 1 0 1 1 0 0 0 Animal Science 0 1 1 0 1 1 0 0 0 Biochemistry 0 1 1 0 1 1 0 0 0 Entomology 1 1 2 1 1 2 0 0 0 Plant Pathology 0 1 1 0 1 1 0 0 0 School of Natural Resources 0 2 2 0 2 2 0 0 0 TOTAL 2 16 18 2 16 18 0 0 0
Year: 2011-2012 # Reviews # Approvals # Denials
W M Total W M Total W M Total School of Biological Sciences 0 1 1 0 1 1 0 0 0 Earth & Atmospheric Sciences 1 0 1 1 0 1 0 0 0 Physics & Astronomy 0 1 1 0 1 1 0 0 0 Statistics 0 1 1 0 1 1 Electrical Engineering 0 1 1 0 1 1 0 0 0 Animal Science 0 1 1 0 1 1 0 0 0 Biological Systems Engineering 0 1 1 0 1 1 0 0 0 Food Science & Technology 0 1 1 0 1 1 0 0 0 Plant Pathology 0 1 1 0 1 1 0 0 0 School of Natural Resources 1 0 1 1 0 1 0 0 0 TOTAL 2 8 10 2 8 10 0 0 0 Source: Senior Vice Chancellor for Academic Affairs, 2007-2012
138
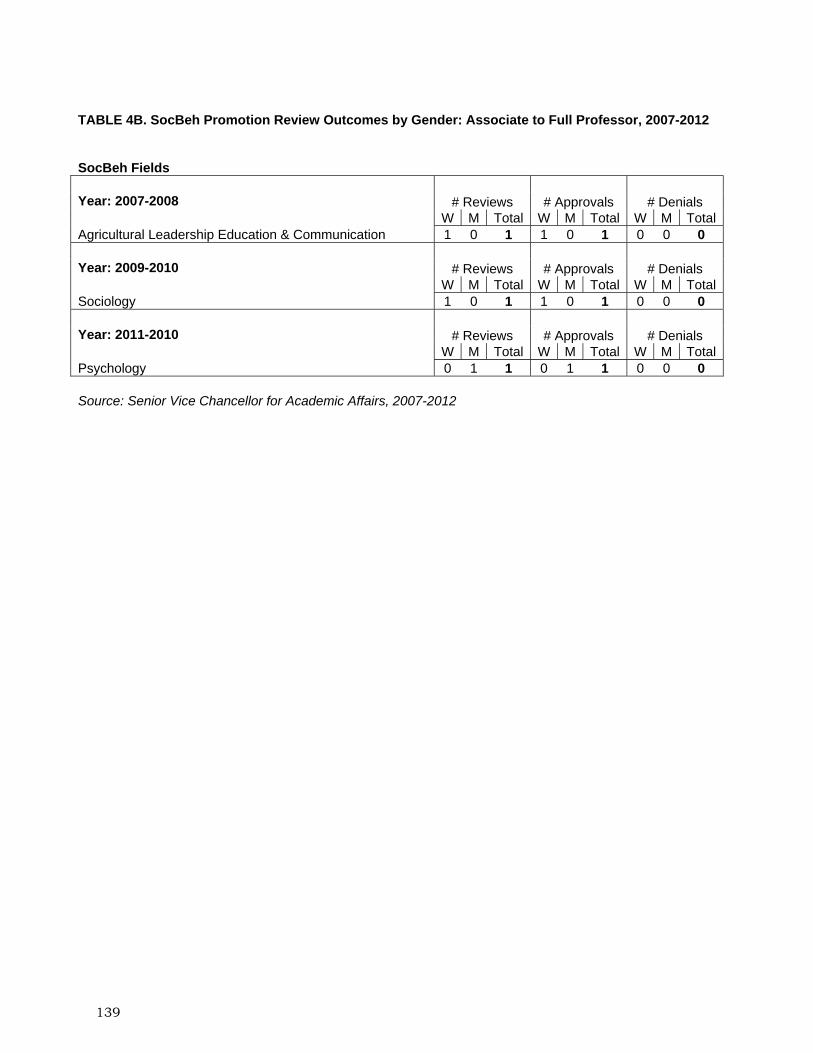
TABLE 4B. SocBeh Promotion Review Outcomes by Gender: Associate to Full Professor, 2007-2012
SocBeh Fields
Year: 2007-2008 # Reviews # Approvals # Denials W M Total W M Total W M Total
Agricultural Leadership Education & Communication 1 0 1 1 0 1 0 0 0
Year: 2009-2010 # Reviews # Approvals # Denials W M Total W M Total W M Total
Sociology 1 0 1 1 0 1 0 0 0
Year: 2011-2010 # Reviews # Approvals # Denials W M Total W M Total W M Total
Psychology 0 1 1 0 1 1 0 0 0
Source: Senior Vice Chancellor for Academic Affairs, 2007-2012
139

TABLE 5A. Years in Rank at the Associate Professor Level for STEM and SocBeh Faculty NOT Hired as Associate Professors, 2007-2011
YEAR: 2007 STEM SocBeh
Years in Rank
Women Men Women Men
Number % of
Women Number
% of Men
Number% of
Women Number
% of Men
0-2 11 55% 24 26% 1 56% 1 33% 3-5 5 25% 20 21% 1 11% 2 33% 6-8 1 5% 12 13% 0 0% 1 17% 9-11 3 15% 10 11% 1 22% 0 0% 12-14 0 0% 13 14% 0 11% 0 0% 15 or more 0 0% 15 16% 1 0% 1 17%
YEAR: 2008 STEM SocBeh
Years in Rank
Women Men Women Men
Number % of
Women Number
% of Men
Number% of
Women Number
% of Men
0-2 13 65% 26 29% 2 50% 2 33% 3-5 3 15% 16 18% 0 0% 2 33% 6-8 1 5% 10 11% 1 0% 1 17% 9-11 2 10% 8 9% 1 25% 0 0% 12-14 1 5% 14 16% 0 0% 0 0% 15 or more 0 0% 15 17% 0 0% 1 17%
YEAR: 2009 STEM SocBeh
Years in Rank
Women Men Women Men
Number % of
Women Number
% of Men
Number% of
Women Number
% of Men
0-2 7 35% 32 35% 2 40% 1 20% 3-5 7 35% 11 12% 1 20% 0 0% 6-8 3 15% 17 18% 1 0% 3 60% 9-11 1 5% 4 4% 0 0% 0 0% 12-14 2 10% 13 14% 1 20% 0 0% 15 or more 0 0% 15 16% 0 0% 1 20%
YEAR: 2010 STEM SocBeh
Years in Rank
Women Men Women Men
Number % of
Women Number
% of Men
Number% of
Women Number
% of Men
0-2 7 30% 33 35% 2 50% 4 50% 3-5 10 43% 18 19% 1 25% 0 0% 6-8 3 13% 10 11% 0 0% 2 25% 9-11 0 0% 5 5% 0 0% 1 0% 12-14 3 13% 8 8% 1 25% 0 0% 15 or more 0 0% 21 22% 0 0% 1 13%
YEAR: 2011 STEM SocBeh
Years in Rank
Women Men Women Men
Number % of
Women Number
% of Men
Number% of
Women Number
% of Men
0-2 5 30% 28 32% 3 50% 5 83% 3-5 10 43% 23 26% 2 33% 0 0% 6-8 3 13% 2 2% 0 0% 1 17%
140

9-11 1 0% 7 8% 0 0% 0 0% 12-14 2 13% 5 6% 1 17% 0 0% 15 or more 1 0% 22 25% 0 0% 0 0% Source: Institutional Research and Planning, 2007-2011 TABLE 5B. Years in Rank at the Associate Professor Level for STEM and SocBeh Faculty Hired as Associate Professors, 2007-2011
YEAR: 2007 STEM SocBeh
Years in Rank
Women Men Women Men
Number % of
Women Number
% of Men
Number% of
Women Number
% of Men
0-2 0 0% 3 13% 0 56% 1 33% 3-5 1 17% 2 9% 0 11% 0 33% 6-8 1 17% 7 30% 0 0% 1 17% 9-11 3 50% 3 13% 1 22% 0 0% 12-14 1 17% 2 9% 0 11% 0 0% 15 or more 0 0% 6 26% 0 0% 1 17%
YEAR: 2008 STEM SocBeh
Years in Rank
Women Men Women Men
Number % of
Women Number
% of Men
Number% of
Women Number
% of Men
0-2 1 14% 6 30% 1 50% 1 33% 3-5 0 0% 2 10% 0 0% 0 0% 6-8 2 29% 1 5% 0 0% 1 33% 9-11 2 29% 5 25% 1 50% 0 0% 12-14 1 14% 1 5% 0 0% 0 0% 15 or more 1 14% 5 25% 0 0% 1 33%
YEAR: 2009 STEM SocBeh
Years in Rank
Women Men Women Men
Number % of
Women Number
% of Men
Number% of
Women Number
% of Men
0-2 1 17% 7 35% 1 50% 1 33% 3-5 0 0% 2 10% 0 0% 0 0% 6-8 1 17% 0 0% 0 0% 0 0% 9-11 2 33% 6 30% 1 0% 1 0% 12-14 1 17% 0 0% 0 0% 0 0% 15 or more 1 17% 5 25% 0 0% 1 33%
YEAR: 2010 STEM SocBeh
Years in Rank
Women Men Women Men
Number % of
Women Number
% of Men
Number% of
Women Number
% of Men
0-2 1 20% 3 17% 1 50% 0 0% 3-5 0 0% 6 33% 0 0% 1 33% 6-8 0 0% 1 6% 0 0% 0 0% 9-11 0 0% 3 17% 0 0% 1 0% 12-14 3 60% 0 0% 1 50% 0 0% 15 or more 1 20% 5 28% 0 0% 1 33%
141

YEAR: 2011 STEM SocBeh
Years in Rank
Women Men Women Men
Number % of
Women Number
% of Men
Number% of
Women Number
% of Men
0-2 0 0% 3 15% 0 0% 0 0% 3-5 1 17% 6 30% 1 100% 1 50% 6-8 1 17% 5 25% 0 0% 1 50% 9-11 0 0% 0 0% 0 0% 0 0% 12-14 2 33% 2 10% 0 0% 0 0% 15 or more 2 33% 4 20% 0 0% 0 0% Source: Institutional Research and Planning, 2007-2011
142

TABLE 6A. UNL STEM Voluntary, Non-Retirement Attrition by Rank and Gender, 2007-2011
Year: 2007-2008 Assistant Associate Full W M W M W M
Animal Science 0 0 1 0 0 0 Architectural Engineering 0 0 0 1 0 0
Computer Science & Engineering 0 1 0 0 0 0 Earth & Atmospheric Sciences 0 1 0 0 0 0 Industrial & Mgmt Systems 0 0 1 0 0 0 Mechanical Engineering 0 0 0 1 0 0 Physics and Astronomy 0 0 1 0 0 0
Veterinary and Biomedical Sciences 0 0 0 0 0 1
TOTAL 0 2 3 2 0 1
Year: 2008-2009 Assistant Associate Full W M W M W M
Architectural Engineering 0 0 0 1 0 0 Biochemistry 0 0 0 0 0 1 Mathematics 0 1 0 0 0 0 Mechanical Engineering 0 1 0 0 0 0 School of Biological Sciences 0 0 0 1 0 0 TOTAL 0 2 0 2 0 1
Year: 2009-2010 Assistant Associate Full W M W M W M
Animal Science 1 0 0 0 0 0 Biological Systems Engineering 0 0 0 1 0 0 School of Natural Resources 0 1 0 0 0 0 TOTAL 1 1 0 1 0 0
Year: 2010-2011 Assistant Associate Full W M W M W M
Biological Sciences 0 1 0 0 0 0
Computer Science & Engineering 0 0 0 1 0 0
Industrial & Mgmt Systems 0 0 0 1 0 0 TOTAL 0 1 0 2 0 0
Year: 2011-2012 * Assistant Associate Full W M W M W M
Architectural Engineering 0 0 0 0 0 1
Chemical & Biomolecular Engineering 0 0 0 0 0 1
Construction Management 0 0 0 0 0 1 Electrical Engineering 2 0 0 1 0 0 Food Science & Technology 0 1 0 0 0 0 Mathematics 0 0 0 0 0 1 Statistics 1 0 0 0 0 0 TOTAL 3 1 0 1 0 4 * Data for 2011-12 are current through April 1, 2012 Source: Payroll, September 2 through September 1 of each year
143
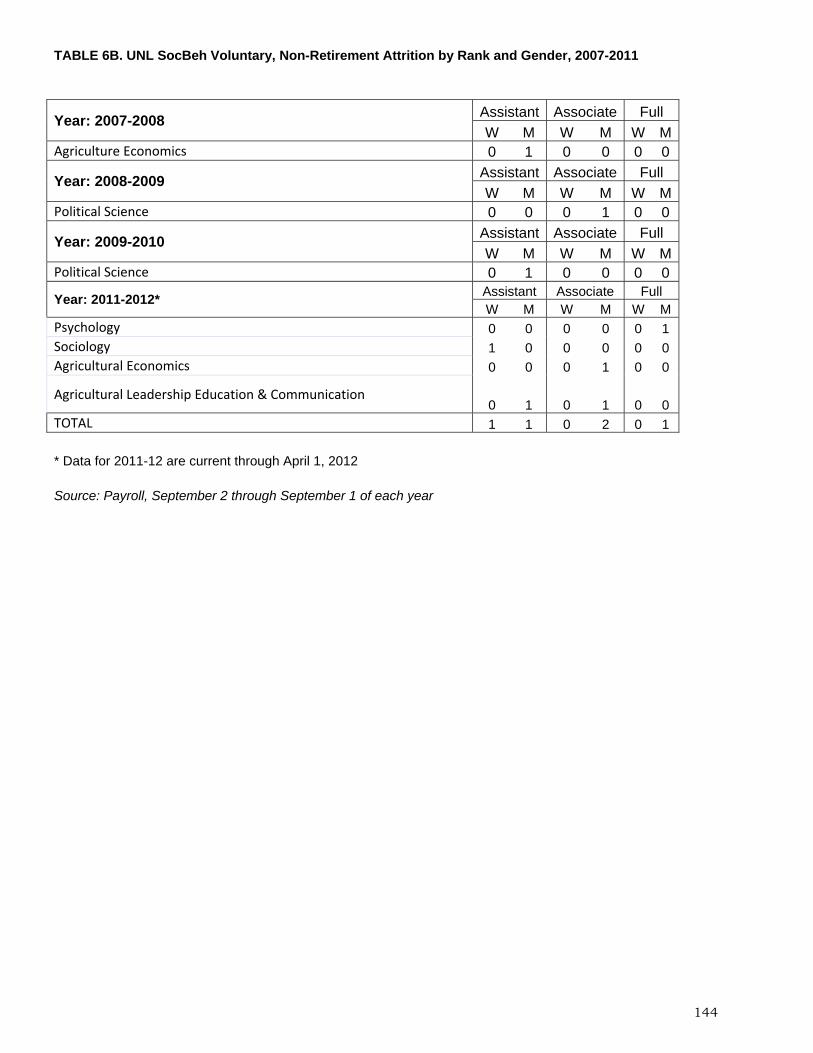
TABLE 6B. UNL SocBeh Voluntary, Non-Retirement Attrition by Rank and Gender, 2007-2011
Year: 2007-2008 Assistant Associate Full
W M W M W MAgriculture Economics 0 1 0 0 0 0
Year: 2008-2009 Assistant Associate Full
W M W M W MPolitical Science 0 0 0 1 0 0
Year: 2009-2010 Assistant Associate Full
W M W M W MPolitical Science 0 1 0 0 0 0
Year: 2011-2012* Assistant Associate Full W M W M W M
Psychology 0 0 0 0 0 1 Sociology 1 0 0 0 0 0 Agricultural Economics 0 0 0 1 0 0
Agricultural Leadership Education & Communication 0 1 0 1 0 0
TOTAL 1 1 0 2 0 1
* Data for 2011-12 are current through April 1, 2012 Source: Payroll, September 2 through September 1 of each year
144

TABLE 7a. Number and Percent of UNL New-Hires in STEM and SocBeh Fields by Rank and Department, 2007 Assistant Associate Full
STEM Fields M W % W M W % W M W % W College of Arts & Sciences
Biological Sciences 0 1 100% 0 0 na 0 0 na Chemistry 0 1 100% 0 0 na 0 0 na
Computer Science & Engineering 1 0 0% 0 0 na 0 0 na Geosciences 1 0 0% 0 0 na 0 0 na Mathematics 1 1 50% 0 0 na 0 0 na
Physics & Astronomy 2 0 0% 0 0 na 0 0 na Statistics 0 1 100% 0 0 na 0 0 na
College of Engineering
Architectural Engineering 0 0 na 0 0 na 0 0 na Chemical and Biomolecular Engineering 0 0 na 0 0 na 0 0 na
Civil Engineering 0 0 na 0 0 na 0 0 na Computer & Electronics Engineering 0 0 na 0 0 na 1 0 0%
Construction Management 1 0 0% 0 0 na 0 0 na Construction Systems 0 1 100% 0 0 na 0 0 na Electrical Engineering 0 1 100% 0 0 na 0 0 na
Engineering Mechanics 0 0 na 0 0 na 0 0 na Industrial and Management Systems 1 0 0% 0 0 na 0 0 na
Mechanical Engineering 0 0 na 0 0 na 0 0 na
Institute of Agriculture & Natural Resources (IANR) Academic Units
Agronomy & Horticulture 0 0 na 0 0 na 0 0 na Animal Sciences 0 0 na 0 0 na 0 0 na
Biochemistry 0 0 na 0 0 na 0 0 na Biological Systems Engineering 0 1 100% 0 0 na 0 0 na
Entomology 0 0 na 0 0 na 0 0 na Food Science & Technology 0 0 na 0 0 na 0 0 na
Plant Pathology 0 0 na 0 0 na 0 0 na School of Natural Resources 0 0 na 0 0 na 0 0 na
Veterinary & Biomedical Sciences 1 0 0% 2 0 0% 0 0 na
TOTAL STEM 8 7 47% 2 0 0% 1 0 0% Assistant Associate Full
SocBeh Fields M W % W M W % W M W % W College of Arts & Sciences
Communication Studies 0 0 na 0 0 na 0 0 na Political Science 2 0 0% 1 0 0% 0 1 100%
Psychology 1 0 0% 0 0 na 0 0 na Sociology 1 3 75% 0 0 na 0 0 na
Institute of Agriculture & Natural Resources (IANR) Academic Units
Agricultural Leadership Education & Communication 0 0 na 0 0 na 0 0 na Agricultural Economics 0 0 na 0 0 na 0 0 na
TOTAL SocBeh 4 3 43% 1 0 0% 0 1 100%
Source: Institutional Research and Planning, October,2007
145
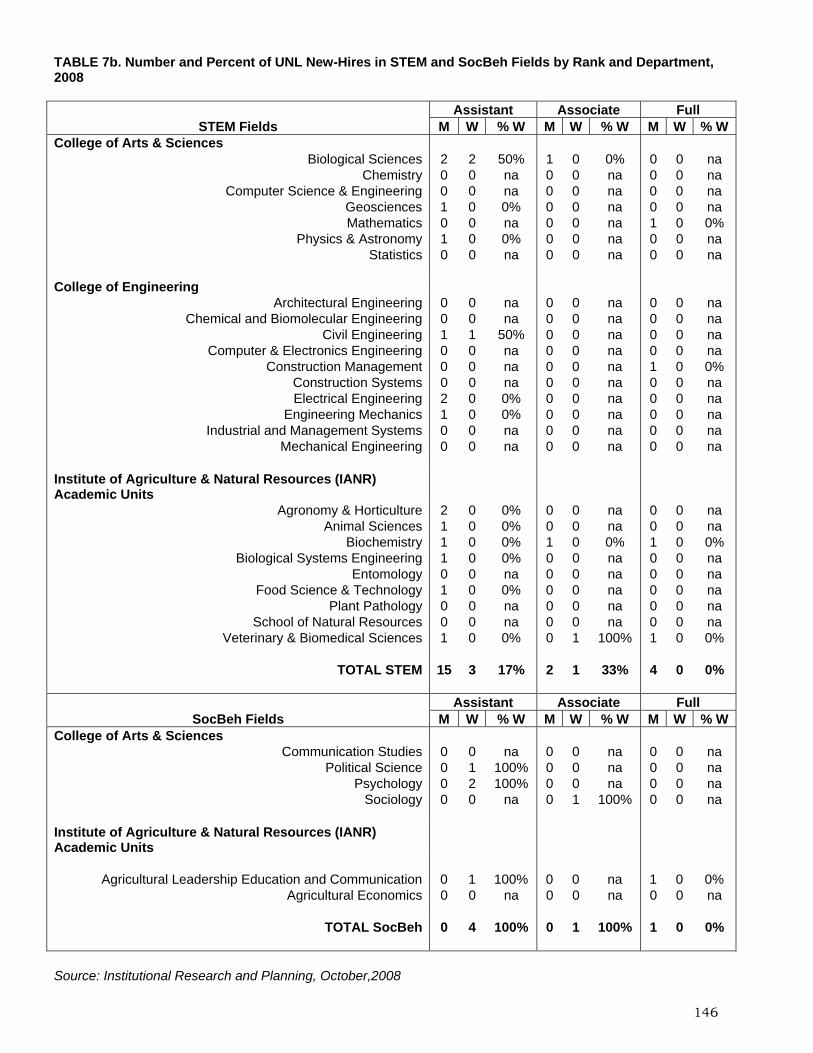
TABLE 7b. Number and Percent of UNL New-Hires in STEM and SocBeh Fields by Rank and Department, 2008 Assistant Associate Full
STEM Fields M W % W M W % W M W % WCollege of Arts & Sciences
Biological Sciences 2 2 50% 1 0 0% 0 0 na Chemistry 0 0 na 0 0 na 0 0 na
Computer Science & Engineering 0 0 na 0 0 na 0 0 na Geosciences 1 0 0% 0 0 na 0 0 na Mathematics 0 0 na 0 0 na 1 0 0%
Physics & Astronomy 1 0 0% 0 0 na 0 0 na Statistics 0 0 na 0 0 na 0 0 na
College of Engineering
Architectural Engineering 0 0 na 0 0 na 0 0 na Chemical and Biomolecular Engineering 0 0 na 0 0 na 0 0 na
Civil Engineering 1 1 50% 0 0 na 0 0 na Computer & Electronics Engineering 0 0 na 0 0 na 0 0 na
Construction Management 0 0 na 0 0 na 1 0 0% Construction Systems 0 0 na 0 0 na 0 0 na Electrical Engineering 2 0 0% 0 0 na 0 0 na
Engineering Mechanics 1 0 0% 0 0 na 0 0 na Industrial and Management Systems 0 0 na 0 0 na 0 0 na
Mechanical Engineering 0 0 na 0 0 na 0 0 na
Institute of Agriculture & Natural Resources (IANR) Academic Units
Agronomy & Horticulture 2 0 0% 0 0 na 0 0 na Animal Sciences 1 0 0% 0 0 na 0 0 na
Biochemistry 1 0 0% 1 0 0% 1 0 0% Biological Systems Engineering 1 0 0% 0 0 na 0 0 na
Entomology 0 0 na 0 0 na 0 0 na Food Science & Technology 1 0 0% 0 0 na 0 0 na
Plant Pathology 0 0 na 0 0 na 0 0 na School of Natural Resources 0 0 na 0 0 na 0 0 na
Veterinary & Biomedical Sciences 1 0 0% 0 1 100% 1 0 0%
TOTAL STEM 15 3 17% 2 1 33% 4 0 0% Assistant Associate Full
SocBeh Fields M W % W M W % W M W % WCollege of Arts & Sciences
Communication Studies 0 0 na 0 0 na 0 0 na Political Science 0 1 100% 0 0 na 0 0 na
Psychology 0 2 100% 0 0 na 0 0 na Sociology 0 0 na 0 1 100% 0 0 na
Institute of Agriculture & Natural Resources (IANR) Academic Units
Agricultural Leadership Education and Communication 0 1 100% 0 0 na 1 0 0% Agricultural Economics 0 0 na 0 0 na 0 0 na
TOTAL SocBeh 0 4 100% 0 1 100% 1 0 0%
Source: Institutional Research and Planning, October,2008
146

TABLE 7c. Number and Percent of UNL New-Hires in STEM and SocBeh Fields by Rank and Department, 2009 Assistant Associate Full
STEM Fields M W % W M W % W M W % WCollege of Arts & Sciences
Biological Sciences 1 1 50% 0 0 na 0 0 na Chemistry 0 0 na 0 0 na 0 0 na
Computer Science & Engineering 0 1 100% 0 0 na 0 0 na Geosciences 1 0 0% 0 0 na 0 0 na Mathematics 1 1 50% 0 0 na 0 0 na
Physics & Astronomy 1 0 0% 0 0 na 0 0 na Statistics 0 0 na 0 0 na 0 0 na
College of Engineering
Architectural Engineering 1 1 50% 0 0 na 0 0 na Chemical and Biomolecular Engineering 0 0 na 1 0 0% 0 0 na
Civil Engineering 1 0 0% 0 0 na 0 0 na Computer & Electronics Engineering 1 0 0% 0 0 na 0 0 na
Construction Management 0 0 na 1 0 0% 0 0 na Construction Systems 0 0 na 0 0 na 0 0 na Electrical Engineering 0 0 na 0 0 na 0 0 na
Engineering Mechanics 0 0 na 0 0 na 0 0 na Industrial and Management Systems 0 0 na 0 0 na 1 0 0%
Mechanical Engineering 1 1 50% 0 0 na 0 0 na
Institute of Agriculture & Natural Resources (IANR) Academic Units
Agronomy & Horticulture 2 0 0% 0 0 na 0 0 na Animal Sciences 1 1 50% 0 0 na 1 0 0%
Biochemistry 0 0 na 0 0 na 0 0 na Biological Systems Engineering 2 0 0% 0 0 na 0 0 na
Entomology 0 0 na 0 0 na 0 0 na Food Science & Technology 0 0 na 0 0 na 0 0 na
Plant Pathology 1 0 0% 0 0 na 0 0 na School of Natural Resources 1 1 50% 0 0 na 0 0 na
Veterinary & Biomedical Sciences 3 0 0% 0 0 na 0 0 na
TOTAL STEM 18 7 28% 2 0 0% 2 0 0% Assistant Associate Full
SocBeh Fields M W % W M W % W M W % WCollege of Arts & Sciences
Communication Studies 1 0 0% 0 0 na 0 0 na Political Science 1 1 50% 0 0 na 0 0 na
Psychology 2 0 0% 0 0 na 0 0 na Sociology 0 0 na 0 0 na 0 0 na
Institute of Agriculture & Natural Resources (IANR) Academic Units
Agricultural Leadership Education and Communication 0 0 na 0 0 na 0 0 na Agricultural Economics 0 0 na 0 0 na 0 0 na
TOTAL SocBeh 4 1 20% 0 0 na 0 0 na
Source: Institutional Research and Planning, October, 2009
147

TABLE 7d. Number and Percent of UNL New-Hires in STEM and SocBeh Fields by Rank and Department, 2010 Assistant Associate Full
STEM FIELDS M W % W M W % W M W % W College of Arts & Sciences
Biological Sciences 0 1 100% 1 0 0% 0 0 na Chemistry 2 0 0% 0 0 na 0 0 na
Computer Science & Engineering 1 0 0% 1 0 0% 0 0 na Geosciences 0 1 100% 0 0 na 0 0 na Mathematics 0 0 na 0 0 na 0 0 na
Physics & Astronomy 0 0 na 0 0 na 0 0 na Statistics 0 0 na 0 0 na 0 0 na
College of Engineering
Architectural Engineering 0 0 na 0 0 na 0 0 na Chemical and Biomolecular Engineering 1 0 0% 0 0 na 0 0 na
Civil Engineering 0 0 na 0 0 na 0 0 na Computer & Electronics Engineering 0 0 na 0 0 na 0 0 na
Construction Management 0 0 na 0 0 na 0 0 na Construction Systems 0 0 na 0 0 na 0 0 na Electrical Engineering 0 1 100% 0 0 na 0 0 na
Engineering Mechanics 0 0 na 0 0 na 0 0 na Industrial and Management Systems 0 0 na 0 0 na 0 0 na
Mechanical Engineering 0 0 na 0 0 na 0 0 na
Institute of Agriculture & Natural Resources (IANR) Academic Units
Agronomy & Horticulture 4 0 0% 0 0 na 1 0 0% Animal Sciences 0 0 na 0 0 na 0 0 na
Biochemistry 2 1 33% 0 0 na 0 0 na Biological Systems Engineering 0 0 na 0 0 na 0 0 na
Entomology 2 1 33% 0 0 na 0 0 na Food Science & Technology 1 1 50% 0 0 na 0 0 na
Plant Pathology 0 0 na 0 0 na 0 0 na School of Natural Resources 1 0 0% 0 0 na 0 0 na
Veterinary & Biomedical Sciences 0 0 na 0 0 na 0 0 na
TOTAL STEM 14 6 30% 2 0 0% 1 0 0% Assistant Associate Full
SocBeh FIELDS M W % W M W % W M W % W College of Arts & Sciences
Communication Studies 0 0 na 0 0 na 0 0 na Political Science 0 2 100% 0 0 na 0 0 na
Psychology 0 0 na 0 0 na 1 0 0% Sociology 0 1 100% 0 0 na 0 0 na
Institute of Agriculture & Natural
Resources (IANR) Academic Units Agricultural Leadership Education and
Communication 0 1 100% 0 0 na 0 0 na Agricultural Economics 0 0 na 0 0 na 0 0 na
TOTAL SocBeh 0 4 100% 0 0 na 1 0 0%
Source: Institutional Research and Planning, October, 2010
148
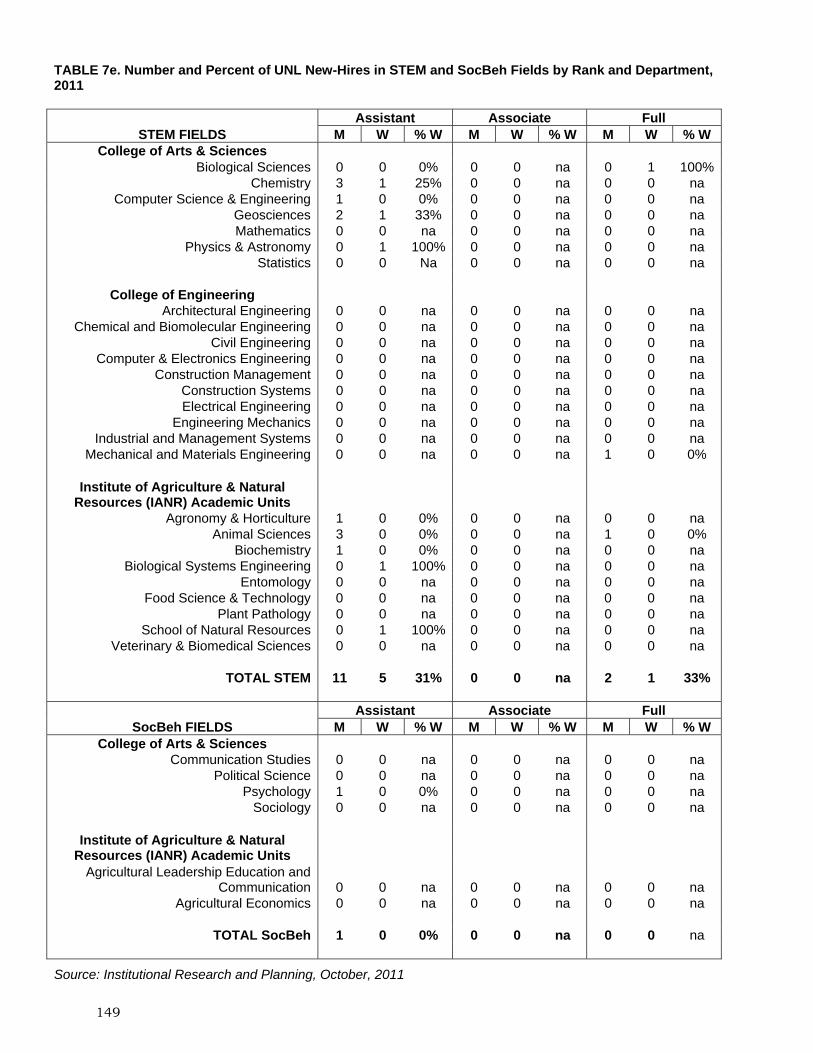
TABLE 7e. Number and Percent of UNL New-Hires in STEM and SocBeh Fields by Rank and Department, 2011 Assistant Associate Full
STEM FIELDS M W % W M W % W M W % W College of Arts & Sciences
Biological Sciences 0 0 0% 0 0 na 0 1 100%Chemistry 3 1 25% 0 0 na 0 0 na
Computer Science & Engineering 1 0 0% 0 0 na 0 0 na Geosciences 2 1 33% 0 0 na 0 0 na Mathematics 0 0 na 0 0 na 0 0 na
Physics & Astronomy 0 1 100% 0 0 na 0 0 na Statistics 0 0 Na 0 0 na 0 0 na
College of Engineering
Architectural Engineering 0 0 na 0 0 na 0 0 na Chemical and Biomolecular Engineering 0 0 na 0 0 na 0 0 na
Civil Engineering 0 0 na 0 0 na 0 0 na Computer & Electronics Engineering 0 0 na 0 0 na 0 0 na
Construction Management 0 0 na 0 0 na 0 0 na Construction Systems 0 0 na 0 0 na 0 0 na Electrical Engineering 0 0 na 0 0 na 0 0 na
Engineering Mechanics 0 0 na 0 0 na 0 0 na Industrial and Management Systems 0 0 na 0 0 na 0 0 na
Mechanical and Materials Engineering 0 0 na 0 0 na 1 0 0%
Institute of Agriculture & Natural Resources (IANR) Academic Units
Agronomy & Horticulture 1 0 0% 0 0 na 0 0 na Animal Sciences 3 0 0% 0 0 na 1 0 0%
Biochemistry 1 0 0% 0 0 na 0 0 na Biological Systems Engineering 0 1 100% 0 0 na 0 0 na
Entomology 0 0 na 0 0 na 0 0 na Food Science & Technology 0 0 na 0 0 na 0 0 na
Plant Pathology 0 0 na 0 0 na 0 0 na School of Natural Resources 0 1 100% 0 0 na 0 0 na
Veterinary & Biomedical Sciences 0 0 na 0 0 na 0 0 na
TOTAL STEM 11 5 31% 0 0 na 2 1 33% Assistant Associate Full
SocBeh FIELDS M W % W M W % W M W % W College of Arts & Sciences
Communication Studies 0 0 na 0 0 na 0 0 na Political Science 0 0 na 0 0 na 0 0 na
Psychology 1 0 0% 0 0 na 0 0 na Sociology 0 0 na 0 0 na 0 0 na
Institute of Agriculture & Natural
Resources (IANR) Academic Units Agricultural Leadership Education and
Communication 0 0 na 0 0 na 0 0 na Agricultural Economics 0 0 na 0 0 na 0 0 na
TOTAL SocBeh 1 0 0% 0 0 na 0 0 na
Source: Institutional Research and Planning, October, 2011
149

TABLE 8a. Faculty Leadership Positions, 2008
All Faculty
# of Women Faculty # of Male Faculty % of Female Faculty All STEM SocBeh All STEM SocBeh All STEM SocBeh
Tenured Full Professors 586 118 19 11 468 236 46 20% 8% 19% STEM Department Heads/Chairs 26 1 1 na 25 25 na 4% 4% na SocBeh Department Heads/Chairs 6 1 na 1 5 na 5 17% na 17%
Deans 13 4 0 0 9 0 0 31% 0% 0% Associate Deans 23 10 0 0 13 3 0 44% 0% 0% Center Directors 57 14 0 0 43 12 1 25% 0% 0% President, Chancellor, Vice chancellors
14 6 0 0 8 0 0 43% 0% 0%
Source: Institutional Research and Planning, October, 2008 University Professorships Committee 11 4 2 0 7 4 0 36% 33% 0%
Instructional Technology Advisory Committee (ITAC)
18 5 0 1 13 2 3 28% 0% 25%
International Programs Advisory Council (IPAC)
9 4 0 3 5 2 0 44% 0% 100%
General Purpose Classroom Committee (GPAC)
13 2 0 0 11 3 0 15% 0% 0%
Source: Senior Vice Chancellor for Academic Affairs, 2008 Research Council 15 8 2 1 7 4 1 53% 33% 50% Radiation Safety Committee 8 1 1 0 7 7 0 13% 13% 0% Research Advisory Board (RAB) 22 7 4 1 15 12 0 32% 25% 100% Institutional Review Board (IRB) 12 4 0 1 8 0 1 33% 0% 50% Institutional Animal Care and Use Committee (IACUC)
15 3 1 1 12 8 3 20% 11% 25%
Conflict of Interest in Research Committee (CIRC)
9 1 0 1 8 3 0 11% 0% 100%
Institutional Biosafety Committee 6 0 0 0 6 5 0 0% 0% 0%
Source: Office of Research, 2008 Academic Planning Committee 13 4 1 0 9 5 0 31% 17% 0% Rights and Responsibilities Committee
5 3 0 1 2 1 0 60% 0% 100%
Curriculum Committee 12 4 0 0 8 3 0 33% 0% 0% Source: Institutional Research and Planning and Faculty Senate Website, 2008
Promotion and Tenure Committee (P&T)
258 41 24 17 217 180 37 16% 12% 31%
Executive Committee 70 14 12 2 56 43 13 20% 22% 13% Graduate Admissions Committee 185 38 16 22 147 105 42 21% 13% 34%
Source: Individual Departments, 2008 TOTAL University-wide Committees
168 50 11 10 118 59 8 30% 16% 56%
TOTAL Department-level Committees
513 93 52 41 420 328 92 18% 14% 31%
Committee membership only includes faculty and excludes adjunct, emeritus faculty, staff, and students
150

Table 8b. Faculty Leadership Positions, 2009 All
Faculty # of Female Faculty # of Male Faculty % of Female Faculty
All STEM SocBeh All STEM SocBeh All STEM SocBeh Tenured Full Professors 589 120 19 11 469 247 39 20% 7% 22% STEM Department Heads/Chairs 26 0 0 na 26 26 na 0% 0% na
SocBeh Department Heads/Chairs
6 1 na 1 5 na 5 17% na 17%
Deans 13 6 0 0 7 0 0 46% 0% 0% Associate Deans 24 9 0 0 15 3 0 38% 0% 0% Center Directors 57 14 1 0 43 14 2 25% 7% 0% President, Chancellor, Vice chancellors 14 6 0 0 8 0 0 43% 0% 0%
Source: Institutional Research and Planning, October, 2009 University Professorships Committee 11 5 2 1 6 3 0 46% 40% 100%
Instructional Technology Advisory Committee (ITAC) 18 4 0 1 14 2 2 22% 0% 33%
International Programs Advisory Council (IPAC) 11 5 0 3 6 3 0 46% 0% 100%
General Purpose Classroom Committee (GPAC)
16 3 0 0 13 3 0 19% 0% 0%
Source: Senior Vice Chancellor for Academic Affairs Office, 2009 Research Council 11 5 2 0 6 4 0 46% 33% 0% Radiation Safety Committee 8 1 1 0 7 7 0 13% 13% 0% Research Advisory Board (RAB) 23 7 3 1 16 9 1 30% 25% 50%
Institutional Review Board (IRB) 13 5 0 2 8 0 2 39% 0% 50%
Institutional Animal Care and Use Committee (IACUC)
17 4 1 1 13 9 3 24% 10% 25%
Conflict of Interest in Research Committee (CIRC) 7 0 0 0 7 3 0 0% 0% 0%
Institutional Biosafety Committee 5 0 0 0 5 4 0 0% 0% 0%
Source: Office of Research, 2009 Academic Planning Committee 14 3 1 0 11 6 0 21% 14% 0%
Rights and Responsibilities Committee 5 3 0 1 2 0 1 60% 0% 50%
Curriculum Committee 13 4 0 0 9 3 1 31% 0% 0% Source: Institutional Research and Planning and Faculty Senate Website, 2009
Promotion and Tenure Committee (P&T) 309 45 27 18 264 224 40 15% 11% 31%
Executive Committee 86 16 7 9 70 57 13 19% 11% 41% Graduate Admissions Committee 208 43 20 23 165 117 48 21% 15% 32%
Source: Individual Departments, 2009 TOTAL University-wide Committees** 172 49 12 10 123 56 10 29% 18% 50%
TOTAL Department-level Committees 603 105 54 51 499 398 101 17% 12% 34%
Committee membership only includes faculty and excludes adjunct, emeritus faculty, staff, and students
151

Table 8c. Faculty Leadership Positions, 2010
All
Faculty # of Female Faculty # of Male Faculty % of Female Faculty
All STEM SocBeh All STEM SocBeh All STEM SocBeh Tenured Full Professors 600 121 22 12 479 262 37 20% 8% 24% STEM Department Heads/Chairs * 24 0 0 na 24 24 na 0% 0% na SocBeh Department Heads/Chairs 6 1 na 1 5 na 5 17% na 17% Deans 12 5 0 0 7 0 0 42% na na Associate Deans 26 12 0 0 14 1 0 46% 0% na Center Directors 57 18 2 0 39 15 1 32% 12% 0% President, Chancellor, Vice chancellors
14 5 0 0 9 0 0 36% na na
Source: Institutional Research and Planning, October, 2010 University Professorships Committee
11 6 2 0 5 2 0 55% 50% na
College of Engineering Promotion & Tenure Committee **
12 1 1 0 11 11 0 8% 8% na
College of Arts & Sciences Promotion & Tenure Committee **
6 4 0 2 2 2 0 67% 0% 100%
Source: Senior Vice Chancellor for Academic Affairs Office, 2010 Research Council 14 4 1 1 10 6 0 29% 14% 100% Radiation Safety Committee 8 1 1 0 7 7 0 13% 13% na Research Advisory Board (RAB) 18 5 3 0 13 10 1 28% 23% 0% Institutional Review Board (IRB) 14 6 0 2 8 0 5 43% na 29% Institutional Animal Care and Use Committee (IACUC)
15 2 1 1 13 11 2 13% 8% 33%
Conflict of Interest in Research Committee (CIRC)
9 1 1 0 8 5 0 11% 17% na
Institutional Biosafety Committee 7 0 0 0 7 6 0 0% 0% na Source: Office of Research, 2010 Academic Planning Committee 13 5 0 0 8 2 0 38% 0% na Rights and Responsibilities Committee
4 2 0 1 2 0 1 50% na 50%
Curriculum Committee 13 6 0 0 7 3 1 46% 0% 0% Source: Institutional Research and Planning and Faculty Senate Website, 2010
Promotion and Tenure Committee (P&T)
309 41 26 15 268 232 36 13% 10% 29%
Executive Committee 107 22 15 7 85 70 15 21% 18% 32% Graduate Admissions Committee 183 45 22 23 138 104 34 25% 17% 40% Source: Individual Departments, 2010 TOTAL University-wide Committees**
144 43 10 7 101 65 10 30% 13% 41%
TOTAL Department-level Committees
599 108 63 45 491 406 85 18% 13% 35%
Committee membership only includes faculty and excludes adjunct, emeritus faculty, staff, and students
* Department chairs were not provided for Construction Management and Construction Systems
** University-wide academic committees used in previous year tables were eliminated. They were replaced with college level P&T committees (IANR does not have such a committee).
152
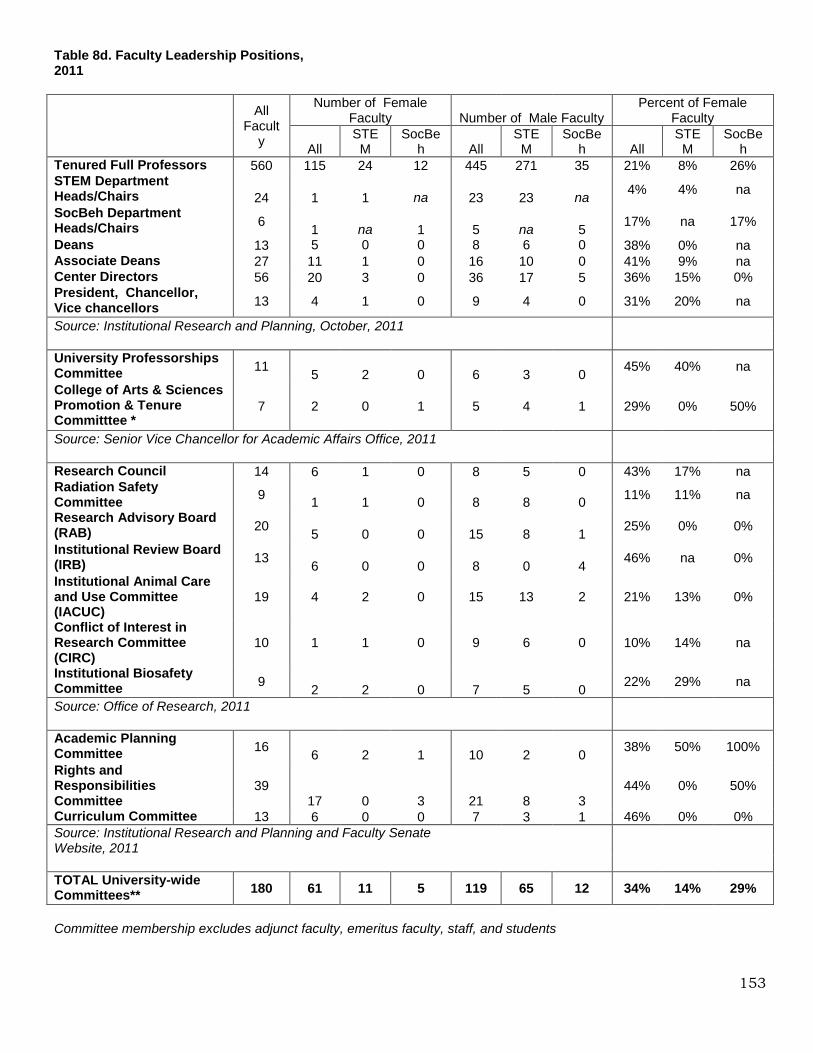
Table 8d. Faculty Leadership Positions, 2011
All
Faculty
Number of Female Faculty Number of Male Faculty
Percent of Female Faculty
All
STEM
SocBeh All
STEM
SocBeh All
STEM
SocBeh
Tenured Full Professors 560 115 24 12 445 271 35 21% 8% 26% STEM Department Heads/Chairs 24 1 1 na 23 23 na
4% 4% na
SocBeh Department Heads/Chairs
6 1 na 1 5 na 5
17% na 17%
Deans 13 5 0 0 8 6 0 38% 0% na Associate Deans 27 11 1 0 16 10 0 41% 9% na Center Directors 56 20 3 0 36 17 5 36% 15% 0% President, Chancellor, Vice chancellors
13 4 1 0 9 4 0 31% 20% na
Source: Institutional Research and Planning, October, 2011
University Professorships Committee
11 5 2 0 6 3 0
45% 40% na
College of Arts & Sciences Promotion & Tenure Committtee *
7 2 0 1 5 4 1 29% 0% 50%
Source: Senior Vice Chancellor for Academic Affairs Office, 2011
Research Council 14 6 1 0 8 5 0 43% 17% na Radiation Safety Committee
9 1 1 0 8 8 0
11% 11% na
Research Advisory Board (RAB)
20 5 0 0 15 8 1
25% 0% 0%
Institutional Review Board (IRB)
13 6 0 0 8 0 4
46% na 0%
Institutional Animal Care and Use Committee (IACUC)
19 4 2 0 15 13 2 21% 13% 0%
Conflict of Interest in Research Committee (CIRC)
10 1 1 0 9 6 0 10% 14% na
Institutional Biosafety Committee
9 2 2 0 7 5 0
22% 29% na
Source: Office of Research, 2011
Academic Planning Committee
16 6 2 1 10 2 0
38% 50% 100%
Rights and Responsibilities Committee
39 17 0 3 21 8 3
44% 0% 50%
Curriculum Committee 13 6 0 0 7 3 1 46% 0% 0%
Source: Institutional Research and Planning and Faculty Senate Website, 2011
TOTAL University-wide Committees**
180 61 11 5 119 65 12 34% 14% 29%
Committee membership excludes adjunct faculty, emeritus faculty, staff, and students
153

F. ADVANCE-NEBRASKA E-NEWS SAMPLE
154
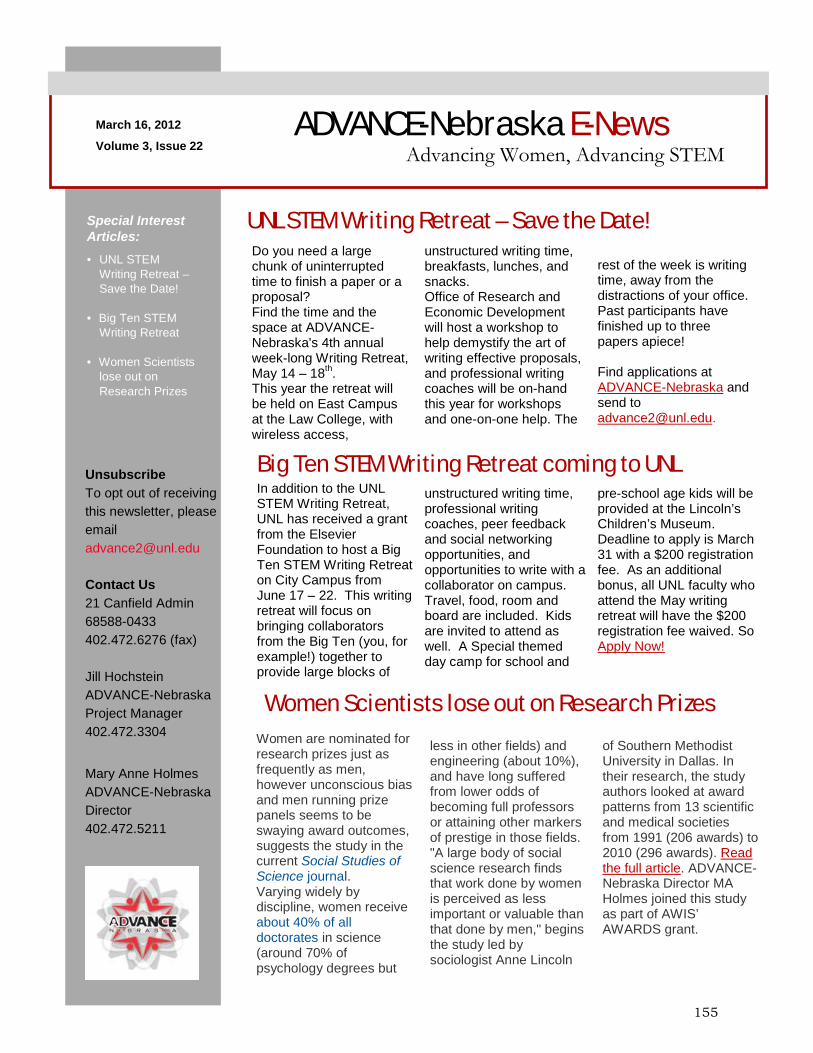
March 16, 2012
Volume 3, Issue 22
ADVANCE-Nebraska E-News Advancing Women, Advancing STEM
Special Interest Articles: • UNL STEM
Writing Retreat – Save the Date!
• Big Ten STEM
Writing Retreat • Women Scientists
lose out on Research Prizes
Unsubscribe
To opt out of receiving this newsletter, please email [email protected] Contact Us
21 Canfield Admin 68588-0433 402.472.6276 (fax) Jill Hochstein ADVANCE-Nebraska Project Manager 402.472.3304
Mary Anne Holmes ADVANCE-Nebraska Director 402.472.5211
In addition to the UNL STEM Writing Retreat, UNL has received a grant from the Elsevier Foundation to host a Big Ten STEM Writing Retreat on City Campus from June 17 – 22. This writing retreat will focus on bringing collaborators from the Big Ten (you, for example!) together to provide large blocks of
Big Ten STEM Writing Retreat coming to UNL
UNL STEM Writing Retreat – Save the Date! Do you need a large chunk of uninterrupted time to finish a paper or a proposal? Find the time and the space at ADVANCE-Nebraska's 4th annual week-long Writing Retreat, May 14 – 18th. This year the retreat will be held on East Campus at the Law College, with wireless access,
unstructured writing time, professional writing coaches, peer feedback and social networking opportunities, and opportunities to write with a collaborator on campus. Travel, food, room and board are included. Kids are invited to attend as well. A Special themed day camp for school and
pre-school age kids will be provided at the Lincoln’s Children’s Museum. Deadline to apply is March 31 with a $200 registration fee. As an additional bonus, all UNL faculty who attend the May writing retreat will have the $200 registration fee waived. So Apply Now!
unstructured writing time, breakfasts, lunches, and snacks. Office of Research and Economic Development will host a workshop to help demystify the art of writing effective proposals, and professional writing coaches will be on-hand this year for workshops and one-on-one help. The
rest of the week is writing time, away from the distractions of your office. Past participants have finished up to three papers apiece!
Find applications at ADVANCE-Nebraska and send to [email protected].
Women Scientists lose out on Research Prizes
Women are nominated for research prizes just as frequently as men, however unconscious bias and men running prize panels seems to be swaying award outcomes, suggests the study in the current Social Studies of Science journal. Varying widely by discipline, women receive about 40% of all doctorates in science (around 70% of psychology degrees but
less in other fields) and engineering (about 10%), and have long suffered from lower odds of becoming full professors or attaining other markers of prestige in those fields. "A large body of social science research finds that work done by women is perceived as less important or valuable than that done by men," begins the study led by sociologist Anne Lincoln
of Southern Methodist University in Dallas. In their research, the study authors looked at award patterns from 13 scientific and medical societies from 1991 (206 awards) to 2010 (296 awards). Read the full article. ADVANCE-Nebraska Director MA Holmes joined this study as part of AWIS’ AWARDS grant.
155
We’re on the Web! See us at:
Advance.unl.edu
There will be a series of brown bag lunches this semester on the UNL campus for faculty wishing to discuss issues for women in STEM. Bring your lunch and get to know other women in STEM on campus. All faculty are invited to attend.
Meeting dates are as follows: Friday, March 16th, Noon – 1:00pm, 3rd Floor Board Room, Whittier Building Wednesday, April 18th, Noon- 1:00pm, A211 Animal Science Building, East Campus Tuesday, May 8th, Noon-1:00pm, Beadle Center room N263
Issues for Women in STEM Brown Bag Lunches
Keystone Symposia has now some additional funds for Early Career Investigator Travel Awards (ECITA). These awards are for Assistant Professors from designated URM backgrounds in the U.S., who are “bench” researchers. The purpose is to support their research success by providing funds for them to attend one of the Keystone Symposia research meetings (Up to $1800). The application may be found on-line at www.keystonesymposia.org/diversity See ECITA. The application process opened March 1, 2012 for all of our meetings between now and Feb 28, 2013. However, the awards will be made upon review, on a first come basis. So interested applicants should view our meetings right away at www.keystonesymposa.org/meetings and find a meeting of interest for which they might want to apply. The awards are made for a particular meeting.
Early Career Investigator Travel Awards (ECITA)
If you have anything of interest to the Advance community, please send us your news and articles. Thanks!
Send us your input & articles
Inside Higher Ed, March 9, 2012, by Kaustuv Basu Will scientists who aim to strike a healthy balance between work and family end up leaving the STEM fields? Experts raised the question Thursday, after the Association for Women in Science published an international survey that showed that a majority of researchers and scientists had conflicts between their work schedules and personal lives at least two to three times a week. The survey includes answers from 4,225 scientists and researchers from around the world. Sixty-four percent of those who responded work for universities; 24 percent were from the United States. Seventy percent of the respondents were men; 80 percent were married or had a partner. The results suggest that complaints heard in American university laboratories about the lack of family-friendly workplaces may be similar to those made by scientists around the world. “If there’s one-third of scientists who are unhappy, then we might lose a lot of people who are playing a role in science,” said Donna Dean, an AWIS board member and former president of the organization. She said there were no wide disparities between the numbers across countries, genders or disciplines. Read more.
Elusive Balance
156

G. BEST PRACTICES, FACULTY RECRUITMENT, DEVELOPMENT AND RETENTION DRAFT
157

University of Nebraska-Lincoln
ADVANCE Faculty Committee 2012
Best Practices Faculty Recruitment, Development and Retention A Guide for Colleges and Departments
158

University of Nebraska – Lincoln ADVANCE Faculty Committee 2012
Page 2 of 36
The University of Nebraska Board of Regents Policies pertaining to Equal Opportunity/Affirmative Action Guidelines (3.1.3) prescribe that: The University will undertake a vigorous program of affirmative recruitment for minorities and women in all job categories in which they are found to be underutilized (5.b). Therefore, the method by which faculty positions are advertised should result in a highly qualified and diverse pool of candidates.
This document was written and compiled by members of the University of Nebraska ADVANCE Faculty committee including Shireen Adenwalla, Alexandra Basolo, Erin Blankenship, Andrea Cupp, Concetta DiRusso (Chair), Tracy Frank, Susan Hermiller, Elizabeth (Libby) Jones, Merlin Lawson, Nancy Myers, Andrzej Nowak, Sheila Purdhum, Brian Robertson, Melanie Simpson, Anuradha Subramanian and Xiao Zeng. It could not have been accomplished without the ongoing assistance and support of Mary Anne Holmes, Director of UNL ADVANCE, Julia McQuilllan and Jill Hochstein.
159

University of Nebraska – Lincoln ADVANCE Faculty Committee 2012
Page 3 of 36
Table of Contents 1. Introduction 2. University Culture
A. Faculty advancement B. Faculty retention C. Faculty participation in governance
3. Promoting Respect and Collegiality A. Creating a supportive environment for faculty B. Creating a supportive environment for students and staff C. Building meaningful practices
4. Importance and Value of a Diverse Faculty
A. Advantages to recruiting women in STEM disciplines to the faculty B. Advantages to the student body conferred by a diverse faculty
5. Recognize and Minimize the Affects of Implicit Bias
A. Barriers to diversity that must be addressed B. Mechanisms to limit implicit bias
6. Accommodating Work-life balance A. Dual careers B. Family and medical leave C. Tenure and promotion clocks D. Schedules
7. Career development, advancement and retention A. Fostering success of early career faculty B. Professional development for mid- and late-career faculty C. Active appreciation of all faculty D. Team building E. Leadership opportunities
8. Annual, tenure, and promotion review A. Published policies and guidelines for each level of faculty progress through ranks B. Transparency C. Equity and consistency in review D. Faculty advocacy E. Formulate rubric for progress F. Evaluate team-building and team-based skills in teaching and research G. Guidelines for avoiding implicit bias in review H. Institutionalization of the annual review process
9. Searching for New Faculty: Defining and Advertising the Position
A. The search committee B. Advertising the position C. Posting the position
10. Searching for New Faculty: Applicant Evaluation and Selection
A. Develop criteria for evaluation B. Stages of the review
11. Interviewing candidates
A. Preparing for the interview B. The interview process C. Post-interview procedures and consideration
160
University of Nebraska – Lincoln ADVANCE Faculty Committee 2012
Page 4 of 36
1. Introduction
The following “Best Practices” have as their goal the achievement of excellence in the academic work place that is the University of Nebraska – Lincoln. The UNL Faculty includes all individuals in each college, department and center that are charged with the education of the next generation of leaders, entrepreneurs, scientists and teachers. It is a tremendous responsibility that we take to head and heart. Therefore, we must have an excellent faculty with great breadth of experience and expertise. From the day of hire through to retirement, the faculty is expected to provide excellence in teaching, research and service to guide our students and our communities forward into the next millennia.
We can’t achieve excellence by being insular or by excluding 50% of the work force. Nor, can we achieve excellence in an environment that is narrow, non-collegial or that excludes persons of diverse experience, ethnicity, and cultural or educational experience. Diversity is essential to excellence; a homogenous faculty limits diversity of experience and thought, narrows the breadth of our scholarship, and limits the role models accessible to our students. Without diversity our university is weaker, our students less prepared to find their way in, and to contribute to, their developing world. This is not an either-or choice. Diversity produces the best science; diverse research teams can perceive more challenges and think of better solutions to science, engineering and math puzzles that currently face our nation and the world. Globalization has brought home the imperative that we must diversify, we must work well in teams, and we must be creative problem solvers that can gather and unify disparate approaches to find unique solutions to society’s problems.
Therefore, it is the goal of the present document to examine and enrich the work environment for all faculty members at UNL. As the Faculty Committee of ADVANCE, our primary goal is to increase the numbers of women faculty in the science, technology, engineering and mathematics disciplines (STEM). However, in building these best practices for faculty recruitment, development and retention, we always focused on improving the work environment for every member of the faculty present and future. We therefore take responsibility for the contents of these Best Practices and welcome constructive comments and feedback. We hope that dissemination of these Best Practices begins a dialogue on how best to work together – a dialog about how to move constructively forward, a dialogue that allows the suggestion that perhaps the way we’ve always done things isn’t the only way, or sometimes, the best way. And sometimes, the usual ways are still useful ways. That should be part of the dialogue as well. The present document was written by the Faculty ADVANCE Committee, drawing upon UNL documents and experience as well as extensive literature searches on diversity, faculty work, faculty achievement of excellence, and practices that promote the STEM disciplines. Many individuals toiled many hours to accomplish this task and we are most grateful for their diverse experience and opinions that led to the present document.
161

University of Nebraska – Lincoln ADVANCE Faculty Committee 2012
Page 5 of 36
2. University Culture The objective of the University is to build an environment in which all faculty members, regardless of rank, find professional development opportunities and fulfillment within UNL so that they continue throughout their academic careers to advance the teaching, research and service missions at this university. Our goal is to create a culture of inclusiveness in which all (faculty, staff and students) feel valued for their individual and collective contributions. Faculty retention is essential because the faculty is the university's most critical resource, and their productivity helps build on the investment made to establish their research and teaching programs. Retention of faculty begins with the spirit of the recruitment and hiring process, but long-term successful retention is influenced substantially by university and departmental climate, which is the atmosphere or ambience of an organization as perceived by its members. An organization’s climate is reflected in its structures, policies and practices; the demographics of its members and leaders; and the quality of personal interactions (Fine and Sheridan, 2008). A. Faculty Advancement: Promotion of the professional goals and objectives of the faculty is important at all stages of a career and at all faculty ranks. There are generally formal mentoring/advising programs for early career faculty that are useful and should be continued after promotion from Assistant to Associate and Full Professor rank. Development programs to foster departmental and institutional leadership benefit the institution as well as the faculty member. Mechanisms listed below support maintenance of a collegial and collaborative work environment that is enticing to new faculty and promotes career satisfaction at all levels by cultivating continual growth of established UNL faculty members.
1. Assist faculty in establishing visibility by forming a network of senior colleagues in their field who have achieved professional prominence and are committed to supporting and facilitating the advancement of others in the field. Providing funds for faculty to travel to conferences and to invite experts in their field to UNL for seminars, as well as nominating faculty for service on committees in professional societies, are ways to increase visibility.
2. Offer leadership development programs in research, teaching and/or administration, available to all faculty members, with voluntary enrollment of interested faculty. For example, the Committee on Institutional Cooperation (CIC) offers an Academic Leadership Program (ALP), which is an intensive professional experience aimed at developing the leadership and managerial skills of faculty who have demonstrated exceptional ability and academic promise (see http://www.cic.net/Home/Projects/Leadership/ALP/Introduction.aspx).
3. Ensure that college and departmental resources are distributed equitably.
4. Encourage faculty to suggest improvements to teaching programs, departmental policies, etc., that would enhance the environment for the entire academic community.
5. Provide resources to supplement departmental teaching and service voids that arise while faculty are on sabbatical.
6. Promote collegiality and practice impartiality in guiding efforts of department chairs/heads and individual faculty.
7. Reinvent the faculty club to provide opportunities for faculty members across departments, colleges and campuses to interact in a relaxed yet professional setting.
B. Faculty Retention: Retention of faculty members is a complex issue and involves the perception of the environment, resources, and remuneration as competitive and attractive. University, college and departmental administration may contribute to a positive perception in many ways:
162

University of Nebraska – Lincoln ADVANCE Faculty Committee 2012
Page 6 of 36
1. Identify UNL-specific barriers to retention through faculty focus groups, individual conversations, discussions with chairs/heads of departments and schools, and exit interviews; establish and promote policies to remove these barriers.
2. Utilize a variety of resources to retain faculty members (including for example: salary adjustments, increased research space and equipment, named professorships, readjusted appointment apportionment to reflect best efforts, bridge funding).
3. Maintain salaries and benefits that are competitive with national averages and within Big Ten institutions.
4. Encourage faculty to communicate their concerns to the department chair/head and/or upper level administrators.
5. Expect Department chairs to advocate for the faculty and communicate their concerns to the upper administration.
C. Faculty Participation in Governance: At UNL, governance is traditionally the shared responsibility of the faculty and administration with oversight provided by the board of regents. Within colleges and departments, individual faculty members benefit from an open environment where their ideas and concerns can be voiced in a productive and proactive manner. The following policies are recommended to foster shared governance.
1. Faculty rights and responsibility for departmental governance should be clearly stated in the department’s bylaws. It is particularly important to specify in the bylaws whether or not faculty members with partial appointments and/or those with non-tenured or tenure leading lines may vote on some or all policy issues.
2. Hold regular faculty meetings at least twice a year.
3. Encourage faculty members to contribute items to the departmental meeting agenda and to voice their opinions on major policy issues. These would pertain, for example, to teaching and research, sharing of common resources and equipment, supervision and training of graduate students and fellows, departmental finances (when appropriate), and recruitment and retention of students and faculty.
4. Ensure that the meeting agenda and materials are distributed far enough in advance to allow faculty to think about them, and what they could contribute at the meeting.
5. In large departments (i.e. 10 or more faculty members), leadership may be jointly shared between the chair and an executive committee. The responsibilities of the executive committee might include, for example, authoring policy statements on departmental issues including curriculum, student rights, evaluation and review. Ideally, policies authored by the executive committee are then reviewed, revised and accepted or rejected by the full body of the faculty.
6. Define the department’s standing committees and discuss as a faculty the procedures for rotation of membership. Reevaluate the need for each standing committee on a regular basis.
7. Leadership on various committees within the department and college may be assigned to particular faculty members by the chair or head. When this is the case, leadership should be rotated among the faculty at least every 3 years.
8. Periodically discuss the departmental distribution of teaching assignments and agree upon rubrics for course buy-out, if appropriate, to allow for time for unusually demanding faculty governance or leadership opportunities.
163
University of Nebraska – Lincoln ADVANCE Faculty Committee 2012
Page 7 of 36
9. As a Chair or Head, negotiate and advocate for the faculty-defined rules and procedures when appropriate in upper administrative decision-making processes.
164

University of Nebraska – Lincoln ADVANCE Faculty Committee 2012
Page 8 of 36
3. Promoting Respect and Collegiality
In higher education, collegiality refers to the cooperative relationship of colleagues, including mutual understanding, inclusiveness, courtesy, respect, trust and inclusion based upon a shared sense that it is in the common interest of all to encourage and promote the general welfare and the mission of the academic community. Collegiality should not be construed as a legal definition to deny tenure because a pre-tenure faculty member does not “fit in” (Haag, 2005), but rather it is defined as that which validates the most positive affirmation of the academic milieu. A sense of community within a department is a key component of faculty satisfaction and retention (Trower and Gallagher, 2008).
The following list of suggestions focus on developing a supportive environment and creating relevant interactions that enhance interactive, collaborative and considerate communication. It is adapted in part from Fine and Sheridan (2008), Waltman and Hollenshead (2007), and Yen (2006).
A. Creating a supportive environment can be enhanced by employing a number of positive behavioral and community actions.
1. Fostering a welcoming environment is critical for pre-tenure and underrepresented faculty; however, all faculty benefit from friendly and affirming interactions. “Hostility and rudeness of one or more faculty within the department detract most from my satisfaction at work” (Fine and Sheridan, 2008).
2. At departmental meetings, ensure that everyone has a chance to voice opinions or concerns. Listen attentively and respond verbally only after careful consideration. Acknowledge and attribute ideas, suggestions, and comments accurately. Women and minority department members often report that their remarks are marginalized or ignored. Encourage colleagues who are reticent to participate in discussions by specifically asking them for an opinion.
3. Encourage respect for varied research methodologies, for interdisciplinary research, and for mainstream and ‘non-mainstream’ research.
4. Personally introduce new faculty and staff to department members with shared interests. Make an effort to reach out to new colleagues by visiting their offices or inviting them to informal lunch/coffee gatherings. Encourage new faculty to seek out colleagues in other departments and offer to make introductions.
5. Make an effort to include faculty members with partial or irregular appointments in making departmental decisions that are relevant to their expertise and interests.
6. Host regular social events and ensure that they are open to all department members when appropriate (examples include: an annual banquet; pre-seminar refreshments).
7. Create a communal space – coffee room or lounge, for informal interaction.
8. Become aware of how unconscious biases and assumptions can influence interactions between department members. It may be helpful to have departmental discussions or seminars on unconscious bias.
9. Recognize and value the work of departmental members. Publically recognize and praise faculty, staff and students who perform work on behalf of the department.
B. Building meaningful practices can enhance a welcoming department.
165

University of Nebraska – Lincoln ADVANCE Faculty Committee 2012
Page 9 of 36
1. Create a guideline document establishing the expectation that all members of the department should treat each other with dignity and respect and that inequitable or disrespectful treatment will not be tolerated. Promote these behaviors by personal example.
2. Communicating effectively with others to establish supportive departmental relationships is key to a welcoming climate. Practicing civility enhances a harmonious work environment and promotes ethical behavior. Addressing incivility at the time it occurs rather than waiting until it “gets bad” encourages faculty to resolve differences at the lowest common denominator and prevents conflict from escalating.
3. Build an inclusive community by ensuring that departmental committees are diverse with respect to age, gender, nationality, race and ethnicity.
4. Ensure that the isolation and alienation that many women and minority faculty members experience is not mistaken or criticized as “not being collegial” or “not being a team player”, particularly when they are evaluated for tenure by departmental colleagues. Encourage cross-disciplinary informal relationships to build a sense of community among under-represented groups.
5. Ensure that women and minority faculty members are not subject to higher expectations for number and quality of publications than men and majority faculty members. Be aware that inadvertent biases and assumptions may influence the evaluation of women and minority faculty members (Yen, 2006).
6. Listen respectfully to complaints and concerns about treatment or policies in the department. If the complaint regards possible harassment or other illegal behavior, be familiar with UNL policies and procedures on unlawful discrimination, including sexual and other prohibited harassment. [See: http://www.unl.edu/equity/dhpolicies.shtml] Encourage the complainant to consider available informal or formal options. Be aware of the legal responsibility of the chair or administrator to act promptly in cases of harassment or discrimination.
References
Fine, E., and Sheridan, J. (2008) Enhancing Department Climate: A Guide for Department Chairs. Women in Science and Engineering Leadership Institute, University of Wisconsin, Madison. Available for download at http://wiseli.engr.wisc.edu/initiatives/climate
Haag, Pamela (2005). Is collegiality code for hating ethnic, racial and female faculty at tenure time? Education Digest, v. 71, (1), p. 57-62.
Trower, C., and Gallagher, A. (2008). Why collegiality matters. Chronicle of Higher Education, v. 55, (11), pA50-A51.
Waltman, J., and Hollenshead, Carol (2007). Creating a Positive Departmental Climate: Principles for Best Practices. ADVANCE Program, The Center for the Education of Women, University of Michigan.
Yen, J. (2006). University of Washington COE and CAS Faculty Retention Toolkit for Department Chairs. ADVANCE Program, Science and Engineering Departments, University of Washington. Available: http://www.engr.washington.edu/advance/resources/Retention/index.html
166

University of Nebraska – Lincoln ADVANCE Faculty Committee 2012
Page 10 of 36
4. Importance and value of a diverse faculty
The academic, social and economic benefit of an inclusive and diverse campus cannot be underestimated. UNL encourages and welcomes diversity among its faculty, students and staff as an essential mechanism to maintain an intellectual learning environment that promotes excellence in scholarship and advancement in knowledge. Importantly, the faculty are the intellectual capital of the university. They are responsible for educating the future workforce of the nation, a workforce that must be prepared to compete and excel in the world markets and communities where trans-disciplinary teams will be forging new technologies and products. Thus, in the current competitive and fragile economic environment, preparation of the next generation of contributors to the STEM disciplines by a diverse faculty is essential to ensure the US will remain a leading contributor to progress and innovation.
The following sections detail the advantages afforded by a diverse faculty and describe best practices to limit bias in selecting and promoting faculty.
A. Actively recruiting women to the STEM disciplines is advantageous to the university at large for the following reasons.
1) A diverse faculty is required to meet the needs of the student body to provide innovation in scholarship, novel approaches to learning and cutting edge research to develop new products and services.
2) Diversity is essential for developing skills and knowledge required to work in teams to bring new kinds of scholarship and pedagogy so that students can be educated on issues of growing importance to society globally and to offer pathways to varied communities connected to our institution.
3) Women are half of the potential workforce and their intellectual capabilities and unique perspectives are essential to meet the national goals in educating the future workforce in STEM disciplines.
4) Currently, the numbers of women choosing to enter STEM fields has increased and in certain fields, such as biological science and medicine, the numbers of women obtaining terminal degrees in these fields is essentially equivalent to the numbers of men. However, in all fields, the percentage of women in the academe remains low in all STEM disciplines. This means fewer role models for women students and a deficit in the breadth of knowledge and approaches to learning and research afforded by the female experience and perspective.
5) Additionally, parity for women faculty in the academe will only be achieved if women are selected for leadership roles and higher-level administrative positions. Woman with leadership roles at the university provide role models to female students, and condition male students to viewing women as leaders. Currently, no college deanship, no center directorship, and only two department chairs are held by women in STEM at UNL (Spring 2012). Again, diversity in the administrative body will lead to innovation and excellence in programs, methods of performance, and methods of management.
B. A faculty body balanced by diverse membership provides selective advantages to the student body.
1) Students progress by being exposed to a greater diversity of ideas, and by receiving input from individuals like themselves, as well as from individuals that are unlike them. When students are
167

University of Nebraska – Lincoln ADVANCE Faculty Committee 2012
Page 11 of 36
exposed to a diversity of opinions and outlooks, they will be better prepared to succeed in a diverse world with a global economy (Brown, 1998; Collins & Kritsonis, 2006).
2) The faculty composition should match the diversity of the student body so that all students are provided with role models, and are instilled with the knowledge that they too can succeed in their career goals. Importantly, the most accurate predictor of subsequent success for female undergraduates is the percentage of women among faculty members at their college (Trower & Chait, 2002). Male students taught and advised by female faculty members are more likely to view women as coequal colleagues.
3) Women faculty should be at the same proportion as female students in their respective fields to provide advising on career goals and to offer advice on requirements for success in a given field. In some fields, sub-disciplines may be favored by female students over male students. Therefore, the numbers of women faculty in a department must meet the needs of these students as well as students in other sub-disciplines.
4) The greater the diversity of the faculty, the broader the range of coverage in course offerings. Additionally, students will be exposed to different types of teaching and learning methods. Studies have shown that women use active and collaborative learning techniques more often than men (Umbach, 2006), are more committed to teaching (Fairweather, 1996), and have a greater repertoire of teaching techniques than men (Finkelstein et al. 1998; Pascarella et al. 2001; Harlow, 2003). Additional research found that women faculty interact with students more than their male counterparts, and engage students in higher order cognitive activities more frequently than men (Umbach, 2006).
5) Experience with a diverse faculty, who provide a diversity of curricula and teaching methods results in students who are: more complex thinkers, confident in handling cultural differences, and likely to seek to remedy inequities (Hurtado et al. 1999; Smith et al. 1997, Web Ref. 6). Students at the University of Michigan who experienced greater diversity had higher academic confidence, and social skills; and multiple diversity experiences appear to have synergistic effects on the development of self (Nelson Laird, 2005).
References
http://www.upenn.edu/provost/images/uploads/Valian.pdf
http://www.advance.rackham.umich.edu/GSE-_Faculty_Recruitment_Retention.pdf
http://www.diversityweb.org/diversity_innovations/faculty_staff_development/recruitment_tenure_promotion/faculty_recruitment.cfm
http://www.nsf.gov/pubs/2000/cawmset0409/cawmset_0409.pdf
http://www.aacu.org/publications/divfacintro.cfm
The Congressional Commission on the Advancement of Women and Minorities in Science, Engineering and Technology (CAWMSET), Land of Plenty: Diversity as America’s Competitive Edge in Science, Engineering and Technology (Arlington, VA: National Science Foundation, September 2000), 1, 9–13.
Turner, CSV 1998 Keeping our faculties: Addressing the recruitment and retention of faculty of color in higher education. Executive Summary of Symposium, October 18-20.
Turner, CSV 2002 Diversifying the faculty: A guidebook for search committees. Washington D.C.: American Association of Colleges and Universities.
168
University of Nebraska – Lincoln ADVANCE Faculty Committee 2012
Page 12 of 36
Brown, C. (1998) Campus diversity: Presidents as leaders. College Student Affairs Journal. 18, 84-94.
Cabrera, A.F., Crissman, J.L., Bernal, E.M., Nora, A, Terenzini P.T., and Pascarella, E.T. (2002) Collaborative learning: Its impact on college students’ development and diversity. Journal of College Student Development, 43, 20-34.
College and University Professional Association for Human Resources(2011) Advancing Diversity: Call to Action, 3(2), 31-32.
Collins, C.J., and Kritsonis, W.A., (2006) National Viewpoint: The importance of hiring a diverse faculty. Doctoral Forum National Journal for Publishing and Mentoring Doctoral Student Research, 3(1), 1-7.
Dedoussus, E-V (2007) Issues of diversity in academia: through the eyes of ‘third-country’ faculty. Higher Education, 54,135–156.
Fairweather, J. S. (1996) Faculty work and public trust: restoring the value of teaching and public service in American academic life. Allyn and Bacon, Boston, MA.
Finkelstein, M.J., Seal R.K., and Schuster, J.H. (1998) The New Academic Generation: A profession in transformation. The Johns Hopkins University Press, Baltimore, MD.
Harlow, R. (2003) Race doesn’t matter, but...:The effect of race on professors’ experiences and emotion management in the undergraduate classroom. Social Psychology Quarterly, 66, 348–363.
Hurtado, S., Milem, J., Clayton-Pedersen, A., and Allen, W. (1999) Enacting diverse learning environments: Improving the climate for racial/ethnic diversity in higher education. George Washington University, Washington, DC.
Nelson and Laird, T.F. (2005) College students’ experiences with diversity and their effects on academic self-confidence, social agency, and disposition toward critical thinking. Research in Higher Education, 46, 365-387.
Pascarella, E.T., Palmer, B., Moye, M., and Pierson, C.T. (2001) Do diversity experiences influence the development of critical thinking? Journal of College Student Development, 42(3), 257-271.
Schmitz, C., Stakeman, C., and Sisneros, J. (2001) Educating professionals for practice in a multi cultural society: Understanding oppression and valuing diversity. Families in Society. Journal of Contemporary Human Services, 82(6), 612–622.
Springer, A.D. (2004) Faculty diversity in a brave new world. Academe, July-August, 90(4), 62.
Trower, C.A., Chait, R.P. (2002) Faculty Diversity – Too Little for too long. Harvard Magazine, Mar-Apr, 1-10.
Umbach, P.D. (2006) The contribution of faculty of color to undergraduate education. Research in Higher Education, 47(3), 317- 345.
Further Relevant Readings and Resources
169

University of Nebraska – Lincoln ADVANCE Faculty Committee 2012
Page 13 of 36
Aguirre, A. Jr. (2000) Women and minority faculty in the academic workplace: Recruitment, retention, and academic culture. ASHE–ERIC Higher Educ Rep., 27:1–141.
Antonio, A.L. (2003) Diverse Student Bodies, Diverse Faculties., Academe Online , 01902946, Nov/Dec2003, Vol. 89, Issue 6, pp. 4. (A publication of the American Association of University Professors. Can be found at http://www.aaup.org/AAUP/pubsres/academe/2003/ND/Feat/anto.htm
Astin, H.S., and Antonio, A.L. (2004) The impact of college on character development. New Directions for Institutional Research, Special Issue: Assessing Character Outcomes in College. Volume 2004, Issue 122, pages 55–64.
Barrett, L. and Barrett, P. (2011) Women and Academic Workloads: Career Slow Lane or Cul-de-Sac? Higher Education: The International Journal of Higher Education and Educational Planning, v61 n2 p141-155.
Brown, V., Geis, F.L. (1984) Turning lead into gold: Leadership by men and women and the alchemy of social consensus. Journal of Personality and Social Psychology 46, 811–824.
Carnes, M., Handelsman, J., and Sheridan, J. (2005) Diversity in academic medicine: The stages of change model. Journal of Women’s Health, 14(6): 471-475.
Deaux, K., Emswiller, T. (1974) Explanations of successful performance on sex-linked tasks: What is skill for the male is luck for the female. Journal of Personality and Social Psychology, 29:80–85.
Dedoussis, E-V. (2007) Issues of diversity in academia: through the eyes of ‘third-country’ faculty. Higher Education. 54,135–156. DOI 10.1007/s10734-006-9024-6
Gurin, P. (1999) The compelling need for diversity in higher education: Expert testimony in Gratz, et al. v. Bollinger, et al. Michigan Journal of Race & Law, 5, 363-425.
Hill, P.L., Shaw, R.A., Taylor, J.R., and Hallar, B.L. (2011) Advancing Diversity in STEM. Innovative Higher Education, v36 n1 p19-27.
Smith, D.G. (1966) Achieving Faculty Diversity. Debunking the Myths. AAC&U Publications. ISBN/ISSN: 0-911696-68-7
Smith, D.G., & Associates. (1997) Diversity works: The emerging picture of how students benefit. Washington, DC: Association of American Colleges and Universities.
Ridgeway, C.L. (2001) Gender, status, and leadership. Journal of Social Issues, 57:637–655.
170
University of Nebraska – Lincoln ADVANCE Faculty Committee 2012
Page 14 of 36
5. Recognize and Minimize the Affects of Implicit bias A. Barriers to diversity are often maintained by unacknowledged biases. All individuals no matter how well intentioned have inherent prejudices that are expressed in words, deeds and writings. Most of us have ourselves been impacted by the biases of others. If such negative experiences occur on a daily basis and become part of the departmental or university culture, these unconscious or implicit biases can be major barriers to recruiting and retaining a diverse faculty.
1) Implicit bias is characterized by unintentional and automatic statements or deeds that limit the function or demean an individual of a different sex, race, ethnicity or with a different perspective based on experience. It arises outside of immediate awareness and may contradict conscious thought and expressed opinions and/or beliefs.
2) The consequences of implicit bias are profound. The biased perspective becomes incorporated into institutional practice where they may influence hiring decisions, evaluation processes and other work-related practices.
3) Outcomes of implicit bias include a limited range of viewpoints that can narrow fields of scholarship and research found within the university community. This may also result in the exclusive hiring of individuals who are like-minded, share ethnic and racial similarities, and are of the same gender.
4) Implicit biases engender microagressive behaviors including veiled verbal insults, interruptions in conversation, repeated misidentification, and underappreciated or credited opinions or work. Faculty members who are the target of implicit biases often feel excluded and marginalized.
5) For faculty members who are in the minority may experience limited opportunities to participate in departmental and institutional decision-making. A common complaint of women faculty members in STEM at UNL and elsewhere is an excessive service and advising workload, and only "token" committee assignments.
6) Women may have infrequent opportunities to assume leadership positions or achieve an institutional presence since these positions are often assigned by senior leadership who, perhaps unconsciously, promote individuals more like themselves.
7) As departments begin to diversify there is often a lack of senior colleagues from the same demographic group as these individuals, so the new faculty member receives little guidance to assist success in the academic workplace or to progress toward promotion in rank and tenure.
B. Mechanisms to limit the impact of implicit bias and to employ diversification of the faculty to the best advantage to the university.
1) Recognizing implicit bias is often very difficult and requires objective examination of ones beliefs and practices. Project Implicit (Harvard University; http://www.projectimplicit.net/) offers a web portal for individuals to learn about implicit bias and to examine their own hidden assumptions. This site also provides references and materials to help understand and recognize bias in the work environment.
2) The best way to address implicit bias is to admit to its existence and limit its influence. With regard to faculty recruitment, this can be approached through search committee training that is offered by EAD The mean of this acronym has not previously been stated in this document. All interactions between faculty and among faculty and students, must be governed by mutual respect and appreciation that true growth only comes from the acquisition of new knowledge and expanded experience, i.e. diversity.
171
University of Nebraska – Lincoln ADVANCE Faculty Committee 2012
Page 15 of 36
3) Within the department, the head or chair should speak compellingly in support of diversity and should frame the issues proactively. Leadership of the department and upper levels of administration should include persons with diverse perspectives and experience. Inclusion means the active, intentional and ongoing engagement with diversity. Departmental practices must be inclusive, ensuring that all voices are heard equally, and everyone is included in or made aware of departmental committee meetings, events and opportunities.
4) All administrators should advocate for persons from underrepresented groups and should consider the opinions of persons with unique experiences that may differ from the majority perspective.
5) In any faculty governance situation and all committee meetings, individuals should promote innovative approaches and diverse opinions, and should provide full attention to each member as they express their opinions on a given topic. In summarizing and reporting committee work, acknowledge contributions and recognize strengths of each committee member including those with a minority view.
172

University of Nebraska – Lincoln ADVANCE Faculty Committee 2012
Page 16 of 36
6. Accommodating Work-Life Balance
In the long term most individuals will experience family events that require adjustments made to their professional efforts. Support of the work-life balance of faculty is a key ingredient in both the retention and productivity of faculty. Therefore, these issues should be discussed with all employees in anticipation of need. This section contains a summary of UNL policies and recommended best practices for accommodating the balance between work and life.
UNL policy states [http://hr.unl.edu/er/fmla/] that employees may be granted up to twelve weeks of unpaid leave for any of the following reasons:
• to address maternal/paternal concerns related to the birth or adoption of a child, or the placement of a child with the employee for foster care;
• to address a serious health condition of the employee's spouse, child or parent; • to address the employee's own serious health condition that renders the employee unable to
perform essential functions of the job; or • in association with a death in the immediate family
Additionally, a collection of some of UNL’s work-life integration policies may be found at:
http://www.unl.edu/svcaa/faculty/policies/work life integration.shtml
http://www.unl.edu/svcaa/faculty/policies/work life integration.pdf
A. Dual Careers
1. Faculty members often have a partner in need of a suitable career opportunity. In many cases this concern may be addressed at the time of hire. Alternatively, this situation may arise after the faculty member has worked for some time at UNL, or it may not have been handled during the recruitment process. Addressing these dual career situations can be vital to the retention of UNL faculty.
2. Wide distribution of UNL’s dual career policies facilitates their implementation. Information on assistance available from the ADVANCE-Nebraska program is at http://advance.unl.edu/dualcareer/ Details on policies for the College of Arts & Sciences can be found at http://ascweb.unl.edu/adminresources/recruitment/dualcareers.html
3. Dual career situations can be an excellent retention opportunity, as the faculty may appreciate the university’s efforts on their behalf. It is also important that the university not take advantage of the resolution of a dual career situation; both partners must be treated individually and equally with other faculty members, with the same care taken toward their retention and evaluation.
B. Family and Medical Leaves
1. Distribute UNL leave policies to all faculty; for details, see
http://www.unl.edu/svcaa/faculty/policies/work life integration.shtml
These leave policies include, and are more generous than, those of the Federal Family and Medical Leave Act; for more on FMLA:
173

University of Nebraska – Lincoln ADVANCE Faculty Committee 2012
Page 17 of 36
http://hr.unl.edu/er/fmla/
Dissemination of these policies to all faculty is essential not only for faculty who may need them, but for faculty who evaluate their colleagues who have taken such leaves. Faculty should not be penalized for taking available leaves through a lack of knowledge on their colleague’s part.
2. Make extended policies known to the faculty and available to all. Many departments may offer the opportunity for further leave time, modified duties, graduate research assistants, extra travel funds, laboratory supplies, etc., for a period of time after a medical/family leave has ended. These policies can make a significant difference to a faculty member’s ability to resume a high level of productivity afterward.
3. Some examples of family leave best practices, for parents and adoptive parents, include offering course release in both the semester the baby is due (note that older women tend to have high-risk pregnancies) and the following semester, facilitating opportunities for the mother to continue nursing her child if she chooses, encouraging all faculty to be supportive (e.g. scheduling meetings to accommodate schedules - see more below), and working closely with the faculty member to determine course and committee assignments that may be more manageable during the semester of her/his return.
C. Tenure and Promotion Clocks
1. UNL policy states that any tenure-track faculty member may request a one-year extension of the probationary period in cases where an individual may be unable to meet the usual demands of the job while experiencing high demands in other aspects of life. Additional interruptions may be granted based upon individual circumstances. An individual may take as many one-year extensions as is necessary. UNL’s policies also include options for modified duties and part-time tenure appointments; for these and more details, see:
http://www.unl.edu/svcaa/faculty/policies/worklife balance.shtml
2. Provide all faculty who take a maternity, disability, or other family or medical leave with the opportunity to interrupt the tenure clock for that academic year to allow for an extension of time before the tenure review process begins.
3. Tenured faculty who are not fully promoted may also be experiencing high demands in other aspects of life for a period of time. Provide options for interruptions of the promotion clock, based upon individual circumstances.
4. Educate faculty at all ranks on how to properly evaluate faculty who have taken family and/or medical leave. This includes modification of the annual evaluation, evaluation toward tenure, and evaluation toward promotion to reflect the reduced productivity caused by the leave. The extension of time required to accomplish the same goals and achieve the same level of activity as would be required without the leave should not be counted against the individual.
D. Schedules
1. Accommodation in scheduling, for example avoiding scheduling meetings, seminars, events, etc., too early or late in the day (e.g. before 9 a.m. or after 5 p.m.), enables faculty to better mesh their work with their personal lives.
2. Child care services (including infant care) at UNL include a new Children’s Center in 2008, providing a full-time year round child care facility on campus. These services are important for many faculty on campus. More detail is found at:
http://childcare.unl.edu/
and the Ruth Staples Child Development Laboratory on East Campus:
174
University of Nebraska – Lincoln ADVANCE Faculty Committee 2012
Page 18 of 36
http://cehs.unl.edu/cyaf/outreach/staplesLab.shtml
3. In addition to accommodating schedules for parental duties, it is important not to overburden other faculty with work commitments in early morning and evening times, as well.
4. Flexibility is instrumental in accommodating family and personal responsibilities.
5. Invite faculty to suggest solutions. It is also helpful for departments/academic units to share information with each other and with the faculty on accommodations they have found to be successful.
Resources:
A list of UNL support offices and organizations can be downloaded at: www.unl.edu/svcaa/documents/support_offices_and_organizations.pdf Links to all UNL policies can be found at : http://bf.unl.edu/policies/
175

University of Nebraska – Lincoln ADVANCE Faculty Committee 2012
Page 19 of 36
7. Career Development and Advancement Every new member of the UNL faculty brings a wealth of resources due to their unique education and experience to fulfill and enhance the goals and missions of the University. The excitement and desire to serve should be nurtured and permitted to develop and expand throughout the faculty member’s career. The faculty rank is one set of career hallmarks, while tenure is another. Therefore, much effort is expended toward achieving each rank. However, the day-to-day and year-to-year achievements of each faculty member should be recognized and celebrated continually. Likewise, it must be appreciated that achieving the rank of Full Professor signifies not fulfillment but continuation of contributions to the university’s ongoing missions in teaching, research, service and extension.
The following are best practices addressing development and advancement of faculty throughout their careers at UNL as well as mechanisms to support and maintain collaborative and collegial interactions.
A. Fostering Success of Early Career Faculty. New faculty are often challenged to find the balance among the demands of research, teaching and service that is critical to their success in an academic career at UNL. Experienced faculty members are sounding boards, resources for information, aids to navigating administrative policies, connections to the wider community, and advocates for their new colleagues. Many avenues within the colleges and departments will guide the progress of pre-tenure faculty members.
1. Define a faculty development program for each departmental unit.
a) A faculty development program may involve a single experienced senior faculty member or a team. The model of choice may depend on the apportionment of the faculty time (i.e. teaching, research, service) or other considerations. Likewise the mentor/mentoring team may change membership as experience of the early career faulty member changes over time.
b) Identify a more senior faculty sponsor for all early career faculty members within a department. This sponsor and advisor will be most effective if his/her professional guidance is applied uniformly to increase the innovation, effectiveness, and performance of each individual in teaching, research and service.
c) Identify a research sponsor to provide feedback on papers and grant proposals, engage in collaborative research, give advice on mentoring undergraduate research, etc.
d) Identify a teaching sponsor to provide information on teaching methodologies, share course materials (syllabi, handouts, etc.), provide feedback on classroom experiences, help with teaching issues, etc.
e) Ideally, select sponsors who are not actively engaged in the process of evaluating their junior colleagues (e.g. on a P&T committee), but rather faculty with whom the faculty member can confide without concern. This will avoid conflict of interest.
f) Consider a faculty advisor outside of the department, college and/or university when appropriate expertise is not available from within. This may be particularly important for women and individuals from diverse backgrounds when senior faculty members do not include individuals with a similar framework of reference.
g) Provide a mechanism to review and evaluate the advising relationship; make adjustments as necessary. An adversarial or ineffective plan may do more harm than having none at all.
2. Provide funding for early career faculty to attend conferences to present their research, network with colleagues, and meet with experts in their research area outside of UNL.
176

University of Nebraska – Lincoln ADVANCE Faculty Committee 2012
Page 20 of 36
3. Ensure that pre-tenure faculty have a voice in the governance of the unit by having them serve on graduate, annual evaluation/salary review, and other substantive committees. Consider encouraging new faculty to speak at faculty meetings.
4. Hold teaching and/or research assistantships and/or fellowships for pre-tenure faculty. Recruiting new students to build a research program takes time.
5. Clarify the tenure and promotion process as much as possible. Faculty of under-represented groups may not be parts of informal networks where this information is often subtly exchanged. Annual evaluation and feedback are essential in keeping pre-tenure faculty on track to a successful promotion (see below).
6. Devote resources for pre-tenure faculty to host colloquium speakers who may serve as external letter-writers in the tenure process.
7. Encourage faculty to take advantage of campus-wide development opportunities, including grant-writing seminars (research.unl.edu/events/grantseminar/) and grantsmanship programs (research.unl.edu/facultyresources/fellowsprogram.shtml) offered by the Office of Research and Economic Development, as well as the Peer Review of Teaching Project (www.courseportfolio.org/peer/pages/index.jsp).
B. Professional Development: Mid- and Later-Career Faculty. Once promotion to associate professor with tenure has been attained, some individuals are on a rapidly rising career trajectory for which UNL might appear limiting. This may lead productive individuals (regardless of rank) to seek career opportunities elsewhere commensurate with their experience. Alternatively, other faculty members experience a "stall" in their professional careers, for some, due to events in their personal lives, for others, due to increased service or administrative responsibilities, or isolation and/or changes in their research area. Continued professional development of all faculty members can be maximized with professional support systems that continue beyond tenure, guiding faculty through advancement to full professor, and offering further professional development opportunities within UNL.
1. Consider establishing programs that are designed to aid career development at all faculty levels.
a. Development programs for mid-career faculty may be formatted with significant input from the faculty.
b. Formats for career development of more senior faculty may include regular one on one interaction with senior fully promoted faculty within or outside the departmental unit, or may consist of a small group committee that supports and advises each other collectively, or may include regular, but less formal, gatherings or discussion groups.
2. Advertise faculty development leave programs broadly; this second point seems that it should be separated from the first --increased monetary support for faculty development programs can be of great benefit for career development.
3. Provide seed money to faculty for them to change to a new field, or to restart their research program after a "stall". These funds may be used for travel to conferences, workshops, or research collaborators, or for an "internal sabbatical".
4. Encourage faculty members to attend professional development workshops on team building, including managing a research group, supervising a laboratory, supervising staff, etc.; see more in Section E (Team Building) below.
5. Encourage faculty to attend professional development workshops on leadership and administration; see more in Section F (Leadership Opportunities) below.
6. Reevaluate teaching and service commitments of each faculty member regularly (e.g., every few years) within a department to maintain timeliness, energy and vigor, and to prevent stagnation or boredom.
177

University of Nebraska – Lincoln ADVANCE Faculty Committee 2012
Page 21 of 36
7. Maintain "Swing space" for short term lab or office expansion wherever possible.
C. Active Recognition: An integral part of retaining faculty and encouraging productivity lies in making sure that each faculty member feels valued and respected by their colleagues and the university.
1. Department chairs are encouraged to actively nominate their faculty for awards and recognition, working closely with all of the faculty to identify strengths and opportunities. A department might also establish a standing committee charged with nominating colleagues for internal and external awards. That committee might develop a calendar of when department, college, university and professional society deadlines normally occur.
2. Promote visibility of every individual faculty member at the departmental, college and university levels according to their interests, talent and experience; reward and publicize faculty accomplishments in extramural as well as intramural activities.
3. Acknowledge, promote, and communicate the efforts and accomplishments of all faculty to upper administration.
4. Identify and recommend faculty members for extramural awards.
5. Nominate faculty for monetary awards for exceptional teaching, service, and/or research (e.g., the College Distinguished Teaching awards, ORCA and OTICA, etc.); consider providing monetary support for additional awards.
D. Team Building: Faculty members do not work in isolation but in unified groups within the department, college and university to accomplish the overall objectives and fulfill the mission of the university in teaching, research and service. This work can be facilitated by departments and the administration in a variety of ways.
1. Encourage interdisciplinary programs in teaching and research, including programs that are cross-college and cross-discipline.
a) Form research and/or teaching subgroups to encourage collaborations and networking; make the topical areas plastic to encourage innovation and varied membership.
b) Foster interactions among faculty who have diverse experiences and methods of teaching and research that might enrich and expand one another's work.
c) Create opportunities for professional and social interactions between faculty of different departments.
d) Aid faculty in taking advantage of internal and external funding opportunities that require collaborative approaches.
2. Foster open and non-judgmental communication among all ranks of faculty.
a) Encourage and embrace a diversity of ideas, skills and experience.
b) Promote inclusion during discussion of issues and strategic planning.
c) Engage faculty in departmental discussions of programs, new initiatives and directions.
d) Encourage active listening and well-considered discussions; discourage dominance of one or a few participants in open forums
3. Establish and publicize mechanisms to resolve conflicts within the department among faculty, staff and/or students. Maintain privacy to protect those involved.
4. Establish a process or mechanism by which senior faculty members that are most often tapped as team leaders may seek advice and guidance as needed in fulfilling that role.
178

University of Nebraska – Lincoln ADVANCE Faculty Committee 2012
Page 22 of 36
E. Leadership Opportunities: As a faculty member acquires experience, it is important to have opportunities for leadership roles within the department and college. Providing a venue within UNL for acquiring leadership and team-building skills of advancing faculty can also be an important retention issue and critical for faculty perceptions of individual value and empowerment.
1. Ensure that faculty members have the time to pursue new avenues of professional work.
a) Keep a log of teaching and service at the departmental level.
b) Annually review and discuss readjustment of teaching and service loads among faculty commensurate with appointment apportionment.
c) Actively encourage faculty to apply for leadership positions.
2. Position faculty for advancement and future leadership opportunities.
a) Publicize and reward accomplishments of faculty throughout their careers.
b) Encourage faculty to enroll in the Academic Leadership Program (ALP) of the Big Ten Committee on Institutional Cooperation (CIC). [http://www.cic.net/Home/Projects/Leadership/ALP/Introduction.aspx]
c) Nominate faculty members to serve on university-wide committees, including those that develop policies governing teaching and research.
d) Nominate faculty members to serve in various positions within the professional societies and editorial boards in the discipline.
e) Treat all faculty members equitably in assigning leadership positions; rotate frequently unless disadvantageous to program continuity
f) Annually review committee memberships and leadership composition, in order to rotate responsibilities among faculty.
3. Encourage and recognize the talents, skill sets, and experience acquired during tenure at UNL as well as externally.
4. When possible, limit the numbers of years of service for membership and leadership of university committees (e.g., 3 years), so that more faculty members can contribute their expertise toward guiding policies that govern the university and its missions in teaching and research.
5. Consider more frequent rotation and/or term limits for chancellors, deans, associate deans, chairs, graduate chairs, etc. to provide opportunities for other senior experienced faculty members to make contributions.
References
Judith M. Gappa, Ann E. Austin, and Andrea G. Trice, (2007), Rethinking Faculty Work: Higher Education's Strategic Imperative , Jossey-Bass
Filene, Peter (2005), The Joy of Teaching: A practical guide for new teachers., University of North Carolina Press
Daniel W. Wheeler, Alan T. Seagren, Linda Wysong Becker and Edward R. Kinley (2008),The Academic Chair's Handbook (Jossey-Bass Resources for Department Chairs), Jossey-Bass
More materials can be found at: http://teachingacademy.wisc.edu/archive/Resources/supportbib.html
179

University of Nebraska – Lincoln ADVANCE Faculty Committee 2012
Page 23 of 36
8. Annual, tenure, and promotion review
UNL assessment practices should be known to accommodate diversity as an integral component in the pursuit of excellence. To attract and retain excellent faculty, all evaluation, tenure and promotion policies, practices and procedures need to embrace and recommend a work-life balance that is welcoming to the best and most creative faculty. Policies and guidelines that accomplish this should include each level of faculty progress through the ranks and should be communicated clearly and openly.
A. Publish policies and guidelines for each level of faculty progress through ranks. Each College at UNL has published guidelines for the evaluation of faculty on the UNL website (e.g.; http://ianrhome.unl.edu/faculty-resources). However, the implementation of these guidelines is interpreted in a unit and/or discipline-specific manner that benefits from definition at the unit level. 1. Department Chairs and Heads, in collaboration with a committee comprised of faculty at each
rank, should develop standardized procedures, forms and sample letters for the unit’s annual evaluations, as well as promotion, tenure, and reappointment evaluation.
2. Formulate a rubric that reflects the unit’s expectations for annual progress, promotion, and tenure (see below).
3. Consider developing a handbook that explains expectations for tenure track and non-tenure track faculty at each rank. Include sample templates and headings to guide faculty members in documenting their efforts in the most easily interpreted fashion.
4. Provide a sample of a complete CV and tenure package for new faculty to begin documenting their efforts from the moment they begin their appointment.
5. Emphasize to new faculty the importance of establishing relationships with critical players in their research or teaching field whom will be able to serve as external evaluators for their promotion and tenure applications in the future.
6. Establish a mechanism for regularly revisiting and amending expectation criteria for Reappointment, Promotion, Tenure and Annual evaluations. Ensure that criteria are consistent with College and University-level expectations.
B. Establish an evaluation team or committee.
Accomplishments of each faculty member are annually summarized and provided to the Department Chair or Head. An assessment of each faculty member’s accomplishments in the context of the unit’s and the university’s expectations, in addition to the Chair’s or Head’s evaluation, is most effective in ensuring the equitable evaluation of the faculty member if done annually by a team of evaluators who represent relevant viewpoints. 1. Consider establishing a standing committee for annual evaluation, and promotion & tenure
recommendations, here designated the APT evaluation team. 2. Discuss and establish guidelines for the choice of the committee or APT evaluation team and
for the regular rotation of its members, whether by selection or election. 3. Emphasize diversity in the APT evaluation team. Consider representation of all faculty ranks
and gender/ethnic demographics if possible.
C. Ensure transparency. Making the requirements and processes for assessment clear and unambiguous to both the evaluators and those being evaluated enables all faculty to work most effectively and productively
180
University of Nebraska – Lincoln ADVANCE Faculty Committee 2012
Page 24 of 36
by removing uncertainty and by helping to assure everyone that assessment is as objective as possible. 1. Publish and/or distribute documents, expectations and sample templates for annual
evaluation documentation so they are easily accessible for all faculty. 2. Provide guidelines to the APT evaluators that are available to all faculty so evaluation is
consistent, and faculty understand the evaluation criteria. 3. Composition of the APT evaluation team and/or guidelines for choice of committee members
should be published in the Unit’s by-laws and distributed to all faculty. 4. Regularly discuss criteria for promotion, tenure and evaluation at faculty meetings.
D. Maintain equity and consistency in review. Each faculty member, regardless of circumstances, must be evaluated with the same procedures and expectations to preserve objectivity and ensure equal consideration. 1. Use of a rubric is encouraged, to facilitate consistent evaluation. 2. Confidentiality in written and verbal deliberations is critical. Information regarding an
individual’s personal circumstances, if not documented in the individual’s annual accomplishments report or promotion/tenure file, must not be discussed.
3. External evaluation letters that reveal personal information about the faculty member being evaluated should be excluded from consideration.
4. An APT Evaluation team discusses each faculty member in the absence of the Department Chair/Head and documents its evaluation of each faculty member independently.
5. Faculty members who have requested extension of the tenure clock must be evaluated according to net accomplishments in teaching, research, and service irrespective of time in rank.
6. A chair of the APT evaluation team, in collaboration with the team, ensures that individual faculty evaluations are distributed in writing to the faculty member and that the written document accurately reflects the discussion about the file.
7. Discussions about individual faculty promotion, tenure, or annual evaluation files should be formal, confidential, and only transpire in the presence of the full APT evaluation team. Email exchanges should be avoided.
8. Department heads/chairs meet with the chair of the APT evaluation team to discuss each recommendation provided by the team prior to conducting her/his annual evaluation.
E. Identify a faculty advocate for each promotion and tenure file. 1. Pre-tenure faculty are encouraged to identify, in consultation with the unit head or chair if
possible, a more senior faculty advisor/advocate with whom they confer about compilation of documents for promotion and tenure.
2. The chair of the APT evaluation team may serve as a faculty advocate whether or not a senior faculty advisor is identified for the individual faculty member. The APT evaluation chair confers with candidates for promotion and/or tenure well in advance of the APT evaluation team meeting to ensure that the candidate has all materials needed to complete the evaluation file.
3. If an evaluation file is incomplete, the APT evaluation chair informs the individual faculty member so they have an opportunity to provide an explanation or update the missing information.
181

University of Nebraska – Lincoln ADVANCE Faculty Committee 2012
Page 25 of 36
F. Formulate a rubric for progress at each level. To make the best and most objective assessments, evaluators are strongly encouraged to make use of a standard rubric for assessments. Discussions at the full faculty level are ideal for establishing consensus about meeting, exceeding, or not meeting expectations of excellence. As appropriate to the percentage appointment of the individual faculty, the rubric may address the following criteria. 1. Research: published manuscripts, book chapters, and other scholarly works; internal and
external grants applied for and/or received; students and/or postdoctoral fellows mentored; patents; etc.
2. Teaching: contribution to formal course instruction; student evaluations and/or testimonials; peer evaluated teaching; mentoring of students; etc. Note that this evaluation does not focus on the CIEQ or other student evaluation score, since these scores are easily manipulated and reflect many attitudes that extend beyond the successful accomplishment of the faculty member’s teaching duties*.
3. Service: contribution to formal departmental, college, and university committees; professional service on grant review panels, manuscript reviews, and society organizational service; internal and external outreach activities; etc.
4. External letters of evaluation: number of letters required; content of letters; sample letter of solicitation to be sent by unit chair/head; guidelines for who can serve as an evaluator and timeline for requests.
G. Evaluate team-building and team-based skills in teaching and research when appropriate.
Evaluative processes need to include assessment of faculty leadership and participation in team and interdisciplinary research and education activities. As the nature of faculty teaching and research becomes increasingly more collaborative and team-based, assessment procedures must be clear in respect to the importance and value of leadership of, and participation in, teams that seek funding or that conduct collaborative research or education. 1. Assess collaborative funding, resources, and expenditures. 2. Provide incentives for engaging in and documenting collaborative activities, and clearly
document assessment procedures for the outcomes.
H. Guidelines for avoiding implicit bias Many studies have shown that all men and women have unintentional and unexamined biases and assumptions and these affect their evaluation of others. Steps that help make evaluation a carefully considered and deliberative process, not one that is rushed or unexamined, have been shown to reduce the effects of such implicit bias and assumptions. This is particularly significant in the evaluation of women and minority faculty members who are not as representative of the traditional majority academic faculty culture. 1. Evaluations of faculty that are deferred by use of UNL family leave policy should be treated
the same as evaluations conducted at the normal period and should be evaluated without prejudice.
2. To make the best and most objective assessments, evaluators need to have enough time allotted for assessment and need to take their time in assessment.
3. Personal issues relating to health, family, or personal situations of any kind should not be discussed or considered in evaluation.
4. Tenure clock extensions, as mentioned above, should not be discussed or considered in evaluation.
5. Race and gender should not be discussed or considered in evaluation.
182
University of Nebraska – Lincoln ADVANCE Faculty Committee 2012
Page 26 of 36
6. Student evaluations should not be a major consideration in the quality of a faculty member’s teaching. Student assessment has been extensively documented to reflect implicit bias that negatively impacts specific ethnic, age and gender demographics. Furthermore, such data vary directly with course assignment.
I. Institutionalize the annual review process for all faculty. 1. Conduct annual promotion and/or tenure evaluations for those faculty who are not yet tenured
and those not yet fully promoted. All faculty will be better able to optimize their activities and make progress toward promotion, tenure, or increased productivity, if they have regular performance evaluations.
2. Conduct 3-year promotion and tenure reviews for tenure-leading faculty and faculty who are not yet fully promoted.
3. Provide useful and timely feedback on performance and progress to all faculty, including those post-tenure and those fully promoted.
4. Consider post-tenure reviews of fully promoted faculty every three years.
References
Julianne Arbuckle and Benne D. Williams, (2003) Students’ Perceptions of Expressiveness: Age and Gender Effects on Teacher Evaluations Sex Roles. Vol. 49. Nos. 9/10,
183
University of Nebraska – Lincoln ADVANCE Faculty Committee 2012
Page 27 of 36
9. Searching for New Faculty: Defining and Advertising the Position “The University of Nebraska-Lincoln is a public university committed to providing a quality education to a diverse student body. One aspect of this commitment is to foster a climate of inclusion and mutual support that will enhance our ability to achieve our overall goals of recruiting and retaining good faculty and staff while allowing all of us to focus our energies and talents on our important missions of education, research and service.” (from the University of Nebraska – Lincoln Non-Discrimination Statement). This policy statement is in place because diversification and heterogeneity of thought and experience in academia are essential to creativity and advancement of knowledge, each of which are imperative for the success of our institution and our nation. Therefore, every new hire is an opportunity to revitalize, expand and enhance departmental programs and skills, i.e. to diversify.
A. The Search Committee - The faculty search committee should be an interactive group with the primary goal of hiring the best person to meet the long-term objectives of the department and university in their field of expertise. To maintain and foster excellence, this potential faculty member should add diverse experiences that will strengthen and broaden the educational and research sphere of the department.
1. Appointment of the Committee
a) Appoint a diverse committee – inclusive of women and minorities. b) Consider appointing a member from outside the department to bring a fresh perspective to
discussions. c) Confirm that all committee members have a realistic estimate of the time involved in the search
process from start to finish. d) Stress the need of committee members to attend search committee training offered by the Office
of Equity, Access and Diversity Programs (EADP). This training covers materials on the importance of selecting and maintaining a diverse academic community, and that aid in the identification of implicit biases and instruct on methods to minimize their impact.
e) Encourage committee members to become familiar with ADVANCE documents on best practices for a successful search.
2. Meetings Prior to Advertising the Position
Review state and federal laws related to hiring. Review the UNL policy at www.unl.edu/equity/NonDiscrimination%20Statement%2010.pdf
a) Acknowledge the importance of the participation of committee members. b) Discuss the roles and responsibilities of committee members, including the importance of
confidentiality c) Determine how members will communicate with each other and the campus community. e) Openly recognize implicit biases. Consider inviting representatives from the ADVANCE program
to provide input on methods to prevent biases from negatively influencing professional activities. f) Ask the Dean to meet with the committee to reiterate the importance of inclusion g) Maintain a rapport among committee members by establishing an atmosphere of collegiality,
dedication, open-mindedness, and respect for everyone’s input h) Remind committee members that they are acting as representatives of the department/
university, not as representatives of their research area or their individual interests i) Balance the dynamics of meetings so that no one individual dominates discussions j) Establish the equality of committee members (rank/tenure do not enter in) k) Establish ground rules for attendance, duties, decision-making, treatment of candidates, etc. l) Make meetings effectual and efficient.
184
University of Nebraska – Lincoln ADVANCE Faculty Committee 2012
Page 28 of 36
m) Make clear that diversity and excellence are compatible, and should be dually considered in the course of the search.
n) Emphasize that all inquiries/requests regarding the search and the hire should be referred to the Search Committee Chair, including those from applicants and the academic community.
3. Planning and preparation before the search begins
a) Develop an effective recruitment plan, identifying selection criteria. b) Establish plans for actively recruiting women and members of other under-represented groups. c) Establish guidelines for the evaluation of applicants that abate implicit biases that could creep into
the review process. d) Remind the committee members that ADVANCE-Nebraska is available for consultation on an on-
going basis as questions arise during the search process.
B. Advertising a Position
A diverse pool of applicants is critical to attracting the most-qualified hires for a position. The following quote exemplifies barriers to attaining this goal.
“When it comes to actually recruiting diverse faculty members, many search committees report that they cannot find qualified women. Research, however, has shown that committees succeed in hiring women and people of color when they transform the search process, are committed to diversity and are proactive about building a diverse applicant pool. Transforming the search process requires that the committee do more than simply place ads and wait for applicants to express interest.”
(http://www.engr.washington.edu/advance/workshops/F07-Faculty-Recruitment)
1. Attracting a Diverse Applicant Pool. The broadest, most diverse pool of applicants will increase the likelihood of recruiting the most qualified candidate. a) Consider that a broadened position description may increase the number of women and other
underrepresented groups to apply. b) Be aware that the language used to describe a position can influence the pool of individuals who
submit an application, thus care should be taken in crafting the wording. The following web resources provide information to help insure that language is appropriate and not exclusionary:
http://www.aps.org/programs/minorities/recruitment/ads.cfm
http://www.washington.edu/diversity/avpfa/language.html
2. Position Statement. A clear statement about the position should be crafted.
a) Identify what is expected in terms of teaching, research and service. b) Identify the qualifications and experience sought. c) Clearly state what is expected of the position, including: job title; duties of position; minimum
degree requirement; % FTE appointment; required qualifications for position; closing date; start date of appointment.
d) State whether the position will be tenured, tenure eligible, or not tenure eligible. e) Identify a contact person for additional information about the position. f) Clearly state what constitutes a complete application, e.g. curriculum vitae, statement of teaching
qualifications and philosophy; statement of research interests and plans; name and address of individuals who may provide letters of reference.
185

University of Nebraska – Lincoln ADVANCE Faculty Committee 2012
Page 29 of 36
g) State whether letters should be sent by the closing date or will be requested by the Search Committee based on a list provided by the applicant.
C. Posting the Position. To attract the best applicants, the search should be broad and the ad should target a diversity of groups. The language used (refer to B above) and the appearance of an advertisement can influence the pool of individuals who submit an application, thus care should be taken in preparing the advertisement.
1. Write the advertisement to ensure that it does not discourage applicants who are women and individuals from other underrepresented groups in STEM fields.
2. Make the ad explicit about the University being an inclusive community.
3. Advertise the position broadly. Make use of internet sites frequented by professionals, including post-docs and graduate students in relevant fields.
4. You can find out where your last hire found out about the job ad by contacting Human Resources to access PeopleAdmin faculty job ad data. Research has shown most new STEM faculty learn about a job ad through an online ad. Most short-listed STEM women learn about the job through word of mouth, i.e. from a personal referral.
5. Another source of information on where to place the advertisement might be graduate students, post-docs, and your most recent hires.
6. U.S. Department of Labor requires that there be a paper advertisement in case a non-U.S. citizen is offered the job.
186

University of Nebraska – Lincoln ADVANCE Faculty Committee 2012
Page 30 of 36
10. Searching for New Faculty: Applicant Evaluation and Selection
This list of suggested practices for applicant evaluation and selection focuses on developing evaluation criteria and applying them to developing the “long short list” and “short list” of applicants. It is adapted in part from Fine and Handelsman (2005).
A. Develop criteria for evaluation
1. It is helpful if the search committee meets prior to the application deadline to discuss and agree upon the criteria that will be used for evaluation.
a) Effective criteria are those that can be applied consistently to all applicants.
b) EAD requires that evaluation criteria are consistent with those listed in the job advertisement and its description on People Admin.
c) Use a standard evaluation form, or rubric discussed in the committee meetings. Accountability has been shown to increase the accuracy and objectivity of ratings (Mero and Motowidlo, 1995). Refer to Section C for sample rubrics. See also the ADVANCE-Nebraska website: http://advance.unl.edu
2. Throughout the selection process, periodically re-evaluate criteria and their implementation to ensure that they are serving their intended purpose.
a) Are criteria being applied consistently?
b) Are search committee members inadvertently relying on unwritten or unrecognized criteria?
c) Are certain criteria or the way in which they are applied inadvertently screening out applications from members of under-represented groups?
B. Stages of the review:
1. Build a “long short list” and then, after primary review, select a “short list” of applicants to bring in for interview. The “long short list” might include only those individuals that meet the minimum qualifications of the job description in People Admin, or it may be a list of applicants that the committee wishes to look at more closely. The “short list” typically includes individuals that the committee wishes to be brought in for interview. The selection of the “long short list” and “short list” should be carried out at separate meetings or a series of meetings, scheduled to allow committee members sufficient time to thoroughly review all applications. Throughout the process, remember that the search committee may be called upon to make a convincing case that the review was thorough and handled fairly. All committee members should keep sufficiently detailed notes so that the reasons for decisions will be clear later.
a) Development of the long list:
i. Frankly inform and educate committee members about how much time reading and evaluating applications will take. Inexperienced or busy members may otherwise put off reading the files until it is too late to do a thorough evaluation. Studies show that devoting a minimum of 15-20 minutes per application will help to minimize the effects of unconscious bias.
187
University of Nebraska – Lincoln ADVANCE Faculty Committee 2012
Page 31 of 36
ii. The use of a rubric can help to ensure that all applications are given equal treatment (example given below).
iii. Before finalizing the “long short list,” examine it closely to see whether qualified applicants from under-represented groups are included. If not, consider whether biases or assumptions have influenced rankings.
iv. When requesting letters of reference, request that letter writers refrain from commenting on any aspect of the applicant’s personal life that is not allowed in the normal search interview, such as marital or parental status, etc.
v. Review objectives, criteria, and evaluation procedures. Remind committee members to devote at least 15-20 minutes to the evaluation of every applicant and to be prepared to defend every decision for rejecting or retaining an applicant.
vi. Some committees find it useful to devise an evaluation rubric that considers the same range of criteria used in tenure and promotion decisions, such as accomplishments and potential for future excellence in teaching, research, and service (example given below).
vii. Evaluate the entire application; don’t depend too heavily on only one element such as letters of recommendation, or the prestige of the degree-granting institution or postdoctoral program.
viii. Beware of bias in letters of recommendation. Studies show that regardless of the gender of the letter writer, letters for women and minorities are often shorter, provide fewer references to the CV, make more references to personal issues such as relationship status and personality, and contain more “doubt raisers” (Trix and Psenka, 2003).
ix. Do not allow individuals to dominate the process or to push for dropping or retaining applicants without defending their reasons. Ask quieter members of the committee for their opinions.
x. The search committee chair should strive to require uniform application of standards in retaining or dropping applicants.
• After search committee members present initial evaluations, review the rankings a second time. Opinions expressed early in the process can change after many applications are considered and strengths and weaknesses of the applications become clarified.
188

University of Nebraska – Lincoln ADVANCE Faculty Committee 2012
Page 32 of 36
Example of a Long List Evaluation Form
Name Current Position________________________________________________________ Current Location________________________________________________________ Highest Degree__________ Year_______ School ____________________________ Academic Discipline_____________________________________________________ I = Inadequate; A = Adequate; G = Good; E = Excellent
Qualifications Rating
Comments I A G E Education: PhD in relevant area of study
Postdoctoral experience Teaching experience Research experience Grant writing experience Publication history Involvement in Extended Professional Communities
Involvement in outreach activities Experience with diversity or multicultural issues
Community involvement Other professional interests/skills Recommendation letters
Particular strengths this candidate offers: Concerns this candidate presents: Overall rating (Check one in each row)
Required qualifications: exceeds meets does not meet Preferred qualifications: exceeds meets does not meet
189

University of Nebraska – Lincoln ADVANCE Faculty Committee 2012
Page 33 of 36
b) Development of the short list:
i. The short list is derived from the top candidates remaining after the long list has been reviewed as in (a). From this list the candidates may be chosen for an interview in the final stages of the selection process.
• Before finalizing the “short list,” examine it closely to see whether qualified applicants from under-represented groups are included. If not, consider whether biases or assumptions have influenced ratings.
• Individual reviewers as well as the committee chair should keep sufficiently detailed notes so that the reasons for decisions will be clear later.
• Note that the “short list” of candidates will be submitted to the Office of Equity, Access and Diversity Programs for scrutiny to make sure University policies are adhered to.
Example of a Short List Rubric:
Category Considerations
Research: Publication output and quality, grants success, research potential (as indicated by feasibility of proposed research, evidence for developing collaborations, evidence for attempting to secure funding, manuscripts in review, letters of reference, etc.)
Teaching: Classroom/field teaching experience, experience advising students on research projects, teaching potential (as indicated by application materials - CV, teaching statement, letters of reference)
Leadership and Teamwork:
Examine evidence of leadership and team building skills. For example, these may be indicated by leadership roles in undergraduate and graduate professional organizations. Leadership and organizational skills may be indicated within the CV as a list of professional experiences, in the proposed research plan, and in the statement of teaching philosophy.
Outreach/ Service:
Outreach experience and potential (as indicated by application material - CV, statements in statements? Is this correct?, letters of recommendations, etc.) Service experience on committees, boards, etc. (as indicated in application material - CV, letters of reference, etc.)
Programmatic Enhancement:
Evaluate whether or not the experience and expertise of the candidate would broaden current capabilities and, for example, attract a broader group of students and research funding. Discuss whether programs that might be initiated by the candidate would be within the scope of departmental research and teaching, or would provide novel enrichment and enhancement opportunities.
190

University of Nebraska – Lincoln ADVANCE Faculty Committee 2012
Page 34 of 36
11. Interviewing Candidates
The interview is an essential part of the selection process for new faculty members in any department. Importantly, the quality of the interview experience impacts the profile of the university as prospective candidates reflect after leaving campus on the quality of the academic work environment. The list of suggested practices in this section focuses on developing and implementing an effective interview process. Logistical details such as short list approval, required meetings with particular administrators, and interview expense authorization are given in the College of Arts and Sciences Search and Hiring Procedures Document [http://ascweb.unl.edu/adminresources/recruitment/tenure_hiring.html ] and the IANR Search Advisory Committee Handbook [http://ianrhome.unl.edu/admin]. The following is adapted in part from Fine and Handelsman (2005).
Throughout the planning and interview process, remember that the interview allows the department to determine if the candidate would be a good fit for UNL, but also allows the candidate to determine if UNL would be a good fit for her/him. Keep both of these goals in mind to ensure an effective interview.
A. Preparing for the Interview
1. Develop a set of questions that each candidate will be asked. These questions should be designed to expand upon and clarify information available in application documents or missing from those documents. The same information content should be acquired from each candidate to allow unbiased comparison. Examples of questions include those related to the areas of:
a) Educational background
b) Research and teaching experience and philosophy
c) Research interests they may pursue in the future
d) Potential sources of future funding
e) Potential courses of interest
f) Potential collaborative interactions with faculty and students
g) Mentoring philosophy
2. Educate all interviewers, department faculty, and personnel about inappropriate questions. These include questions relating to:
a) age, gender, marital status, race, birthplace, ancestry, religion – it is not acceptable to probe for potential dual career issues during the interview.
b) disabilities or health problems
c) arrest record
191

University of Nebraska – Lincoln ADVANCE Faculty Committee 2012
Page 35 of 36
3. The interview team is responsible for projecting and promoting a positive environment. Each interviewer should encourage an open dialogue with the candidate that is both professional and non-threatening.
4. If a seminar and/or round table discussion will be led by the candidate, provide them some information about the audience, the purpose of the forum, and content areas before they arrive on campus.
5. Build the interview schedule, making sure to include breaks for the candidate. Also be sure to allow enough time to travel between buildings/campuses. The schedule should be detailed (identify interviewers by name and affiliation). Share the schedule with the candidate before she/he arrives. Consider adding a tour of the campus or of facilities in allied units and a tour of neighborhoods in Lincoln.
6. Keeping in mind the second aim of the interview process, personalize the interview for each candidate.
7. Provide candidates with opportunities to learn about UNL beyond the department/center (benefits, child-care options, grant-writing workshops, other aids offered to pre-tenure faculty [Paid trips to funding agencies? Set-aside teaching assistantships?], etc.).
8. Develop an information packet to share with all candidates, including information about Lincoln. ADVANCE can help with this, and a great resource is "About Lincoln" link on the UNL Human Resources site: http://visit.unl.edu/ucomm/lincoln/. It is legal to tell candidates about the great schools in Lincoln, but not to probe or to appear to be probing for information on parental status.
9. Remember that one purpose of the interview is to have each candidate eager to be offered the position at UNL. Present the department, the college, the university and Lincoln in a positive light and make it clear how the candidate is viewed as fitting into the department/unit.
B. The Interview Process
1. Follow the schedule! 2. Make candidates feel comfortable and welcome. Treat all candidates
fairly and with respect. Remind faculty members that each candidate is a potential colleague.
3. Encourage faculty members, graduate students, undergraduates, and people from other, allied units to attend candidate talks. Remind them of inappropriate questions.
4. Allow the graduate/undergraduate students in the program a chance to interact with the candidate and ask for their input on each candidate.
5. Allow the candidate sufficient time to ask questions.
C. Post- Interview Procedures and Considerations
1. Remind faculty and other evaluators to complete their evaluations as soon as possible.
192
University of Nebraska – Lincoln ADVANCE Faculty Committee 2012
Page 36 of 36
2. Decide how to proceed if your top candidate turns you down. 3. Solicit input from graduate/undergraduate students as appropriate. 4. Other post-interview activities will vary by department.
References
Fine, E., and Handelsman, J. (2005) Searching for Excellence and Diversity: A Guide for Search Committee Chairs: Women in Science and Engineering Leadership Institute, University of
Wisconsin, Madison. Available for download at http://wiseli.engr.wisc.edu/hiring.php#resources. Mero, N.P., and Motowidlo, S.J. (1995) Effects of rater accountability on the accuracy and the favorability of performance ratings. Journal of Applied Psychology, v. 80, p. 517-524.
Singh, A. et al. (2007) ADVANCE Faculty Recruitment Tutorial, University of Rhode Island. Available for download at http://www.uri.edu/advance/files/pdf/Recruitment/Recruit_Handbook_Web.pdf
Trix, F., and Psenka, C. (2003). Exploring the color of glass: letters of recommendation for female and male medical faculty. Discourse and Society, v. 14, p. 191-220.
193
H. DATA COLLECTION PROCESS AND ANALYSIS OF NONRESPONSE: FACULTY
NETWORK AND WORKLOAD STUDY 2011
194
University of Nebraska-Lincoln
ADVANCE-Nebraska Program
Data Collection Process and Analysis of Nonresponse: Faculty Network and Workload Study (2011)
Report prepared by Megumi Watanabe, M.A. and Dr. Christina Falci
The UNL ADVANCE Program is
supported by a grant from the
National Science Foundation.
http://advance.unl.edu
Office Address: 21 Canfield
Lincoln, NE 68588-0420
Phone: 402-472-3304
FAX: 402-472-6276
195
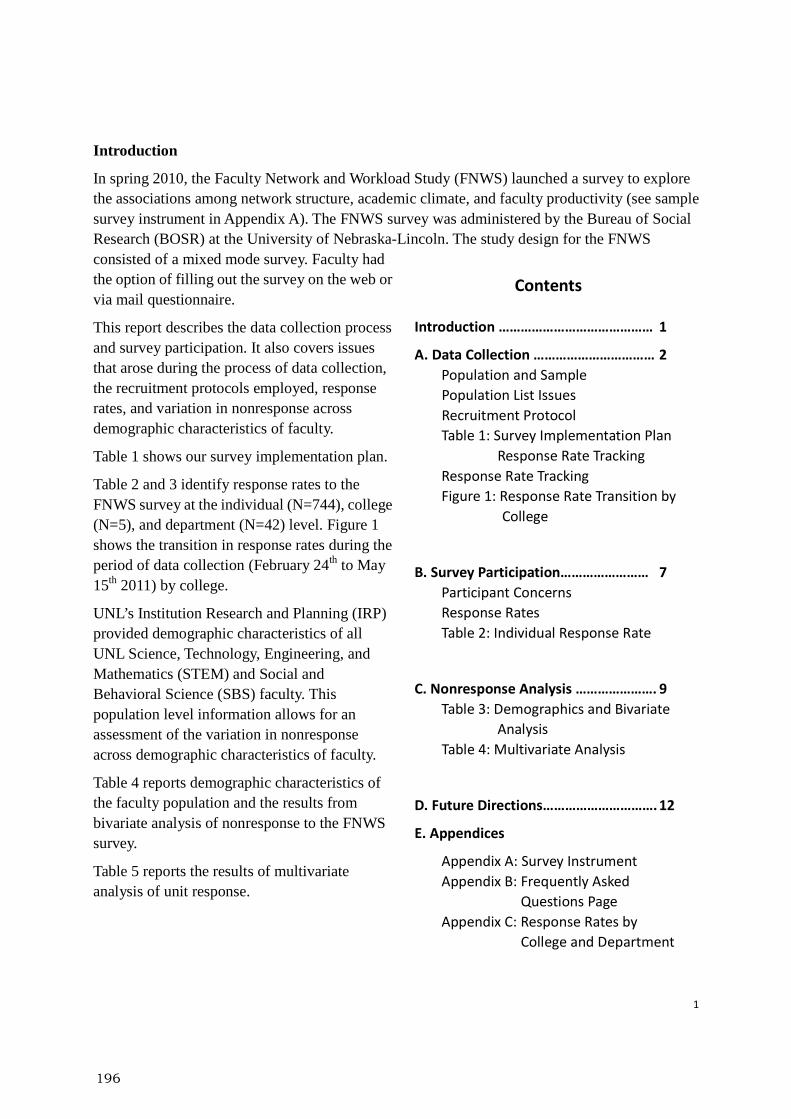
1
Introduction
In spring 2010, the Faculty Network and Workload Study (FNWS) launched a survey to explore the associations among network structure, academic climate, and faculty productivity (see sample survey instrument in Appendix A). The FNWS survey was administered by the Bureau of Social Research (BOSR) at the University of Nebraska-Lincoln. The study design for the FNWS consisted of a mixed mode survey. Faculty had the option of filling out the survey on the web or via mail questionnaire.
This report describes the data collection process and survey participation. It also covers issues that arose during the process of data collection, the recruitment protocols employed, response rates, and variation in nonresponse across demographic characteristics of faculty.
Table 1 shows our survey implementation plan.
Table 2 and 3 identify response rates to the FNWS survey at the individual (N=744), college (N=5), and department (N=42) level. Figure 1 shows the transition in response rates during the period of data collection (February 24th to May 15th 2011) by college.
UNL’s Institution Research and Planning (IRP) provided demographic characteristics of all UNL Science, Technology, Engineering, and Mathematics (STEM) and Social and Behavioral Science (SBS) faculty. This population level information allows for an assessment of the variation in nonresponse across demographic characteristics of faculty.
Table 4 reports demographic characteristics of the faculty population and the results from bivariate analysis of nonresponse to the FNWS survey.
Table 5 reports the results of multivariate analysis of unit response.
Contents
Introduction …………………………………… 1
A. Data Collection …………………………… 2
Population and Sample
Population List Issues
Recruitment Protocol
Table 1: Survey Implementation Plan
Response Rate Tracking
Response Rate Tracking
Figure 1: Response Rate Transition by
College
B. Survey Participation…………………… 7
Participant Concerns
Response Rates
Table 2: Individual Response Rate
C. Nonresponse Analysis …………………. 9
Table 3: Demographics and Bivariate
Analysis
Table 4: Multivariate Analysis
D. Future Directions…………………………. 12
E. Appendices
Appendix A: Survey Instrument
Appendix B: Frequently Asked
Questions Page
Appendix C: Response Rates by
College and Department
196

2
Data Collection Population and Sample
The survey population is comprised of full-time faculty with a tenure home in one of the 32 STEM or 10 SBS departments at the University of Nebraska-Lincoln. Due to the focus on faculty networks we had to bound actors within academic departments and made every attempt to identify faculty who actively participate in the department. Faculty are excluded from the sample frame for the study if any of the following apply to their position: 1) they work at an extension center in rural Nebraska (e.g., North Platte and Scotts Bluff); 2) they primarily hold an administrative appointment (i.e., have little or no Full-Time Equivalence (FTE) in their tenure home department, e.g., Deans); or 3) they were on an extended leave of absence. The final sample for the study is comprised of 744 faculty within 42 departments and five different colleges. Population List Issues (Coverage Errors)
IRP performed a data extract on the personnel database in Fall 2010 to identify all eligible faculty in the survey population. Unfortunately, there is an unavoidable time lag between the personnel data drawn by IRP, which was valid as of October 2010, and the beginning of the FNWS survey (March 2011). This time lag caused undercoverage in the sample frame of newly-hired faculty and erroneous inclusion of faculty who either left or retired after October 2010. Therefore, we checked the department websites in February 2011 and adjusted the list of the target population (e.g., added and dropped a few faculty). We did not, however, catch all coverage errors before the initiation of the survey.
After the data collection began (in early March), we were notified that one faculty member in Veterinary and Biomedical Sciences invited to participate in the survey had already retired and is therefore ineligible for the study. We also received a phone call from a faculty member in this department informing us that we failed to include four additional faculty in the department. Subsequently, all four of the identified faculty were invited to participate in the survey. Upon further investigation, however, three of these identified faculty members were excluded from the original sampling frame because they were working at an extension center (the Clay Center in Hastings, NE). The fourth identified faculty member was added to the sampling frame. This person was originally missed because he was an associate dean; however, this person was also a department head with an FTE of 60% in their tenure home department.
In early April, we received an email from a faculty member in the Chemistry department who was working as a program director for the National Science Foundation in Washington, DC. Although he held tenure in the department of Chemistry, he had been on an extended leave of absence. Therefore, we considered him ineligible for the study.
Also in early April, we were notified that one person included as Economics department faculty was actually managerial/professional staff and was ineligible for the study. We also received an email from a faculty member in this department saying that we were missing a faculty member
197

3
who was in the department of Economics. This person was missed because he had been teaching in the Raikes School of Computer Science and Management. This school provides an undergraduate degree program taught by faculty across several different departments (e.g., computer science, management, design, accounting, marketing, engineering). The Economics department faculty member’s FTE was 100% in the Raikes School, but this faculty member had a tenure home in Economics and routinely participated in department activities.
By mid April, after receiving a few phone calls and emails, we became aware of an issue with Associate Deans. Because IRP classifies most associate deans as administrators and not faculty, seven of the nine Associate Deans were originally left off the population list from IRP. A key issue is that Associate Deans had vastly different appointments in terms their split in FTE between their tenure home department and their administrative office. Some had no FTE in the tenure home and others had FTEs as high as 60%. In other words, some were active participants in their tenure home departments (and faculty let us know we did not include them in the study) and others had minimal or no participation in their tenure home departments. We personally spoke with one Associate Dean with a 20% FTE in their tenure department who indicated no involvement with their tenure home department (i.e., not invited to faculty meetings, did not vote on department issues or tenure, did not teach in the department or conduct research). Although all Associate Deans were subsequently invited to participate in the survey, we decided to only retain the four Associate Deans with an FTE greater than 25% in their tenure home department.
Finally, after the survey period ended, we identified 11 additional survey participants who should have been considered ineligible for the study. These individuals were ineligible for one of the following reasons: 1) working part-time – had a total FTE lower than 90% - three cases; 2) on leave for the whole 2010-2011 academic year or longer - seven cases; or 3) not in a tenure-line position - one case.
During the data collection process, we took several different strategies to correct these above described coverage errors. First, the total of 22 ineligible faculty who were invited to participate in the survey will simply be dropped from the final sample. Because we used a roster method (i.e., provide a list of all faculty in a participants tenure home department) to collect the network data in our study, however, it is much more challenging and complicated to add faculty to the original sampling frame.
When only one faculty member in a department was missing, we simply invited this person to participate in the survey using the same recruitment protocols and sent them (and provided web access to) the same survey all other faculty in their department received. Although this strategy has the advantage of ease in implementation, the drawback for the network questions is not giving the non-missed department members the opportunity to identify network ties to the missed faculty member. Thus, we will have to rely solely on the reports from the missed faculty member to identify their network connections. This is the strategy we employed for the one faculty member missed in the department of Economics and the seven Associate Deans - each Associate Dean had a tenure home departments with no other missing faculty.
198

4
If, in contrast, we missed more than one faculty member within a sampled department, then a different strategy is required. In addition to sending the missed faculty a revised survey, we also had to provide an updated set of network questions to everyone in department. This is the strategy we used for the four faculty missed within the department of Veterinary and Biomedical Sciences. Specifically, we revised the network questions on the mail survey for this department and updated the network questions on the web survey. Then, the missed faculty members were invited to participate in the survey using the same recruitment protocol. At the same time, the originally sampled faculty members in this department were sent out a revised section of the network questions in the mail with an apology letter explaining the issue with the survey that was initially mailed.
Finally, we caught two eligible faculty within the same department who were not invited to participate after the survey implementation period was over. We caught them because several respondents including their departmental colleagues nominated them for the questions that asked to list names of faculty outside of their tenure home department who they had collaborated or had received research related help from. In the first case, we excluded the faculty member from the original list of target population because of an error in the IRP data, which indicated the person was not tenure-line faculty. In the second case, we did not include the faculty member in the target population list because he was listed as a center director on the department website and was not included in the IRP data. Recruitment Protocol
At the initiation of the survey period (February 24th 2011), we invited 754 faculty members to participate in the survey. As described above, we subsequently invited 12 additional persons to participate in the survey after February 24th. Overall, 766 individuals were invited to participate in the survey. All faculty invited to participate in the survey received the same recruitment protocols described below, but faculty who were added to the original sampling frame after February 24th
were given each action at a later date.
With the goal of collecting complete social network data, the response rates for the study must be very high (over 80%). Several procedures were implemented to foster high survey response rates (see Table 1 for full details). Participants were first sent a pre-notification letter in the main, which included a UNL notepad as an incentive. One week later a mail questionnaire was mailed, which included a UNL pen incentive and log-in access to the web survey. Then, multiple follow-ups via mail, email and phone were made to non-respondents until the end of the survey period (May 20th). One mail follow-up included a replacement questionnaire. Finally, twice during the survey administration department chairs were asked by the dean of their college to send an email to their faculty encouraging their participation in the survey. These emails were written by the principal investigators and provided to the chairs.
199

5
Table 1. Survey Implementation Plan
Date Action
Thursday, February 24
Prenotification letters mailed to faculty home signed by Dean of College, Vice
Chancellor of Research, and PI’s (Dr. Falci, and Dr. McQuillan); include UNL
notepad as incentive
Friday, March 4
1 week later: Mail questionnaire to home; include cover letter signed by PI’s
with web version access link and login information , pen as incentive, and
Frequently Asked Questions (FAQ) page
Tuesday, March 8 2 work days later: First follow-up email sent to work account containing web
version access link and login information
Monday, March 14
1 week later: send Thank you / Postcard reminder with web information to
home. Also, college Deans send email to department Chairs asking chair to
send email to faculty encouraging them to participate in the survey.
Monday, March 21
(note: Spring Break week)
1 week later: send replacement questionnaire to nonrespondents via postal
mail to home address in bigger envelopes than 8x10; include cover letter
signed by PI’s with web information and the FAQ page
Monday, March 28 1 week later: send second email follow-up email to work account containing
web link and login information
Tuesday, April 5
1 week later: BOSR emails department Chairs their department-level
response rates (as of April 1). Also, email from Deans asking chairs without a
100% response rate to send another email to their faculty encouraging them
to participate in the survey.
Tuesday, April 19 3 weeks later: Start phone calls to non-respondents. Callers will leave a
reminder messages, not administer questionnaire.
Tuesday, May 3 2 weeks later: send final email reminder
Wednesday, May 20 End data collection – one week after the end of the semester
200

6
Response Rate Tracking
Between March 4th and May 15th, we tracked participate response for all faculty invited to participate in the survey (N=766). Figure 1 shows the climb in response rates for each college across the days of survey administration from March 4th to May 15th during the 2011 spring semester. The recruitment protocols are labeled on the horizontal axis based on the day of implementation. Several response rate bumps are noticeable in these trend lines and may correspond with the recruitment protocols, especially the emails from department chairs to faculty. Figure 1. Increases in Faculty Response Rates by College over the Survey Implementation Period
0%
10%
20%
30%
40%
50%
60%
70%
80%
90%
100%
Re
spo
nse
Ra
te
Days of Survey with labels for Recruitment Protocols
Survey Participation by College*
IANR
Arts & Sciences
Education
Business
Engineering
faculty response
after chair emails
201

7
Survey Participation Participant Concerns
The pilot study in 2008 brought to light several concerns participant would have about the FNWS survey. For this reason, we provided a frequently asked questions (FAQ) page whenever we mailed participants a survey, and we posted FAQ on BOSR’s website (see Appendix B). The FAQ page provided some general information about the study and covered several specific concerns participants might have that reflect common problems with the nature of network data collection (collecting network data is inherently sensitive because it requires participants to name names- e.g., who do you hang-out with socially?) and gathering data within an institution (faculty wanted to know who will have access to the data and how it will be used). In general, most of these specific concerns revolved around privacy and confidentiality. To help alleviate these concerns we explained social network analysis, how confidentiality would be maintained, and data security.
The FAQ also provided contact information of the principal investigator (Dr. Falci) for any additional questions. Dr. Falci was contacted by phone and email by numerous survey participants. The majority of faculty who contacted her asked questions that were answered on the FAQ page – suggesting that many faculty did not read the FAQ page. Of course, some faculty asked questions that were not included on the FAQ page. These additional questions had two common themes.
First, many faculty brought up reasons to Dr. Falci for why they should not have to fill out the survey. These reasons revolved around several fairly unique faculty issues, such as having a reduced or no teaching load, having a primarily administrative appointment, being on a leave of absence, retiring in the next year, and being newly hired in fall 2010 or spring 2011. For these participants, we reassured them that their participation was important. Second, faculty who held joint appointments were sometimes confused about how to answer the questions. We instructed them to answer department specific questions (with the name of the department included in the question) about their tenure home department. All other questions should be answered based on their overall experience at UNL (including both their tenure home department and their joint appointment). Response Rates
With our well designed recruitment protocol, we attained an overall response rate of 75.1% (Table 2). We calculated the response rate based on the standard definition set by the American Association for Public Opinion Research (AAPOR). We used Response Rate 2 (RR2), which counts partial completes as respondents.1 We defined partial completes as having answered at
1 The American Association for Public Opinion Research. 2011. “Standard Definitions: Final
Dispositions of Case Codes and Outcome Rates for Surveys. Revised 2011” Retrieved November 29, 2011 (http://www.aapor.org/Standard_Definitions2.htm).
202

8
least one question in the entire FNWS survey.
Table 2: Individual Response Rate
Among 559 respondents, the number of the respondents who chose the mail option and the Web option was about the same. 276 (49.4% of the respondents) responded with the mail option while 280 (50.1%) responded with the Web option. Three (less than 1%) completed the survey combining the mail and Web options.
There was considerable variation in response rates by college (Appendix C). The highest college level response rate was 78.4% of the College of Arts and Sciences (A&S) and the lowest response rate was 65.1% of the College of Engineering (Eng). Four out of five colleges had response rates above 70%.
Within each college, the response rates varied across departments as well (Appendix C). The lowest response rate was 41.7% of department #4 in the College of Engineering, while the highest response rate was 100.0% of department #2 in the College of Agricultural Sciences and Natural Resources (CASNR).
When conducing network research the most important response rate is the relational response rate. This response rate tells us how much missing relational (i.e., network tie) information we have in our study. Again, we want this number to be very high and in all but four departments we attained a relational response rate above 80%. In a department with 15 faculty, 8 would have to fill out the survey to have a relational response rate of 80%.
203

9
Nonresponse Analysis
Table 3 reports the demographic characteristics of the survey population and the variation between the respondents and the nonrespondents by these demographic characteristics. The results of a bivariate analysis between each of the demographic characteristics and survey unit nonresponse revealed that associate professors had a higher nonresponse rate (31.1%) compared to assistant (18.3%) and full (24.6%) professors. The differences across academic rank were significant at the p<.01 level. When we categorized the faculty into four groups based on race and gender (white men, nonwhite men, white women, and nonwhite women), nonwhite men had the highest nonresponse rate (32.7%). The group differences, however, were only marginally significant (p<.10). There were also marginally significant differences by citizenship status and age. In Fall 2010, UNL’s administration initiated a voluntary separation incentive program (VSIP), whereby retirement age faculty were offered a full year’s salary to retire at the end of the academic year. The program was developed to ease UNL’s budget problems. As a result, forty-nine faculty members in our survey population retired from UNL at the end of the 2010-2011 academic year. The retiring faculty had a higher nonresponse rate (34.7%) compared to the faculty who were not retiring (24.2%) (p<.10).
204

10
Table 3: Demographics and Bivariate Analysis
205

11
Table 4: Multivariate Logistic Regression Analysis of Unit Response
Table 4 provides the results from a multivariate analysis of unit response using the demographic characteristics mentioned in the previous section. The variable for joint appointment was dropped due to its high collinearity with the split FTE variable. For the same reason, four variables that were highly correlated with academic rank (age, years at working at UNL, years since earning the highest degree, and monthly salary) were also dropped from the multivariate analysis. The result shows that compared to nonwhite men, who were least likely to respond to the survey, nonwhite women were more likely to respond to the survey (OR=3.15, p<.05) controlling for the other variables. US citizens were more likely to respond compared to non-US citizens (OR=1.55, p<.05) controlling for the other variables. In addition, compared to associate professors, who were least likely to respond among the three rank groups, assistant professors were more likely to respond (OR=2.05, p<.01) controlling for the other variables.
206

12
Reflections and Future Directions
One additional wave of data collection is planned within the ADVANCE-Nebraska time frame. The third wave of data collection will be administered Spring 2013, the 5th year of ADVANCE-Nebraska. To improve the accuracy of the sampling frame or the last waves of data collection, we should keep several points in mind. First, we should get data from IRP on faculty who have appointments as administrators (e.g., associate deans, research center directors) and check their FTE to see if they are an integral part of their home departments. If they are, they need to be included in the network questions. Sometimes, however, having FTE in the tenure home departments does not necessarily mean that they get to vote on department issues or tenure. Second, we should get information on faculty who are on leave of absence in the semester before and after IRP creates the faculty roster. That way we can distinguish those who are on extended leave. Lastly, we should be aware of the potential errors in IRP’s faculty roster like the case of the two faculty members in the Psychology department.
In the next survey, we could make the survey process go more smoothly by (1) including more N/A response choices for some faculty who do not teach or who do not do research and (2) providing a place for faculty to write in left off department members – they could add eligible (missed faculty from the frame) and ineligible faculty (e.g., professors of practice, instructors). For the web survey in particular, we should have the FAQ link embedded in each webpage of the web survey and make sure that the saved data (previous responses) will appear when respondents log out and then log back.
207

A1
Faculty Networks and Workload Study Welcome to the UNL Faculty Networks and Workload Study. The purpose of this study is to learn about the networks, workload, and job satisfaction of UNL faculty like you. Please be assured that the answers you provide will remain confidential.
We truly appreciate your time and help with this important study.
If you have any questions about the study, feel free to contact Dr. Christina Falci (472-3762; [email protected]). This study has been reviewed and approved by the UNL IRB (#2008028737EP). If you have questions about your rights as a participant in this study, you may contact them at 402-472-6965.
First, we would like to ask about the time you spend on teaching, research and service.
1. To what extent do you agree or disagree with the following statements about your work time during the current academic year?
Strongly Agree Agree
Slightly Agree
Slightly Disagree Disagree
Strongly Disagree
I have been able to dedicate enough work time to my research.
I have been able to dedicate enough work time to my teaching.
2. Thinking about how you spend your work time, how many hours do you spend on each of the following activities in an average week during the current academic year? If none, please enter “0”.
Hours
Classroom teaching, preparing materials for class and grading
Working with students outside of class (e.g., in meetings, responding to emails, reading theses or dissertations, writing letters of recommendation)
Working on research
Fulfilling administrative responsibilities
Working on committee service responsibilities
Extension (e.g., programs, outreach)
Practice (e.g., external paid consulting, medical practice, personal business)
Appendix A
208

A2
3. To what extent do you agree or disagree with each of the following statements? Strongly
Agree Agree Slightly Agree
Slightly Disagree Disagree
Strongly Disagree
Overall, I enjoy the work I do as a faculty member.
The work I do as a faculty member is meaningful to me.
If I had to do it over again, I would still become a professor.
Next, we would like to ask about your research activities from January 2008 until now. You might find it helpful to have a copy of your vita handy when answering these questions. 4. How many of the following research products have you produced from January 2008 until now?
If none, please enter “0”.
Number of each
Articles published or accepted for publication in peer-reviewed journals
Manuscripts published or accepted for publication in peer-reviewed conference proceedings
Papers published or accepted for publication as part of meeting abstracts
Oral or poster presentations at professional conferences
Research monographs published or monograph contracts accepted by a publisher
Textbooks published or textbook contracts accepted by a publisher
Books edited
Book chapters published or accepted for publication
Extension publications (e.g., NebGuides, Extension Circulars)
Patents granted
Software released
Please list any additional research products you have produced from January 2008 until now.
Do not list the research products reported Question #4 above.
209
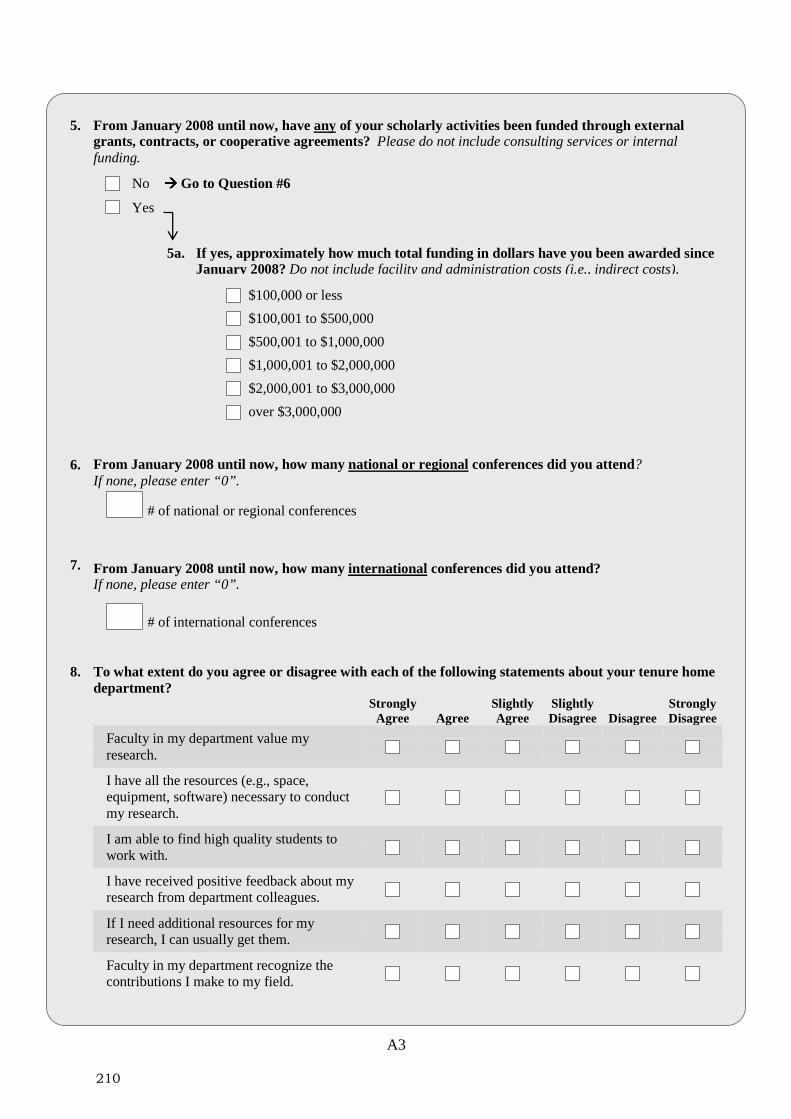
A3
5. From January 2008 until now, have any of your scholarly activities been funded through external grants, contracts, or cooperative agreements? Please do not include consulting services or internal funding.
No ���� Go to Question #6
Yes
5a. If yes, approximately how much total funding in dollars have you been awarded since January 2008? Do not include facility and administration costs (i.e., indirect costs).
$100,000 or less $100,001 to $500,000 $500,001 to $1,000,000 $1,000,001 to $2,000,000 $2,000,001 to $3,000,000 over $3,000,000
6. From January 2008 until now, how many national or regional conferences did you attend? If none, please enter “0”.
# of national or regional conferences
7. From January 2008 until now, how many international conferences did you attend? If none, please enter “0”.
# of international conferences
8. To what extent do you agree or disagree with each of the following statements about your tenure home department?
Strongly Agree Agree
Slightly Agree
Slightly Disagree Disagree
Strongly Disagree
Faculty in my department value my research.
I have all the resources (e.g., space, equipment, software) necessary to conduct my research.
I am able to find high quality students to work with.
I have received positive feedback about my research from department colleagues.
If I need additional resources for my research, I can usually get them.
Faculty in my department recognize the contributions I make to my field.
210

A4
The next series of questions addresses the many different ways of interacting with other faculty from your tenure home department. Importantly, your name and the name of your colleagues will only be recorded as numbers (e.g., 123456). This way no one will be able to connect your name with your specific answers. For additional information about these questions please see the “Frequently Asked Questions” page provided in your survey packet. First, we would like to ask you about research collaborations. By “research collaboration” we mean working together on any type of research product, such as co-authoring manuscripts or grant applications, giving conference presentations, or developing software. Include works in progress and finished products. 9.
From January 2008 until now, have you collaborated with each of the following faculty members from your tenure home department? Please leave the row with your own name blank and check “no” for anyone you have not collaborated within since January 2008. Again, to maintain confidentiality all names will be recorded as numbers, including your own name.
Yes No Miguel Carranza Miguel Ceballos Jacob Cheadle Lory Dance Mary Deegan Christina Falci Bridget Goosby Kellie Hagewen Danny Hoyt Emily Kazyak Lisa Kort-Butler Julia McQuillan Helen Moore Kristen Olson Philip Schwadel Jolene Smyth Kimberly Tyler Leslie Whitbeck 10. How satisfied or dissatisfied are you with your opportunities to collaborate with faculty from your
tenure home department?
Very
Satisfied Satisfied Slightly Satisfied
Neither Satisfied nor Dissatisfied
Slightly Dissatisfied Dissatisfied
Very Dissatisfied
211

A5
Second, we would like to ask about receiving helpful research related support from departmental colleagues in the current academic year. By “helpful research support” we mean anything that helps improve the quality of your research or increase your research productivity. It can come in many forms including: feedback on manuscripts, grant applications, or lab protocols; providing materials useful to your work, such as equipment or books; a conversation that helps with methodology or theory; etc. 11.
During the current academic year, how often have you received helpful research related support from each of the following faculty members from your tenure home department? Please leave the row with your own name blank and check “not in this academic year” when applicable.
Not in This Academic Year
Once or Twice This Year
Once or Twice a Semester
Once or Twice a Month
Once a Week or More Often
Miguel Carranza Miguel Ceballos Jacob Cheadle Lory Dance Mary Deegan Christina Falci Bridget Goosby Kellie Hagewen Danny Hoyt Emily Kazyak Lisa Kort-Butler Julia McQuillan Helen Moore Kristen Olson Philip Schwadel Jolene Smyth Kimberly Tyler Leslie Whitbeck 12. How satisfied or dissatisfied are you with the research help you receive from faculty from your tenure
home department?
Very
Satisfied Satisfied Slightly Satisfied
Neither Satisfied nor Dissatisfied
Slightly Dissatisfied Dissatisfied
Very Dissatisfied
212

A6
Third, we would like to ask about how often you spend your free time or discuss personal matters with departmental colleges in the current academic year. By “free time” we mean time you have chosen to spend with another faculty member that does not entail a work function or activity. It can take many forms: having coffee or sharing a meal; leisure or exercise activities (e.g., attending a play or playing golf); etc. “Discussing personal matters” entails talking about the people in your life, your social activities, your joys or struggles, etc. 13.
During the current academic year, how often have you spent free time or discussed personal matters with each of the following faculty members from your tenure home department? Please leave the row with your own name blank and check “not in this academic year” when applicable. Again, to maintain confidentiality all names will be recorded as numbers, including your own.
Not in This Academic Year
Once or Twice This Year
Once or Twice a Semester
Once or Twice a Month
Once a Week or More Often
Miguel Carranza Miguel Ceballos Jacob Cheadle Lory Dance Mary Deegan Christina Falci Bridget Goosby Kellie Hagewen Danny Hoyt Emily Kazyak Lisa Kort-Butler Julia McQuillan Helen Moore Kristen Olson Philip Schwadel Jolene Smyth Kimberly Tyler Leslie Whitbeck 14. How satisfied or dissatisfied are you with the amount of personal interaction with faculty from your
tenure home department?
Very
Satisfied Satisfied Slightly Satisfied
Neither Satisfied nor Dissatisfied
Slightly Dissatisfied Dissatisfied
Very Dissatisfied
213
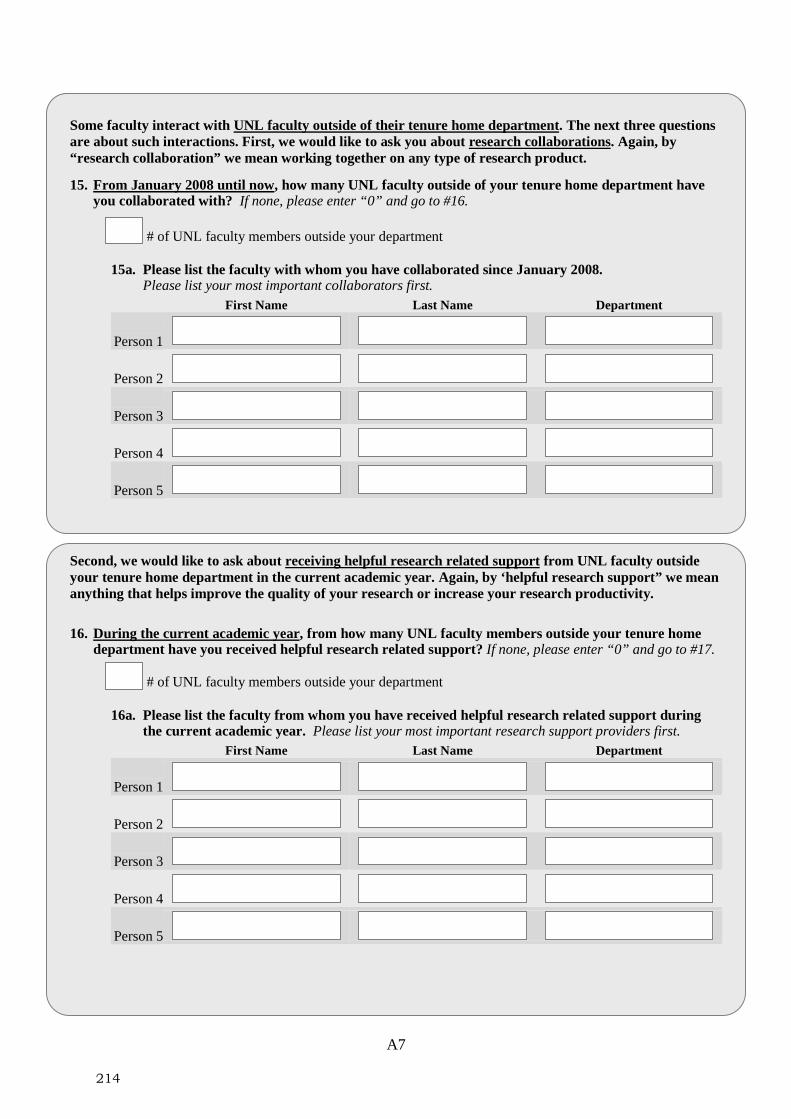
A7
Some faculty interact with UNL faculty outside of their tenure home department. The next three questions are about such interactions. First, we would like to ask you about research collaborations. Again, by “research collaboration” we mean working together on any type of research product. 15. From January 2008 until now, how many UNL faculty outside of your tenure home department have
you collaborated with? If none, please enter “0” and go to #16.
# of UNL faculty members outside your department 15a. Please list the faculty with whom you have collaborated since January 2008.
Please list your most important collaborators first. First Name Last Name Department
Person 1
Person 2
Person 3
Person 4
Person 5 Second, we would like to ask about receiving helpful research related support from UNL faculty outside your tenure home department in the current academic year. Again, by ‘helpful research support” we mean anything that helps improve the quality of your research or increase your research productivity.
16. During the current academic year, from how many UNL faculty members outside your tenure home department have you received helpful research related support? If none, please enter “0” and go to #17.
# of UNL faculty members outside your department 16a. Please list the faculty from whom you have received helpful research related support during
the current academic year. Please list your most important research support providers first. First Name Last Name Department
Person 1
Person 2
Person 3
Person 4
Person 5
214
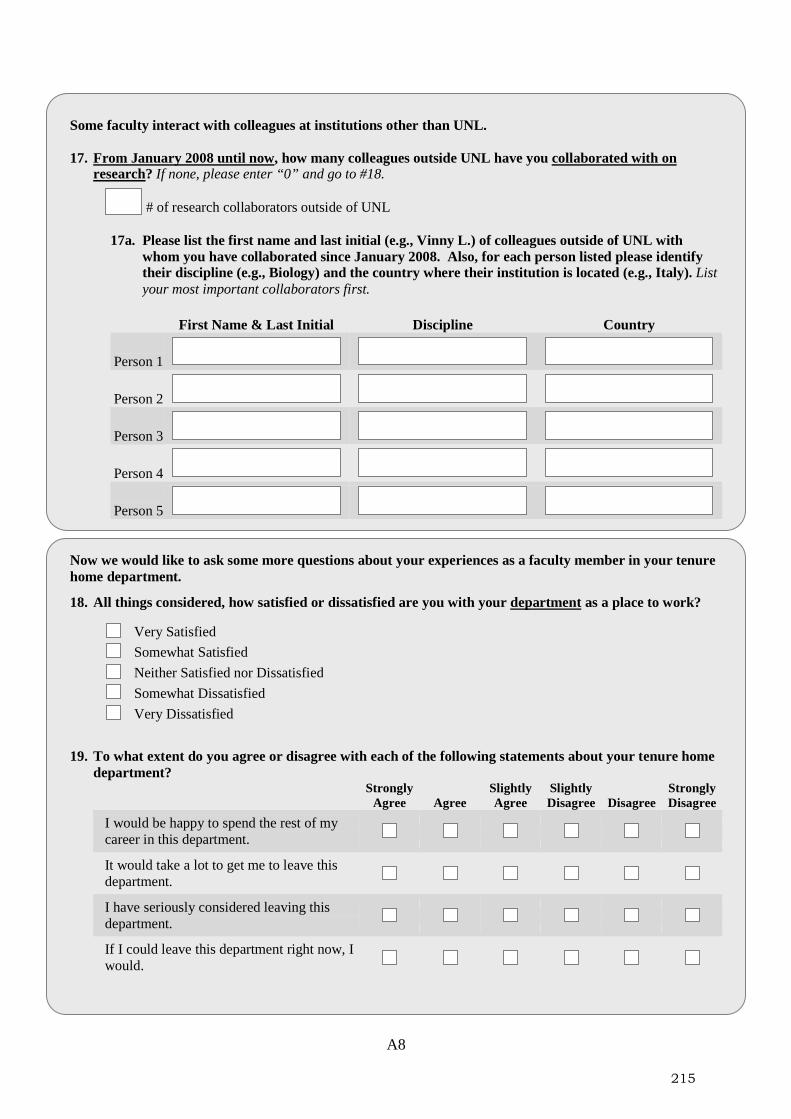
A8
Some faculty interact with colleagues at institutions other than UNL. 17. From January 2008 until now, how many colleagues outside UNL have you collaborated with on
research? If none, please enter “0” and go to #18.
# of research collaborators outside of UNL 17a. Please list the first name and last initial (e.g., Vinny L.) of colleagues outside of UNL with
whom you have collaborated since January 2008. Also, for each person listed please identify their discipline (e.g., Biology) and the country where their institution is located (e.g., Italy). List your most important collaborators first.
First Name & Last Initial Discipline Country
Person 1
Person 2
Person 3
Person 4
Person 5 Now we would like to ask some more questions about your experiences as a faculty member in your tenure home department. 18. All things considered, how satisfied or dissatisfied are you with your department as a place to work?
Very Satisfied
Somewhat Satisfied
Neither Satisfied nor Dissatisfied
Somewhat Dissatisfied
Very Dissatisfied
19. To what extent do you agree or disagree with each of the following statements about your tenure home department?
Strongly Agree Agree
Slightly Agree
Slightly Disagree Disagree
Strongly Disagree
I would be happy to spend the rest of my career in this department.
It would take a lot to get me to leave this department.
I have seriously considered leaving this department.
If I could leave this department right now, I would.
215

A9
20. To what extent do you agree or disagree with each of the following statements about your tenure home
department? Strongly
Agree Agree Slightly Agree
Slightly Disagree Disagree
Strongly Disagree
Faculty in my department are supportive of one another.
Faculty in my department are sometimes rude to one another.
Faculty in my department enjoy working together.
Tension among faculty in my department makes working here uncomfortable.
Faculty in my department spend time to get to know one another.
21. To what extent are each of the following aspects of tenure and promotion in your tenure home department clear or unclear?
Very Clear Clear
Slightly Clear
Slightly Unclear Unclear
Very Unclear
The body of academic work considered (i.e., what things are evaluated)
Academic work performance expectations (i.e., the quantity and quality of work)
The steps involved in the process (i.e., from preparing a file to the final decision)
22. Please indicate how much you agree or disagree with the following statement about your tenure home department:
On the whole, tenure and promotion decisions are made primarily on performance-based criteria (e.g., research, teaching, or service) rather than on non-performance-based criteria (e.g., politics, relationships, or demographics).
Strongly Agree Somewhat Agree Neither Agree nor Disagree Somewhat Disagree Strongly Disagree
216
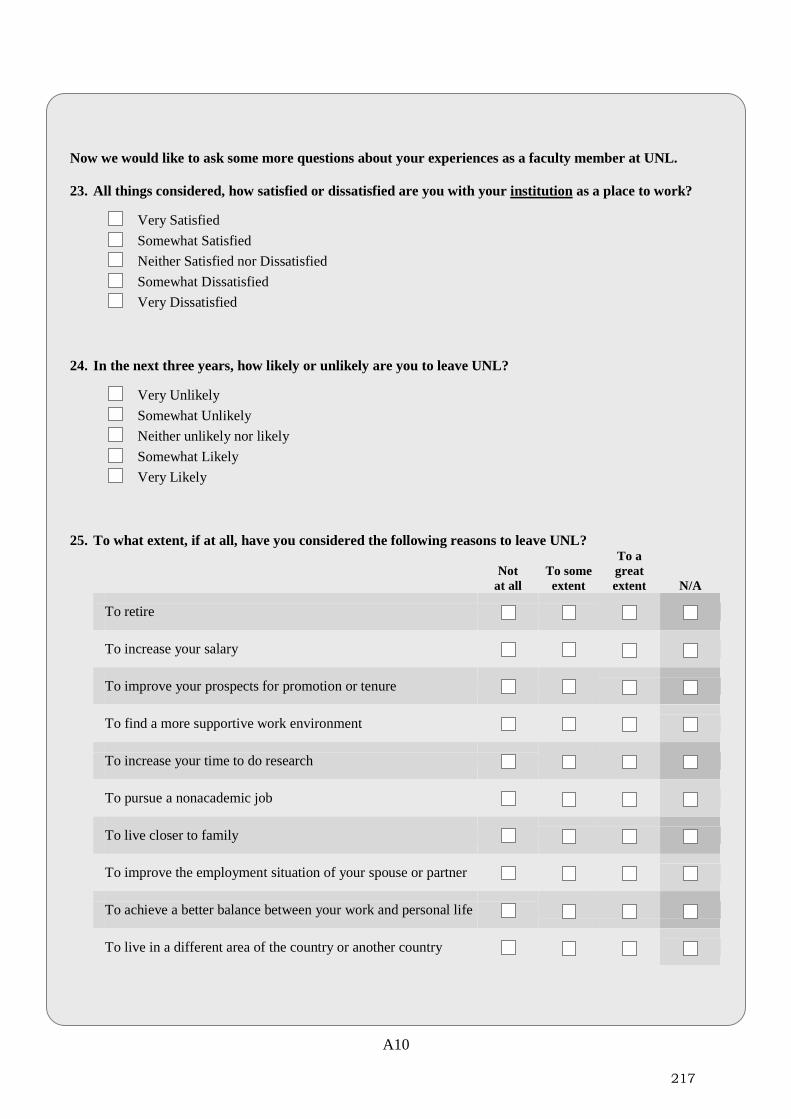
A10
Now we would like to ask some more questions about your experiences as a faculty member at UNL. 23. All things considered, how satisfied or dissatisfied are you with your institution as a place to work? Very Satisfied Somewhat Satisfied Neither Satisfied nor Dissatisfied Somewhat Dissatisfied Very Dissatisfied
24. In the next three years, how likely or unlikely are you to leave UNL? Very Unlikely Somewhat Unlikely Neither unlikely nor likely Somewhat Likely Very Likely
25. To what extent, if at all, have you considered the following reasons to leave UNL?
Not at all
To some extent
To a great extent N/A
To retire
To increase your salary
To improve your prospects for promotion or tenure
To find a more supportive work environment
To increase your time to do research
To pursue a nonacademic job
To live closer to family
To improve the employment situation of your spouse or partner
To achieve a better balance between your work and personal life
To live in a different area of the country or another country
217
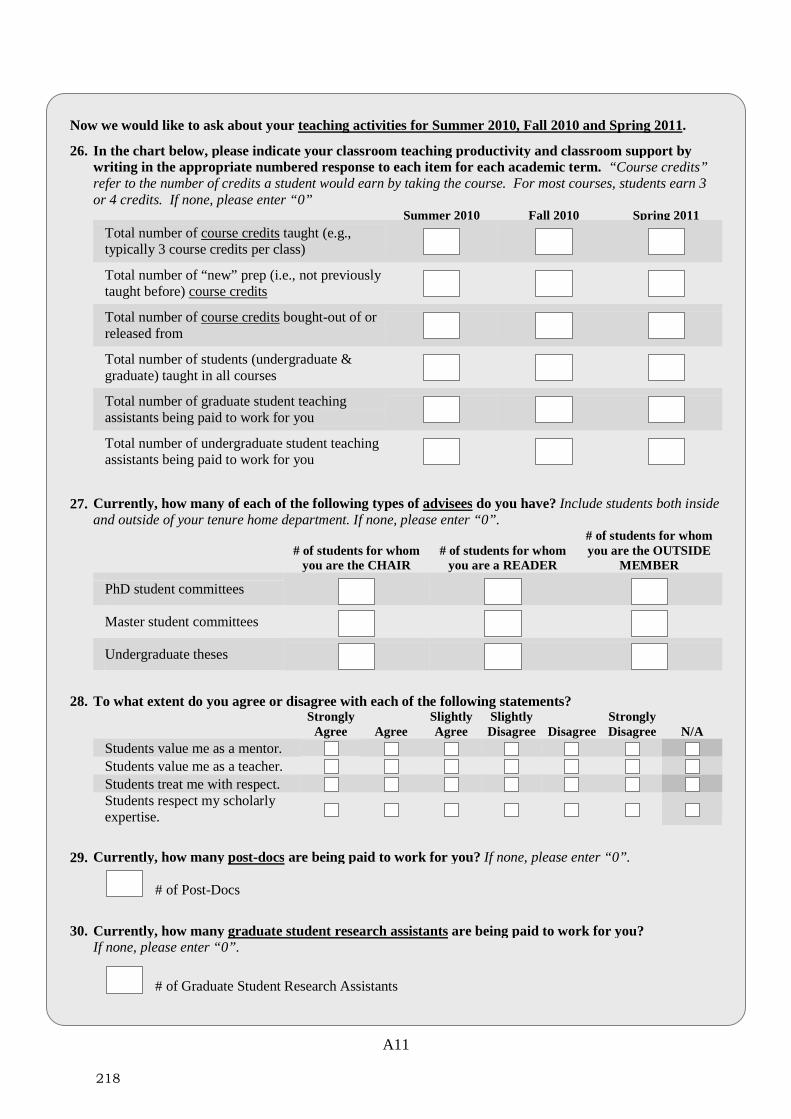
A11
Now we would like to ask about your teaching activities for Summer 2010, Fall 2010 and Spring 2011. 26. In the chart below, please indicate your classroom teaching productivity and classroom support by
writing in the appropriate numbered response to each item for each academic term. “Course credits” refer to the number of credits a student would earn by taking the course. For most courses, students earn 3 or 4 credits. If none, please enter “0”
Summer 2010 Fall 2010 Spring 2011
Total number of course credits taught (e.g.,
typically 3 course credits per class)
Total number of “new” prep (i.e., not previously
taught before) course credits
Total number of course credits bought-out of or
released from
Total number of students (undergraduate &
graduate) taught in all courses
Total number of graduate student teaching
assistants being paid to work for you
Total number of undergraduate student teaching
assistants being paid to work for you
27. Currently, how many of each of the following types of advisees do you have? Include students both inside and outside of your tenure home department. If none, please enter “0”.
# of students for whom
you are the CHAIR # of students for whom
you are a READER
# of students for whom you are the OUTSIDE
MEMBER
PhD student committees
Master student committees
Undergraduate theses
28. To what extent do you agree or disagree with each of the following statements? Strongly
Agree Agree Slightly Agree
Slightly Disagree Disagree
Strongly Disagree N/A
Students value me as a mentor. Students value me as a teacher. Students treat me with respect. Students respect my scholarly
expertise.
29. Currently, how many post-docs are being paid to work for you? If none, please enter “0”.
# of Post-Docs
30. Currently, how many graduate student research assistants are being paid to work for you? If none, please enter “0”.
# of Graduate Student Research Assistants
218

A12
Now we would like to ask about your service roles and committee assignments. 31. Have you ever served in any of the following administrative positions in your tenure home department
at UNL? Currently
Serving Served in the past
Never Served
Chair or Head of department or unit Director of a center, program or institute Director of Graduate Studies Director of Undergraduate studies
32. Currently, how many committees (formal and ad hoc) are you serving on in your tenure home department, excluding student thesis committees? If none, please enter “0”.
# of departmental committees
33. How satisfied or dissatisfied are you with each of the following?
Very Satisfied
Slightly Satisfied
Neither Satisfied nor Dissatisfied
Slightly Dissatisfied
Very Dissatisfied
The influence you have on the decision-making that affects the direction of the department
The encouragement you have received from colleagues for pursuing leadership positions
34. Within your tenure home department, how fair or unfair are each of the following? Very
Fair Fair Slightly
Fair Slightly Unfair Unfair
Very Unfair
Don’t Know
Rotation of service committee assignments Evaluation of faculty scholarly performance Distribution of faculty salaries Distribution of departmental resources
35. Currently, how many university, school, or college committees (formal and ad hoc) are you serving on, excluding student thesis committees? If none, please enter “0”.
# of university, school, or college committees
36. Currently, how many external committees or boards related to your discipline (e.g., accreditation, editor of a journal, officer of a professional association) are you serving on? If none, please enter “0”.
# of external committees or boards
219
A13
Finally, we would like to ask questions about your life outside of UNL. 37. Were you born in the United States? No Yes
38. Do you currently have a spouse or partner? No ���� Go to Question #39 Yes
38a. Does your spouse/partner have (or is working toward) an advanced (Masters or PhD) or professional degree (MD, JD, etc.)?
No Yes 38b. How many hours does your spouse or partner work in a typical week? Please include
paid work, volunteer work and work time devoted to studies if a student.
# of hours in a typical week
39. Are you currently providing care for a dependent adult (e.g., elderly, disabled, or chronically ill)?
No Yes
40. Do you have any biological, adopted or step children? No ���� Go to Question #41 Yes
40a. How many children within each if the following age ranges currently live with you all or part of the time?
None 1 Child 2 Children
3 or More Children
Newborn to 4 Years Old 5 to 9 Years Old 10 to 13 Years Old 14 to 18 Years Old 19 Years and Older
41. In total, how many hours in a typical week do you spend on home and family responsibilities? Please include food preparation, shopping, yard work, laundry, cleaning, dependent care, and other home/family responsibilities. If none, please enter “0”.
# of hours in a typical week
220

A14
42. To what extent do you agree or disagree with each of the following statements? Strongly
Agree Agree Slightly Agree
Slightly Disagree Disagree
Strongly Disagree N/A
Due to stress in my family/personal life, I am often preoccupied with personal matters at work.
Being emotionally drained after work prevents me from enjoying my family/personal life.
If I need to work nights or on the weekends, I can count on someone to take care of things at home.
The time I must devote to my job keeps me from family activities more than I would like.
The time I spend with family often keeps me from spending time on work activities that could be helpful to my career.
When I am frustrated by my work, members of my family try to understand.
If I need to travel out of town for my job, my family would have a hard time managing household responsibilities.
43. How satisfied or dissatisfied are you with your balance between your professional time and your personal or family time?
Very Satisfied Satisfied Slightly Satisfied Neither Satisfied nor Dissatisfied Slightly Dissatisfied Dissatisfied Very Dissatisfied
221
A15
44. To what extent do you agree or disagree with each of the following statements?
Strongly Agree
Slightly Agree
Neither Agree nor Disagree
Slightly Disagree
Strongly Disagree N/A
My colleagues are respectful of my efforts to balance work and home responsibilities.
In my department, faculty may comfortably raise personal or family responsibilities when scheduling work activities or meetings.
Meetings in my department are often scheduled at times that conflict with my family responsibilities.
My colleagues do what they can to make family obligations and an academic career compatible.
I am hesitant to talk about my family life with other faculty in my department.
I can easily alter my work schedule to accommodate my family responsibilities.
45. Please rate effectiveness or ineffectiveness for the following policies and practices at UNL.
Very Ineffective
Somewhat Ineffective
Neither Effective
nor Ineffective
Somewhat Effective
Very Effective
Not Offered N/A
Spousal/Partner hiring
program
Paid/unpaid personal leave
Childcare
Stop the clock for parental or
other family reasons
222

A16
46. Please tell us anything else about the survey questions or being a faculty member that you would like us
to know.
Thank you for your time!
Please return your completed questionnaire in the enclosed envelope or mail it back to us at:
Bureau of Sociological Research
301 Benton Hall Lincoln, NE 68588-6102
223

Faculty Networks and Workload Study (FNWS) Frequently Asked Questions
What is the purpose of this study? Who is funding this study? Who is conducting this study?
The purpose of this study is to learn about UNL faculty networks, workloads, and job satisfaction. The study is funded by the National Science Foundation. This research is being conducted by Dr. Christina Falci (PI), an Assistant Professor, and Dr. Julia McQuillan, an Associate Professor, both in the Department of Sociology at UNL. Who is administering the survey?
The survey is being administered by the Bureau of Sociological Research (BOSR) at the University of Nebraska-Lincoln. BOSR is a research shop that provides data collection services to social scientists, State Agencies, and units needing evaluation research. For this study, BOSR will print and mail the questionnaires, house the web-based version of the survey, maintain respondent confidentiality (see additional details below), and monitor faculty response to the survey. To learn more about BOSR please visit their website at: http://bosr.unl.edu. How will this survey benefit me?
The knowledge gained from this study will provide invaluable insights into how academic life can be improved for all faculty. The results will be used to identify what UNL is doing well and locate possible areas in which to improve faculty life. This survey provides faculty with the opportunity to share their ideas and voice concerns. Participating in this survey will also make you part of innovative research on academic life. Where can I learn about the results of the study?
Data from this study should be ready for data analysis beginning in fall 2011 and we anticipate having preliminary results from this study in early spring 2012. At this time, faculty will have the opportunity to attend one of many on campus "results" presentations where the investigators will summarize the key findings from the study. In these presentations, faculty will also be encouraged to give their perspective on these results of the study. Why are faculty names in the survey?
A primary purpose of this study is to learn about faculty networks. A network tie involves any form of interpersonal interaction occurring between two people in the network. Our study explores three relational ties: research collaborations, research support and non-work related interactions. To measure these connections in a department, we provide a list of names of all faculty within a department to each participant in the study. To capture network ties outside of a faculty member’s tenure home department, we ask study participants to provide the names of UNL faculty or colleagues outside of UNL. When participants select or identify another person in the survey, they create a “tie” with that person. It would be impossible to create a network tie between two individuals without using names of network members. Be assured that your confidentiality is of top priority for this research. All of the answers that you provide, including naming your connections to others, will be kept completely confidential. Please see the next question for an explanation of how we will maintain the confidentiality of research participants and the confidentiality of identified persons. How will my answers be kept confidential?
While your name and the names of people you work with appear on the questionnaire, these names and the name of your department are never entered into the data. In the data, numeric codes are entered in place the name of individual faculty (e.g., 12345678) and departments (e.g., 123). These numeric codes prevent anyone looking at the data from being able to identify any individual or department by name. In essence, the people who analyze the data will be looking at connections between numerically coded individuals within and across numerically coded departments. Only BOSR staff will have the link between the numeric codes and the individual or department names. This link will be stored in a secured drive and will never be shared with anyone, including the principal investigator, any staff on this project, your department chair or any other administrator, any other UNL unit, or the study funder.
Appendix B
224
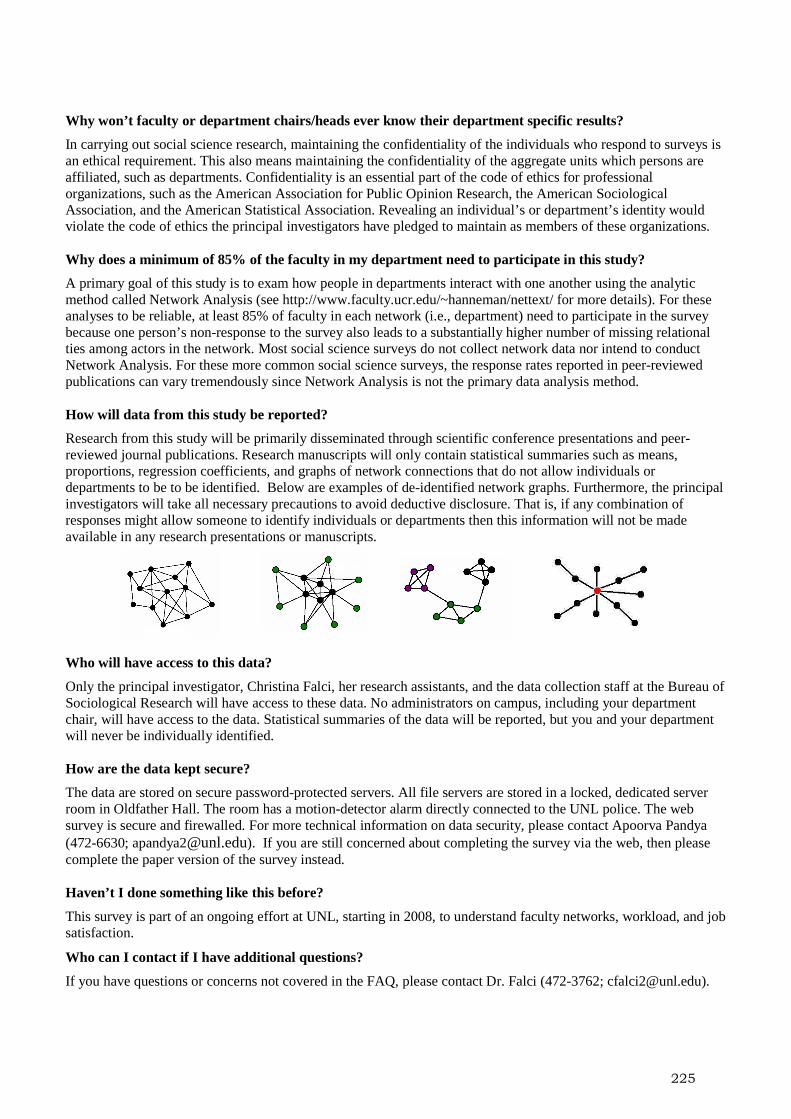
Why won’t faculty or department chairs/heads ever know their department specific results?
In carrying out social science research, maintaining the confidentiality of the individuals who respond to surveys is an ethical requirement. This also means maintaining the confidentiality of the aggregate units which persons are affiliated, such as departments. Confidentiality is an essential part of the code of ethics for professional organizations, such as the American Association for Public Opinion Research, the American Sociological Association, and the American Statistical Association. Revealing an individual’s or department’s identity would violate the code of ethics the principal investigators have pledged to maintain as members of these organizations. Why does a minimum of 85% of the faculty in my department need to participate in this study?
A primary goal of this study is to exam how people in departments interact with one another using the analytic method called Network Analysis (see http://www.faculty.ucr.edu/~hanneman/nettext/ for more details). For these analyses to be reliable, at least 85% of faculty in each network (i.e., department) need to participate in the survey because one person’s non-response to the survey also leads to a substantially higher number of missing relational ties among actors in the network. Most social science surveys do not collect network data nor intend to conduct Network Analysis. For these more common social science surveys, the response rates reported in peer-reviewed publications can vary tremendously since Network Analysis is not the primary data analysis method. How will data from this study be reported?
Research from this study will be primarily disseminated through scientific conference presentations and peer-reviewed journal publications. Research manuscripts will only contain statistical summaries such as means, proportions, regression coefficients, and graphs of network connections that do not allow individuals or departments to be to be identified. Below are examples of de-identified network graphs. Furthermore, the principal investigators will take all necessary precautions to avoid deductive disclosure. That is, if any combination of responses might allow someone to identify individuals or departments then this information will not be made available in any research presentations or manuscripts.
Who will have access to this data?
Only the principal investigator, Christina Falci, her research assistants, and the data collection staff at the Bureau of Sociological Research will have access to these data. No administrators on campus, including your department chair, will have access to the data. Statistical summaries of the data will be reported, but you and your department will never be individually identified. How are the data kept secure?
The data are stored on secure password-protected servers. All file servers are stored in a locked, dedicated server room in Oldfather Hall. The room has a motion-detector alarm directly connected to the UNL police. The web survey is secure and firewalled. For more technical information on data security, please contact Apoorva Pandya (472-6630; [email protected]). If you are still concerned about completing the survey via the web, then please complete the paper version of the survey instead. Haven’t I done something like this before?
This survey is part of an ongoing effort at UNL, starting in 2008, to understand faculty networks, workload, and job satisfaction.
Who can I contact if I have additional questions?
If you have questions or concerns not covered in the FAQ, please contact Dr. Falci (472-3762; [email protected]).
225

Population RespondentsNodal Response
Rates
Relational Response
Rates
N N % %
Arts and Sciences (A&S)
A&S #1 20 14 70.0% 92.1%
A&S #2 26 21 80.8% 96.9%
A&S #3 8 7 87.5% 100.0%
A&S #4 12 8 66.7% 90.9%
A&S #5 40 32 80.0% 96.4%
A&S #6 21 17 81.0% 97.1%
A&S #7 11 9 81.8% 98.2%
A&S #8 18 15 83.3% 98.4%
A&S #9 17 12 70.6% 92.7%
A&S #10 19 17 89.5% 99.4%
A&S #11 37 29 78.4% 95.8%
A&S #12 25 18 72.0% 93.0%
Total 254 199 78.4%
Business Administration (CBA)
CBA #1 16 8 50.0% 76.7%
CBA #2 16 10 62.5% 87.5%
CBA #3 10 8 80.0% 97.8%
CBA #4 12 11 91.7% 100.0%
CBA #5 9 8 88.9% 100.0%
Total 63 45 71.4%
Education and Human Sciences (CEHS)
CEHS #1 19 16 84.2% 98.3%
CEHS #2 19 13 68.4% 91.2%
CEHS #3 13 8 61.5% 87.2%
CEHS #4 19 16 84.2% 98.3%
Total 70 53 75.7%
Engineering (Eng)
Eng #1 9 6 66.7% 91.7%
Eng #2 11 9 81.8% 98.2%
Eng #3 11 9 81.8% 98.2%
Eng #4 10 5 50.0% 77.8%
Eng #5 9 5 55.6% 83.3%
Eng #6 22 18 81.8% 97.4%
Eng #7 12 5 41.7% 68.2%
Eng #8 10 6 60.0% 86.7%
Eng #9 14 8 57.1% 83.5%
Eng #10 18 11 61.1% 86.3%
Total 126 82 65.1%
Agricultural Sciences and Natural Resources (CASNR)
CASNR #1 16 12 75.0% 95.0%
CASNR #2 16 16 100.0% 100.0%
CASNR #3 41 33 80.5% 96.6%
CASNR #4 9 4 44.4% 72.2%
CASNR #5 23 16 69.6% 91.7%
CASNR #6 23 19 82.6% 97.6%
CASNR #7 41 31 75.6% 94.5%
CASNR #8 14 13 92.6% 100.0%
CASNR #9 20 14 70.0% 92.1%
CASNR #10 11 8 72.7% 94.6%
CASNR #11 17 14 82.4% 97.8%
Total 231 180 77.9%
College and Department
Appendix C: Response Rates by College and Department
226

Concep
tual M
odel fo
r the
Faculty Networks and
Workloa
d Stud
y (FNWS)
Outcomes
(Individu
al & Departm
ent)
Job Satisfaction
Organizational
Commitment
Research Tim
e
Research Productivity
Work‐life Integration
Clim
ate Pe
rcep
tions
(Individu
al & Departm
ent)
Collegiality
Tenure & Promotion Clarity
Research Value
Fairness
Decision M
aking
Family Friendliness
Student Interactions
Satisfaction with networks
Workloa
d
(Individu
al)
Classroom Teaching Time
Non‐classroom Teaching Time
Number of Courses & Studen
ts
Number of New
Preps
Committee Work Tim
e
Service Assignmen
ts
Student Advising
Work Re
sources
(Individu
al)
Teaching & Research Assistants
Post‐Doctoral Fellows
Travel Support
Conference Travel
Course Releases
Network Structure
(Collabo
ratio
n, Research Su
pport &
Frie
ndship)
Individu
al (a
ctor network po
sition)
centrality, nested
ness, brokerage, cutpoint, bridge
Dyadic (actor pairs)
multiplexity, tie strength, reachability, geo
desic
distance, indep
enden
t paths, homophily
Ego‐Network (actor dire
ct con
nections)
alter‐den
sity, alter‐heterogeneity, alter‐dem
os
Dep
artm
ent (all faculty in dept.)
centralization, clustering, cohesion, transitivity,
triad cen
sus, core‐periphery, fragm
entation, dyad
census, heterogeneity, segregation
Dem
ograph
ics
Individu
al Attrib
utes
race, gen
der, age, citizenship, academ
ic rank, hire
date, salary, administrative appointm
ents, m
arital
and paren
tal status
Dep
artm
ent C
haracteristics
aggregation of individual dem
ographics,
dep
artm
ent size, academ
ic area, homogeneity
228

Theo
retic
al Frames
Structural The
ory of Action
o Actors who are in
sim
ilar locations will beh
ave in a sim
ilar manner
perception
satisfaction
opportunities and constraints
perform
ance
Social Cap
ital
o Actors with better network connections will have a competitive advantage
access to resources: inform
ation, research collaborations, guidance, social support, etc.
229

J. CALENDAR OF EVENTS
230

AD
VA
NC
E-N
ebra
ska
Cal
enda
r D
ate
Act
ivity
/Eve
ntSh
ort D
escr
iptio
n05
/16/
2011
-05-
20-
2011
Wri
ting
Retr
eat
6/6/
2011
-6/9
/201
2JA
M M
eetin
g in
Was
hing
ton
D.C
.Jil
l Hoc
hste
in a
nd Ju
lia M
cQui
llan
atte
nded
7/
1/20
12A
nnua
l Rep
ort s
ubm
itted
to N
SF08
/01
- 08/
05G
AIN
Wri
ting
Retr
eat
Mar
y A
nne
Hol
mes
and
Tri
sh
Won
ch H
ill a
ttend
ed th
e G
AIN
W
ritin
g Re
trea
t
8/17
/201
1Ex
tern
al E
valu
ator
Vis
it
8/29
/201
1A
dvan
ce L
eade
rshi
p Te
am M
eetin
g
9/8/
2011
Eval
uatio
n M
eetin
g
9/8/
2011
Con
vers
atio
ns 2
.0 W
orks
hop
Fall
Facu
lty e
vent
hel
d on
Eas
t C
ampu
s, s
how
casi
ng p
anel
s of
di
scus
sion
mos
t im
port
ant t
o fa
culty
9/14
/201
1A
dvan
ce F
acul
ty M
eetin
g9/
16/2
011
Exte
rnal
Adv
isor
y Bo
ard
Mem
ber V
isit
Joyc
e Ye
n ca
me
to U
NL
cam
pus
and
prov
ide
a pr
esen
tatio
n to
fa
culty
on
impl
icit
Bias
9/26
/201
1A
dvan
ce L
eade
rshi
p Te
am M
eetin
g9/
28/2
011
Adv
ance
Fac
ulty
Mee
ting
10/5
/201
1Ev
alua
tion
Mee
ting
10/3
1/20
11A
dvan
ce L
eade
rshi
p Te
am M
eetin
g11
/16/
2011
Eval
uatio
n M
eetin
g11
/30/
2011
Eval
uatio
n M
eetin
g12
/13/
2011
Adv
ance
facu
lty m
eetin
g12
/14/
2011
Eval
uatio
n M
eetin
g1/
17/2
012
Exte
rnal
Eva
luat
or V
isit
Ann
Aus
tin v
isite
d ca
mpu
s fr
om
J 1
7 1
91/
20/2
012
STEM
Dat
a C
hair
/Hea
d Br
eakf
ast D
iscu
ssio
n
1/20
/201
2Sh
owca
se V
isito
rG
eral
dine
Ric
hmon
d ga
ve ta
lk to
fa
culty
ent
itled
, "W
omen
and
N
egot
iatio
n"
Hos
ted
by A
dvan
ce a
t City
Uni
on
Love
Lib
rary
Wri
ting
Retr
eat
Ann
Aus
tin, U
NL'
s ex
tern
al e
valu
ator
vis
ited
cam
pus
Aug
ust 1
7 -
19th
231

AD
VA
NC
E-N
ebra
ska
Cal
enda
r D
ate
Act
ivity
/Eve
ntSh
ort D
escr
iptio
n1/
30/2
012
Adv
ance
Lea
ders
hip
Team
Mee
ting
1/30
/201
2Ev
alua
tion
Mee
ting
2/3/
2012
Adv
ance
Fac
ulty
Mee
ting
2/9/
2012
Adv
ance
Inia
tive
Aw
ard
2/13
/201
2Ev
alua
tion
Mee
ting
2/17
/201
2A
dvan
ce fa
culty
com
mitt
ee
2/20
/201
2A
dvan
ce L
eade
rshi
p Te
am M
eetin
g2/
21/2
012
Wom
en in
STE
M B
row
n Bo
g Lu
nche
on
3/5/
2012
Exte
rnal
Eva
luat
or V
isit
3/6/
2012
Pres
ente
r for
facu
lty D
evel
opm
ent
3/16
/201
2Ev
alua
tion
Mee
ting
3/16
/201
2W
omen
in S
TEM
Bro
wn
Bog
Lunc
heon
3/26
/201
2A
dvan
ce L
eade
rshi
p Te
am M
eetin
g3/
30/3
012
Eval
uatio
n M
eetin
gA
nnua
l Rep
ort
4/11
/201
2Ev
alua
tion
Mee
ting
4/17
/201
2Ev
alua
tion
Mee
ting
4/18
/201
2W
omen
in S
TEM
Bro
wn
Bog
Lunc
heon
4/20
/201
2Fa
cutly
Com
mitt
ee m
eets
with
SV
CA
A4/
24/2
012
Eval
uatio
n M
eetin
gA
nnua
l Rep
ort
05/1
4-18
, 201
2A
dvan
ce W
ritin
g Re
trea
t
Ann
ual R
epor
t
Mar
y D
eane
Sor
cine
lli v
isite
d U
NL
cam
pus
and
gave
a ta
lk to
Ann
Aus
tin v
isite
d ca
mpu
s 5
-8, g
ave
a pr
esen
tatio
n to
Dea
ns &
C
hair
s on
recr
uitm
ent,
inst
itutio
naliz
atio
n
Law
Col
lege
on
East
Cam
pus
Ann
ual R
epor
t
Hos
ted
by E
ast C
ampu
s
Cel
ebra
tion
for t
he A
dvan
ce C
hanc
ello
r's In
itiat
ive
Aw
ard
232