advance to next slide1 set up module section 1. advance to next slide2 interactive introduction to...
TRANSCRIPT
Advance to next slide 1
Set Up Module
Section 1
Advance to next slide 2
Interactive Introduction to SPSS Statistical Software
Elizabeth Bigham, Ph.D.California State University San Marcos May 2007 -
Funded by SSRIC
If you have not done so, save this file as a slide show (.pps) and view as a slide show.
Use the double-down arrows in the bottom right hand corner of this window to “Advance to next slide”.
Advance to next slide 3
Set-Up Instructions - 1
• Follow the set-up instructions (first 6 slides) before you begin the module.
• This module requires the use of SPSS and DeskPins software. DeskPins keeps the instructional window on top so you can see it while you complete the SPSS exercises.
Advance to next slide 4
• If you have DeskPins on your computer (you would see a red push-pin in the bottom left blue area of your screen), advance to Set-Up Instructions – 6.
• If you do not have DeskPins already, print out the instructions on the next 4 slides (slides 3, 4, 5, 6) and follow the directions to download this free program.
Set-Up Instructions - 2
Advance to next slide 5
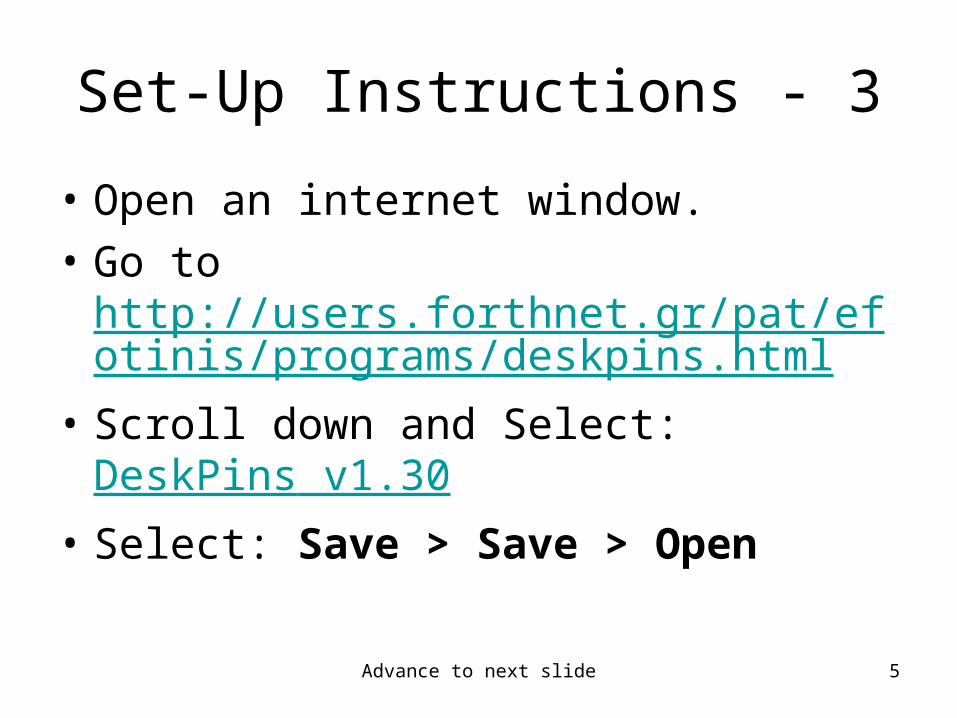
Set-Up Instructions - 3
• Open an internet window.
• Go to http://users.forthnet.gr/pat/efotinis/programs/deskpins.html
• Scroll down and Select: DeskPins v1.30
• Select: Save > Save > Open
Advance to next slide 6
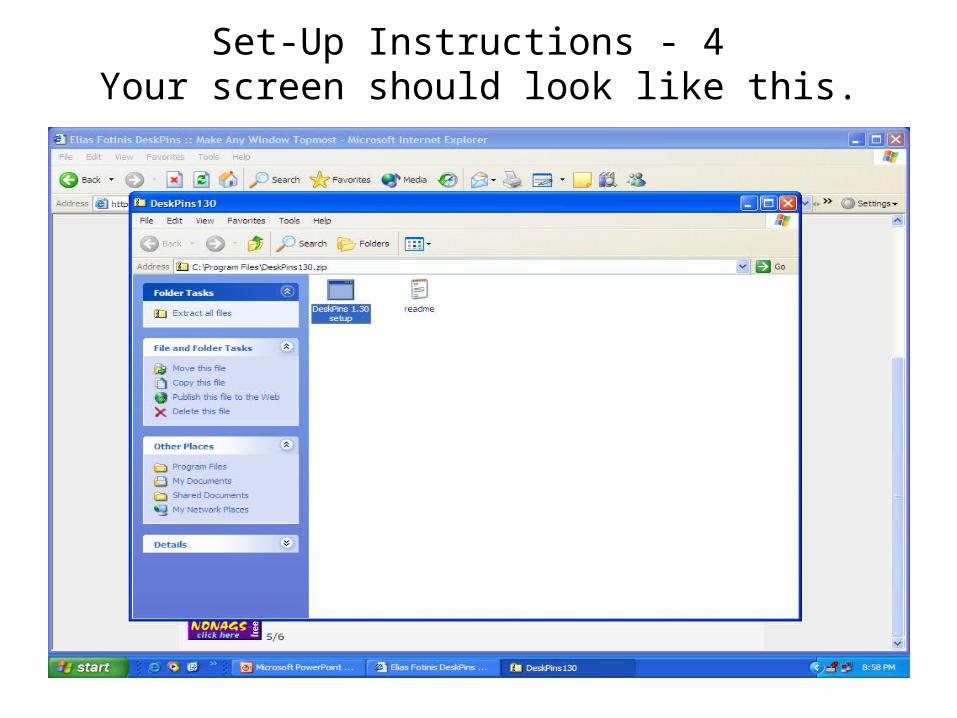
Set-Up Instructions - 4 Your screen should look like this.
Advance to next slide 7
• Double left click on: DeskPins 1.30 setup• Select: Extract all > Next > Next > Next >
Finish• Select: DeskPins 1.30 setup installer > Run >
Next > Install• When “Completed” appears in the upper left
corner of the window, select: Close• Close the DeskPins window• Restart you computer to activate the DeskPins
program and then return here and continue with Set-Up Instructions – 6.
Set-Up Instructions - 5
Advance to next slide 8
Set-Up Instructions - 6
• DeskPins should now be installed (you should see a red push-pin at the bottom right corner of your screen).
• Left click on the red push-pin (pick up a pin)• Left click on this screen (you should see a red push-pin
appear in the blue area above) • Shrink this window to approximately 20% of the size of
your screen and move it to the bottom right hand corner of your screen. – This will allow you to carry out the exercises in SPSS while
viewing the instructions.
• Now you are set-up and ready to begin the module!

Advance to next slide 9
Introduction to SPSS
Section 2
Advance to next slide 10
Interactive Introduction to SPSS Statistical Software
Welcome,
This module was designed to introduce you to SPSS statistical software. It is an interactive presentation for students who have successfully completed a lower division statistics course and are ready to begin conducting computerized statistical analysis.
Advance to next slide 11
Learning Objectives
You will learn to:– set-up a data entry page– work with variables, such as add, move, and
recode them– perform descriptive analysis– conduct simple correlations
Advance to next slide 12
Directions
• Remember to use the double-down arrows to “Advance to next slide” (or go back and review slides) at your own pace.
• Words in italics refer to a location.
• Words in “quotes” are words you type.
• Bold indicates a selection (to click on).
• The symbol > indicates that you move to the next step.
Advance to next slide 13
Getting Started
• Data collection methods vary and the capabilities of SPSS are tremendous.
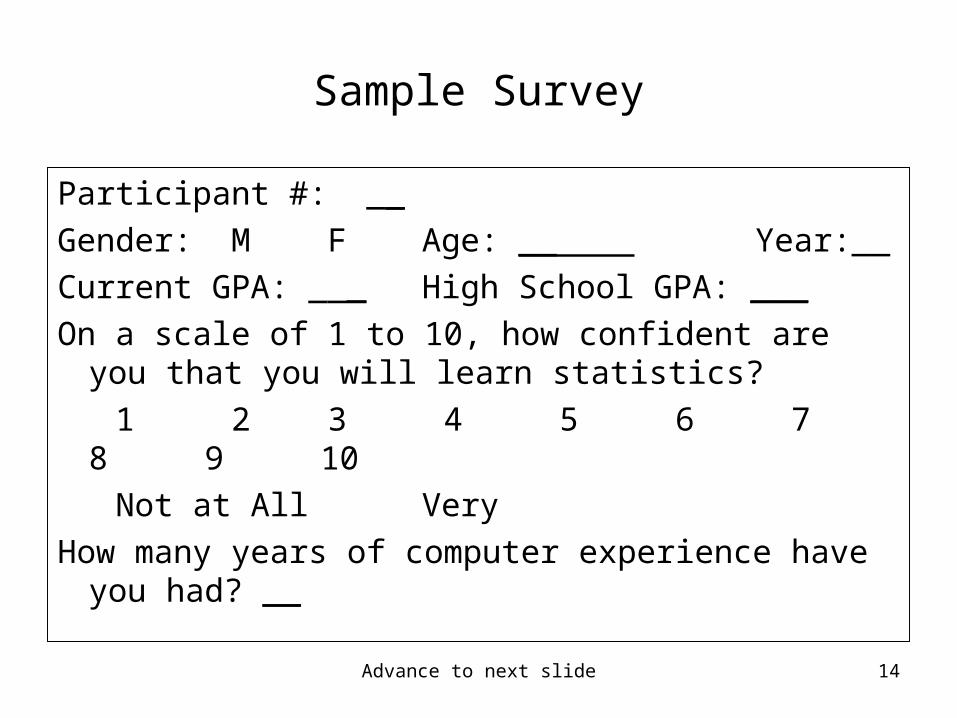
• For this introductory module, we will use a simple survey (on the next slide) as part of a hypothetical study.
• Take a look at the Sample Survey and note the information that is collected with each item.
Advance to next slide 14
Sample Survey
Participant #: __
Gender: M F Age: __ Year:__
Current GPA: ___ High School GPA: ___
On a scale of 1 to 10, how confident are you that you will learn statistics?
1 2 3 4 5 6 7 8 9 10
Not at All Very
How many years of computer experience have you had? __
Advance to next slide 15
Open SPSS
• Open SPSS: Start > All Programs > SPSS for Windows > SPSS 14.0 for Windows
• Your Version number may be different.
• A medium size window will open.
• Select: Type in Data > OK
Advance to next slide 16
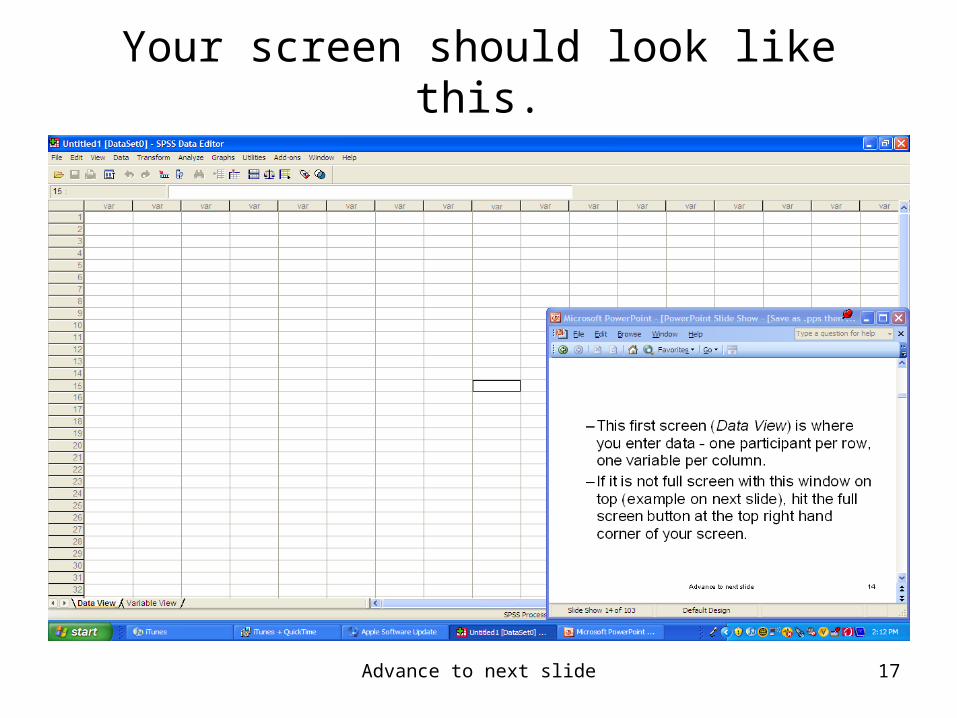
– This first screen (Data View) is where you enter data - one participant per row, one variable per column.
– If it is not full screen with this window on top (example on next slide), hit the full screen button at the top right hand corner of your screen.
Advance to next slide 17
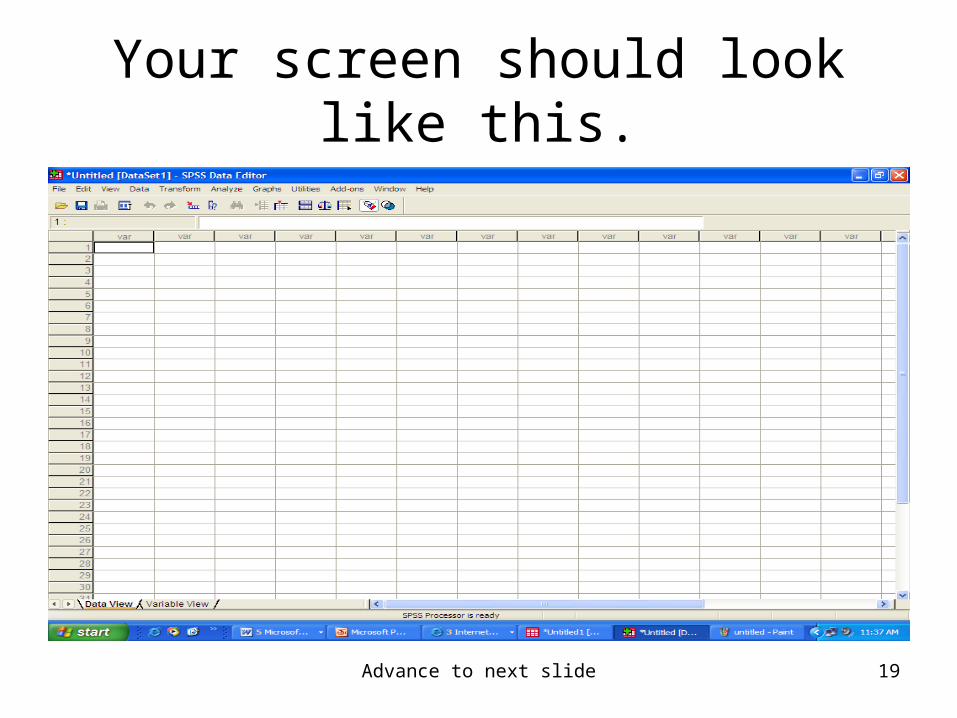
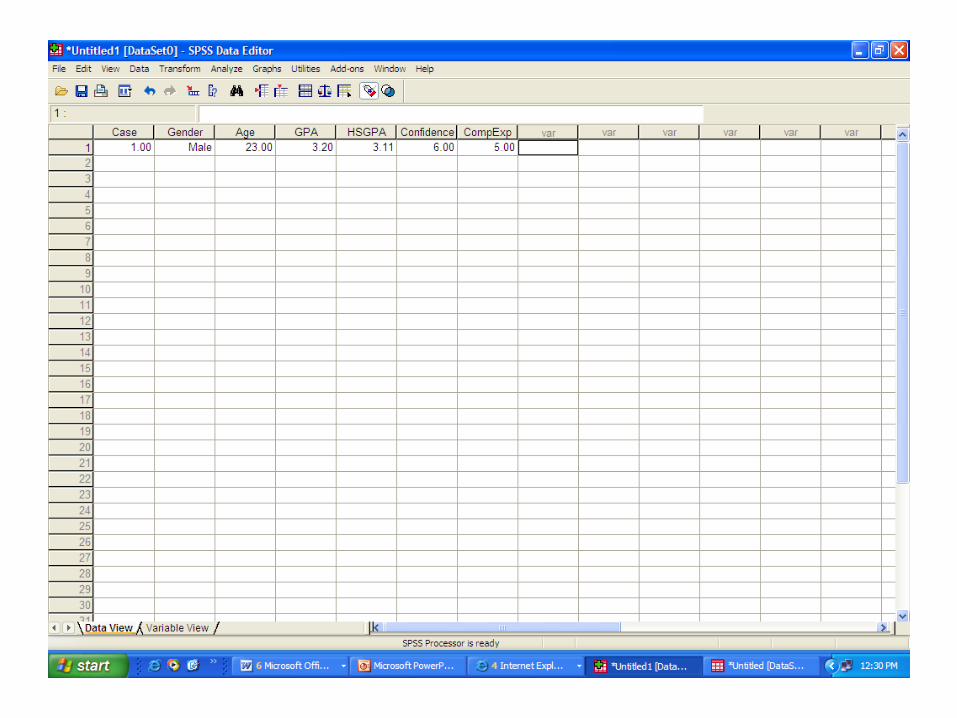
Your screen should look like this.
Advance to next slide 18
• For the rest of the module, the small instructional window will not be in the pictures that show what your screen should currently look like.
• See the next slide for an example.
Advance to next slide 19
Your screen should look like this.
Advance to next slide 20
Set-up a Data Entry Page
Section 3
Advance to next slide 21
Set Up Columns
• Switch to Variable View. At the bottom left of your screen there are two tabs (Data View and Variable View). Select: Variable View. (This screen is where you enter information about your variables - one variable per row.)

Advance to next slide 22
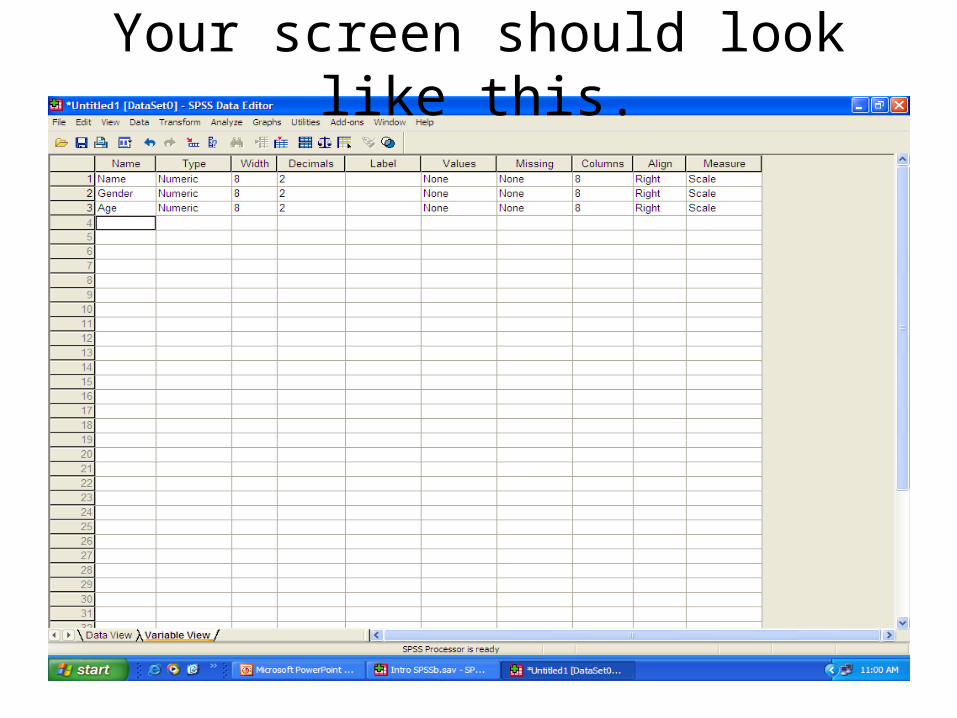
Your screen should look like this.
Advance to next slide 23
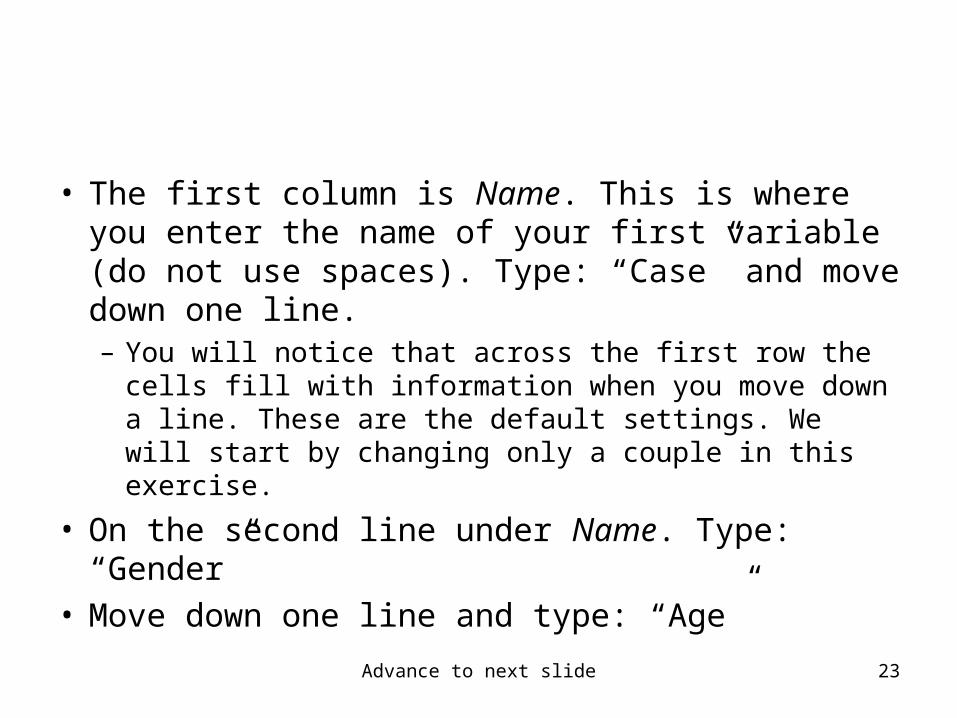
• The first column is Name. This is where you enter the name of your first variable (do not use spaces). Type: “Case” and move down one line. – You will notice that across the first row the cells fill
with information when you move down a line. These are the default settings. We will start by changing only a couple in this exercise.
• On the second line under Name. Type: “Gender” • Move down one line and type: “Age”
Advance to next slide 24
Your screen should look like this.
Advance to next slide 25
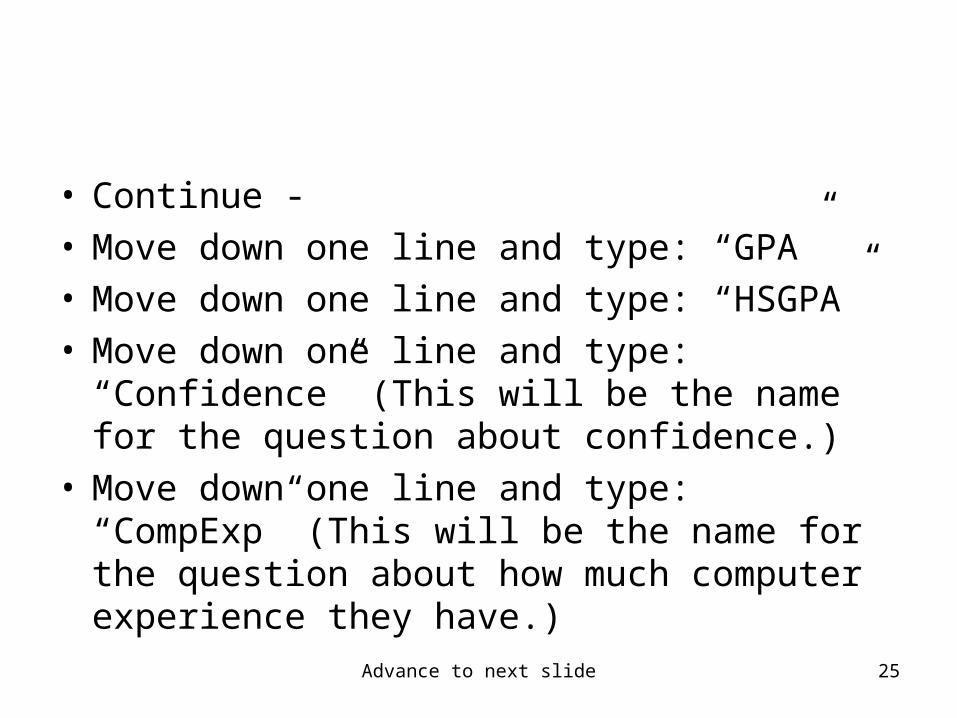
• Continue - • Move down one line and type: “GPA”• Move down one line and type: “HSGPA”• Move down one line and type: “Confidence”
(This will be the name for the question about confidence.)
• Move down one line and type: “CompExp” (This will be the name for the question about how much computer experience they have.)
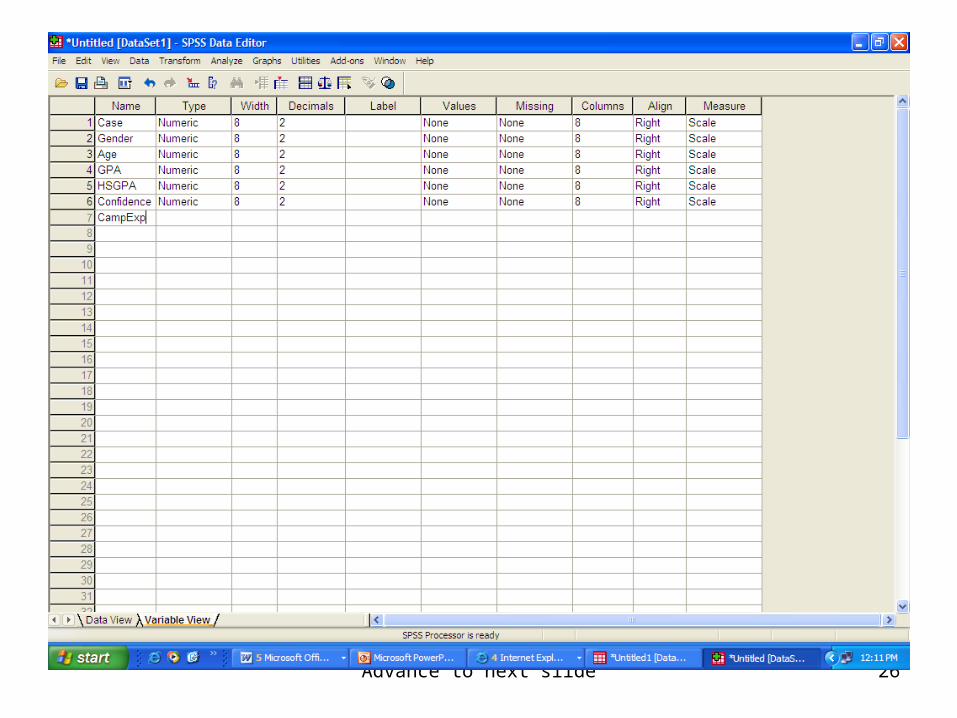
Advance to next slide 26
Advance to next slide 27
Coding
– In response to the survey item Gender, your participant will circle M or F. SPSS will need a number that indicates Male and a number that indicates Female.
• Go to Line 2 (Gender) and move over to the Values column, click on the cell and then on the 3 dots shaded in grey. A Value Labels window will appear. Enter “1” in the Value box and “Male” in the Label box. Select: Add. Then type “2” and “Female.” Select: Add > OK.
Advance to next slide 28
Advance to next slide 29
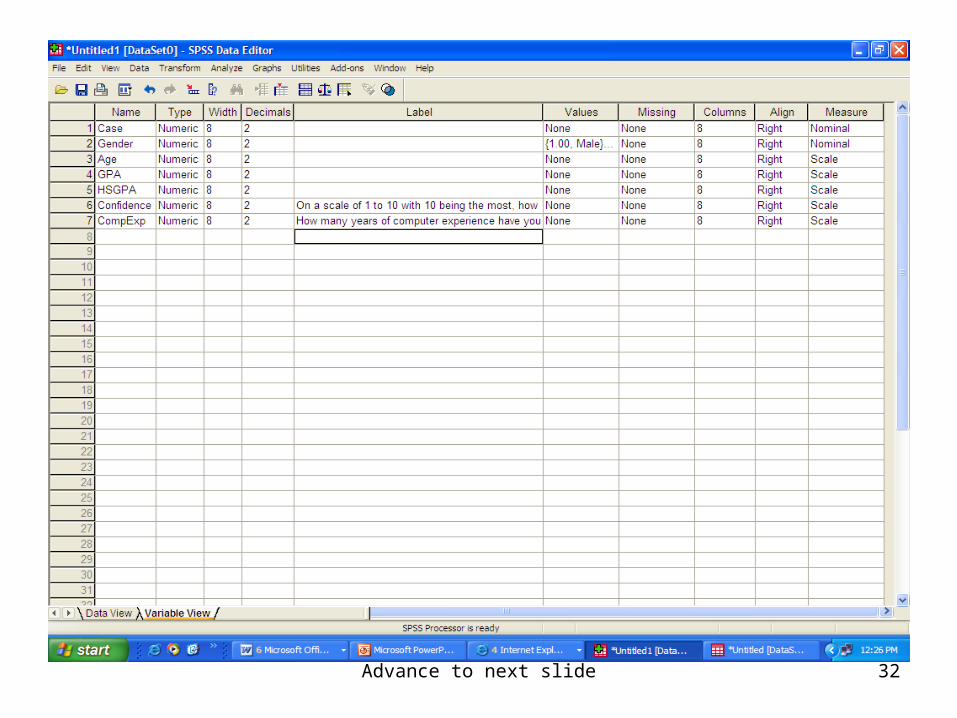
– You can write in information that explains the variable in the Label column.
• Go to line 6 (Confidence) and move over to the Label column and type: “On a scale of 1 to 10 with 10 being the most, how confident are you that you will learn statistics?”
• Move down to the Label column of line 7 (CompExp) and type: “How many years of computer experience have you had?”
Advance to next slide 30
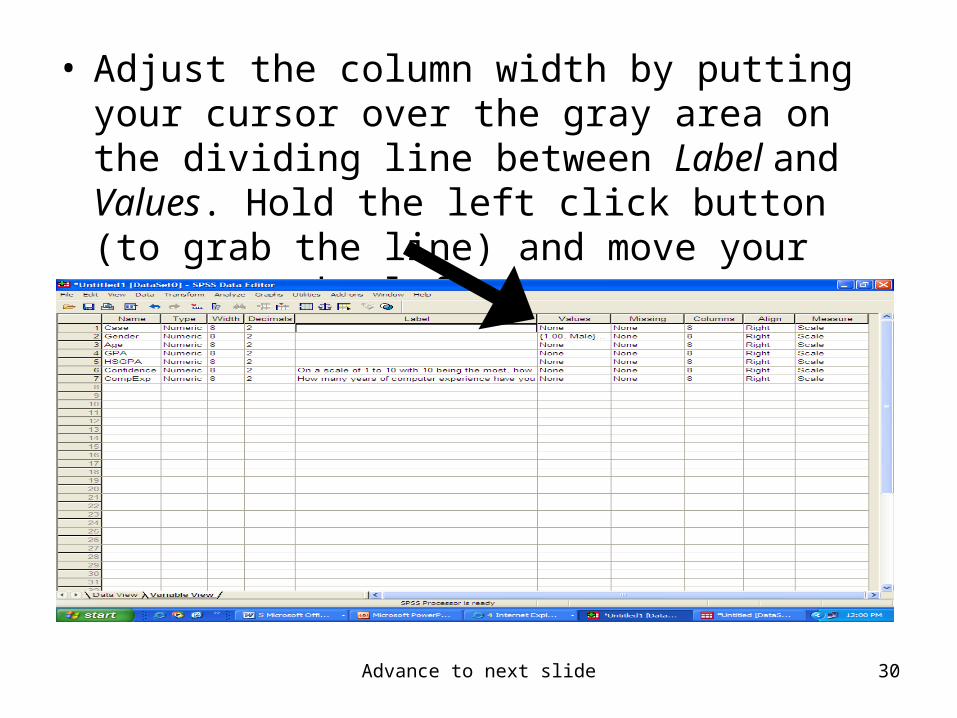
• Adjust the column width by putting your cursor over the gray area on the dividing line between Label and Values. Hold the left click button (to grab the line) and move your mouse to the left.
Advance to next slide 31
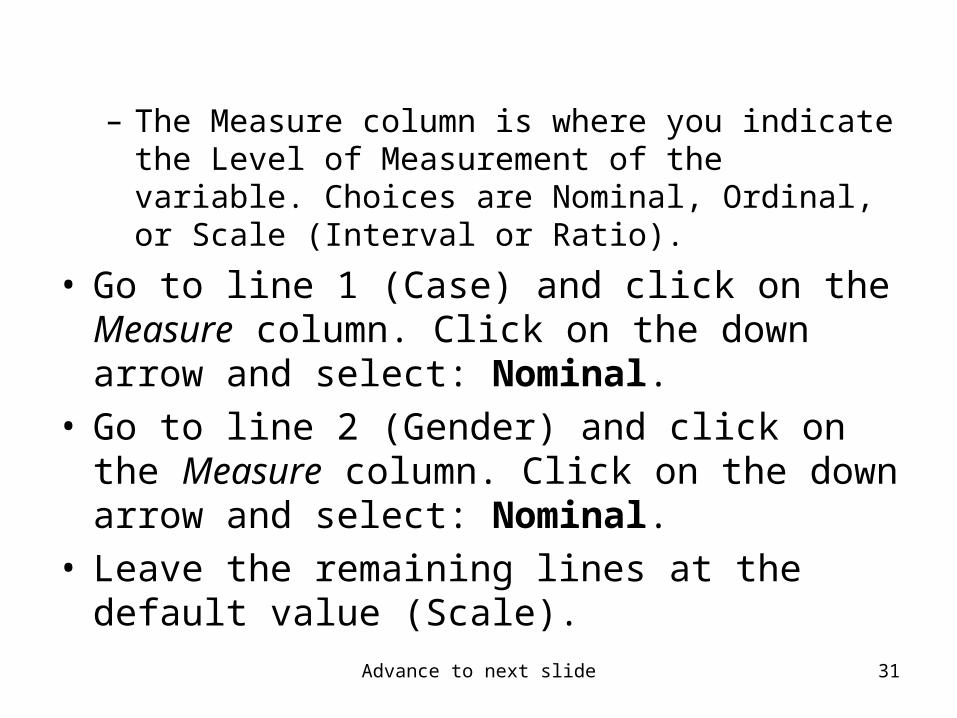
– The Measure column is where you indicate the Level of Measurement of the variable. Choices are Nominal, Ordinal, or Scale (Interval or Ratio).
• Go to line 1 (Case) and click on the Measure column. Click on the down arrow and select: Nominal.
• Go to line 2 (Gender) and click on the Measure column. Click on the down arrow and select: Nominal.
• Leave the remaining lines at the default value (Scale).
Advance to next slide 32

Advance to next slide 33
Enter Data
Section 4
Advance to next slide 34
Enter Data
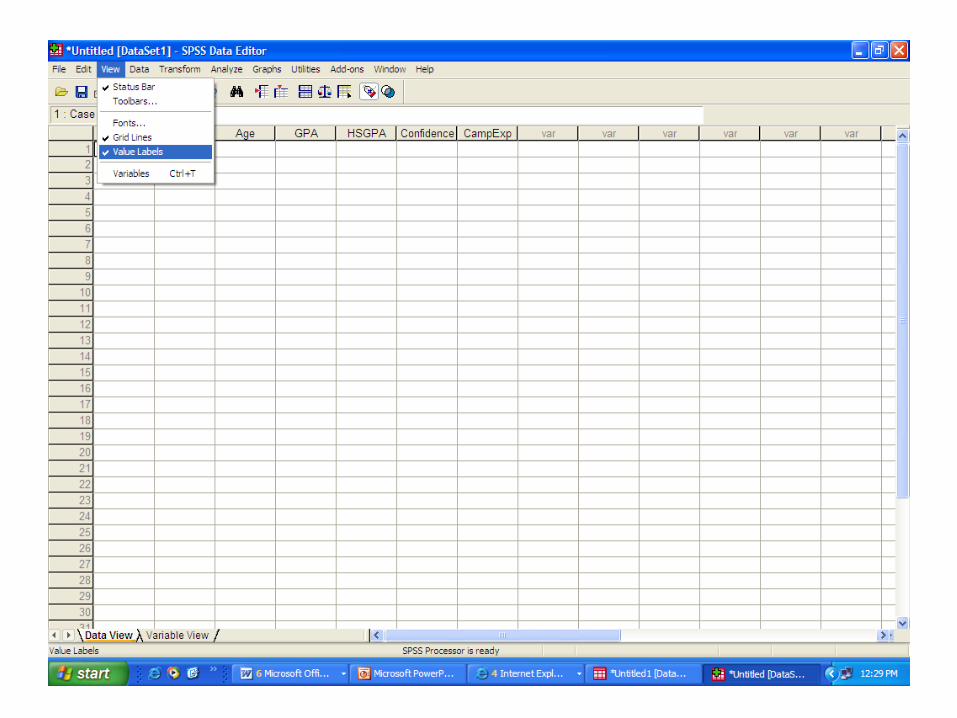
• Switch to Data View. At the bottom left of your screen select: Data View.
• In the upper left portion of your screen, select View and, if Value Labels is not checked, select Value Labels
Advance to next slide 35
Advance to next slide 36
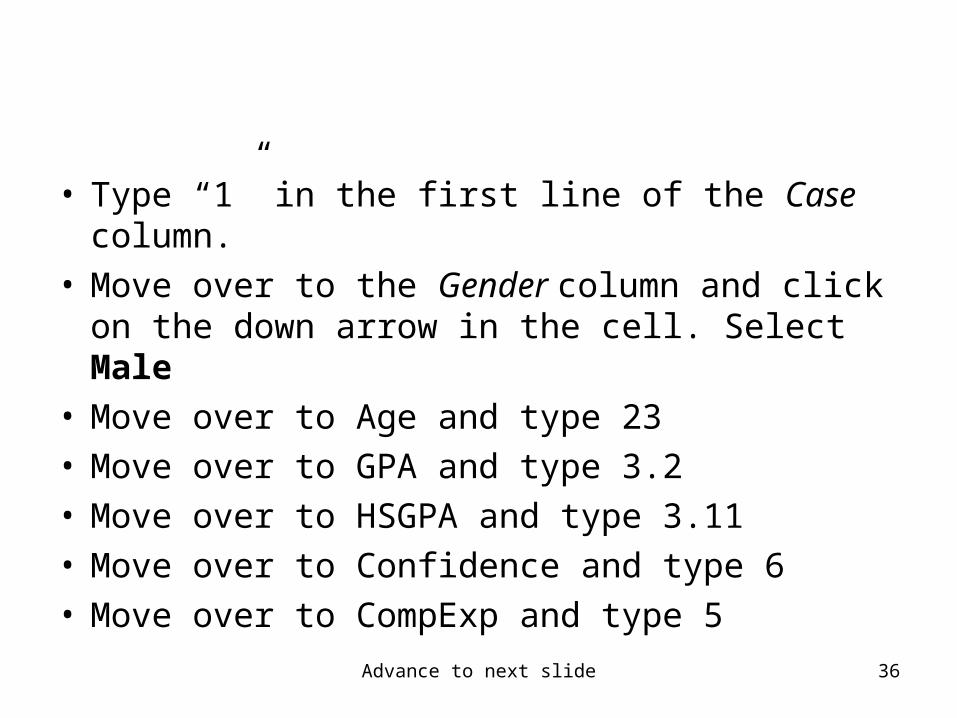
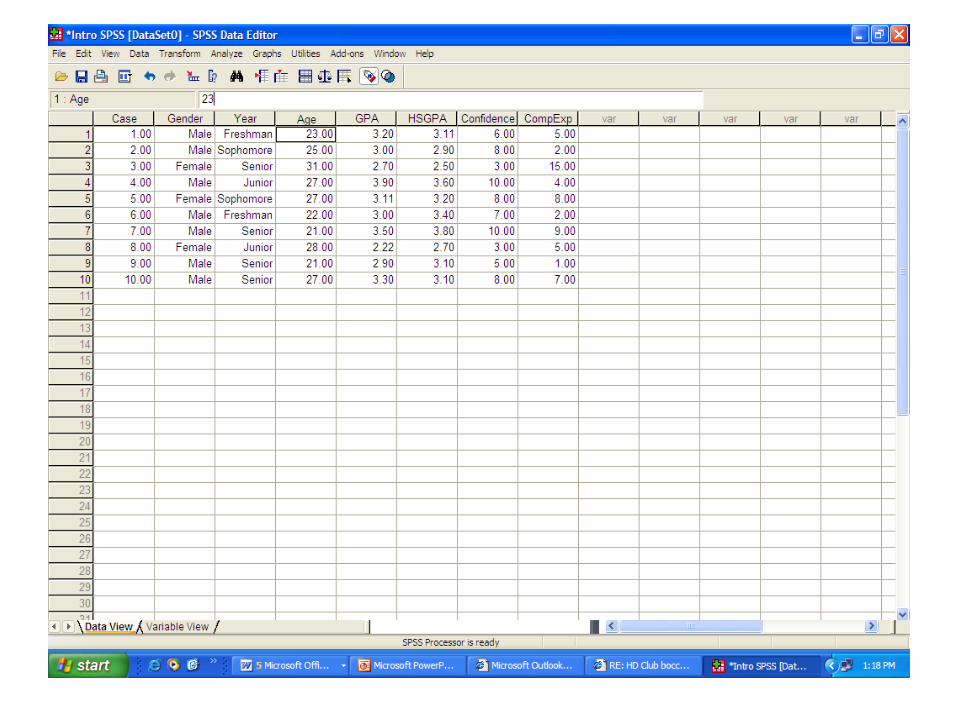
• Type “1” in the first line of the Case column. • Move over to the Gender column and click on
the down arrow in the cell. Select Male• Move over to Age and type 23• Move over to GPA and type 3.2• Move over to HSGPA and type 3.11• Move over to Confidence and type 6• Move over to CompExp and type 5
Advance to next slide 37
Advance to next slide 38
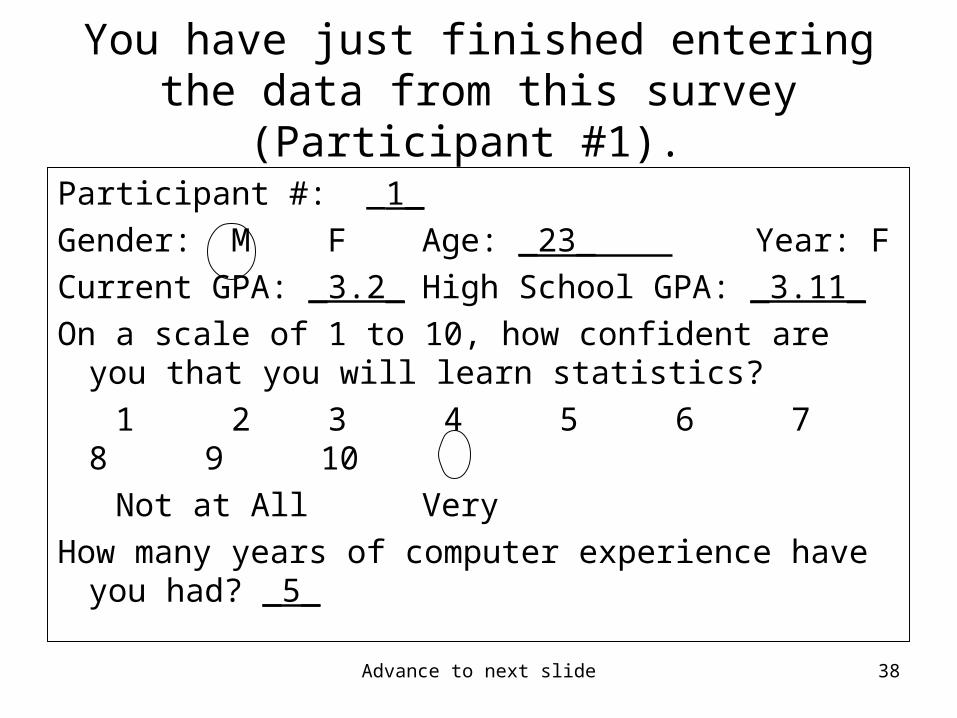
You have just finished entering the data from this survey (Participant #1).
Participant #: _1_
Gender: M F Age: _23_ Year: F
Current GPA: _3.2_ High School GPA: _3.11_
On a scale of 1 to 10, how confident are you that you will learn statistics?
1 2 3 4 5 6 7 8 9 10
Not at All Very
How many years of computer experience have you had? _5_
Advance to next slide 39
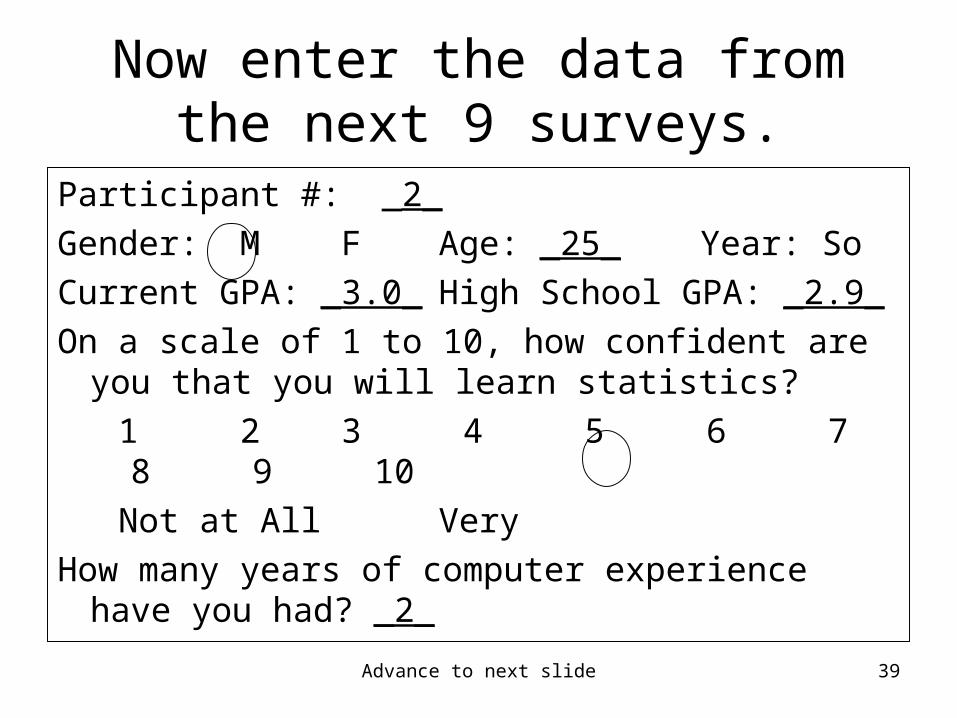
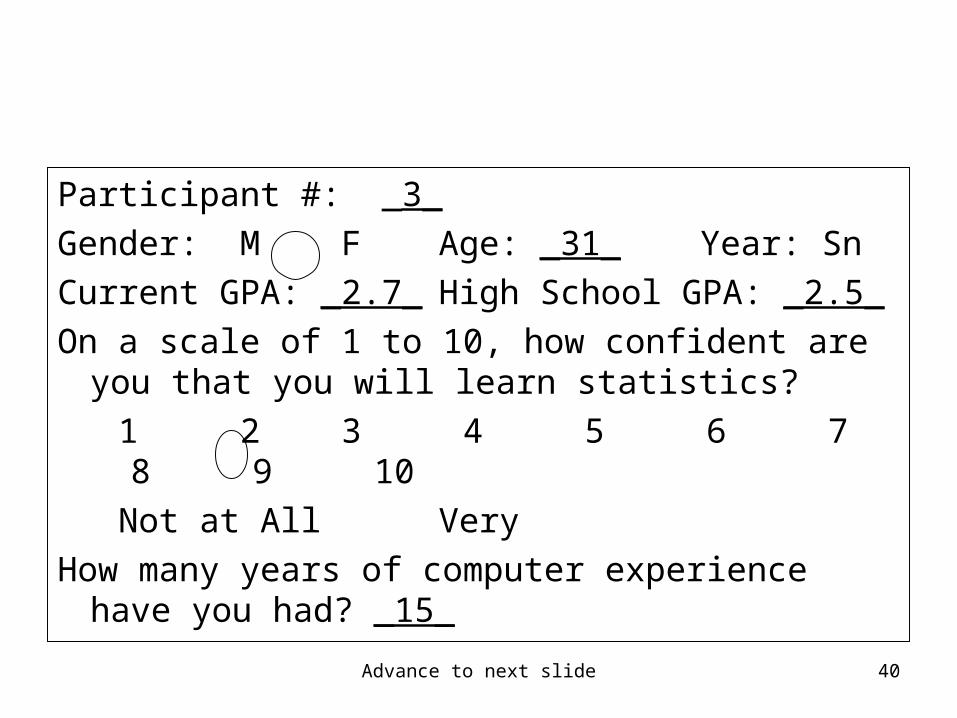
Now enter the data from the next 9 surveys.
Participant #: _2_
Gender: M F Age: _25_ Year: So
Current GPA: _3.0_ High School GPA: _2.9_
On a scale of 1 to 10, how confident are you that you will learn statistics?
1 2 3 4 5 6 7 8 9 10
Not at All Very
How many years of computer experience have you had? _2_
Advance to next slide 40
Participant #: _3_
Gender: M F Age: _31_ Year: Sn
Current GPA: _2.7_ High School GPA: _2.5_
On a scale of 1 to 10, how confident are you that you will learn statistics?
1 2 3 4 5 6 7 8 9 10
Not at All Very
How many years of computer experience have you had? _15_
Advance to next slide 41
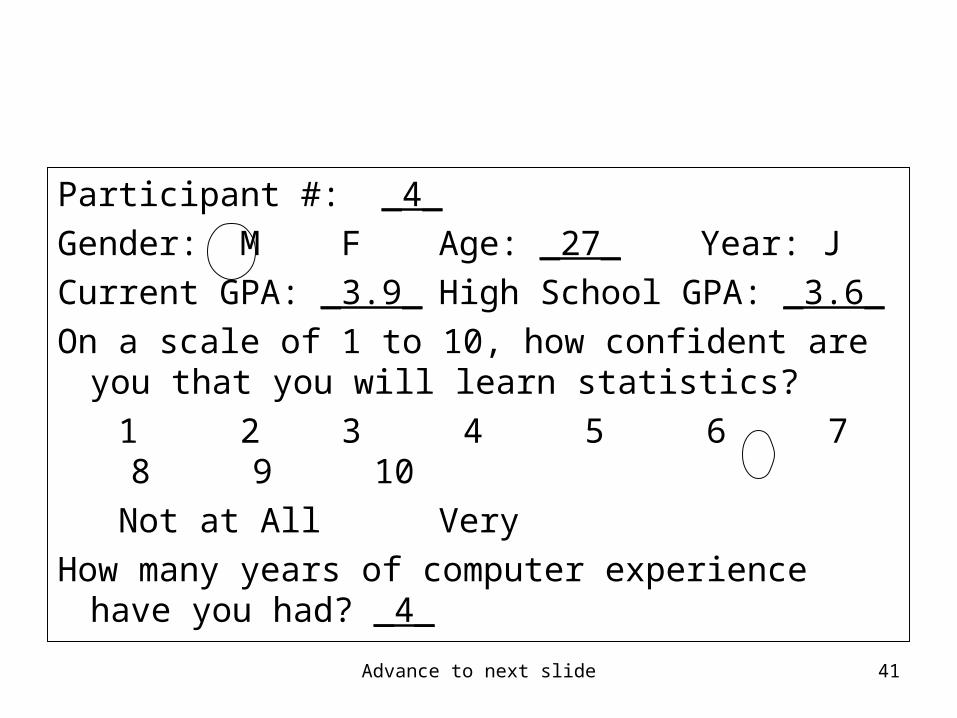
Participant #: _4_
Gender: M F Age: _27_ Year: J
Current GPA: _3.9_ High School GPA: _3.6_
On a scale of 1 to 10, how confident are you that you will learn statistics?
1 2 3 4 5 6 7 8 9 10
Not at All Very
How many years of computer experience have you had? _4_
Advance to next slide 42
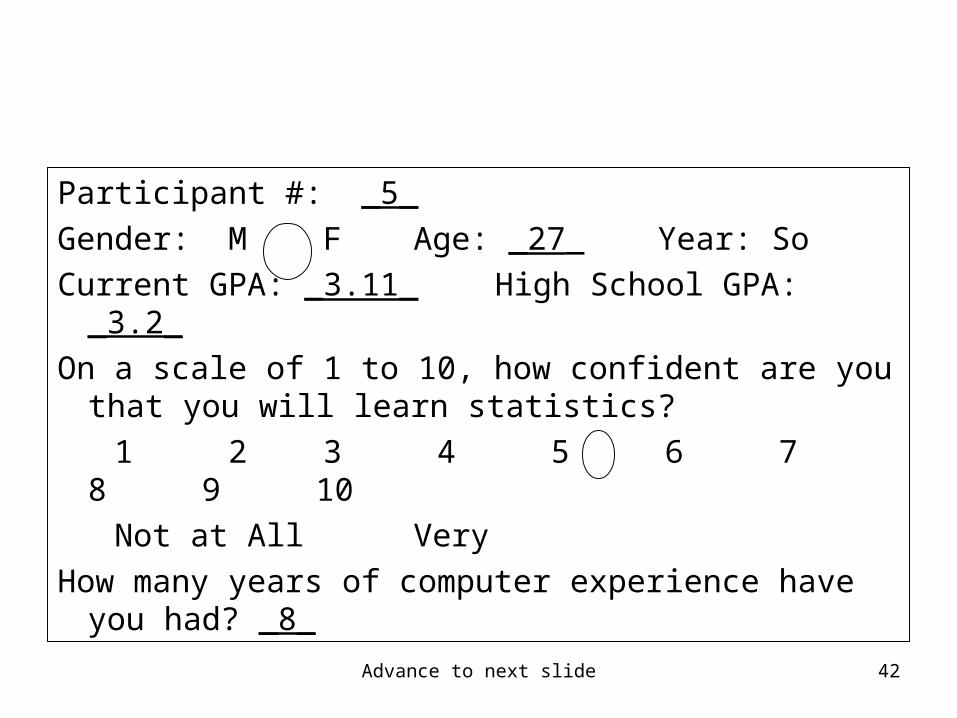
Participant #: _5_
Gender: M F Age: _27_ Year: So
Current GPA: _3.11_ High School GPA: _3.2_
On a scale of 1 to 10, how confident are you that you will learn statistics?
1 2 3 4 5 6 7 8 9 10
Not at All Very
How many years of computer experience have you had? _8_
Advance to next slide 43
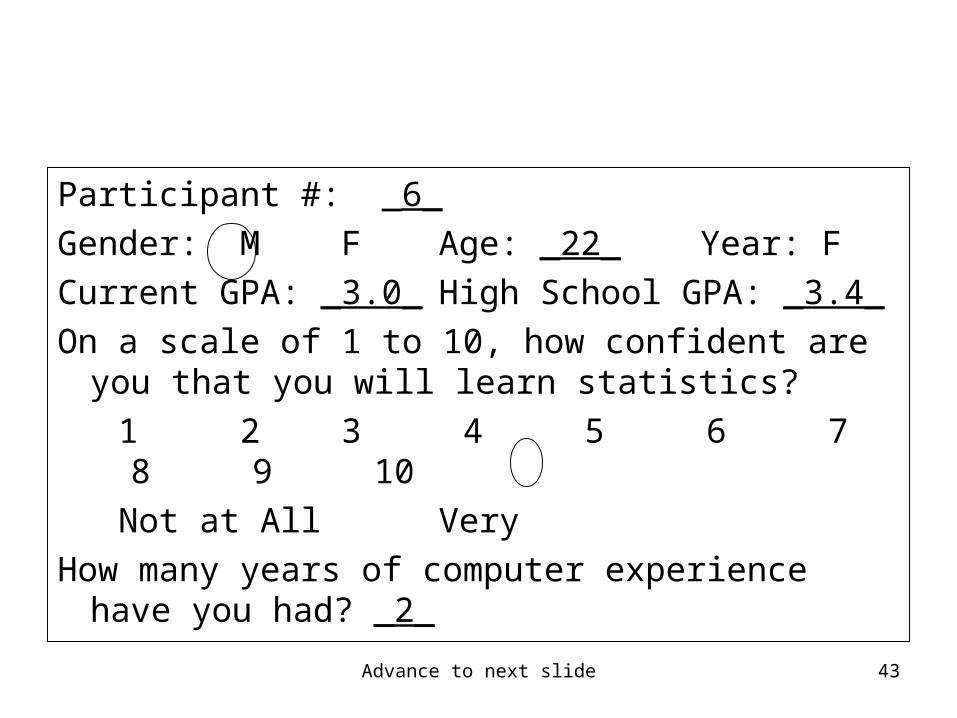
Participant #: _6_
Gender: M F Age: _22_ Year: F
Current GPA: _3.0_ High School GPA: _3.4_
On a scale of 1 to 10, how confident are you that you will learn statistics?
1 2 3 4 5 6 7 8 9 10
Not at All Very
How many years of computer experience have you had? _2_
Advance to next slide 44
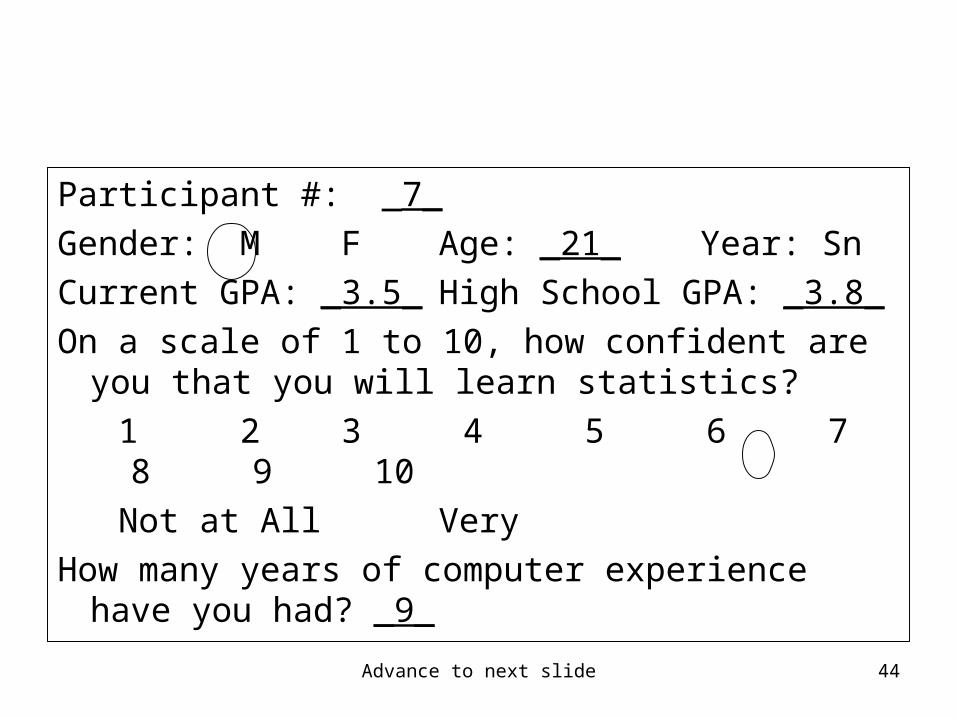
Participant #: _7_
Gender: M F Age: _21_ Year: Sn
Current GPA: _3.5_ High School GPA: _3.8_
On a scale of 1 to 10, how confident are you that you will learn statistics?
1 2 3 4 5 6 7 8 9 10
Not at All Very
How many years of computer experience have you had? _9_
Advance to next slide 45
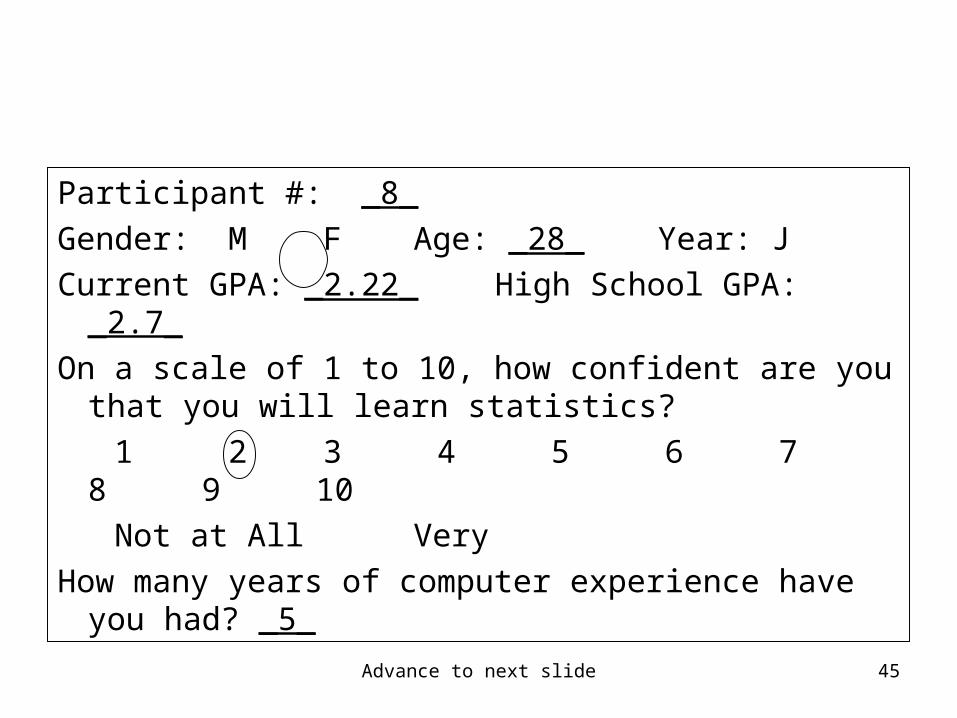
Participant #: _8_
Gender: M F Age: _28_ Year: J
Current GPA: _2.22_ High School GPA: _2.7_
On a scale of 1 to 10, how confident are you that you will learn statistics?
1 2 3 4 5 6 7 8 9 10
Not at All Very
How many years of computer experience have you had? _5_
Advance to next slide 46
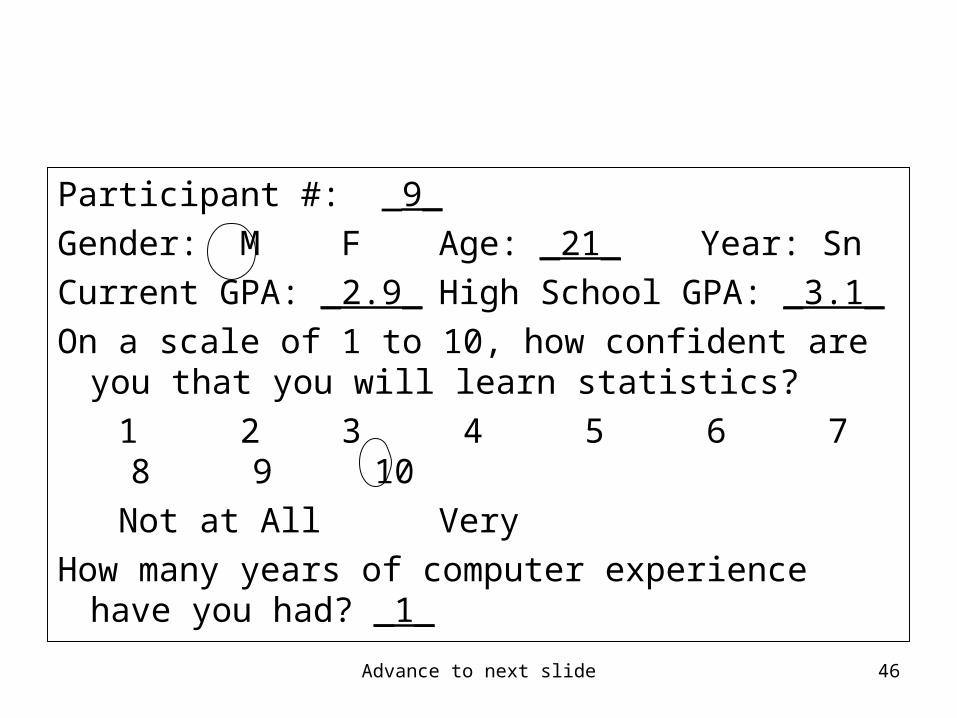
Participant #: _9_
Gender: M F Age: _21_ Year: Sn
Current GPA: _2.9_ High School GPA: _3.1_
On a scale of 1 to 10, how confident are you that you will learn statistics?
1 2 3 4 5 6 7 8 9 10
Not at All Very
How many years of computer experience have you had? _1_
Advance to next slide 47
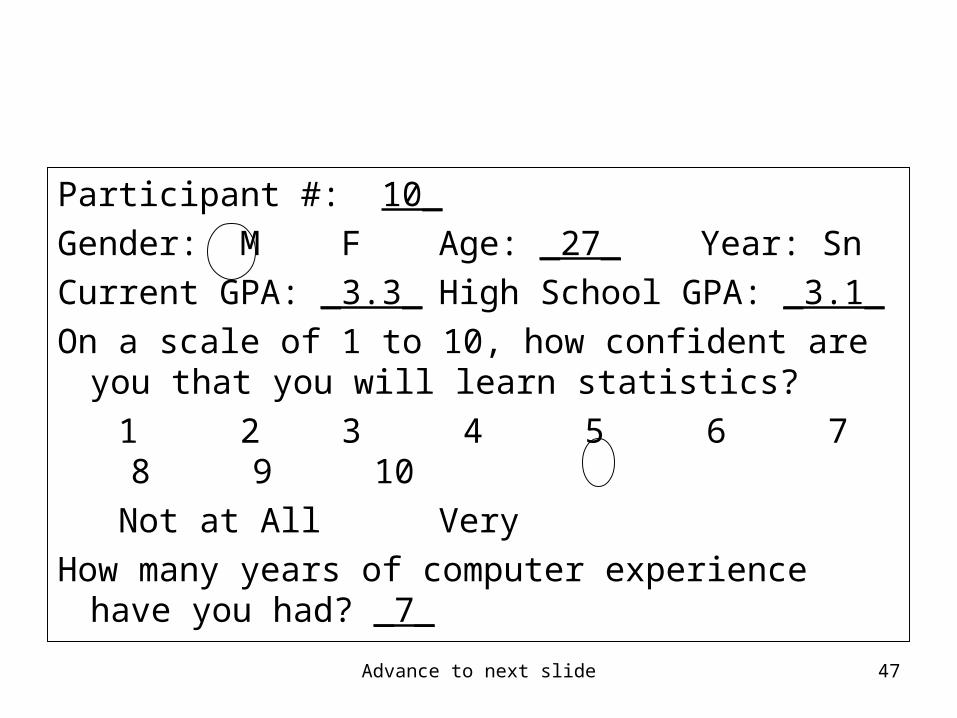
Participant #: 10_
Gender: M F Age: _27_ Year: Sn
Current GPA: _3.3_ High School GPA: _3.1_
On a scale of 1 to 10, how confident are you that you will learn statistics?
1 2 3 4 5 6 7 8 9 10
Not at All Very
How many years of computer experience have you had? _7_
Advance to next slide 48
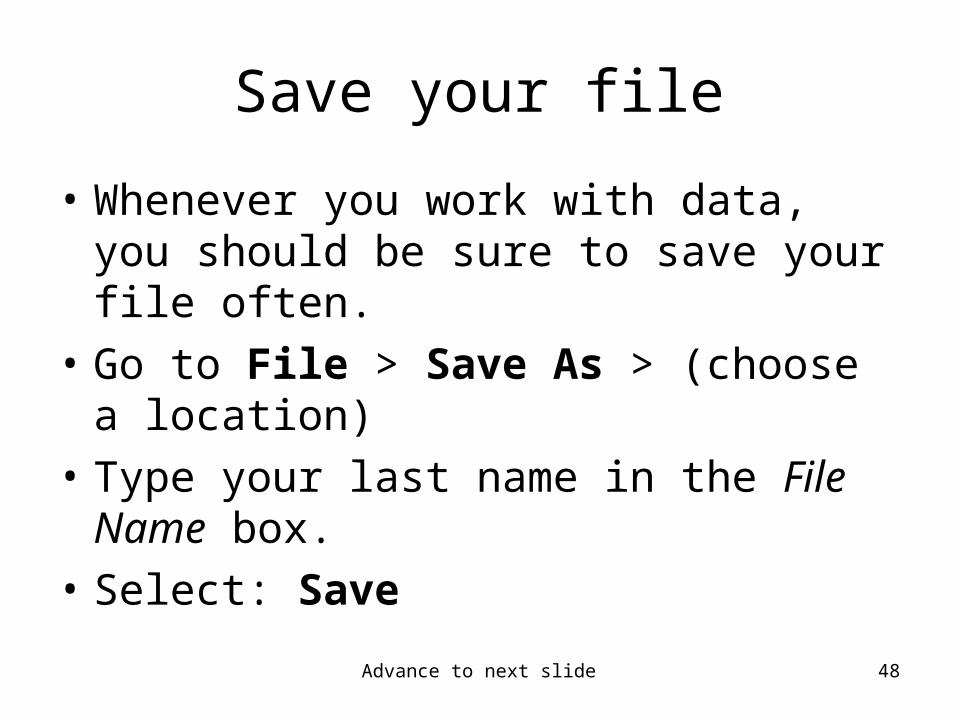
Save your file
• Whenever you work with data, you should be sure to save your file often.
• Go to File > Save As > (choose a location)
• Type your last name in the File Name box.
• Select: Save
Advance to next slide 49

Advance to next slide 50
Work with Variables
Section 5
Advance to next slide 51
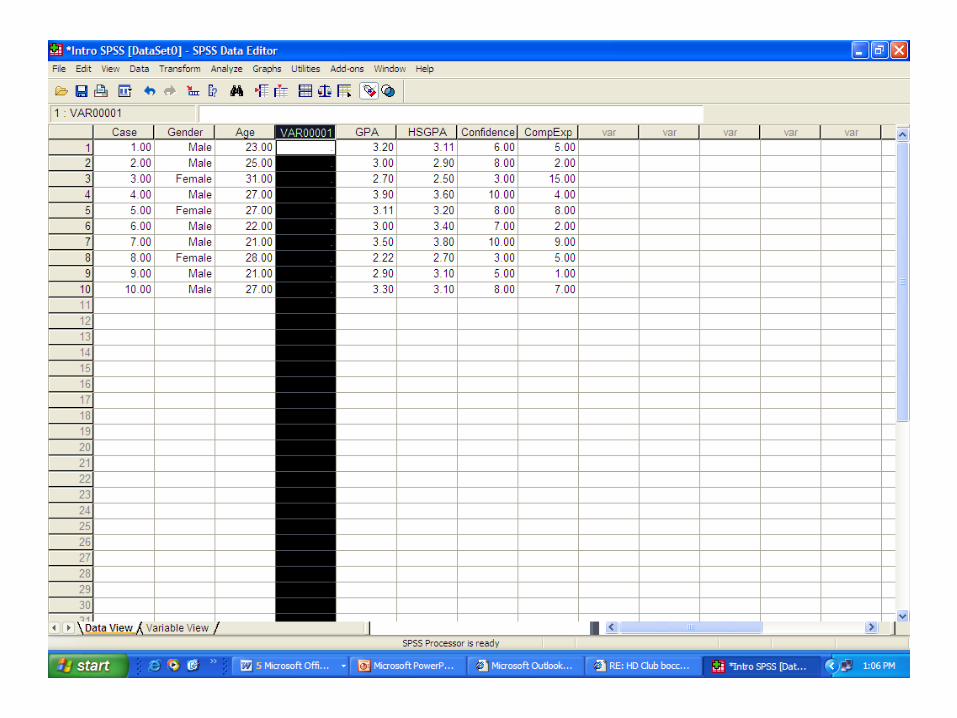
Add a variable
Click on the top grey portion of the GPA column to highlight the column. At the top left of your screen, select Edit > Insert variable.
Advance to next slide 52
Advance to next slide 53
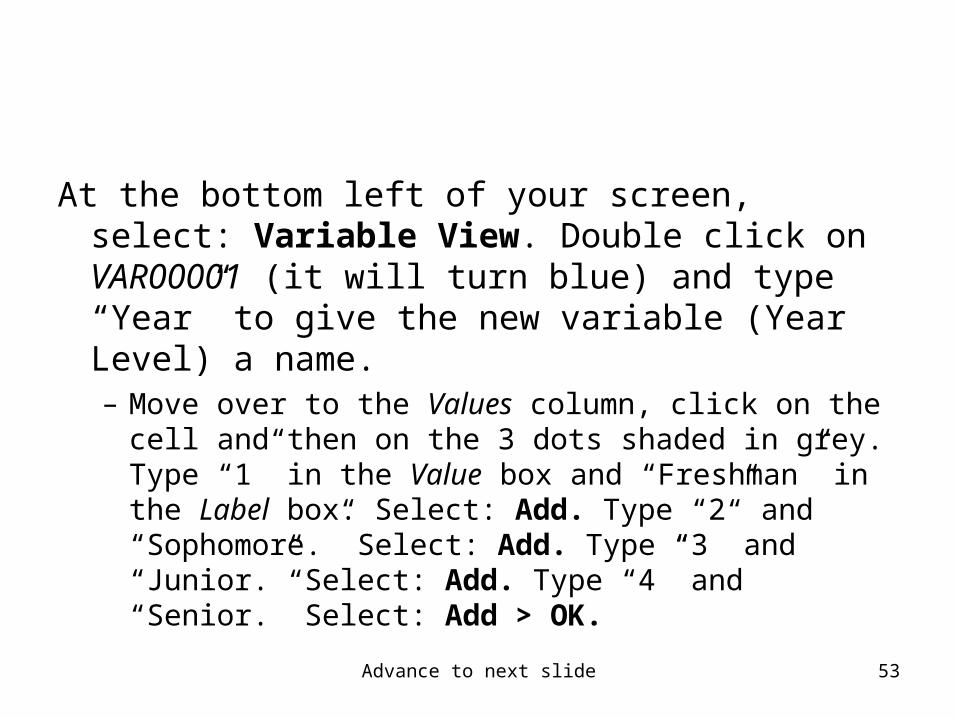
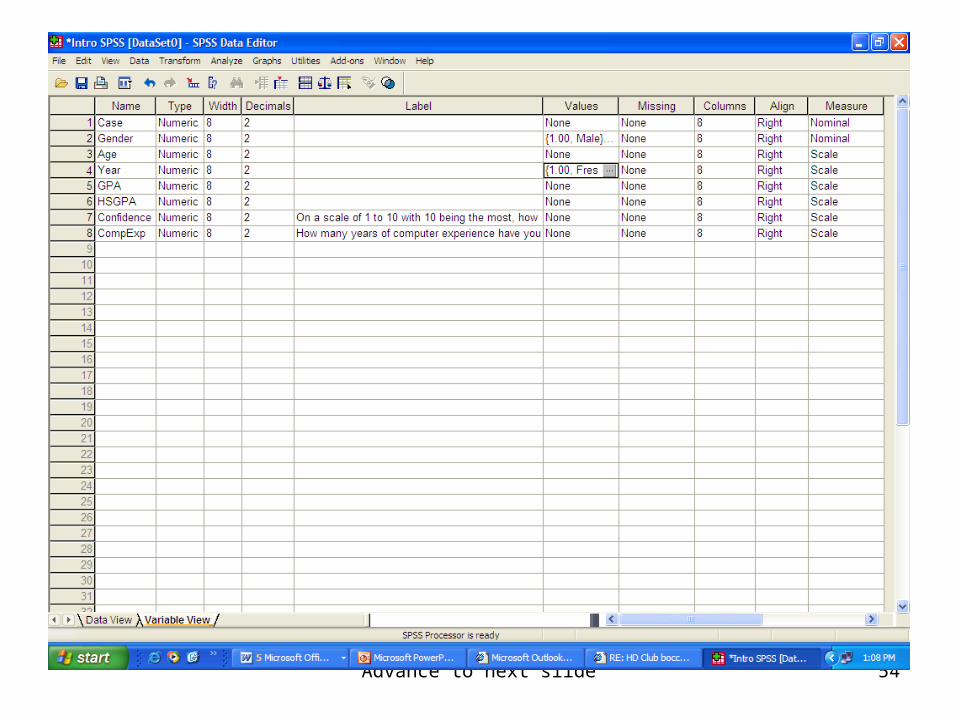
At the bottom left of your screen, select: Variable View. Double click on VAR00001 (it will turn blue) and type “Year” to give the new variable (Year Level) a name. – Move over to the Values column, click on the cell and
then on the 3 dots shaded in grey. Type “1” in the Value box and “Freshman” in the Label box. Select: Add. Type “2” and “Sophomore.” Select: Add. Type “3” and “Junior.” Select: Add. Type “4” and “Senior.” Select: Add > OK.
Advance to next slide 54
Advance to next slide 55
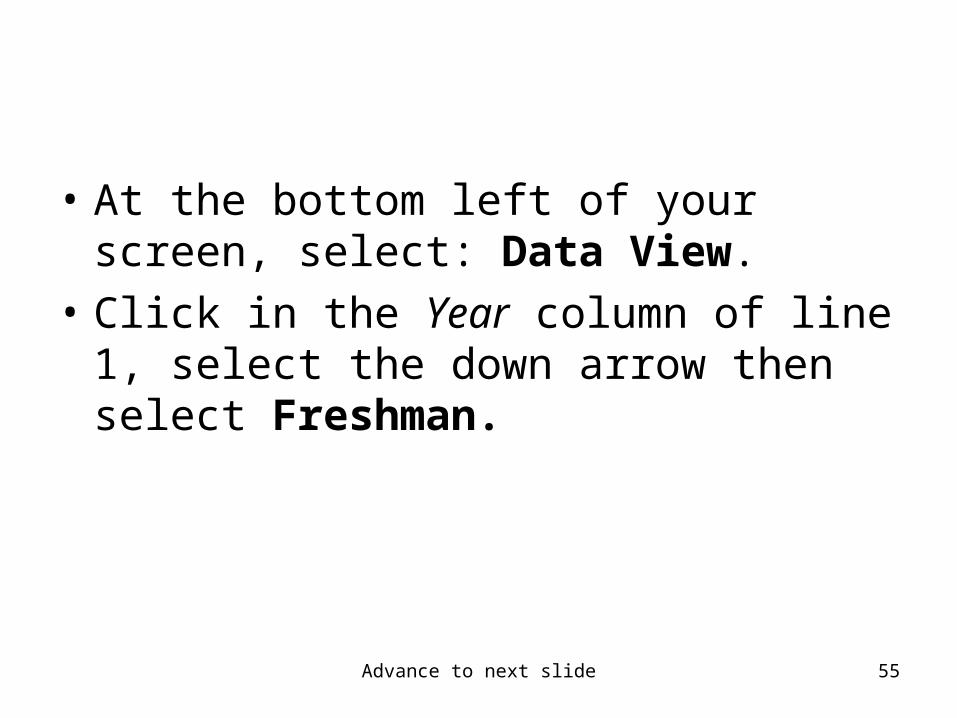
• At the bottom left of your screen, select: Data View.
• Click in the Year column of line 1, select the down arrow then select Freshman.
Advance to next slide 56
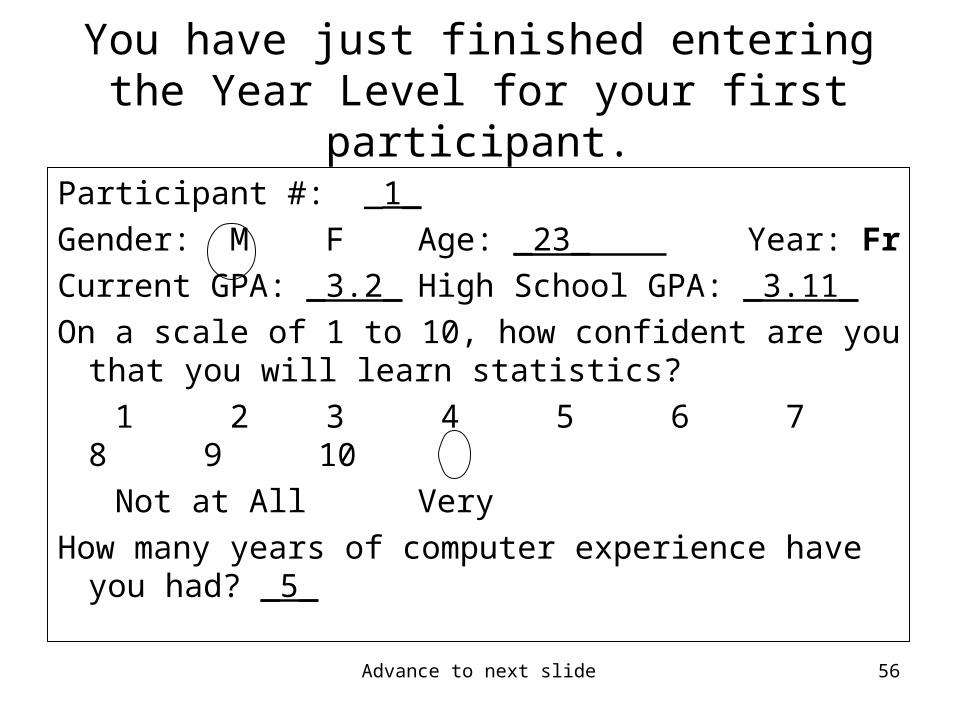
You have just finished entering the Year Level for your first participant.
Participant #: _1_
Gender: M F Age: _23_ Year: Fr
Current GPA: _3.2_ High School GPA: _3.11_
On a scale of 1 to 10, how confident are you that you will learn statistics?
1 2 3 4 5 6 7 8 9 10
Not at All Very
How many years of computer experience have you had? _5_
Advance to next slide 57
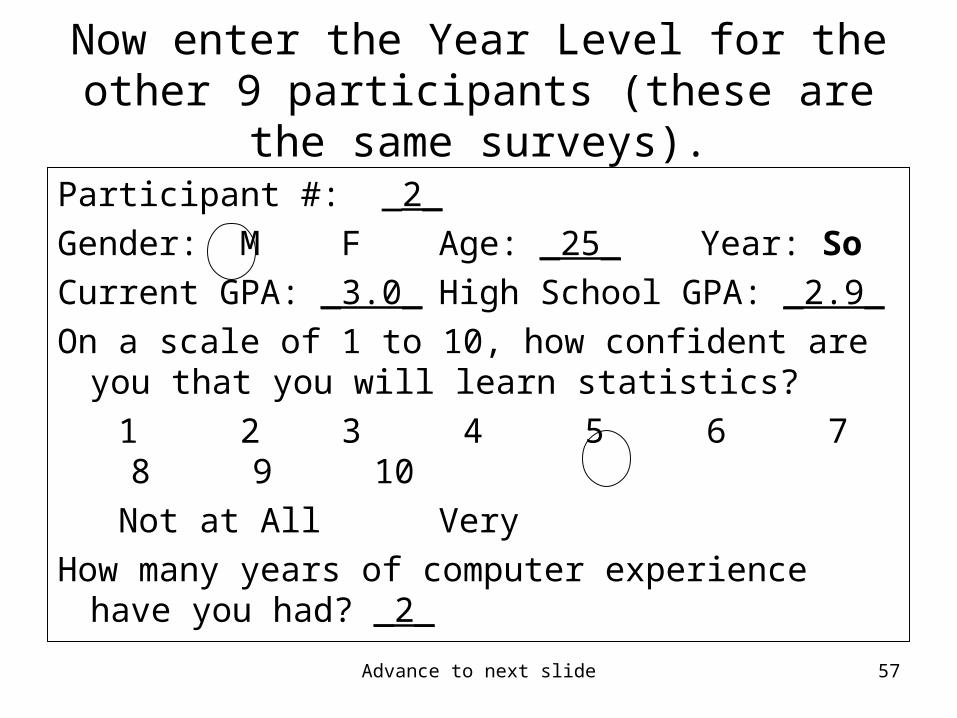
Now enter the Year Level for the other 9 participants (these are the same surveys).
Participant #: _2_
Gender: M F Age: _25_ Year: So
Current GPA: _3.0_ High School GPA: _2.9_
On a scale of 1 to 10, how confident are you that you will learn statistics?
1 2 3 4 5 6 7 8 9 10
Not at All Very
How many years of computer experience have you had? _2_

Advance to next slide 58
Participant #: _3_
Gender: M F Age: _31_ Year: Sn
Current GPA: _2.7_ High School GPA: _2.5_
On a scale of 1 to 10, how confident are you that you will learn statistics?
1 2 3 4 5 6 7 8 9 10
Not at All Very
How many years of computer experience have you had? _15_

Advance to next slide 59
Participant #: _4_
Gender: M F Age: _27_ Year: Ju
Current GPA: _3.9_ High School GPA: _3.6_
On a scale of 1 to 10, how confident are you that you will learn statistics?
1 2 3 4 5 6 7 8 9 10
Not at All Very
How many years of computer experience have you had? _4_

Advance to next slide 60
Participant #: _5_
Gender: M F Age: _27_ Year: So
Current GPA: _3.11_ High School GPA: _3.2_
On a scale of 1 to 10, how confident are you that you will learn statistics?
1 2 3 4 5 6 7 8 9 10
Not at All Very
How many years of computer experience have you had? _8_
Advance to next slide 61
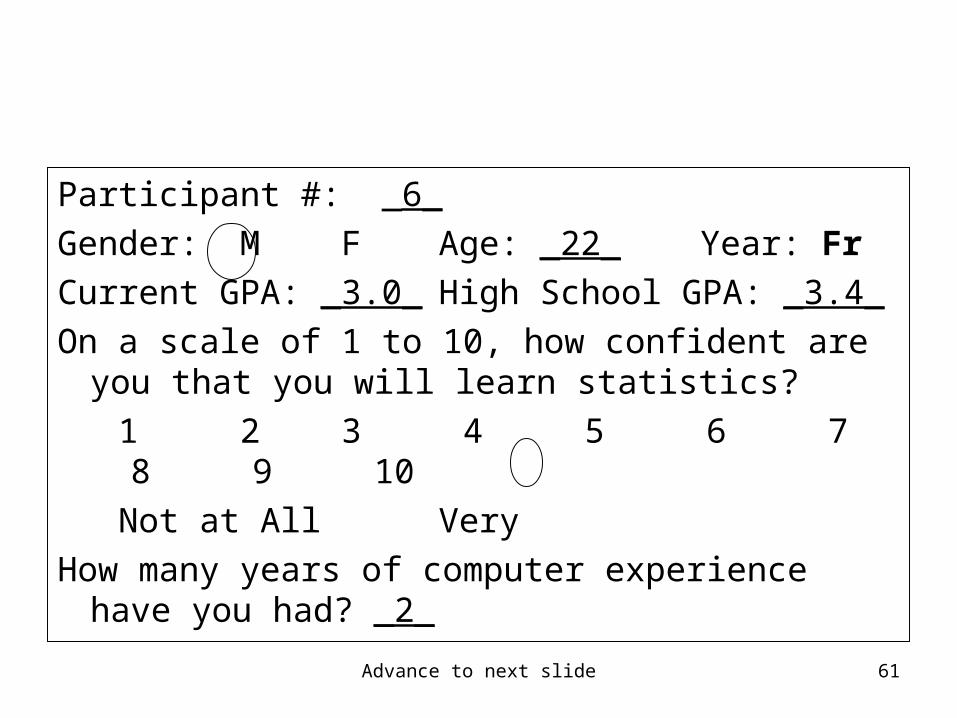
Participant #: _6_
Gender: M F Age: _22_ Year: Fr
Current GPA: _3.0_ High School GPA: _3.4_
On a scale of 1 to 10, how confident are you that you will learn statistics?
1 2 3 4 5 6 7 8 9 10
Not at All Very
How many years of computer experience have you had? _2_
Advance to next slide 62
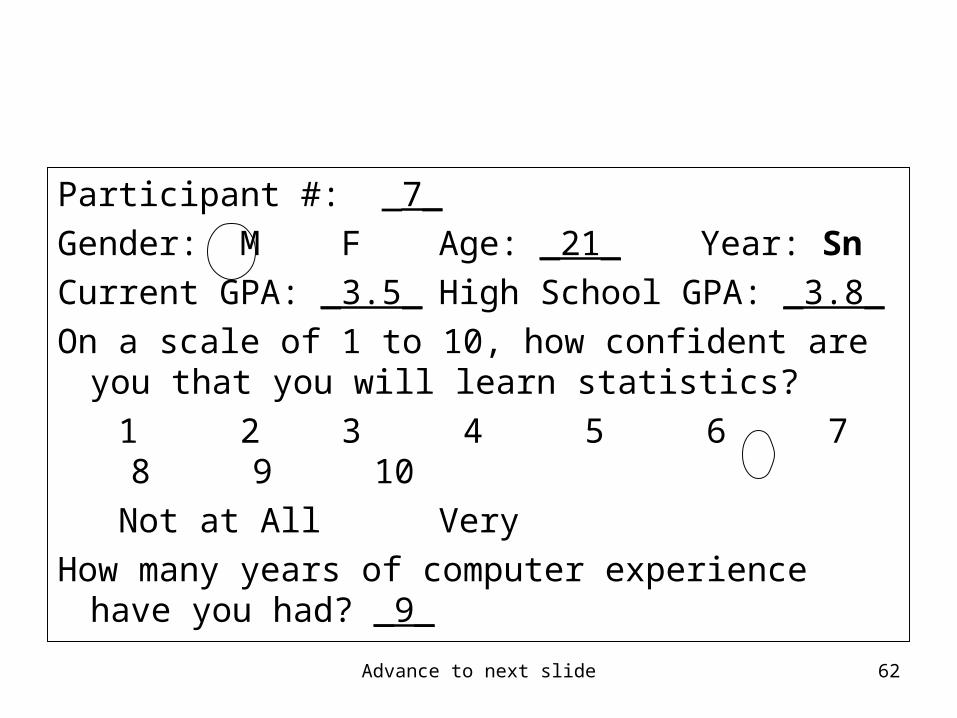
Participant #: _7_
Gender: M F Age: _21_ Year: Sn
Current GPA: _3.5_ High School GPA: _3.8_
On a scale of 1 to 10, how confident are you that you will learn statistics?
1 2 3 4 5 6 7 8 9 10
Not at All Very
How many years of computer experience have you had? _9_
Advance to next slide 63
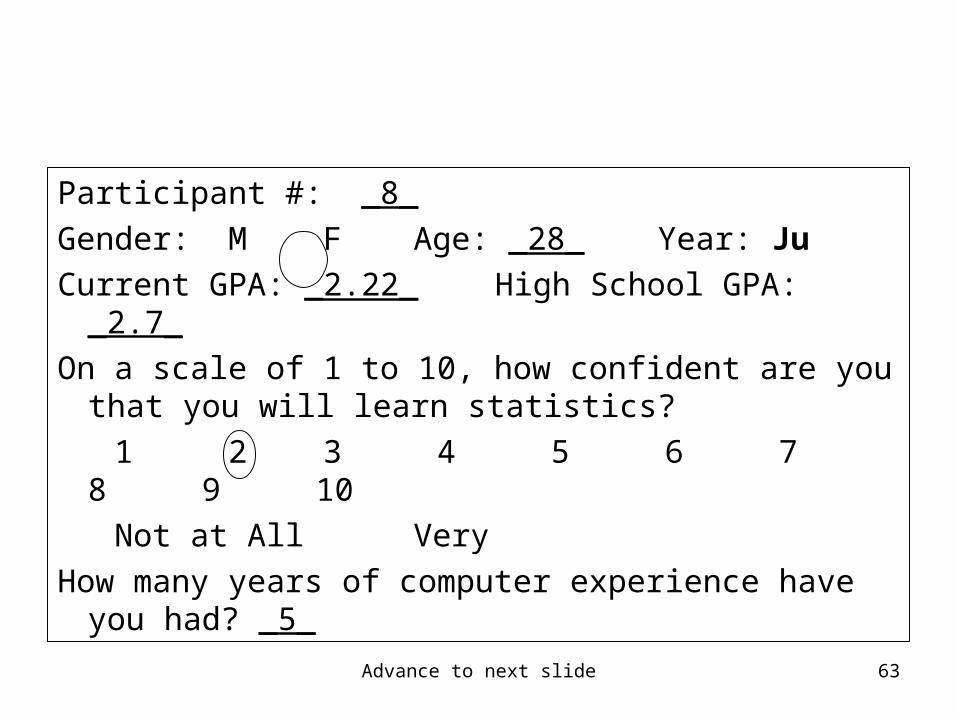
Participant #: _8_
Gender: M F Age: _28_ Year: Ju
Current GPA: _2.22_ High School GPA: _2.7_
On a scale of 1 to 10, how confident are you that you will learn statistics?
1 2 3 4 5 6 7 8 9 10
Not at All Very
How many years of computer experience have you had? _5_
Advance to next slide 64
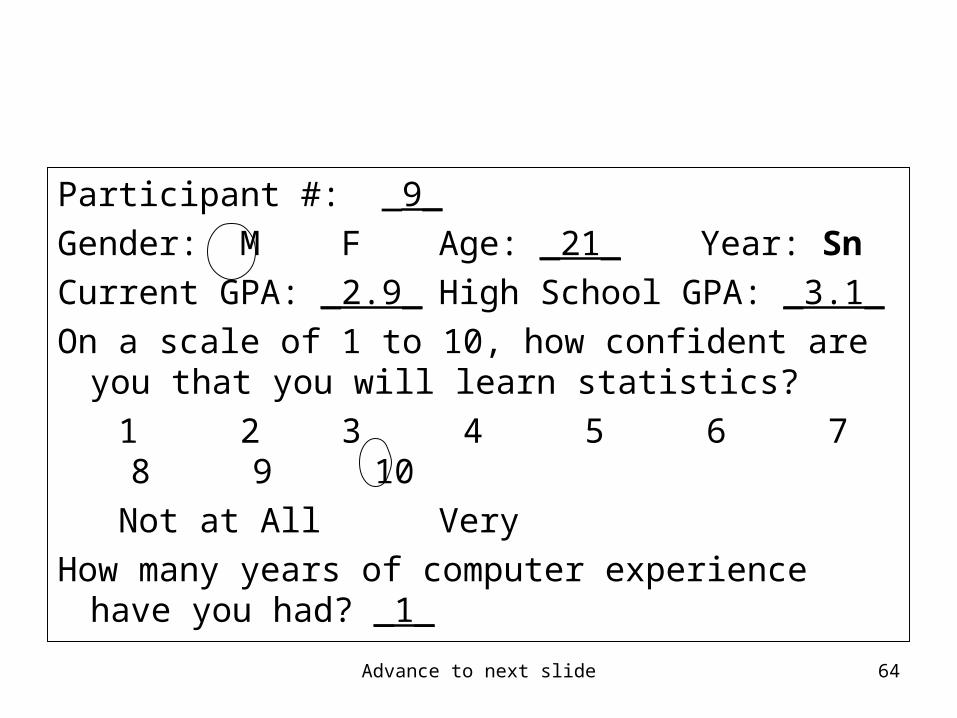
Participant #: _9_
Gender: M F Age: _21_ Year: Sn
Current GPA: _2.9_ High School GPA: _3.1_
On a scale of 1 to 10, how confident are you that you will learn statistics?
1 2 3 4 5 6 7 8 9 10
Not at All Very
How many years of computer experience have you had? _1_
Advance to next slide 65
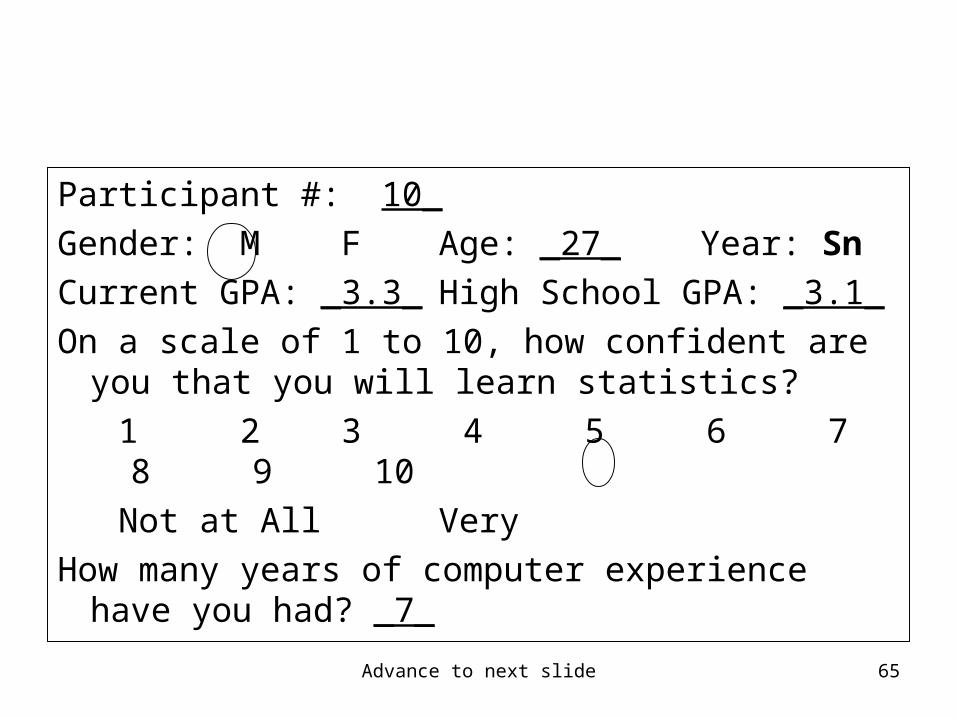
Participant #: 10_
Gender: M F Age: _27_ Year: Sn
Current GPA: _3.3_ High School GPA: _3.1_
On a scale of 1 to 10, how confident are you that you will learn statistics?
1 2 3 4 5 6 7 8 9 10
Not at All Very
How many years of computer experience have you had? _7_
Advance to next slide 66
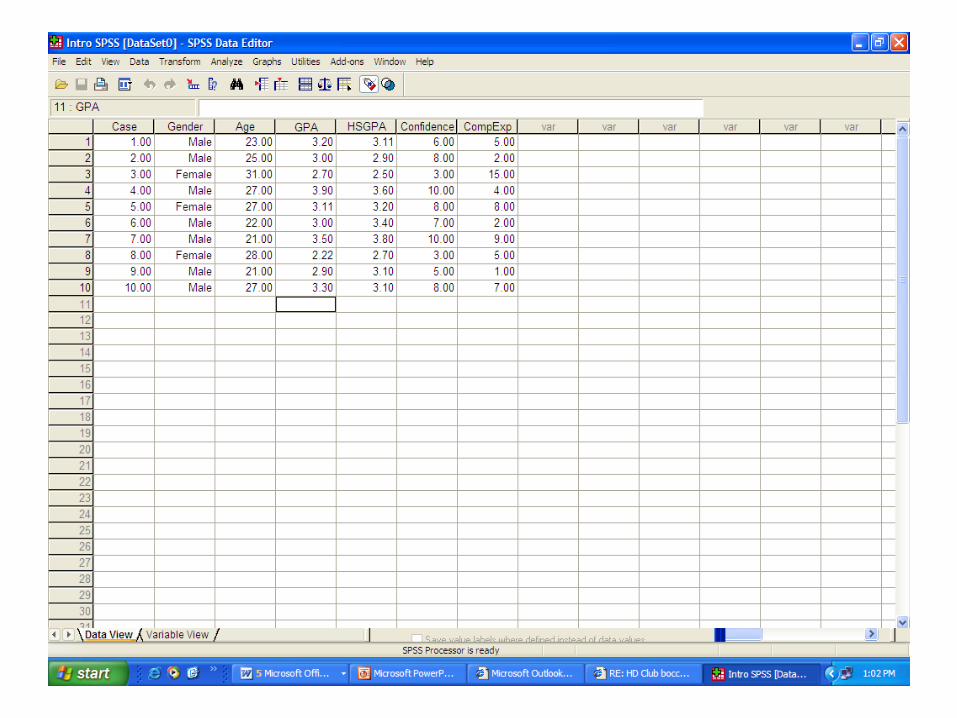
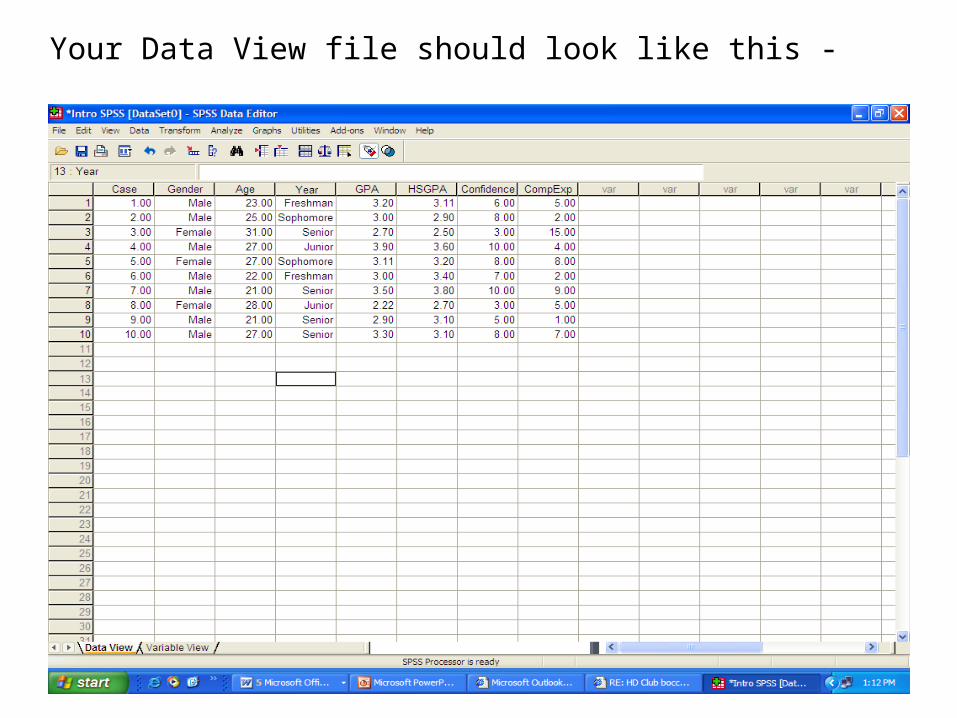
Your Data View file should look like this -
Advance to next slide 67
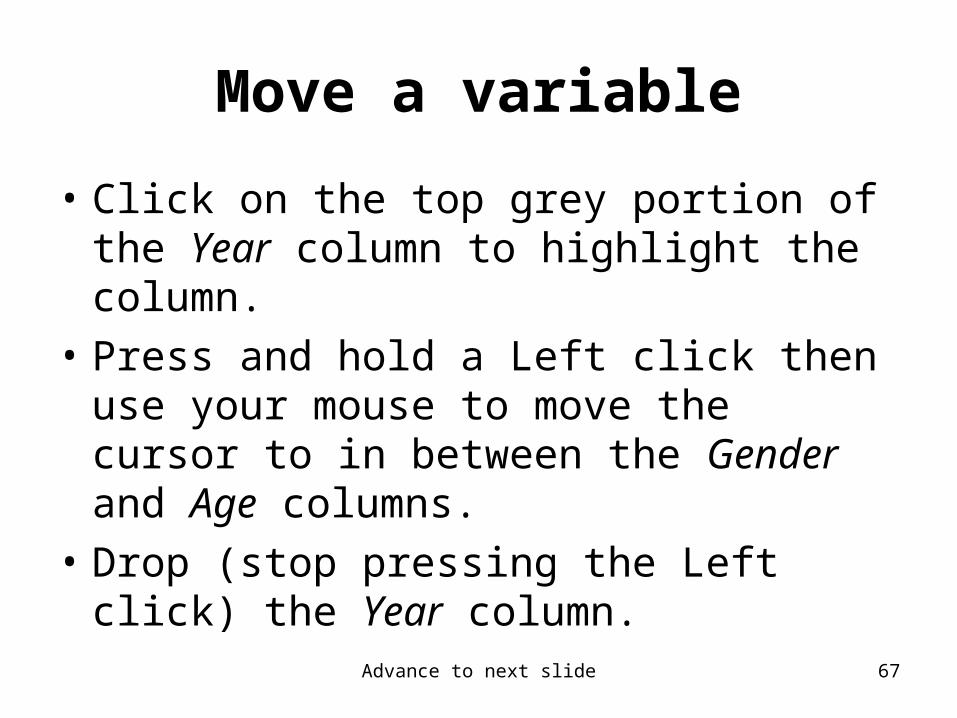
Move a variable
• Click on the top grey portion of the Year column to highlight the column.
• Press and hold a Left click then use your mouse to move the cursor to in between the Gender and Age columns.
• Drop (stop pressing the Left click) the Year column.
Advance to next slide 68
Advance to next slide 69
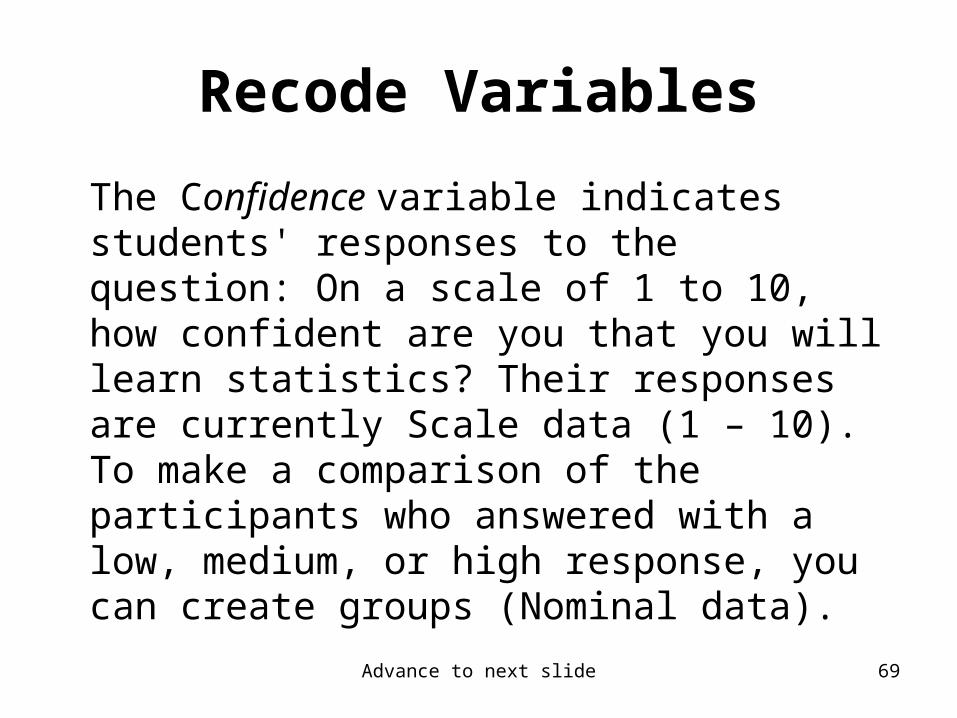
Recode Variables
The Confidence variable indicates students' responses to the question: On a scale of 1 to 10, how confident are you that you will learn statistics? Their responses are currently Scale data (1 – 10). To make a comparison of the participants who answered with a low, medium, or high response, you can create groups (Nominal data).
Advance to next slide 70
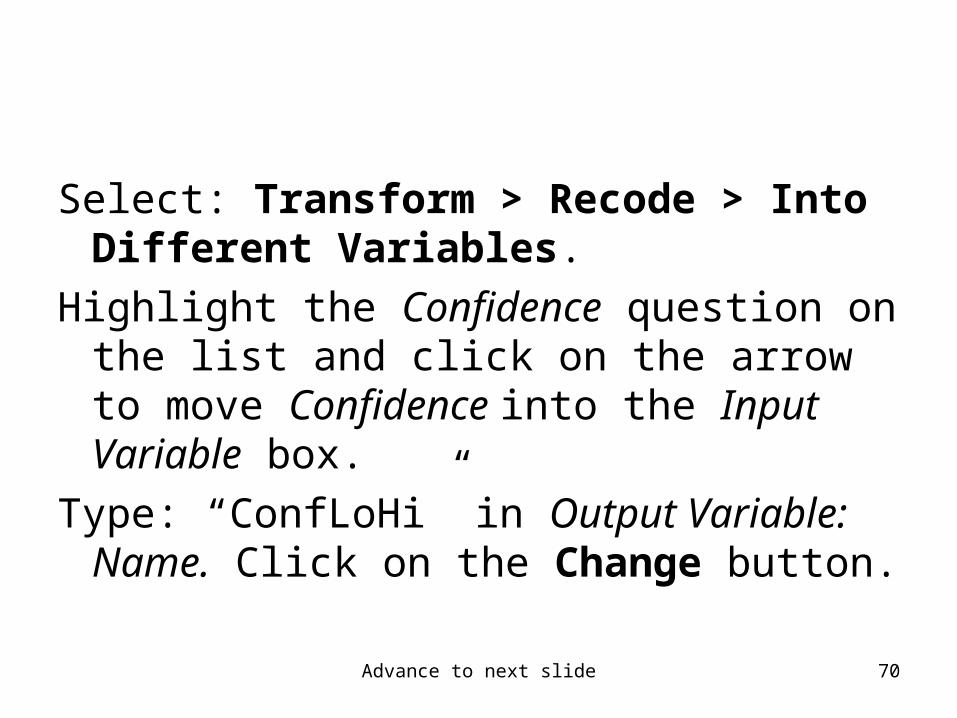
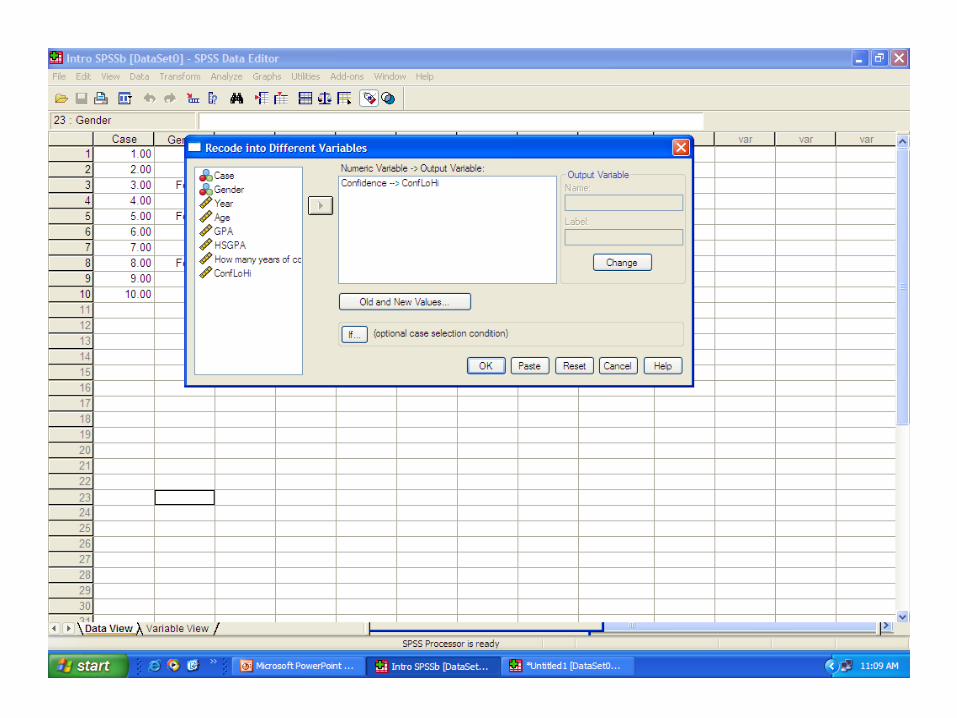
Select: Transform > Recode > Into Different Variables.
Highlight the Confidence question on the list and click on the arrow to move Confidence into the Input Variable box.
Type: “ConfLoHi” in Output Variable: Name. Click on the Change button.
Advance to next slide 71
Advance to next slide 72
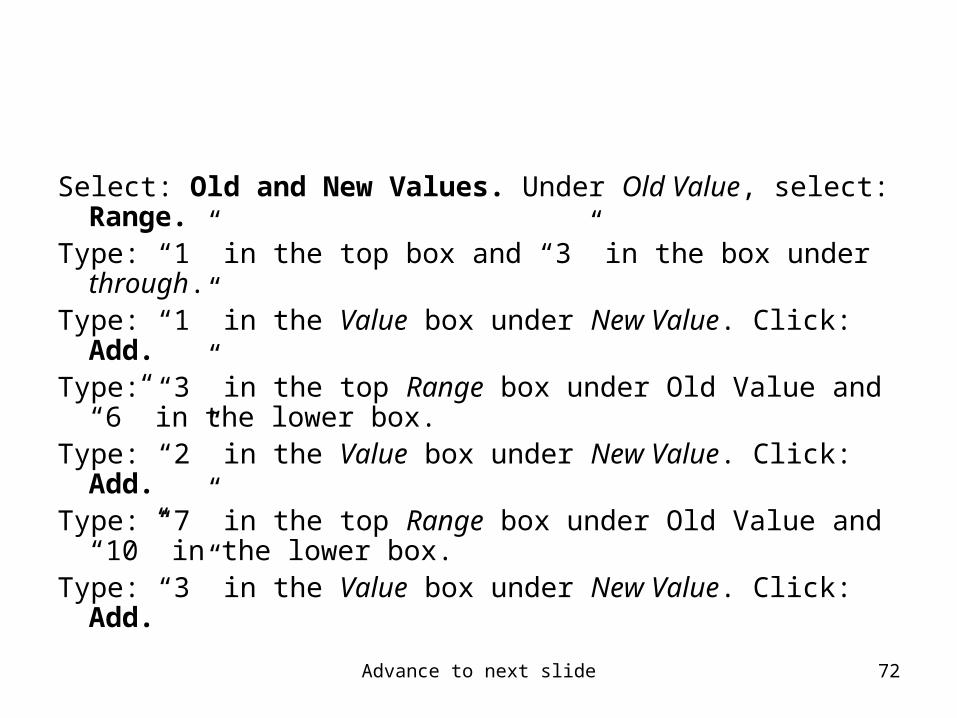
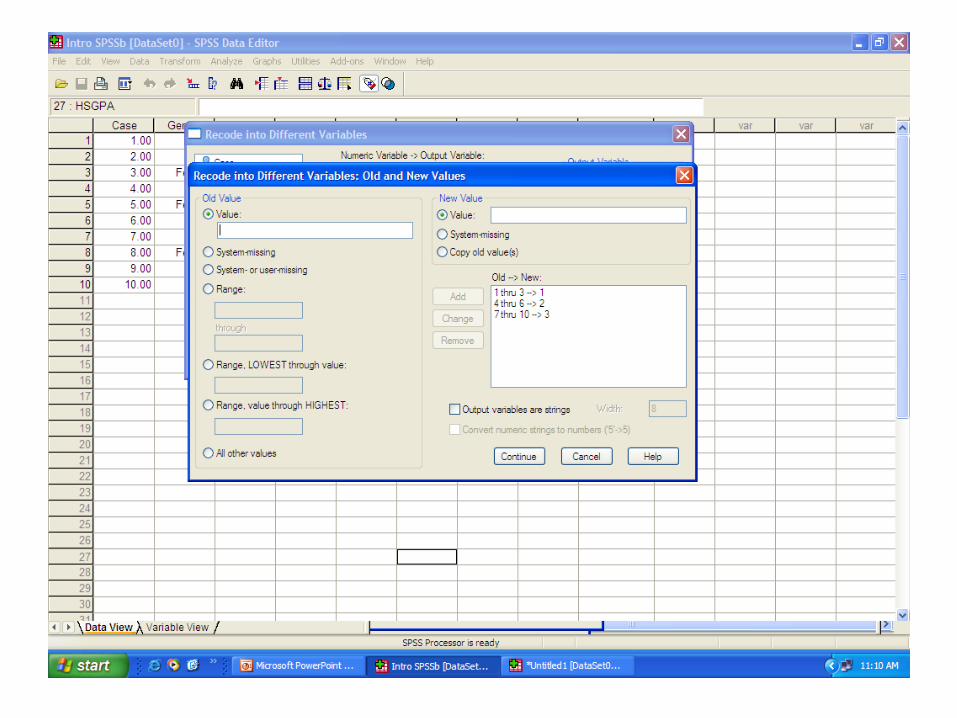
Select: Old and New Values. Under Old Value, select: Range.
Type: “1” in the top box and “3” in the box under through.Type: “1” in the Value box under New Value. Click: Add.Type: “3” in the top Range box under Old Value and “6” in
the lower box.Type: “2” in the Value box under New Value. Click: Add.Type: “7” in the top Range box under Old Value and “10” in
the lower box.Type: “3” in the Value box under New Value. Click: Add.
Advance to next slide 73
Advance to next slide 74
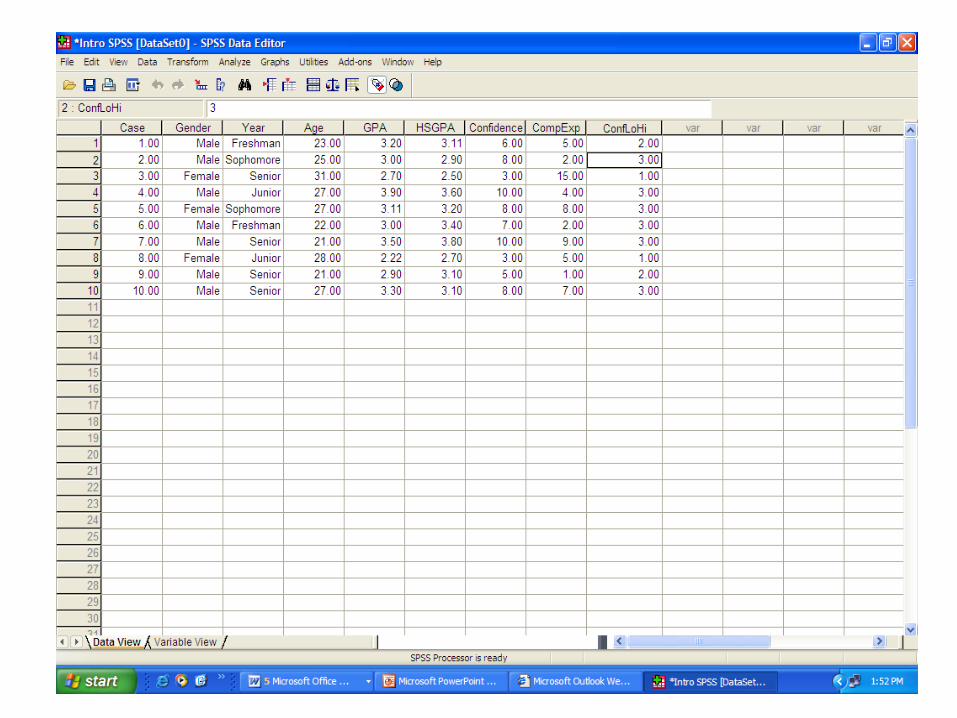
• Click on Continue > OK
• The new variable will appear at the right hand side of your current variables.
Advance to next slide 75

Advance to next slide 76
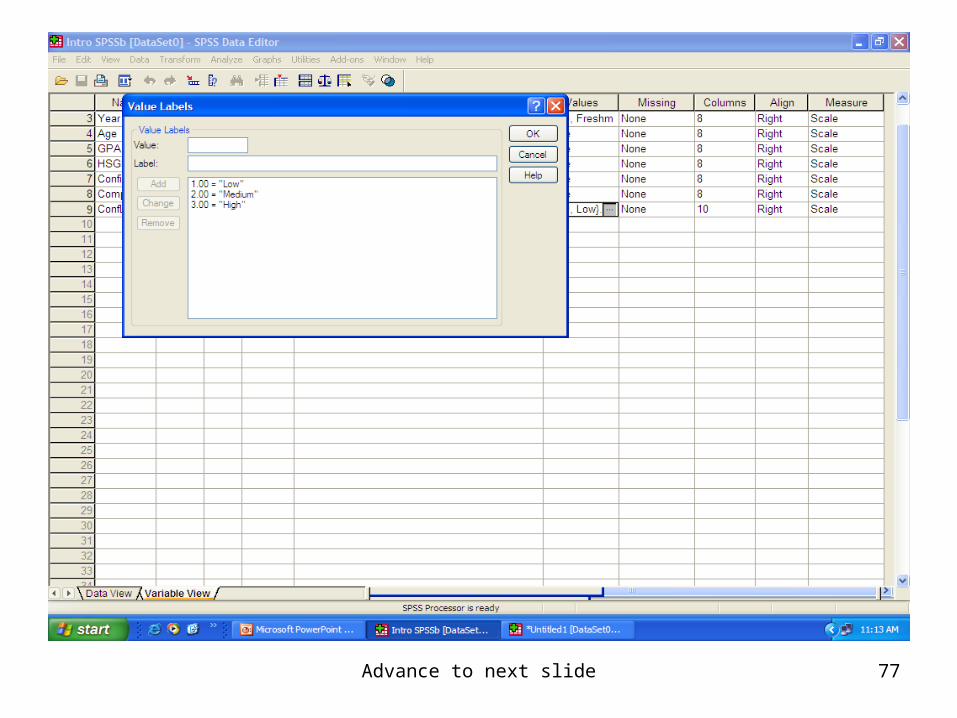
• At the bottom left of your screen, select: Variable View
• Go to line 9 (ConfLoHi) and move over to the Values column. Click on the cell and then on the 3 dots shaded in grey. Type “1” in the Value box and “Low” in the Label box. Select: Add. Type “2” and “Medium.” Select: Add. Type “3” and “High.” Select: Add
Advance to next slide 77
Advance to next slide 78
• Select: OK
Advance to next slide 79
Perform Descriptive Statistics
Section 6
Advance to next slide 80
Descriptive Statistics
• Descriptive statistics describe the status of variables. How you describe the status of variables depends on the level of measurement of the variable. Recall that SPSS uses Nominal, Ordinal, and Scale (Interval or Ratio).– Nominal and Ordinal variables, such as Gender, could
be reported as Frequency (% or number of Males and Females).
– Scale variables, such as Age, could be reported by stating the Minimum, Maximum, Mean, and Standard Deviation (Ages ranged from 18 to 64 years old with an average age of 27 (SD=9.81)).
Advance to next slide 81
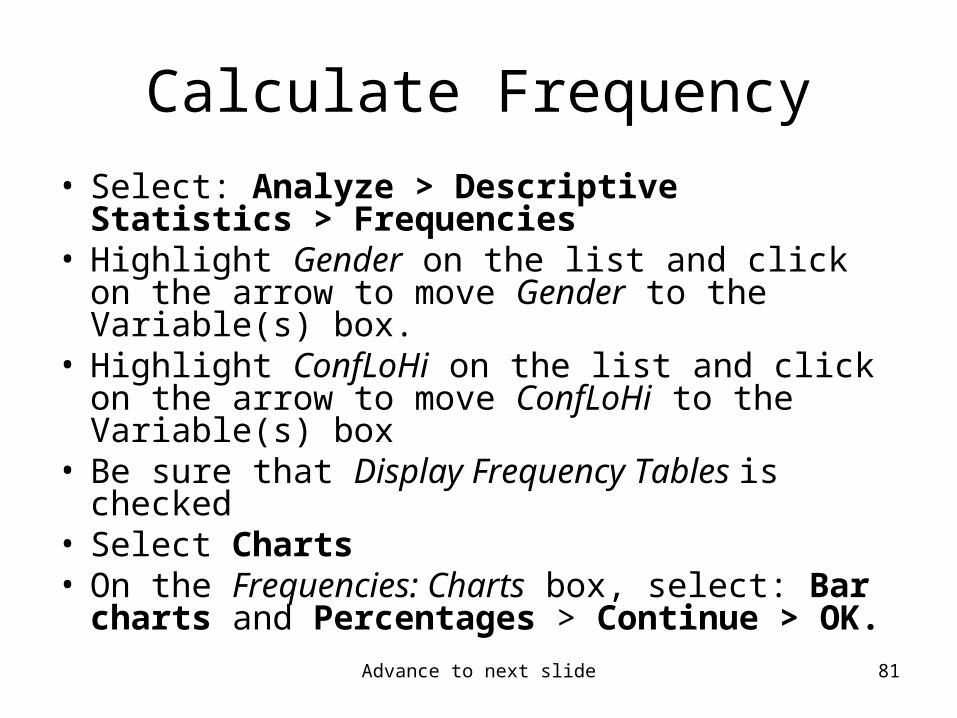
Calculate Frequency
• Select: Analyze > Descriptive Statistics > Frequencies
• Highlight Gender on the list and click on the arrow to move Gender to the Variable(s) box.
• Highlight ConfLoHi on the list and click on the arrow to move ConfLoHi to the Variable(s) box
• Be sure that Display Frequency Tables is checked
• Select Charts• On the Frequencies: Charts box, select: Bar
charts and Percentages > Continue > OK.
Advance to next slide 82
Advance to next slide 83
• Notice that a 2nd file is now open. • Each time you perform an analysis, the output
will be added to the output file. • When you save, you will need to save both your
data file (.sav) and your output file (.spo).• Go to File > Save As > (choose a location)• Type your last name in the File Name box.• Select: Save
Advance to next slide 84
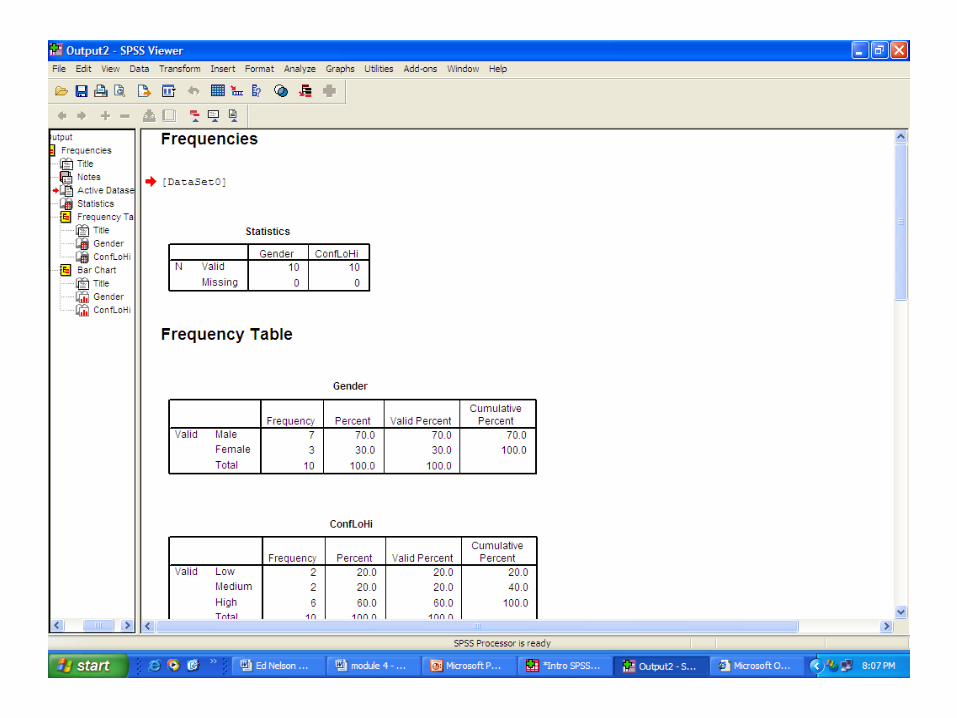
Review the Output
• Frequencies: the number of valid and missing data entries for Gender and ConfLoHi
• Frequency Table: the number of data entries for each level of Gender (how many Males and Females) and ConfLoHi (how many Low, Medium, and High) followed by Bar Charts
Advance to next slide 85
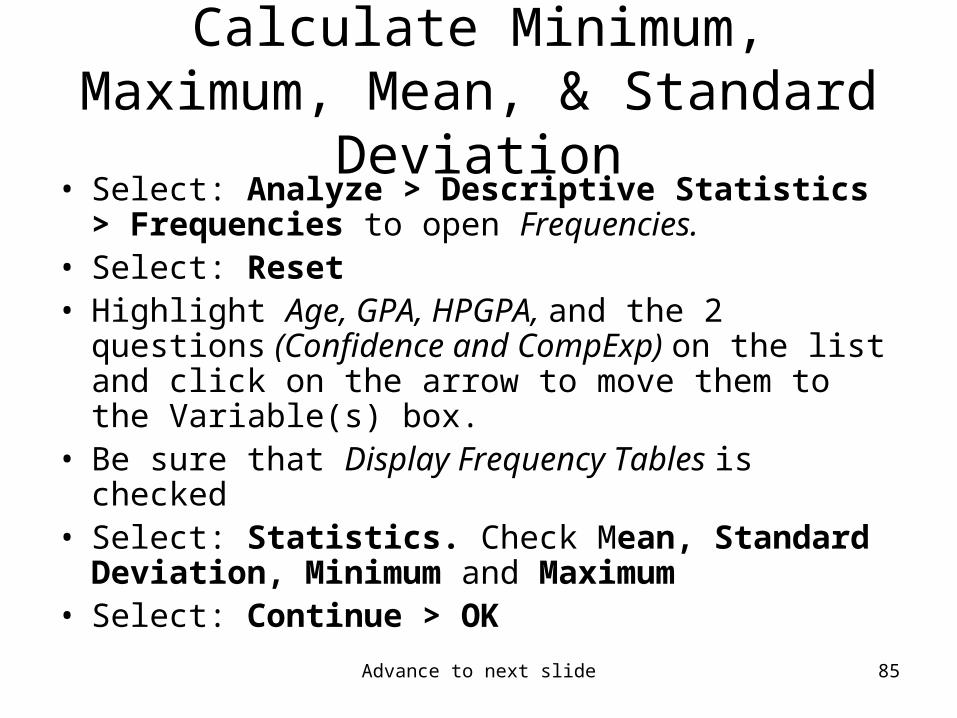
Calculate Minimum, Maximum, Mean, & Standard Deviation
• Select: Analyze > Descriptive Statistics > Frequencies to open Frequencies.
• Select: Reset • Highlight Age, GPA, HPGPA, and the 2 questions
(Confidence and CompExp) on the list and click on the arrow to move them to the Variable(s) box.
• Be sure that Display Frequency Tables is checked• Select: Statistics. Check Mean, Standard
Deviation, Minimum and Maximum• Select: Continue > OK
Advance to next slide 86
Advance to next slide 87
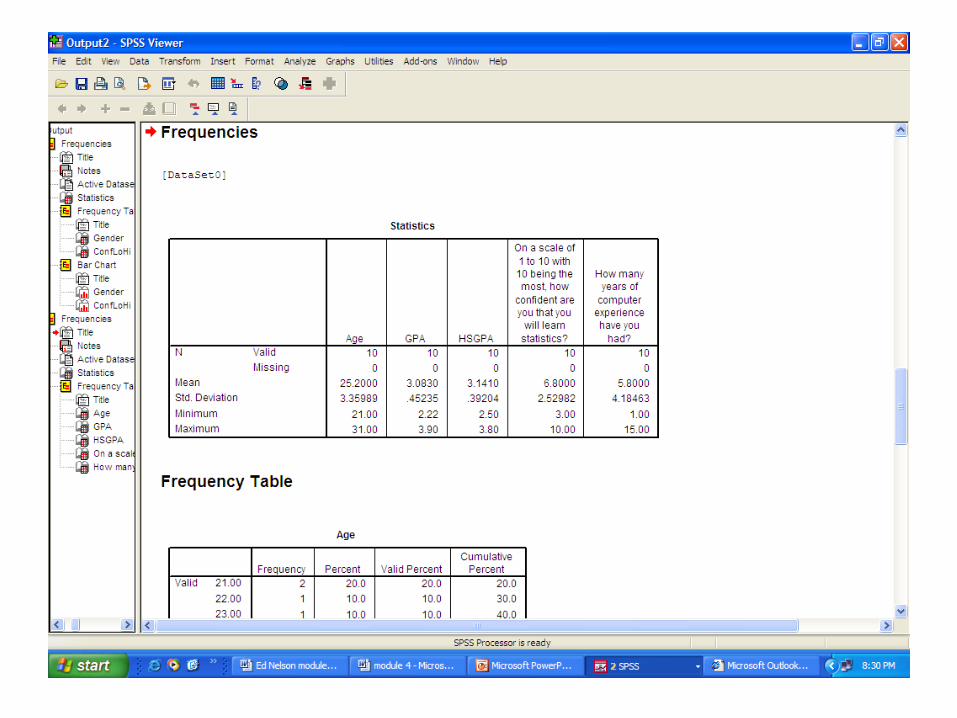
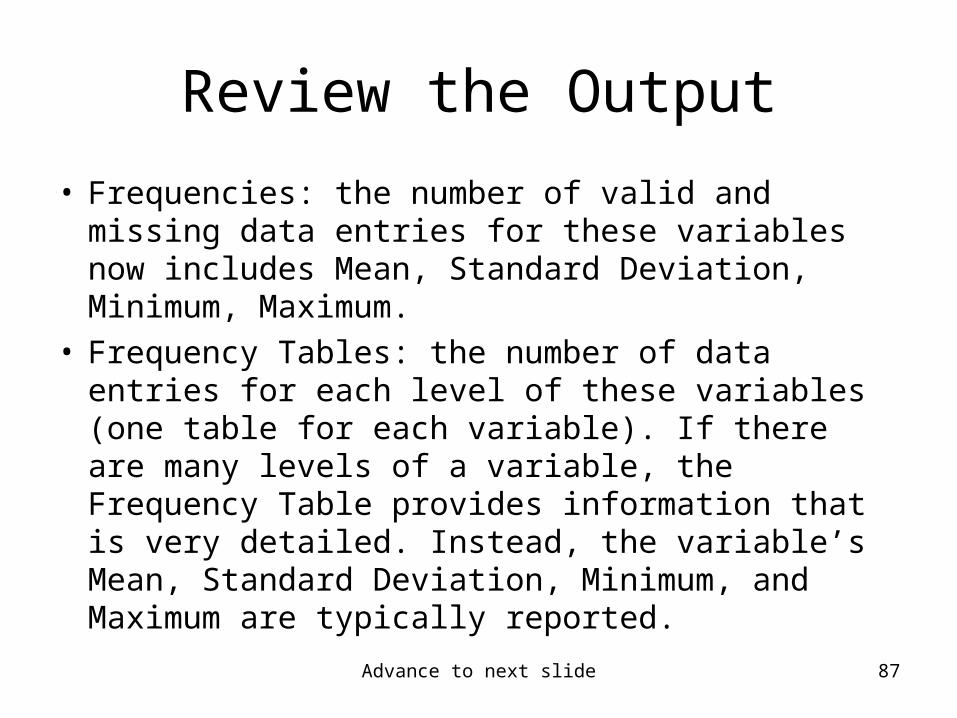
Review the Output
• Frequencies: the number of valid and missing data entries for these variables now includes Mean, Standard Deviation, Minimum, Maximum.
• Frequency Tables: the number of data entries for each level of these variables (one table for each variable). If there are many levels of a variable, the Frequency Table provides information that is very detailed. Instead, the variable’s Mean, Standard Deviation, Minimum, and Maximum are typically reported.
Advance to next slide 88
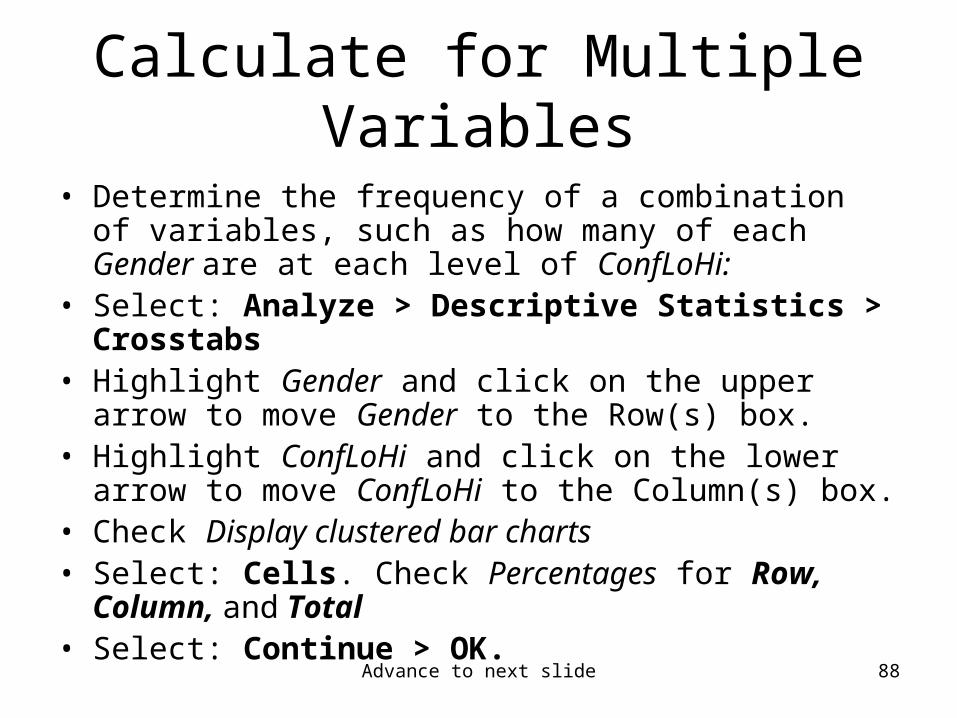
Calculate for Multiple Variables
• Determine the frequency of a combination of variables, such as how many of each Gender are at each level of ConfLoHi:
• Select: Analyze > Descriptive Statistics > Crosstabs • Highlight Gender and click on the upper arrow to move
Gender to the Row(s) box.• Highlight ConfLoHi and click on the lower arrow to move
ConfLoHi to the Column(s) box.• Check Display clustered bar charts • Select: Cells. Check Percentages for Row, Column,
and Total• Select: Continue > OK.
Advance to next slide 89
Advance to next slide 90
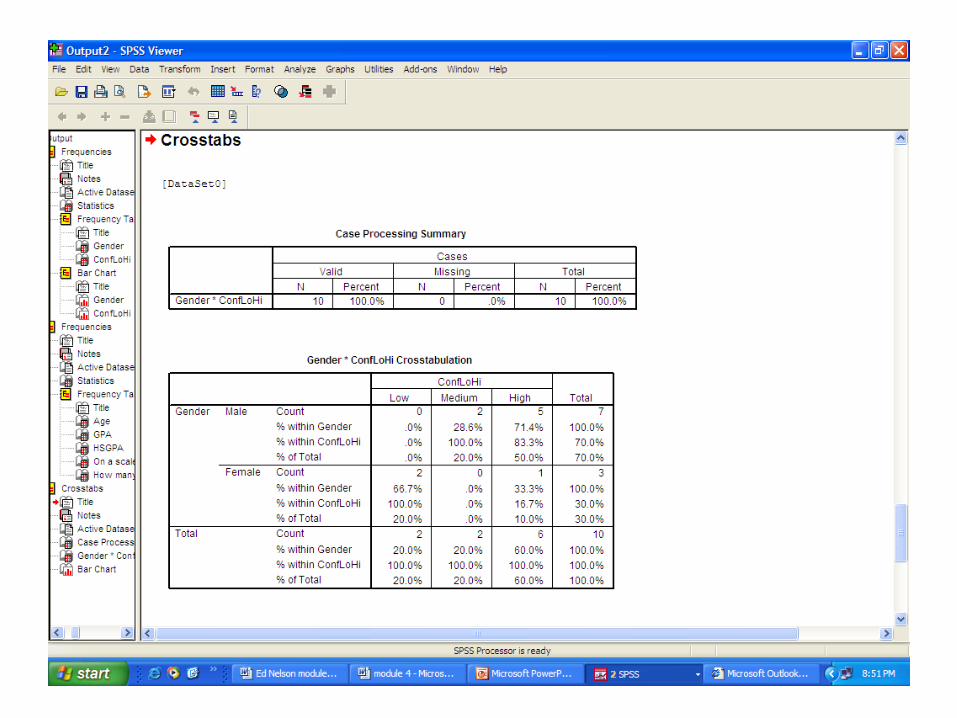
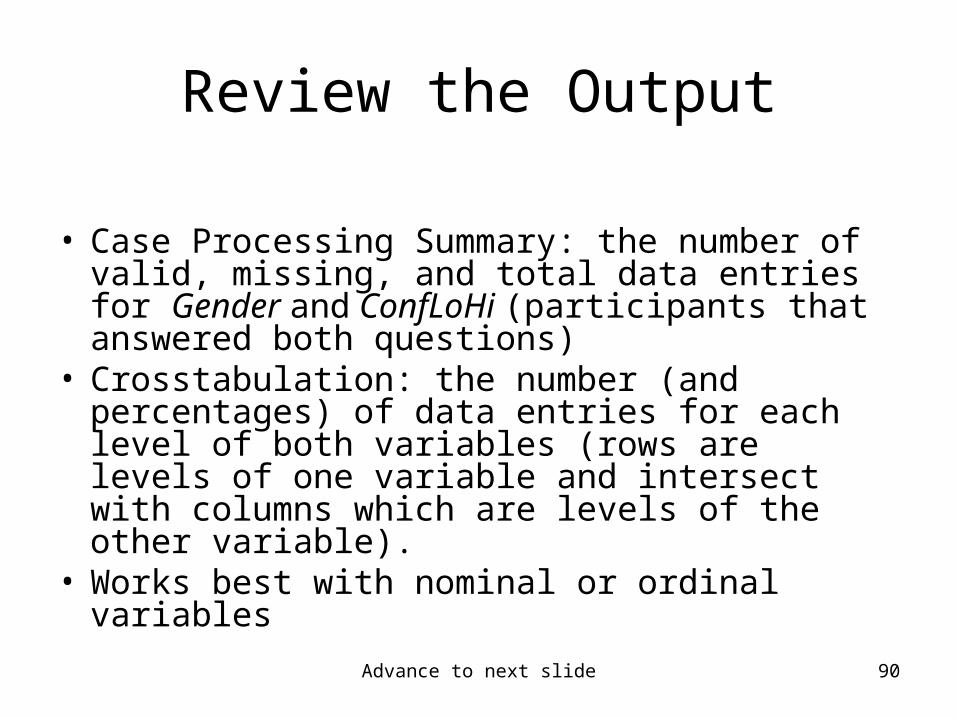
Review the Output
• Case Processing Summary: the number of valid, missing, and total data entries for Gender and ConfLoHi (participants that answered both questions)
• Crosstabulation: the number (and percentages) of data entries for each level of both variables (rows are levels of one variable and intersect with columns which are levels of the other variable).
• Works best with nominal or ordinal variables

Advance to next slide 91
Conduct Simple Correlations
Section 7
Advance to next slide 92
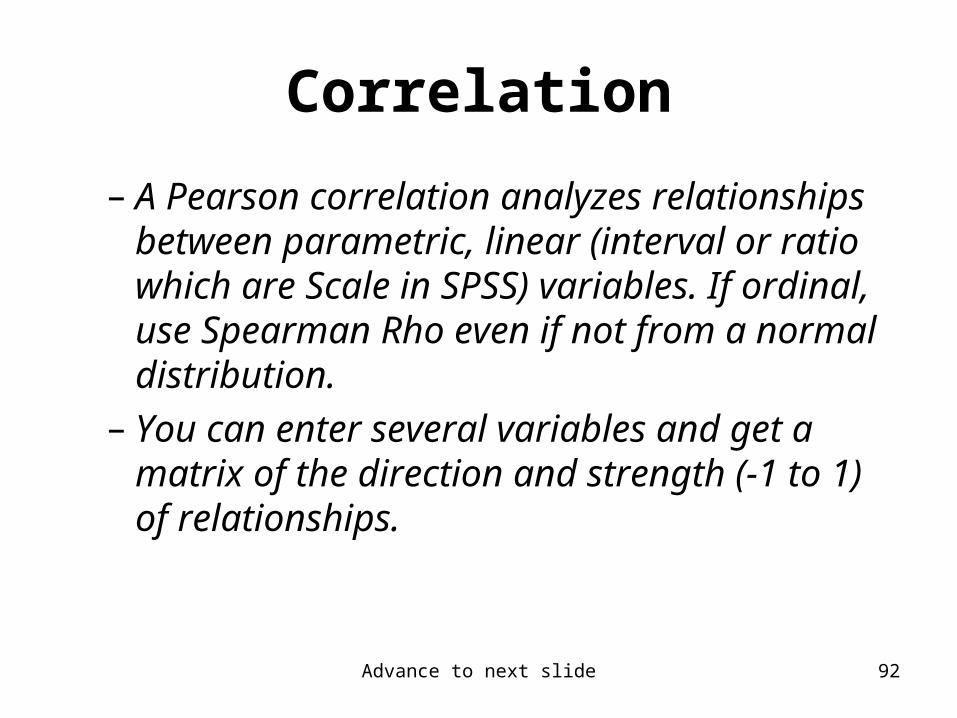
Correlation
– A Pearson correlation analyzes relationships between parametric, linear (interval or ratio which are Scale in SPSS) variables. If ordinal, use Spearman Rho even if not from a normal distribution.
– You can enter several variables and get a matrix of the direction and strength (-1 to 1) of relationships.
Advance to next slide 93
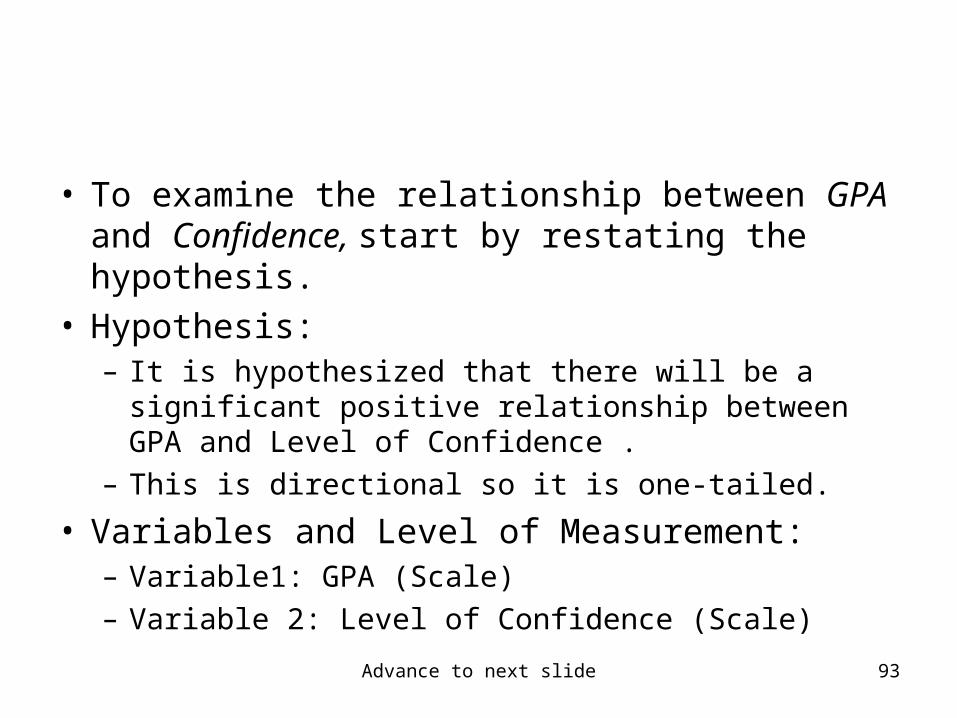
• To examine the relationship between GPA and Confidence, start by restating the hypothesis.
• Hypothesis: – It is hypothesized that there will be a significant
positive relationship between GPA and Level of Confidence .
– This is directional so it is one-tailed.
• Variables and Level of Measurement: – Variable1: GPA (Scale)– Variable 2: Level of Confidence (Scale)
Advance to next slide 94
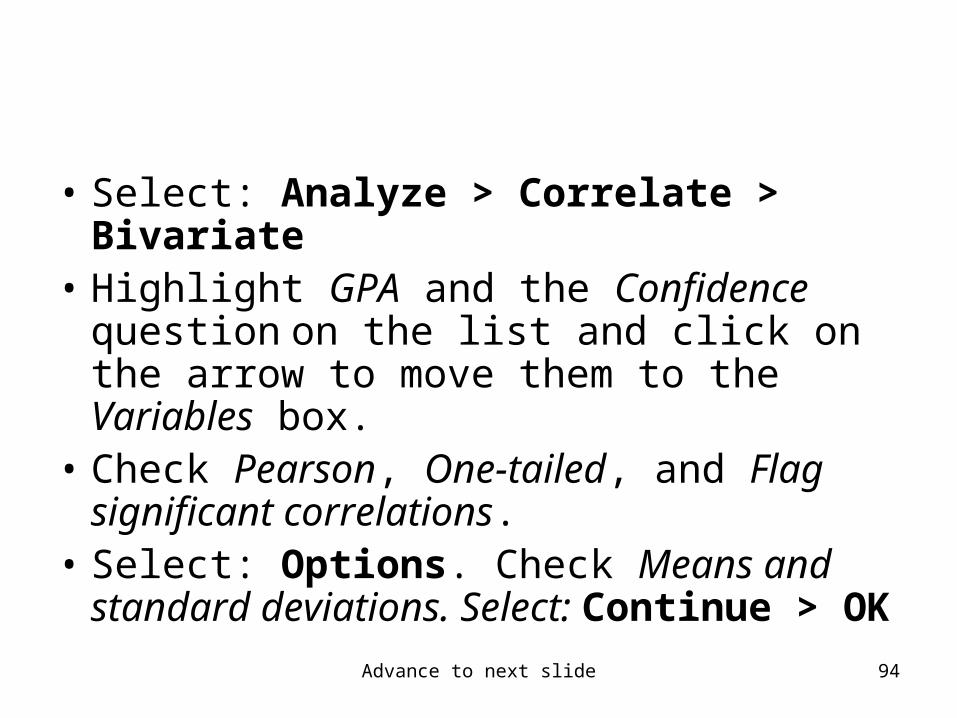
• Select: Analyze > Correlate > Bivariate• Highlight GPA and the Confidence
question on the list and click on the arrow to move them to the Variables box.
• Check Pearson, One-tailed, and Flag significant correlations.
• Select: Options. Check Means and standard deviations. Select: Continue > OK
Advance to next slide 95
Advance to next slide 96
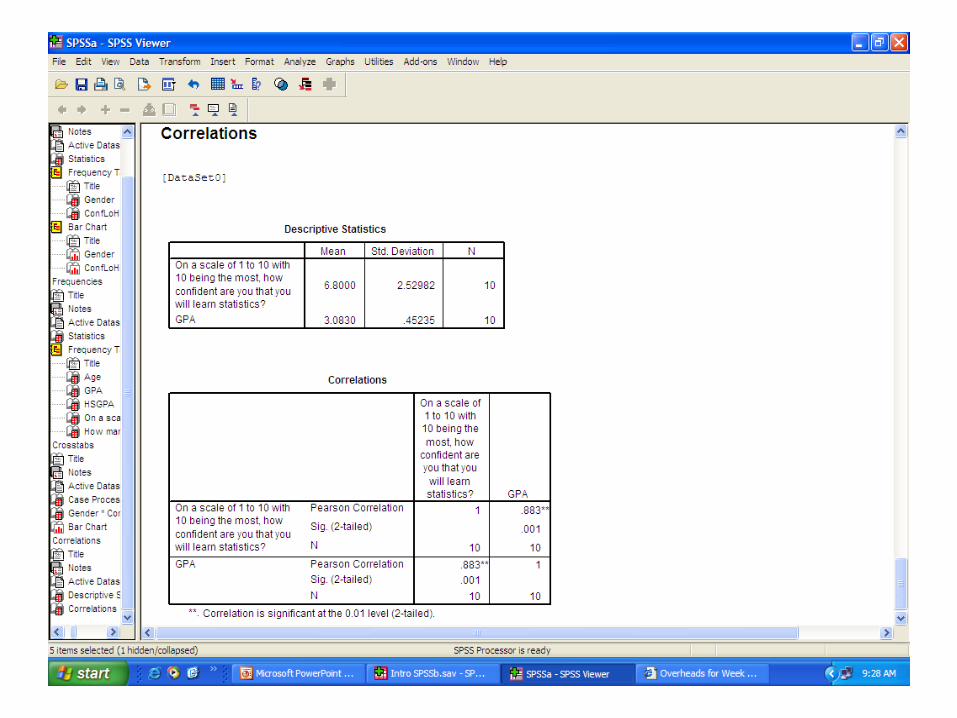
Review Output
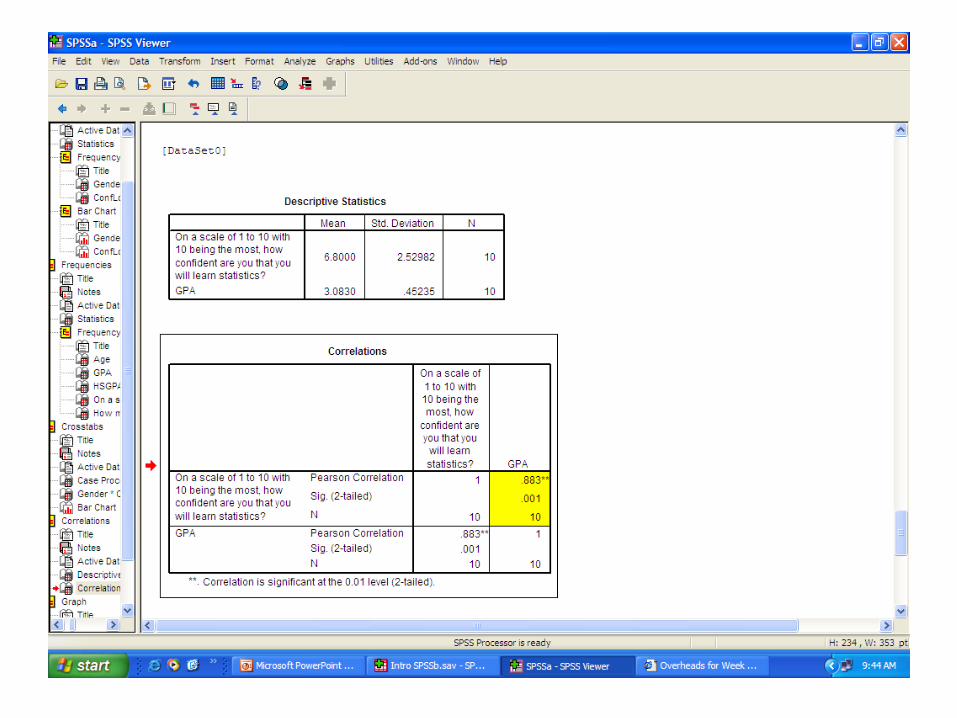
• Descriptive Statistics: Here are the Means, Standard Deviations, and N for GPA and Level of Confidence.
• Correlations: The variables are listed across the top and down the side so that they intersect within the grid. Each intersection box has the value of the correlation, then the significance level, then the N.
Advance to next slide 97
• Find the numbers in the statement below on the output at the intersection of GPA and Level of Confidence (the question about confidence): – There was a positive correlation [r(10)= .883,
p < .01] between GPA and Level of Confidence.
Advance to next slide 98

Advance to next slide 99
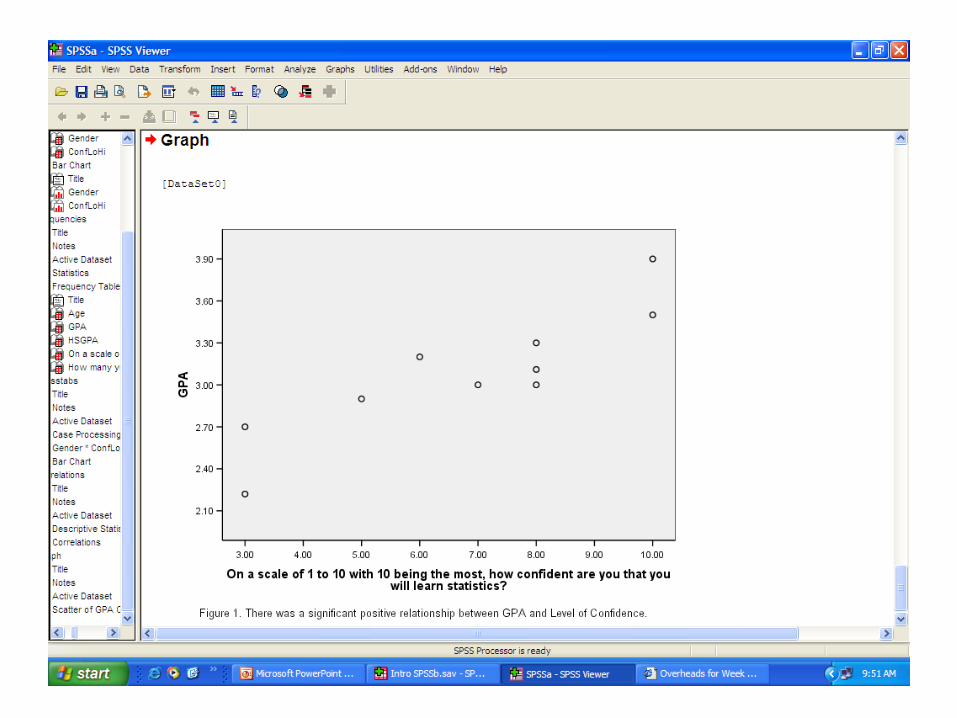
Scatter plot
• A scatter plot is a common method of displaying the results of a bivariate correlation. You can add a third variable by entering it at set markers by.
• One variable is represented on each axis and the dots represent the intersection of participants’ scores on the two variables.
Advance to next slide 100
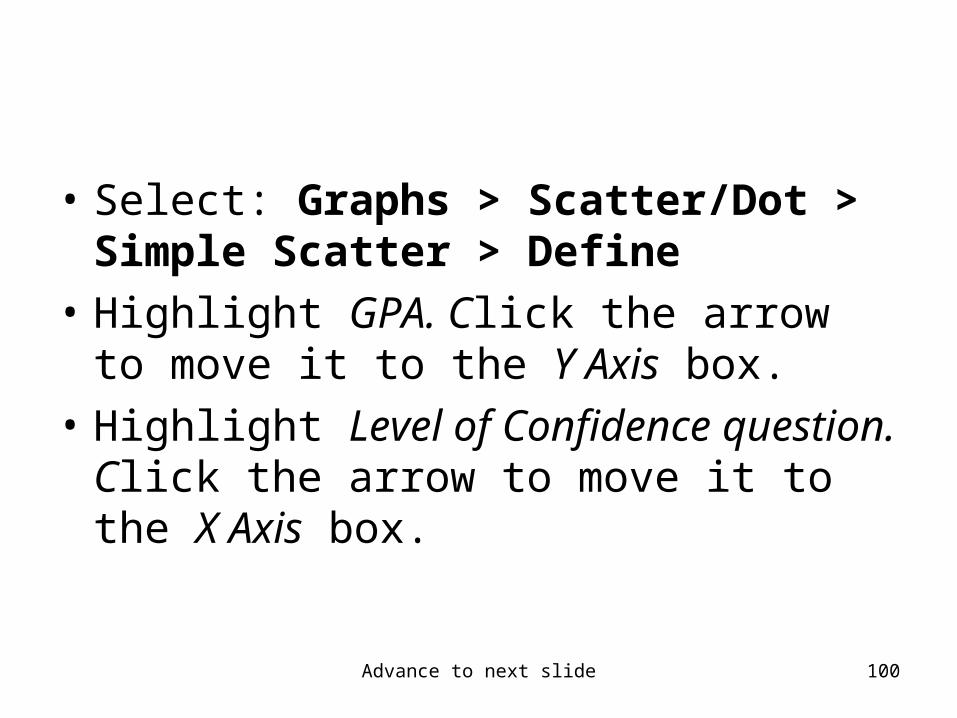
• Select: Graphs > Scatter/Dot > Simple Scatter > Define
• Highlight GPA. Click the arrow to move it to the Y Axis box.
• Highlight Level of Confidence question. Click the arrow to move it to the X Axis box.
Advance to next slide 101
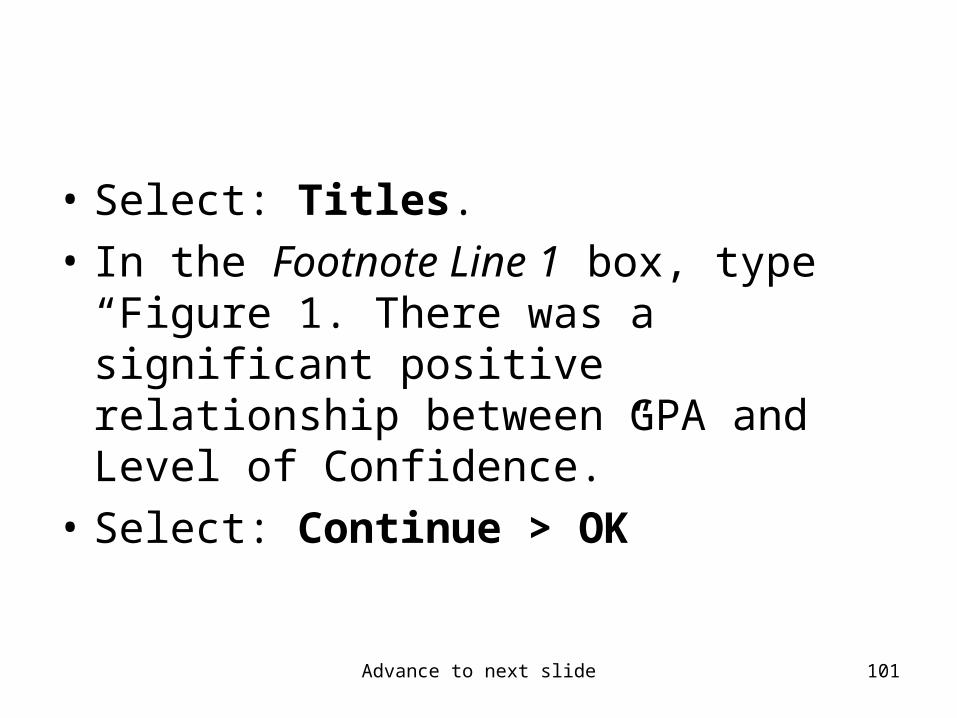
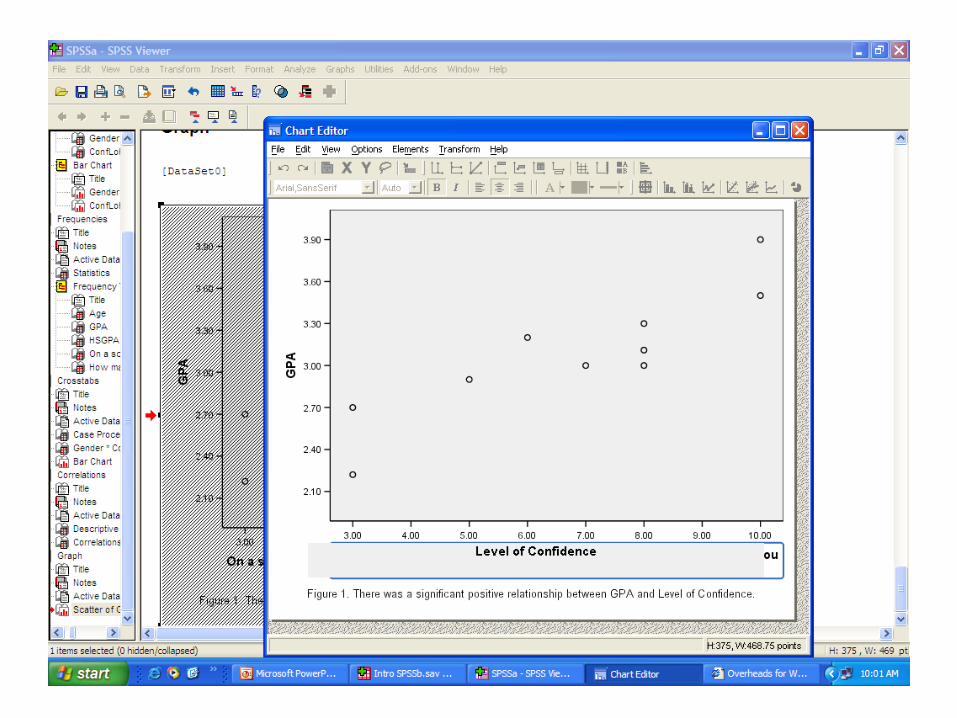
• Select: Titles.
• In the Footnote Line 1 box, type “Figure 1. There was a significant positive relationship between GPA and Level of Confidence.”
• Select: Continue > OK
Advance to next slide 102
Advance to next slide 103
• SPSS Graphs are easily edited and copy/pasted into your document. You can change the Axis labels, colors, sizes, etc. in the Chart Editor.
• Place your curser over the chart and double-left click. Now double click on the X Axis label (On a scale of 1 to 10 with 10 being the most, how confident are you that you will learn statistics?). A the blue box appears around the text. (Close the Properties box that pops up.)
• You can now change the label by deleting the old label and typing: “Level of Confidence”
Advance to next slide 104
Advance to next slide 105
• Click outside the box onto the SPSS Viewer to close the Chart Editor and the change will be made to your graph.
• If you wanted to use your graph in a document, you would just right click then Copy / Paste it into your document.
Advance to next slide 106
• Good Job!
• You have almost completed the module.
• Just 2 more steps.

Advance to next slide 107
Post Test
Section 8
Advance to next slide 108
• Step 1 -
• Print the output file (SPSS Viewer)
• Select: File > Print > OK
Advance to next slide 109
• Step 2 -– Get out a blank sheet of paper and answer
the questions on the next page.– If you find that they are difficult for you to
answer, you should go back through the module, review your statistics text, or consult with your professor.
Advance to next slide 110
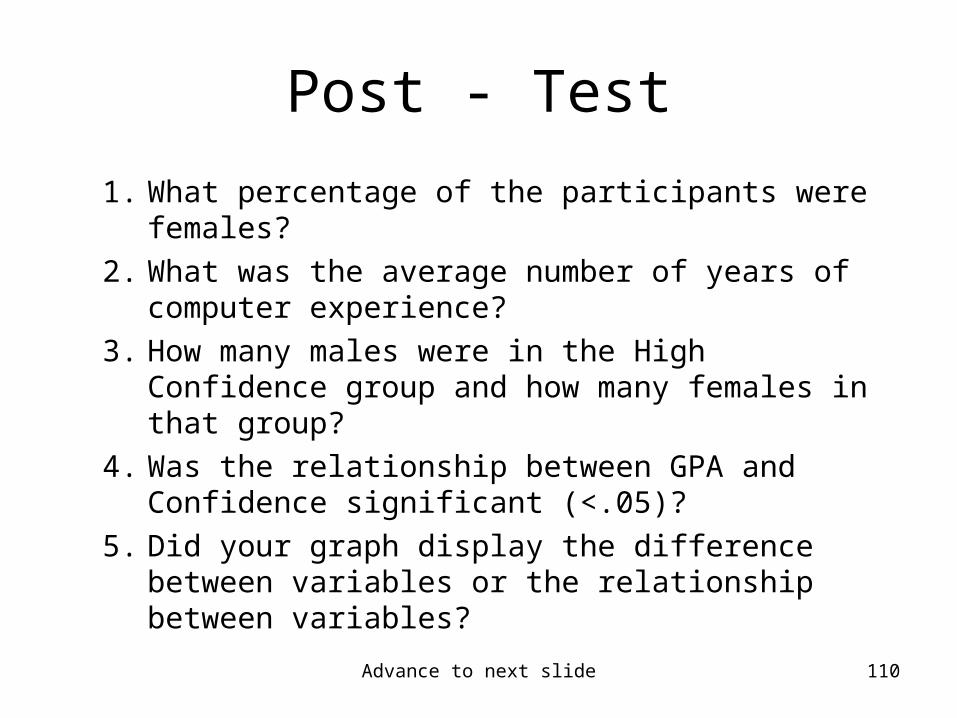
Post - Test
1. What percentage of the participants were females?
2. What was the average number of years of computer experience?
3. How many males were in the High Confidence group and how many females in that group?
4. Was the relationship between GPA and Confidence significant (<.05)?
5. Did your graph display the difference between variables or the relationship between variables?
Advance to next slide 111
Congratulations
• You have now – set-up a data entry page– added, moved, and recoded variables– performed descriptive analysis on nominal
and scale variables– conducted a Pearson correlation and created
a scatter plot for the results
Advance to next slide 112
Thank You
• Your comments are appreciated and may be directed to:
• Elizabeth Bigham, Ph.D.• California State University San Marcos• 333 S. Twin Oaks Valley Rd.• San Marcos, CA 92096• [email protected]