advanced burner reactor preliminary nepa data · pdf fileadvanced burner reactor preliminary...
TRANSCRIPT

Advanced Burner Reactor Preliminary NEPA Data Study
ANL-AFCI-183
Nuclear Engineering Division

Availability of This ReportThis report is available, at no cost, at http://www.osti.gov/bridge. It is also available on paper to the U.S. Department of Energy and its contractors, for a processing fee, from:
U.S. Department of Energy
OfficeofScientificandTechnicalInformation
P.O. Box 62
Oak Ridge, TN 37831-0062
phone (865) 576-8401
fax (865) 576-5728
Disclaimer
This report was prepared as an account of work sponsored by an agency of the United States Government. Neither the United States
Governmentnoranyagencythereof,norUChicagoArgonne,LLC,noranyoftheiremployeesorofficers,makesanywarranty,express
or implied, or assumes any legal liability or responsibility for the accuracy, completeness, or usefulness of any information, apparatus,
product,orprocessdisclosed,orrepresentsthatitsusewouldnotinfringeprivatelyownedrights.Referencehereintoanyspecific
commercial product, process, or service by trade name, trademark, manufacturer, or otherwise, does not necessarily constitute or imply
its endorsement, recommendation, or favoring by the United States Government or any agency thereof. The views and opinions of
documentauthorsexpressedhereindonotnecessarilystateorreflectthoseoftheUnitedStatesGovernmentoranyagencythereof,
Argonne National Laboratory, or UChicago Argonne, LLC.
About Argonne National Laboratory Argonne is a U.S. Department of Energy laboratory managed by UChicago Argonne, LLC under contract DE-AC02-06CH11357. The Laboratory’s main facility is outside Chicago, at 9700 South Cass Avenue, Argonne, Illinois 60439. For information about Argonne, see www.anl.gov.

A U.S. Department of Energy laboratory managed by UChicago Argonne, LLC
Advanced Burner Reactor Preliminary NEPA Data Study
ANL-AFCI-183
by L. L. Briggs, J. E. Cahalan, L. W. Deitrich, T. H. Fanning, C. Grandy, R. Kellogg, T. K. Kim, and W. S. YangNuclear Engineering Division, Argonne National Laboratory September 21, 2007 work sponsored by U. S. Department of Energy, Office of Nuclear Energy, Science and Technology


ANL-AFCI-183, Rev. 0.5 Preliminary NEPA Data Study
Advanced Burner Reactor Facility i September 21, 2007
Table of Contents
1. Introduction.......................................................................................................... 1 2. ABR Safety Design Approach ............................................................................. 2 2.1. Sodium Coolant ................................................................................................... 2 2.2. Defense in Depth.................................................................................................. 2 2.3. Inherent and Passive Safety ................................................................................. 3 2.4. Sodium-Cooled Reactor Operating Experience................................................... 5 2.5. Inherent Passive Safety in the ABR..................................................................... 5 3. ABR Operations and Requirements..................................................................... 6 3.1 Fissile Material Inventory .................................................................................. 10 3.2 Fuel Handling..................................................................................................... 10 3.3 Facility Requirements ........................................................................................ 13 3.3.1 Industrial Security and Safeguards .................................................................... 13 3.3.2 Buildings and Structures .................................................................................... 13 3.3.2.1 Reactor Building ................................................................................................ 14 3.3.2.2 Balance of Plant Building .................................................................................. 17 3.3.2.3 Control Room and Personnel Building .............................................................. 17 3.3.2.4 Radwaste/Maintenance Building ....................................................................... 17 3.3.2.5 Security Gate House .......................................................................................... 18 3.3.2.6 Emergency Generator Buildings........................................................................ 18 3.3.2.7 Balance of Plant Services Building.................................................................... 18 3.3.2.8 Lift Station Building and Wastewater Treatment Plant Building...................... 18 3.3.2.9 Fuel Handling Facility Building ........................................................................ 19 3.3.2.10 Fuel Storage Facility Building ........................................................................... 19 3.3.2.11 Cooling Towers.................................................................................................. 19 3.3.3 Radioactive and Hazardous Wastes from Operations........................................ 20 3.3.4 Non-hazardous Operations Wastes .................................................................... 21 3.3.5 Annual Operations Data..................................................................................... 21 4. Summary of Nuclear Materials, Wastes, Effluents, Emissions, and Utilities
during Operations and Construction .................................................................. 25 4.1 High-level Waste/Spent Nuclear Fuel ............................................................... 25 4.2 Effluents from Operations.................................................................................. 25 4.3 Air Emissions from Operations ......................................................................... 27 4.3.1 Radionuclide Emissions..................................................................................... 27 4.3.2 Hazardous Air Pollutants ................................................................................... 27 4.4 Transportation .................................................................................................... 28 4.4.1 Transportation Data for Shipment of Wastes..................................................... 28 4.4.2 Physics Data for Transportation of Spent Startup Driver Fuel .......................... 28 4.5 Construction....................................................................................................... 35 4.5.1 General Construction Requirements .................................................................. 35 4.5.2 Construction Land Requirements ...................................................................... 35 4.5.3 Construction Wastes .......................................................................................... 36 References......................................................................................................................... 38 Appendix A: Bases for Data Presented............................................................................ 41

ANL-AFCI-183, Rev. 0.5 Preliminary NEPA Data Study
Advanced Burner Reactor Facility ii September 21, 2007
Appendix B: ABR Construction Wastes Spreadsheet Tables.......................................... 70 Appendix C: ABR Plant Steel Requirements Spreadsheet Table.................................... 75

ANL-AFCI-183, Rev. 0.5 Preliminary NEPA Data Study
Advanced Burner Reactor Facility 1 September 21, 2007
1. Introduction
The Global Nuclear Energy Partnership (GNEP) is a new nuclear fuel cycle paradigm with the goals of expanding the use of nuclear power both domestically and internationally, addressing nuclear waste management concerns, and promoting non-proliferation. A key aspect of this program is fast reactor transmutation, in which transuranics recovered from light water reactor spent fuel are to be recycled to create fast reactor transmutation fuels. The benefits of these fuels are to be demonstrated in an Advanced Burner Reactor (ABR), which will provide a representative environment for recycle fuel testing, safety testing, and modern fast reactor design and safeguard features.
Because the GNEP programs will require facilities which may have an impact upon the environment within the meaning of the National Environmental Policy Act of 1969 (NEPA), preparation of a Programmatic Environmental Impact Statement (PEIS) for GNEP is being undertaken by Tetra Tech, Inc. The PEIS will include a section on the ABR. In support of the PEIS, the Nuclear Engineering Division of Argonne National Laboratory has been asked to provide a description of the ABR alternative, including graphics, plus estimates of construction and operations data for an ABR plant. The compilation of this information is presented in the remainder of this report.
Currently, DOE has started the process of engaging industry on the design of an Advanced Burner Reactor. Therefore, there is no specific, current, vendor-produced ABR design that could be used for this PEIS datacall package. In addition, candidate sites for the ABR vary widely as to available water, geography, etc. Therefore, ANL has based its estimates for construction and operations data largely on generalization of available information from existing plants and from the environmental report assembled for the Clinch River Breeder Reactor Plant (CRBRP) design [CRBRP, 1977]. The CRBRP environmental report was chosen as a resource because it thoroughly documents the extensive evaluation which was performed on the anticipated environmental impacts of that plant. This source can be referenced in the open literature and is publicly available. The CRBRP design was also of a commercial demonstration plant size – 975 MWth – which falls in the middle of the range of ABR plant sizes being considered (250 MWth to 2000 MWth). At the time the project was cancelled, the CRBRP had progressed to the point of having completed the licensing application to the Nuclear Regulatory Commission (NRC) and was in the process of receiving NRC approval. Therefore, it was felt that [CRBRP, 1977] provides some of the best available data and information as input to the GNEP PEIS work. CRBRP was not the source of all the information in this document. It is also expected that the CRBRP data will be bounding from the standpoint of commodity usage because fast reactor vendors will develop designs which will focus on commodity and footprint reduction to reduce the overall cost per kilowatt electric compared with the CRBR plant. Other sources used for this datacall information package are explained throughout this document and in Appendix A. In particular, see Table A.1 for a summary of the data sources used to generate the datacall information.
Again, all of the data gathered for environmental analysis in this EIS reflects what was available from open literature sources including that available on international fast

ANL-AFCI-183, Rev. 0.5 Preliminary NEPA Data Study
Advanced Burner Reactor Facility 2 September 21, 2007
reactor designs. Data on current or future international designs was either not available or not of sufficient detail for use in this datacall and EIS. It is expected that along with U.S.-based companies, foreign countries will also propose ABR designs as part of DOE’s ABR solicitation, however, those design concepts are not currently available for use as part of this datacall information package. Lastly, similar to what is anticipated for advanced U.S. designs, foreign fast reactor designs, if designed to be safe and economical, will fall within the data envelope of the information contained in this datacall package. The remaining report sections provide a summary of the safety design approach applicable to an ABR (Sec. 2), a discussion of applicable ABR operations and requirements (Sec. 3), and a summary of the various wastes and emissions generated during plant construction and operation (Sec. 4). Details regarding the data presented in tables in the body of the report are provided in Appendices A, B, and C.
2. ABR Safety Design Approach
2.1. Sodium Coolant
When a fission reaction occurs in nuclear reactor fuel, high-energy neutrons traveling at high speed are released in the reaction. In light water reactors, the fuel is of a type that fissions mostly when it absorbs neutrons which are moving relatively slowly, and so it is necessary to slow down the neutrons through collisions with the coolant water. The water thus serves two purposes: removing heat from the reactor core and slowing down neutrons to allow for further fission reactions.
In fast reactors, the fuel is of a type such that most of the fissions are caused by fast-moving neutrons, and so a coolant must be used which does not slow neutrons to the extent that water does. The coolant used in most fast reactors is liquid sodium because it slows fission neutrons much less than does water and it has many desirable thermal and physical properties, such as excellent heat transfer and compatibility with the metals used for reactor fuel cladding, duct walls, etc.
2.2. Defense in Depth
The fundamental safety goals in nuclear power reactor design and operation are to assure the health and safety of the public, to protect the plant operating staff from harm, and to prevent plant damage. Traditionally, these goals have been fulfilled by an approach that 1) minimizes risk by maximizing safety margins in design and operation, 2) reduces the likelihood of potentially harmful events by providing safety systems to deal with foreseen events, and 3) provides additional design features to mitigate the harmful consequences of low probability events. This approach is usually identified as “defense in depth.”
The basic principle of defense in depth is to provide multiple levels of protection against release of radioactive material. One part of defense in depth is physical barriers, like the multiple barriers to release of radioactivity provided by the fuel cladding, the primary coolant system boundary, and the reactor containment building. Safety systems are

ANL-AFCI-183, Rev. 0.5 Preliminary NEPA Data Study
Advanced Burner Reactor Facility 3 September 21, 2007
provided to protect the physical barriers and prevent event sequences from proceeding. Emergency planning provides an additional layer of defense in depth, should the other barriers be threatened. In all instances, the defense-in-depth strategy depends on the independence of the protective measures, so that no single event can breech more than one protective level.
2.3. Inherent and Passive Safety
In the current fleet of operating light water reactors (LWRs), the safety systems generally include the reactor shutdown systems, emergency core cooling systems and decay heat removal systems. The safety systems are generally active, depending on electrical or steam power; correct valve alignment; proper performance of pumps, valves and other equipment; and proper operator action. While these systems have proven to be effective when called upon, they are complex and have high capital and maintenance costs.
Most of the modern advanced LWR designs have reduced the dependence on active safety systems in favor of a greater reliance on passive systems that depend on natural phenomena, such as gravity or natural convection flow in cooling systems. Inherent characteristics of the design, such as negative reactivity feedback and long flow coastdown, may provide an additional level of protection.
A sodium-cooled fast reactor provides a demonstrated high level of inherent and passive safety. The coolant thermo-physical properties provide superior heat removal and transport characteristics at low operating pressure with a large temperature margin to boiling. Since the system operates at low pressure, the likelihood of a loss-of-coolant accident is greatly reduced. The reactor guard vessel is designed to hold primary coolant in the event of a leak in the primary coolant system. The reactor guard vessel assures that the reactor core remains covered with sodium and cooled by the emergency heat removal system, even if the primary reactor vessel fails. If primary coolant leaks and oxidizes in the reactor building air atmosphere, or if failures of the cladding and the primary system barriers lead to release of gaseous fission products, the reactor containment building provides a final low-leakage barrier to release of radioactivity to the environment.
The normal process of safety assessment of a design considers a spectrum of design basis accidents (DBAs) as tests of the various safety systems. These DBAs generally assume single failures. Accidents within the design basis must be accommodated by the design and shown to present risks to the public that are within regulatory standards. Beyond the design basis, there exists a class of accidents of such low probability (typically, less than 10-6 per reactor year, although regulators have not yet assigned a specific probability value) that they have been termed “hypothetical.” These events involve multiple failures of safety grade systems. Because of the potentially severe consequences of accidents in this class, they have received significant regulatory scrutiny in prior sodium-cooled fast reactor licensing reviews for the purpose of characterizing thermal and structural safety margins beyond the design basis.
Three beyond-design-basis accident (BDBA) sequences, each involving failure of both reactor scram systems, have received attention in past licensing safety assessments. In

ANL-AFCI-183, Rev. 0.5 Preliminary NEPA Data Study
Advanced Burner Reactor Facility 4 September 21, 2007
the unprotected loss-of-flow (ULOF) sequence, it is assumed that power is lost to all primary and secondary coolant pumps, and the reactor scram systems fail to activate. In the unprotected transient overpower (UTOP) sequence, it is assumed that one or more inserted control rods are withdrawn, plus the reactor scram systems fail to operate. In the unprotected loss-of-heat-sink (LOHS) accident, it is assumed that heat removal through the power conversion system is lost, and the reactor scram systems do not activate. Taken collectively, these three accident initiators encompass all the ways that an operating reactor can be perturbed, i.e. by a change in coolant flow, by a change in reactivity, or by a change in coolant inlet temperature.
A sodium-cooled fast reactor can be capable of accommodating these beyond-design-basis accident initiators without producing high temperatures and conditions that might lead to a severe accident, such as coolant boiling, cladding failures, or fuel melting. The inherent neutronic, hydraulic, and thermal performance characteristics of such a reactor provide self-protection in beyond-design-basis sequences to limit accident consequences without activation of engineered systems or operator actions. This characteristic has been termed ‘inherent passive safety.’
The efficacy of such passive safety was demonstrated through two landmark tests conducted on the Experimental Breeder Reactor-II (EBR-II), namely loss-of-flow without scram and loss-of-heat-sink without scram tests. With the automated safety systems disabled, the two most demanding accident initiating events were deliberately induced with the reactor at full power, first one, then the other. Each time the reactor simply coasted to a safe, low power state without any damage at all to the fuel or any reactor component. These tests proved conclusively that passive safety design is achievable for metallic-fueled fast reactors with sodium cooling. Additional analyses have shown that inherent reactivity feedback and heat removal performance can be achieved in sodium-cooled, pool-type, metal fueled reactors of all sizes (see [Cahalan, 1990] and [Royl, 1990]).
Within the overall safety framework for ABR, passive safety will serve to provide additional margins for public protection in the event of very low probability events for which the frequency of occurrence is lower than the normal threshold for deterministic assessment. No abnormal radioactivity releases will occur in the event of beyond-design-basis accidents, and all of the multiple defense-in-depth barriers (fuel cladding, reactor vessel, containment building) for public protection will remain intact, just as for design-basis accidents. The passive safety performance of ABR will eliminate the potential for severe accident consequences in very low frequency, beyond-design-basis sequences. Consequently, for ABR, beyond-design-basis accidents need to be considered only in the context of probabilistic risk assessments, in which such events are analyzed with best-estimate scoping methods that demonstrate safety margins beyond the normal design basis without requiring the use of deterministic analyses.
ANL-AFCI-183, Rev. 0.5 Preliminary NEPA Data Study
Advanced Burner Reactor Facility 5 September 21, 2007
2.4. Sodium-Cooled Reactor Operating Experience
Safe, stable and predictable operation of sodium-cooled fast reactors has been demonstrated in many countries worldwide, resulting in a comprehensive understanding of the necessary safety requirements, design features, and operating practices for these reactors. The concept of the sodium-cooled fast reactor has been proven by operational experience in the U.S., U.K., France, Germany, Russia, and Japan. In the U.S., the EBR-II and the FFTF operated safely and reliably for 40 reactor-years. While there have been incidents in sodium-cooled fast reactors, including at the Fermi-1 reactor in Michigan (a coolant flow blockage caused by a loose part leading to local fuel melting) and the MONJU reactor in Japan (a leak of non-radioactive sodium due to a piping design deficiency), in no case has there been any uncontrolled release of radioactive material, nor has there been any incident that resulted from a fundamental flaw in the concept of the sodium-cooled fast reactor.
The international community continues to develop fast reactor technology. The BN-800 power plant is under construction at Beloyarsk in Russia. China is constructing a small prototype power reactor near Beijing. India is constructing a large prototype power reactor at Kalpakkam. Construction of new, large sodium-cooled fast reactor plants has been proposed in Russia, France, Japan and the U.S.
2.5. Inherent Passive Safety in the ABR
The Advanced Burner Reactor safety design approach will implement the defense-in-depth strategy by adopting the traditional three levels of safety. Since the ABR will be a sodium-cooled fast reactor, it will provide significant safety margin enhancements by inherent characteristics that enable passive safety responses to potential accident initiators.
At the first level of safety, the ABR will be designed to operate with a high degree of reliability, so that accident initiators are prevented from occurring. The first level of safety will be assured in part by selection of fuel, cladding, coolant, and structural materials that are stable and compatible and provide large margins between normal operating conditions and limiting failure conditions. Next, the first level of safety will be assured by adopting an arrangement of components that allows monitoring, inspection, and testing for performance changes or degradation and for repair and replacement of components necessary to assure that safety margins are not degraded.
At the second level of safety, the ABR will provide protection in the event of equipment failure or operating error. This level of protection is provided by engineered safety systems for reactor shutdown, reactor heat removal, and emergency power. Each of these safety-grade back-up systems functions in the event of failure in the corresponding operating system and are subjected to continuous monitoring and periodic testing and inspection.

ANL-AFCI-183, Rev. 0.5 Preliminary NEPA Data Study
Advanced Burner Reactor Facility 6 September 21, 2007
The ABR will incorporate an independently powered and instrumented secondary reactor shutdown system that operates automatically to reduce reactor power rapidly in the event that the primary shutdown system fails. For shutdown cooling, the ABR will include a safety-grade emergency heat removal system, independent from the normal heat removal system and capable of passively removing residual decay heat by natural circulation. In addition to the normal off-site power supply, the ABR will be equipped with a second, independent safety-grade on-site emergency power supply.
The third level of safety provides additional protection of the public health and safety in an extremely unlikely event that is not expected to occur in the life of the plant, or which was not foreseen at the time the plant was designed and constructed. As an example, level 3 protections for cooling assurance and containment of radioactivity are provided by the reactor guard vessel and the reactor containment building. The reactor guard vessel assures that the reactor core remains covered with sodium and cooled by the emergency heat removal system, even if the primary reactor vessel fails. Similarly, the reactor containment building provides a final low-leakage barrier to release of radioactivity to the environment in the event of a primary coolant leak or of failures of the cladding and the primary system barriers leading to release of gaseous fission products.
3. ABR Operations and Requirements
As described in Sec. 1, construction and operating requirements for the Advanced Burner Reactor have been derived largely from CRBRP evaluations discussed in documents available to the public. A more recent preconceptual design of a sodium-cooled fast reactor [Chang, 2006] has been identified for use in describing major plant systems. However, the description presented here is not intended to constrain future design decisions for the ABR. Where design decisions are expected to have a significant influence on environmental impact, conservative choices are made or, as in the case of fuel choice, two alternatives are presented.
The major systems of the ABR are expected to include: 1) the reactor vessel containing the reactor core and the primary sodium coolant, 2) the intermediate heat transport system, which transfers heat from the primary coolant to the secondary coolant, and 3) a power conversion system that uses heat from the secondary coolant to produce electricity. These systems are illustrated in Fig. 1. In this concept, the reactor vessel and primary and secondary heat transport systems are located below grade on a nuclear island which is seismically isolated from its foundations.
Primary system components for the ABR may be arranged in either a pool or loop configuration. Figure 2 illustrates a pool configuration, where the reactor core, primary pumps, intermediate heat exchangers (IHX), and direct reactor auxiliary cooling system heat exchangers (DRACS – not shown in Fig. 2) are contained in a pool of sodium coolant within the reactor vessel. In a pool configuration, all primary sodium coolant piping is within the sodium pool, which virtually eliminates the possibility of a loss of coolant and provides a large thermal inertia during reactor transients. In addition, the reactor vessel is a simple structure with no penetrations, surrounded by an additional

ANL-AFCI-183, Rev. 0.5 Preliminary NEPA Data Study
Advanced Burner Reactor Facility 7 September 21, 2007
guard vessel. In a loop configuration, primary pumps and intermediate heat exchangers are external to the reactor vessel and are interconnected by pipes. This type of configuration is illustrated in Fig. 3, which shows a diagram of one of the Fast Flux Test Facility (FFTF) loops.
The fundamental flow path for sodium is similar between pool and loop configurations. Primary pumps discharge sodium coolant into the inlet plenum of the core. The coolant is heated as it flows through the core and then exits into the outlet plenum. Heated sodium then flows through the IHXs, where it gives up its heat to the intermediate heat transport system and then returns to be drawn back into the primary pumps.
The relationship among the primary, intermediate, and secondary heat transport systems is shown in Fig. 1, where a supercritical CO2 Brayton cycle is assumed for the power conversion system, although a steam Rankine cycle can also be used. In the intermediate
Figure 1. Elevation view shows the reactor vessel and containment secondary heat transport system and power conversion system.

ANL-AFCI-183, Rev. 0.5 Preliminary NEPA Data Study
Advanced Burner Reactor Facility 8 September 21, 2007
Figure 2. Cut-away view of a pool configuration shows the primary heat transport system within the reactor vessel. [Chang, 2006]
Reactor vessel
Guard vessel
Primary pump
IHX
Core
Inlet plenum

ANL-AFCI-183, Rev. 0.5 Preliminary NEPA Data Study
Advanced Burner Reactor Facility 9 September 21, 2007
Figure 3. Diagram of the FFTF loop configuration, showing one of the loops [Cabell, 1980]

ANL-AFCI-183, Rev. 0.5 Preliminary NEPA Data Study
Advanced Burner Reactor Facility 10 September 21, 2007
heat transport system, pumps circulate sodium coolant through the IHXs to recover heat from the primary system. The coolant then flows through steam generators (for the Rankine cycle option) or sodium-to-CO2 heat exchangers (for the advanced supercritical CO2 Brayton cycle option) to transfer heat to the power conversion system. The power conversion system uses the thermal energy to do mechanical work on a turbine-generator and produce electricity. A schematic of a supercritical CO2 Brayton cycle power conversion system concept is presented in Fig. 4, and a schematic of a steam cycle system is diagrammed in Fig. 5.
3.1 Fissile Material Inventory
The power level of the ABR core has not yet been finalized but is evaluated in the range between 250 MWth and 2000 MWth. A 250 MWth design would, because of its size, be economical to build, yet would be large enough to serve as a small engineering scale demonstration plant. A 2000 MWth plant, on the other hand, would provide a full-scale commercial demonstration of the ABR concept, at a higher cost. It is expected that the final ABR design will fall in between these two values. Therefore, parameters which are a function of reactor power level have been estimated in this report for a 250 MWth core, a 1000 MWth core, and a 2000 MWth core, thus providing both mid-range and bounding values for these parameters. See Appendix A, Table A.2, for a summary of the methods used to scale various parameters for reactor power.
Startup fuel type has also not been finalized but will be either metal (U-Pu-Zr or U-Zr) or mixed oxide (UO2-PuO2). Therefore, fuel cycle analysis results are presented for both metal and oxide candidate core designs.
Table 1 lists fissile material inventory in the reactor core at all three power levels and for both types of cores. The table also gives estimates of the maximum fissile inventory (fresh plus spent fuel) on site over sixty years of operation, assuming that the ABR is not co-located with a startup fuel reprocessing facility and that the startup fuel is stored on site indefinitely. See the discussion of Table 1 in Appendix A for details of the data calculations.
3.2 Fuel Handling
Fuel assemblies for the ABR will be delivered from one of two sources: either from a co-located fuel processing and fabrication facility [Chang, 2006] or from offsite fabrication facilities in DOE/DOT-approved shipping containers. In either case, new fuel assemblies enter the primary containment building through an intra-building transfer area. Major components in the fuel handling system are indicated in Fig. 6, which shows an artist’s rendition of a candidate ABR concept. The intra-building tunnel will interface with a fuel staging/storage area that is either part of the ABR facility or part of a co-located fuel processing facility.

ANL-AFCI-183, Rev. 0.5 Preliminary NEPA Data Study
Advanced Burner Reactor Facility 11 September 21, 2007
Figure 4. Candidate ABR supercritical CO2 Brayton cycle power conversion system

ANL-AFCI-183, Rev. 0.5 Preliminary NEPA Data Study
Advanced Burner Reactor Facility 12 September 21, 2007
Figure 5. Candidate ABR Steam Cycle Power Conversion System

ANL-AFCI-183, Rev. 0.5 Preliminary NEPA Data Study
Advanced Burner Reactor Facility 13 September 21, 2007
Once fuel enters the containment building, it is transferred to the fuel unloading machine for placement into the reactor vessel. An in-vessel fuel handling machine manages the movement and placement of fuel within the reactor vessel. Spent fuel that is removed from the reactor vessel by the fuel unloading machine is placed into an intra-building cask and returned to the fuel staging/storage area.
3.3 Facility Requirements
3.3.1 Industrial Security and Safeguards
The industrial security and safeguards system [Chang, 2006] is designed to protect plant equipment and personnel and to prevent the theft of special nuclear materials. The system is designed to defend against the design basis threats specified in regulations. The key requirements for the security and safeguards systems are:
• Allow plant access only to authorized personnel and material • Prevent the theft of special nuclear materials • Prevent the sabotage of critical plant equipment • Deter, detect, and delay unauthorized activities and assaults on the plant
3.3.2 Buildings and Structures
In addition to buildings and structures to house the primary and secondary heat transport systems and the power conversion system, a number of other buildings necessary to support overall operations are part of the ABR facility. As discussed in [Chang, 2006], these include a control/personnel building as well as buildings for radwaste and maintenance, balance-of-plant services, emergency generators, and security. A site plan for the 2000 MWth design is shown in Fig. 7. A list of site buildings and structures for the ABR concept, including currently proposed dimensions, is given in Table 2 for a 250 MWth ABR design, a 1000 MWth design, and a 2000 MWth design. It should be noted that the ABR facility design will continue to evolve, and as it evolves, designs of
Table 1. ABR Fissile Inventory Metal (kg.) Oxide* (kg.)
250 MWth, core + in-vessel storage 550 580 1000 MWth, core + in-vessel storage 2260 2550 2000 MWth, core + in-vessel storage 4,600 4,770 250 MWth, maximum on site 12,500 13,200 1000 MWth, maximum on site 25,700 24,200 2000 MWth, maximum on site 60,600 63,400 * Core adjusted to the same TRU conversion ratio as the metal core

ANL-AFCI-183, Rev. 0.5 Preliminary NEPA Data Study
Advanced Burner Reactor Facility 14 September 21, 2007
particular buildings and structures may change. Therefore, dimensions and site layout of later designs may differ from those given in Table 2 and in Fig. 7.
3.3.2.1 Reactor Building
The reactor building encloses the entire primary reactor system and secondary heat transport system and is constructed on a seismically-isolated basemat structure. The building is a reinforced-concrete containment structure that contains an inner reactor containment dome and is designed for a maximum leak rate of 0.1 %/day at an internal
Figure 6: Major components of the fuel handling system in a candidate ABR concept. [Chang, 2006]

ANL-AFCI-183, Rev. 0.5 Preliminary NEPA Data Study
Advanced Burner Reactor Facility 15 September 21, 2007
Figure 7. Site plan for the ABR.

ANL-AFCI-183, Rev. 0.5 Preliminary NEPA Data Study
Advanced Burner Reactor Facility 16 September 21, 2007
Table 2. ABR Site Buildings and Structures with Proposed Dimensions. Footprint (ft2) Length (ft) Width (ft) Height (ft)
Building Name 250
MWth 1000
MWth 2000
MWth 250
MWth 1000
MWth 2000
MWth 250
MWth 1000
MWth 2000
MWth 250
MWth 1000
MWth 2000
MWth Reactor Building 7,832 32,685 32,685 89 dia. 204 dia 204 dia. - - - 100 140 140 BOP Building 3,336 41,860 41,860 72 260 260 46 161 161 49 75 75 Control/ Personnel Building 6,319 12,600 12,600 89 131 131 71 96 96 30 30 30 Radwaste/ Maintenance Facility 6,000 24,000 24,000 100 124 124 60 193 193 40/80* 40/80* 40/80* Security Gate House 900 900 900 30 30 30 30 30 30 16 16 16 Emergency Gen. Bldg. (2 for 1000 and 2000 MWth ABR) 375
1,500 each
1,500 each 25
50 each
50 each 15
30 each
30 each 12 12 each 12 each
BOP Services Building 2,250 9,000 9,000 50 100 100 45 90 90 20 20 20 Lift Station 1,200 1,200 1,200 40 40 40 30 30 30 16 16 16 Wastewater Treatment Plant 1,200 4,800 9350 40 80 110 30 60 85 16 16 16 Fuel Handling Facility 6,000 6,000 6,000 100 100 100 60 60 60 16 16 16 Fuel Storage Facility 31,250 57,400 57,400 250 307 307 125 187 187 16 16 16 Cooling Towers (each)** 2,352 19,300 19,300 48 156 dia. 156 dia. 48 - - 33 220 220 Interior Security Perimeter Fence 1.1x10⁵ 7.1x10⁵ 7.1x10⁵ 435 1,085 1,085 244 660 660 - - - Exterior Security Perimeter Fence 2.4x10⁵ 1.1x10⁶ 1.1x10⁶ 616 1,253 1,253 394 885 885 - - - *80 ft. high bay for maintaining tall components, 40 ft. low bay for other maintenance, waste management, etc. ** Dimensions in Table 2 are for wet cooling towers.
ANL-AFCI-183, Rev. 0.5 Preliminary NEPA Data Study
Advanced Burner Reactor Facility 17 September 21, 2007
pressure of 10 psig. The reactor building is a conventional reactor containment structure with the reactor vessel assembly located below grade. All of the primary radioactive systems are located below grade within the reactor building.
3.3.2.2 Balance of Plant Building
The balance of plant building contains the power conversion systems, which will be based on either a steam Rankine cycle or a super-critical CO2 Brayton cycle. Future design considerations for the ABR will determine the type of power conversion system to use. Regardless of choice, the ABR will have nearly identical operating conditions for the primary and secondary systems, and overall plant efficiency will be similar.
In the preconceptual design discussed in [Chang, 2006], the balance of plant building houses a supercritical CO2 Brayton cycle and consists of upper and lower levels. The building heating and air conditioning system maintains an ambient temperature for the enclosed equipment and maintains a slightly negative atmospheric pressure relative to the outside so that minor CO2 leaks would be contained within the structure. All ventilation equipment is located adjacent to the building to deliver air for cooling of the generator and ambient temperature control for the building.
The lower level is located below grade. The lower level is open to the upper floor, so that, in the event of a leak, the CO2 will sink and collect in the lower level. The lower level also contains the inventory control tanks and the letdown tanks which are part of the Brayton cycle system on the upper level. Access to this lower level will be for inspection of the tanks or maintenance purposes only.
If a Rankine cycle is used instead for the power conversion system, the Brayton cycle equipment in the balance of plant building will be replaced by the feedwater and condensate systems equipment, such as the deaerator, condenser, feedwater pumps, etc.
3.3.2.3 Control Room and Personnel Building
The reactor control building is a multi-story building adjoining the reactor building. This concrete and steel tornado-hardened, Seismic Category 1 structure houses the control room, technical support center, and the central computers for the overall plant. It also includes space for switchgears; cable routing rooms; motor-generator sets; heating, ventilating, and air conditioning equipment; compressed air; and other auxiliary systems. Fire protection/suppression systems are also provided.
3.3.2.4 Radwaste/Maintenance Building
The radwaste/maintenance building is a slab-on-grade sheet metal high bay structure that provides two areas: a waste management area and a maintenance area. The waste management area is sized and designed to handle the collection, treatment, staging and shipment for disposal of all regulated wastes generated at the site. Waste will be generated from on-going and periodic maintenance work during the life of the plant.

ANL-AFCI-183, Rev. 0.5 Preliminary NEPA Data Study
Advanced Burner Reactor Facility 18 September 21, 2007
Equipment will exist in this building to condition the waste streams that are expected to be generated from the plant.
The maintenance side of the building provides space and equipment for the routine and planned maintenance of the facility and equipment. The maintenance building also has a location in the structure where large components will be assembled prior to installation in the reactor building. A rail spur provides easy access and delivery of components such as the reactor vessel module, primary pumps, intermediate heat exchangers, and balance-of-plant system equipment to the maintenance area during installation and checkout of the primary and secondary systems. After the facility has been constructed, the maintenance building will then have space and equipment for performing routine and non-routine maintenance of the reactor primary and secondary systems.
3.3.2.5 Security Gate House
The security gate house is a single-story reinforced concrete non-seismic category structure with a reinforced concrete slab located at grade. The windows are made from bullet-proof glass.
The security gate house provides a controlled means of access to the plant site to prevent inadvertent access, industrial sabotage or the theft of nuclear materials. All personnel must pass through this building and be checked by the associated security systems for ingress and egress to sensitive plant structures/areas, or areas where radioactive materials are stored. The plant security system is monitored and operated from this building. A truck trap is located adjacent to this building that allows for security force control and containment of trucks requiring access to the site for deliveries or pickups.
3.3.2.6 Emergency Generator Buildings
Gas or diesel generator buildings are located adjacent to the reactor control building. The 250 MWth plant has one building housing two modular 1 MWe generators that provide emergency power to the primary and secondary systems upon demand. The 1000 MWth plant has two buildings housing one 3 MWe generator each, while the 2000 MWth plant has two buildings housing two 3 MWe generators each. The emergency generator buildings are shipped as single integrated units that can be quickly installed at the site and made operable to support the construction activities during the facility construction, emergency power during reactor operations, and as an alternative source of power during reactor decommissioning.
3.3.2.7 Balance of Plant Services Building
The balance of plant services building provides space for equipment that supports the balance of plant building, cooling towers, and other services. This includes recirculation pumps, water conditioning equipment, air compressors, electrical switchgears, motor control centers, plant heating systems, and other support equipment.
3.3.2.8 Lift Station Building and Wastewater Treatment Plant Building

ANL-AFCI-183, Rev. 0.5 Preliminary NEPA Data Study
Advanced Burner Reactor Facility 19 September 21, 2007
The lift station building provides pumps and filtration system to pump water from the river (or other suitable cooling water source) to the plant for use in cooling and domestic water services. The lift station footprint should be about the same for all three candidate plants, since pump footprint does not increase much as pump flow increases within the range of the plants, plus, if additional pumps are needed, the pumps can be stacked vertically. All wastewaters go through the wastewater treatment plant, where the water is treated prior to being discharged. Assuming the wastewater treatment function is approximately proportional to the surface area of ponds, tanks, etc. and that the surface area of these components should scale approximately linearly with reactor power, the wastewater treatment plant building footprint should scale approximately linearly with reactor power, as shown in Table 2. The slight deviation from linear scaling between the 1000 MWth and 2000 MWth footprints comes from having restricted the building length and width to whole numbers which would give approximate linear increases with power in the building area.
3.3.2.9 Fuel Handling Facility Building
The fuel handling facility houses the fuel receiving, storage, and shipping system. It also contains the instrumentation and control system that is used to operate 1) the fuel receiving, storage, and shipping system and 2) the fuel handling system. New core assemblies enter the fuel handling facility and are unloaded from the shipping containers and inspected. They are then temporarily stored in the air cell, from which they are transferred by the inter-building coffin to the reactor building prior to core loading. A spent fuel assembly is removed by the pantograph fuel handling machine from storage around the core barrel and transferred to the fuel unloading machine, which places the assembly in the inter-building coffin and transfers it back to the air cell in the fuel handling facility.
3.3.2.10 Fuel Storage Facility Building
The fuel storage facility provides long-term storage for spent ABR fuel. The building can be used simply for spent fuel storage, or it can house a fuel cycle facility for processing spent fuel. Fuel is transferred from the fuel handling facility to the fuel storage facility via an inter-building coffin.
3.3.2.11 Cooling Towers
Four open-evaporative, forced-air counter flow wet cooling towers are used in the 250 MWth design to reject heat to the atmosphere. Each tower has an induced draft, axial fan at the tower outlet. The 1000 and 2000 MWth plant designs operate with natural draft wet cooling towers (one for the 1000 MWth plant, two for the 2000 MWth plant). Forced convection towers are more cost effective for lower heat loads and so are suitable for the 250 MWth design. The large natural draft towers are more efficient for larger heat loads and are therefore used for the 1000 and 2000 MWth plants. Figure 8 shows an example of forced convection cooling towers similar to those proposed for the 250 MWth ABR

ANL-AFCI-183, Rev. 0.5 Preliminary NEPA Data Study
Advanced Burner Reactor Facility 20 September 21, 2007
plant design. Dry cooling towers could be used with any of the three plants if indicated by local conditions.
3.3.3 Radioactive and Hazardous Wastes from Operations
Estimates of annual low-level, mixed low-level, and hazardous wastes in both liquid and solid form are shown in Table 3. Liquid low-level waste is generated from decontaminating radioactive systems and is assumed to scale approximately linearly with reactor power. Solid low-level waste is a mixture of items, some of which do not scale with power. Transuranics will appear only in miniscule amounts in the liquid waste effluent, and so there will be no transuranic waste requiring separate disposal. Hazardous liquid waste comes from the chemical waste treatment system and may include, if a steam Rankine cycle is used in the power conversion system, clarifier blowdown, backwashes, and regenerant wastes and will also include rinse water from the process water treatment systems and non-radioactive building floor drainage. Hazardous solid
Figure 8. Example of forced convection cooling towers.

ANL-AFCI-183, Rev. 0.5 Preliminary NEPA Data Study
Advanced Burner Reactor Facility 21 September 21, 2007
waste is the result of processing solid wastes from the balance of plant system.
The bases for the values given in Table 3 are detailed in the discussion of Table 3 in Appendix A.
3.3.4 Non-hazardous Operations Wastes
Table 4 provides data on non-hazardous wastes from plant operations. Sanitary waste is assumed to be processed on site by a sanitary waste system. Water effluent from the waste system will be returned to a local body of water, similar to practices in most municipalities. Sludge from the processing of sanitary waste will be transported off site. See the discussion of Table 4 in Appendix A for details of the data calculations.
All other non-hazardous waste is expected to be ordinary trash, which would be transported off site.
3.3.5 Annual Operations Data
Estimates of plant electrical requirements are summarized in Table 5. Appendix A provides details on how these estimates were calculated. The majority of the electrical energy demand is from the motors on the primary and intermediate sodium pumps, the water recirculation pumps, and, if a Brayton cycle is used for power conversion, the CO2 compressors, if the compressors are powered by electric motors (option 2), rather than being driven directly by the turbine (option 1). If a Rankine cycle is used instead, the electrical demand of the power conversion system will come from the feedwater and the condensate pumps [Lomperski, 2007].
Table 3. Estimated Annual Radioactive and Hazardous Wastes from Operations
ABR Power Capacity
250 MWth 1000 MWth 2000 MWth
Liquid Solid Liquid Solid Liquid Solid Low-Level 7.9 x10⁴ gal. 55 yd3 3.2 x10⁵ gal. 82 yd3 6.3 x10⁵ gal. 119 yd3 Mixed Low-Level negligible 4.3 yd.3 negligible 11.4 yd.3 negligible 19.6 yd.3 Hazardous 4.6x10⁶ gal. 9.1x10⁴ lb.
max. 1.84x10⁷ gal. 3.65x10⁵ lb
max. 3.7x10⁷ gal. 7.3x10⁵ lb.
max.
Table 4. Estimated Annual Non-hazardous Operations Wastes 250 MWth 1000 MWth 2000 MWth Liquid (gal.) Solid ( yd3) Liquid (gal.) Solid( yd3) Liquid (gal.) Solid( yd3) Sanitary 1.9x10⁶ 3.5 yd3 2.2x10⁶ 4.0 2.4x10⁶ 4.5 Other negligible 1150 negligible 1300 negligible 1450

ANL-AFCI-183, Rev. 0.5 Preliminary NEPA Data Study
Advanced Burner Reactor Facility 22 September 21, 2007
Brayton cycle option 2 [Sienicki, 2007] is the bounding case of several possible options for driving the compressors. This case has a 156.4 MW turbine (for the 250 MWth plant) driving a larger size generator than would be the case if the compressors are driven directly by the turbine. Assuming a 1.5 % efficiency loss, the generator output is 154 MWe versus 95.9 MWe for the best estimate single-shaft case (Option 1). The excess plant electrical output essentially goes to energizing the motors that drive the compressors. Thus, while the compressors draw AC power from the grid, the larger generator outputs that power to the grid. The net electrical power leaving the plant is still close to but slightly less than the 95.9 MWe value for the single-shaft case. For the 1000 MWth plant, these power values increase by a factor of four, and for the 2000 MWth plant, they increase by a factor of eight.
Table 5. ABR Estimated Annual Electrical Requirements Plant Specifications Consumption/Use
Centrifugal pumps 5.09x10⁴ MWh Brayton option 1 Electromagnetic pumps 6.04x10⁴ MWh Centrifugal pumps 7.20x10⁵ MWh Rankine Electromagnetic pumps 8.15x10⁵ MWh Centrifugal pumps 5.33x10⁵ MWh
250 MWth
Brayton option 2 Electromagnetic pumps 5.42x10⁵ MWh Centrifugal pumps 1.22x10⁵ MWh Brayton option 1 Electromagnetic pumps 1.59x10⁵ MWh Centrifugal pumps 2.07x10⁵ MWh Rankine Electromagnetic pumps 2.44x10⁵ MWh Centrifugal pumps 2.05x10⁶ MWh
1000 MWth
Brayton option 2 Electromagnetic pumps 2.45x10⁶ MWh Centrifugal pumps 2.17x10⁵ MWh Brayton option 1 Electromagnetic pumps 2.93x10⁵ MWh Centrifugal pumps 3.86x10⁵ MWh Rankine Electromagnetic pumps 4.62x10⁵ MWh Centrifugal pumps 4.07x10⁶ MWh
Electrical Energy
2000 MWth
Brayton option 2 Electromagnetic pumps 4.15x10⁶ MWh Centrifugal pumps 5.8 MWe Brayton option 1 Electromagnetic pumps 6.9 MWe Centrifugal pumps 8.2 MWe Rankine Electromagnetic pumps 9.3 MWe Centrifugal pumps 60.8 MWe
250 MWth
Brayton option 2 Electromagnetic pumps 61.9 MWe Centrifugal pumps 13.9 MWe Brayton option 1 Electromagnetic pumps 18.2 MWe Centrifugal pumps 23.6 MWe Rankine Electromagnetic pumps 27.9 MWe Centrifugal pumps 234 MWe
1000 MWth
Brayton option 2 Electromagnetic pumps 238 MWe Centrifugal pumps 24.8 MWe Brayton option 1 Electromagnetic pumps 33.4 MWe Centrifugal pumps 44.1 MWe Rankine Electromagnetic pumps 52.7 MWe Centrifugal pumps 465 MWe
Peak Electrical Demand
2000 MWth
Brayton option 2 Electromagnetic pumps 473 MWe
ANL-AFCI-183, Rev. 0.5 Preliminary NEPA Data Study
Advanced Burner Reactor Facility 23 September 21, 2007
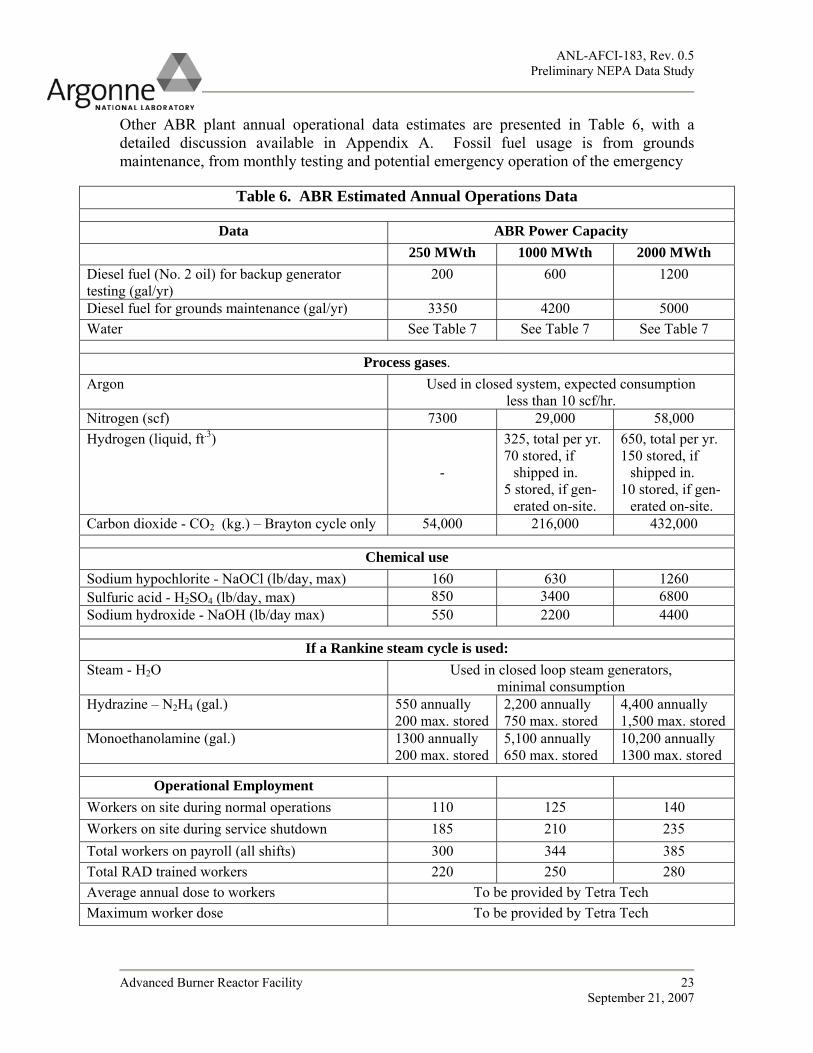
Other ABR plant annual operational data estimates are presented in Table 6, with a detailed discussion available in Appendix A. Fossil fuel usage is from grounds maintenance, from monthly testing and potential emergency operation of the emergency
Table 6. ABR Estimated Annual Operations Data
Data ABR Power Capacity 250 MWth 1000 MWth 2000 MWth
Diesel fuel (No. 2 oil) for backup generator testing (gal/yr)
200 600 1200
Diesel fuel for grounds maintenance (gal/yr) 3350 4200 5000 Water See Table 7 See Table 7 See Table 7
Process gases.
Argon Used in closed system, expected consumption less than 10 scf/hr.
Nitrogen (scf) 7300 29,000 58,000 Hydrogen (liquid, ft.3)
-
325, total per yr. 70 stored, if
shipped in. 5 stored, if gen-
erated on-site.
650, total per yr. 150 stored, if
shipped in. 10 stored, if gen-
erated on-site. Carbon dioxide - CO2 (kg.) – Brayton cycle only 54,000 216,000 432,000
Chemical use Sodium hypochlorite - NaOCl (lb/day, max) 160 630 1260 Sulfuric acid - H2SO4 (lb/day, max) 850 3400 6800 Sodium hydroxide - NaOH (lb/day max) 550 2200 4400
If a Rankine steam cycle is used: Steam - H2O Used in closed loop steam generators,
minimal consumption Hydrazine – N2H4 (gal.) 550 annually
200 max. stored 2,200 annually 750 max. stored
4,400 annually 1,500 max. stored
Monoethanolamine (gal.) 1300 annually 200 max. stored
5,100 annually 650 max. stored
10,200 annually 1300 max. stored
Operational Employment
Workers on site during normal operations 110 125 140 Workers on site during service shutdown 185 210 235 Total workers on payroll (all shifts) 300 344 385 Total RAD trained workers 220 250 280 Average annual dose to workers To be provided by Tetra Tech Maximum worker dose To be provided by Tetra Tech

ANL-AFCI-183, Rev. 0.5 Preliminary NEPA Data Study
Advanced Burner Reactor Facility 24 September 21, 2007
diesel generators, and possibly from a diesel fire pump, if it is determined that one is needed.
In general, the main process gases used are argon and hydrogen, plus CO2 if a Brayton cycle is used, or nitrogen if a Rankine cycle is used [Chang, 2006]. Argon is used as a cover gas in the reactor, the intermediate heat transport system (IHTS), the IHTS cold traps, and for steam plant applications. Argon is also used for inerting the annular space between the reactor vessel and the guard vessel. Data from [Cutforth, 1971] indicate very low loss of argon from the system is expected. Nitrogen gas is used for steam generator water-side purging. For the 1000 and 2000 MWth plant designs, hydrogen gas is used to cool the main generator stator core and rotating field during operation, whereas the 250 MWth generator is small enough to be air-cooled. Two options are considered for providing hydrogen: having hydrogen delivered by an outside supplier and stored for use, or installing a hydrogen generator on-site and generating hydrogen continuously, with a 6-day reserve in storage. Argon, nitrogen, and CO2 are all stored in tanks in liquid form and vaporized for use. Hydrogen is stored as a liquid in the hydrogen system.
If wet cooling towers are used, the makeup water required dwarfs the makeup required for process water treatment, as indicated in Table 7. If dry cooling towers are used, makeup water requirements are very low, but dry cooling towers would be much larger than wet cooling towers. Details of the data calculations are given in the discussion of Table 7 in Appendix A.
Sodium hypochlorite is injected intermittently for bio-fouling control in the cooling tower and groundwater intake, plus minor amounts to the sanitary system discharge. Sulfuric acid is added occasionally to the cooling tower water and the chemical waste treatment system to control high pH. Sodium hydroxide pellets are added intermittently to the chemical waste treatment system. If a Rankine cycle is used, hydrazine is added to the feedwater as an oxygen scavenger, and monoethanolamine is added to control pH.
Table 7. Estimated Annual Makeup Water Usage Total Waste Water
(blowdown plus process water)
ABR Power
(MWth)
Cooling Tower
Evaporation (gal.)
Cooling Tower Drift (gal.)
Cooling Tower
Blowdown (gal.)
Max. Process Water (gal.)
Wet Cooling
(gal.)
Dry Cooling
(gal.)
Wet Cooling
(gal.)
Dry Cooling
(gal.) 250 5.57x10⁸ 1.47x10⁷ 3.55x10⁸ 1.64x10⁷ 9.43x10⁸ 1.64x10⁷ 3.71x10⁸ 1.64x10⁷
1000 2.23x10⁹ 5.78x10⁷ 1.42x10⁹ 6.57x10⁷ 3.77x10⁹ 6.57x10⁷ 1.49x10⁹ 6.57x10⁷
2000 4.46x10⁹ 1.16x10⁸ 2.84x10⁹ 1.31x10⁸ 7.55x10⁹ 1.31x10⁸ 2.97x10⁹ 1.31x10⁸

ANL-AFCI-183, Rev. 0.5 Preliminary NEPA Data Study
Advanced Burner Reactor Facility 25 September 21, 2007
4. Summary of Nuclear Materials, Wastes, Effluents, Emissions, and Utilities during Operations and Construction
4.1 High-level Waste/Spent Nuclear Fuel
On average, one-third of the core is replaced each year. Table 8 lists the annual discharge for both fuel types and for the high and low candidate powers. See Appendix A for further details. The cycle length, or time elapsed between stoppages for refueling, is one year for the 1000 and 2000 MWth ABR designs, two months for the 250 MWth ABR. The 250 MWth ABR has a much shorter cycle length because a core this small has only limited room for control rods and so cannot accommodate a large reactivity swing. In the 1000 and 2000 MWth ABR candidate core designs, the cycle length was targeted at one year in order to increase the capacity factor. The longer cycle length results in a large reactivity swing, which can be handled by including a large number of control rods, since the core designs have sufficient space for many control rods.
Spent nuclear startup fuel will be stored on-site for eventual reprocessing
Table 8. Annual Spent Fuel Discharge from the ABR Metal Fuel Oxide Fuel
ABR Power (MWth)
Heavy Metal (kg.) Assemblies
Heavy Metal (kg.) Assemblies
250 850 24 890 241000 3100 45 2500 362000 5560 110 5760 110
4.2 Effluents from Operations
Table 9 provides estimated activities of significant radionuclides in the liquid radioactive waste effluent. Liquid radioactive waste comes from rinses to clean radioactivity and residual sodium from components removed from the primary and intermediate systems, plus liquid from floor drains, shower drains, and laboratory drains. The concentrations given in Table 9 assume that, after distillation and demineralization, a decontamination factor of 105 is achieved. Effluent radioactivity is assumed to scale approximately linearly with reactor power. This estimate is based upon the CRBRP evaluation of concentration of radionuclides in the effluent from the liquid radwaste systems ([CRBRP, 1977], Table 3.5-3), which assumed the effluent would be diluted by mixing with the blowdown from the wet cooling tower. If a dry cooling tower is used instead for the ABR plant, radioactive effluent will either need to be diluted by some other means or will need to be transported off-site for dilution and release.

ANL-AFCI-183, Rev. 0.5 Preliminary NEPA Data Study
Advanced Burner Reactor Facility 26 September 21, 2007
Table 9. Estimated Activity of Liquid Waste Effluent from the ABR
Isotope 250 MWth ABR (µCi/cc)
1000 MWth ABR (µCi/cc)
2000 MWth ABR (µCi/cc)
H-3 2.06x10⁻⁹ 8.24x10⁻⁹ 1.65 x10⁻⁸ Na-22 1.77 x10⁻¹⁴ 7.09 x10⁻¹⁴ 1.42 x10⁻¹³ Na-24 5.05 x10⁻¹⁵ 2.02 x10⁻¹⁴ 4.04 x10⁻¹⁴ Cr-51 1.42 x10⁻¹³ 5.68 x10⁻¹³ 1.14 x10⁻¹² Mn-54 1.00 x10⁻¹² 4. 00 x10-12 8.00 x10⁻¹² Co-58 6.15 x10⁻¹³ 2.46 x10⁻¹² 4.92 x10⁻¹² Fe-59 4.93 x10⁻¹⁵ 1.97 x10⁻¹⁴ 3.94 x10⁻¹⁴ Co-60 9.83 x10⁻¹³ 3.93 x10⁻¹² 7.86 x10⁻¹² Sr-89 1.13 x10⁻¹³ 4.51 x10⁻¹³ 9.02 x10⁻¹³ Y-89m 1.13 x10⁻¹³ 4.51 x10⁻¹³ 9.02 x10⁻¹³ Sr-90 8.10 x10⁻¹⁴ 3.24 x10⁻¹³ 6.48 x10⁻¹³ Y-90 8.10 x10⁻¹⁴ 3.24 x10⁻¹³ 6.48 x10⁻¹³ Y-91 1.66 x10⁻¹³ 6.63 x10⁻¹³ 1.33 x10⁻¹² Zr-95 3.13 x10⁻¹³ 1.25 x10⁻¹² 2.50 x10⁻¹² Nb-95 3.13 x10⁻¹³ 1.25 x10⁻¹² 2.50 x10⁻¹² Mo-99 3.53 x10⁻¹⁴ 1.41 x10⁻¹³ 2.82 x10⁻¹³ Ru-103 4.33 x10⁻¹³ 1.73 x10⁻¹² 3.46 x10⁻¹² Ru-106 3.35 x10⁻¹³ 1.34 x10⁻¹² 2.68 x10⁻¹² Rh-106 3.35 x10⁻¹³ 1.34 x10⁻¹² 2.68 x10⁻¹² Ag-111 1.15 x10⁻¹⁴ 4.58 x10⁻¹⁴ 9.16 x10⁻¹⁴ Sb-125 4.68 x10⁻¹⁶ 1.87 x10⁻¹⁵ 3.74 x10⁻¹⁵ Te-129m 5.73 x10⁻¹⁶ 2.29 x10⁻¹⁵ 4.58 x10⁻¹⁵ Te-129 5.73 x10⁻¹⁶ 2.29 x10⁻¹⁵ 4.58 x10⁻¹⁵ I-131 2.17 x10⁻¹⁴ 8.68 x10⁻¹⁴ 1.74 x10⁻¹³ Te-132 3.88 x10⁻¹⁵ 1.55 x10⁻¹⁴ 3.10 x10⁻¹⁴ I-132 3.88 x10⁻¹⁵ 1.55 x10⁻¹⁴ 3.10 x10⁻¹⁴ Cs-134 2.20 x10⁻¹⁵ 8.78 x10⁻¹⁵ 1.76 x10⁻¹⁴ Cs-136 9.88 x10⁻¹⁵ 3.95 x10⁻¹⁴ 7.90 x10⁻¹⁴ Cs-137 3.93 x10⁻¹⁴ 1.57 x10⁻¹³ 3.14 x10⁻¹³ Ba-140 2.27 x10⁻¹³ 9.07 x10⁻¹³ 1.81 x10⁻¹² La-140 2.27 x10⁻¹³ 9.07 x10⁻¹³ 1.81 x10⁻¹² Ce-141 3.73 x10⁻¹³ 1.49 x10⁻¹² 2.98 x10⁻¹² Pr-143 1.96 x10⁻¹³ 7.83 x10⁻¹³ 1.57 x10⁻¹² Ce-144 2.65 x10⁻¹³ 1.06 x10⁻¹² 2.12 x10⁻¹² Pr-144 2.65 x10⁻¹³ 1.06 x10⁻¹² 2.12 x10⁻¹² Nd-147 8.20 x10⁻¹⁴ 3.28 x10⁻¹³ 6.56 x10⁻¹³ Pm-147 1.52 x10⁻¹³ 6.06 x10⁻¹³ 1.21 x10⁻¹² Eu-155 1.50 x10⁻¹⁴ 5.99 x10⁻¹⁴ 1.20 x10⁻¹³ Ta-182 1.18 x10⁻¹³ 4.7 x10⁻¹³ 9.4 x10⁻¹³ Pu-239 2.09 x10⁻¹⁶ 8.35 x10⁻¹⁶ 1.67 x10⁻¹⁵ Pu-240 2.73 x10⁻¹⁶ 1.09 x10⁻¹⁵ 2.18 x10⁻¹⁵ Pu-241 2.29 x10⁻¹⁴ 9.14 x10⁻¹⁴ 1.83 x10⁻¹³ Pu-242 5.80 x10⁻¹⁹ 2.32 x10⁻¹⁸ 4.64 x10⁻¹⁸

ANL-AFCI-183, Rev. 0.5 Preliminary NEPA Data Study
Advanced Burner Reactor Facility 27 September 21, 2007
4.3 Air Emissions from Operations
4.3.1 Radionuclide Emissions
Table 10 gives estimated annual gaseous emissions for significant radionuclides, based on expected annual releases calculated for CRBR ([CRBRP, 1977], Table 3.5-8). Releases are assumed to scale approximately linearly with reactor power.
4.3.2 Hazardous Air Pollutants
The only air pollutants emitted from the plant result from testing or emergency operation of the emergency generators and use of diesel-powered equipment for grounds maintenance. Releases from monthly testing are presented in Table 11, assuming the generators are diesel. Appendix A provides details of how the pollutant quantities were estimated. All pollutants are covered by the National Ambient Air Quality Standards of the U.S. Environmental Protection Agency.
Table 10. Estimated Annual Gaseous Radionuclide Emissions from the ABR Radionuclide Total Release from
250 MWth ABR, Ci Total Release from
1000 MWth ABR, Ci Total Release from
2000 MWth ABR, Ci Xe-131 m 1.28 x10⁻³ 5.1 x10⁻³ 1.02 x10⁻² Xe-133m 8.0 x10⁻³ 3.2 x10⁻² 6.4 x10⁻² Xe-133 0.145 0.58 1.16 Xe-135m 0.01 0.04 0.08 Xe-135 0.6 2.4 4.8 Xe-138 0.017 0.066 0.132 Kr-83m 0.017 0.066 0.132 Kr-85m 0.045 0.18 0.36 Kr-85 5.75 x10⁻⁴ 2.3 x10⁻³ 4.6x10⁻³ Kr-87 0.0375 0.15 0.3 Kr-88 0.08 0.32 0.64 Ar-39* 0.3 1.2 2.4 Ar-41* 0.011 0.044 0.088 Ne-23* 4.75 x10-3 1.9 x10⁻² 3.8x10⁻² H-3* 0.17 0.66 1.32 Total 1.5 5.8 11.6 * Release rate independent of failed fuel fraction
Table 11. ABR Estimated Annual Release of Hazardous Air Pollutants Annual Release (tons) Pollutant 250 MWth 1000 MWth 2000 MWth
SO2 4.1 5.5 7.1 Hydrocarbons 4.1 5.5 7.1
NOx 41 45 71 CO 8.2 11.0 14.1

ANL-AFCI-183, Rev. 0.5 Preliminary NEPA Data Study
Advanced Burner Reactor Facility 28 September 21, 2007
4.4 Transportation
4.4.1 Transportation Data for Shipment of Wastes
Estimated numbers of 55-gallon drums of solid radioactive waste which would be generated annually are provided in Table 12, based upon estimates for CRBR [CRBRP, 1977]. These quantities are consistent with the waste volumes discussed in Table 3. See Appendix A for calculation details.
Control rod assemblies, control rod assembly lines (cut to fit in the shipping cask), and radial shield assemblies can probably be shipped in any of several currently licensed shipping casks for radioactive materials.
Sanitary waste sludge and non-hazardous solid waste would be transported off site to commercial processing and/or disposal facilities.
4.4.2 Physics Data for Transportation of Spent Startup Driver Fuel
Several options for spent startup driver fuel from the ABR are currently being considered. These include 1) storing the spent fuel in the ABR Fuel Storage Facility indefinitely, 2) reprocessing the fuel in an on-site reprocessing facility, or 3) shipping the spent fuel off site for processing. If the fuel is shipped off site for processing periodically, the decay heat and isotopic composition of the spent fuel as a function of time after discharge must be evaluated against the heat and radiation limits of the spent fuel shipping casks. Table 13. lists decay heat per assembly as a function of time for both metal and oxide fuels at peak discharge burnup from the 250 MWth, 1000 MWth, and 2000 MWth cores. [Kim, 2007a] Tables 14 through 25 display, for each of the six candidate cores, isotopic mass per assembly of heavy metal nuclides and of fission products which are the dominant contributors to decay heat over the first ten years of post-irradiation cooling. [Kim, 2007a]
Table 12. Annual Estimated Low-Level Waste from the ABR Number of 55-Gallon Drums Waste Type
250 MWth 1000 MWth 2000 MWth Compactible solids 28 28 28
Non-compactible solids 155 155 155 Solidified liquid radwaste 35 140 280

ANL-AFCI-183, Rev. 0.5 Preliminary NEPA Data Study
Advanced Burner Reactor Facility 29 September 21, 2007
Table 13. Decay Heat per ABR Spent Startup Driver Fuel Assembly at Peak Discharge
Burnup Decay Heat (kW)
250 MWth ABR 1000 MWth ABR 2000 MWth ABR Time
Metal Oxide Metal Oxide Metal Oxide discharge 227.4 227.1 300.6 281.4 334.1 329.330 days 10.5 10.6 9.3 8.6 10.0 10.11 year 2.9 3.0 5.9 5.5 2.6 2.62 years 1.4 1.5 2.6 2.4 1.3 1.43 years 1.0 1.0 1.4 1.3 0.8 0.85 years 0.7 0.7 0.8 0.8 0.4 0.410 years 0.6 0.6 0.4 0.5 0.2 0.215 years 0.5 0.6 0.3 0.3 0.2 0.220 years 0.5 0.6 0.2 0.3 0.2 0.2
Table 14. Actinide Isotopic Masses at Peak Discharge Burnup of 250 MWth ABR Spent Metal Fuel Isotope Mass per Assembly (g.)
discharge 30 days 1 yr. 2 yr. 3 yr. 5 yr. 10 yr. 15 yr. 20 yr. U-234 U-235 U-236 U-237 U-238
6.51 21.57 4.25 0.08
17077.25
6.77 21.58 4.28
3.8E-03 17077.25
9.76 21.73 4.63
2.5E-05 17077.25
13.10 21.89 5.01
2.4E-05 17077.25
16.44 22.06 5.39
2.3E-05 17077.25
23.05 22.38 6.16
2.1E-05 17077.25
39.14 23.19 8.06
1.6E-05 17077.25
54.63 24.01 9.97
1.3E-05 17077.25
69.53 24.82 11.88
1.0E-05 17077.25
Np-237 Np-239
486.14 3.77
486.49 6.9E-04
487.18 1.4E-04
488.56 1.4E-04
489.60 1.4E-04
492.02 1.4E-04
498.94 1.4E-04
506.89 1.4E-04
515.53 1.4E-04
Pu-238 402.81 407.31 427.71 430.48 428.40 422.18 406.62 391.40 376.88 Pu-239 5743.13 5746.59 5746.59 5746.59 5746.59 5746.59 5743.13 5743.13 5743.13 Pu-240 3647.80 3647.80 3647.80 3651.26 3651.26 3654.72 3661.63 3665.09 3668.55 Pu-241 842.97 839.51 803.21 765.52 729.56 662.48 520.72 409.38 321.87 Pu-242 755.84 755.84 755.84 755.84 755.84 755.84 756.18 756.18 756.18 Am-241 642.08 645.54 680.81 717.46 752.04 816.69 951.19 1054.58 1133.41 Am-242m 32.73 32.72 32.58 32.43 32.28 31.99 31.27 30.57 29.88 Am-243 162.27 162.27 162.27 162.23 162.23 162.20 162.13 162.06 161.96 Cm-242 35.86 31.71 7.69 1.69 0.42 0.09 0.08 0.07 0.07 Cm-243 1.37 1.36 1.33 1.30 1.27 1.21 1.07 0.95 0.84 Cm-244 52.56 52.42 50.62 48.72 46.89 43.43 35.86 29.61 24.46 Cm-245 6.17 6.17 6.17 6.17 6.16 6.16 6.16 6.16 6.16

ANL-AFCI-183, Rev. 0.5 Preliminary NEPA Data Study
Advanced Burner Reactor Facility 30 September 21, 2007
Table 15. Fission Product Isotopic Masses at Peak Discharge Burnup of 250 MWth ABR Spent Metal Fuel
Isotope Mass per Assembly (g.) discharge 30 days 1 yr. 2 yr. 3 yr. 5 yr. 10 yr. 15 yr. 20 yr. Kr-85 1.97 1.96 1.84 1.73 1.62 1.42 1.03 0.75 0.54 Y-90 9.5E-03 8.8E-03 8.6E-03 8.4E-03 8.2E-03 7.8E-03 7.0E-03 6.2E-03 5.5E-03 Sr-90 35.20 35.13 34.39 33.58 32.79 31.26 27.75 24.64 21.88 Rh-106 3.7E-05 3.5E-05 1.9E-05 9.4E-06 4.7E-06 1.2E-06 3.8E-08 1.2E-09 3.9E-11 Ag-108m 5.7E-07 5.7E-07 5.6E-07 5.6E-07 5.6E-07 5.5E-07 5.4E-07 5.2E-07 5.1E-07 Sb-125 3.26 3.21 2.56 1.99 1.55 0.94 0.27 0.08 0.02 Te-125m 0.04 0.04 0.04 0.03 0.02 1.3E-02 3.8E-03 1.1E-03 3.1E-04 Cs-134 7.02 6.83 5.02 3.59 2.56 1.31 0.24 0.05 0.01 Cs-137 159.92 159.60 156.25 152.69 149.20 142.45 126.93 113.06 100.76 Ba-137m 2.5E-05 2.4E-05 2.4E-05 2.3E-05 2.3E-05 2.2E-05 1.9E-05 1.7E-05 1.5E-05 Pr-144 1.5E-03 1.4E-03 6.2E-04 2.5E-04 1.0E-04 1.8E-05 2.0E-07 2.4E-09 2.8E-11 Sm-147 14.57 15.27 22.18 28.03 32.52 38.62 45.02 46.75 47.20 Pm-147 31.88 31.96 25.19 19.34 14.85 8.75 2.34 0.62 0.17 Sm-151 19.86 19.88 19.75 19.59 19.45 19.15 18.42 17.73 17.06 Eu-154 2.16 2.15 2.00 1.84 1.70 1.45 0.97 0.65 0.43 Eu-155 4.60 4.54 4.00 3.47 3.02 2.28 1.14 0.56 0.28
Table 16. Actinide Isotopic Masses at Peak Discharge Burnup of 250 MWth ABR Spent Oxide Fuel
Isotope Mass per Assembly (g.) discharge 30 days 1 yr. 2 yr. 3 yr. 5 yr. 10 yr. 15 yr. 20 yr. U-234 7.28 7.57 10.90 14.61 18.32 25.66 43.52 60.73 77.30 U-235 23.47 23.49 23.64 23.82 23.99 24.34 25.20 26.07 26.93 U-236 5.00 5.04 5.41 5.82 6.22 7.04 9.07 11.12 13.16 U-237 8.6E-02 4.0E-03 2.7E-05 2.5E-05 2.4E-05 2.2E-05 1.7E-05 1.4E-05 1.1E-05 U-238 18932.27 18932.27 18932.27 18932.27 18932.27 18932.27 18932.27 18932.27 18932.27 Np-237 490.85 490.85 491.97 493.09 494.21 496.82 504.29 512.50 521.46 Np-239 4.35 7.9E-04 1.5E-04 1.5E-04 1.5E-04 1.5E-04 1.5E-04 1.5E-04 1.5E-04 Pu-238 447.92 452.78 475.55 478.16 475.92 469.20 451.66 434.86 418.44 Pu-239 6099.24 6102.97 6102.97 6102.97 6102.97 6102.97 6099.24 6099.24 6099.24 Pu-240 3896.94 3896.94 3900.68 3900.68 3900.68 3904.41 3911.87 3915.61 3919.34 Pu-241 902.19 898.84 860.01 819.33 780.88 709.21 557.67 438.22 344.53 Pu-242 799.55 799.55 799.55 799.55 799.55 799.92 799.92 799.92 800.29 Am-241 658.45 661.81 699.88 739.08 776.40 845.46 989.54 1100.40 1185.13 Am-242m 35.63 35.61 35.47 35.30 35.14 34.83 34.04 33.27 32.52 Am-243 173.57 173.61 173.57 173.57 173.53 173.50 173.42 173.35 173.27 Cm-242 39.23 34.69 8.42 1.85 0.46 0.10 0.08 0.08 0.08 Cm-243 1.84 1.84 1.79 1.75 1.71 1.63 1.44 1.28 1.13 Cm-244 59.69 59.54 57.48 55.32 53.23 49.31 40.72 33.64 27.78 Cm-245 7.33 7.33 7.32 7.32 7.32 7.32 7.32 7.32 7.31

ANL-AFCI-183, Rev. 0.5 Preliminary NEPA Data Study
Advanced Burner Reactor Facility 31 September 21, 2007
Table 17. Fission Product Isotopic Masses at Peak Discharge Burnup of 250 MWth ABR Spent Oxide Fuel
Isotope Mass per Assembly (g.) discharge 30 days 1 yr. 2 yr. 3 yr. 5 yr. 10 yr. 15 yr. 20 yr. Kr-85 2.00 1.99 1.87 1.76 1.65 1.45 1.05 0.76 0.55 Y-90 9.6E-03 9.0E-03 8.8E-03 8.6E-03 8.4E-03 8.0E-03 7.1E-03 6.3E-03 5.6E-03 Sr-90 35.89 35.82 35.05 34.23 33.42 31.87 28.29 25.12 22.30 Rh-106 3.7E-05 3.5E-05 1.9E-05 9.4E-06 4.7E-06 1.2E-06 3.9E-08 1.2E-09 4.0E-11 Ag-108m 5.7E-07 5.7E-07 5.7E-07 5.7E-07 5.6E-07 5.6E-07 5.4E-07 5.3E-07 5.1E-07 Sb-125 3.32 3.27 2.60 2.02 1.58 0.96 0.27 0.08 0.02 Te-125m 0.04 0.04 0.04 0.03 0.02 1.3E-02 3.8E-03 1.1E-03 3.1E-04 Cs-134 6.72 6.54 4.80 3.43 2.45 1.25 0.23 0.04 0.01 Cs-137 163.04 162.75 159.35 155.69 152.15 145.28 129.41 115.30 102.72 Ba-137m 2.5E-05 2.5E-05 2.4E-05 2.4E-05 2.3E-05 2.2E-05 2.0E-05 1.8E-05 1.6E-05 Pr-144 1.5E-03 1.4E-03 6.2E-04 2.5E-04 1.0E-04 1.8E-05 2.1E-07 2.4E-09 2.8E-11 Sm-147 15.32 16.04 23.15 29.17 33.79 40.05 46.66 48.45 48.90 Pm-147 32.84 32.90 25.92 19.91 15.28 9.01 2.40 0.64 0.17 Sm-151 20.48 20.51 20.37 20.21 20.06 19.75 19.00 18.28 17.59 Eu-154 2.11 2.09 1.95 1.79 1.66 1.41 0.94 0.63 0.42 Eu-155 4.69 4.64 4.08 3.55 3.08 2.33 1.16 0.58 0.29
Table 18. Actinide Isotopic Masses at Peak Discharge Burnup of 1000 MWth ABR Spent
Metal Fuel Isotope Mass per Assembly (g.)
discharge 30 days 1 yr. 2 yr. 3 yr. 5 yr. 10 yr. 15 yr. 20 yr. U-234 0.23 0.24 0.34 0.46 0.57 0.80 1.35 1.88 2.39 U-235 40.61 40.62 40.84 41.06 41.29 41.74 42.87 44.00 45.14 U-236 16.13 16.14 16.32 16.51 16.71 17.09 18.05 19.01 19.96 U-237 0.27 1.3E-02 5.2E-06 4.9E-06 4.7E-06 4.3E-06 3.4E-06 2.6E-06 2.1E-06 U-238 54912.55 54912.55 54912.55 54912.55 54912.55 54912.55 54912.55 54912.55 54912.55 Np-237 33.48 33.74 33.78 33.83 33.89 34.05 34.61 35.36 36.28 Np-239 13.21 1.9E-03 1.4E-06 1.4E-06 1.4E-06 1.4E-06 1.4E-06 1.4E-06 1.4E-06 Pu-238 13.99 14.14 14.68 14.74 14.65 14.44 13.89 13.37 12.86 Pu-239 7992.70 8003.58 8003.58 8003.58 8003.25 8003.25 8002.59 8002.26 8001.94 Pu-240 1839.94 1839.94 1839.61 1839.61 1839.18 1839.18 1838.09 1836.90 1836.14 Pu-241 175.64 174.96 167.41 159.57 152.06 138.08 108.55 85.32 67.08 Pu-242 21.44 21.44 21.44 21.45 21.45 21.45 21.45 21.45 21.45 Am-241 18.37 19.06 26.58 34.40 41.84 55.64 84.62 107.05 124.37 Am-242m 0.70 0.70 0.70 0.69 0.69 0.69 0.67 0.65 0.64 Am-243 1.62 1.62 1.62 1.62 1.62 1.62 1.62 1.62 1.62 Cm-242 0.98 0.87 0.21 0.05 1.1E-02 2.1E-03 1.6E-03 1.6E-03 1.5E-03 Cm-243 0.03 0.03 0.03 0.03 0.03 0.03 0.03 0.02 2.0E-02 Cm-244 0.28 0.28 0.27 0.26 0.25 0.23 0.19 0.16 0.13 Cm-245 0.02 0.02 0.02 0.02 0.02 0.02 0.02 0.02 2.4E-02

ANL-AFCI-183, Rev. 0.5 Preliminary NEPA Data Study
Advanced Burner Reactor Facility 32 September 21, 2007
Table 19. Fission Product Isotopic Masses at Peak Discharge Burnup of 1000 MWth ABR
Spent Metal Fuel Isotope Mass per Assembly (g.)
discharge 30 days 1 yr. 2 yr. 3 yr. 5 yr. 10 yr. 15 yr. 20 yr. Kr-85 4.80 4.77 4.50 4.22 3.95 3.47 2.51 1.82 1.32 Y-90 2.4E-02 2.2E-02 2.1E-02 2.1E-02 2.0E-02 1.9E-02 1.7E-02 1.5E-02 1.4E-02 Sr-90 87.02 86.83 84.99 82.99 80.99 77.28 68.59 60.90 54.07 Rh-106 5.1E-05 4.8E-05 2.5E-05 1.3E-05 6.4E-06 1.6E-06 5.2E-08 1.7E-09 5.4E-11 Ag-108m 1.4E-06 1.4E-06 1.4E-06 1.4E-06 1.4E-06 1.4E-06 1.3E-06 1.3E-06 1.2E-06 Sb-125 0.03 3.4E-03 1.2E-13 4.6E-25 1.8E-36 0.00 0.00 0.00 0.00 Te-125m 0.09 0.09 0.08 0.06 0.05 0.03 7.9E-03 2.3E-03 6.5E-04 Cs-134 27.35 26.61 19.54 13.96 9.98 5.09 0.95 0.18 0.03 Cs-137 362.72 362.00 354.42 346.33 338.40 323.14 287.89 256.49 228.48 Ba-137m 5.6E-05 5.5E-05 5.4E-05 5.3E-05 5.2E-05 4.9E-05 4.4E-05 3.9E-05 3.5E-05 Pr-144 2.1E-03 2.0E-03 8.7E-04 3.6E-04 1.5E-04 2.5E-05 2.9E-07 3.3E-09 3.9E-11 Sm-147 41.90 42.98 53.65 62.67 69.60 79.01 88.91 91.54 92.25 Pm-147 49.41 49.35 38.87 29.85 22.92 13.51 3.61 0.96 0.26 Sm-151 38.83 38.85 38.58 38.29 37.99 37.41 36.00 34.64 33.33 Eu-154 7.66 7.61 7.07 6.52 6.02 5.12 3.42 2.29 1.53 Eu-155 9.33 9.23 8.12 7.06 6.14 4.64 2.31 1.15 0.57
Table 20. Actinide Isotopic Masses at Peak Discharge Burnup of 1000 MWth ABR Spent Oxide Fuel
Isotope Mass per Assembly (g.) discharge 30 days 1 yr. 2 yr. 3 yr. 5 yr. 10 yr. 15 yr. 20 yr. U-234 0.35 0.37 0.51 0.67 0.83 1.15 1.92 2.66 3.38 U-235 35.49 35.51 35.75 36.01 36.26 36.78 38.07 39.36 40.65 U-236 18.62 18.64 18.91 19.19 19.48 20.06 21.49 22.93 24.36 U-237 0.22 1.0E-02 9.2E-06 8.7E-06 8.3E-06 7.6E-06 6.0E-06 4.7E-06 3.7E-06 U-238 53121.47 53121.47 53121.47 53121.47 53121.47 53121.47 53121.47 53121.47 53121.47 Np-237 29.88 30.10 30.17 30.27 30.38 30.67 31.69 33.06 34.72 Np-239 12.90 1.9E-03 3.3E-06 3.3E-06 3.3E-06 3.3E-06 3.3E-06 3.3E-06 3.3E-06 Pu-238 19.05 19.31 20.48 20.65 20.56 20.27 19.52 18.79 18.09 Pu-239 9100.22 9115.84 9115.84 9115.84 9115.84 9115.84 9112.46 9108.03 9108.03 Pu-240 2757.29 2757.29 2756.85 2756.85 2756.85 2756.07 2754.51 2753.28 2751.72 Pu-241 311.15 309.92 296.55 282.58 269.28 244.59 192.27 151.12 118.80 Pu-242 43.93 43.93 43.93 43.93 43.93 43.94 43.94 43.95 43.95 Am-241 36.65 37.87 51.21 65.05 78.21 102.63 153.93 193.66 224.28 Am-242m 1.51 1.51 1.50 1.49 1.49 1.47 1.44 1.41 1.37 Am-243 3.79 3.80 3.80 3.79 3.79 3.79 3.79 3.79 3.79 Cm-242 1.99 1.76 0.43 0.09 0.02 4.4E-03 3.5E-03 3.4E-03 3.3E-03 Cm-243 0.10 0.10 0.09 0.09 0.09 0.08 0.07 0.07 0.06 Cm-244 0.81 0.81 0.78 0.75 0.72 0.67 0.55 0.46 0.38 Cm-245 0.08 0.08 0.08 0.08 0.08 0.08 0.08 0.08 0.08

ANL-AFCI-183, Rev. 0.5 Preliminary NEPA Data Study
Advanced Burner Reactor Facility 33 September 21, 2007
Table 21. Fission Product Isotopic Masses at Peak Discharge Burnup of 1000 MWth ABR Spent Oxide Fuel
Isotope Mass per Assembly (g.) discharge 30 days 1 yr. 2 yr. 3 yr. 5 yr. 10 yr. 15 yr. 20 yr. Kr-85 5.27 5.24 4.94 4.63 4.34 3.81 2.76 2.00 1.45 Y-90 2.6E-02 2.5E-02 2.4E-02 2.3E-02 2.3E-02 2.2E-02 1.9E-02 1.7E-02 1.5E-02 Sr-90 98.06 97.90 95.78 93.54 91.30 87.10 77.32 68.63 60.93 Rh-106 4.9E-05 4.6E-05 2.4E-05 1.2E-05 6.2E-06 1.6E-06 5.0E-08 1.6E-09 5.2E-11 Ag-108m 1.6E-06 1.6E-06 1.6E-06 1.6E-06 1.6E-06 1.6E-06 1.6E-06 1.5E-06 1.5E-06 Sb-125 6.87 6.75 5.37 4.18 3.26 1.97 0.56 0.16 0.05 Te-125m 0.09 0.09 0.08 0.06 0.05 0.03 7.9E-03 2.3E-03 6.5E-04 Cs-134 27.02 26.29 19.31 13.79 9.86 5.03 0.94 0.17 0.03 Cs-137 415.08 414.26 405.60 396.28 387.28 369.74 329.43 293.48 261.48 Ba-137m 6.4E-05 6.3E-05 6.2E-05 6.1E-05 5.9E-05 5.7E-05 5.0E-05 4.5E-05 4.0E-05 Pr-144 2.0E-03 1.8E-03 8.1E-04 3.3E-04 1.4E-04 2.3E-05 2.7E-07 3.1E-09 3.6E-11 Sm-147 57.94 59.09 70.52 80.20 87.60 97.68 108.32 111.11 111.86 Pm-147 53.07 52.88 41.63 31.96 24.54 14.47 3.86 1.03 0.27 Sm-151 45.64 45.66 45.34 44.99 44.65 43.97 42.31 40.71 39.17 Eu-154 8.37 8.31 7.72 7.12 6.57 5.59 3.74 2.50 1.67 Eu-155 10.14 10.02 8.82 7.67 6.67 5.04 2.51 1.25 0.62
Table 22. Actinide Isotopic Masses at Peak Discharge Burnup of 2000 MWth ABR Spent Metal Fuel
Isotope Mass per Assembly (g.) discharge 30 days 1 yr. 2 yr. 3 yr. 5 yr. 10 yr. 15 yr. 20 yr. U-234 0.10 0.10 0.11 0.16 0.23 0.30 0.44 0.77 1.08 U-235 31.78 31.80 31.83 31.99 32.21 32.43 32.85 33.93 35.01 U-236 11.31 11.33 11.37 11.52 11.73 11.94 12.36 13.42 14.46 U-237 0.19 8.9E-03 2.5E-05 6.2E-06 5.9E-06 5.6E-06 5.1E-06 4.0E-06 3.2E-06 U-238 38106.10 38106.10 38106.10 38106.10 38106.10 38106.10 38106.10 38106.10 38106.10 Np-237 15.53 15.72 15.73 15.75 15.80 15.86 16.02 16.64 17.49 Np-239 12.95 1.9E-03 1.6E-06 1.6E-06 1.6E-06 1.6E-06 1.6E-06 1.6E-06 1.6E-06 Pu-238 7.89 8.04 8.24 8.70 8.82 8.79 8.66 8.34 8.03 Pu-239 7589.82 7603.81 7603.81 7603.81 7603.81 7603.81 7603.81 7601.96 7601.96 Pu-240 2017.40 2017.40 2017.21 2017.21 2016.83 2016.65 2016.27 2015.52 2014.39 Pu-241 209.86 209.03 207.39 200.02 190.60 181.63 164.97 129.69 101.95 Pu-242 24.96 24.96 24.96 24.96 24.96 24.96 24.96 24.97 24.97 Am-241 15.17 16.00 17.64 25.01 34.36 43.25 59.75 94.42 121.31 Am-242m 0.58 0.58 0.58 0.58 0.58 0.58 0.57 0.56 0.55 Am-243 1.88 1.88 1.88 1.88 1.88 1.88 1.88 1.88 1.87 Cm-242 1.09 0.97 0.75 0.23 0.05 1.2E-02 1.9E-03 1.4E-03 1.3E-03 Cm-243 0.04 0.04 0.04 0.04 0.04 0.04 0.04 0.03 0.03 Cm-244 0.34 0.34 0.34 0.33 0.32 0.31 0.28 0.23 0.19 Cm-245 0.03 0.03 0.03 0.03 0.03 0.03 0.03 0.03 0.03

ANL-AFCI-183, Rev. 0.5 Preliminary NEPA Data Study
Advanced Burner Reactor Facility 34 September 21, 2007
Table 23. Fission Product Isotopic Masses at Peak Discharge Burnup of 2000 MWth ABR Spent Metal Fuel
Isotope Mass per Assembly (g.) discharge 30 days 1 yr. 2 yr. 3 yr. 5 yr. 10 yr. 15 yr. 20 yr. Kr-85 3.82 3.80 3.76 3.59 3.36 3.15 2.77 2.00 1.45 Y-90 1.9E-02 1.7E-02 1.7E-02 1.7E-02 1.6E-02 1.6E-02 1.5E-02 1.3E-02 1.2E-02 Sr-90 67.58 67.46 67.19 65.99 64.43 62.93 60.00 53.27 47.29 Rh-106 5.5E-05 5.2E-05 4.7E-05 2.8E-05 1.4E-05 7.0E-06 1.8E-06 5.7E-08 1.8E-09 Ag-108m 1.1E-06 1.1E-06 1.1E-06 1.1E-06 1.1E-06 1.1E-06 1.1E-06 1.1E-06 1.0E-06 Sb-125 5.87 5.78 5.55 4.60 3.58 2.79 1.69 0.48 0.14 Te-125m 0.07 0.08 0.07 0.06 0.05 0.04 0.02 0.01 1.9E-03 Cs-134 20.71 20.14 19.06 14.79 10.57 7.55 3.86 0.72 0.13 Cs-137 291.08 290.55 289.44 284.44 277.95 271.59 259.31 231.03 205.83 Ba-137m 4.5E-05 4.4E-05 4.4E-05 4.4E-05 4.3E-05 4.2E-05 4.0E-05 3.5E-05 3.1E-05 Pr-144 2.3E-03 2.2E-03 1.9E-03 9.5E-04 3.9E-04 1.6E-04 2.7E-05 3.1E-07 3.7E-09 Sm-147 27.15 28.17 30.17 38.31 46.90 53.50 62.44 71.87 74.36 Pm-147 46.81 46.92 45.12 36.98 28.39 21.80 12.85 3.43 0.92 Sm-151 32.13 32.18 32.14 31.95 31.70 31.46 30.98 29.81 28.68 Eu-154 5.54 5.50 5.43 5.11 4.71 4.35 3.70 2.47 1.65 Eu-155 7.90 7.81 7.64 6.87 5.98 5.20 3.93 1.95 0.97
Table 24. Actinide Isotopic Masses at Peak Discharge Burnup of 2000 MWth ABR Spent Oxide Fuel
Isotope Mass per Assembly (g.) discharge 30 days 1 yr. 2 yr. 3 yr. 5 yr. 10 yr. 15 yr. 20 yr. U-234 0.11 0.12 0.13 0.19 0.27 0.35 0.53 0.95 1.34 U-235 23.17 23.19 23.23 23.39 23.62 23.83 24.28 25.39 26.50 U-236 10.65 10.67 10.72 10.93 11.22 11.50 12.06 13.46 14.87 U-237 0.19 8.75E-03 2.84E-05 9.69E-06 9.22E-06 8.75E-06 8.04E-06 6.26E-06 4.96E-06 U-238 31310.54 31310.54 31310.54 31310.54 31310.54 31310.54 31310.54 31310.54 31310.54 Np-237 13.12 13.31 13.32 13.36 13.43 13.52 13.77 14.70 16.03 Np-239 13.26 2.01E-03 3.31E-06 3.31E-06 3.31E-06 3.31E-06 3.31E-06 3.31E-06 3.31E-06 Pu-238 9.31 9.57 9.94 10.78 11.02 10.99 10.85 10.45 10.06 Pu-239 7835.27 7848.22 7848.22 7848.22 7848.22 7848.22 7848.22 7848.22 7845.74 Pu-240 2698.41 2698.41 2698.23 2698.23 2697.88 2697.71 2697.18 2695.79 2694.57 Pu-241 328.56 327.27 324.70 313.12 298.42 284.38 258.28 203.03 159.61 Pu-242 45.14 45.14 45.14 45.14 45.14 45.14 45.14 45.14 45.14 Am-241 21.19 22.49 25.06 36.59 51.24 65.16 91.03 145.30 187.39 Am-242m 0.92 0.92 0.92 0.91 0.91 0.91 0.90 0.87 0.85 Am-243 3.88 3.88 3.88 3.88 3.88 3.88 3.88 3.88 3.88 Cm-242 1.93 1.71 1.32 0.41 0.09 0.02 2.96E-03 2.13E-03 2.13E-03 Cm-243 0.09 0.09 0.09 0.09 0.09 0.09 0.08 0.07 0.07 Cm-244 0.85 0.85 0.84 0.82 0.79 0.76 0.70 0.58 0.48 Cm-245 0.08 0.08 0.08 0.08 0.08 0.08 0.08 0.08 0.08

ANL-AFCI-183, Rev. 0.5 Preliminary NEPA Data Study
Advanced Burner Reactor Facility 35 September 21, 2007
Table 25. Fission Product Isotopic Masses at Peak Discharge Burnup of 2000 MWth ABR Spent Oxide Fuel
Isotope Mass per Assembly (g.) discharge 30 days 1 yr. 2 yr. 3 yr. 5 yr. 10 yr. 15 yr. 20 yr. Kr-85 4.48 4.46 4.41 4.20 3.94 3.69 3.24 2.34 1.70 Y-90 2.2E-02 2.0E-02 2.0E-02 1.9E-02 1.9E-02 1.9E-02 1.8E-02 1.5E-02 1.4E-02 Sr-90 78.79 78.64 78.33 76.96 75.14 73.38 69.96 62.10 55.14 Rh-106 6.7E-05 6.3E-05 5.7E-05 3.3E-05 1.7E-05 8.5E-06 2.1E-06 6.9E-08 2.2E-09 Ag-108m 1.4E-06 1.3E-06 1.3E-06 1.3E-06 1.3E-06 1.3E-06 1.3E-06 1.3E-06 1.3E-06 Sb-125 6.73 6.62 6.36 5.26 4.10 3.19 1.94 0.56 0.15 Te-125m 0.08 0.08 0.08 0.07 0.06 0.05 0.02 0.01 2.2E-03 Cs-134 25.47 24.79 23.45 18.20 13.00 9.29 4.74 0.89 0.17 Cs-137 344.86 344.21 342.91 337.01 329.29 321.79 307.24 273.72 243.86 Ba-137m 5.3E-05 5.3E-05 5.2E-05 5.2E-05 5.1E-05 5.0E-05 4.7E-05 4.1E-05 3.8E-05 Pr-144 2.7E-03 2.6E-03 2.2E-03 1.1E-03 4.6E-04 1.9E-04 3.2E-05 3.8E-07 4.4E-09 Sm-147 31.51 32.71 35.03 44.54 54.55 62.23 72.67 83.66 86.61 Pm-147 54.57 54.70 52.61 43.12 33.11 25.42 14.99 4.00 1.06 Sm-151 37.66 37.71 37.66 37.43 37.15 36.87 36.30 34.93 33.62 Eu-154 6.73 6.68 6.58 6.21 5.72 5.28 4.49 3.00 2.01 Eu-155 9.43 9.33 9.11 8.20 7.13 6.19 4.69 2.33 1.16
4.5 Construction
4.5.1 General Construction Requirements
Preliminary estimates of construction requirements for the ABR plant are summarized in Table 26. Steel usage includes structural steel, component steel, furnishings, support systems such as fire protection and railroads, fences, and steel used in the HVAC and electrical systems. Water requirements include compaction of fill, dust control, fire protection, sanitary facilities, production of concrete, and other construction-related activities. See the discussion of Table 26 in Appendix A for further details regarding the basis for the estimates presented in the table.
4.5.2 Construction Land Requirements
Table 27 outlines the estimated land use needed to build an ABR. Details of how these estimates were obtained are given in Appendix A. Once an accident analysis of the ABR is completed and radioactivity release values are available, the total site area will be adjusted consistent with regulatory requirements governing releases at the site boundary.

ANL-AFCI-183, Rev. 0.5 Preliminary NEPA Data Study
Advanced Burner Reactor Facility 36 September 21, 2007
4.5.3 Construction Wastes
It is assumed that no low-level or mixed low-level radioactive wastes will be generated during the construction of the ABR plant. The estimated quantities of all hazardous and non-hazardous construction wastes are listed in Table 28. These wastes are assumed to scale with plant size. The information used to generate these waste estimates is provided in the discussion of Table 28 in Appendix A and in the spreadsheet tables listed in Appendix B.
Table 26. Preliminary Construction Requirements for the ABR ABR Power Capacity 250 MWth 1000 MWth 2000 MWth
Construction Period (including cold start-up)
5 years 5.5 years 6 years
Construction Employment Total worker years 2700 7000 11400 Peak workers (4th or 5th year) 780 2050 3330 Materials/Resources Consumed During Construction Period Electrical Power required (Peak)
9 MWe 23 MWe 38 MWe
Power available from back-up generators
2 MWe 6 MWe 12 MWe
Back-up generators, fuel type. Internal combustion, diesel or natural gas Concrete (yd3) 76,000 200,000 325,000 Steel (tons) 9,900 24,700 39,200 Liquid fuel (gal.) 60,000 144,00 243,000 Lube oil (gal.) 700 1,700 2,900 Water (gal/day, max.) 20,000 51,000 83,000
Table 27. Estimated ABR Construction Land Requirements
ABR Power Capacity 250 MWth 1000 MWth 2000 MWth
Land Use Land Area (acres) Land Area (acres) Land Area (acres) Total Permanent Site 1100 1400 1640 Facilities 80 100 120 Plant 3 4 5 Temporary Laydown Area 60 160 250 Temporary Parking Lots 5 12 20 Permanent Parking Lots 2 2 3

ANL-AFCI-183, Rev. 0.5 Preliminary NEPA Data Study
Advanced Burner Reactor Facility 37 September 21, 2007
Table 28. Estimated Total Construction Wastes for an ABR Plant Waste Liquid (gal.) Solid
250 MWth
1000 MWth
2000 MWth
250 MWth 1000 MWth 2000 MWth
Hazardous 7,200 21,000 37,200 1.4 yd3 4.1 yd3 7.2 yd3
Non-hazardous (sanitary): - - - 440 tons 1,150 tons 1,870 tons
- Liquid waste processed on site
23,000,000 61,000,000 99,000,000 - - -
- Portable toilets 196,000 518,000 841,000 - - -
Non-hazardous (other) 82,000 217,000 352,000 32,400 yd3 85,600 yd3 139,000 yd3

ANL-AFCI-183, Rev. 0.5 Preliminary NEPA Data Study
Advanced Burner Reactor Facility 38 September 21, 2007
References
[Cahalan, 1990] Cahalan, J. et al., “Performance of Metal and Oxide Fuels during Accidents in a Large Liquid Metal Cooled Reactor”, Proc. 1990 Intl. Fast Reactor Safety Mtg., Snowbird UT, Vol. IV, p. 73, August, 1990.
[Chang, 2006] Chang, Y. I. et al., “Advanced Burner Test Reactor Preconceptual Design Report,” ANL-ABR-1 (ANL-AFCI-173), September 5, 2006.
[Caterpillar, 1990] Caterpillar Performance Handbook, 21st edition.
[Cabell, 1980] Cabell, C. P., A Summary Description of the Fast Flux Test Facility, HEDL-400, Richland, Wash., 1980.
[CRBRP, 1982] Clinch River Breeder Reactor Preliminary Safety Analysis Report, Amendment 70, Project Management Corporation, 1982.
[CRBRP, 1977] Clinch River Breeder Reactor Plant Environmental Report, Vols. 2 and 3, Project Management Corporation, 1977.
[CRBRP, 1974] Clinch River Breeder Reactor Plant Reference Design Report, Vol. I, Westinghouse Electric Corporation, June 1974.
[Cutforth, 1971] Cutforth, D. C. and W. H. Perry, “Purity of EBR-II Primary Cover Gas,” ANL/EBR-052, November 1971.
[Flores, 2007] Flores, Oscar E., San Onofre Nuclear Generating Station, Southern California Edison, private communication.
[IAEA, 2007] “Power Reactor Information System: United States of America,” IAEA Power Reactor Information System home page [http://www.iaea.org/programmes/a2/index.html].
[Kim, 2006a] Kim, T. K. and W. S. Yang, Argonne National Laboratory, private communication, December 20, 2006.
[Kim, 2006b] Kim, T. K., W. S. Yang, and R. N. Hill, Argonne National Laboratory, private communication, September 1, 2006.
[Kim, 2007a] Kim, T. K. and W. S. Yang, Argonne National Laboratory, private communication, June 2007.
[Kim, 2007b] Kim, T. K. and W. S. Yang, Argonne National Laboratory, private communication, June 2007.
[Lawson, 2007] Lawson, J., Spallation Neutron Source, private communication.

ANL-AFCI-183, Rev. 0.5 Preliminary NEPA Data Study
Advanced Burner Reactor Facility 39 September 21, 2007
[Lomperski, 2007] Lomperski, S. W., Argonne National Laboratory, private communication.
[MDNR, 2006] Missouri Department of Natural Resources website, December 18, 2006 [http://www.dnr.mo.gov/env/swmp/pubs-reports/Table101.htm].
[Mirant, 2007] “Zeeland Generating Plant,” Mirant Corporation web site [http://www.mirant.com/our_business/where_we_work/zeeland.htm].
[NEF, 2005] National Enrichment Facility Safety Analysis Report, Rev. 7, Louisiana Energy Services, June 2005 [http://www.nrc.gov/materials/fuel-cycle-fac/licapp-envir-rpts.html].
[Perry, 1997] Perry, R.H., D. W. Green, and J. O. Maloney, Perry’s Chemical Engineers Handbook, McGraw-Hill, 1997, p. 27-9.
[PSAI, 2006] Portable Sanitation Association International, September 24, 2006 [http: //www.americanrestroom.org/contacts/PSAI%20Extended%20Chart%20w_pics.pdf]
[Royl, 1990] Royl, P. et al., “Influence of Metal and Oxide Fuel Behavior on the ULOF Accident in 3500MWth Heterogeneous LMR Cores and Comparison with Other Large Cores,” Proc. 1990 Intl. Fast Reactor Safety Mtg., Snowbird UT, Vol. IV, p. 83, August, 1990.
[Sienicki, 2007] Sienicki, J. and A. Moisseytsev, Argonne National Laboratory, private communication.
[Smith, 2002] Smith, D., “Adequate Cooling of Generators is Essential”, Power Engineering, Vol. 106, part 9, pp. 42-47, September 2002. [http://pepei.pennnet.com/articles/article_display.cfm?article_id=154893]
[Speranza, 2005] Speranza, J., “Continuous hydrogen replacement technique offers improved power plant electric generator efficiency and longevity,” Technical Update from Proton Energy, January 2005. [http://72.14.253.104/search?q=cache:rwJY2mqFdAAJ:www.protonenergy.com/data/Unsorted/H2Replen_v3-17411.pdf+%22Mirant-Zeeland+improves+operational+efficiency%22&hl=en&ct=clnk&cd=1&gl=us]
[Tawney, 2003] Tawney, R., Z. Khan, and J. Zachary, “Economic and Performance Evaluation of Heat Sink Options in Combined Cycle Applications,” Proceedings of Turbo Expo: ASME/IGTI Turbo Expo, June 16-19, 2003.
[USDOE, 1988] Phase IX Update (1987) report for the Energy Economic Data Base Program, EEDB-IX, U.S. Department of Energy, DOE/NE-0091, 1988.

ANL-AFCI-183, Rev. 0.5 Preliminary NEPA Data Study
Advanced Burner Reactor Facility 40 September 21, 2007
[USEPA, 1999] U.S. Environmental Protection Agency, Biosolids Generation, Use, and Disposal in The United States, EPA530-R-99-009, September 1999 [http://www.epa.gov /epaoswer/non-hw/compost/biosolid.pdf].
[USNRC, 2005] Environmental Impact Statement for the Proposed National Enrichment Facility in Lea County, New Mexico, NUREG-1790, June 2005 [http://www.nrc.gov/ reading-rm/doc-collections/nuregs/staff/sr1790/ch4-10.pdf].
[USNRC, 2006] Code of Federal Regulations, Title 10, Part 20, Subpart C (sections 1201-1208), Nuclear Regulatory Commission [http://www.access.gpo.gov/nara/cfr/waisidx_06/10cfr20_06.html].

ANL-AFCI-183, Rev. 0.5 Preliminary NEPA Data Study
Advanced Burner Reactor Facility 41 September 21, 2007
Appendix A: Bases for Data Presented
As mentioned in Sec. 1, the datacall information presented in this report was derived from a number of information sources. Table A.1 identifies these sources with the particular data parameters to which each source contributed.
Table A.1. Data Sources for Various Parameters
Data Source Parameters
Clinch River Breeder Reactor Plant Environmental Report [CRBRP, 1977]
Employment estimates (construction and operations), liquid radioactive waste effluent activities, radionuclide gaseous emissions, radioactive and hazardous wastes volumes, sanitary liquid waste, plant power consumption, fossil fuel usage (construction and operations), chemical usage (sodium hypochlorite, sulfuric acid, sodium hydroxide), water usage (construction and operations), quantities of hazardous air pollutants, concrete volume for construction, land requirements, sanitary liquid wastes, plant electrical requirements
Clinch River Breeder Reactor Preliminary Safety Analysis Report [CRBRP, 1982]
Employment estimates
National Enrichment Facility Safety Analysis Report [NEF, 2005] and Environmental Impact Statement [USNRC, 2005]
Construction hazardous wastes
Missouri Department of Natural Resources [MDNR, 2006]
Construction solid sanitary wastes
Energy Economic Data Base [USDOE , 1988] Construction sanitary and non-hazardous wastes, steel usage
Caterpillar Performance Handbook [Caterpillar 1990]
Construction liquid fuel and lube oil.
ABTR Preconceptual Design Report [Chang, 2006] Plant power consumption, plant layout and building dimensions, inert gases used, plant electrical requirements, operations fossil fuel usage, process gases
Fuel cycle analyses performed for the ABR [Kim, 2006a], [Kim, 2006b], [Kim, 2007a], [Kim, 2007b]
Fissile inventory, spent fuel discharge, decay heat and isotopic masses of spent fuel.
Spallation Neutron Source [Lawson, 2007] Construction electrical requirements San Onofre Nuclear Generating Station [Flores, 2007]
Process gases, chemical usage (hydrazine, monoethanalomine
Zeeland Generating Plant [Mirant, 2007] and [Speranza, 2005]
Hydrogen usage
Portable Sanitation Association International [PSAI, 2006]
Construction liquid sanitary wastes
Power Engineering article on cooling of generators [Smith, 2002]
Hydrogen usage

ANL-AFCI-183, Rev. 0.5 Preliminary NEPA Data Study
Advanced Burner Reactor Facility 42 September 21, 2007
As indicated in Sec. 3.1, values for some operational parameters and some construction parameters are dependent upon reactor power, but not necessarily by a simple linear dependence. Table A.2 summarizes the various techniques used to adjust parameters for reactor power. Details of these adjustments are discussed in the explanations below of the calculations used for the data presented in each table.
Table A.2. Approaches to Scaling for Reactor Power for Various Parameters Parameters Scaling Approach
Fissile inventory, spent fuel discharge, spent fuel physics data Fuel cycle analysis of candidate core designs
Building and structure dimensions Sized to fit equipment Low-level liquid waste Linear with power Low-level solid waste Linear with power for solidified liquid radwaste Mixed low-level solid waste Linear with power for most components Hazardous liquid and solid wastes Linear with power Sanitary liquid and solid wastes Linear with power Solid non-hazardous waste Linear with power
Electrical demand for operations
Linear scaling with power for sodium and water pumps, CO2 compressors (Brayton cycle option), feedwater and condensate pumps (Rankine cycle option)
Emergeny generator fossil fuel use Linear with generator capacity Grounds maintenance fossil fuel use Scaled to facilities areas Process gases Linear with power Process chemicals Linear with power
Operations employment 88% of CRBRP for 250 MWth, 112% for 2000 MWth
Water usage Linear with power Activity of liquid waste effluent and gaseous radionuclide emissions Linear with power
Hazardous air pollutants Linear with power Construction time Data on construction of existing plants Construction employment (PABR/PCRBR)0.7 (take PCRBR to be 1000 MWth) Construction electrical power Linear scaling Concrete (PABR/PCRBR)0.7 (take PCRBR to be 1000 MWth) Steel Primarily scaling by (PABR/PPWR)0.7
Construction liquid fuel and lube oil Proportional to land requirements and concrete volume
Construction water consumption (PABR/PCRBR)0.7 (take PCRBR to be 1000 MWth)
Land requirements 80% of CRBRP for 250 MWth, 120% for 2000 MWth
Construction wastes Primarily scaling by (PABR/PPWR)0.7
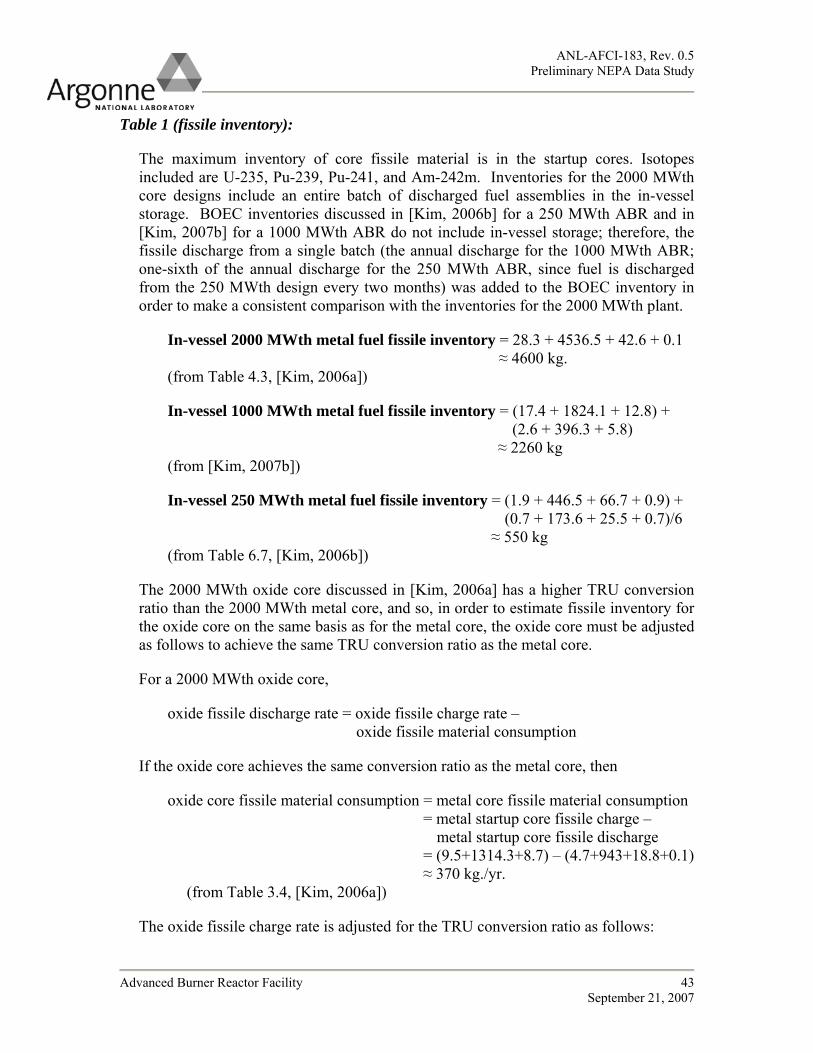
ANL-AFCI-183, Rev. 0.5 Preliminary NEPA Data Study
Advanced Burner Reactor Facility 43 September 21, 2007
Table 1 (fissile inventory):
The maximum inventory of core fissile material is in the startup cores. Isotopes included are U-235, Pu-239, Pu-241, and Am-242m. Inventories for the 2000 MWth core designs include an entire batch of discharged fuel assemblies in the in-vessel storage. BOEC inventories discussed in [Kim, 2006b] for a 250 MWth ABR and in [Kim, 2007b] for a 1000 MWth ABR do not include in-vessel storage; therefore, the fissile discharge from a single batch (the annual discharge for the 1000 MWth ABR; one-sixth of the annual discharge for the 250 MWth ABR, since fuel is discharged from the 250 MWth design every two months) was added to the BOEC inventory in order to make a consistent comparison with the inventories for the 2000 MWth plant.
In-vessel 2000 MWth metal fuel fissile inventory = 28.3 + 4536.5 + 42.6 + 0.1 ≈ 4600 kg.
(from Table 4.3, [Kim, 2006a])
In-vessel 1000 MWth metal fuel fissile inventory = (17.4 + 1824.1 + 12.8) + (2.6 + 396.3 + 5.8)
≈ 2260 kg (from [Kim, 2007b])
In-vessel 250 MWth metal fuel fissile inventory = (1.9 + 446.5 + 66.7 + 0.9) + (0.7 + 173.6 + 25.5 + 0.7)/6
≈ 550 kg (from Table 6.7, [Kim, 2006b])
The 2000 MWth oxide core discussed in [Kim, 2006a] has a higher TRU conversion ratio than the 2000 MWth metal core, and so, in order to estimate fissile inventory for the oxide core on the same basis as for the metal core, the oxide core must be adjusted as follows to achieve the same TRU conversion ratio as the metal core.
For a 2000 MWth oxide core,
oxide fissile discharge rate = oxide fissile charge rate – oxide fissile material consumption
If the oxide core achieves the same conversion ratio as the metal core, then
oxide core fissile material consumption = metal core fissile material consumption = metal startup core fissile charge –
metal startup core fissile discharge = (9.5+1314.3+8.7) – (4.7+943+18.8+0.1) ≈ 370 kg./yr.
(from Table 3.4, [Kim, 2006a])
The oxide fissile charge rate is adjusted for the TRU conversion ratio as follows:

ANL-AFCI-183, Rev. 0.5 Preliminary NEPA Data Study
Advanced Burner Reactor Facility 44 September 21, 2007
oxide adj. fissile charge rate = (oxide TRU charge rate at the orig. conv. ratio)x (metal fissile charge rate)/(metal TRU charge rate)
= (1468.9)(9.5+1314.3+8.7)/1422.1) ≈ 1380 kg./yr.
(from Table 3.4, [Kim, 2006a])
The adjusted oxide fissile discharge rate is then
oxide adjusted fissile discharge rate ≈ 1380 – 370 ≈ 1010 kg./yr.
The adjusted BOEC oxide core fissile inventory, assuming that replacing the entire core requires three batches, can be found from
adj. oxide core fissile inv. = (adj. oxide core heavy metal (HM) inv.)x (metal core fissile inventory)/(metal core HM inv.)
adj. oxide core HM inv. = (no. of batches)x((total metal HM charge)/ (total metal TRU charge))x(orig. oxide TRU charge) - (oxide HM consumption)
= (3)x((6233.0)/(1422.1))*(1468.9) – (4884.9-4209.4) ≈ 18,640 kg.
(from Table 3.4, [Kim, 2006a])
The metal core fissile inventory is the total BOEC fissile inventory minus the in-vessel storage, or
metal core fissile inventory = BOEC total fissile inventory – BOEC in-vessel storage fissile inventory
= (28.3-4.7)+(4536.5-948.8)+(42.6-17.3)+0.1 ≈ 3700 kg
(from Table 4.3, [Kim, 2006a])
Therefore,
adj. oxide core fissile inv. = (18,640)*(3700)/(2657.9+5848.2+9522.7) ≈ 3760 kg.
(from Table 4.3, [Kim, 2006a])
The in-vessel fissile inventory for the 2000 MWth oxide core is therefore
In-vessel 2000 MWth oxide fuel fissile inventory = core fissile inv. + 1 cycle discharge
≈ 3760 + (1010)/1 = 4770 kg.
Making similar adjustments to the 250 MWth oxide core,

ANL-AFCI-183, Rev. 0.5 Preliminary NEPA Data Study
Advanced Burner Reactor Facility 45 September 21, 2007
oxide core fissile material consumption = metal core fissile material consumption = metal startup core fissile charge –
metal startup core fissile discharge = (1.0+222.6+33.8) –
(0.7+173.6+25.5+0.7) ≈ 57 kg./yr.
(from Table 6.7, [Kim, 2006b])
The oxide fissile charge rate is then adjusted for the TRU conversion ratio as
oxide adj. fissile charge rate = (oxide TRU charge rate at the orig. conv. ratio)x (metal fissile charge rate)/(metal TRU charge rate)
= (449.2)(1.0+222.6+33.8)/431.0) ≈ 268 kg./yr.
(from Tables 6.7 and 6.8, [Kim, 2006b])
The adjusted oxide fissile discharge rate is then
oxide adjusted fissile discharge rate ≈ 268-57 ≈ 211 kg./yr.
The adjusted BOEC oxide core fissile inventory, assuming that the average fuel residence time is 2.25 batches, can be found from
adj. oxide core fissile inv. = (adj. oxide core heavy metal (HM) inv.)x (metal core fissile inventory)/(metal core HM inv.)
adj. oxide core HM inv. = (no. of batches)x((total metal HM charge)/ (total metal TRU charge))x(orig. oxide TRU charge) - (oxide HM consumption)
= (2.25)x((932.7)/(431.0))*(449.2) – (1007.8-923.5) ≈ 2,103 kg.
(from Tables 6.7 and 6.8, [Kim, 2006b])
The metal core fissile inventory is the BOEC fissile inventory, or
BOEC core fissile inventory = 1.9+446.5+66.7+0.9 ≈ 516 kg. (from Table 6.7, [Kim, 2006b])
Therefore,
adj. oxide core fissile inv. = (2,103)*(516)/(1984.6) ≈ 545 kg.
(from Table 6.7, [Kim, 2006b])
The in-vessel fissile inventory for the 250 MWth oxide core is therefore

ANL-AFCI-183, Rev. 0.5 Preliminary NEPA Data Study
Advanced Burner Reactor Facility 46 September 21, 2007
In-vessel 250 MWth oxide fuel fissile inventory = core fis. inv. + 1 cycle discharge
≈ 545 + (211)*(2/12 yr.) = 580 kg.
The 1000 MWth oxide and metal cores addressed in [Kim, 2007b] have very similar conversion ratios. Therefore, the in-vessel fissile inventory for the 1000 MWth oxide core is calculated directly from the inventory and mass flow values given in [Kim, 2007b], or
In-vessel 1000 MWth oxide fuel fissile inventory = core fis. inv. + 1 cycle discharge
= (16.2+2137.6+21.4) + (1.8+362.8+8.6)
≈ 2550 kg.
Assuming the startup fuel is stored on-site indefinitely, the maximum fissile inventory at the plant can be estimated from the annual fissile discharge inventory over the sixty years of reactor operation, plus the beginning of equilibrium cycle (BOEC) core fissile inventory (total metal fuel fissile inventory, minus the spent fuel fissile inventory in the in-vessel storage). For a 2000 MWth metal core operating sixty years and discharging fuel annually,
Total discharge fissile inventory = (60-(cycle length (mo.))/12)(discharge inv. rate) = (60-(12/12) yrs.)(4.7+943.0+18.8+0.1 kg/yr) ≈ 57,000 kg.
(from Table 3.4, [Kim, 2006a])
BOEC core fissile inventory = BOEC total fissile inventory – BOEC in-vessel storage fissile inventory
= (28.3-4.7)+(4536.5-948.8)+(42.6-17.3)+0.1 ≈ 3600 kg
(from Table 4.3, [Kim, 2006a])
Maximum 2000 MWth metal fissile inventory = Total discharge fissile inv. + BOEC core fissile inv.
= 57,000 + 3600 = 60,600 kg.
For a 1000 MWth metal core operating sixty years and discharging fuel annually,
Total discharge fissile inventory = (60-(cycle length (mo.))/12)(discharge inv. rate) = (60-(12/12) yrs.)(2.6+396.3+5.8 kg/yr) ≈ 23,900 kg.
(from [Kim, 2007b])

ANL-AFCI-183, Rev. 0.5 Preliminary NEPA Data Study
Advanced Burner Reactor Facility 47 September 21, 2007
BOEC core fissile inventory = 17.4+1824.1+12.8 ≈ 1850 kg. (from [Kim, 2007b])
Maximum 1000 MWth metal fissile inventory ≈ 23,900 + 1850 ≈ 25,700 kg.
Finally, the maximum fissile inventory for a 250 MWth metal core ABR which discharges fuel every two months can be estimated as
Total discharge fissile inventory = (60-(2/12)yr.)(0.7+173.6+25.5+0.7 kg/yr.) ≈ 12,000 kg.
(from Table 6.7, [Kim, 2006b])
BOEC core fissile inventory = 1.9+446.5+66.7+0.9 ≈ 500 kg. (from Table 6.7, [Kim, 2006b])
Maximum 250 MWth metal fissile inventory ≈ 12,000 + 500 = 12,500 kg.
Using the adjusted oxide fissile discharge rate and the adjusted oxide core fissile inventory calculated above for a 2000 MWth oxide core, the maximum fissile inventory for a 2000 MWth ABR oxide core plant operating 60 years is
Maximum 2000 MWth oxide fissile inventory ≈ (60-(12/12) yr.)*(1010 kg/yr.) + 3760 kg. ≈ 63,400 kg.
The maximum fissile inventory for a 1000 MWth ABR oxide core plant operating 60 years is calculated as
Total discharge fissile inventory = (60-(cycle length (mo.))/12)(discharge inv. rate) = (60-(12/12) yrs.)(1.8+362.8+8.6 kg/yr) ≈ 22,000 kg.
(from [Kim, 2007b])
BOEC core fissile inventory = 16.2+2137.6+21.4 ≈ 2200 kg. (from [Kim, 2007b])
Maximum 1000 MWth oxide fissile inventory ≈ 22,000+2200 ≈ 24,200 kg.
Finally, using the adjusted oxide fissile discharge rate and the adjusted oxide core fissile inventory calculated above for a 250 MWth oxide core, the maximum fissile inventory for a 250 MWth ABR oxide core plant operating 60 years is
Maximum 250 MWth oxide fissile inventory ≈ (60-(2/12)yr.)*(211 kg/yr.) + 545 kg.
≈ 13,200 kg.

ANL-AFCI-183, Rev. 0.5 Preliminary NEPA Data Study
Advanced Burner Reactor Facility 48 September 21, 2007
Table 3 (radioactive and hazardous wastes from operations):
Low-level liquid waste ([CRBRP, 1977], Secs. 3.5.1.2, 3.5.1.3). In the CRBRP design, there are two systems which produce low-level liquid waste: an intermediate activity level liquid process system, which processes aqueous effluent from cleaning residual sodium and radioactivity from components removed from the primary and intermediate sodium loops, and a low activity level liquid radwaste system, which processes liquid effluents from floor drains, shower drains, and laboratory drains. Both systems decontaminate liquids by filtration, evaporation, and demineralization. Both systems discharge liquid only after sampling and analysis confirm that the liquid meets release limits. The intermediate activity level liquid process system discharges 4,000 gal. of water per year, diluted by the cooling tower blowdown. The low activity level liquid radwaste system drains 850 gal./day into a discharge stream. Combined discharge is therefore
[4000 gal./yr. + (850 gal./day)x(365 days/yr.)] = 3.14x10⁵ gal./yr.
Since the CRBRP power was nearly 1000 MWth, this is the value taken for the 1000 MWth ABR. To adjust for the power difference between CRBR and a 2000 MWth ABR, this quantity is doubled, so the total discharge is 6.3 x10⁵ gal./yr. To adjust for the power difference between CRBR and a 250 MWth ABR, this quantity is cut by a factor of four, so the total discharge is 7.9 x10⁴ gal./yr.
Low-level solid waste ([CRBRP, 1977], Sec. 3.5.3, Table 3.5-10). Includes compactible solids (rags, paper, seals – 200 cu. ft. after compaction, assuming compaction decreases volume by a factor of ten), non-compactible solids (low activity scrapped components and components metal from cutting operations, 572 cu. ft., and resins, 450 cu. ft.), and solidified liquid radwaste (concentrated material from the bottom of the low-level and intermediate level system evaporators which is drawn off and solidified, 1,000 cu. ft.). The solidified liquid radwaste quantity was assumed to scale linearly with ABR power. Therefore, for a 2000 MWth ABR, the total volume of low-level solid waste is estimated as
(200 + 572 + 450 + 2x1000 ft3.)/(27 yd3./ ft3.) = 119 yd3/yr.
For a 1000 MWth ABR, the total volume of low-level solid waste is estimated as
(200 + 572 + 450 + 1000 ft3.)/(27 yd3./ ft3.) = 82 yd3/yr.,
and for a 250 MWth ABR, the total volume of low-level solid waste is estimated as
(200 + 572 + 450 + 1000 ft3./4)/(27 yd3./ ft3.) = 55 yd3/yr.
Mixed low-level solid waste ([CRBRP, 1977], Sec. 3.8.3 and Sec. 3.5.3, Table 3.5-10). Includes control rod assemblies and drive lines and radial shield assemblies, which are both radioactive and contaminated with sodium. Also, from Table 3.5-10, Sec. 3.5.3, includes 1) filters contaminated with radioactivity and sodium (165 cu. ft.),

ANL-AFCI-183, Rev. 0.5 Preliminary NEPA Data Study
Advanced Burner Reactor Facility 49 September 21, 2007
2) ex-vessel storage tank sodium (42 cu. ft.), and 3) sodium-bearing solids (235 cu. ft.).
According to Sec. 3.8.3 of [CRBRP, 1977], all nineteen CRBR control rods were to be replaced every year, nineteen drive lines were to be replaced every ten years, and shield assemblies were to be replaced as follows: 72 assemblies every three years for the first row, 78 assemblies every six years for the second row, 84 assemblies every twelve years for the third row, and 90 assemblies every twenty-four years for the fourth row. ANL has not yet optimized either the number of control rods or the control rod worths for the candidate ABR cores, nor has an evaluation been done to determine the frequency with which control rods, reflectors, and shields would be replaced. Therefore, the CRBR values given in [CRBRP, 1977] for waste from replacing in-vessel components are considered the best estimate available at present. Because these numbers are only a rough estimate, no scaling for the various candidate ABR power ratings has been used. As control rod requirements and in-vessel component replacement are evaluated, the mixed low-level solid waste estimate should be revised.
Assuming control rod assemblies and shield assemblies are the same length as a fuel rod, both have dimensions 115 in. long (Fig. 3.8-2, [CRBRP, 1977]) and a hexagonal cross-section 4.7 in. across the flats (Sec. 3.8.1.1, [CRBRP, 1977]). The assembly volume is approximately
V=A(L) L = 115 in. A = 6(4.7/2)(4.7/(2(SQRT(3))) in.2 = 19.1 in.2
Therefore,
V = (19.1)(115) = 2200 in.3 = 4.7x10⁻² yd.3
As described above, the number of assemblies shipped each year = 19 + 72/3 + 78/6 + 84/12 + 90/24, or just under 67 per year on average (e.g., 66 or 67 each year).
Control rod assembly lines are 30 feet long and have a 2 in. outside diameter, so the volume is
V=30(3.14)(1)(1) in.3 = 94.3 in.3 = 0.002 yd.3
The volume of waste from control rod assemblies, drive lines, and radial shield assemblies is then
V = 67(4.7x10⁻²) + 19(.002)/10 yd.3, or 3.2 yd.3/year.
The volume of waste from filters, metallic sodium from fuel handling operations, and sodium-bearing solids (primary, intermediate, and ex-vessel storage tank cold traps ([CRBRP, 1974], Sec. 3.4, “Solid Radwaste System,”) is

ANL-AFCI-183, Rev. 0.5 Preliminary NEPA Data Study
Advanced Burner Reactor Facility 50 September 21, 2007
165+42+235 ft.3/yr.)/(27 ft.3/ yd.3 = 8.2 yd.3/yr.
This waste volume should scale approximately linearly with reactor power, so for a 2000 MWth ABR, the volume of waste would be about 16.4 yd.3/yr., and for a 250 MWth ABR, the volume of waste would be about 1.1 yd.3/yr.
An upper bound on the total amount of solid mixed low-level waste can be estimated by assuming that sodium in all sodium-bearing components will be treated off site. In this case, the total solid mixed low-level waste would be
16.4 + 3.2 = 19.6 yd.3/yr. for a 2000 MWth ABR, 8.2 + 3.2 = 11.4 yd.3/yr. for a 1000 MWth ABR, 1.1 + 3.2 = 4.3 yd.3/yr. for a 250 MWth ABR.
The more likely option is that metallic sodium and some or all of the sodium-bearing solids and filters would be treated on-site. In this case, the volume of mixed low-level solid waste to be disposed of off-site would be reduced accordingly.
Hazardous liquid waste ([CRBRP, 1977], Sec. 3.3.4).
The CRBRP design chemical waste treatment system discharges effluent at about 35 gal./minute, or
(35 gal./min.)x(60 min./hr.)x(24 hr./day)x(365 days/yr.) = 1.84x10⁷ gal./yr.,
so a 1000 MWth ABR plant would generate about 1.84x10⁷ gallons of hazardous liquid waste per year. Assuming the effluent volume varies approximately linearly with plant power, a 250 MWth plant would generate about (1.84x10⁷)/4 = 4.6x10⁶ gallons of hazardous liquid waste per year, while a 2000 MWth plant would produce about (1.84x107)x2 = 3.7x10⁷ gallons per year.
Hazardous solid waste ([CRBRP, 1977], Sec. 10.4.1.1.1 and Table 10.4-2).
Hazardous solid waste estimates for CRBRP were based on processing solid wastes from the cooling tower basin, neutralizing and settling facility, and sludge dewatering beds. The estimated average solid waste stream from the CRBRP chemical waste treatment system is 1,000 lb/day, or 3.65x10⁵ lb/yr. Wastes would be somewhat less if a Brayton cycle were used. Therefore, assuming that the waste produced is approximately linearly dependent on plant power, an upper bound for the hazardous solid waste from a 250 MWth plant would be (3.65x10⁵)/4 = 9.1x10⁴ lb./yr.; for a 1000 MWth ABR plant it would be 3.65x10⁵ lb/yr., and for a 2000 MWth plant, it would be (3.65x105)x2 = 7.3x10⁵ lb./yr.
Table 4 (non-hazardous operations wastes):
Sanitary liquid waste ([CRBRP, 1977], Sec. 5.5).

ANL-AFCI-183, Rev. 0.5 Preliminary NEPA Data Study
Advanced Burner Reactor Facility 51 September 21, 2007
Assume a liquid sanitary waste figure of 25 gal./day per operations staff member and that each staff member works about 250 days per year. Total number of workers employed by a 250 MWth plant is estimated at 300, based on employment numbers given for CRBRP (see discussion of Table 6 in Appendix A for the basis for the number of workers). The annual liquid sanitary waste produced for a 250 MWth plant would then be
25x250x300 ≈ 1.9x10⁶ gallons/year
The total employment for CRBRP was expected to be 344 workers (see the discussion in Appendix A of Table 6). Since CRBRP and the 1000 MWth ABR are comparable sized plants, this is also taken to be the total employment for the 1000 MWth ABR. The annual liquid sanitary waste produced for a 1000 MWth plant would then be
25x250x344 ≈ 2.2x10⁶ gallons/year
For a 2000 MWth plant, total employment is estimated at 385 workers (see the discussion of Table 6 in Appendix A). The annual liquid sanitary waste produced for a 2000 MWth plant would then be
25x250x385 ≈ 2.4x10⁶ gallons/year
Sanitary solid waste ([USEPA, 1999].
The reference describes a water treatment plant which treats 11 million gallons of sanitary wastewater per day (MGD) and produces 7500 cubic yards of biosolids (sludge) per year. If a 250 MWth ABR plant processed 1.9x10⁶ gallons of wastewater per year (see above), the annual production of biosolids to be hauled away would be 7500x(1.9x106)/(11x365)/(106), or approximately 3.5 cubic yards. For a 1000 MWth plant, the annual amount of biosolids would be 7500x(2.2x106)/(11x365)/(106), or approximately 4.0 cubic yards. For a 2000 MWth plant, the annual amount of biosolids would be 7500x(2.4x106)/(11x365)/(106), or approximately 4.5 cubic yards.
Other non-hazardous solid waste
During normal plant operation, non-hazardous solid waste (i.e., ordinary trash) is produced at a rate of about 1.5 yd3 per 100 employees per day. Assuming the average employee works 250 days per year, the amount of trash generated annually for a 250 MWth plant (300 employees, see Table 6) would be about 300x1.5x250/100 = 1150 yd3 per year. The amount for a 1000 MWth plant (344 employees from Table 6) would be about 344x1.5x250/100 = 1300 yd3 per year. The amount for a 2000 MWth plant (385 employees from Table 6) would be about 385x1.5x250/100 = 1450 yd3 per year.
Table 5 (electrical requirements):
Electrical energy and peak electrical demand.

ANL-AFCI-183, Rev. 0.5 Preliminary NEPA Data Study
Advanced Burner Reactor Facility 52 September 21, 2007
In-plant power consumption for the CRBR plant was projected to be 30 MWe ([CRBRP, 1977], Sec. 3.2.3). Some of this power consumption is independent of reactor power, but the power required for the three primary sodium pumps, the three intermediate sodium pumps, and the three water recirculation pumps would scale linearly with pump volumetric flow rate, and the flow rates of all three types of pumps are assumed to scale approximately linearly with reactor power. Each CRBR primary pump and each intermediate pump was designed with a 5000 HP main motor, while each recirculation pump was designed with a 2000 HP motor ([CRBRP, 1974], Sec. 3.1 (“Primary Pump”) and Sec. 3.5, Table 3-9), so at full power, these pumps would require
Ppumps = (6x5000 + 3x2000 HP)x(746x10-6 MW/HP) = 26.9 MWe.
Therefore, the portion of the CRBR plant power consumption that would be independent of reactor power is estimated as
Pfixed = 30 – 26.9 = 3.1 MWe
This estimate is used for the fixed portion of an ABR plant power consumption.
The 250 MWth, the 1000 MWth, and the 2000 MWth ABR plant designs all include four primary sodium pumps and two intermediate sodium pumps. Both centrifugal mechanical pumps and EM pumps have been considered for the primary pumps; only EM pumps have been considered for the intermediate pumps. For the 250 MWth plant design [Chang, 2006], the centrifugal primary pump option specifies 0.34 MW required per pump, while the EM pump option requires 0.61 MW per pump. Therefore, the two primary pump options for a 250 MWth ABR would require
Pprimary cent. pumps, 250 MWth = 4x0.34 = 1.36 MWe
Pprimary EM pumps, 250 MWth = 4x0.61 = 2.44 MWe.
Assuming primary pump power scales approximately linearly with reactor power, the two primary pump options for a 1000 MWth ABR would require
Pprimary cent. pumps, 1000 MWth = 4x1.36 = 5.44 MWe
Pprimary EM pumps, 1000 MWth = 4x2.44 = 9.76 MWe,
and the two primary pump options for a 2000 MWth ABR would require
Pprimary cent. pumps, 2000 MWth = 8x1.36 = 10.9 MWe
Pprimary EM pumps, 2000 MWth = 8x2.44 = 19.5 MWe.

ANL-AFCI-183, Rev. 0.5 Preliminary NEPA Data Study
Advanced Burner Reactor Facility 53 September 21, 2007
The intermediate pump design discussed in [Chang, 2006] specifies a power requirement of 0.41 MWe per pump. Therefore, the intermediate pumps for a 250 MWth ABR would need
Pint. pumps, 250 MWth = 2x0.41 = 0.82 MWe,
the intermediate pumps for a 1000 MWth ABR would need
Pint. pumps, 1000 MWth = 4x0.82 = 3.28 MWe,
and the intermediate pumps for a 2000 MWth ABR would need
Pint. pumps, 2000 MWth = 8x0.82 = 6.56 MWe,
The circulating water pumps in the balance-of-plant system require 0.53 MWe for a 250 MWth plant, 2.1 MWe for a 1000 MWth plant, and 4.3 MWe for a 2000 MWth plant [Lomperski, 2007].
If the supercritical CO2 Brayton cycle is used in the power conversion system, the CO2 compressors may add considerably to the plant electrical requirements, depending upon the design option used [Sienicki, 2007]. In option 1, the two compressors are on the same shaft as the turbine such that they are driven directly by the turbine and not by electric motors. Thus, there is no motor electric power requirement. However, an alternate design possibility (option 2) is to have the compressors and turbine on three separate shafts and drive each compressor with an electric motor rather than its own dedicated turbine (in which case, a larger generator is used to make up the difference in the net power provided by the plant). If option 2 is used, the main compressor requires 27.9 MWe and the recompressing compressor requires 27.1 MWe for a 250 MWth plant. These power demands are assumed to scale approximately linearly with reactor power, so for a 1000 MWth ABR, the main compressor requires 112 MWe and the recompressing compressor requires 108 MWe, while for a 2000 MWth ABR, the main compressor requires 223 MWe and the recompressing compressor requires 217 MWe.
Using the value of 3.1 MWe evaluated above for the fixed portion of the ABR plant electrical demand, the peak electrical demand for a 250 MWth ABR using option 1 of the supercritical CO2 Brayton cycle is then estimated as
Ppeak, 250 MWth, Brayton option 1, cent. prim. pumps = 3.1 + 1.36 + 0.82 + 0.53 = 5.8 MWe
Ppeak, 250 MWth, Brayton option 1, EM prim. pumps = 3.1 + 2.44 + 0.82 + 0.53 = 6.9 MWe
If option 2 of the Brayton cycle is selected, the power requirements become
Ppeak, 250 MWth, Brayton option 2, cent. prim. pumps = 3.1 + 1.36 + 0.82 + 0.53 + 27.9 + 27.1

ANL-AFCI-183, Rev. 0.5 Preliminary NEPA Data Study
Advanced Burner Reactor Facility 54 September 21, 2007
= 60.8 MWe
Ppeak, 250 MWth, Brayton option 2, EM prim. pumps = 3.1 + 2.44 + 0.82 + 0.53 + 27.9 + 27.1 = 61.9 MWe
For a Rankine cycle power conversion system, the feedwater pumps for a 250 MWth ABR would require approximately 2.1 MWe and the condensate pumps approximately 0.31 MWe [Lomperski, 2007]. The power requirements would then be
Ppeak, 250 MWth, Rankine, cent. prim. pumps = 3.1 + 1.36 + 0.82 + 0.53 + 2.1 + 0.31 = 8.2 MWe
Ppeak, 250 MWth, Rankine, EM prim. pumps = 3.1 + 2.44 + 0.82 + 0.53 + 2.1 + 0.31 = 9.3 MWe
For a 1000 MWth ABR, peak electrical demand for the two primary pump options and option 1 of the Brayton cycle is estimated as
Ppeak, 1000 MWth, Brayton option 1, cent. prim. pumps = 3.1 + 5.44 + 3.28 + 2.1 = 13.9 MWe
Ppeak, 1000 MWth, Brayton option 1, EM prim. pumps = 3.1 + 9.76 + 3.28 + 2.1 = 18.2 MWe.
Peak electrical demand for a 1000 MWth ABR using option 2 of the Brayton cycle and either primary pump option would be
Ppeak, 1000 MWth, Brayton option 2, cent. prim. pumps = 3.1 + 5.44 + 3.28 + 2.1 + 112 + 108 = 234 MWe
Ppeak, 1000 MWth, Brayton option 2, EM prim. pumps = 3.1 + 9.76 + 3.28 + 2.1 + 112 + 108 = 238 MWe.
For a Rankine cycle, it is assumed that the feedwater and condensate pump powers scale linearly with reactor power, so the feedwater pumps for a 1000 MWth ABR would require approximately 2.1x4 = 8.4 MWe, and the condensate pumps would require approximately 0.31x4 = 1.24 MWe [Lomperski, 2007]. Therefore, peak electrical demand for a 1000 MWth ABR using a Rankine cycle and either primary pump option would be
Ppeak, 1000 MWth, Rankine, cent. prim. pumps = 3.1 + 5.44 + 3.28 + 2.1 + 8.4 + 1.24 = 23.6 MWe
Ppeak, 1000 MWth, Rankine, EM prim. pumps = 3.1 + 9.76 + 3.28 + 2.1 + 8.4 + 1.24 = 27.9 MWe.

ANL-AFCI-183, Rev. 0.5 Preliminary NEPA Data Study
Advanced Burner Reactor Facility 55 September 21, 2007
For a 2000 MWth ABR, peak electrical demand for the two primary pump options and option 1 of the Brayton cycle is estimated as
Ppeak, 2000 MWth, Brayton option 1, cent. prim. pumps = 3.1 + 10.9 + 6.56 + 4.3 = 24.8 MWe
Ppeak, 2000 MWth, Brayton option 1, EM prim. pumps = 3.1 + 19.5 + 6.56 + 4.3 = 33.4 MWe.
Peak electrical demand for a 2000 MWth ABR using option 2 of the Brayton cycle and either primary pump option would be
Ppeak, 2000 MWth, Brayton option 2, cent. prim. pumps = 3.1 + 10.9 + 6.56 + 4.3 + 223 + 217 = 465 MWe
Ppeak, 2000 MWth, Brayton option 2, EM prim. pumps = 3.1 + 19.5 + 6.56 + 4.3 + 223 + 217 = 473 MWe.
For a Rankine cycle, the feedwater pumps for a 2000 MWth ABR would require approximately 2.1x4 = 8.4 MWe, and the condensate pumps would require approximately 0.31x4 = 1.24 MWe [Lomperski, 2007]. Therefore, peak electrical demand for a 2000 MWth ABR using a Rankine cycle and either primary pump option would be
Ppeak, 2000 MWth, Rankine, cent. prim. pumps = 3.1 + 10.9 + 6.56 + 4.3 + 16.8 + 2.48 = 44.1 MWe
Ppeak, 2000 MWth, Rankine, EM prim. pumps = 3.1 + 19.5 + 6.56 + 4.3 + 16.8 + 2.48 = 52.7 MWe.
Estimates for maximum annual power consumption for the various 250 MWth ABR options are then
Pannual, 250 MWth, Brayton option 1, cent. prim. pumps = (5.8 MWe)*(8760 hr./yr) = 5.09x10⁴ MWh
Pannual, 250 MWth, Brayton option 1, EM prim. pumps = (6.9 MWe)*(8760 hr./yr) = 6.04x10⁴ MWh
Pannual, 250 MWth, Brayton option 2, cent. prim. pumps = (60.8 MWe)*(8760 hr./yr) = 5.33x10⁵ MWh
Pannual, 250 MWth, Brayton option 2, EM prim. pumps = (61.9 MWe)*(8760 hr./yr) = 5.42x10⁵ MWh.
Pannual, 250 MWth, Rankine, cent. prim. pumps = (8.2 MWe)*(8760 hr./yr) = 7.20x10⁵ MWh

ANL-AFCI-183, Rev. 0.5 Preliminary NEPA Data Study
Advanced Burner Reactor Facility 56 September 21, 2007
Pannual, 250 MWth, Rankine, EM prim. pumps = (9.3 MWe)*(8760 hr./yr) = 8.15x10⁵ MWh.
Maximum annual power consumption for the various 1000 MWth ABR options is estimated as
Pannual, 1000 MWth, Brayton option 1, cent. prim. pumps = (13.9 MWe)*(8760 hr./yr) = 1.22x10⁵ MWh
Pannual, 1000 MWth, Brayton option 1, EM prim. pumps = (18.2 MWe)*(8760 hr./yr) = 1.59x10⁵ MWh
Pannual, 1000 MWth, Brayton option 2, cent. prim. pumps = (234 MWe)*(8760 hr./yr) = 2.05x10⁶ MWh
Pannual, 1000 MWth, Brayton option 2, EM prim. pumps = (238 MWe)*(8760 hr./yr) = 2.45x10⁶ MWh.
Pannual, 1000 MWth, Rankine, cent. prim. pumps = (23.6 MWe)*(8760 hr./yr) = 2.07x10⁵ MWh
Pannual, 1000 MWth, Rankine, EM prim. pumps = (27.9 MWe)*(8760 hr./yr) = 2.44x10⁵ MWh.
Maximum annual power consumption for the various 2000 MWth ABR options is estimated as
Pannual, 2000 MWth, Brayton option 1, cent. prim. pumps = (24.8 MWe)*(8760 hr./yr) = 2.17x10⁵ MWh
Pannual, 2000 MWth, Brayton option 1, EM prim. pumps = (33.4 MWe)*(8760 hr./yr) = 2.93x10⁵ MWh
Pannual, 2000 MWth, Brayton option 2, cent. prim. pumps = (465 MWe)*(8760 hr./yr) = 4.07x10⁶ MWh
Pannual, 2000 MWth, Brayton option 2, EM prim. pumps = (473 MWe)*(8760 hr./yr) = 4.15x10⁶ MWh.
Pannual, 2000 MWth, Rankine, cent. prim. pumps = (44.1 MWe)*(8760 hr./yr) = 3.86x10⁵ MWh
Pannual, 2000 MWth, Rankine, EM prim. pumps = (52.7 MWe)*(8760 hr./yr) = 4.62x10⁵ MWh.

ANL-AFCI-183, Rev. 0.5 Preliminary NEPA Data Study
Advanced Burner Reactor Facility 57 September 21, 2007
Table 6 (operations data):
Emergency generator fossil fuel usage ([CRBRP, 1977], Tables 3.7-2 and 5.5-1; [CRBRP, 1974], Sec. 4.4, “Emergency Power System”, and Sec. 3.1, “Primary Pump”; [Chang, 2006], Sec. 2.9.6)
The only fossil fuel usage identified for CRBR is for the two emergency diesel generators and the diesel fire pump. From [CRBRP, 1977], Table 5.5-1, fuel consumption for each is 95 lbs./hr of No. 2 oil. Per [CRBRP, 1977], Table 3.7.2, each engine is run for 24 hours/year for testing. According to [CRBRP, 1974], Sec. 4.4, each diesel generator is rated at 3.3 MWe. The 250 MWth ABR plant design ([Chang, 2006], Sec. 2.9.6) includes two 1 MWe emergency generators and considers the option of making the generators either diesel or gas. If diesel generators were used, and if the fuel usage scales approximately linearly with generator size, the mass of fuel used per year for a 250 MWth ABR plant would be
M = 2(24 h./yr.)(95 lbs/hr. for 3.3 MWe)/3.3 = 1382 lbs No. 2 oil/yr.
The density of No. 2 oil is 7.05 lb./gal. [Perry, 1997]. Therefore, the volume of fuel used per year for emergency generator testing for a 250 MWth ABR plant would be:
V = 1382 lbs/yr/(7.05 lb./gal.) ≈ 200 gal./yr.
The ABR 1000 MWth design assumes that the emergency generator capacity consists of two 3 MWe generators, or 6 MWe, so the volume of fuel used per year for a 2000 MWth ABR plant would be
V ≈ (200 gal./yr.)x3 = 600 gal./yr.
The ABR 2000 MWth design assumes that the emergency generator capacity consists of four 3 MWe generators, or 12 MWe, so the volume of fuel used per year for a 2000 MWth ABR plant would be
V ≈ (200 gal./yr.)x6 = 1200 gal./yr.
Grounds maintenance fossil fuel usage
Assume that diesel powered equipment is used 25 times per year for grounds maintenance and that 5 gallons of fuel are consumed per hour by all the equipment used. Also, assume that maintenance can be completed on three acres each hour. From Table 27, a 250 MWth plant will have about 80 acres committed to landscaped facilities, so the amount of fossil fuel consumed in grounds maintenance per year would be about 80x25x5/3 ≈ 3350 gal./yr. For a 1000 MWth plant, Table 27 indicates 100 acres of landscaped facilities, so the fossil fuel consumption for grounds maintenance would be about 100x25x5/3 ≈ 4200 gal./yr. Finally, for a 2000 MWth plant, Table 27 shows 120 acres of landscaped facilities, so the fossil fuel consumption for grounds maintenance would be about 120x25x5/3 = 5000 gal./yr.

ANL-AFCI-183, Rev. 0.5 Preliminary NEPA Data Study
Advanced Burner Reactor Facility 58 September 21, 2007
Process gases ([Chang, 2006], Secs. II.10.1 and II.10.17).
Nitrogen. If the Rankine cycle option is selected for the power conversion system, nitrogen would be used for sparging in the steam generators. Sparging occurs when a steam generator is taken out of service either due to malfunction of a piece of equipment or for maintenance. Hydrazine would be injected into the water in the steam generator, then nitrogen gas would be blown in through the bottom of the steam generator to mix the hydrazine with the water and to blanket the water. A 6900 MWth commercial nuclear plant (two 3450 MWth reactors) uses about 200,000 scf (one tanker truck) of nitrogen per year for steam generator sparging [Flores, 2007]. The quantity of nitrogen used will scale approximately linearly with plant power. A 250 MWth ABR would therefore require about (200,000)x(250/6900) ≈ 7300 scf of nitrogen annually, a 1000 MWth ABR plant would require about (200,000)x(1000/6900) = 29,000 scf of nitrogen annually, and a 2000 MWth ABR plant would require about (200,000)x(2000/6900) = 58,000 scf of nitrogen per year.
Hydrogen. Both 1000 and 2000 MWth ABR plants would probably use a generator cooled by hydrogen. Hydrogen flow and initial charge to such a generator are discussed in [Smith, 2002], which describes a GE Frame 7 gas turbine generator as taking an initial charge of 7,500 ft.3 of hydrogen gas for purge and filling and requiring 21 ft.3 of hydrogen gas per hour for makeup. Hydrogen-cooled generators for the 903 MWe generating plant at Zeeland, Michigan are discussed in [Mirant, 2007] and [Speranza, 2005]. These three generators require a total of about 70 scf/hr. of hydrogen makeup for cooling. Assuming each of these generators also takes an initial charge of about 7,500 scf of hydrogen gas, the Zeeland plant would require about 3x7500 + 70x24x365 = 635,700 scf of hydrogen per year. Assuming that hydrogen required would scale approximately linearly with total generator power, a rough estimate of the hydrogen requirements of a 1000 MWth ABR plant generator (380 MWe, assuming 38% efficiency) would be about (380/903)x635,700 = 268,000 scf/yr., while the hydrogen requirements of a 2000 MWth ABR plant generator (760 MWe, assuming 38% efficiency) would be about (760/903)x635,700 = 535,000 scf/yr. The volume ratio between hydrogen gas at 1 atm. and liquid hydrogen is about 825. Therefore, a 1000 MWth ABR generator would require about 268,000/825 = 325 ft.3 of liquid hydrogen per year., while a 2000 MWth ABR generator would require about 535,000/825 = 650 ft.3 of liquid hydrogen per year. If hydrogen is delivered to the site and stored on-site in tanks in liquid form, and assuming liquid hydrogen deliveries about five times per year, a reasonable quantity to store onsite for a 1000 MWth plant would be about 70 ft.3, and for a 2000 MWth plant about 150 ft.3. If a hydrogen generator is used to generate hydrogen continuously, only a reserve of a few days needs to be stored on site. Assuming a reserve for six days, about (70x24x6)x(380/903)/825 = 5 ft.3 of liquid hydrogen would be stored on-site as reserve for a 1000 MWth ABR, and about (70x24x6)x(760/903)/825 = 10 ft.3 for a 2000 MWth ABR. For a 1000 MWth ABR, approximately (3x7500)x380/903) = 9,500 scf of hydrogen gas would be required to purge and charge the generator, and for a 2000 MWth ABR, approximately (3x7500)x(760/903) = 19,000 scf would be required.

ANL-AFCI-183, Rev. 0.5 Preliminary NEPA Data Study
Advanced Burner Reactor Facility 59 September 21, 2007
Carbon Dioxide. For the preconceptual design 250 MWth ABR plant, the CO2 inventory in the S-CO2 Brayton cycle is 10,800 kg. There will also be a cryogenic storage tank or tanks located near to the turbine generator building holding additional CO2 needed for makeup to compensate for any losses and to recharge the system if it needs to be depressurized for maintenance or repair. The inventory in the storage tank(s) is estimated as four times the cycle inventory, or 43,200 kg. Thus, the total CO2 onsite during normal operation is (10,800 + 43,200) = 54,000 kg., or about 963,000 scf, since CO2 has a density of 1.98 kg/m3 at standard temperature and pressure, or 0.056 kg/scf. There is a need for a flow of CO2 for the shaft seals on the turbomachinery. It is anticipated that this CO2 will be captured for reuse and not vented. It is also anticipated that leakages from the cycle will be negligible. These numbers should scale roughly linearly with the power level such that, for a 1000 MWth plant, there would be four times as much, or 216,000 kg (3.9 million scf) of CO2 onsite, while for a 2000 MWth plant, there would be eight times as much, or 432,000 kg (7.7 million scf) of CO2 onsite. [Sienicki, 2007]
Chemical Use ([CRBRP, 1977], Sec 3.6, Fig. 3.6-1)
Sodium hypochlorite. The CRBRP design called for intermittent injection of sodium hypochlorite for bio-fouling control in the cooling tower water (maximum of 450 lb./day) and in the ground water intake (maximum of 180 lb./day), plus minor amounts to the sanitary system discharge. Thus, a 1000 MWth plant should require 450+180=630 lb. per day. Assuming the requirements for this chemical scale linearly with water volume, which should scale approximately linearly with plant power, a 250 MWth ABR would require a maximum daily addition of (450+180)/4 ≈ 160 lb., while a 2000 MWth ABR would take at most (450+180)x2 = 1260 lb. per day.
Sulfuric acid. This chemical was to be added occasionally to the CRBRP cooling tower water and the chemical waste treatment system to control high pH. A maximum of 3400 lb./day was specified, so a 1000 MWth plant would need a maximum of 3400 lb./day. Scaling this quantity linearly with power would result in a 250 MWth ABR plant requiring occasional addition of 3400/4 = 850 lb. of sulfuric acid per day, while a 2000 MWth plant would receive 3400x2 = 6800 lb.
Sodium hydroxide. The CRBRP chemical waste treatment system was expected to require a maximum of 2200 lb. of sodium hydroxide a day on an intermittent basis, so a 1000 MWth ABR would be expected to require occasional addition of at most 2200 lb per day. Adjusting linearly for power, a 250 MWth ABR plant chemical waste treatment system would use 2200/4 = 550 lb. of sodium hydroxide per day on occasion, while a 2000 MWth plant would periodically require 2200x2 = 4400 lb./day.
Steam ([CRBRP, 1977], Sec. 3.2, Table 3.2-1)
Steam is used only if a steam generator is used in the power conversion system. In this case, steam would be the working fluid within the closed loop of the steam generator. For CRBR, steam flow to the turbine would be 3.34 x10⁶ lb/hr., or

ANL-AFCI-183, Rev. 0.5 Preliminary NEPA Data Study
Advanced Burner Reactor Facility 60 September 21, 2007
(3.34x10⁶ lb/hr. x 24 hr./day x 365 d/yr)/(2000 lb/ton) = 1.46x10⁷ ton/yr.
Assuming steam produced varies approximately linearly with reactor power, then steam flow for a 1000 MWth ABR would be 1.46x10⁷ ton/yr., for a 2000 MWth ABR, steam flow = 2.92 x10⁷ ton/yr., and for a 250 MWth ABR, steam flow = 3.66 x10⁶ ton/yr.
Hydrazine. If a Rankine cycle is used, hydrazine would be added to the feedwater as an oxygen scavenger. Hydrazine is used to control oxygen in the steam cycle at nearly all U. S. nuclear power plants. The quantity of hydrazine added scales approximately with reactor power. A 6900 MWth nuclear plant (two 3450 MWth reactors) requires 15,000 gal. of hydrazine per year and receives deliveries of the chemical three times per year [Flores, 2007]. A 250 MWth ABR would therefore require about (15,000)x(250/6900) = 550 gal. of hydrazine per year and would store at most 200 gal. at one time, a 1000 MWth ABR would require about (15,000)x(1000/6900) = 2,200 gal. annually and would store at most 750 gal. at one time. and a 2000 MWth ABR would require about (15,000)x(2000/6900) = 4,400 gal. annually and would store at most 1500 gal. at one time.
Monoethanolamine. If a Rankine cycle is used, the steam and water must be kept alkaline in order to control corrosion. An organic amine is added to the water to control pH; nearly all U. S. power plants use one of the following three: monoethanolamine, morpholine, or ammonia. Of these, monoethanolamine distributes best throughout the system and controls pH in the condensate the best. A 6900 MWth nuclear plant requires 35,000 gal. of monoethanolamine per year and receives the chemical in eight shipments per year [Flores, 2007]. The plant therefore stores at most 4500 gal. at one time. The quantity of the chemical required scales approximately linearly with reactor power. A 250 MWth ABR would therefore require about 1300 gal. of monoethanolamine annually and, if it followed the same delivery schedule, would store less than 200 gal. at a time. A 1000 MWth ABR would use about 5,100 gal. annually and would store about 650 gal. at a time, and a 2000 MWth ABR would use about 10,200 gal. annually and would store about 1300 gal. at a time.
Employment. Values expected for the CRBRP are found in [CRBRP, 1977], Sec. 3.7.1, and [CRBRP, 1982], Ch. 13, Figure 13.1-2: CRBRP Organizational Chart. It was expected that there would be 125 workers present on site at any one time during normal operations, with 210 workers on site at any one time during the annual service shutdown. Total employment of the plant was expected to be 344 workers. A certain number of these were rad workers, as describe in [CRBRP, 1982], Ch. 13, Figure 13.1-2: CRBRP Organizational Chart. Rad workers were taken to be all workers in health physics, engineering, operations, and plant maintenance, other than the following: Training, Shift Clerks, Janitor and Labor Services Supervisor. The total number of employees classified as rad workers would then be:
69 + (59-10) + 15 + 59 + 35 + 4 + 21 ≈ 250

ANL-AFCI-183, Rev. 0.5 Preliminary NEPA Data Study
Advanced Burner Reactor Facility 61 September 21, 2007
These numbers should be representative of employment at a 1000 MWth ABR.
To reflect some economy of scale regarding plants of different sizes, the employment numbers for the 250 MWth plant were taken as about 88% of those for the CRBRP, while the employment numbers for the 2000 MWth plant were assumed to be about 112% of those for the CRBRP.
Table 7 (makeup water usage):
Water usage ([CRBRP, 1977], Sec. 3.3, Table 3.3-1 and Figure 3.3-1; [Tawney, 2003])
The CRBR plant was designed with a mechanical draft wet cooling tower, which represents most of the plant makeup water. The remainder of the water makeup goes to process waste treatment, which includes chemical waste treatment, radwaste systems, the potable water and sanitary waste systems, demineralizer regenerations, and the condensate polishing system, which treats condensate to maintain the feedwater chemistry needed by the steam generator. Systems other than the cooling tower require on average 67 gpm of water, with a peak design capacity of 125 gpm (6.57 x10⁷ gal./yr.). At 975 MWth, the cooling tower requires 7,050 gpm (3.71x10⁹ gal./yr.) of makeup water, with 2,700 gpm (1.42x10⁹ gal./yr.) returned to the water source, 4,240 gpm (2.23x10⁹ gal./yr.) lost to evaporation, and 110 gpm (5.78x10⁷ gal./yr.) lost to drift (droplets of water discharged from the system during operation). Waste water to be processed is therefore the sum of the water used in process waste treatment plus cooling tower blowdown, or (125+2,700) = 2,825 gpm (1.49x10⁹ gal./yr.) The water requirements are assumed to vary linearly with reactor operating power and to be approximately independent of the type of wet cooling tower used, as shown in Table 7.
If dry cooling technology is used instead of a wet cooling system, no makeup water is required by the plant heat sink, and the makeup water requirements are limited to those for process water treatment, plus a minor amount to compensate for any leaks in the power conversion system if a Rankine cycle is used.
Table 8 (spent fuel discharge):
From Table 3.4 in [Kim, 2006a],
metal 2000 MWth startup core spent fuel discharge ≈ 5560 kg. HM/yr.
From [Kim, 2007b],
metal 1000 MWth startup core spent fuel discharge ≈ 3100 kg. HM/yr.
From Table 6.7 in [Kim, 2006b],
metal 250 MWth startup core spent fuel discharge ≈ 850 kg. HM/yr.

ANL-AFCI-183, Rev. 0.5 Preliminary NEPA Data Study
Advanced Burner Reactor Facility 62 September 21, 2007
As covered above in the discussion of Table 1, the 2000 MWth oxide core discussed in [Kim, 2006a] has a higher TRU conversion ratio than the 2000 MWth metal core, and so, in order to estimate annual discharge for the oxide core on the same basis as for the metal core, the oxide core must be adjusted as follows to achieve the same TRU conversion ratio as the metal core.
For a 2000 MWth oxide core,
oxide HM discharge rate = oxide HM charge rate – oxide HM consumption
If the oxide core achieves the same conversion ratio as the metal core, then
oxide core HM consumption = metal core HM consumption = metal startup core HM charge –
metal startup core HM discharge = 6233.0 – 5558.5 kg./yr. ≈ 675 kg./yr.
(from Table 3.4, [Kim, 2006a])
The oxide HM charge rate is adjusted for the TRU conversion ratio as follows:
oxide adj. HM charge rate = (oxide TRU charge rate at the orig. conv. ratio)x (metal HM charge rate)/(metal TRU charge rate)
= (1468.9)*(6233.0/1422.1) ≈ 6440 kg/yr.
(from Table 3.4, [Kim, 2006a])
The adjusted oxide HM discharge rate is then
2000 MWth startup oxide core HM discharge rate ≈ 6440 – 675 ≈ 5760 kg./yr.
Similarly, for a 250 MWth oxide core,
oxide HM discharge rate = oxide HM charge rate – oxide HM consumption
If the oxide core achieves the same conversion ratio as the metal core, then
oxide core HM consumption = metal core HM consumption = metal startup core HM charge –
metal startup core HM discharge = 932.7 – 848.2 kg./yr. ≈ 85 kg./yr.
(from Table 6.7, [Kim, 2006b])
The oxide HM charge rate is adjusted for the TRU conversion ratio as follows:
oxide adj. HM charge rate = (oxide TRU charge rate at the orig. conv. ratio)x

ANL-AFCI-183, Rev. 0.5 Preliminary NEPA Data Study
Advanced Burner Reactor Facility 63 September 21, 2007
(metal HM charge rate)/(metal TRU charge rate) = (449.2)*(932.7/431.0) ≈ 973 kg/yr.
(from Tables 6.7 and 6.8, [Kim, 2006b])
The adjusted oxide HM discharge rate is then
250 MWth startup oxide core HM discharge rate ≈ 973 – 85 ≈ 890 kg./yr
The spent fuel discharge for the 1000 MWth oxide startup core is taken directly from [Kim, 2007b] as
1000 MWth startup oxide core HM discharge rate ≈ 2500 kg. HM/yr.
Both metal and oxide 1000 MWth ABR cores contain 180 fuel assemblies and have a cycle length of one year. However, the fuel is dicharged in four batches for the metal core, and so the 1000 MWth metal ABR discharges 180/4 = 45 assemblies per year, whereas the oxide core fuel is discharged in five batches, or 180/5 = 36 assemblies per year.
Table 11 (hazardous air pollutants):
References: [CRBRP, 1977], Table 3.7-2; [Chang, 2006], Sec. 2.9.6.
Hazardous air pollutants would be released to the atmosphere during testing or emergency operation of the emergency generators and during use of diesel-powered equipment for grounds maintenance. Assuming the emergency generators are diesel powered, emissions can be estimated from data for CRBR plant diesel operation in [CRBRP, 1977], Table 3.7-2. CRBR diesels included the two 3.3 MWe emergency diesel generators and a diesel fire pump. Since no data on the diesel fire pump could be found, it was conservatively assumed that the total maximum air pollutants given in Table 3.7-2 could be attributed to testing of the two emergency generators. The total maximum pollutant releases given in Table 3.7-2 are
Pollutant Release, ton/yr. SO2 0.75
Hydrocarbons 0.75 NOx 7.5 CO 1.5
Assume that these releases are from testing of two 3.3 MWe generators and that 1) emissions scale approximately linearly with generator fuel usage and 2) fuel usage scales approximately linearly with generator power. The 250 MWth ABR plant design includes two 1.0 MWe emergency generators, the 1000 MWth design assumes two 3.0 MWe emergency generators, and the 2000 MWth plant design includes four 3.0 MWe emergency generators. Therefore, the maximum annual emissions for

ANL-AFCI-183, Rev. 0.5 Preliminary NEPA Data Study
Advanced Burner Reactor Facility 64 September 21, 2007
testing emergency diesel generators for both sizes of plant should be approximately as given in Table A.3 below.
Table A.3. Approximate Annual Release of Hazardous Air Pollutants During
Emergency Diesel Generator Testing and Grounds Maintenance Pollutant Release, ton/yr.
Plant Size Generator Testing Grounds Maintenance Total 250 MWth 0.75/3.3 = 0.23 0.23x(3350/200) = 3.9 4.11000 MWth (0.75/3.3 )*3 = 0.68 0.23x(4200/200) = 4.8 5.5SO2 2000 MWth (0.75/3.3 )*6 = 1.36 0.23x(5000/200) = 5.7 7.1250 MWth 0.75/3.3 = 0.23 0.23x(3350/200) = 3.9 4.11000 MWth (0.75/3.3 )*3 = 0.68 0.23x(4200/200) = 4.8 5.5Hydrocarbons 2000 MWth (0.75/3.3 )*6 = 1.36 0.23x(5000/200) = 5.7 7.1250 MWth 7.5/3.3 = 2.3 2.3x(3350/200) = 39 411000 MWth (7.5/3.3 )*3 = 6.8 2.3x(4200/200) = 48 45NOx 2000 MWth (7.5/3.3 )*6 = 13.6 2.3x(5000/200) = 57 71250 MWth 1.5/3.3 = 0.46 0.46x(3350/200) = 7.7 8.21000 MWth (1.5/3.3 )*3 = 1.36 0.46x(4200/200) = 9.7 11.0CO 2000 MWth (1.5/3.3 )*6 = 2.73 0.46x(5000/200) = 11.4 14.1
Testing of the emergency generators for the 250 MWth ABR would consume about 200 gallons of diesel fuel per year (see discussion above of Table 6). Grounds maintenance would require about 3350 gallons of diesel fuel per year for the 250 MWth ABR, about 4200 gallons per year for the 1000 MWth ABR, and about 5000 gallons per year for the 2000 MWth ABR (again, see the discussion above of Table 6). Assuming the grounds maintenance equipment produces about the same amount of air pollutants per gallon of diesel fuel as the emergency generators, the air pollutants released annually from grounds maintenance would scale linearly with the amount of diesel fuel consumed. Therefore, grounds maintenance for each size of ABR plant would produce the quantities of pollutants shown in Table A.3.
Table 12 (low-level waste):
Information taken from [CRBRP, 1977], Table 3.5-11. One 55-gallon drum is eqiuivalent to 7.4 ft.3. The estimates of numbers of containers required per year given in [CRBRP, 1977] appear to also account for empty space within the drum for each waste type. The table combines filters, which are mixed low-level waste (due to sodium residue), with resins, which are low-level waste, so the quantity for resins was estimated by scaling the total value (100 55-gallon drums) using the annual volume numbers for resins (450 ft.3) and filters (165 ft.3) from [CRBRP, 1977], Table 3.5-10. This gives
No. of drums containing resins = 100(450/(450+165) = 73 drums

ANL-AFCI-183, Rev. 0.5 Preliminary NEPA Data Study
Advanced Burner Reactor Facility 65 September 21, 2007
The total number of drums of non-compactible solids is the sum of the number of drums of scrapped components (82 from Table 3.5-11) and the number of drums of resins, or 73+82 = 155.
The only waste which scales with reactor power is the solidified liquid radwaste (140 drums for CRBR), so this value was scaled directly with candidate ABR power.
Table 26 (construction requirements):
Construction period: Figure A.1 plots construction time vs. plant power for 41 U.S. power reactors [IAEA, ]. The plot indicates that plants around 2000 MWth took about six years to complete, so the construction time estimate for the 2000 MWth ABR has been taken as six years. This is an estimate for time during which construction activities are in progress; delays due to regulatory issues, etc., during which construction work may be suspended, are not included, since construction wastes, fossil fuel emissions, etc. will not be generated and thus the idle time will have little, if any, environmental impact.
Since construction employment is adjusted for plant size, construction time is not expected to vary much with plant size, since the larger the plant size, the more staff and equipment are available for tasks such as pouring concrete, installing electrical systems, etc. Therefore, it is estimated that a 250 MWth ABR would take perhaps a year less to build than a 2000 MWth plant, or five years and that a 1000 MWth ABR would take about 5.5 years to build.
Construction employment: CRBRP total employment and peak employment are taken from Sec. 8.2, Table 8.2-1, [CRBRP, 1977]. These values are then scaled by (PABR)/(PCRBR)0.7
Construction peak electrical requirements: This parameter has been estimated by looking at a comparable size of construction project, the Spallation Neutron Source. According to [Lawson, 2007], a 9 MWe line supplied the electrical needs of about 800 construction workers during the 6.5 year construction period, or about 11.25 kW per worker. Assuming this estimate is applicable to ABR construction, a 250 MWth plant would require about 780x11.25 ≈ 9 MWe maximum during construction, while a 1000 MWth plant would need about 2050x11.25 ≈ 23 MWe maximum and a 2000 MWth plant would need about 3330x11.25 ≈ 38 MWe maximum during construction.
Diesel or gas generators would be used during construction ([Chang, 2006], Sec. 11.9.6). The current design calls for two 1 MWe back-up generators for the 250 MWth plant, two 3 MWe back-up generators for the 1000 MWth plant, and four 3 MWe back-up generators for the 2000 MWth plant. Thus, either temporary generators would be needed during construction to supplement the permanent back-up generators, or a temporary power line would need to be installed for construction.

ANL-AFCI-183, Rev. 0.5 Preliminary NEPA Data Study
Advanced Burner Reactor Facility 66 September 21, 2007
Concrete used in construction: Concrete estimate from Sec. 4.3.3, [CRBRP, 1977] is 200,000 yd3, so the amount of concrete needed to construct a 1000 MWth ABR would be about 200,000 yd3. If a volume-to-power factor of
(VABR)/(VCRBR) = (PABR)/(PCRBR)0.7
is used, similar to that described in Appendices B and C, and using PCRBR = 1000 MWth, then the amount of concrete for a 250 MWth ABR can be estimated as
250 MWth ABR concrete = 200,000x(250/1000)0.7 = 76,000 yd3,
while the amount for a 2000 MWth ABR would be estimated as
2000 MWth ABR concrete = 200,000x(2000/1000)0.7 = 325,000 yd3,
Steel used in construction: Details used in making the steel estimates are given in the spreadsheet table provided in Appendix C.
Use of liquid fuel and lube oil during construction: The major tasks requiring liquid fuel and lube oil are site preparation, excavation, hauling, backfill, and site finishing. Table A.4 presents details of the assumptions and data taken from [Caterpillar, 1990] and applied to the estimated land requirements and concrete usage for the two bounding ABR designs to generate estimates for liquid fuel and lube oil requirements during construction.
Construction water usage: A construction water usage estimate is available for CRBRP from Sec. 4.1.2.1, [CRBRP, 1977]. This value is consistent with assuming 25 gallons of water used per day per worker. Peak daily construction water use can therefore be estimated by multiplying the anticipated number of workers in the peak year by 25.
Table 27 (construction land requirements):
Land requirements are calculated from the CRBRP land requirements found in [CRBRP, 1977], Sec. 4.1 and Table 4.1-1. The CRBRP site was expected to cover 1,364 acres total, most of it natural wooded area. Table 4.1-1 of [CRBRP, 1977] provides a detailed breakdown of the types of land usage included in the laydown area during construction. Land usage for a 250 MWth plant is assumed to be 80% of that for CRBRP, while land for a 2000 MWth plant is assumed to be 120% of CRBRP, to a first approximation. Land usage for a 1000 MWth plant is taken as the CRBRP estimate, with the total site area rounded to 1400 acres.
Laydown area for the CRBRP is given as 156 acres in [CRBRP, 1977], Table 4.1-1. This value is rounded to 160 acres for the 1000 MWth ABR plant. The laydown area is scaled for reactor power by (PABR/PCRBR)0.7, so for the 250 MWth ABR, the laydown area is calculated as (156)x(250/1000)0.7, or 60 acres, and for the 2000 MWth ABR, the laydown area is (156)x(2000/1000)0.7, or 250 acres.

ANL-AFCI-183, Rev. 0.5 Preliminary NEPA Data Study
Advanced Burner Reactor Facility 67 September 21, 2007
Table A.4. Estimation of Liquid Fuel and Lube Oil Consumed During ABR Construction Supporting data from [Caterpillar, 1990]
Land clearing 250 MWth 1000 MWth 2000 MWth Assume light vegetation, level terrain, good footing, clay subsoil. Assume area cleared is equal to Facilities, Laydown, and Temp parking areas (see Table 27). Assume D7H, Weldco brush rake, medium duty load factor Area to be cleared (acres) (from Table 27) 145 272 390 Hours per acre 1.8 1.8 1.8 Gallons per hour 9 9 9 Gallons per acre cleared 16.2 16.2 16.2 Fuel for land clearing (gal) 2349 4406 6318
Site preparation Assume site prep includes construction of roads and preliminary utility work, drainage. Assume site is nominally flat (<10% grade), clay subsoil, with good footing. Assume site prep work is equal to twice plant area (see Table 27). Area to be prepped (acres) 6 8 10 Gallons per acre prepped 255 255 255 Fuel for site prep (gal) 1530 2040 2550
Excavation Assume excavation volume is equal to four times the volume of concrete placed. Assume excavation is by hydraulic excavator, hauling by articulated dump. Concrete volume (yd.3) (from Table26) 76000 200000 325000 Excavation volume (yd.3) (4x concrete volume) 304000 800000 1300000 Excavation productivity (yd.3/hr) 375 375 375 Excavation fuel consumption (gal/hr) 14.5 14.5 14.5 Excavation fuel (gal) 11755 30933 50267
Hauling Assume excavation spoil is hauled 0.3 miles for storage/reuse. Haul/dump volume (yd.3) (excavation volume, see above) 304000 800000 1300000 Haul productivity (yd.3/hr) 360 360 360 Haul fuel consumption (gal/hr) 10.2 10.2 10.2 Haul/dump fuel (gal) 8613 22667 36833
Backfill Assume backfill/disposition requires same amount of fuel to load/haul/dump as Exc + Haul. Backfill / disposition fuel (gal) 20368 53600 87100
Site finishing Assume site finishing requires same amount of fuel as land clearing. Site finishing fuel (gal) 2349 4406 6318 Fuel for misc equipment (gal) 15000 30000 60000 Total fuel (gal) 59615 143646 243068 Assume that lube oil and grease consumption is 1.2% of fuel volume, per Caterpillar data. Lube oil and grease (gal) 715 1724 2917

ANL-AFCI-183, Rev. 0.5 Preliminary NEPA Data Study
Advanced Burner Reactor Facility 68 September 21, 2007
Permanent parking areas are calculated assuming 120 parking spaces per acre and 1.4 employees on average per car. Allowing for shift change overlap and temporary contract staff during shutdown periods, permanent parking for a 250 MWth plant can be estimated from the total number of plant employees as 300/(120x1.4), rounded up to 2 acres. For a 1000 MWth plant, permanent parking can be estimated as 344/(120x1.4), or about 2 acres. For a 2000 MWth plant, permanent parking can be estimated as 385/(120x1.4), rounded up to 3 acres.
Temporary parking lot size is estimated using the peak employment figures and the same assumptions as for permanent parking lots. Thus, temporary parking for a 250 MWth plant can be estimated as 780/(120x1.4), rounded up to 5 acres. For a 1000 MWth plant, temporary parking can be estimated as 2050/(120x1.4), or about 12 acres. For a 2000 MWth plant, permanent parking can be estimated as 385/(120x1.4), rounded up to 20 acres.
Table 28 (construction wastes):
Hazardous liquid and solid wastes: see Appendix B, Table B.2.
Sanitary liquid and solid wastes ([CRBRP, 1977], Sec. 4.1.1.5 and Table 8.2-1; Appendix B, Table B.3)
These two references differ considerably in estimates of sanitary liquid waste. The CRBR report lists a capacity to process a peak of 61,250 gallons per day, comprised of normal domestic sanitary wastewater, including laundry wastes and sink and toilet wastes. Liquid sanitary wastes were planned to be treated in an on-site treatment system during both construction and operations, with sludge to be collected and disposed of off-site by a contractor. Very limited use was to be made of chemical toilets. Assuming liquid sanitary waste of 25 gal./person/day and the annual construction employment figures from Table 8.2-1, total liquid sanitary waste during construction would be
365(150+450+1000+1500+1980+1483+450/4) = 61,000,000 gal.,
which is a reasonable estimate of the liquid sanitary wastes during construction for a 1000 MWth ABR plant. If the CRBR liquid sanitary wastes are scaled by a power factor, as described in Appendix B, then for construction of a 2000 MWth plant,
Liquid sanitary waste = (61,000,000)*(2000/1000)0.7 ≈ 99,000,000 gal.
and for construction of a 250 MWth plant,
Liquid sanitary waste = (61,000,000)*(250/1000)0.7 ≈ 23,000,000 gal.
By contrast, the analysis presented in Table B.3 assumes sanitary liquid waste to be exclusively from waterless portable toilets, with this waste then transported off site to be processed. Because the ABR plant design has not yet developed to the point of

ANL-AFCI-183, Rev. 0.5 Preliminary NEPA Data Study
Advanced Burner Reactor Facility 69 September 21, 2007
addressing sanitary waste expected during construction, both approaches are included in this document.
Solid sanitary wastes are assumed to be generated primarily by lunch waste and hand cleaning. The analysis described in Appendix B, Table B.3 estimates the mass of these untreated wastes from ten years of data on per capita solid wastes generated in Missouri. No average density value is estimated, so the solid waste estimate is given in tons.
Other non-hazardous wastes: see Appendix B, Table B.4.

ANL-AFCI-183, Rev. 0.5 Preliminary NEPA Data Study
Advanced Burner Reactor Facility 70 September 21, 2007
Appendix B: ABR Construction Wastes Spreadsheet Tables
Construction wastes for an ABR plant have been estimated primarily based upon information from construction of an existing reactor power generating station. Information was organized in a spreadsheet which was then used to perform the necessary calculations. Tables B.1 through B.6 list each sheet in the spreadsheet. Table B.1 summarizes the assumptions and results of the evaluation. Tables B.2 through B.4 provide details of the calculations for hazardous wastes, sanitary wastes, and other non-hazardous wastes. Tables B.5 and B.6 provide information supporting the calculations.
Table B.1. Summary of Waste Generated During Construction of a Commercial Scale Advanced Burner Reactor.
250 MWth 1000 MWth 2000 MWth Solid Liquid Solid Liquid Solid Liquid Units Source/Factor Hazardous/Special Waste 1.3 25.4 3.7 73.8 6.6 130.8 tons comparable project est.Sanitary Waste 436 750 1,150 1,980 1,868 3,217 tons per capita-day Other Waste 5,692 342 15,022 904 24,403 1,468 tons per trade hours Assumptions: Greenfield site - no prior structures to remove, no D&D. Estimates include only waste generated on site. Soil spoil will be reused on site. Landscape and land clearing debris (green wood materials) will be reused onsite. Construction period - from site planning through initial commissioning. Reasonable efforts will be made to reduce, reuse, reclaim, recycle. No on-site residential workers. Assume craft hours scale by PWR/ABR Cost Factor. Reasonable efforts will be made to avoid specification and use of hazardous/special materials. Wastewater will be separated from surface runoff. Liquid sanitary wastes - assumed based on primary use of no-flush portable toilets. (Same qty of sanitary waste would be generated w/wo ABR project.) ??? Sanitary wastes are similar to those generated if manpower were on another project or stayed home. Waste generated will scale proportionate to ABR Cost Factor. Waste comes from purchased material (packaging, waste, scrap) and purchased labor hours, so a reasonable first-order assumption is that the amount of waste is proportional to dollar cost. Cost/Power Factor Assume: (cost / COST) = (power / POWER)^0.7
(empirical correlation that compensates for economies of scale) 250 MWth 1000 MWth 2000 MWth Power factor exponent 0.7 0.7 0.7
Note: Cost/Power factor was estimated from PWR information because this information was not available for CRBR, since CRBR was never actually built.
PWR Power, MWe 1144 1144 1144 ABR Power (Pth), MWth 250 1000 2000 ABR Power effiency(Pe/Pth) 39% 39% 39% ABR Power (Pe), MWe 97.5 390 780 ABR/PWR cost factor 0.18 0.47 0.76

ANL-AFCI-183, Rev. 0.5 Preliminary NEPA Data Study
Advanced Burner Reactor Facility 71 September 21, 2007
Table B.2. ABR Construction Hazardous / Special Waste
Includes: Oils, paints and thinners, cleaners, sealants, glues and adhesives, batteries, pesticides
Hazardous Waste - Solid Assume Hazardous Waste - Solid will be generated at a rate similar to that estimated in [USNRC, 2005]. These numbers are annual construction wastes, taken from the National Enrichment Facility Safety Analysis Report [NEF, 2005]. This analysis is a recent evaluation of a facility of comparable size to the ABR and so was preferred to CRBR estimates. 250 MWth 1000 MWth 2000 MWth Adhesives, resins, sealers, caulking. 466.5 lb/yr 0.277 yd.3/yr. 1231.1 lb/yr 0.730 yd.3/yr. 2000 lb/yr 1.186 yd.3/yr. Lead (batteries) 46.7 lb/yr 0.002 yd.3/yr 123.11 lb/yr 0.006 yd.3/yr 200 lb/yr 0.010 yd.3/yr Estimated density of adhesives, etc. (varies from 1 to 2 g/cc; 1g/cc = 1/5.93E-04 lb/cu. yd. 1 g/cc chosen as a conservative value for density) 1,686 lb/yd.3
Density of lead (11.35 g/cc - CRC Handbook of Tables for Engineering Science) 19,140 lb/yd.3
Annual ABR Construction Hazardous Waste - Solid 0.26 ton/yr 0.279 yd.3/yr 0.68 ton/yr 0.74 yd.3/yr 1.10 ton/yr 1.196 yd.3/yr Years for construction 5.0 5.5 6.0 Total ABR Construction Hazardous Waste - Solid 1.283 ton 1.395 yd.3 3.724 ton 4.051 yd.3 6.6 ton 7.179 yd.3
Hazardous Waste - Liquid Assume Hazardous Waste - Liquid will be generated at a rate similar to that estimated in [USNRC, 2005]. These numbers are annual construction wastes, taken from the National Enrichment Facility Safety Analysis Report [NEF, 2005]. 250 MWth 1000 MWth 2000 MWth Paints, solvents, thinners, organics 4,898 lb/yr 700 gal/yr 12,927 lb/yr 1,847 gal/yr 21,000 lb/yr 3,000 gal/yr Petroleum products, oils, lubricants 4,898 lb/yr 700 gal/yr 12,927 lb/yr 1,847 gal/yr 21,000 lb/yr 3,000 gal/yr Sulfuric acid (batteries) 187 lb/yr 23 gal/yr 492 lb/yr 62 gal/yr 800 lb/yr 100 gal/yr Pesticides 187 lb/yr 23 gal/yr 492 lb/yr 62 gal/yr 800 lb/yr 100 gal/yr Annual ABR Construction Hazardous Waste - Liquid 5.09 ton/yr 1,446 gal/yr 13.42 ton/yr 3,817 gal/yr 21.80 ton/yr 6,200 gal/yr Years for construction 5.0 5.5 6.0 Total ABR Construction Hazardous Waste - Liquid 25.43 ton 7,231 gal. 73.8 ton 20,991 gal. 130.8 ton 37.200 gal.
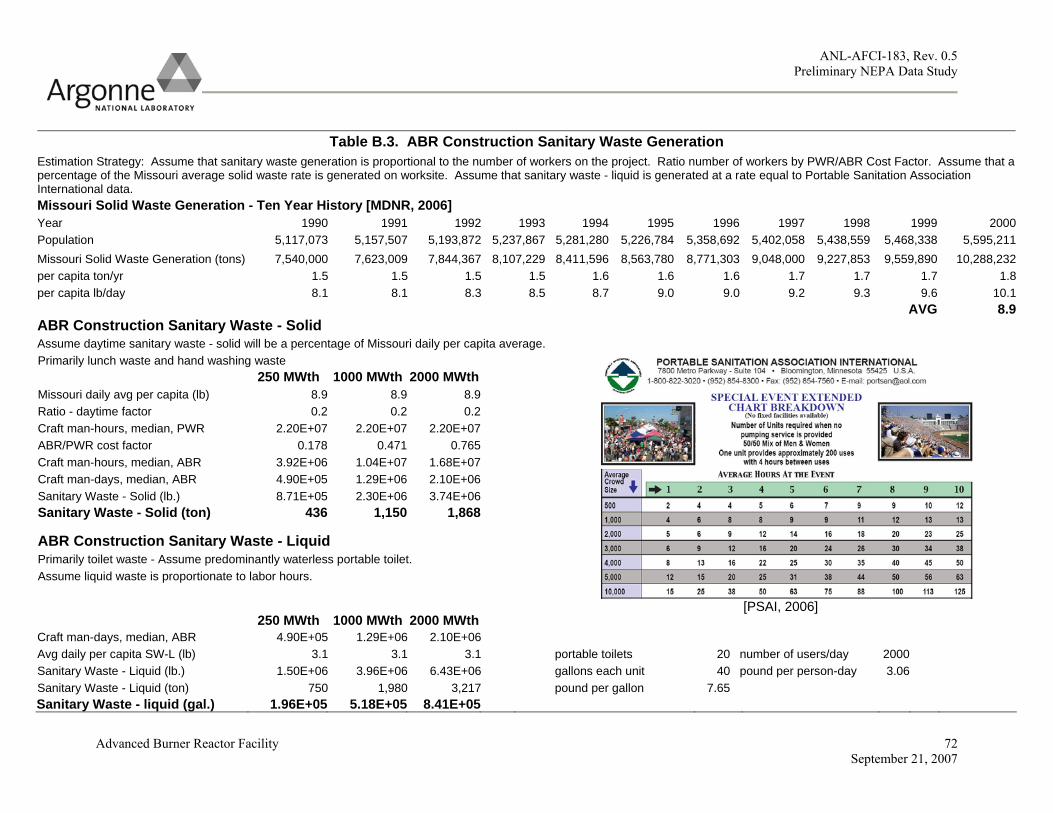
ANL-AFCI-183, Rev. 0.5 Preliminary NEPA Data Study
Advanced Burner Reactor Facility 72 September 21, 2007
Table B.3. ABR Construction Sanitary Waste Generation
Estimation Strategy: Assume that sanitary waste generation is proportional to the number of workers on the project. Ratio number of workers by PWR/ABR Cost Factor. Assume that a percentage of the Missouri average solid waste rate is generated on worksite. Assume that sanitary waste - liquid is generated at a rate equal to Portable Sanitation Association International data. Missouri Solid Waste Generation - Ten Year History [MDNR, 2006] Year 1990 1991 1992 1993 1994 1995 1996 1997 1998 1999 2000Population 5,117,073 5,157,507 5,193,872 5,237,867 5,281,280 5,226,784 5,358,692 5,402,058 5,438,559 5,468,338 5,595,211Missouri Solid Waste Generation (tons) 7,540,000 7,623,009 7,844,367 8,107,229 8,411,596 8,563,780 8,771,303 9,048,000 9,227,853 9,559,890 10,288,232per capita ton/yr 1.5 1.5 1.5 1.5 1.6 1.6 1.6 1.7 1.7 1.7 1.8per capita lb/day 8.1 8.1 8.3 8.5 8.7 9.0 9.0 9.2 9.3 9.6 10.1
AVG 8.9ABR Construction Sanitary Waste - Solid Assume daytime sanitary waste - solid will be a percentage of Missouri daily per capita average. Primarily lunch waste and hand washing waste 250 MWth 1000 MWth 2000 MWth Missouri daily avg per capita (lb) 8.9 8.9 8.9Ratio - daytime factor 0.2 0.2 0.2Craft man-hours, median, PWR 2.20E+07 2.20E+07 2.20E+07ABR/PWR cost factor 0.178 0.471 0.765Craft man-hours, median, ABR 3.92E+06 1.04E+07 1.68E+07Craft man-days, median, ABR 4.90E+05 1.29E+06 2.10E+06Sanitary Waste - Solid (lb.) 8.71E+05 2.30E+06 3.74E+06Sanitary Waste - Solid (ton) 436 1,150 1,868 ABR Construction Sanitary Waste - Liquid Primarily toilet waste - Assume predominantly waterless portable toilet. Assume liquid waste is proportionate to labor hours.
250 MWth 1000 MWth 2000 MWth [PSAI, 2006]
Craft man-days, median, ABR 4.90E+05 1.29E+06 2.10E+06 Avg daily per capita SW-L (lb) 3.1 3.1 3.1 portable toilets 20 number of users/day 2000Sanitary Waste - Liquid (lb.) 1.50E+06 3.96E+06 6.43E+06 gallons each unit 40 pound per person-day 3.06Sanitary Waste - Liquid (ton) 750 1,980 3,217 pound per gallon 7.65 Sanitary Waste - liquid (gal.) 1.96E+05 5.18E+05 8.41E+05

ANL-AFCI-183, Rev. 0.5 Preliminary NEPA Data Study
Advanced Burner Reactor Facility 73 September 21, 2007
Table B.4. Other ABR Non-Hazardous Construction Waste Construction waste generated on site will be similar in nature and volume to waste generated during construction of a similar sized industrial facility. Other Waste - Solid material trimmings packaging materials spoiled materials rebar scraps crates, skids carpet scraps drywall scraps Assume generation rates by craft man-hours, see Table B.5. Assume waste generation scales by cost factor.
250 MWth 1000 MWth 2000 MWth PWR Other Waste - Solid 31906 ton 1.82E+05 yd.3 31906 ton 1.82E+05 yd.3 31906 ton 1.82E+05 yd.3
ABR/PWR cost factor 0.178 0.178 0.471 0.471 0.765 0.765 ABR Other Waste - Solid 5,692 ton 3.24E+04 yd.3 15,022 ton 8.56E+04 yd.3 24,403 ton 1.39E+05 yd.3
Other Waste - Liquid Water from washing and cleaning (density = 1 kg/m.3) Assume generation rates by craft man-hours, see Table B.5. Assume waste generation scales by cost factor.
250 MWth 1000 MWth 2000 MWth PWR Other Waste - Liquid 1919 ton 4.60E+05 gal. 1919 ton 4.60E+05 gal. 1919 ton 4.60E+05 gal. ABR/PWR cost factor 0.178 0.178 0.471 0.471 0.765 0.765 ABR Other Waste - Liquid 342 ton 8.21E+04 gal. 904 ton 2.17E+05 gal. 1,468 ton 3.52E+05 gal.

ANL-AFCI-183, Rev. 0.5 Preliminary NEPA Data Study
Advanced Burner Reactor Facility 74 September 21, 2007
Table B.5. Man-hours to Construct a Power Station
Per [USDOE, 1988] - Direct Craft Man-hours for 1144MWe PWR Power Generating Station.
Median Construction other
solid waste
Median Construction other
liquid waste
Craft Median Man-
hours Better Man-
hours
per man-week, in pounds
per project, in
tons
per man-week, in pounds
per project, in
tons Boiler Makers 951,041 667,062 100 1189 5 59Bricklayers 340,127 215,368 350 1488 10 43Carpenters 1,718,442 1,322,745 200 4296 5 107Electricians 3,817,045 2,201,879 90 4294 2 95Ironworkers 2,276,271 1,314,267 100 2845 5 142Laborers 2,469,131 1,587,579 125 3858 10 309Millwrights 241,073 192,938 100 301 5 15Operating Engineers 1,635,640 903,182 50 1022 2 41Painters 744,695 292,610 100 931 20 186Pipe Fitters 6,904,749 3,025,010 125 10789 10 863Sheet Metal Workers 359,071 160,302 100 449 10 45Teamsters 355,036 154,652 50 222 2 9All Others 177,453 150,412 100 222 2 4 Sum 31906 Sum 1919
Sum 21,989,774 12,188,006
Table B.6. Weight to Volume Conversions
Material Conversion Rate Units 300.0 lbs./yd.3
Wood 6.7 yd.3/ton 30-100 lbs./yd.3
Cardboard (loose) 20-50 yd.3/ton 400.0 lbs./yd.3
Drywall 5.0 yd.3/ton 350.0 lbs./yd.3
Mixed Waste 5.7 yd.3/ton

ANL-AFCI-183, Rev. 0.5 Preliminary NEPA Data Study
Advanced Burner Reactor Facility 75 September 21, 2007
Appendix C: ABR Plant Steel Requirements Spreadsheet Table
Table C.1 below shows the spreadsheet table assembled to estimate steel usage in constructing an ABR plant. Estimates are given for a 250 MWth, a 1000 MWth, and a 2000 MWth plant. Estimates are based on an actual PWR because it was felt that steel usage would be better estimated from actual detailed construction information on a commercial PWR than from much less detailed information on CRBR, which was never constructed.
Table C.1. Advanced Burner Reactor Steel Requirements
2000 MWth 1000 MWth 250 MWth Structures per ABR Plans L (ft) W (ft) Area (SF) Roofed Area (SF) Roofed Area (SF) Roofed
Security Gate House 30 30 900 900 900 900 900 900 Control Bldg, 1000 and 2000 131 96 12576 12576 12576 12576 Control Bldg, 250 89 71 6319 6319 BOP Bldg, 1000 and 2000 260 161 41860 41860 41860 41860 BOP Bldg, 250 72 46 3312 3312 Reactor Bldg, 1000 and 2000 204 204 41616 41616 41616 41616 Reactor Bldg, 250 89 89 7921 7921 Fuel Handling Facility, all 100 60 6000 6000 6000 6000 6000 6000 Fuel Storage Facility, 1000 and 2000 307 187 57409 57409 57409 57409 Fuel Storage Facility, 250 250 125 31250 31250 RW/Maint Facility, 1000 and 2000 120 200 24000 24000 24000 24000 RW/Maint Facility, 250 100 60 6000 6000 Switch Yard 100 89 8900 8900 8900 BOP Services Bldg, 1000 and 2000 100 90 9000 9000 9000 9000 BOP Services Bldg, 250 50 45 2250 2250 Cooling Tower, 2000 (two) 156 dia 38227 Cooling Tower, 1000 156 dia 19113 Cooling Tower, 250 (four) 48.5 48.5 2352

ANL-AFCI-183, Rev. 0.5 Preliminary NEPA Data Study
Advanced Burner Reactor Facility 76 September 21, 2007
Back-up generator bldg, 1000 and 2000 100 30 3000 3000 3000 3000 Back-up generator bldg, 250 25 15 375 375 Lift Station Bldg 40 30 1200 1200 1200 1200 1200 1200 Waste Water Tx Bldg, 2000 110 85 9350 9350 Waste Water Tx Bldg, 1000 80 60 4800 5800 Waste Water Tx Bldg, 250 40 30 1200 1200 Sum 254038 206911 230374 202361 85036 66727 Volume/Power factor to scale various size facilities. Data derived from 1144 MWe PWR Convert to 250, 1000, and 2000 MWth
Volume/Power Factor Assume: (volume / VOLUME) = (power / POWER)^0.7 250 MW 1000 MW 2000 MW Volume factor exponent 0.7 0.7 0.7 PWR Power, MWe 1144 1144 1144 ABR Power, MWth 250 1000 2000 ABR Power efficiency (Pe/Pth) 39% 39% 39% ABR Power, MWte 97.5 390 780 ABR/PWR cost factor 0.178 0.471 0.765 250/2000 cost factor 0.233 1000/2000 cost factor 0.616 Steel Usage, per 1144 MWe Pressurized Water Reactor, 1987 Historical Data
Experience 2000 1000 250 Commodity Median Better MWth MWth MWth
Qty Qty (ton) (ton) (ton)

ANL-AFCI-183, Rev. 0.5 Preliminary NEPA Data Study
Advanced Burner Reactor Facility 77 September 21, 2007
Reinforcing steel ton 25,328 20082 19372 11925 4519 Embedded steel ton 1921 1324 1469 904 343 Structural steel ton 10906 7198 8341 5135 1946 Carbon steel piping (NS) ton 1038 813 794 489 185 Stainless steel piping (NS) ton 342 283 261 161 61 Carbon steel piping (NNS) ton 3995 3228 3055 1881 713 Stainless steel piping (NNS) ton 315 258 241 149 56
Sum(ton) 43,845 33,186 Sum(ton) 33534 20643 7822 NS - Nuclear Safety Grade NNS - Non-Nuclear Safety Grade
Steel Used in Reactor Equivalent Volumes and Masses by rectangular approximations, at 2000 MWth, adjusted to 250 and 1000 MWth. Qty L W T V Density Steel Weight in in in in^3 lb/in^3 Tons Primary Vessel 1 1319 688 2 1814944 0.29 263.2 Secondary Vessel 1 1400 700 1 980000 0.29 142.1 Core & support 1 100 100 50 500000 0.29 72.5 Redan 1 1450 435 1 630750 0.29 91.5 Cover 1 1000 1000 3 3000000 0.29 435.0 IHX 4 1150 150 0.5 345000 0.29 50.0 Primary Pump/Motor 4 1500 16 16 1536000 0.29 222.7 Sample service equipment 1 1200 60 1 72000 0.29 10.4 Secondary Piping 1 1200 31.4 0.6 22608 0.29 3.3 Miscellaneous 1 100 25 25 62500 0.29 9.1 Sum 1300 tons 1000 2000 250 MWth MWth MWth

ANL-AFCI-183, Rev. 0.5 Preliminary NEPA Data Study
Advanced Burner Reactor Facility 78 September 21, 2007
Steel (ton) 800 1300 303
1000 MWth 2000 MWth 250 MWth Generating equipment P (MWe) Ton/MWe Ext (ton) Ext (ton) Ext (ton) Spec Resource
Steam turbines 780 2.31 1109 1802 420 HP+LP steam turbinewww.genesispower.co.nz/genesis
Generators 780 1.03 495 803 187Distributed winding, hydrogen cooled ^
Sum(ton) 1604 2605 608 www.nzcid.org.nz Backup generators Wt (ton) Wt (ton) Wt (ton) Spec Resource
2000 MWth 12,000 kWe 168
Cat 1000 kW standby diesel genset www.cat.com/cda
1000 MWth 6,000 kWe 84
Cat 1000 kW standby diesel genset www.cat.com/cda
250 MWth 2000 kWe 28
Cat 1000 kW standby diesel genset www.cat.com/cda
Sum(ton) 84 168 28 Security Fences L (ft) W (ft) Perimeter(ft) Ext (ton) Ext (ton) Ext (ton) Spec Resource
Inner Security Fence, 1000 and 2000 1085 660 3490 25 25
fence, chain link, industrial, sch 40, 8 ft , 6 ga. wire, 2.5"post, galv. steel. NFPA, RSMeans*
Inner Security Fence, 250 435 244 1358 10 ^ ^ Outer Security Fence, 1000 and 2000 1253 885 4276 30 30 ^ ^

ANL-AFCI-183, Rev. 0.5 Preliminary NEPA Data Study
Advanced Burner Reactor Facility 79 September 21, 2007
Outer Security Fence, 250 616 394 2020 14 ^ ^ Switchyard fence 50 89 278 2 2 2 ^ ^ Sum(ton) 57 57 26 Railroad spurs 3.5 miles ton/mile Ext (ton) Ext (ton) Ext (ton) Spec Resource
Rail 3.5 miles ton/mile 202 707 707 707RE115 rail, plates, spikes,splices www.akrailroad.com/
Plates 3.5 miles ton/mile 33 116 116 116 ^ ^ Joints 3.5 miles ton/mile 12.8 45 45 45 ^ ^ Bolts 3.5 miles ton/mile 1.6 6 6 6 ^ ^ Spikes 3.5 miles ton/mile 4.06 14 14 14 ^ ^ Sum(ton) 887 887 887 Fire Protection Ext (ton) Ext (ton) Ext (ton) Spec Resource
Fire protect system, internal, 2000 206911 ft2 0.92 lb/ft2 95 Dry valve system, extra hazard, NFPA, RSMeans
Fire protect system, internal, 1000 202361 ft2 0.92 lb/ft2 93 ^ ^ Fire protect system, internal, 250 66727 ft2 0.92 lb/ft2 31 ^ ^ Fire hydrant system, external, 1000 and 2000 6000 ft 24.5 lb/ft 74 74
12" main, hydrants, PIV ^
Fire hydrant system, external, 250 3000 ft 24.5 lb/ft 3712" main, hydrants, PIV ^
Sum(ton) 167 169 67 HVAC and Electrical Ext (ton) Ext (ton) Ext (ton) Spec Resource
Heating, 2000 206911 ft2 1.12 lb/ft2 116 hydronic, tube-fin, electric boiler RSMeans
Heating, 1000 202361 ft2 1.12 lb/ft2 113hydronic, tube-fin, electric boiler RSMeans
Heating, 250 66727 ft2 1.12 lb/ft2 37hydronic, tube-fin, electric boiler RSMeans

ANL-AFCI-183, Rev. 0.5 Preliminary NEPA Data Study
Advanced Burner Reactor Facility 80 September 21, 2007
Air conditioning, 2000 206911 ft2 0.52 lb/ft2 54 packaged chiller, fan cooled coil unit RSMeans
Air conditioning, 1000 202361 ft2 0.52 lb/ft2 53packaged chiller, fan cooled coil unit RSMeans
Air conditioning, 250 66727 ft2 0.52 lb/ft2 17packaged chiller, fan cooled coil unit RSMeans
Domestic electrical, 2000 206911 ft2 0.76 lb/ft2 79 service, branch, lighting, receptacles RSMeans
Domestic electrical, 1000 206911 ft2 0.76 lb/ft2 77 service, branch, lighting, receptacles RSMeans
Domestic electrical, 250 66727 ft2 0.76 lb/ft2 25service, branch, lighting, receptacles RSMeans
Sum(ton) 243 248 80 Furnishings Ext (ton) Ext (ton) Spec Resource
Steel content/furn 2000 206911 ft2 1.8 lb/ft2 186 office, maintenance, MRO RSMeans
Steel content/furn 2000 202361 ft2 1.8 lb/ft2 182 ^ RSMeans Steel content/furn, 250 66727 ft2 1.8 lb/ft2 60 ^ RSMeans Sum(ton) 182 186 60 Transmission Towers Existing
2000 MWth
2000 MWth
250 MWth
Total ABR Steel Requirements (ton) 24666 39155 9882 Assumptions Some site facilities do not scale with power levels. *RSMeans - RSMeans Square Foot Costs, 26th Edition (2005) and RSMeans Building Construction Cost Data, 63rd edition (2005)

A U.S. Department of Energy laboratory managed by UChicago Argonne, LLC
Nuclear Engineering DivisionArgonne National Laboratory9700 South Cass Avenue, Bldg. 208 Argonne, IL 60439-4842
www.anl.gov