advanced debug with powerintegrator - lauterbach an07101f – advanced debug with powerintegrator 3...
TRANSCRIPT
Introduction AN07101F – Advanced Debug with PowerIntegrator
www.lauterbach.com
Advanced Debug with PowerIntegrator
Index ADVANCED DEBUG WITH POWERINTEGRATOR................................................................................2
SCENARIO......................................................................................................................................................... 2
SCOPE OF THIS DOCUMENT ................................................................................................................................. 2
Hardware employed .................................................................................................................................... 3
INTERACTION BETWEEN HARDWARE AND SOFTWARE ............................................................................................. 4
Correlation between Hardware and Software execution ............................................................................... 4
Hardware Trigger Events............................................................................................................................. 6
Complex Trigger.......................................................................................................................................... 7
HARDWARE TRACE ............................................................................................................................................ 8
Bus Trace.................................................................................................................................................... 8
Flow-Trace through Branch-Trace messages............................................................................................. 10
Data Logging............................................................................................................................................. 11
PROTOCOL ANALYSIS ....................................................................................................................................... 14
Data Logger by Protocol Analysis .............................................................................................................. 15
CONCLUSIONS................................................................................................................................................. 17
Introduction AN07101F – Advanced Debug with PowerIntegrator
2
Advanced Debug with PowerIntegrator
Scenario In modern embedded applications, developers are facing a growing complexity with the problems they run into during the debug phase as they try to achieve a smooth running application combined with better and better performance. In most advanced designs the interaction between hardware and software is becoming more complex, and developers need specific tools to be able to analyze and correlate the hardware’s behaviour with the execution of certain blocks of code, something that is not usually seen when you are debugging “pure” software. A common example of this type of interaction is the need to monitor and record data controlled by software routines which is being sent between several devices on the board via the communication busses. For this type of monitoring in the hardware you need an instrument that can track and time the signals, a logic analyzer. If this instrument is then correlated with the software it provides information which is much easier for the developer to use. Even better if it can be integrated into the applications debug environment where full advantage can be taken of the links between the hardware and software operation A large and ever growing number of applications also use several communication protocols to allow exchange of data between either local devices (I2C, SPI, etc.) or remote equipment (serial lines, industrial bus, etc..), in this situation, an integrated logic analyzer can be very useful to perform protocol analysis. It is also becoming more common to find microprocessors which are able to handle the execution of a real-time kernel even in applications which are low-end or of limited complexity. This is due to the huge base of solutions which are available for many applications (almost) off-the-shelf (think of Linux and connectivity as an example). This can add many layers of complexity to the debugging part of the project. This kind of design is often based upon CPUs that do not have an onchip trace port, or maybe there are physical design constraints have prevented the use of such technology even though a trace port is there. One of the debug options would be to use bus tracing or data logging which only needs a limited amount of chip resources and, again, we could use a logic analyzer for this purpose. The various ways you can utilize a logic analyzer integrated into the debug environment provide you with many advantages in terms of reduced effort and shorter debug time.
Scope of this document The aim of this application note is to explain the usage, as an advanced debug tool, of PowerIntegrator, part of the range of TRACE32 PowerTools manufactured by Lauterbach, which is a powerful logic analyzer integrated in the TRACE32 PowerView debug development environment. The task is to show how to solve problems and issues of the type we discussed before by going through a series of examples that try to portray real-life situations, using the PowerIntegrator in various ways, along with snippets of code and PRACTICE scripts (Practice is the scripting language for Lauterbach tools).
Introduction AN07101F – Advanced Debug with PowerIntegrator
3
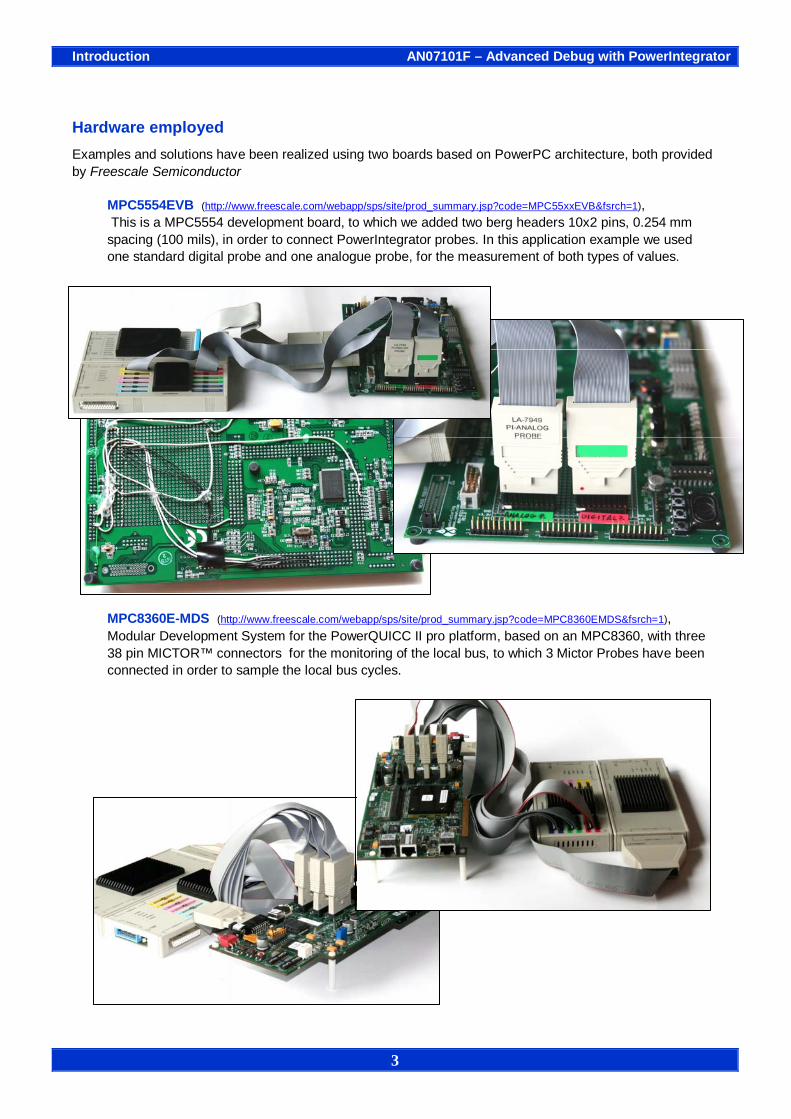
Hardware employed Examples and solutions have been realized using two boards based on PowerPC architecture, both provided by Freescale Semiconductor
MPC5554EVB (http://www.freescale.com/webapp/sps/site/prod_summary.jsp?code=MPC55xxEVB&fsrch=1), This is a MPC5554 development board, to which we added two berg headers 10x2 pins, 0.254 mm spacing (100 mils), in order to connect PowerIntegrator probes. In this application example we used one standard digital probe and one analogue probe, for the measurement of both types of values. MPC8360E-MDS (http://www.freescale.com/webapp/sps/site/prod_summary.jsp?code=MPC8360EMDS&fsrch=1), Modular Development System for the PowerQUICC II pro platform, based on an MPC8360, with three 38 pin MICTOR™ connectors for the monitoring of the local bus, to which 3 Mictor Probes have been connected in order to sample the local bus cycles.
Interaction between Hardware and Software AN07101F – Advanced Debug with PowerIntegrator
4
Interaction between Hardware and Software Correlation between Hardware and Software execution The easiest and most immediate use of an integrated logic analyzer in TRACE32 is to obtain a correlation within a time diagram of hardware events and code execution. This task is not easily to achieve with a “lab” version of a logic analyzer, because the synchronization between the events and the code execution is only an approximation.
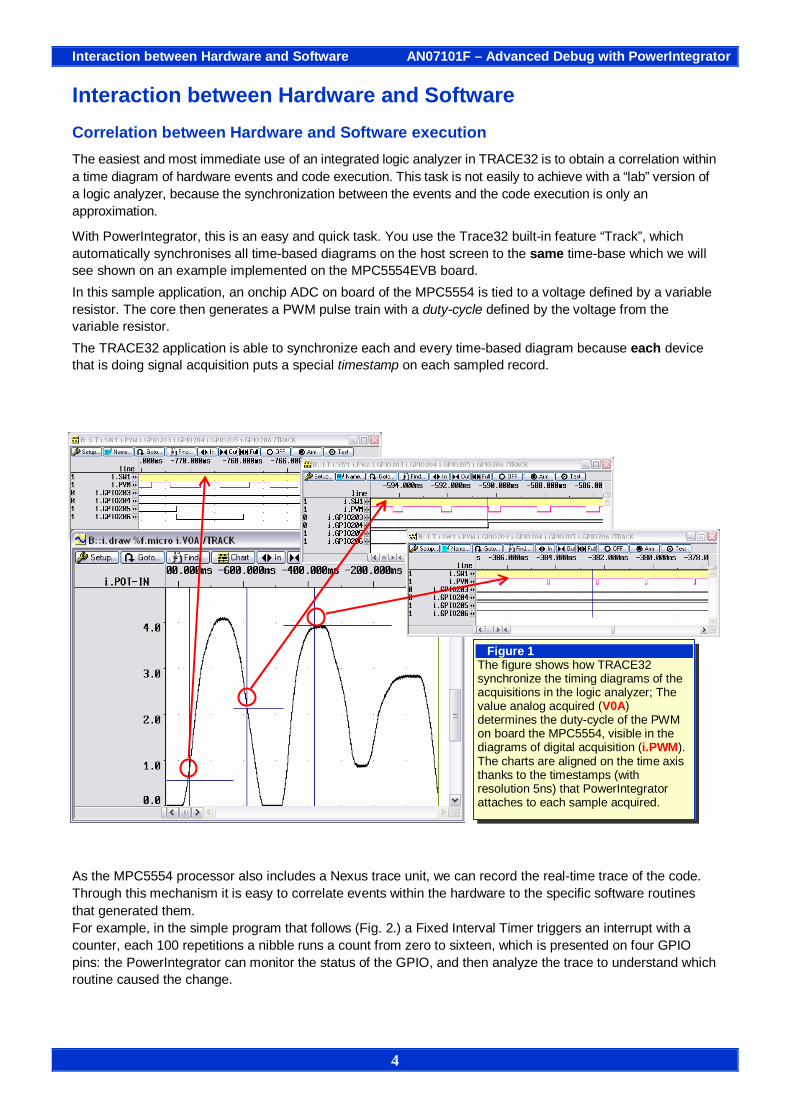
With PowerIntegrator, this is an easy and quick task. You use the Trace32 built-in feature “Track”, which automatically synchronises all time-based diagrams on the host screen to the same time-base which we will see shown on an example implemented on the MPC5554EVB board. In this sample application, an onchip ADC on board of the MPC5554 is tied to a voltage defined by a variable resistor. The core then generates a PWM pulse train with a duty-cycle defined by the voltage from the variable resistor. The TRACE32 application is able to synchronize each and every time-based diagram because each device that is doing signal acquisition puts a special timestamp on each sampled record.
As the MPC5554 processor also includes a Nexus trace unit, we can record the real-time trace of the code. Through this mechanism it is easy to correlate events within the hardware to the specific software routines that generated them. For example, in the simple program that follows (Fig. 2.) a Fixed Interval Timer triggers an interrupt with a counter, each 100 repetitions a nibble runs a count from zero to sixteen, which is presented on four GPIO pins: the PowerIntegrator can monitor the status of the GPIO, and then analyze the trace to understand which routine caused the change.
Figure 1The figure shows how TRACE32 synchronize the timing diagrams of the acquisitions in the logic analyzer; The value analog acquired (V0A) determines the duty-cycle of the PWM on board the MPC5554, visible in the diagrams of digital acquisition (i.PWM). The charts are aligned on the time axis thanks to the timestamps (with resolution 5ns) that PowerIntegrator attaches to each sample acquired.
Interaction between Hardware and Software AN07101F – Advanced Debug with PowerIntegrator
5
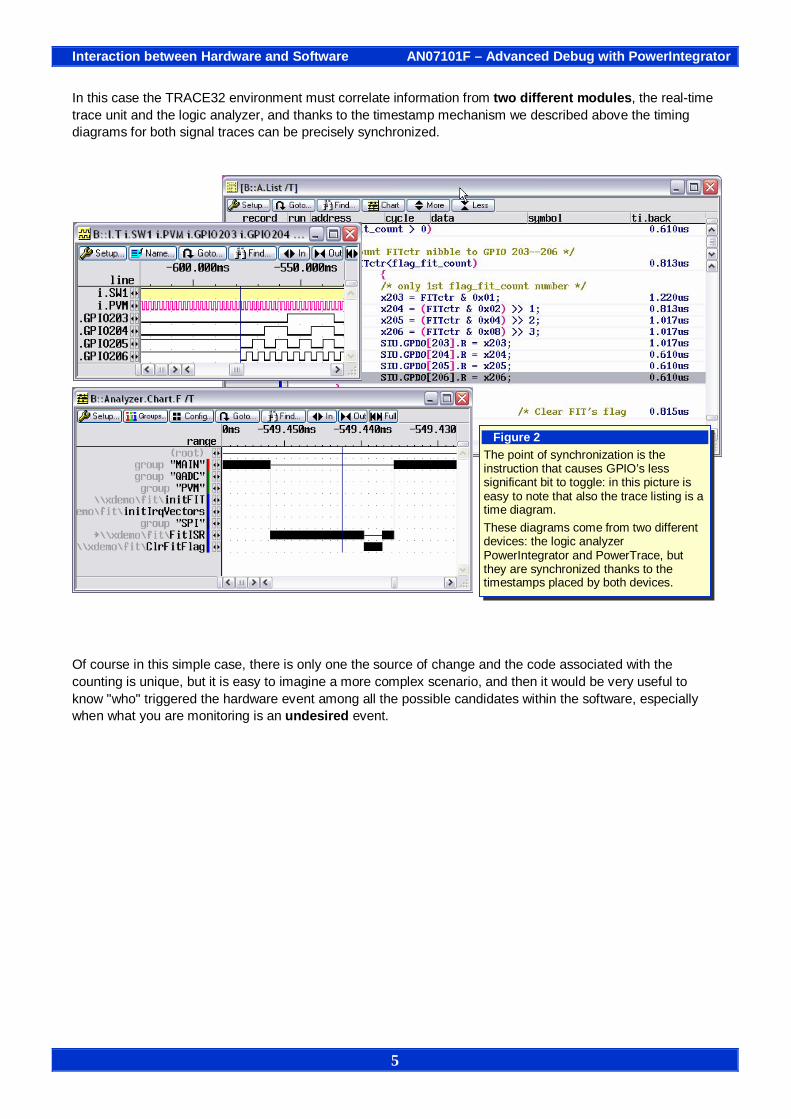
In this case the TRACE32 environment must correlate information from two different modules, the real-time trace unit and the logic analyzer, and thanks to the timestamp mechanism we described above the timing diagrams for both signal traces can be precisely synchronized. Of course in this simple case, there is only one the source of change and the code associated with the counting is unique, but it is easy to imagine a more complex scenario, and then it would be very useful to know "who" triggered the hardware event among all the possible candidates within the software, especially when what you are monitoring is an undesired event.
Figure 2The point of synchronization is the instruction that causes GPIO’s less significant bit to toggle: in this picture is easy to note that also the trace listing is a time diagram. These diagrams come from two different devices: the logic analyzer PowerIntegrator and PowerTrace, but they are synchronized thanks to the timestamps placed by both devices.
Hardware Triggers AN07101F – Advanced Debug with PowerIntegrator
6
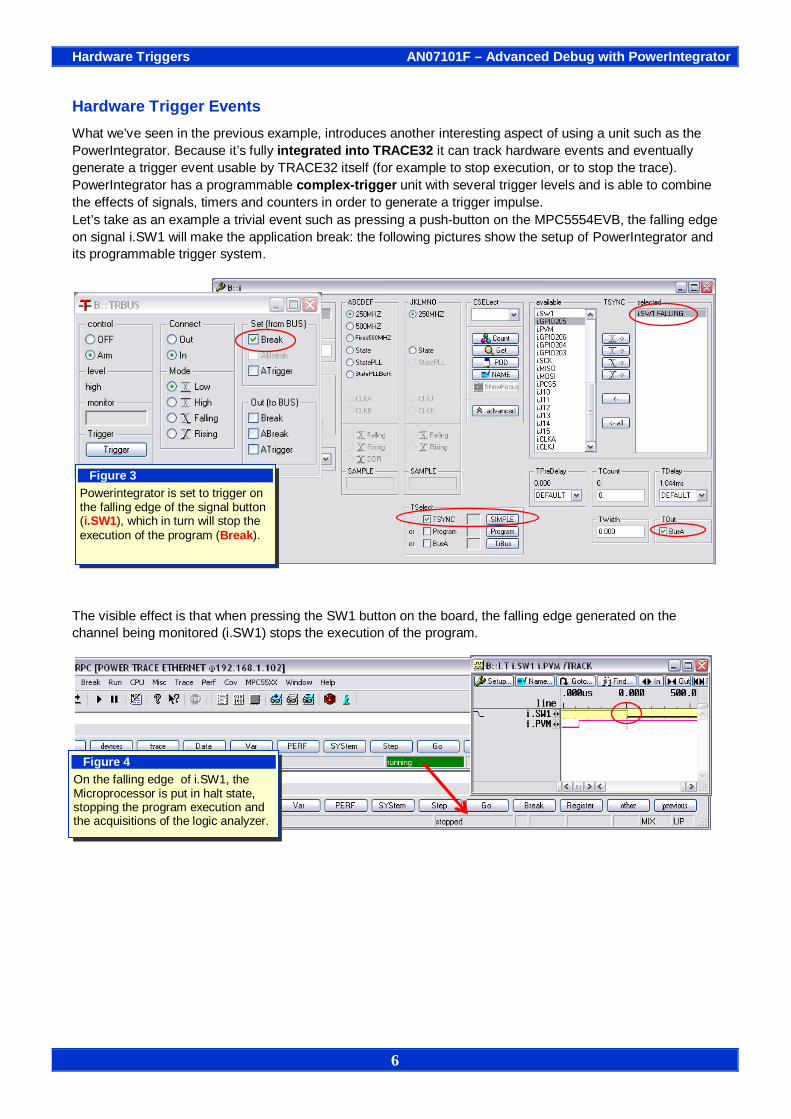
Hardware Trigger Events What we’ve seen in the previous example, introduces another interesting aspect of using a unit such as the PowerIntegrator. Because it’s fully integrated into TRACE32 it can track hardware events and eventually generate a trigger event usable by TRACE32 itself (for example to stop execution, or to stop the trace). PowerIntegrator has a programmable complex-trigger unit with several trigger levels and is able to combine the effects of signals, timers and counters in order to generate a trigger impulse. Let’s take as an example a trivial event such as pressing a push-button on the MPC5554EVB, the falling edge on signal i.SW1 will make the application break: the following pictures show the setup of PowerIntegrator and its programmable trigger system. The visible effect is that when pressing the SW1 button on the board, the falling edge generated on the channel being monitored (i.SW1) stops the execution of the program.
Figure 3 Powerintegrator is set to trigger on the falling edge of the signal button (i.SW1), which in turn will stop the execution of the program (Break).
Figure 4 On the falling edge of i.SW1, the Microprocessor is put in halt state, stopping the program execution and the acquisitions of the logic analyzer.

Hardware Triggers AN07101F – Advanced Debug with PowerIntegrator
7
Complex Trigger Based on the same concept, you can create more sophisticated trigger events by programming the complex trigger unit of the PowerIntegrator, for example by issuing the trigger only when the push-button has been pressed for a time of over 100ms. This is possible by using the timers and the finite state-machine available in the trigger unit. This example reproduces a situation where you want to monitor the duration of an event and stop the execution of the program if it lasts over a specified time limit. To do this, the settings of the trigger system remain the same but you set the logic analyzer on program and compile the following program within the unit: From this basis it is easy to understand how the PowerIntegrator can implement triggers controlled by very complex conditions. It can control the software execution based upon the behaviour of the hardware and the software.
SELECTOR switch i.SW1.Low ; declaration section TIMECOUNTER delay 100.ms ; declare switch event and timer L00: counter.restart delay ;Level 0: monitor if switch is goto L01 if switch ;pressed and change level L01: goto L00 if !switch ;Level 1: go back if button trigger.PODBUS if delay ;is released before 100ms ;otherwise issue trigger
A Figure 5 Powerintegrator is set to generate the trigger based on the program in the box above, point (A) is where the execution is stopped, caused by a 100 ms pressure on SW1.

Hardware Trace AN07101F – Advanced Debug with PowerIntegrator
8
Hardware Trace The most common application for a logic analyzer is the analysis of the logic status of signal groups. Applying this technique by sampling each system bus-cycle (address and data), allows reconstruction of the code executed by the CPU; in other words, you get a real-time trace of the program flow using a technique commonly called Bus Trace. Similarly, one could sample only specific cycles on the system bus, or only a set of dedicated signals, in which case we usually call the method ’Data Logging’; usually you get less detailed information than in a "complete" trace but the pay off is it normally needs far fewer resources. We put together some examples of how the PowerIntegrator would be used on an MPC8360EMDS board from Freescale, with a PowerQUICC II Pro CPU, a processor without a trace-port. This evaluation board is equipped with three MICTOR™ connectors for logic analyzers that allow observation of the local bus, an ideal example of an application for PowerIntegrator.
Bus Trace By sampling the bus cycles performed by the microprocessor you can reconstruct the program fetches and data read/write cycles. In this example we built a simple demo application into FLASH memory on the local bus of our MPC8360 board. We then connected PowerIntegrator probes to the mictor connectors for observation of the local bus, and we then configured it to recognize the read cycles sampling the bus on the rising edge of the FLASH chip-select. We then "programmed" the debugger to recognize the sampled cycles as instruction fetch using
i.disconfig.cycle “fetch” fetch address w.ADDR0-31 data w.DATA0-31
where words ADDR0-31 and DATA0-31 represent the local bus MPC8360 (see fig. 6)
Figure 6 The observation of the local bus (I), sampled at he physical level with PowerIntegrator allows the reconstruction of the flow through the disassembly of cycles (IIa) to obtain a complete Trace Listing (IIb), and a time diagram on high level (III ).
I
II
III
a
b
Hardware Trace AN07101F – Advanced Debug with PowerIntegrator
9
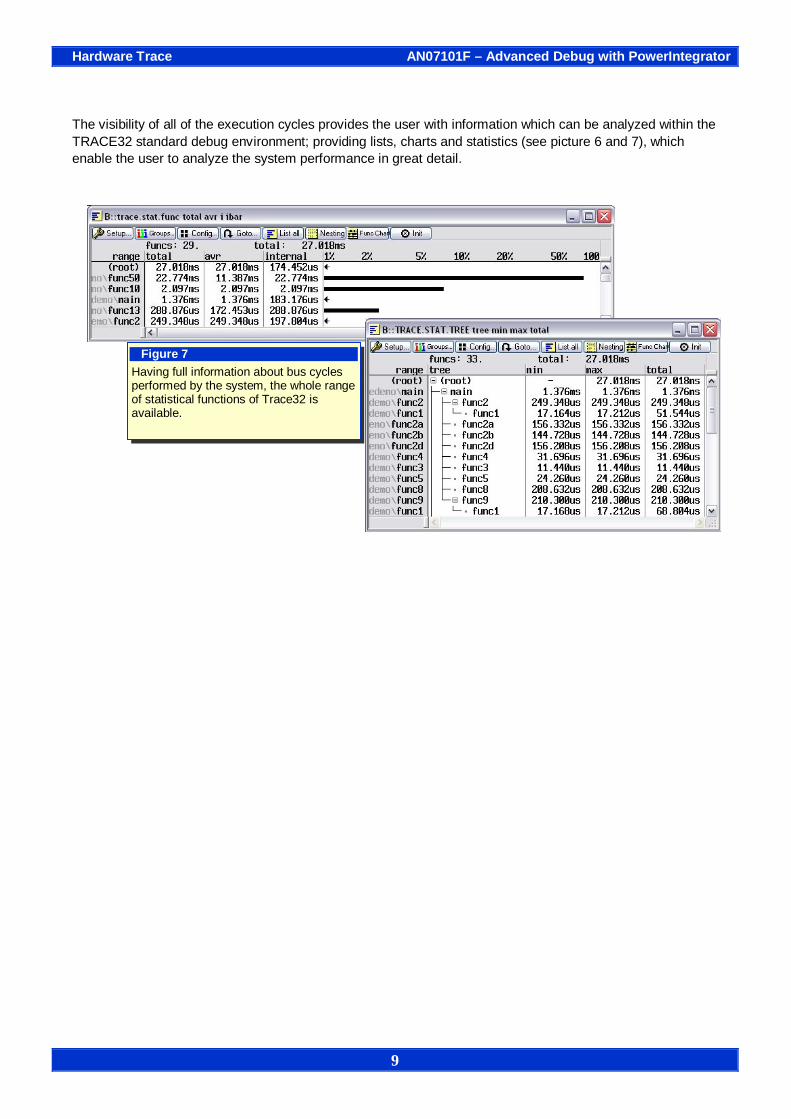
The visibility of all of the execution cycles provides the user with information which can be analyzed within the TRACE32 standard debug environment; providing lists, charts and statistics (see picture 6 and 7), which enable the user to analyze the system performance in great detail.
Figure 7 Having full information about bus cycles performed by the system, the whole range of statistical functions of Trace32 is available.

Hardware Trace AN07101F – Advanced Debug with PowerIntegrator
10
Flow-Trace through Branch-Trace messages An alternative to Bus Trace is for the system to only sample information on execution of non-linear code, or in other words to sample and record only on the executed branch instructions, the code executed between these branches can then be reconstructed with an appropriate algorithm, assuming that the execution is always linear between branches. The trace thus reconstructed is complete and the trace record generally covers a longer period of time than in the “basic” bus trace (since fewer samples carry much more information) the drawback is the lower granularity of timing information as each single sampled record represents more bus cycles. As an example, we implemented this technique on the MPC8360E MDS board: The PowerPC core can issue an exception on every branch instruction hit, and with a dedicated Interrupt Routine, it is possible to transmit the destination of the branch to the PowerIntegrator, producing a trace file similar to the record from a Bus Trace.
The routine writes the value of the program counter that caused the branch-trace exception (in a PowerPC this is stored in the state recovery register SRR0) to the area which is defined by the Flash chip-select. It is then necessary to tell the debugger to recognize the records as flow cycles, and we can get the complete trace listing of the program (see Figure 8):
i.dc.cycle "flow" flow s i.nLWE0 low s i.nLWE1 low s i.LLA30 low a w.DATA0-31 d w.DATA0-31
Note that in this case the address where the data is being written is irrelevant, providing it is defined, as all the information is contained in the written data (w.DATA0-31), which represents the value of the SRR0 when taking a branch-trace exception. Again as TRACE32 has a complete set of information about the executed code, all the functions for statistic and performance analysis are made available to the user.
Figure 8Interpreting the acquired samples as flow trace packages you get complete information about the program code execution.
Hardware Trace AN07101F – Advanced Debug with PowerIntegrator
11
Data Logging As mentioned earlier, another technique often used is data logging, This is normally defined as capturing only specific information by writing some pre-defined data; usually in this type of application, one can use a memory buffer in which the application itself periodically saves the data of interest so it can then be analyzed offline at a later time when the CPU is stopped. With a logic analyzer, we could make the application store this data through PowerIntegrator, without "wasting" target resources, and usually with a less intrusive logging code as a bonus. An interesting situation is when the target is running an operating system and you need to carry out logging at both the kernel and application (user process) level. To provide an example, we again used the MPC8360 MDS board, running a Linux Kernel and logging several data streams for different purposes:
• With the help of the system tick will try to make a qualitative statistic the CPU load. • Track when Linux makes a Task Switch, and analyze it in a time diagram.
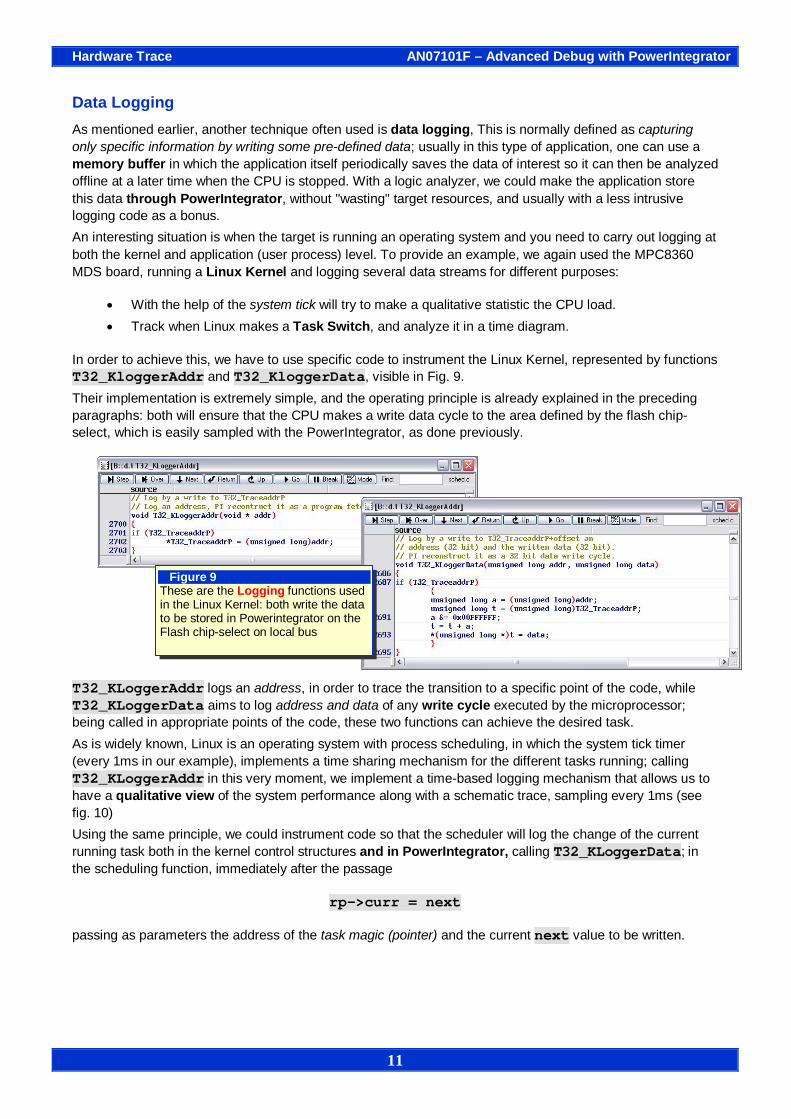
In order to achieve this, we have to use specific code to instrument the Linux Kernel, represented by functions T32_KloggerAddr and T32_KloggerData, visible in Fig. 9. Their implementation is extremely simple, and the operating principle is already explained in the preceding paragraphs: both will ensure that the CPU makes a write data cycle to the area defined by the flash chip-select, which is easily sampled with the PowerIntegrator, as done previously. T32_KLoggerAddr logs an address, in order to trace the transition to a specific point of the code, while T32_KLoggerData aims to log address and data of any write cycle executed by the microprocessor; being called in appropriate points of the code, these two functions can achieve the desired task. As is widely known, Linux is an operating system with process scheduling, in which the system tick timer (every 1ms in our example), implements a time sharing mechanism for the different tasks running; calling T32_KLoggerAddr in this very moment, we implement a time-based logging mechanism that allows us to have a qualitative view of the system performance along with a schematic trace, sampling every 1ms (see fig. 10) Using the same principle, we could instrument code so that the scheduler will log the change of the current running task both in the kernel control structures and in PowerIntegrator, calling T32_KLoggerData; in the scheduling function, immediately after the passage
rp->curr = next
passing as parameters the address of the task magic (pointer) and the current next value to be written.
Figure 9 These are the Logging functions used in the Linux Kernel: both write the data to be stored in Powerintegrator on the Flash chip-select on local bus

Hardware Trace AN07101F – Advanced Debug with PowerIntegrator
12
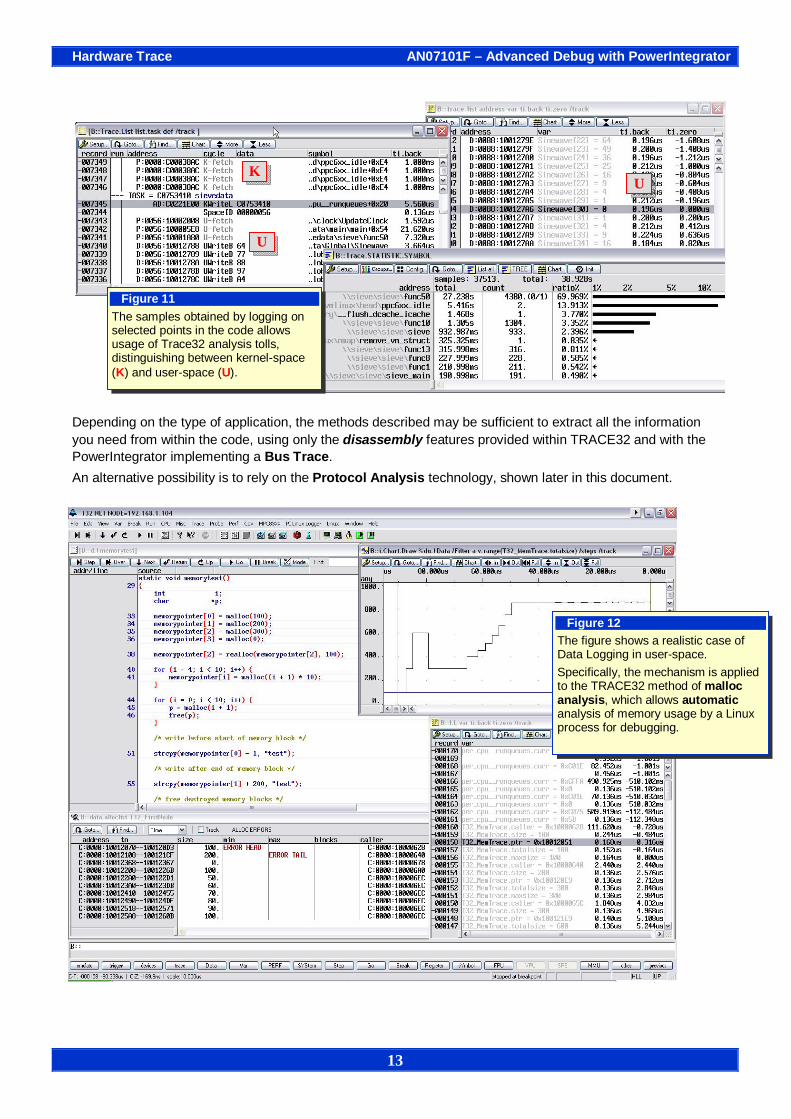
With this information we can produce a schematic trace and a precise timing diagram of the task switching activity of our kernel (see fig. 10). We also have to determine to which area the logical addresses in the trace belong, so this means we have to ensure that as a new process is scheduled, the SpaceID of the new process is also forwarded to our logic-analyzer, PowerIntegrator, again we use a call to T32_KloggerData. Also we need to tell the debugger to disassemble so it is able to recognize PowerIntegrator records as system bus cycles. Here is an abstract of the configuration commands: The same results can be achieved in user-space, but in this case we need the application to be able to write on the local bus flash. To do this in Linux, the application must be able to write to physical addresses, something which is normally not allowed, but it is possible by using the device /dev/mem. It is not the purpose of this application note to show the methods used in detail, it is enough to know that the process can actually write to the same addresses of the two functions already described, and the PowerIntegrator can capture samples in the same way that we used in kernel-space. The result is that it is now possible to discriminate between operations made in kernel-space, user-space and related data, allowing us to utilize the analysis tools provided within TRACE32. (See fig. 11 and fig. 12)
;#### Kernel fetch logged at FF000000 ##### i.disconfig.cycle "K-fetch" fetch &sWriteL0 &KfetchQual a w.DATA0-31 &SIDsample spaceID w.DATA0-31 ;#### SpaceIDs logged at FF000008 ##### i.disconfig.cycle "SpaceID" write &sWriteL0 &KSID_Qual spaceID w.DATA0-31
;#### User fetch logged at FF000004 #####i.disconfig.cycle "U-fetch" fetch &sWriteL0 &UfetchQual a w.DATA0-31 &SIDsample spaceID w.DATA0-31
Figure 10Thanks to the samples obtained by incorporating the Logger functions in the Linux Kernel, we get the trace information, having a 1ms period for execution, and at each task switch.
Hardware Trace AN07101F – Advanced Debug with PowerIntegrator
13
Depending on the type of application, the methods described may be sufficient to extract all the information you need from within the code, using only the disassembly features provided within TRACE32 and with the PowerIntegrator implementing a Bus Trace. An alternative possibility is to rely on the Protocol Analysis technology, shown later in this document.
Figure 11 The samples obtained by logging on selected points in the code allows usage of Trace32 analysis tolls, distinguishing between kernel-space (K) and user-space (U).
Figure 12 The figure shows a realistic case of Data Logging in user-space. Specifically, the mechanism is applied to the TRACE32 method of malloc analysis, which allows automatic analysis of memory usage by a Linux process for debugging.
K
U
U
Protocol Analysis AN07101F – Advanced Debug with PowerIntegrator
14
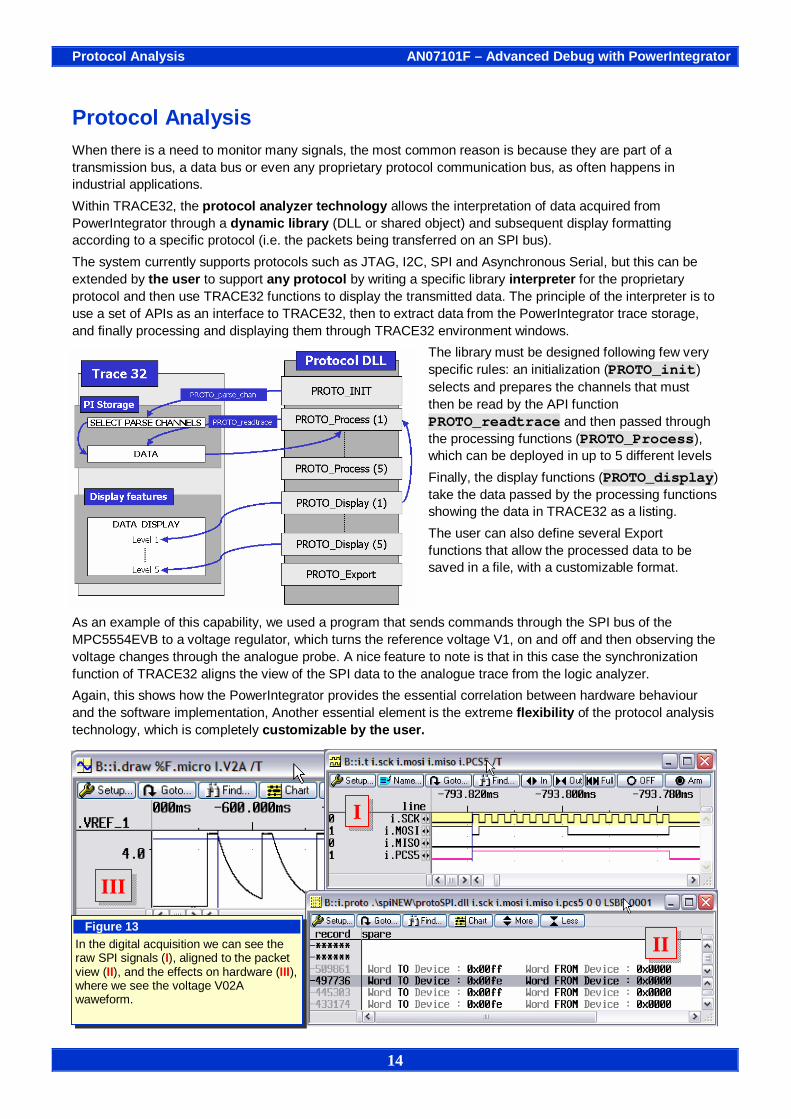
Protocol Analysis When there is a need to monitor many signals, the most common reason is because they are part of a transmission bus, a data bus or even any proprietary protocol communication bus, as often happens in industrial applications. Within TRACE32, the protocol analyzer technology allows the interpretation of data acquired from PowerIntegrator through a dynamic library (DLL or shared object) and subsequent display formatting according to a specific protocol (i.e. the packets being transferred on an SPI bus). The system currently supports protocols such as JTAG, I2C, SPI and Asynchronous Serial, but this can be extended by the user to support any protocol by writing a specific library interpreter for the proprietary protocol and then use TRACE32 functions to display the transmitted data. The principle of the interpreter is to use a set of APIs as an interface to TRACE32, then to extract data from the PowerIntegrator trace storage, and finally processing and displaying them through TRACE32 environment windows.
The library must be designed following few very specific rules: an initialization (PROTO_init) selects and prepares the channels that must then be read by the API function PROTO_readtrace and then passed through the processing functions (PROTO_Process), which can be deployed in up to 5 different levels Finally, the display functions (PROTO_display) take the data passed by the processing functions showing the data in TRACE32 as a listing. The user can also define several Export functions that allow the processed data to be saved in a file, with a customizable format.
As an example of this capability, we used a program that sends commands through the SPI bus of the MPC5554EVB to a voltage regulator, which turns the reference voltage V1, on and off and then observing the voltage changes through the analogue probe. A nice feature to note is that in this case the synchronization function of TRACE32 aligns the view of the SPI data to the analogue trace from the logic analyzer. Again, this shows how the PowerIntegrator provides the essential correlation between hardware behaviour and the software implementation, Another essential element is the extreme flexibility of the protocol analysis technology, which is completely customizable by the user.
Figure 13 In the digital acquisition we can see the raw SPI signals (I), aligned to the packet view (II), and the effects on hardware (III), where we see the voltage V02A waweform.
I
II
III
Protocol Analysis AN07101F – Advanced Debug with PowerIntegrator
15
Data Logger by Protocol Analysis We have seen how a typical method of using a logic analyzer like the PowerIntegrator is to track the performance of the software through the technique of Bus Trace. Providing the data needed for the reconstruction of fetch and read/write cycles, through the direct monitoring of the system bus. Unfortunately this method is not always applicable and in modern targets it’s often impossible to get access to the bus signals. As many processors now provide a real-time trace from the silicon core this is not always the optimum solution, for example the ETM (embedded trace macro-cell) modules provided on ARM cores or the Nexus3 trace provided by Freescale on the MPC55xx family of processors. Another method in common use is to instrument the code, with careful implementation this can provide much useful information. A typical method would be to call an appropriate function which provides information on the last cycle executed by the CPU (within TRACE32 this functionality is known as “logger”). Reading out data like this from most cores is intrusive and interferes with the cores real time performance. Thus the frequency with which you call the logger must be set appropriately for the individual application, as we have already explained earlier in this application note (see Data Logging ). If this technique is implemented so that the information is made available via a hardware interface, it is possible to use a custom protocol to pass the data to the PowerIntegrator, and then to use the protocol analysis technology to display it in TRACE32, making use of the additional functions of trace storage analysis, compared to the information provided by the disassembler itself. This demo program will use an hardware resource, specifically the SPI bus, to pass information on code execution and read/write cycles on data ranges. In a similar way to what was done in the previous program, we will construct a protocol library whose second processing level will transform raw SPI packets contained in Logger Data, storing the result in the API structure of the Trace 32 programming environment.
The protoDisCycle structure contains the information necessary to reconstruct a single system bus -cycle, if the Trace32 debugger finds valid information; the trace analysis functions such as listing, charts and structure are available as if it had actually come from a dedicated trace unit.
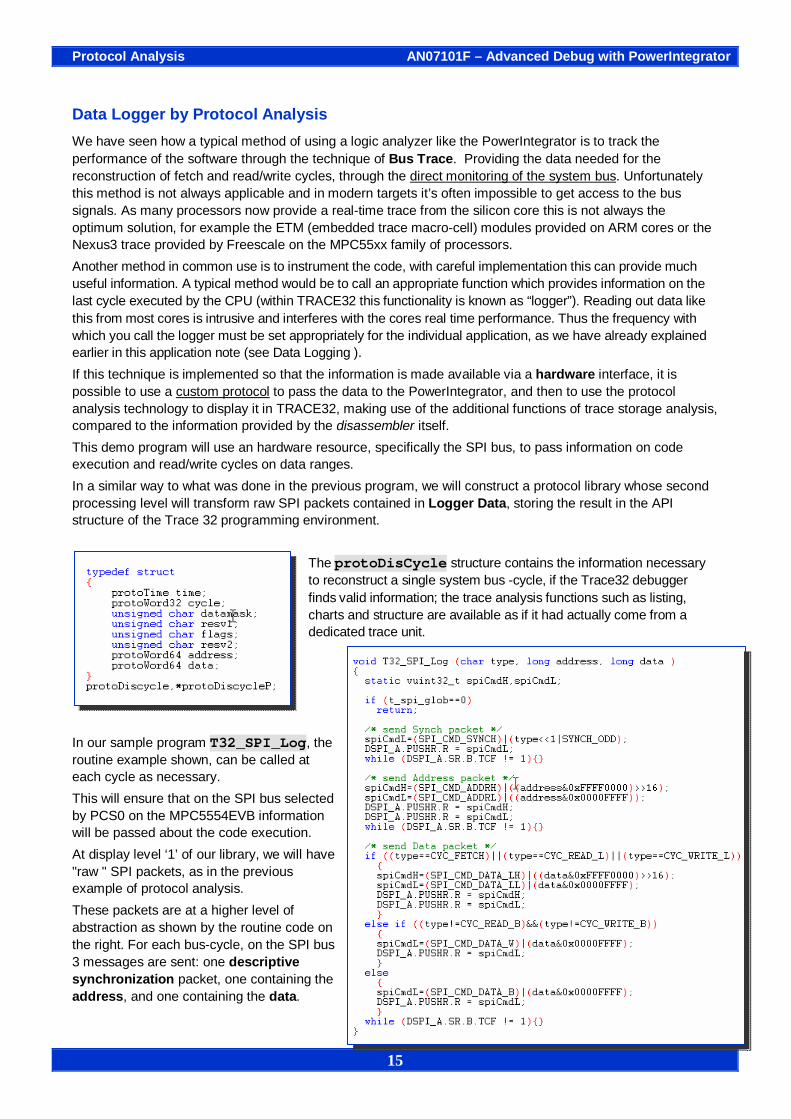
In our sample program T32_SPI_Log, the routine example shown, can be called at each cycle as necessary. This will ensure that on the SPI bus selected by PCS0 on the MPC5554EVB information will be passed about the code execution. At display level ‘1’ of our library, we will have "raw " SPI packets, as in the previous example of protocol analysis. These packets are at a higher level of abstraction as shown by the routine code on the right. For each bus-cycle, on the SPI bus 3 messages are sent: one descriptive synchronization packet, one containing the address, and one containing the data.

Protocol Analysis AN07101F – Advanced Debug with PowerIntegrator
16
The second level of the protocol library puts the data inside the protoDiscycle structure, which allows display of the bus-cycles both in the protocol analyzer window and in the standard trace display windows such as listing and charts (figure 14 ). It is worth comparing what has been done in this example of data logging using Protocol Analysis as compared to the previous data from the Bus trace:
• It’s clear that this solution uses far less resources than the hardware bus trace, in fact only 3 dedicated pins are utilized, compared to using the bus trace which needed the system bus to be totally available.
• The intrusion level in the code is higher, because the write operation in the sampled area is no longer "atomic" (i.e. a single or a few bus-cycles), also it is using resources on the chip’s peripheral and heavier glue code ( the SPI interface driver in this example). There is always the possibility of optimizing this element possibly by reducing the load on the processor, perhaps using more pins might be a good trade off.
• The trace depth is significantly lower, since using a software protocol involves an overhead depending upon the complexity of the protocol (more samples are needed for a single bus-cycle).
• Performances are comparable if, as in this example, you are able to use a fast enough protocol
The two methods have similar fields of application, and the choice is usually defined by the physical limitations of the project hardware, such as reduced access that makes it impossible to sample the entire bus, the inability to use any spare pin(s) of the microprocessor, the need to retrieve the information with the least possible intrusion, etc…
Figure 14 In addition to the raw SPI signals (I), aligned to the SPI packets view (II), we can see now the information as a standard Trace32 trace list (III) and symbolic chart (IV).
I
II
III
IV

Conclusions AN07101F – Advanced Debug with PowerIntegrator
17
Conclusions In conclusion, the examples show how using PowerIntegrator can make a number of features available that are very useful for debugging all kind of applications. Potentially providing direct observation of phenomena related to either hardware or to code execution the PowerIntegrator can be programmed and adapted to work with a wide spectrum of events to be monitored, or used to analyze some specific protocol. All this is possible due to the concept of this logic analyzer and because it is integrated into the TRACE32 debug environment, or in other words because it has been designed to add into and upgrade any existing Lauterbach setup, from the universal PowerDebug USB to the high performance PowerTrace II latest generation system. PowerIntegrator is an indispensable tool which can find many uses in any development lab.
PowerIntegrator – Technical Features
• Complex Trigger System • Trigger I/O Synch with debugger • Protocol Analyser:
CAN, USB, I2C, SPI, JTAG, Serial PCI, SDRAM + User Protocol Kit
• Sampling Freq. fixed 250MHz, fixed 500MHz, or by external clock
• Trace Buffer from 512K x 204 Channels or 1024K x 102 Channels
• Disassembler for Bus trace • 3 Types of Digital Probes: Mictor, Samtec,
Standard • Analogue Probe: 4 Voltage, 3 Current Input • Probe for SDRAM, PCI, DDR, ESICON