advanced ecg interpretation - boston college · advanced ecg interpretation rebecca sevigny bsn,...
TRANSCRIPT
Advanced ECG Interpretation
Rebecca Sevigny BSN, RN, CCRN

DISCLOSURES
None of the planners or presenters of this session have disclosed any conflict or
commercial interest

Objectives • Identify ECG changes related to hypertrophy, bundle branch
blocks, and MI’s
• Review approach to interpretation of wide complex tachycardia
• Describe other miscellaneous causes of ECG abnormalities: pericarditis, electrolyte abnormality, medication effects, and hypothermia
• Practice using a systematic approach to interpreting 12 lead ECGs

• Positive in leads I, II, V4 & V6
• Negative in aVR • Morphology changes depending on
pacemaker • .08-0.11
P Waves

Atrial Enlargement

PR Interval

PR Interval

Ventricular Hypertrophy

Ventricular Hypertrophy
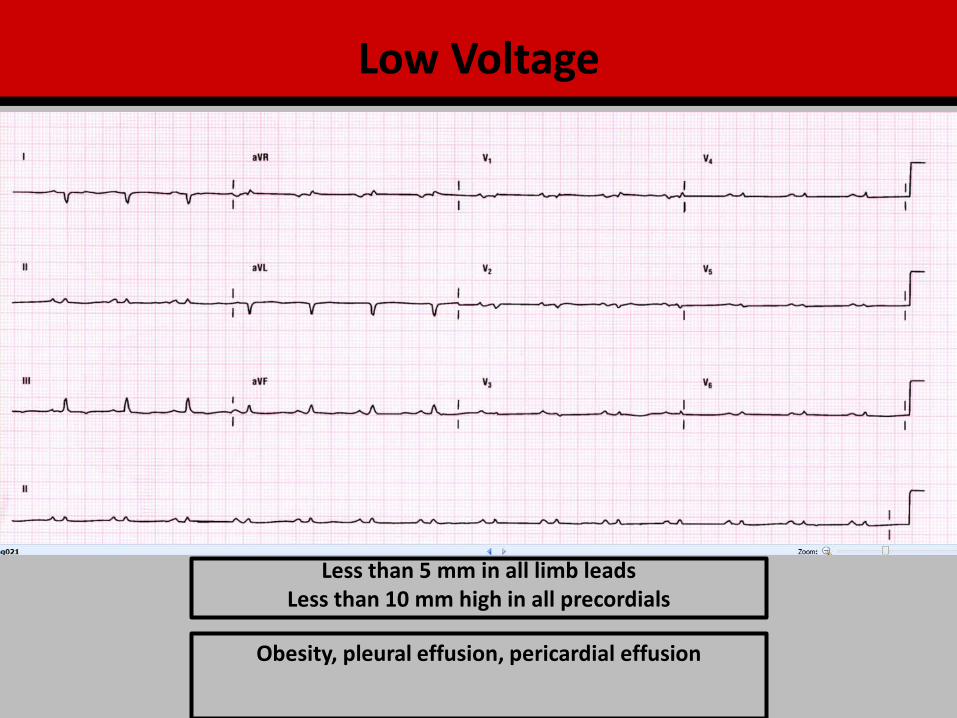
Less than 5 mm in all limb leads Less than 10 mm high in all precordials
Obesity, pleural effusion, pericardial effusion
Low Voltage
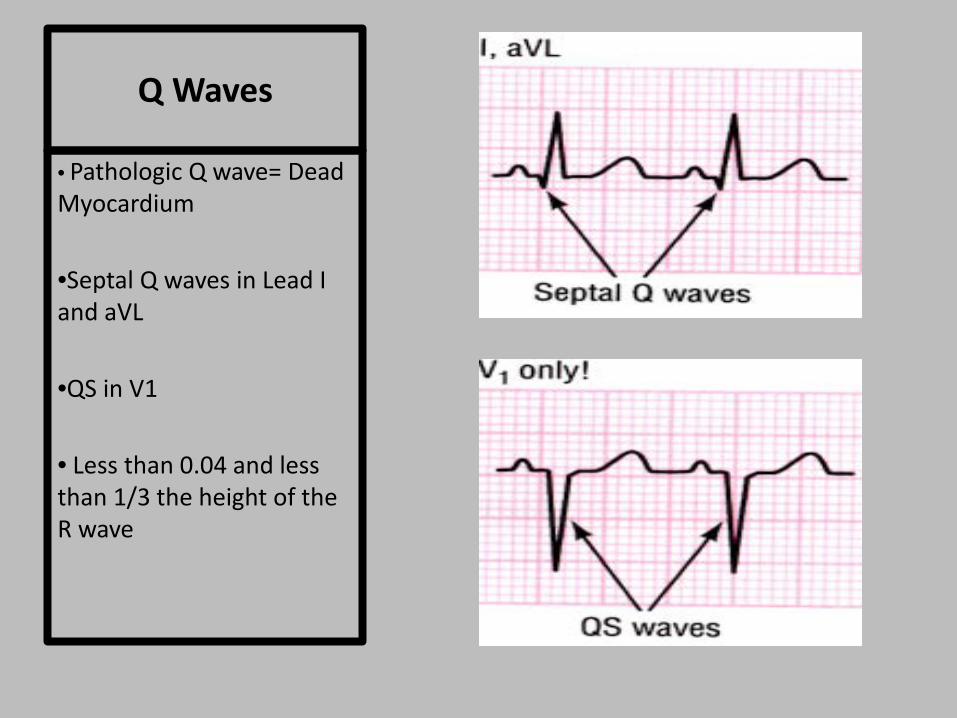
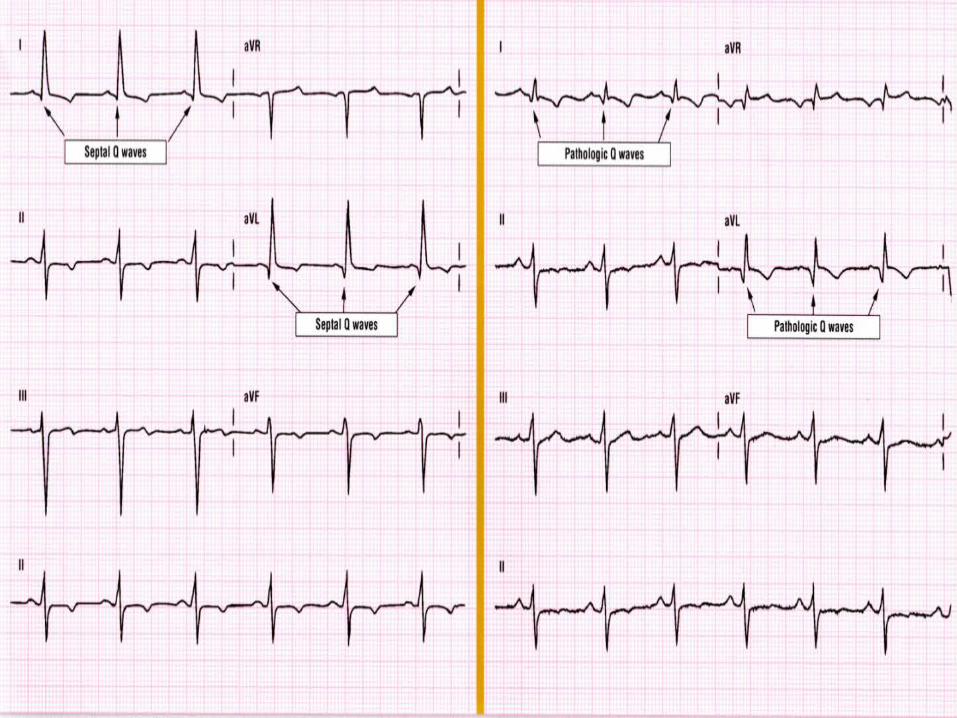
Q Waves
• Pathologic Q wave= Dead Myocardium
•Septal Q waves in Lead I and aVL
•QS in V1
• Less than 0.04 and less than 1/3 the height of the R wave


• Isolate the smallest and most isoelectric limb lead
• Identify the lead perpendicular to this lead
• Is the QRS positive or negative in this lead?
• Is the isoelectric lead more positive or negative?
QRS AXIS
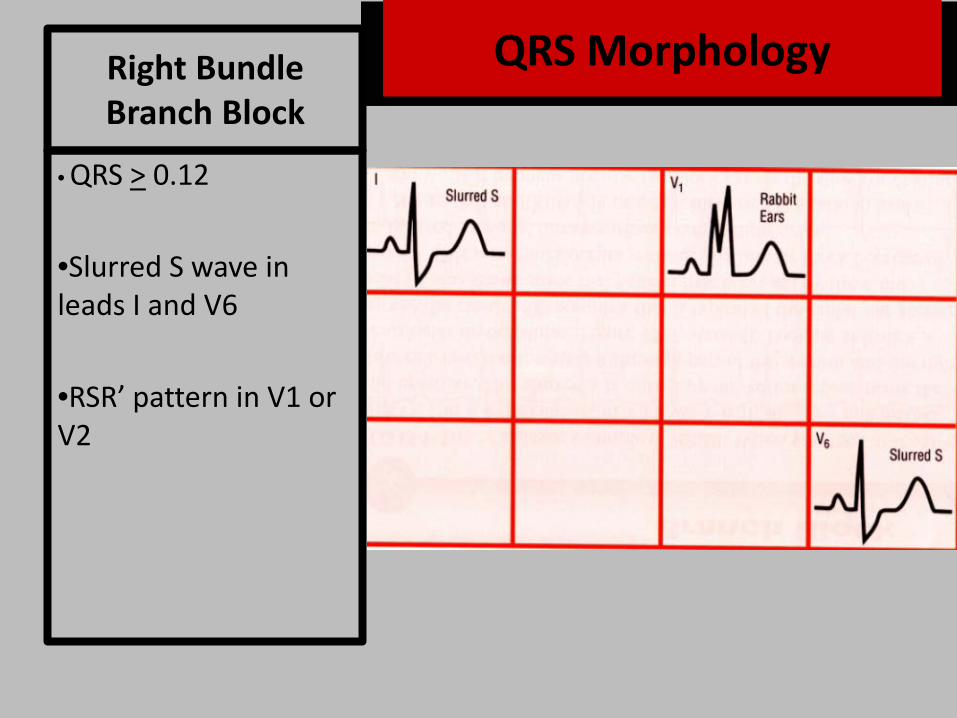
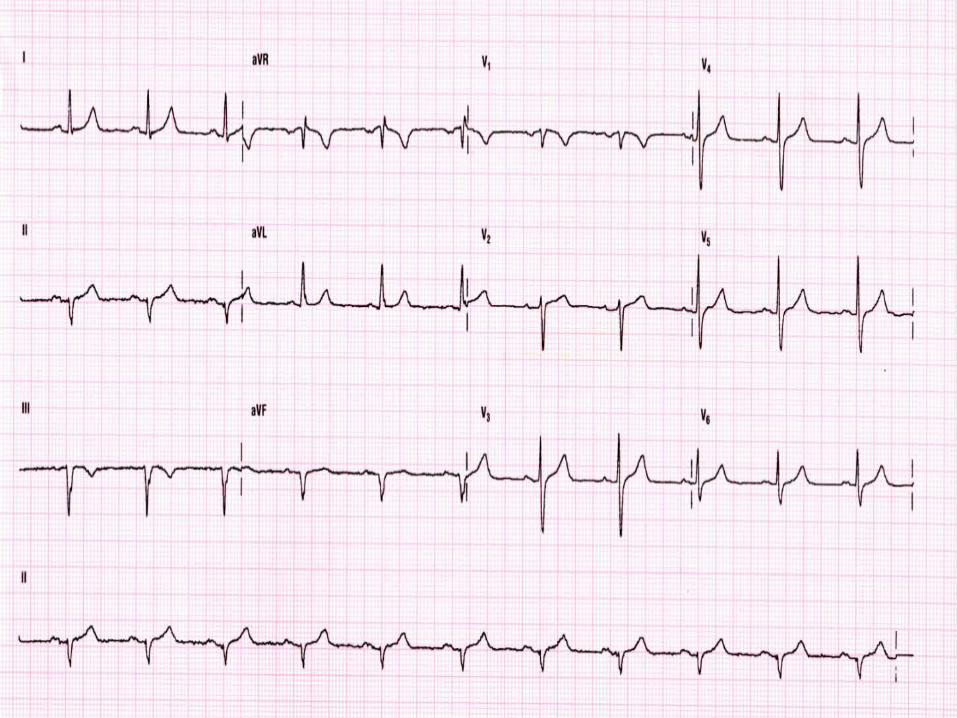
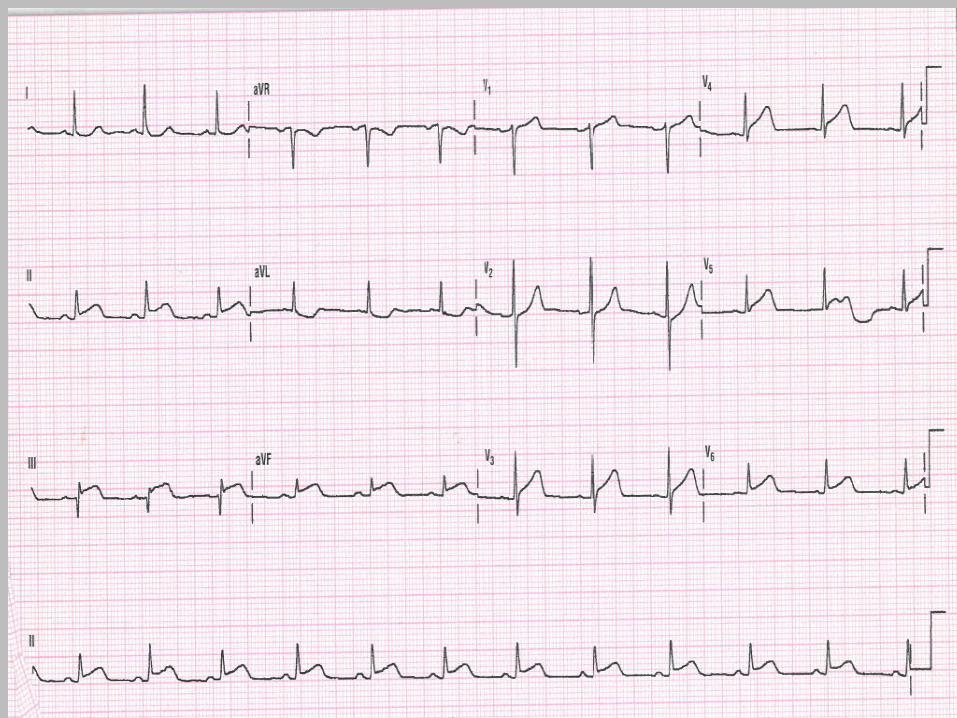
Right Bundle Branch Block
• QRS > 0.12
•Slurred S wave in leads I and V6
•RSR’ pattern in V1 or V2
QRS Morphology

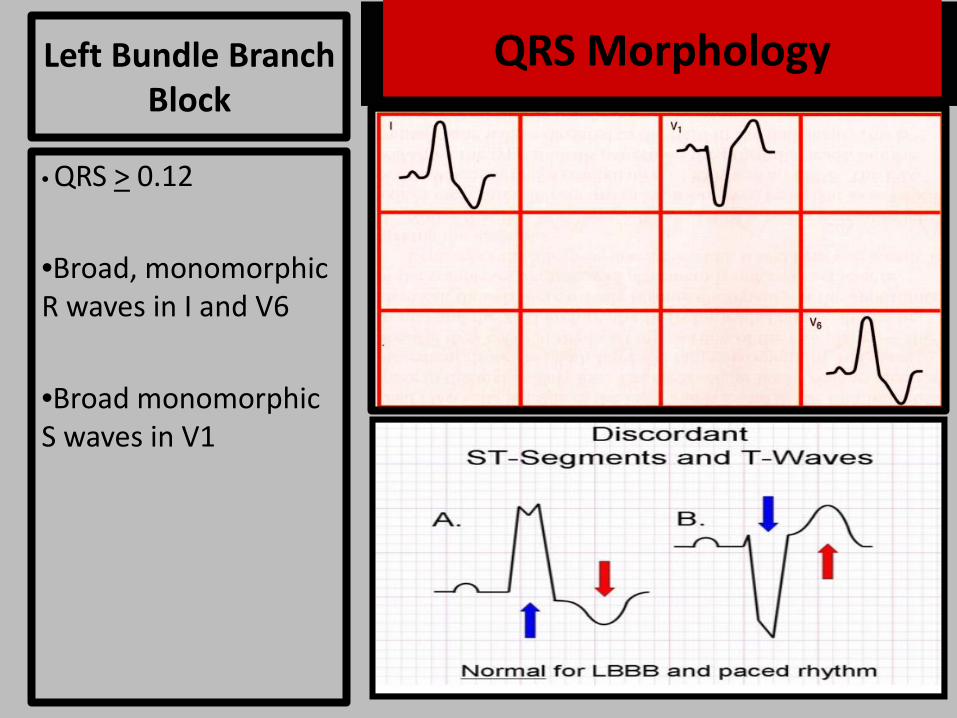
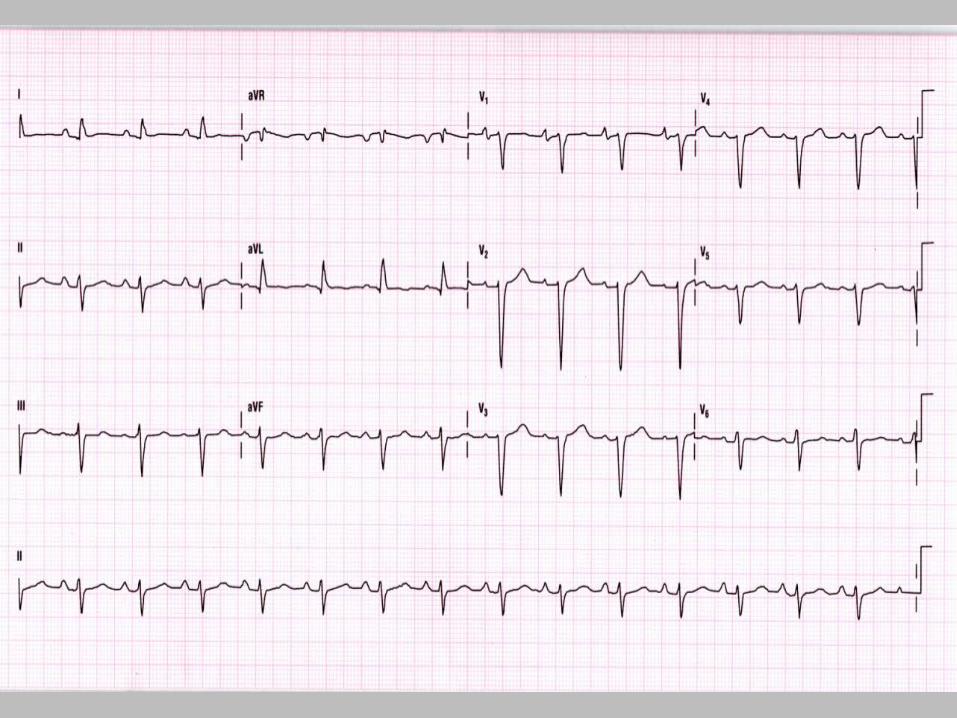
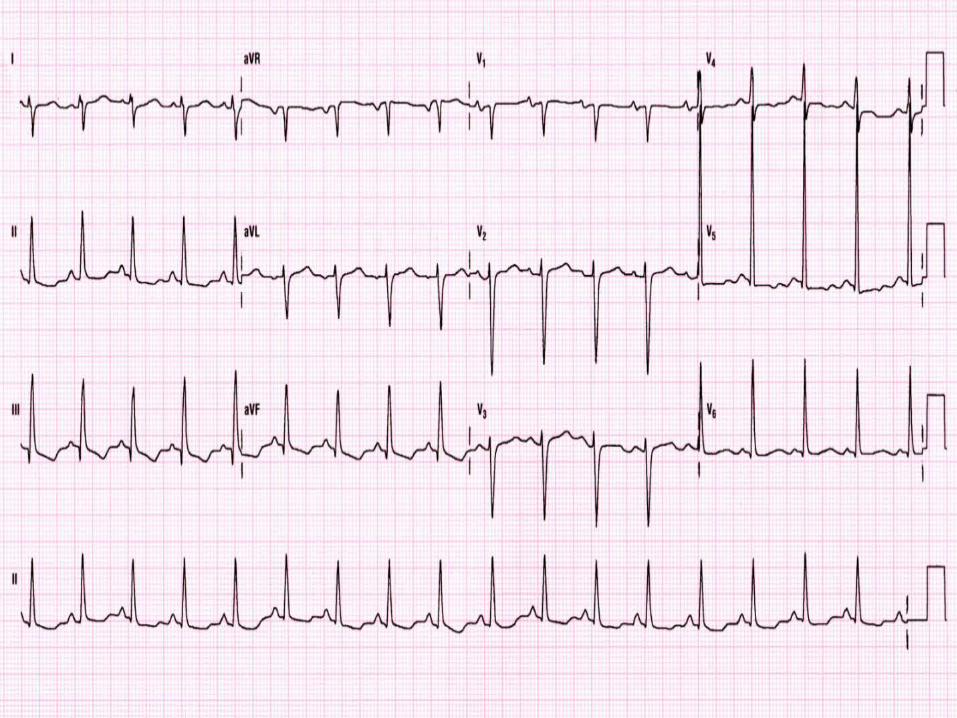
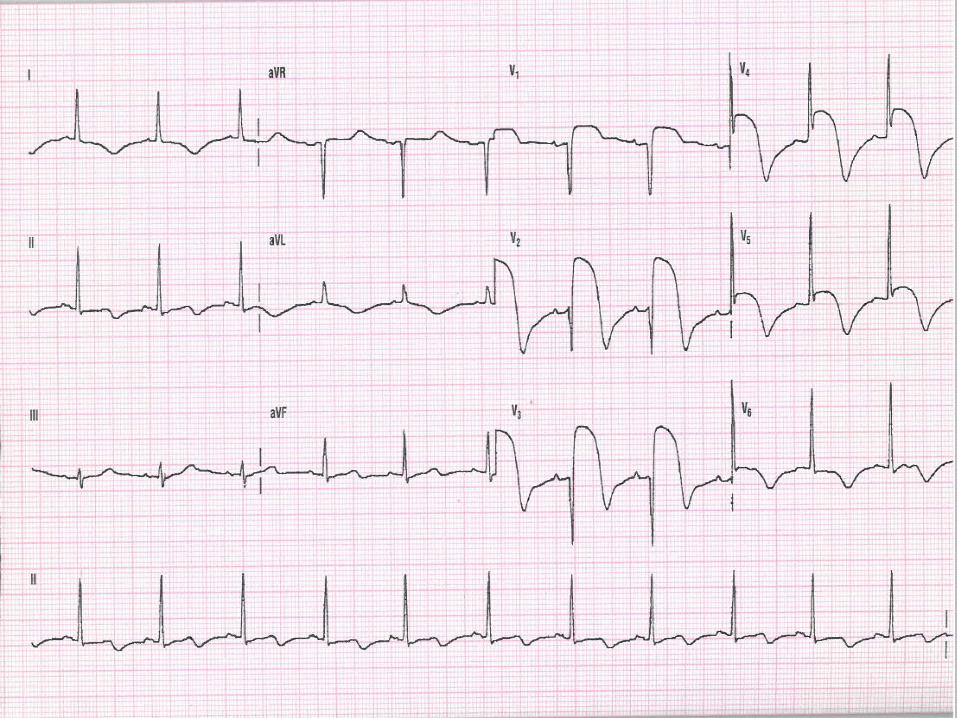
Left Bundle Branch Block
• QRS > 0.12
•Broad, monomorphic R waves in I and V6
•Broad monomorphic S waves in V1
QRS Morphology


Concordant ST elevation > 1mm in leads with a positive QRS complex
(score 5)
Concordant ST depression > 1 mm in V1-V3 (score 3)
Excessively discordant ST elevation > 5 mm in leads with a negative QRS complex (score 2).
A total score of ≥ 3 is reported to have a specificity
of 90% for diagnosing myocardial infarction.
Sgarbossa’s Criteria
Sgarbosa’s Criteria

Intraventricular Conduction Delay
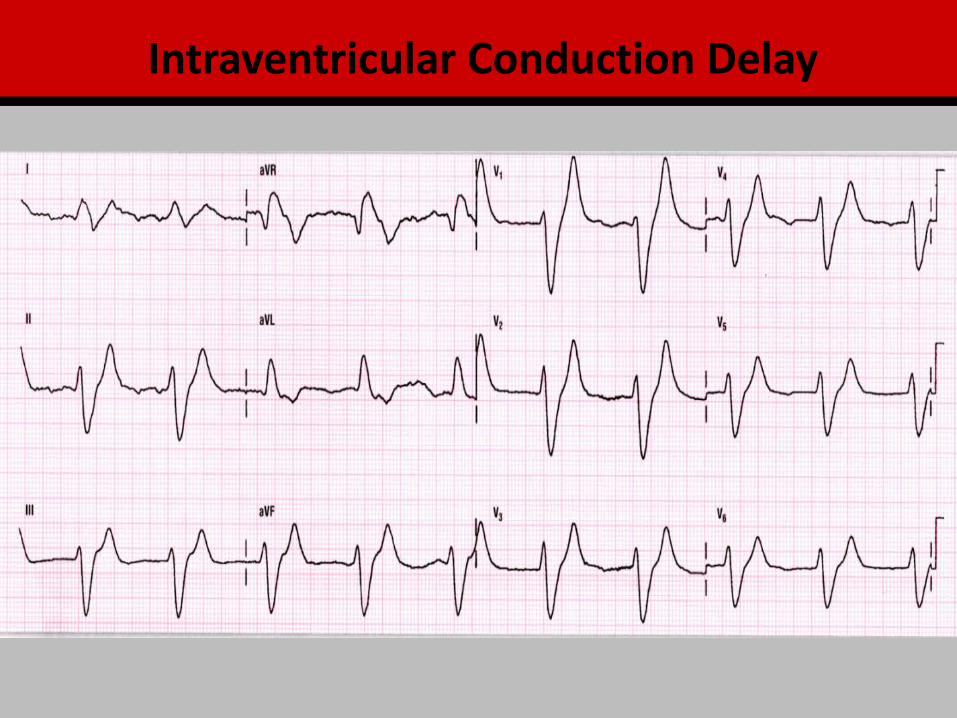
Intraventricular Conduction Delay

QRS
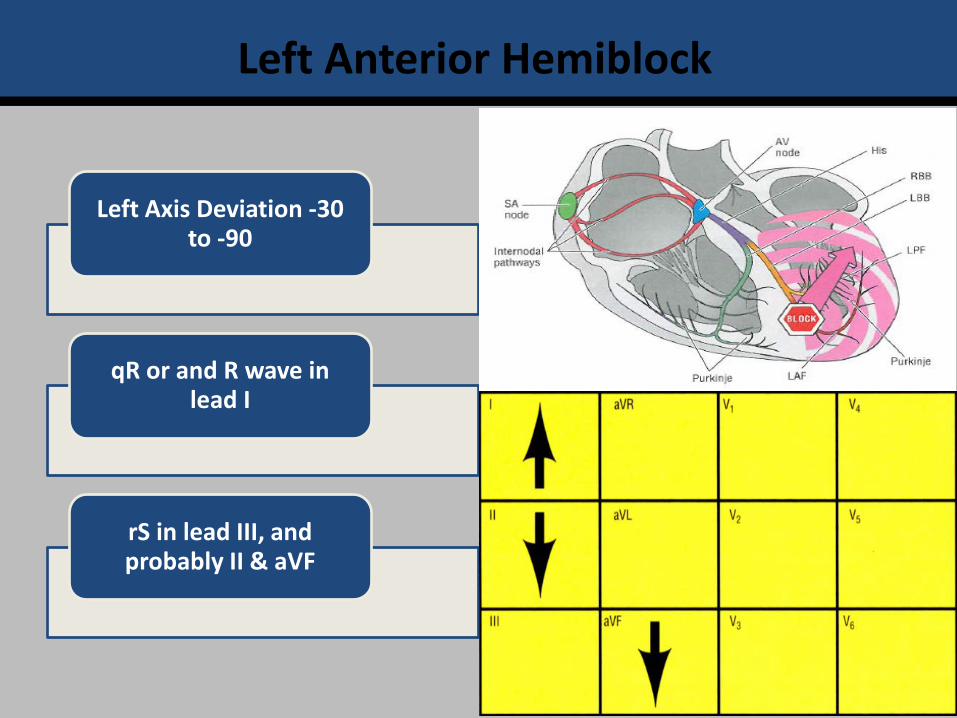
Left Anterior Hemiblock
Left Axis Deviation -30 to -90
qR or and R wave in lead I
rS in lead III, and probably II & aVF

Left Posterior Hemiblock
Right Axis Deviation 90-180
S wave in lead I and q in III
Exclusion of RAE and/or RVH
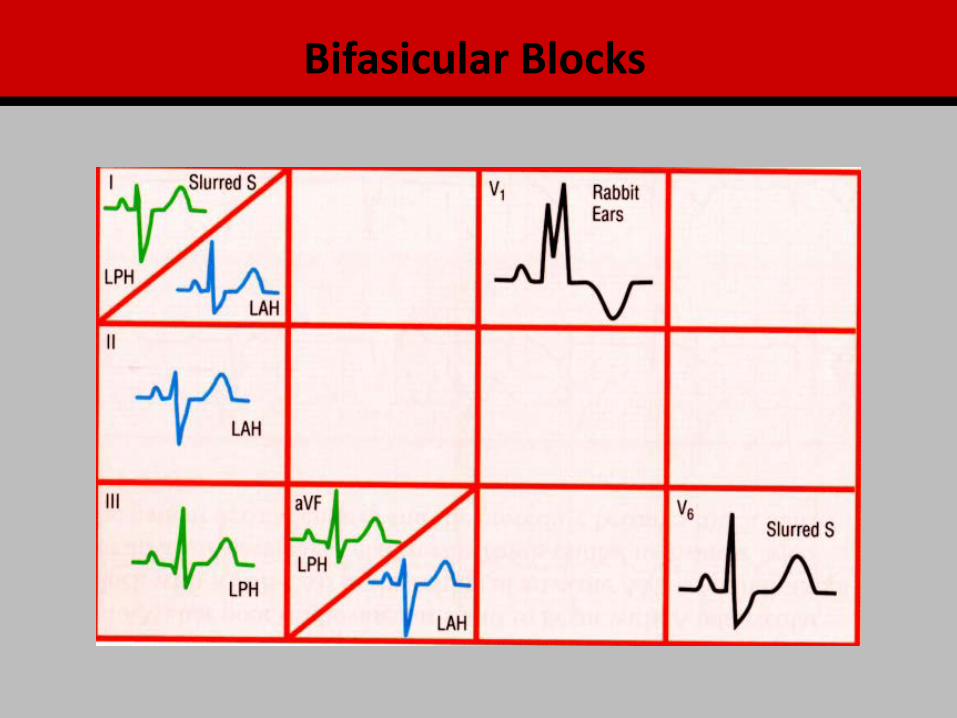
Bifasicular Blocks

Bifasicular Blocks

Bifasicular Blocks
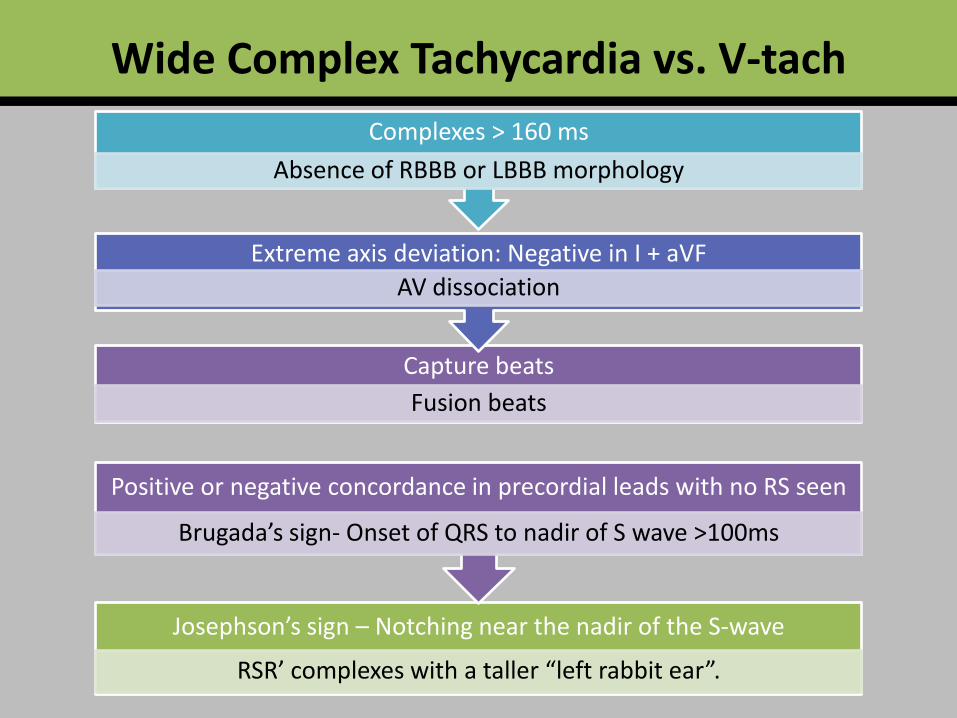
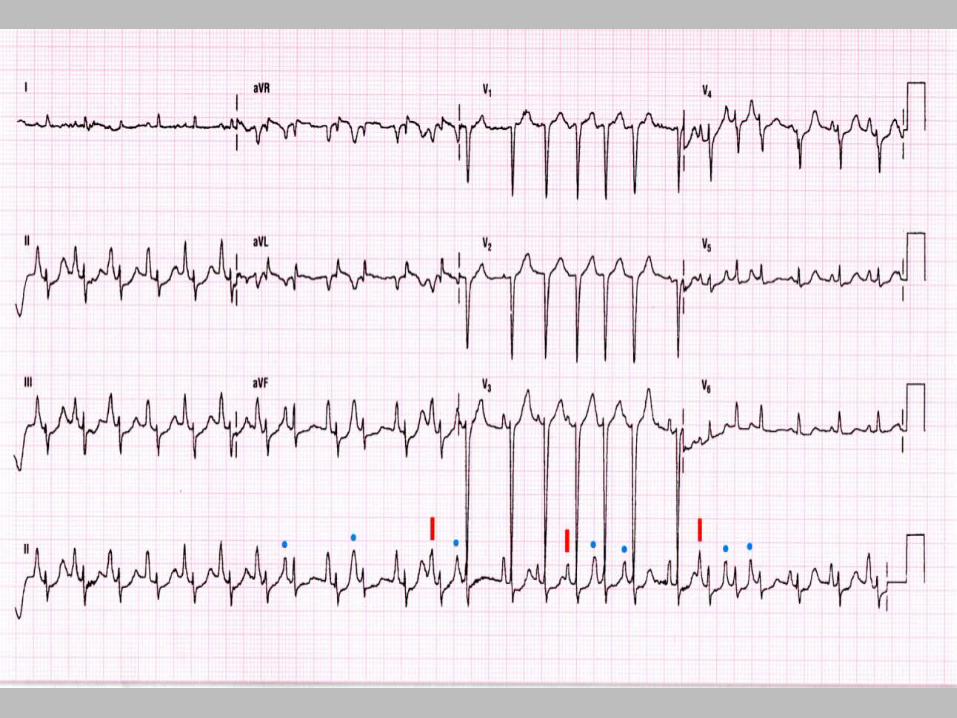
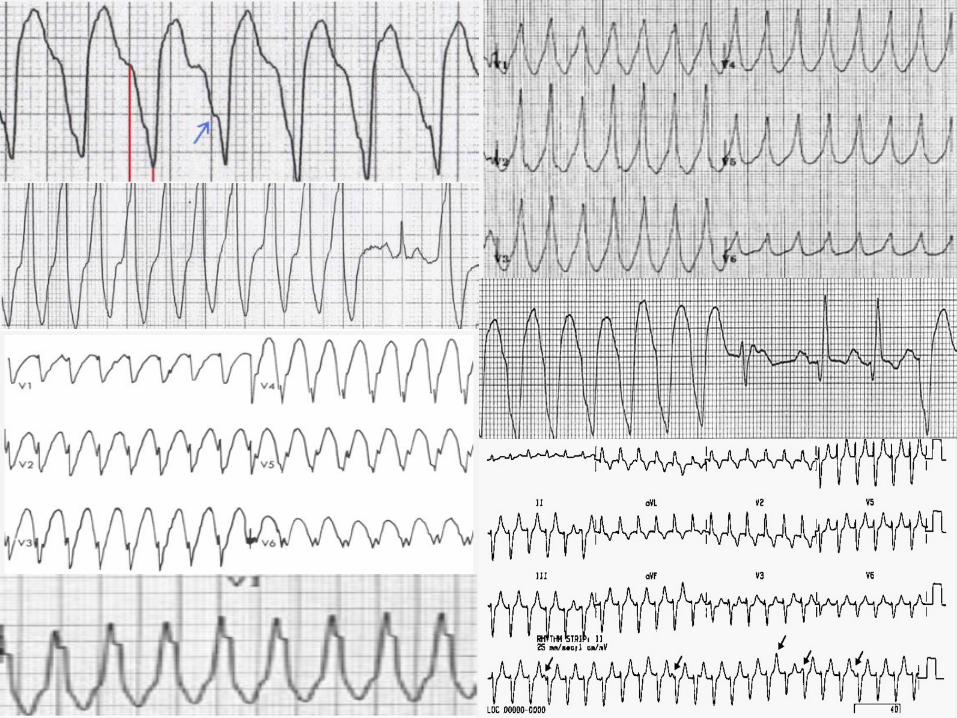
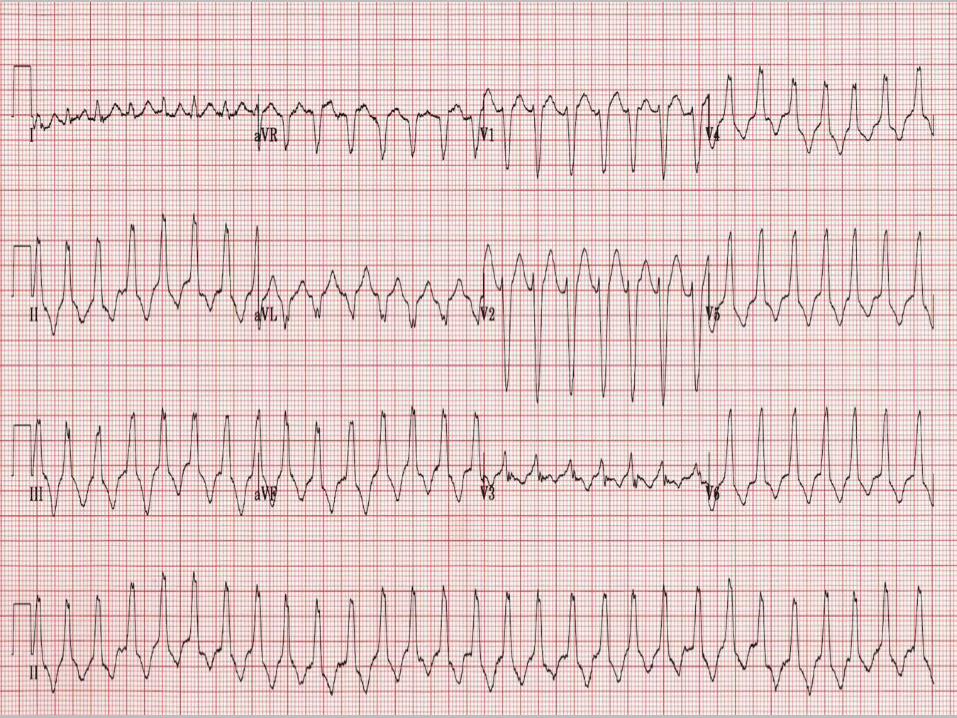
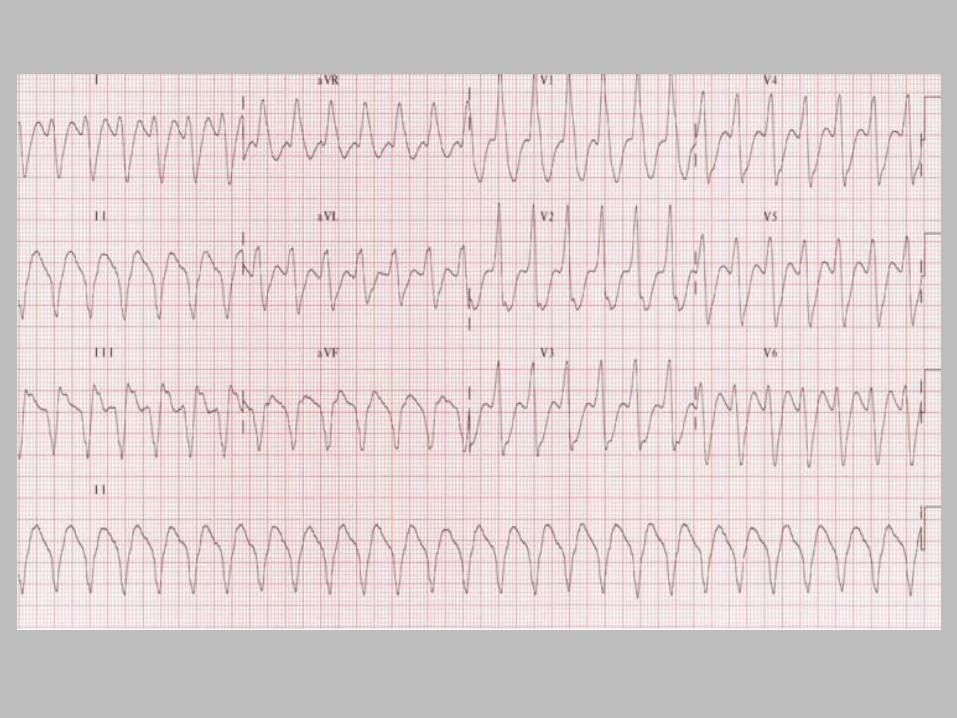
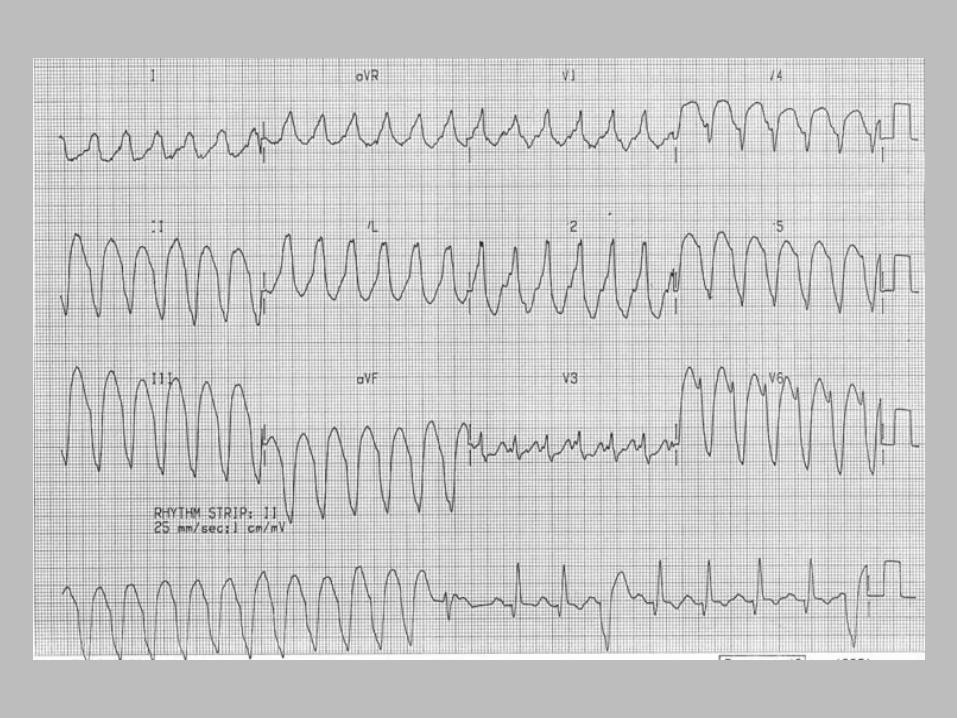
Wide Complex Tachycardia vs. V-tach
Capture beats Fusion beats
Extreme axis deviation: Negative in I + aVF AV dissociation
Complexes > 160 ms Absence of RBBB or LBBB morphology
Josephson’s sign – Notching near the nadir of the S-wave
RSR’ complexes with a taller “left rabbit ear”.
Positive or negative concordance in precordial leads with no RS seen
Brugada’s sign- Onset of QRS to nadir of S wave >100ms

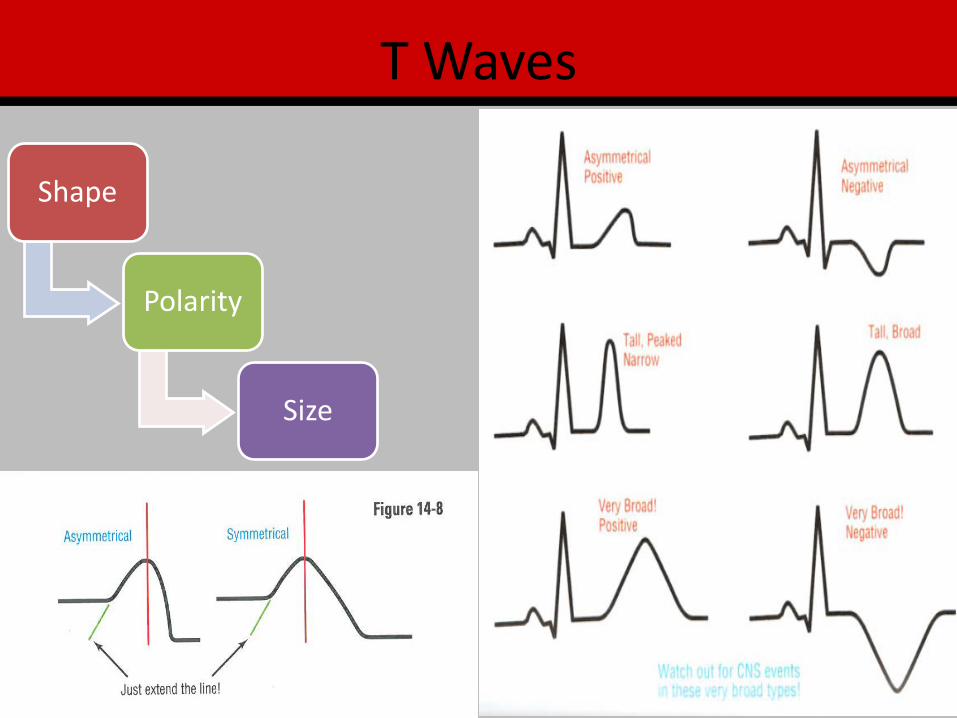
T Waves
Shape
Polarity
Size

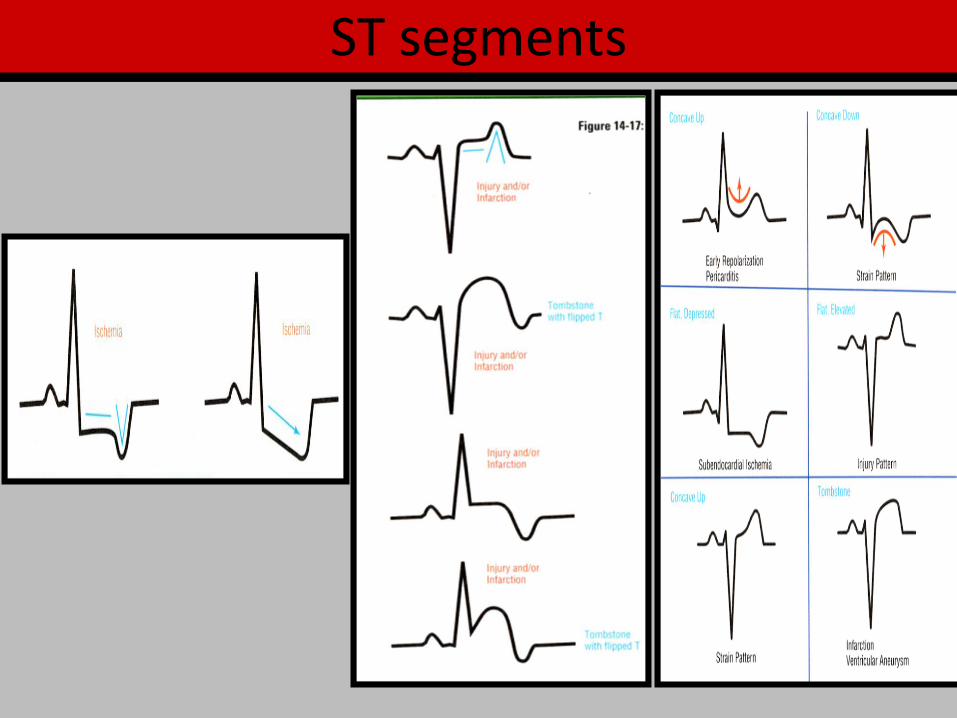
ST segments

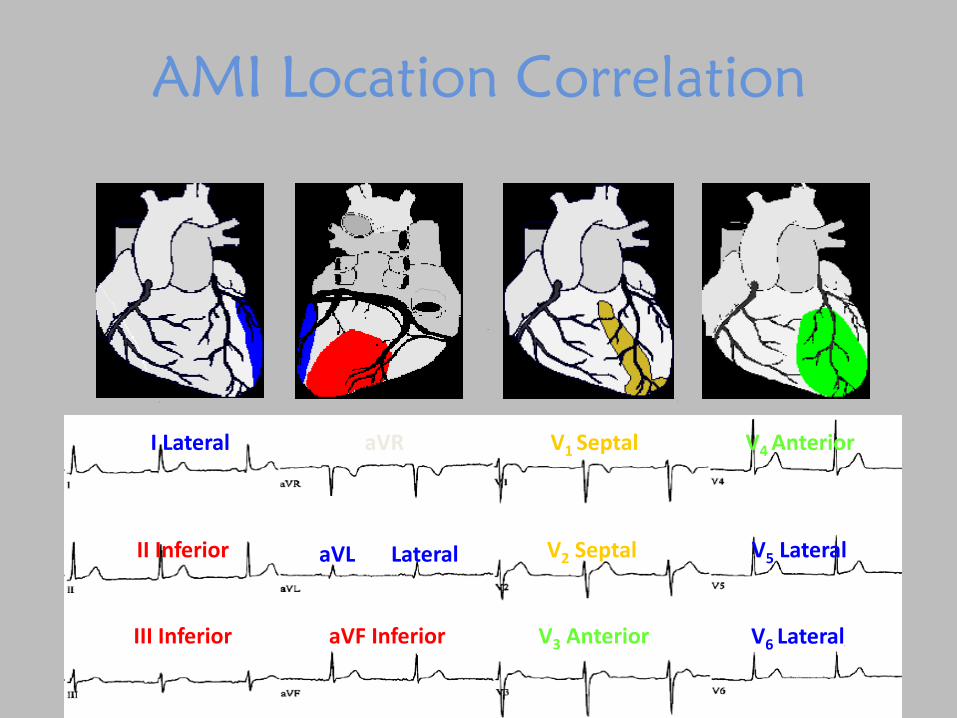
AMI Location Correlation
aVF Inferior III Inferior V3 Anterior V6 Lateral
aVL Lateral II Inferior V2 Septal V5 Lateral
aVR I Lateral V1 Septal V4 Anterior

Reciprocal
• Mirror image when 2 electrodes viewing the MI from opposite angles
II, III, aVF I, aVL
V1, V2 V7, V8, V9


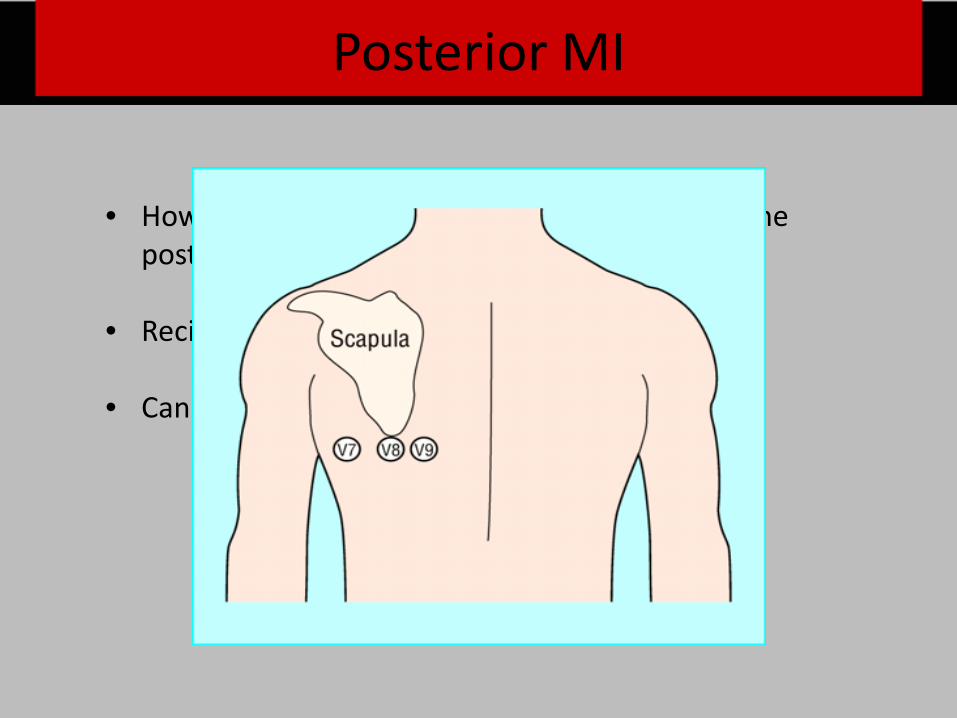
• How do we determine what is happening with the posterior wall of the heart?
• Reciprocal changes will occur in what leads?
• Can perform a posterior ECG with leas V7 to V10
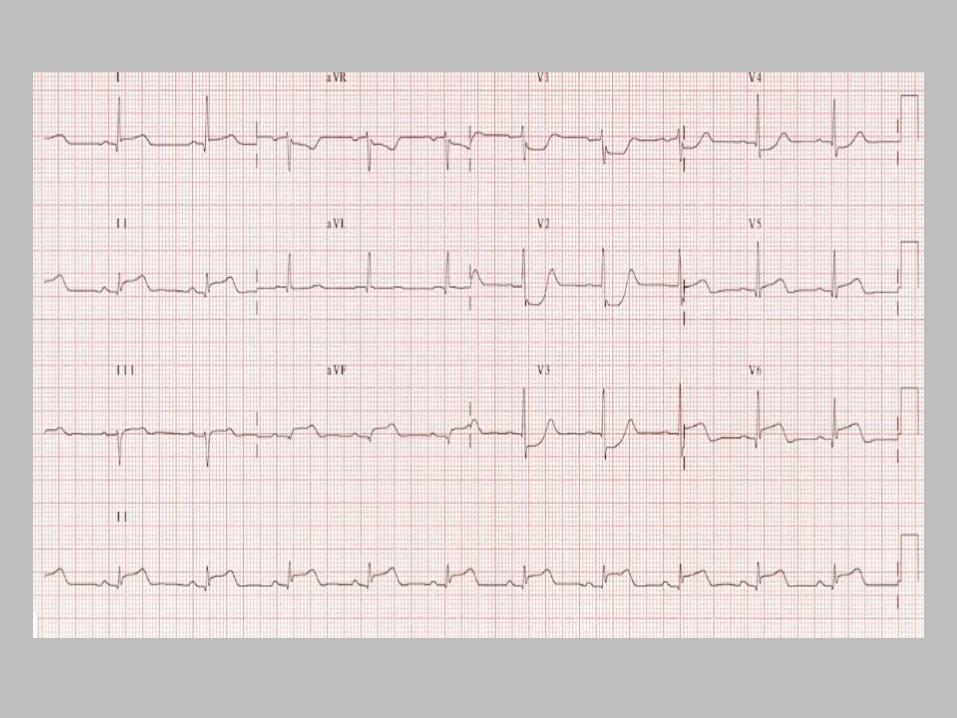
Posterior MI
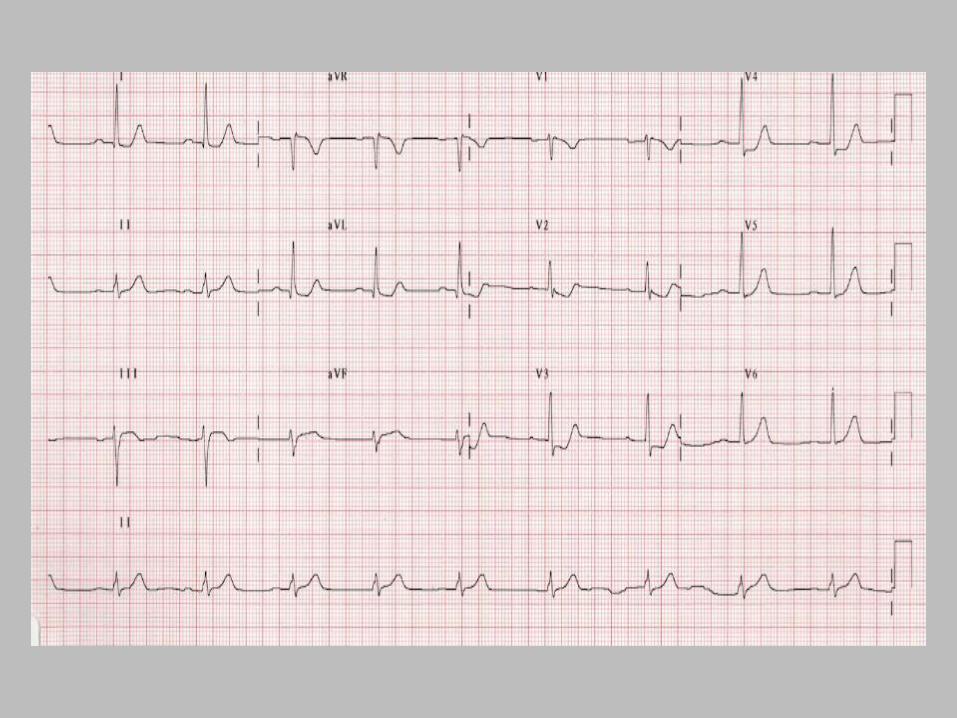
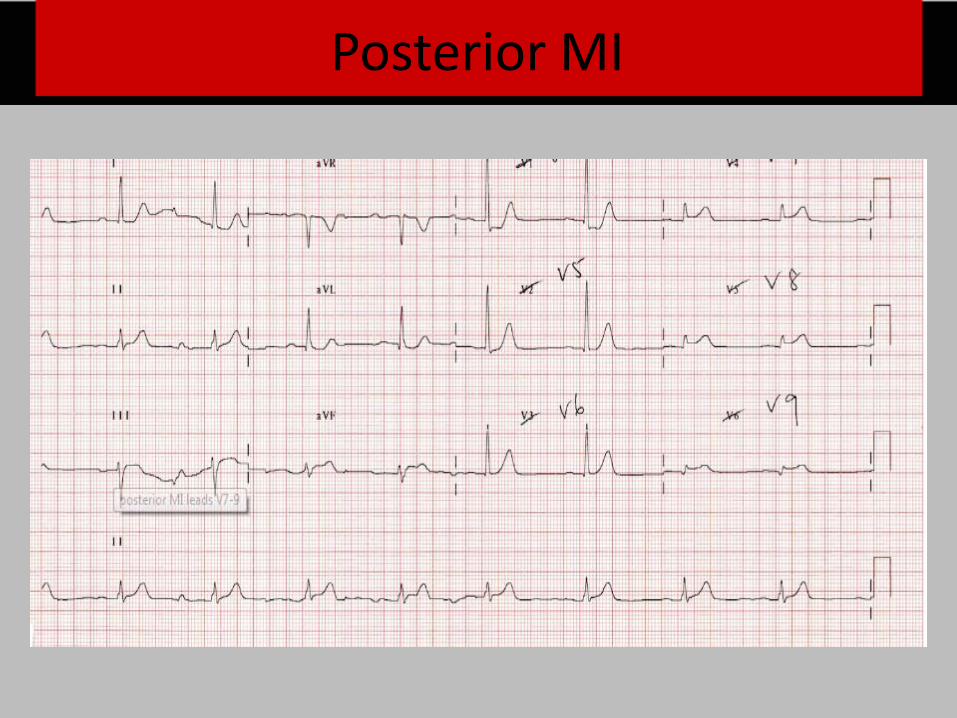
Posterior MI
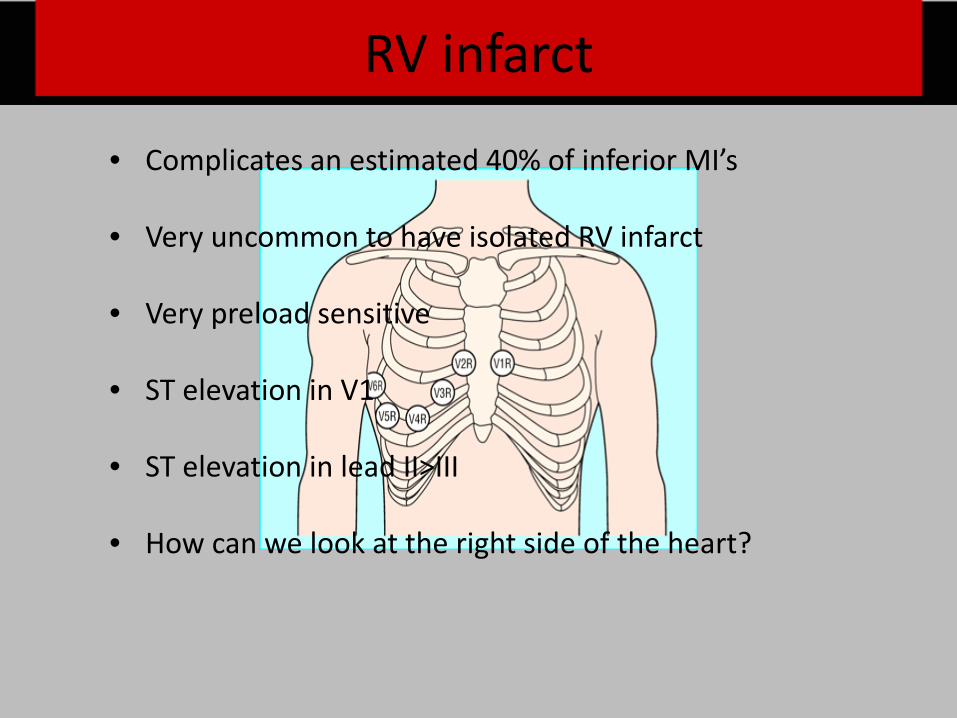
RV infarct
• Complicates an estimated 40% of inferior MI’s
• Very uncommon to have isolated RV infarct
• Very preload sensitive
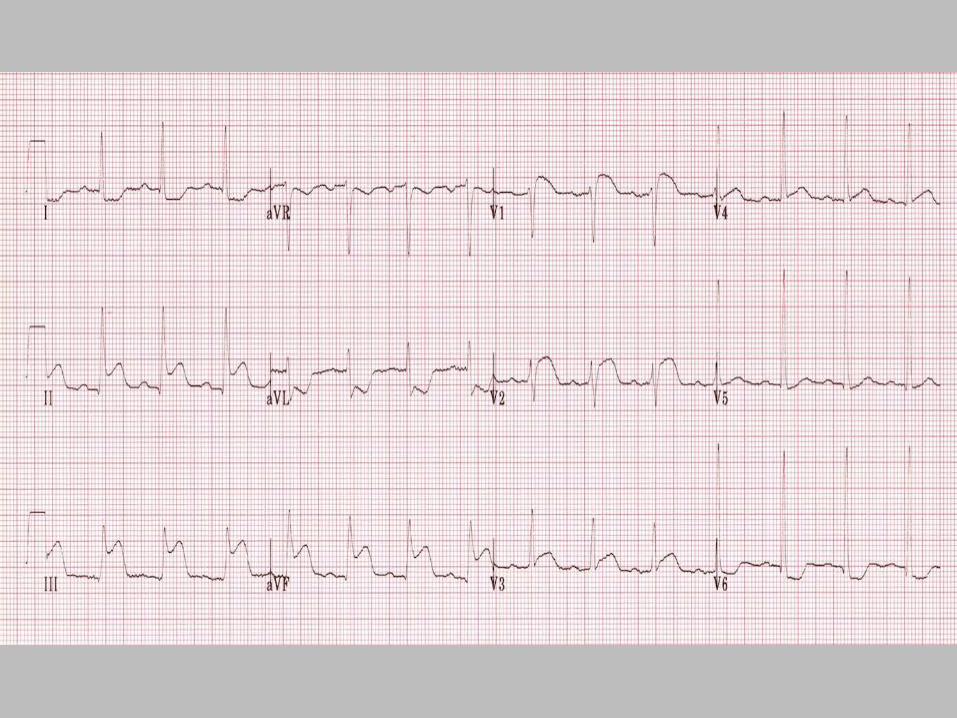
• ST elevation in V1
• ST elevation in lead II>III
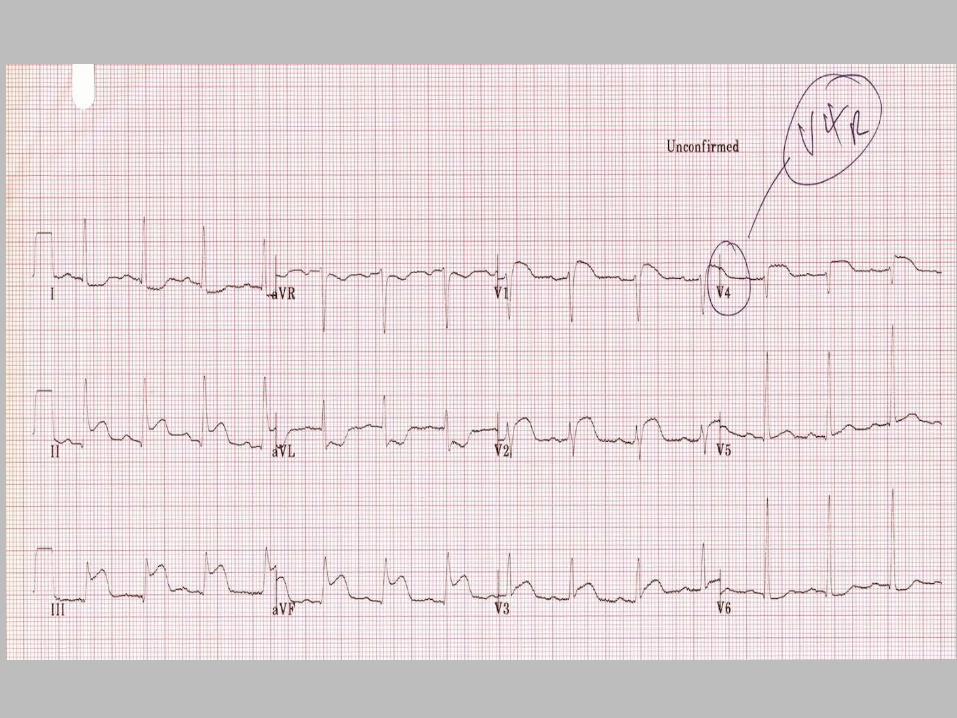
• How can we look at the right side of the heart?
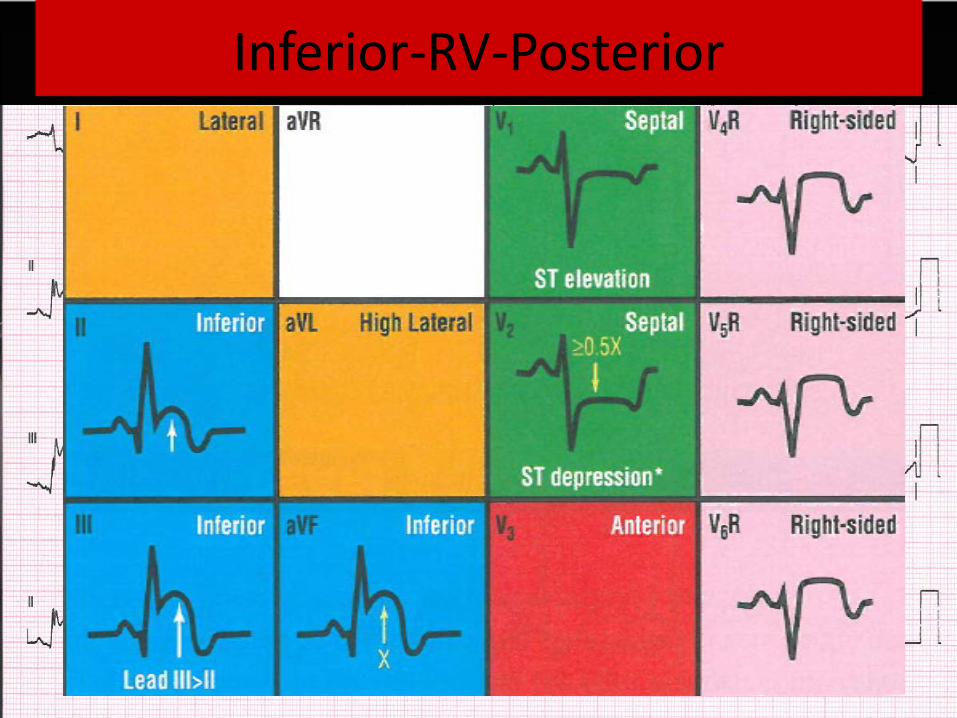
Inferior-RV-Posterior

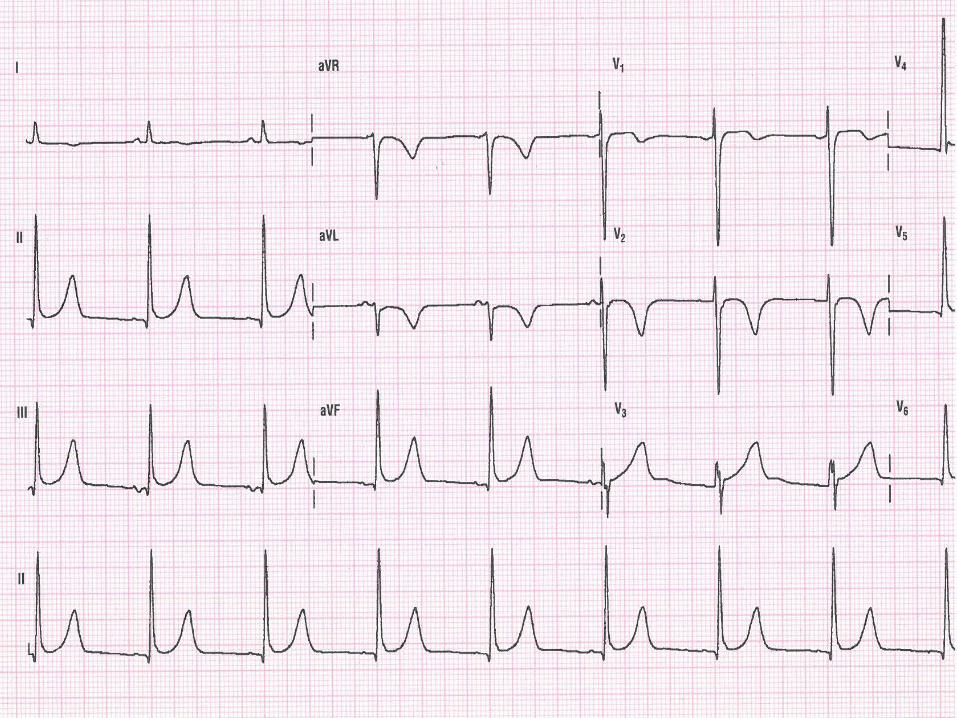
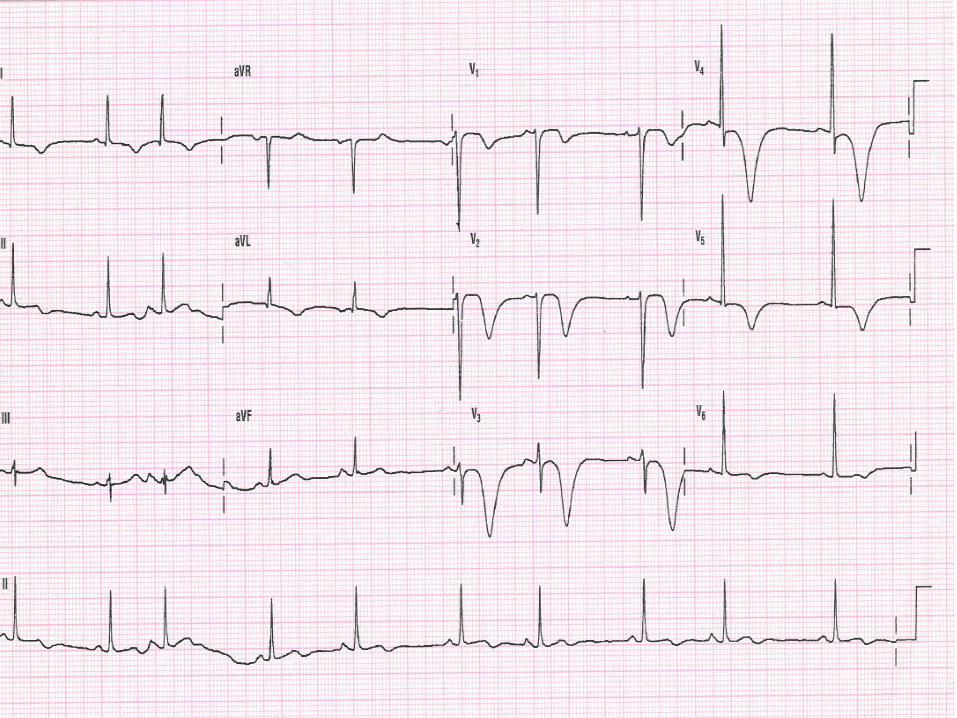
RVH with Strain
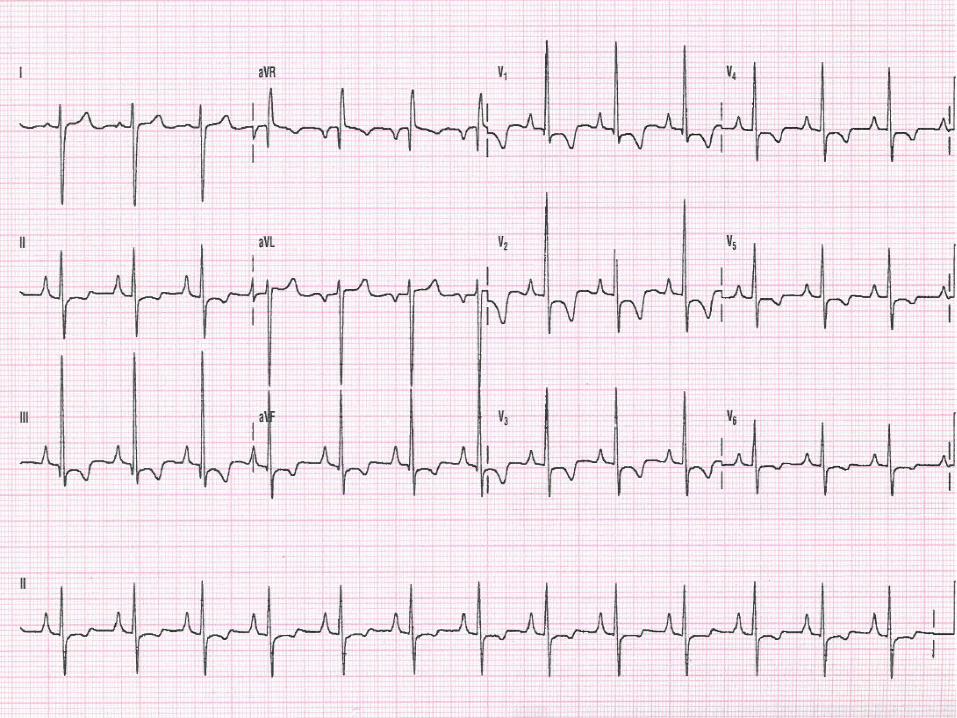

LVH with Strain

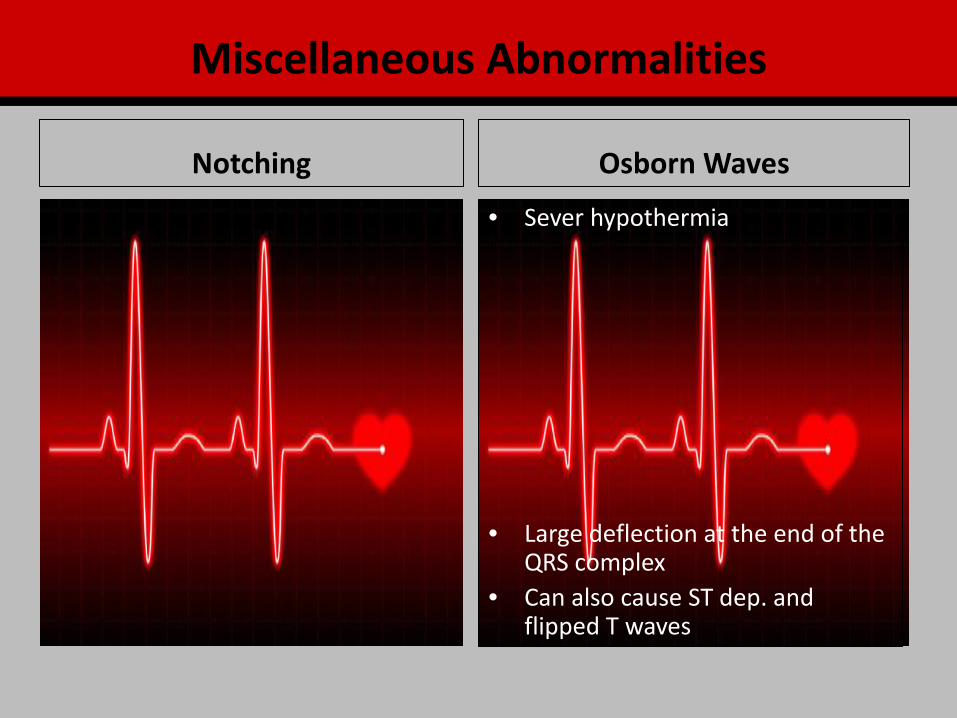
Osborn Waves Notching
• Sever hypothermia
• Large deflection at the end of the QRS complex
• Can also cause ST dep. and flipped T waves
Miscellaneous Abnormalities
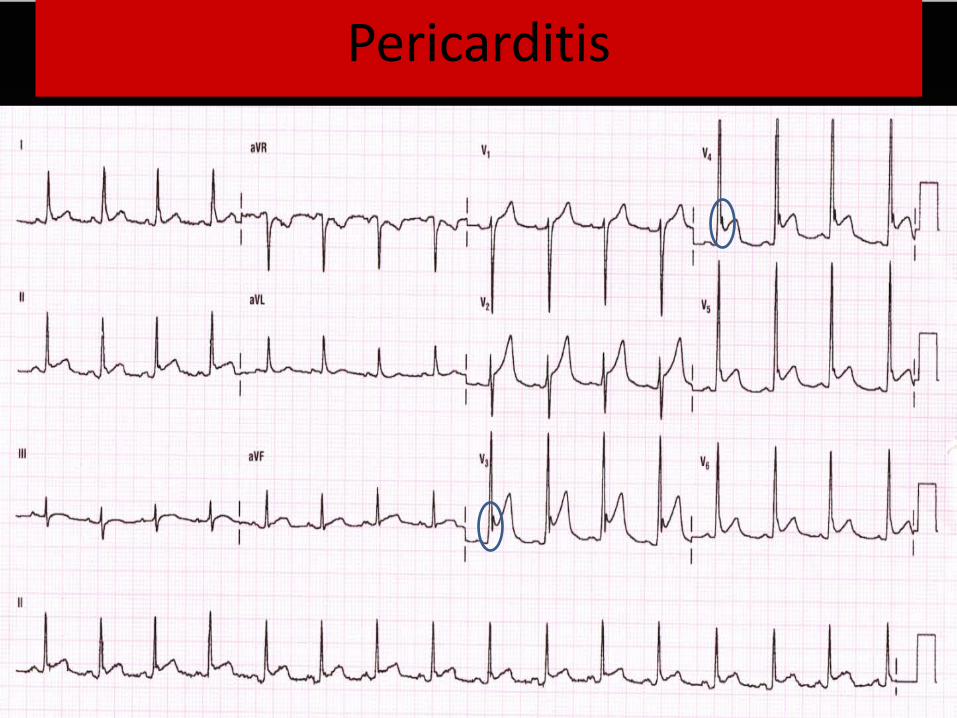
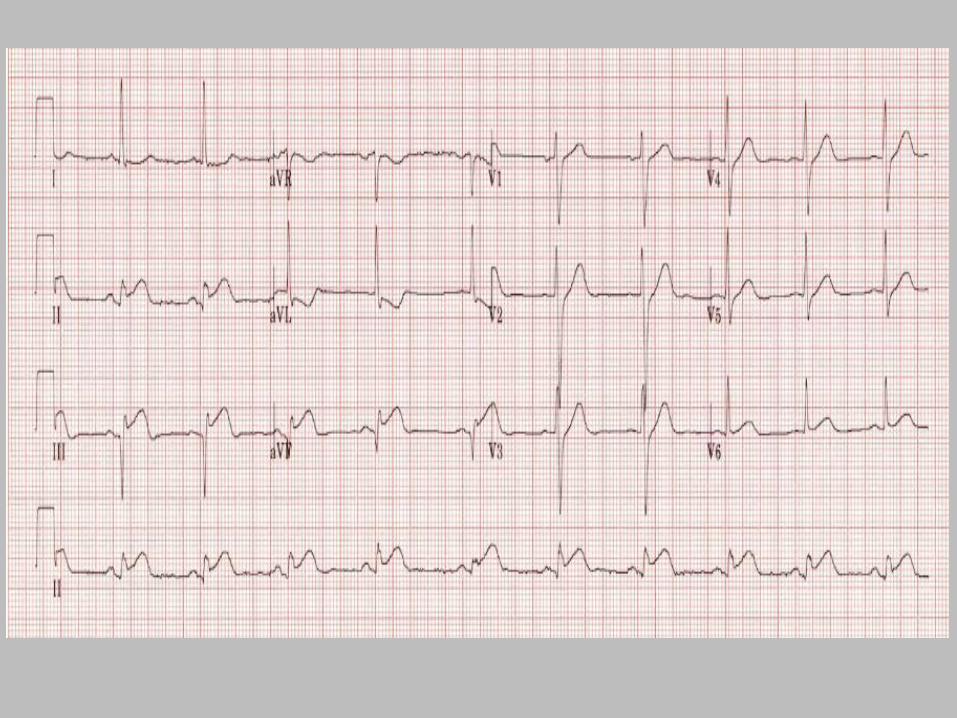
Pericarditis
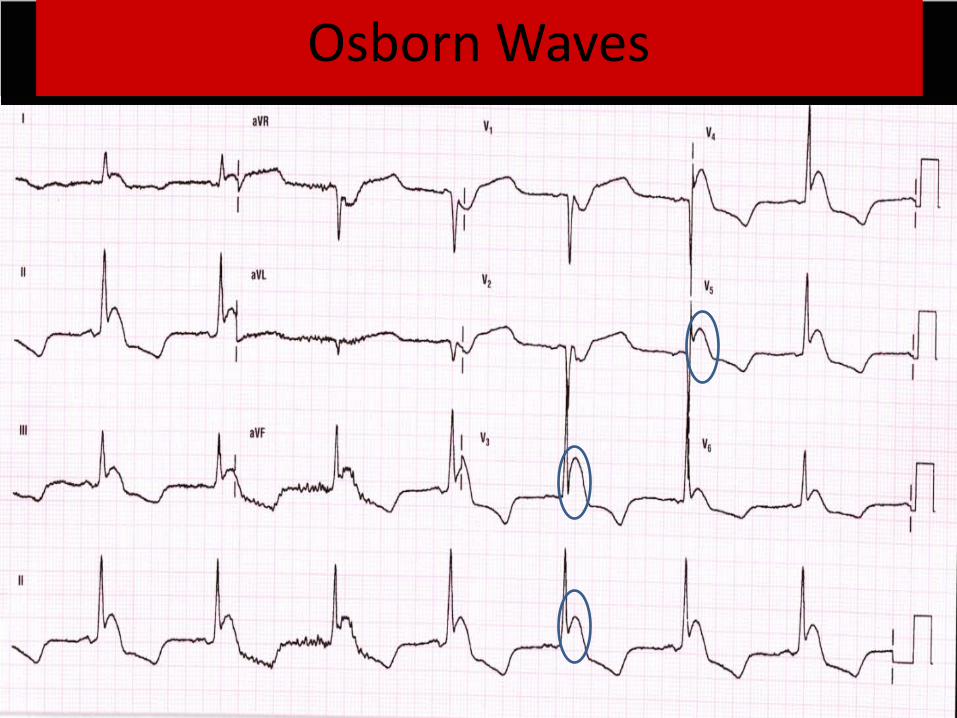
Osborn Waves

Hypocalcemia
• Prolongation of the ST segment with lengthening of the QTc interval
• At risk for the development of torsades de pointes
• ST segment depression in inferior leads ? ischemia
• This ECG also shows LVH with possible strain. Flipped symmetrical T waves in lateral leads.

Hypokalemia
• Mild ST depression
• Mild decreased amplitude of T waves
• Minimal prolongation of the QRS interval
• Prominent U wave
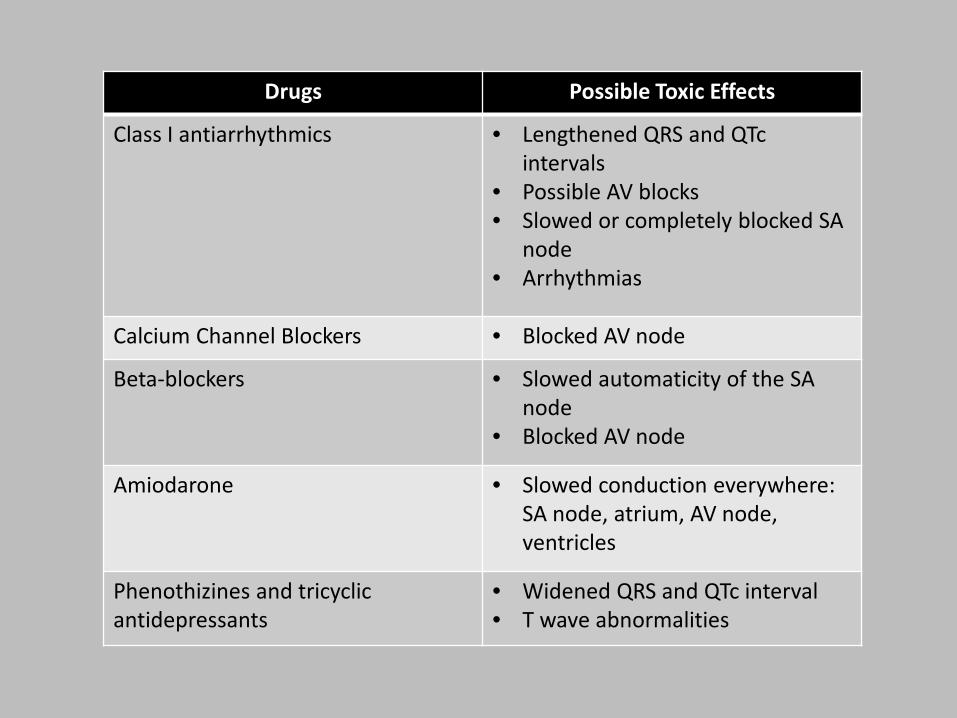
Drugs Possible Toxic Effects
Class I antiarrhythmics • Lengthened QRS and QTc intervals
• Possible AV blocks • Slowed or completely blocked SA
node • Arrhythmias
Calcium Channel Blockers • Blocked AV node
Beta-blockers • Slowed automaticity of the SA node
• Blocked AV node
Amiodarone • Slowed conduction everywhere: SA node, atrium, AV node, ventricles
Phenothizines and tricyclic antidepressants
• Widened QRS and QTc interval • T wave abnormalities
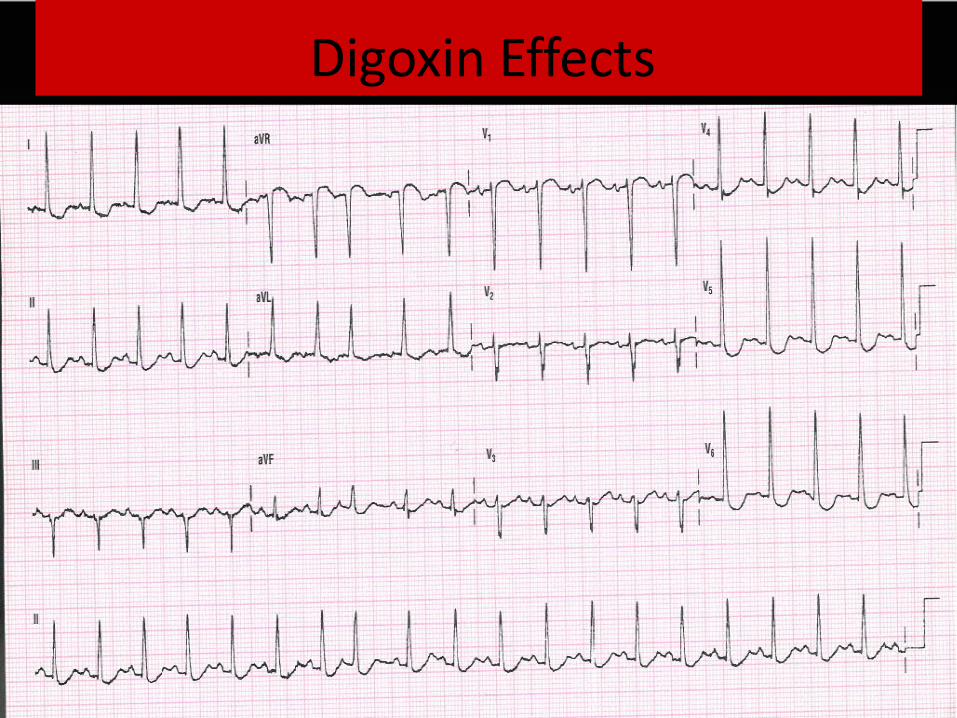
Digoxin Effects
References ECG Library Life in the Fast Lane Retrieved from: http://lifeinthefastlane.com/ecg-library/ Garcia, T. B. (2015). 12_Lead ECG The Art of Interpretation. Jones & Bartlett Learning Burlington, MA Malcolm, T. S. (2012). The Only EKG Book You’ll Ever Need. Lipincott Williams & Wilkins. Philadelphia, PA Walraven, G. (2011) Basic Arrhythmias Seventh Edition. Pearson Education Upper Saddle River, NJ