advanced heat recovery system field...
TRANSCRIPT

COMM-03192012-55870 | November 15, 2016
Advanced Heat Recovery System Field Deployment
Conservation Applied Research & Development (CARD) FINAL REPORT
Prepared for: Minnesota Department of Commerce, Division of Energy Resources
Prepared by: Gas Technology Institute

Prepared by: David Cygan Hamid Abbasi John Wagner Gas Technology Institute 1700 South Mount Prospect Road Des Plaines, IL 60018 Phone (847-768-0524) website (www.gastechnology.org) Project Contact (David Cygan)
© 2016 Gas Technology Institute. All rights reserved.
Contract Number: 55870
Prepared for Minnesota Department of Commerce, Division of Energy Resources Mike Rothman, Commissioner, Department of Commerce Bill Grant, Deputy Commissioner, Department of Commerce, Division of Energy Resources Mary Sue Lobenstein, Project Manager Phone (651-539-1872) Email ([email protected])
ACKNOWLEDGEMENTS This project was supported in part by a grant from the Minnesota Department of Commerce, Division of Energy Resources, through the Conservation Applied Research and Development (CARD) program, which is funded by Minnesota ratepayers. The authors would also like to acknowledge Michael Foods’ Northern Star Potato plant in Chaska, Minnesota and CenterPoint Energy for their financial, in-kind and other contributions to the project.
DISCLAIMER This report does not necessarily represent the view(s), opinion(s), or position(s) of the Minnesota Department of Commerce (Commerce), its employees or the State of Minnesota (State). When applicable, the State will evaluate the results of this research for inclusion in Conservation Improvement Program (CIP) portfolios and communicate its recommendations in separate document(s). Commerce, the State, its employees, contractors, subcontractors, project participants, the organizations listed herein, or any person on behalf of any of the organizations mentioned herein make no warranty, express or implied, with respect to the use of any information, apparatus, method, or process disclosed in this document. Furthermore, the aforementioned parties assume no liability for the information in this report with respect to the use of, or damages resulting from the use of, any information, apparatus, method, or process disclosed in this document; nor does any party represent that the use of this information will not infringe upon privately owned rights.

i
Abstract Gas Technology Institute (GTI) and Cannon Boiler Works (CBW), in cooperation with CenterPoint Energy (CenterPoint), have demonstrated an advanced heat recovery system Ultramizer® on a 1,000 HP boiler at Michael Foods’ Northern Star Potato plant in Chaska, Minnesota. The Ultramizer technology simultaneously captures waste heat and water vapor in industrial and large commercial boiler exhaust gases. Phase 1 of the project involved assessing the market potential for the Ultramizer technology in Minnesota for boilers in the 250 to 1,200 boiler HP (8,600 to 41,400 pounds of steam per hour) output range and identifying three potential candidate sites for field demonstration of the technology. The results confirmed an excellent market potential for the technology, showing an overall market of 549 boilers within the target size range, with food processing plants identified as especially attractive because of higher levels of make-up water used. In Phase 2 of the project, a 1,000 HP boiler at the Northern Star Potato plant that was already equipped with a high temperature economizer, was selected from the candidate sites based on space availability and savings potential. An Ultramizer heat recovery system, sized for a 300 HP boiler was then designed, fabricated, installed and tested on a flue gas slip stream of the boiler to demonstrate its savings potential. Baseline testing, without the Ultramizer, showed efficiencies of 70 to 80% with an average efficiency of 76.05%. Longer term performance tests carried out over several months with the Ultramizer, showed the Ultramizer recovered 33,900 to 40,700 gallons of water monthly for a projected yearly recovery of 436,000 gallons. The monthly energy recovery ranged between 455 and 545 MMBtus for a projected yearly recovery of 5,900 MMBtus. The recovered water and energy translate into annual savings of $41,235 at $5/MMBtu natural gas and 80% boiler efficiency and $10 per 1,000 gallons of purchased and conditioned water. Based on these results, the estimated payback value is 11.8 years. When the project was first initiated natural gas was priced at $10/MMBtu and the payback value would be 6.2 years. The goal of the project was to demonstrate and deploy the Ultramizer technology on commercial and industrial boilers in the 10 to 50 MMBtu/hr range to assist Minnesota gas utilities meet their energy conservation goals. Through market acceptance of the technology the team envisions improved payback.

ii
Table of Contents
Prepared for: Minnesota Department of Commerce, Division of Energy Resources ...................... 1
Prepared by: Gas Technology Institute ................................................................................................... 1
ACKNOWLEDGEMENTS ........................................................................................................................ 2
DISCLAIMER ............................................................................................................................................. 2
Abstract......................................................................................................................................................... i
Executive Summary ................................................................................................................................... 1
Policy Brief .................................................................................................................................................. 4
Background ................................................................................................................................................. 5
Methodology ............................................................................................................................................... 9
Results ........................................................................................................................................................ 14
Issues with Remote Data Acquisition System ...................................................................................... 14
Issues with Boiler and Ultramizer Systems .......................................................................................... 14
Baseline and Initial Performance Data from April 22, 2015 – June 21, 2015 .................................... 15
Performance Data from June 25, 2015 – July 31, 2015 ......................................................................... 19
Ultramizer Run Times ..................................................................................................................... 19
Daily Averages of Collected Parameters ...................................................................................... 21
Daily Averages of Key Parameters for estimating Water and Energy Recovery .................... 23
Daily Averages of Water and Energy Recovered ........................................................................ 25
Performance Data from August 1, 2015 – August 31, 2015 ................................................................ 26
Ultramizer Run Times ..................................................................................................................... 27
Daily Averages of Collected Parameters ...................................................................................... 28
Daily Averages of Key Parameters for estimating Water and Energy Recovery .................... 30
Daily Averages of Water and Energy Recovery .......................................................................... 32
Performance Data from September 1, 2015 – September 30, 2015..................................................... 33
Ultramizer Run Times ..................................................................................................................... 34
Daily Averages of Collected Parameters ...................................................................................... 35
Daily Averages Key Parameters for estimating Water and Energy Recovery ........................ 37
Daily Averages of Water and Energy Recovery .......................................................................... 39
Performance Data from October 1, 2015 – October 31, 2015 .............................................................. 40
Ultramizer Run Times ..................................................................................................................... 41
Daily Averages of Collected Parameters ...................................................................................... 42
iii
Daily Averages of Key Parameters for estimating Water and Energy Recovery .................... 44
Daily Averages of Water and Energy Recovered ........................................................................ 46
Performance Data from November 1, 2015 – November 29, 2015 .................................................... 47
Ultramizer Run Times ..................................................................................................................... 48
Daily Averages of Collected Parameters ...................................................................................... 49
Daily Averages of Key Parameters for estimating Water and Energy Recovery .................... 51
Daily Averages of Water and Energy Recovered ........................................................................ 53
Discussion of Results ............................................................................................................................... 55
Feedback from the Host Site ................................................................................................................... 60
Conclusions and Recommendations ..................................................................................................... 62
References ................................................................................................................................................. 64
List of Tables
Table 1: Monthly Averages of Test Data (2015) ................................................................................... 19
Table 2: Monthly Averages of Test Data (2015) ................................................................................... 55
Table 3: Estimated Monthly and Annual Water and Energy Recovered based on Historical Natural Gas Usage ................................................................................................................................... 58
Table 4: Estimated Monthly and Annual Water and Energy Recovered based on 2015 Natural Gas Usage .................................................................................................................................................. 60
Table 5: Savings Estimates from Original Proposal ............................................................................ 63
iv
List of Figures
Figure 1: Ultramizer Heat and Water Recovery System ...................................................................... 1
Figure 2: TMC Concept ............................................................................................................................. 2
Figure 3: TMC Tubes in a Bundle Assembly .......................................................................................... 2
Figure 4: Cross Section of TMC ................................................................................................................ 5
Figure 5: Alabama and California TMC Ultramizer ............................................................................. 6
Figure 6: TMC Version 1 (Left) and Version 2 (Right) .......................................................................... 7
Figure 7: Ultramizer Energy Savings Benefits ....................................................................................... 7
Figure 8: Ultramizer Annual Water Recovery Rates ............................................................................. 8
Figure 9: Ultramizer Retrofit to the 1,000 HP Boiler ........................................................................... 10
Figure 10: Ultramizer Control Panel ..................................................................................................... 10
Figure 11: Ultramizer P&ID .................................................................................................................... 11
Figure 12: Total Daily Steam Production (lbs) and Natural Gas Consumption (SCF) ................... 16
Figure 13: Average Daily Efficiency of the Boiler ................................................................................ 16
Figure 14: Average Daily Economizer Temperatures (°F) ................................................................. 17
Figure 15: Average Daily Steam Production (lbs, left) and Water Usage (gallons, right) ............. 18
Figure 16: Average Daily Deaerator Steam Usage (PPH, left and % of steam produced, right) .. 18
Figure 17: Ultramizer On and Running Times .................................................................................... 20
Figure 18: Daily Averages of Parameters for the Test Duration ....................................................... 21
Figure 19: Daily Averages of Parameters when Ultramizer was Running ...................................... 22
Figure 20: Key Water and Energy Recovery Parameters during Test Duration ............................. 23
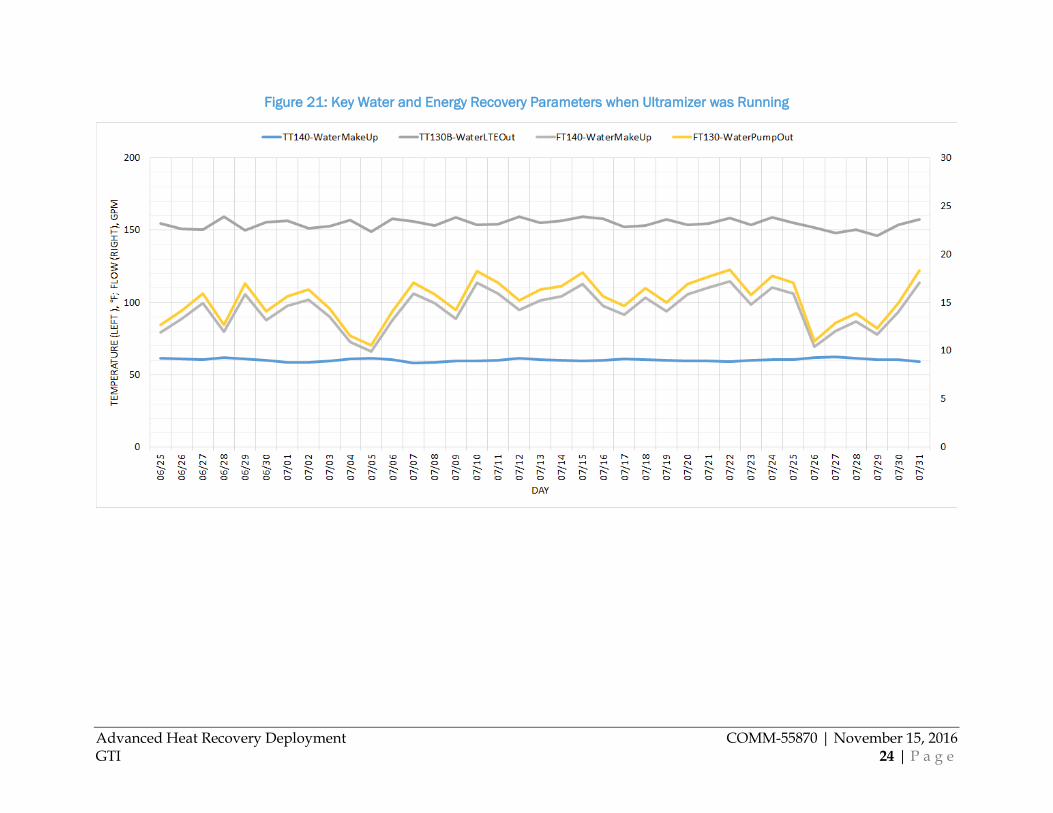
Figure 21: Key Water and Energy Recovery Parameters when Ultramizer was Running ............ 24
Figure 22: Average Water and Energy Recovered over the Test Duration ..................................... 25
Figure 23: Average Water and Energy Recovered when Ultramizer was Running ....................... 26
Figure 24: Ultramizer On and Running Times .................................................................................... 27
Figure 25: Daily Averages of Parameters for the Test Duration ....................................................... 28
Figure 26: Daily Averages of Parameters when Ultramizer was Running ...................................... 29
Figure 27: Key Water and Energy Recovery Parameters during Test Duration ............................. 30
Figure 28: Key Water and Energy Recovery Parameters when Ultramizer was Running ............ 31
Figure 29: Average Water and Energy Recovered over the Test Duration ..................................... 32

v
Figure 30: Average Water and Energy Recovered when Ultramizer was Running ....................... 33
Figure 31: Ultramizer On and Running Times .................................................................................... 34
Figure 32: Daily Averages of Parameters for the Test Duration ....................................................... 35
Figure 33: Daily Averages of Parameters when Ultramizer was Running ...................................... 36
Figure 34: Key Water and Energy Recovery Parameters during Test Duration ............................. 37
Figure 35: Key Water and Energy Recovery Parameters when Ultramizer was Running ............ 38
Figure 36: Average Water and Energy Recovered over the Test Duration ..................................... 39
Figure 37: Average Water and Energy Recovered when Ultramizer was Running ....................... 40
Figure 38: Ultramizer On and Running Times .................................................................................... 41
Figure 39: Daily Averages of Parameters for the Test Duration ....................................................... 42
Figure 40: Daily Averages of Parameters when Ultramizer was Running ...................................... 43
Figure 41: Key Water and Energy Recovery Parameters during Test Duration ............................. 44
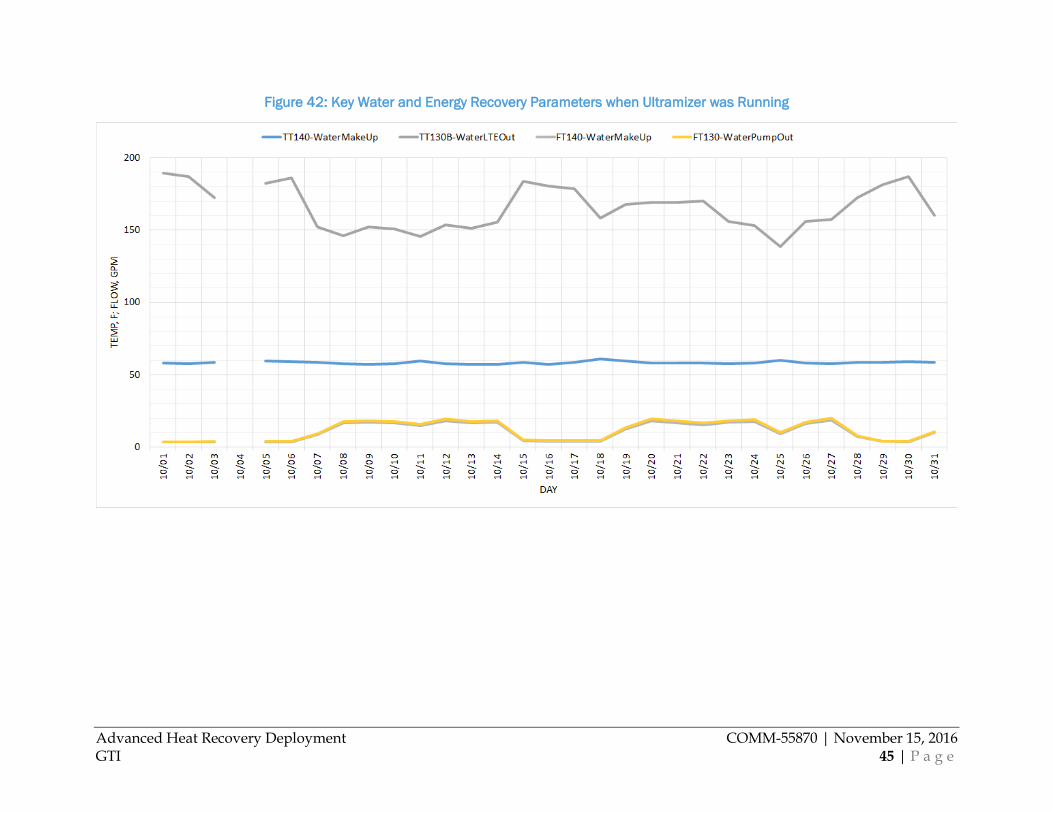
Figure 42: Key Water and Energy Recovery Parameters when Ultramizer was Running ............ 45
Figure 43: Average Water and Energy Recovered over the Test Duration ..................................... 46
Figure 44: Average Water and Energy Recovered when Ultramizer was Running ....................... 47
Figure 45: Ultramizer On and Running Times .................................................................................... 48
Figure 46: Daily Averages of Parameters for the Test Duration ....................................................... 49
Figure 47: Daily Averages of Parameters when Ultramizer was Running ...................................... 50
Figure 48: Key Water and Energy Recovery Parameters during Test Duration ............................. 51
Figure 49: Key Water and Energy Recovery Parameters when Ultramizer was Running ............ 52
Figure 50: Average Water and Energy Recovered over the Test Duration ..................................... 53
Figure 51: Average Water and Energy Recovered when Ultramizer was Running ....................... 54
Figure 52: Monthly Water (left) and Energy Recovered (right) ........................................................ 57
Figure 53: Relationships between Historical Gas Usage and Water and Energy Recovered ........ 57
Figure 54: Historical Natural gas Usage (left) and Projected Water (left) and Energy (right) Recovered .................................................................................................................................................. 59
Figure 55: Monthly 2015 and Historical Average and Natural Gas Consumption (MCF) ............ 59

vi
Definition of Terms
Acronym Meaning
BBtu Billion British Thermal Units
CBW Cannon Boiler Works
CenterPoint CenterPoint Energy
CF Cubic Feet
DOE Department of Energy
GTI Gas Technology Institute
HP Horse Power
IAC Industrial Automation and Control, Inc.
ID Identification
LTE Low Temperature Economizer
MMBtu Million British Thermal Units
P&ID Process and Instrumentation Diagram
PBBS PBBS Equipment Corporation
PLC Programmable Logic Controller
PPH Pounds per Hour
RO Reverse Osmosis
SCF Standard Cubic Feet
TMC Transport Membrane Condenser

Advanced Heat Recovery Deployment COMM-55870 | November 15, 2016 GTI 1 | P a g e
Executive Summary Gas Technology Institute (GTI) and Cannon Boiler Works (CBW), in cooperation with CenterPoint Energy (CenterPoint) have demonstrated an advanced heat recovery system called Ultramizer® on a 1,000 HP boiler at Michael Foods’ Northern Star Potato plant in Chaska, Minnesota. This is the first demonstration of the Ultramizer technology in Minnesota. The Ultramizer technology simultaneously captures waste heat and water vapor from industrial and large commercial boiler exhaust gases. The goal of the project was to demonstrate and deploy the Ultramizer technology on commercial and industrial boilers in the 250 to 1,200 boiler HP (8,600 to 41,400 pounds of steam per hour) output range to assist Minnesota gas utilities meet their energy conservation goals.
The Ultramizer, illustrated in Figure 1, uses GTI’s patented Transport Membrane Condenser (TMC) concept illustrated in Figure 2, to recover heat and water. Porous membrane ceramic tube bundles (Figure 3) are placed in the boiler’s exhaust. Warm stack gas passes by the outside of the tubes while cold water runs through the inside of the tubes under slight negative pressure. The cold water causes stack gas condensation to occur on the outside of the tubes, and the condensed pure water transports through the tube wall and combines with the water stream on the inside of the tubes. The technology increases warm water supply and recovers waste energy to reduce fuel consumption. The core membrane concept was developed with funding support from U.S. Department of Energy (DOE), natural gas utilities, state energy offices, and manufacturing partners, and is licensed to CBW. Prior to the current project, there had not been any demonstrations or commercial sales of Ultramizer in Minnesota.
Figure 1: Ultramizer Heat and Water Recovery System

Advanced Heat Recovery Deployment COMM-55870 | November 15, 2016 GTI 2 | P a g e
Figure 2: TMC Concept
Figure 3: TMC Tubes in a Bundle Assembly
Phase 1 of the project involved assessing the market potential for the Ultramizer technology in Minnesota for boilers in the target output range and identifying three potential candidate sites for field demonstration of the technology. The results confirmed an excellent market potential for the technology, showing an overall market of 549 boilers within the target size range, with food processing plants identified as especially attractive because of higher levels of make-up water used. Phase 2 of the project involved qualifying and securing the host site, preparing engineering designs for Ultramizer retrofit to the host boiler, fabricating and installing the retrofit system, verifying system performance through demonstration testing and technology transfer. A 1,000 HP boiler at the Northern Star Potato plant was selected from the three candidate sites as a representative unit based on its size, availability of space for the retrofit

Advanced Heat Recovery Deployment COMM-55870 | November 15, 2016 GTI 3 | P a g e
system, the site’s interest in the technology, and savings potential. The boiler was already equipped with a high temperature economizer which reduced the retrofit costs but also the potential energy savings from the Ultramizer retrofit.
The Ultramizer system was installed by Horwitz NS/I of New Hope, Minnesota (mechanical) and Egan Company of Brooklyn Park, Minnesota (electrical). Commissioning was performed by CBW with assistance from Industrial Automation and Control, Inc. (IAC), PBBS Equipment Corporation (PBBS) and GTI. PBBS also installed instrumentation and set up the data acquisition system on the boiler, while GTI installed the data acquisition system for monitoring the performance of the Ultramizer. The Ultramizer was sized for a 30% flue gas slip stream of the 1,000 HP boiler.
Data collected by PBBS from April 12, 2015 to June 21, 2015 showed the daily average efficiency before the Ultramizer became operational ranged between 69.84% and 79.77%, averaging 76.05% over the duration. Natural gas and steam flow rates were also measured for a short period with the Ultramizer, however, the fairly large temporal variations in these flow rates both with and without the economizer made it difficult to compare these values to assess the impact of the Ultramizer.
The subsequent longer term monitoring of Ultramizer performance, carried out by GTI from June 25, 2015 to November 29, 2015, showed the Ultramizer recovered 33,900 to 40,700 gallons of water monthly for a projected yearly recovery of 436,000 gallons. The monthly energy recovery ranged between 455 and 545 MMBtus for a projected yearly recovery of 5,900 MMBtus. The recovered water and energy translate into annual savings of $41,235 at $5/MMBtu natural gas and 80% boiler efficiency and $10 per 1,000 gallons of purchased and conditioned water. Based on these results, the estimated payback value is 11.8 years. When the project was first initiated natural gas was priced at $10/MMBtu and the payback value would be 6.2 years. The goal of the project was to demonstrate and deploy the Ultramizer technology on commercial and industrial boilers in the 10 to 50 MMBtu/hr range to assist Minnesota gas utilities meet their energy conservation goals. Through market acceptance of the technology the team envisions improved payback.
During December 2015, while the boiler was off, a number of porous membrane tubes were discovered to have broken. A build-up of soot on tube bundles was also noticed. This was unusual, since the tubes have demonstrated reliable operation in several other boiler applications as well as for several months on the current boiler. Upon investigation, both of these conditions are believed to have been caused by the lack of a make-up air fan on the boiler house. This condition is not usually encountered in typical boiler applications, and is believed to have caused fuel-rich combustion conditions forming soot when the boiler was operating and back-flow of cold outdoor winter air through the Ultramizer freezing residual water and breaking tubes when the boiler was off.

Advanced Heat Recovery Deployment COMM-55870 | November 15, 2016 GTI 4 | P a g e
Policy Brief The goal of the project was to demonstrate and deploy the Ultramizer® technology on commercial and industrial boilers in the 10 to 50 MMBtu/hr range to assist Minnesota gas utilities meet their energy conservation goals.
As the technology saves natural gas from the process/industrial segment, it would be eligible for incentives from CenterPoint’s custom rebate program which covers projects where the particulars of each project need to be gathered. CenterPoint typically pays about $3.50 per saved dekatherm for projects that meet their custom program cost-benefit criteria.
The project was designed to determine the water and energy savings resulting from application of the Ultramizer technology to a flue gas slip stream representing 30% of the total flue gases on a 1,000 HP host boiler. The Ultramizer was therefore sized for a 300 HP boiler. Tests were carried out to document performance both with and without the Ultramizer. The amount of heat (energy) recovered (or saved) equals the difference in the heat contents of the Ultramizer output and input water. The amount of water recovered (or saved) equals the difference in Ultramizer output and input water flow rates. Natural gas savings were estimated as 1.25 times the amount of energy recovered assuming a boiler efficiency of 80% with the Ultramizer. The payback was calculated by estimating water and energy recoveries over one year of normal boiler operation. Natural gas flow rates provided by the local Utility were used as well as the installed cost of the Ultramizer plus normal maintenance costs.
The demonstration tests showed the Ultramizer recovered 33,900 to 40,700 gallons of water monthly for a projected yearly recovery of 436,000 gallons. The monthly energy recovery ranged between 455 and 545 MMBtus for a projected yearly recovery of 5,900 MMBtus. The recovered water and energy translate into annual savings of $41,235 at $5/MMBtu natural gas and 80% boiler efficiency and $10 per 1,000 gallons of purchased and conditioned water.
An assessment of the market potential for the Ultramizer technology in Minnesota for boilers showed an overall market of 549 boilers within the target size range, with food processing plants identified as especially attractive because of higher levels of make-up water used. Since the Ultramizer saves both water and natural gas, it would be a good fit for facilities with good make-up water load, for example the food processing industry. CenterPoint has a fair amount of food processors in the western part of their territory. The Ultramizer would be a technology that CenterPoint could use to get certain food processors to utilize their custom rebate program.
The Ultramizer technology saves both natural gas and water, and can be applied to a wide range of boilers, especially in the 250 to 1,250 HP range. It provides the best performance for boilers that have over 50% make-up water needs. Many of the boilers used in the food processing industry, and applications that use steam directly in the process would fit these criteria. Assuming a typical instance of a 24 MMBtu/hr boiler, low, medium and high annual collective savings of 1,406, 2,812 and 3,515 BBtus of energy are estimated for most likely instances.

Advanced Heat Recovery Deployment COMM-55870 | November 15, 2016 GTI 5 | P a g e
Background Most of the current industrial, commercial, and institutional boilers operate at 75 to 80% thermal efficiency, because the flue gas exhausted from the boiler stack has a high moisture content and is generally at about 450°F. In a boiler fired with natural gas at 15% excess air, the flue gas moisture content is 18% by volume. This represents a large amount of latent heat – about 10% of the total fuel higher heating value input to the boiler. The Ultramizer® employs an innovative method to capture this low-quality heat by using available low-temperature water to extract and condense water vapor from humid waste gas in GTI’s patented Transport Membrane Condenser (TMC), thus recovering both sensible and latent heat to achieve fuel-to-steam efficiency as high as 92 to 94% (higher heating value basis). This approach also recovers clean water from the flue gases for on-site use.
Figure 4 shows a representation of the cross-section of the TMC membrane, where flue gas, after cooling are within about 20 to 50°F of its dew point, pass over the membrane side of the TMC ceramic tube (tube side) and gives up heat and a portion of its water to a counter-current flowing cool water stream (shell side). Water condenses in the micro pores of the ceramic membrane at a temperature above the normal condensation point (dew point) because of the phenomenon of capillary condensation. In this way, both heat and water vapor are removed from the flue gas without reaching the saturation point. This avoids many of the problems of conventional condensers including the formation of corrosive, acidic condensate on the heat exchanger surface leading to corrosion. Because of the high selectivity of the membrane and the formation of a water seal at a temperature above the normal dew point, unwanted contaminants such as CO2 and O2 are prevented from passing through the TMC membrane. GTI laboratory tests have confirmed the water recovered on the shell side of the TMC is neutral in pH and shows no increase in CO2 content.
Figure 4: Cross Section of TMC

Advanced Heat Recovery Deployment COMM-55870 | November 15, 2016 GTI 6 | P a g e
The Ultramizer uses a standard economizer and a secondary heat recovery stage that combines a compact Low Temperature Economizer (LTE) with TMC into a single unit, to recover sensible and latent heat plus water vapor from flue gases. The recovered water is contaminant-free and combines with boiler feed water to both recover and recycle energy and reduce the makeup water requirement for the boiler. The TMC technology was invented by GTI as a component for advanced high-efficiency boiler technology, and was developed under the Super Boiler project sponsored by DOE and other industrial sponsors starting in 2000. Starting in 2006, GTI and Cleaver-Brooks successfully demonstrated prototype versions of TMC-based systems on natural gas-fired boilers in Alabaster, Alabama and Ontario, California.
The Alabama system was developed based on the operating experience and test data GTI obtained from a laboratory heat recovery system for a 3 MMBtu/hr boiler. This was the first industrial-scale TMC-based system designed for a 300 HP (11 MMBtu/hr) firetube boiler. The system is fully automatic to allow unattended operation just like a conventional industrial boiler, and operated for more than 14,000 hours since July 2006. Fuel-to-steam efficiency of 93 to-94% has been consistently achieved with this system. The customer, when firing the boiler 24 hours per day and 5 days per week, reported 12% natural gas savings and 20% makeup water savings. The second TMC-based system was installed in a juice bottling plant located in Ontario, California, also on a 300 HP firetube boiler and has been operating continuously since February 2009. Photographs of the Alabama and the California installations are shown in Figure 5.
Figure 5: Alabama and California TMC Ultramizer
With the successful demonstrations in Alabama and California confirming the technical viability and long-term durability and reliability of the TMC-based heat recovery, GTI assessed the economic feasibility and determined that significant cost reductions were needed for wider deployment of the technology.
A comparison of the original TMC version 1 and the new improved TMC version 2 with an integrated LTE is shown in Figure 6. The 300 HP unit, shown on the right, is a 9 TMC module, three pass design with an integrated LTE. The new TMC with integrated LTE were successfully tested in GTI’s laboratory on a 350 HP boiler and then retrofitted on a 250 HP firetube boiler at Baxter HealthCare, Thousand Oaks, California. Additional TMC units were fabricated,

Advanced Heat Recovery Deployment COMM-55870 | November 15, 2016 GTI 7 | P a g e
laboratory tested and installed at Oak Ridge National Laboratory in Oak, Ridge Tennessee, and Richardson Brands Candy in Canajoharie, New York. Another unit has been installed at the China Lake Naval Station in California.
Based on the successful demonstration of the TMC-based Ultramizer, Cannon Boiler Works (CBW) licensed the technology, naming it the Ultramizer.
Figure 6: TMC Version 1 (Left) and Version 2 (Right)
Figure 7 shows the potential annual energy savings as a function of firing rate and annual operating hours for a nominal 300 HP boiler. Energy savings as high as 10,000 to 12,000 MMBtu/year are possible on a 300 HP boiler operating at high firing rates for 8,000 hours per year.
Figure 7: Ultramizer Energy Savings Benefits
The Ultramizer also provides effective recovery of water from exhaust gases that can be used within the boiler steam system. Figure 8 shows the potential water recovery rates at different firing rates and operating hours for a 300 HP boiler (assuming a 40% exhaust water recovery rate). Annual water savings of 300,000 to 400,000 gallons are possible at higher firing rates and

Advanced Heat Recovery Deployment COMM-55870 | November 15, 2016 GTI 8 | P a g e
operating hours. This water provides economic savings through avoided fresh water purchase, water treatment costs, and disposal.
Figure 8: Ultramizer Annual Water Recovery Rates
Based on testing in the GTI laboratory and in the field, the TMC technology and Ultramizer equipment have shown the ability to significantly increase boiler energy efficiency by 13-15% while also enabling recovery of clean water that is extracted from the boiler’s exhaust gases. This helps offset the need for additional fresh water supply and water treatment. It also avoids a corrosive condensate that is generally created with condensing natural gas heat recovery equipment.
The Ultramizer product is commercially available from CBW, however prior to the current project there had not been any demonstrations or commercial sales in Minnesota. The Ultramizer technology can be used for low-temperature waste heat and water recovery from larger commercial and industrial boilers and other commercial and industrial process applications.

Advanced Heat Recovery Deployment COMM-55870 | November 15, 2016 GTI 9 | P a g e
Methodology The project plan was designed to determine the water and energy savings resulting from application of the Ultramizer® to the host boiler. Tests were carried out to document performance both with and without the Ultramizer. The amount of heat (energy) recovered (or saved) equals the difference in the heat contents of the Ultramizer output and input water. The amount of water recovered (or saved) equals the difference in Ultramizer output and input water flow rates. Natural gas savings have been estimated as equal to 1.25 times the amount of energy recovered assuming an 80% boiler efficiency with the Ultramizer. The payback has been calculated by estimating water and energy recoveries over one year of normal boiler operation. Natural gas flow rates provided by the local Utility were used as well as the installed cost of the Ultramizer plus normal maintenance costs.
The Ultramizer retrofit system was engineered and a detailed design for the Ultramizer system for retrofit to the host boiler was developed. Installation drawings including integration of the system with the host utilities were prepared, approval was secured from the host site, complete design package was completed, and third party equipment required for the retrofit system was procured. An Ultramizer demonstration system based on the approved engineering drawings was fabricated, delivered and installed on the host boiler. This was followed by bringing the Ultramizer online and conducting the required system shakedowns, baseline check-ups, and calibrations including calibration and verification of data acquisition equipment, addressing equipment, instrumentation, or operational issues, that arose during the initial tests, conducting performance testing in accordance with the approved test plan, analyzing the test results, and reviewing the test results with the independent contractor.
An Ultramizer, sized for a 300 HP boiler was designed, fabricated and installed on flue gas slip stream of the 1,000 HP boiler at Michael Foods’ Northern Star Potato plant in Chaska, Minnesota during the first half of 2015. Figure 9 shows the 1,000 HP boiler with the HTE above the boiler and the Ultramizer on the right side of the boiler. Figure 10 shows the Ultramizer control panel and Figure 11 shows the Process and Instrumentation Diagram (P&ID) for the retrofit system.

Advanced Heat Recovery Deployment COMM-55870 | November 15, 2016 GTI 10 | P a g e
Figure 9: Ultramizer Retrofit to the 1,000 HP Boiler
Figure 10: Ultramizer Control Panel

Advanced Heat Recovery Deployment COMM-55870 | November 15, 2016 GTI 11 | P a g e
Figure 11: Ultramizer P&ID
Instrumentation was added for the measurement of make-up water flow rate to the deaerator, steam flow rate from the boiler, and natural gas flow rate to the boiler. Additional information was gathered from the existing boiler control system which included data on boiler firing rate, flue gas oxygen levels and calculated combustion efficiency.
During the demonstration tests, data to allow estimation of gas and water usage and efficiency as well as information on operator experience were collected for both before and after the retrofit. This was done initially on-site for several days and then the operation was remotely monitored, with periodic site visits, as warranted, to check and calibrate instruments and address any equipment related issues. GTI set up a data acquisition system for the Ultramizer which collected data from the Ultramizer's PLC every 10 seconds into files of 1 hour's duration. The data acquisition system also automatically sent out the data it collected – the last four 1-hour data files are emailed out via cellular modem once an hour. Each 1-hour data file was generally emailed four separate times for redundancy in case there were communication drop outs.
The operation of the Ultramizer system was maintained during the demonstration by the steam plant crew – restarting the system as needed when it automatically shut down due to an alarm condition. The crew also manually shut down the system during extended boiler outages.
Prior to and immediately after the installation of the Ultramizer system, tests were carried out by independent contractor PBBS from April 12, 2015 to June 21, 2015 to measure the performance of the system before and after the Ultramizer installation. In addition,

Advanced Heat Recovery Deployment COMM-55870 | November 15, 2016 GTI 12 | P a g e
instrumentation was added for the measurement of make-up water flow rate to the deaerator, steam flow rate from the boiler and natural gas flow rate to the boiler.
Additional information was gathered from the existing boiler control system which included data on boiler firing rate, flue gas oxygen levels and calculated combustion efficiency. PBBS measured the following parameters at a frequency of once per second during these tests:
─ Steam Pressure Setpoint ─ Steam Pressure Actual ─ Firing Rate ─ Combustion Air Fan Speed ─ Blower Motor kW ─ O2 Level ─ Combustion Air Temperature ─ High Temperature Economizer Gas Inlet Temperature ─ High Temperature Economizer Gas Outlet Temperature ─ High Temperature Economizer Water Inlet Temperature ─ High Temperature Economizer Water Outlet Temperature ─ Boiler Water Temperature ─ Combustion Efficiency ─ Steam Flow Rate ─ Natural Gas Flow Rate ─ Water Flow Rate To Deaerator (non-Ultramizer)
Based on these measurements, the following performance parameters were estimated: ─ Total steam produced ─ Total natural gas consumed ─ Total water used ─ Make up water as percent of steam produced ─ Boiler efficiency ─ Deaerator steam flow rate ─ Deaerator steam flow rate as percent of total steam flow rate
In addition, GTI set up a separate data acquisition system to monitor the Ultramizer system performance and collect the data listed below. The listed tag Identifications (IDs) refer to the specific instruments shown in the P&ID and together with the truncated description after the tag ID refer to the respective column titles in data presented.
─ TT140-WaterMakeUp – Temperature Of The Make Up Water Supply ─ TT130A-WaterTMCOut – Temperature Of Water Exiting The Ultramizer ─ TT130B-WaterLTEOut – Temperature Of Water Exiting The Low Temperature
Economizer ─ TT150A-WaterHTEIn – Temperature Of Water Entering The High Temperature
Economizer ─ TT150B-WaterHTEOut – Temperature Of Water Exiting The High Temperature
Economizer ─ TT160A-GasBlrOut – Temperature Of Flue Gas Exiting The Boiler Or Entering
The High Temperature Economizer ─ TT160B-GasHTEOut – Temperature Of Flue Gas Exiting The High Temperature
Economizer

Advanced Heat Recovery Deployment COMM-55870 | November 15, 2016 GTI 13 | P a g e
─ TT160C-GasLTEOut – Temperature Of Flue Gas Exiting The Low Temperature Economizer
─ TT160D-GasTMCOut – Temperature Of Flue Gas Exiting The Ultramizer ─ PT140-WaterMakeUp – Pressure Of The Make Up Water Supply ─ PT130B-WaterPumpOut – Pressure Of Water Exiting The Pump ─ PT120-WaterReservoir – Vacuum At Ultramizer Reservoir ─ LT140-WaterReservoir – Level Of Water In Ultramizer Reservoir ─ LT130-WaterDeaerator – Level Of Water In Deaerator ─ FT140-WaterMakeUp – Flow Rate Of The Make Up Water Supply ─ FT130-WaterPumpOut – Flow Rate Of Water At Ultramizer Outlet ─ FT170-BoilerFiringRate – Measure Of The Boiler Firing Rate ─ LZ140-WaterMakeUp – Position Of Actuator For Ultramizer Reservoir Level
Control Valve ─ LZ130-WaterLTEOut – Position Of Actuator For Deaerator Level Control Valve ─ VSD160SPDREF – Reference Signal For ID Fan Variable Speed Drive
Weekly conference calls with the representative from the host site, contractors/subcontractors and representatives of CenterPoint Energy were held regularly during the commissioning and the first few months of performance testing. These concluded on October 2, 2015 as participation in the calls had decreased due to their diminished value as the operation of the Ultramizer became routine.

Advanced Heat Recovery Deployment COMM-55870 | November 15, 2016 GTI 14 | P a g e
Results The Ultramizer® system at Michael Foods was commissioned during the week of May 18-22, 2015. Shakedown was initiated on May 18, 2015 with checkout of its components. The setup of the Programmable Logic Controller (PLC) and first water fill were accomplished on May 19, 2015. A data acquisition system was also installed on this date to collected operational parameters from the PLC for the Ultramizer. The system was checked for leaks and flue gas was introduced into the Ultramizer on May 20, 2015. The Ultramizer system was transitioned to full operation on May 21, 2015 and monitored to assure proper operation. The system was then left in a powered-up state, awaiting a follow-up visit for training and for repairs needed to the water supply pump and boiler system, before being placed in continuous operation. The boiler’s Reverse Osmosis (RO) water supply pump, which is not a part of the Ultramizer system, needed to be repaired to address the frequent low water supply pressure values observed during commissioning. Following repair of the pump, the Ultramizer system was re-commissioned during the week of June 22-25, 2015 and training of the boiler operators and representatives of PBBS, the local boiler service company was conducted, before the system was put into full operation on June 24, 2015
As discussed earlier, prior to and immediately following Ultramizer installation, boiler performance data was collected for a period covering 60 days beginning on April 12, 2015. Data on the performance of the Ultramizer system itself was collected using a computer installed on site that was programmed to send hourly data files to GTI following its commissioning. The Ultramizer and the data acquisition systems worked as planned, except for a few problems that are described below.
Issues with Remote Data Acquisition System The GTI on-site computer stopped transmitting data on November 29, 2015. Plant outages around the Holidays limited the boiler runtime and personnel availability to troubleshoot the system. The program was restarted on January 12, 2016. Data transmission subsequently recommenced automatically at hourly intervals. The new data transmissions however did not include data from the Ultramizer system's PLC until the Ultramizer system itself was restarted on January 15, 2016.
Issues with Boiler and Ultramizer Systems On December 21, 2015, Michael Foods reported the Ultramizer system could no longer produce sufficient internal vacuum for proper operation and the PLC had shut down the system. CBW was advised of the issue and asked to help with the troubleshooting. On January 16, 2016, Michael Foods ordered a new vacuum pump for the system. There had however been recent personnel changes in the boiler room at Michael Foods and there was no one left with sufficient understanding of the Ultramizer system. PBBS was unable to re-start the system as the water reservoir was not filling in the required amount within the specified time interval. Also, water was observed draining into the bottom transition, which is the section between the ID fan and the LTE, suggesting presence of a tube side leak on either the bundles or the LTE. The LTE was hydro tested and passed with no issues, however, visible signs of broken tubes were observed

Advanced Heat Recovery Deployment COMM-55870 | November 15, 2016 GTI 15 | P a g e
when a bundle was pulled for inspection. CBW opted to have PBBS pull all the bundles for shipment back to CBW for factory testing and evaluation to determine the cause of failure.
All nine bundles were subsequently removed from the Ultramizer and shipped to CBW for factory testing and evaluation. Upon arrival, CBW inspected and factory tested all bundles. All bundles were found to have heavy soot deposits, particularly on the tops of each bundle. Visible signs of broken ceramic tubes were observed on 8 out of the 9 bundles. A hydro test of the only bundle without visible signs of damage found that the bundle was leaking at the tube sheet. It was determined that all bundles needed to be replaced. Based on previous field experience with the Ultramizer and TMC, the excessive amount of tube failures and the heavy sooting was unusual. The tubes have demonstrated reliable operation in several other boiler applications as well as for several months on the current boiler. Upon investigation, both of these conditions are believed to have been caused by the lack of a make-up air fan on the boiler house. This condition is not usually encountered in typical boiler applications, and is believed to have caused fuel-rich combustion conditions forming soot when the boiler was operating and back-flow of cold outdoor winter air through the Ultramizer freezing residual water and breaking tubes when the boiler was off. New bundles were shipped to Michael Foods for reinstallation and commissioning to return the system to full operation.
Baseline and Initial Performance Data from April 22, 2015 – June 21, 2015 Baseline and initial Ultramizer performance data was collected for a period of over 60 days beginning on April 12, 2015. The data collected included flue gas and water temperatures at the inlet and the outlet of the Ultramizer. In addition, instrumentation was added for the measurement of make-up water flow rate to the deaerator, steam flow rate from the boiler and natural gas flow rate to the boiler.
Additional information was gathered from the existing boiler control system which included data on boiler firing rate, flue gas oxygen levels and calculated combustion efficiency. However, for comparisons to data from the Ultramizer, information reviewed has been limited to fuel usage, steam production, water usage, and existing economizer performance.
Figure 12 shows the total daily steam production and natural gas consumption. The daily totals for steam and natural gas decreased and leveled off since data April 22, 2015. The low points from June 7, 2015 to June 13, 2015 are due to boiler shut down for maintenance. The other low outlier is on the data of May 25, 2015, the boiler was not firing often due to low load or maintenance. These outliers were shown in all graphs but excluded from analysis. The average steam and natural gas totals excluding outliers were 267,366 lbs. and 344,881 SCF respectively. The minimum and maximum steam totals were 142,047 and 490,212 lbs. The minimum and maximum natural gas totals were 176,794 and 629,023 SCF. As shown in Figure 12, since April 22, 2015 the steam total has varied between 150,000 and 350,000 lbs. and the gas total varied between 200,000 and 400,000 SCF. The daily steam and gas totals have significant variation due to the load needed within the plant.

Advanced Heat Recovery Deployment COMM-55870 | November 15, 2016 GTI 16 | P a g e
Figure 12: Total Daily Steam Production (lbs) and Natural Gas Consumption (SCF)
Figure 13 shows the average daily efficiency of the boiler which, when the outliers are excluded, stayed between 70 to 80% with the majority of the data points falling between 75 and 80%. The average efficiency before the Ultramizer became operational was 76.05%. The daily average efficiency minimum and maximum were 69.84% and 79.77%. Variation in average efficiency is mostly due to steam production. As steam production increases, efficiency decreases since boilers are typically more efficient at lower firing rates.
Figure 13: Average Daily Efficiency of the Boiler

Advanced Heat Recovery Deployment COMM-55870 | November 15, 2016 GTI 17 | P a g e
The economizer temperatures, shown in Figure 14, were steady and consistent except when the boiler was down for maintenance (June 7, 2015 to June 13, 2015) and from April 22, 2015 to April 28, 2015. It should be noted however that at approximately 198 – 202°F, economizer water inlet is below what would normally be expected for water coming from a deaerator. Deaerator temperatures would generally be above 220°F. The average temperatures for economizer gas at the inlet and the outlet were 386°F and 290.5°F respectively, when excluding the two segments of outliers. The average temperatures for the economizer water at the inlet and the outlet were 200.8°F and 235°F respectively, when excluding the two segments of outliers.
Figure 14: Average Daily Economizer Temperatures (°F)
The total daily water usage, shown in Figure 15, was sporadic within the range of 20,000 to 50,000 gallons. This variability is due to the steam production needed by the plant. The average daily water usage was 33,377 gallons. The minimum and maximum were 19,444 and 48,616 gallons. Makeup water percentage increased dramatically on April 22, 2015. The average before April 22, 2015 was 72% and the average after was 113%. The reason for the increase in makeup water percentage is not known for certain, but could be due to excessive blowdown, carryover in the steam, water leaks in the boiler or boiler feed piping.

Advanced Heat Recovery Deployment COMM-55870 | November 15, 2016 GTI 18 | P a g e
Figure 15: Average Daily Steam Production (lbs, left) and Water Usage (gallons, right)
Figure 16 shows the average daily deaerator steam usage. The deaerator used an average of 1,418 PPH of steam to preheat the makeup water. The minimum and maximum are 818 and 2,046 PPH of steam. These translate to a minimum of 7.51% and a maximum of 18.42% of steam production being used in the deaerator. The average percentage of steam being used by the deaerator was 12.98%. The percentage of steam used by the deaerator increased on April 22, 2015 to accommodate the increase in makeup water percentage.
Figure 16: Average Daily Deaerator Steam Usage (PPH, left and % of steam produced, right)

Advanced Heat Recovery Deployment COMM-55870 | November 15, 2016 GTI 19 | P a g e
Overall, the data collected over the 60 day period was consistent with few outliers that can be attributed to interruptions in plant operations and boiler downtime due to repairs. PBBS expressed confident that the information can be used as a baseline for future efficiency comparisons.
Performance Data from June 25, 2015 – July 31, 2015 The PBBS data collection system continued to collect data through July 31, 2015. Total water to the deaerator was down 5.80% (1,914 gal.) since the installation of the Ultramizer (see Table 1). This could be due to lower loads (June and July are historically low production months) or/and the reduction in steam needed by the deaerator. Total water off the RO line was down 9.36% (3,088 gal.) since the installation of the Ultramizer. The difference in 9.36% and 5.80% is the percentage of daily water usage extracted from the flue gas by the Ultramizer (3.56% or 1,174 gal).
Table 1: Monthly Averages of Test Data (2015)
Daily Average Water Totals
Before Ultramizer (4/23
-6/22)
After Ultramizer (6/25 - 7/31) Change % Change
Total Water Off RO Line 32,988.02 29,899.83 3,088.20 9.36%
Total Water To Deaerator 32,988.02 31,073.94 1,914.08 5.80%
Water To Deaerator From RO Line (PBBS Metered) 32,988.02 10,582.01
Water To Deaerator From Ultramizer (GTI Metered) 0 20,491.93
Water To Ultramizer From RO Line (GTI Metered) 0 19,317.81 All water values in table are in gallons. Days when boiler was shut down are excluded.
The following presents daily averages of Ultramizer run times, collected parameters, and estimated water and energy savings from June 25, 2015 to July 31, 2015. Two sets of data are presented: 1) averaged for the entire time period when data were collected, and 2) when the Ultramizer was on and running.
Ultramizer Run Times
Figure 17 shows the daily average percent of total available time over the test duration the Ultramizer was on, and the daily average percent of total available time it was actually running. The data show the Ultramizer was on from 82.5 to 100% for an average of 96.1% of the total available time, and was running from 68.3 to 99.3% for an average of 92.1% of the total available time over the test duration.

Advanced Heat Recovery Deployment COMM-55870 | November 15, 2016 GTI 20 | P a g e
Figure 17: Ultramizer On and Running Times

Advanced Heat Recovery Deployment COMM-55870 | November 15, 2016 GTI 21 | P a g e
Daily Averages of Collected Parameters
Figure 18 and Figure 19 respectively show variations in daily values of collected parameters when averaged for the test duration and when averaged for the time the Ultramizer was actually running.
Figure 18: Daily Averages of Parameters for the Test Duration

Advanced Heat Recovery Deployment COMM-55870 | November 15, 2016 GTI 22 | P a g e
Figure 19: Daily Averages of Parameters when Ultramizer was Running

Advanced Heat Recovery Deployment COMM-55870 | November 15, 2016 GTI 23 | P a g e
Daily Averages of Key Parameters for estimating Water and Energy Recovery
Figure 20 and Figure 21 respectively show variations in daily values of key parameters used to calculate water and energy recovery when averaged for the test duration and when averaged for the time the Ultramizer was actually running.
Figure 20: Key Water and Energy Recovery Parameters during Test Duration
Advanced Heat Recovery Deployment COMM-55870 | November 15, 2016 GTI 24 | P a g e
Figure 21: Key Water and Energy Recovery Parameters when Ultramizer was Running

Advanced Heat Recovery Deployment COMM-55870 | November 15, 2016 GTI 25 | P a g e
Daily Averages of Water and Energy Recovered
Figure 22 and Figure 23 respectively show the estimated daily values for water and energy recovered by the Ultramizer when averaged for the test duration and averaged for the time the Ultramizer was actually running. Over the duration of the test, and when the Ultramizer was running respectively, the average daily amounts of water and energy recovered were 1,182 and 1,396 gallons, and 15.8 and 17.4 MMBtus respectively.
Figure 22: Average Water and Energy Recovered over the Test Duration

Advanced Heat Recovery Deployment COMM-55870 | November 15, 2016 GTI 26 | P a g e
Figure 23: Average Water and Energy Recovered when Ultramizer was Running
Performance Data from August 1, 2015 – August 31, 2015 The following presents daily averages of Ultramizer run times, collected parameters, and estimated water and energy savings from August 1, 2015 to August 31, 2015. Two sets of data are presented: 1) averaged for the entire time period when data were collected, and 2) when the Ultramizer was on and running.

Advanced Heat Recovery Deployment COMM-55870 | November 15, 2016 GTI 27 | P a g e
Ultramizer Run Times
Figure 24 shows the daily average percent of total available time over the test duration the Ultramizer was on, and the daily average percent of time it was actually running. The data show the Ultramizer was on from 59.4 to 100% for an average of 94.6% of the total available time, and was running from 51.2 to 99.5% for an average of 88.0% of the total available time over the test duration.
Figure 24: Ultramizer On and Running Times

Advanced Heat Recovery Deployment COMM-55870 | November 15, 2016 GTI 28 | P a g e
Daily Averages of Collected Parameters
Figure 25 and Figure 26 respectively show variations in daily values of collected parameters when averaged for the test duration and when averaged for the time the Ultramizer was actually running.
Figure 25: Daily Averages of Parameters for the Test Duration

Advanced Heat Recovery Deployment COMM-55870 | November 15, 2016 GTI 29 | P a g e
Figure 26: Daily Averages of Parameters when Ultramizer was Running

Advanced Heat Recovery Deployment COMM-55870 | November 15, 2016 GTI 30 | P a g e
Daily Averages of Key Parameters for estimating Water and Energy Recovery
Figure 27 and Figure 28 respectively show variations in daily values of key parameters used to calculate water and energy recovery when averaged for the test duration and when averaged for the time the Ultramizer was actually running.
Figure 27: Key Water and Energy Recovery Parameters during Test Duration

Advanced Heat Recovery Deployment COMM-55870 | November 15, 2016 GTI 31 | P a g e
Figure 28: Key Water and Energy Recovery Parameters when Ultramizer was Running

Advanced Heat Recovery Deployment COMM-55870 | November 15, 2016 GTI 32 | P a g e
Daily Averages of Water and Energy Recovery
Figure 29 and Figure 30 respectively show the estimated daily values of water and energy recovery by the Ultramizer when averaged for the test duration and averaged for the time the Ultramizer was actually running. Over the duration of the test and when the Ultramizer was running respectively, the average daily amounts of water and energy recovered were 1,082 and 1,390 gallons and 14.7 and 16.9 MMBtus respectively.
Figure 29: Average Water and Energy Recovered over the Test Duration

Advanced Heat Recovery Deployment COMM-55870 | November 15, 2016 GTI 33 | P a g e
Figure 30: Average Water and Energy Recovered when Ultramizer was Running
Performance Data from September 1, 2015 – September 30, 2015 The following presents daily averages of Ultramizer run times, collected parameters, and estimated water and energy savings from September 1, 2015 to September 31, 2015. Two sets of data are presented: 1) averaged for the entire time period when data were collected, and 2) when the Ultramizer was on and running.

Advanced Heat Recovery Deployment COMM-55870 | November 15, 2016 GTI 34 | P a g e
Ultramizer Run Times
Figure 31 shows the daily average percent of total available time over the test duration the Ultramizer was on, and the daily average percent of total available time it was actually running. The data show the Ultramizer was on from 47.8 to 100% for an average of 88.2% of the total available time, and was running from 34.4 to 99.5% for an average of 84.6% of the total available time over the test duration.
Figure 31: Ultramizer On and Running Times

Advanced Heat Recovery Deployment COMM-55870 | November 15, 2016 GTI 35 | P a g e
Daily Averages of Collected Parameters
Figure 32 and Figure 33 respectively show variations in daily values of collected parameters when averaged for the test duration and when averaged for the time when the Ultramizer was actually running. Note the Ultramizer was not running on September 13-15, 2015.
Figure 32: Daily Averages of Parameters for the Test Duration

Advanced Heat Recovery Deployment COMM-55870 | November 15, 2016 GTI 36 | P a g e
Figure 33: Daily Averages of Parameters when Ultramizer was Running

Advanced Heat Recovery Deployment COMM-55870 | November 15, 2016 GTI 37 | P a g e
Daily Averages Key Parameters for estimating Water and Energy Recovery
Figure 34 and Figure 35 respectively show variations in daily values of key parameters used to calculate water and energy recovery when averaged for the test duration and when averaged for the time the Ultramizer was actually running.
Figure 34: Key Water and Energy Recovery Parameters during Test Duration

Advanced Heat Recovery Deployment COMM-55870 | November 15, 2016 GTI 38 | P a g e
Figure 35: Key Water and Energy Recovery Parameters when Ultramizer was Running

Advanced Heat Recovery Deployment COMM-55870 | November 15, 2016 GTI 39 | P a g e
Daily Averages of Water and Energy Recovery
Figure 36 and Figure 37 respectively show the estimated daily values for water and energy recovered by the Ultramizer when averaged for the test duration and averaged for the time the Ultramizer was actually running. Over the duration of the test, and when the Ultramizer was running respectively, the average daily amounts of water and energy recovered were 523 and 848 gallons and 9.6 and 11.1 MMBtus respectively.
Figure 36: Average Water and Energy Recovered over the Test Duration

Advanced Heat Recovery Deployment COMM-55870 | November 15, 2016 GTI 40 | P a g e
Figure 37: Average Water and Energy Recovered when Ultramizer was Running
Performance Data from October 1, 2015 – October 31, 2015 The following presents daily averages of Ultramizer run times, collected parameters, and estimated water and energy savings from October 1, 2015 to October 31, 2015. Two sets of data are presented 1) averaged for the entire time period when data were collected, and 2) when the Ultramizer was on and running.

Advanced Heat Recovery Deployment COMM-55870 | November 15, 2016 GTI 41 | P a g e
Ultramizer Run Times
Figure 38 shows the daily average percent of total available time over the test duration the Ultramizer was on, and the daily average percent of total available time it was actually running. The data show the Ultramizer was on from 0 to 100% for an average of 86.5% of the total available time, and was running from 0 to 100% for an average of 81.7% of the total available time over the test duration.
Figure 38: Ultramizer On and Running Times

Advanced Heat Recovery Deployment COMM-55870 | November 15, 2016 GTI 42 | P a g e
Daily Averages of Collected Parameters
Figure 39 and Figure 40 respectively show variations in daily values of collected parameters when averaged for the test duration and when averaged for the time the Ultramizer was actually running.
Figure 39: Daily Averages of Parameters for the Test Duration

Advanced Heat Recovery Deployment COMM-55870 | November 15, 2016 GTI 43 | P a g e
Figure 40: Daily Averages of Parameters when Ultramizer was Running

Advanced Heat Recovery Deployment COMM-55870 | November 15, 2016 GTI 44 | P a g e
Daily Averages of Key Parameters for estimating Water and Energy Recovery
Figure 41 and Figure 42 respectively show variations in daily values of key parameters used to calculate water and energy recovery when averaged for the test duration and when averaged for the time the Ultramizer was actually running.
Figure 41: Key Water and Energy Recovery Parameters during Test Duration
Advanced Heat Recovery Deployment COMM-55870 | November 15, 2016 GTI 45 | P a g e
Figure 42: Key Water and Energy Recovery Parameters when Ultramizer was Running

Advanced Heat Recovery Deployment COMM-55870 | November 15, 2016 GTI 46 | P a g e
Daily Averages of Water and Energy Recovered
Figure 43 and Figure 44 respectively show the estimated daily values for water and energy recovered by the Ultramizer when averaged for the test duration and averaged for the time the Ultramizer was actually running. Over the duration of the test, and when the Ultramizer was running respectively, the average daily amounts of water and energy recovered were 646 and 1,076 gallons and 12.0 and 18.1 MMBtus respectively.
Figure 43: Average Water and Energy Recovered over the Test Duration

Advanced Heat Recovery Deployment COMM-55870 | November 15, 2016 GTI 47 | P a g e
Figure 44: Average Water and Energy Recovered when Ultramizer was Running
Performance Data from November 1, 2015 – November 29, 2015 The following presents daily averages of Ultramizer run times, collected parameters, and estimated water and energy savings from November 1, 2015 to November 29, 2015. Two sets of data are presented 1) averaged for the entire time period when data were collected, and 2) when the Ultramizer was on and running.

Advanced Heat Recovery Deployment COMM-55870 | November 15, 2016 GTI 48 | P a g e
Ultramizer Run Times
Figure 45 shows the daily average percent of total available time over the test duration the Ultramizer was on, and the daily average percent of total available time it was actually running. The data show the Ultramizer was on from 0 to 100% for an average of 89.5% of the total available time, and was running from 0 to 100% for an average of 86.3% of the total available time.
Figure 45: Ultramizer On and Running Times

Advanced Heat Recovery Deployment COMM-55870 | November 15, 2016 GTI 49 | P a g e
Daily Averages of Collected Parameters
Figure 46 and Figure 47 respectively show variations in daily values of collected parameters when averaged for the test duration and when averaged for the time the Ultramizer was actually running.
Figure 46: Daily Averages of Parameters for the Test Duration

Advanced Heat Recovery Deployment COMM-55870 | November 15, 2016 GTI 50 | P a g e
Figure 47: Daily Averages of Parameters when Ultramizer was Running

Advanced Heat Recovery Deployment COMM-55870 | November 15, 2016 GTI 51 | P a g e
Daily Averages of Key Parameters for estimating Water and Energy Recovery
Figure 48 and Figure 49 respectively show variations in daily values of key parameters used to calculate water and energy recovery when averaged for the test duration and when averaged for the time the Ultramizer was actually running.
Figure 48: Key Water and Energy Recovery Parameters during Test Duration

Advanced Heat Recovery Deployment COMM-55870 | November 15, 2016 GTI 52 | P a g e
Figure 49: Key Water and Energy Recovery Parameters when Ultramizer was Running

Advanced Heat Recovery Deployment COMM-55870 | November 15, 2016 GTI 53 | P a g e
Daily Averages of Water and Energy Recovered
Figure 50 and Figure 51 respectively show the estimated daily values for water and energy recovered by the Ultramizer when averaged for the test duration and averaged for the time the Ultramizer was actually running. Over the duration of the test, and when the Ultramizer was running respectively, the average daily amount of water and energy recovered were 1,167 and 1,479 gallons and 118.1 and 20.2 MMBtus respectively.
Figure 50: Average Water and Energy Recovered over the Test Duration

Advanced Heat Recovery Deployment COMM-55870 | November 15, 2016 GTI 54 | P a g e
Figure 51: Average Water and Energy Recovered when Ultramizer was Running

Advanced Heat Recovery Deployment COMM-55870 | November 15, 2016 GTI 55 | P a g e
Discussion of Results The baseline as well as the Ultramizer® performance data presented in the previous section, hows large variations in the daily values of steam production, natural gas consumption and ake-up water usage, making it difficult to compare these values with and without the ltramizer to estimate water and energy savings. Consequently, a different approach has been sed for estimating these values, which is believed to provide more consistent and reasonable stimates.
able 2 summarizes the average monthly values of the data collected on the Ultramizer erformance. The June and July values have been combined as the Ultramizer system was fully perational only for a few days in June. The two columns shown for each period represented verage values over the entire period and average values when the Ultramizer was actually unning. The amount of water recovered is calculated by subtracting the amount of make-up ater (FT140-WaterMakeUp) going into the Ultramizer from the amount of water coming out
f the Ultramizer (FT130-WaterPumpOut).
he amount of heat recovered is calculated by multiplying the rise in make-up water emperature through the Ultramizer [calculated by subtracting the temperature of make-up
ater (TT140-WaterMakeUp) at the inlet of the Ultramizer from the temperature of the water at he outlet of the Ultramizer (TT130B-WaterLTEOut)], by the flow rate of water at the outlet of he Ultramizer (FT130-WaterPumpOut) and the specific heat capacity of water. The water and nergy recovery values for when the Ultramizer was running were calculated by dividing the otal values representing the entire period by the fraction of time the Ultramizer was running. hese would be representative of the values had the Ultramizer been on or running the whole
ime. The total water and energy recovery values would be 8.6 to 22.5% higher if extrapolated rom values when the Ultramizer was running.
he Ultramizer ran from 81.65 to 92.08% of the time during the months tested.
Table 2: Monthly Averages of Test Data (2015)
smUue
Tpoarwo
TtwttetTtf
T
Parameter Units
June 25 – July 31
August 1-31
September 1-30
October 1-30
November 1-29
Total Run Total Run Total Run Total Run Total Run TT140-WaterMakeUp °F 60.70 60.37 60.40 59.92 60.92 60.36 59.05 58.42 58.12 57.77
TT130A-WaterTMCOut °F 111.1 113.3 107.8 111.1 113.6 120.2 106.8 113.9 105.5 112.2
TT130B-WaterLTEOut °F 151.7 154.4 147.0 151.3 164.6 174.1 155.3 165.5 148.2 158.7
TT150A-WaterHTEIn °F 195.7 195.6 196.3 196.2 196.6 196.6 195.2 195.2 190.8 194.6
TT150B-WaterHTEOut °F 226.9 227.4 227.6 228.2 231.8 232.1 225.6 231.1 226.6 232.3
TT160A-GasBlrOut °F 368.5 371.8 364.7 369.9 379.0 380.9 361.2 378.1 365.0 381.9
TT160B-GasHTEOut °F 305.8 316.9 288.1 303.3 309.1 335.1 300.9 330.1 316.1 342.2
TT160C-GasLTEOut °F 132.0 135.9 130.6 136.5 136.8 147.5 132.7 145.1 131.4 141.5
TT160D-GasTMCOut °F 108.8 111.4 105.0 108.7 109.4 115.4 102.5 110.4 103.3 110.4
PT140-WaterMakeUp psig 39.92 39.80 39.88 39.72 39.92 39.87 39.62 39.44 39.27 39.07

Advanced Heat Recovery Deployment COMM-55870 | November 15, 2016 GTI 56 | P a g e
Parameter Units
June 25 – July 31
August 1-31
September 1-30
October 1-30
November 1-29
Total Run Total Run Total Run Total Run Total Run PT130B-WaterPumpOut psig 37.55 38.83 36.98 38.77 34.52 38.54 34.09 38.68 34.87 38.73
PT120-WaterReservoir In Hg -5.172 -5.397 -5.414 -5.744 -5.557 -6.320 -4.851 -5.672 -4.114 -4.582
LT140-WaterReservoir in 51.84 52.01 51.79 52.02 51.34 52.03 51.28 52.03 51.37 52.02
LT130-WaterDeaerator in 26.82 26.80 27.01 26.98 27.70 27.71 27.55 27.56 27.12 27.09
FT140-WaterMakeUp gpm 13.50 14.35 13.13 14.37 7.60 8.30 9.78 10.98 14.48 15.59
FT130-WaterPumpOut gpm 14.32 15.32 13.88 15.34 7.97 8.89 10.23 11.73 15.29 16.62
FT170-BoilerFiringRate -- 20.15 24.37 15.70 22.67 35.67 38.25 19.23 34.33 30.22 41.60
LZ140-WaterMakeUp -- 5531 5687 5506 5734 4672 4841 5054 5312 5811 6039
LZ130-WaterLTEOut -- 9745 10192 9011 9606 6325 6642 8056 8672 10979 11578
VSD160SPDREF -- 13162 14013 12666 13951 8475 9400 10046 11536 12572 14020
CR1(Spare) -- 1229 1319 1184 1321 1132 1318 1103 1324 1145 1323
Temperature Increase °F 91.0 94.1 86.6 91.3 103.6 113.6 96.3 107.0 90.1 100.9
Water Recovered gpm 0.820 0.969 0.751 0.965 0.364 0.589 0.449 0.747 0.811 1.027
Water Recovered gpd 1182 1396 1082 1390 523 848 646 1076 1167 1479
Energy Recovered MMBtu/ day 15.79 17.35 14.66 16.89 9.55 11.07 11.99 14.30 18.10 20.20
TMC On % 96.14 94.61 88.16 86.48 89.45
TMC Run % 92.08 88.03 84.63 81.65 86.27
Run when On % 95.78 93.04 95.99 94.42 96.44
Figure 52 shows the monthly recoveries of water and energy. The highest amounts of water and energy were recovered in June-July, August and November, while the lowest amounts were recovered in September. The amounts recovered in October were somewhat higher than in September but significantly lower than the highest values.

Advanced Heat Recovery Deployment COMM-55870 | November 15, 2016 GTI 57 | P a g e
Figure 52: Monthly Water (left) and Energy Recovered (right)
02468101214161820
0
200
400
600
800
1000
1200
1400
June-July August September October November
Water Recovered, gpd
Energy recovered, MMBtu/day
Figure 53 shows the relationship between the historical monthly natural gas usage values (2010 to March 2016) for the two boilers at the plant and the actual amounts of water and energy recovered by the Ultramizer. The best fit lines were used to extrapolate the water and energy recovery values using the historical gas usage data. The results are shown in Table 3. The estimated plant efficiency gain values represent the estimated energy recovered as a percent of historical natural gas usage at the plant. The plant’s efficiency gain varied between 3.6 and 3.8%. The total annual projected water and energy recovery values are 436,359 gallons and 5,905 MMBtus.
Figure 53: Relationships between Historical Gas Usage and Water and Energy Recovered
0
100
200
300
400
500
600
700
800
900
1000
0
5000
10000
15000
20000
25000
30000
35000
40000
45000
50000
12000125001300013500140001450015000
Ener
gy R
ecov
ered
, MM
Btu
Wat
er R
ecov
ered
, gal
lons
Historical Natural Gas Usage, MSCF
Water Recovered
Energy Recovered
Estimated Water Recovered
Estimated Energy Recovered

Advanced Heat Recovery Deployment COMM-55870 | November 15, 2016 GTI 58 | P a g e
Table 3: Estimated Monthly and Annual Water and Energy Recovered based on Historical Natural Gas Usage
2015 Water
Recovered, gallons
2015 Energy
Recovered, MMBtus
Historical Natural Gas
Usage, MSCF
Estimated Water
Recovered, gallons
Estimated Energy
Recovered, MMBtus
Estimated Natural Gas
Savings, %
January
12,802 34,298 466.3 3.6
February
13,013 35,090 476.2 3.7
March
14,044 38,959 524.5 3.7
April
13,318 36,235 490.5 3.7
May
13,455 36,749 496.9 3.7
June 30,211 426.44 12,903 34,679 471.1 3.7
July 37,690 498.80 12,566 33,413 455.3 3.6
August 33,544 454.55 12,697 33,905 461.4 3.6
September 34,746 473.34 12,901 34,670 471.0 3.7
October 35,755 508.36 14,367 40,168 539.6 3.8
November 45,572 582.77 14,504 40,683 546.0 3.8
December
13,658 37,510 506.4 3.7 Year
160,227 436,359 5905 3.7
Figure 54 plots the monthly historical natural gas usage and estimated water and energy recovery values based on the historical natural gas usage. Based on historical gas usage values, the peak natural gas usage and water and energy recovery would be in March, October and November, while the lowest recovery would be in July through September. While the October and November values for water and energy recovered are consistent with the measured values, the July through September values are not. This could be because the actual gas usage in these months was higher than the historical values.

Advanced Heat Recovery Deployment COMM-55870 | November 15, 2016 GTI 59 | P a g e
Figure 54: Historical Natural gas Usage (left) and Projected Water (left) and Energy (right) Recovered
400
420
440
460
480
500
520
540
560
0
5000
10000
15000
20000
25000
30000
35000
40000
45000
Historical Estimated Estimated
Figure 55: Monthly 2015 and Historical Average and Natural Gas Consumption (MCF) compares the historical average and the 2015 natural gas consumption values. Both the levels of consumption and the monthly profile were different in 2015 from the average historical values. There was however, significant year to year variation in historical monthly values, and the 2015 values were not unusual when comparing with the historical value ranges.
Figure 55: Monthly 2015 and Historical Average and Natural Gas Consumption (MCF)
10000
11000
12000
13000
14000
15000
16000
2015 Historical Average

Advanced Heat Recovery Deployment COMM-55870 | November 15, 2016 GTI 60 | P a g e
Table 4 shows the projected water and energy savings based on 2015 natural gas consumption data for the plant’s two boilers. The estimated efficiency gain values ranged from 3 to 3.9% with an annual average efficiency gain of 3.3%.
Table 4: Estimated Monthly and Annual Water and Energy Recovered based on 2015 Natural Gas Usage
2015 Water
Recovered, gallons
2015 Energy
Recovered, MMBtus
2015 Natural
Gas Usage, MSCF
Estimated Water
Recovered, gallons
Estimated Energy
Recovered, MMBtus
Estimated Efficiency
Gain*, %
January
14,968 36,508 494.2 3.3
February
14,731 35,930 486.3 3.3
March
15,081 36,783 497.9 3.3
April
15,265 37,232 504.0 3.3
May
15,169 36,998 500.8 3.3
June 30,211 426.44 13,967 30,211 426.4 3.1
July 37,690 498.80 15,169 37,690 498.8 3.3
August 33,544 454.55 15,265 33,544 454.6 3.0
September 34,746 473.34 15,081 34,746 473.3 3.1
October 35,755 508.36 14,731 35,755 508.4 3.5
November 45,572 582.77 14,968 45,572 582.8 3.9
December
14,806 36,113 488.8 3.3 Year
179,201 437,082 5,916 3.3
* based on total plant natural gas usage
The total annual water and energy savings of 436,000 gallons and 5,900 MMBtus based on historical natural gas usage translate into annual savings of $41,235 based $5/MMBtu natural gas for an 80% efficient boiler and $10 per 1,000 gallons of purchased and conditioned water. Based on these results, the estimated payback value is 11.8 years. When the project was first initiated natural gas was priced at $10/MMBtu and the payback value would be 6.2 years. The goal of the project was to demonstrate and deploy the Ultramizer technology on commercial and industrial boilers in the 10 to 50 MMBtu/hr range to assist Minnesota gas utilities meet their energy conservation goals. Through market acceptance of the technology the team envisions improved payback.
Feedback from the Host Site The following feedback on the project was provided Mr. Shane Menefee, director of environmental affairs at Michael Foods:
“We have a long-standing relationship with CenterPoint Energy [the Minnesota utility that provides natural gas service to Northern Star and other Michael Foods processing facilities]. We have worked with them over the years in looking at energy reduction opportunities and we’re interested in any opportunity that furthers those efforts. The food processing industry is very water-intensive, and any way that we can find to reduce our water consumption—or reuse

Advanced Heat Recovery Deployment COMM-55870 | November 15, 2016 GTI 61 | P a g e
water—is every attractive. This technology provides more benefits over existing economizer technology and is more efficient from an energy conservation perspective.”
“The Ultramizer system is also engineered to be easily integrated with existing boiler and production operations. We like the idea of the technology. Because it wasn’t tied directly to our boiler, we didn’t have to worry about production interruptions. It was very critical for us to maintain the ability to keep our production schedule and [the addition of the Ultramizer system] did not impact it. It was either going to function and reduce our energy consumption or it could just be disconnected.”
“And, even though the results of the demonstration at Northern Star indicated a payback of 10 years based on current natural gas prices, the future will bring improvements in the cost picture. While the financial benefits of the water and energy savings are important to us, we also consider greenhouse gas emission reduction and overall resource conservation to be important.”

Advanced Heat Recovery Deployment COMM-55870 | November 15, 2016 GTI 62 | P a g e
Conclusions and Recommendations The Ultramizer® technology was successfully demonstrated on a 1,000 HP boiler at Michael Foods’ Northern Star Potato plant in Chaska, Minnesota to simultaneously capture waste heat and water vapor in the boiler exhaust gases. The measured values can be considered on the low end because the host boiler was already equipped with a high temperature economizer. Based on the boiler schedule, the Ultramizer operated about 86.5% of the time, recovering an estimated 436,000 gallons of water and 5,900 MMBtus of energy annually. The energy recovery represents 3.7% of the historical natural gas energy used at the plant. Based on these results, the estimated payback value is 11.8 years. When the project was first initiated natural gas was priced at $10/MMBtu and the payback value would be 6.2 years. The goal of the project was to demonstrate and deploy the Ultramizer technology on commercial and industrial boilers in the 10 to 50 MMBtu/hr range to assist Minnesota gas utilities meet their energy conservation goals. Through market acceptance of the technology the team envisions improved payback.
Based on extensive field experience with the TMC technology, the breakage of a number of porous membrane tubes and the build-up of soot on tube bundles encountered during December 2015 is believed to have been caused by the lack of a make-up air fan on the boiler house creating back draft conditions. This situation is not usually encountered in typical boiler applications, and is believed to have caused fuel-rich combustion conditions forming soot when the boiler was operating and back-flow of cold outdoor winter air thorough the Ultramizer freezing residual water and breaking tubes when the boiler was off.
The demonstration test results confirm market potential for the technology for boilers that have 50% or higher makeup water demand, even those that are already equipped with non-condensing economizers like the installation demonstrated in this study.
Table 5 shows the estimated energy savings revised from the values presented in the proposal. The number of boilers was increased by 13.6% from the original estimate in the proposal based on the Phase 1 market study and the most likely savings estimate per instance was increased from 11.2 to 14.8 BBtu to match the demonstration test results. The discrete instance definition as a 24 MMBtu/hr natural gas fired boiler was retained as was the high savings estimate representing boilers with no heat recovery and over 50% make-up water demand. The most likely number of instances were estimated using Payback Acceptance curves developed by Navigant1, and percent of maximum penetration at 10 years for an innovative technology using the Bass Diffusion Model2. The low number of instances is 50% of the likely value and the high number of instances is 125% of the likely value resulting from changes in economic conditions, gas prices, and energy efficiency incentives.

Advanced Heat Recovery Deployment COMM-55870 | November 15, 2016 GTI 63 | P a g e
Table 5: Savings Estimates from Original Proposal
SAVINGS ESTIMATE GRID
Range for Total Number of
Discrete Instances
Low Savings Estimate per
Instance
Most Likely Savings
Estimate per Instance
High Savings
Estimate per Instance
▼ (BBtu) (BBtu) (BBtu) Range of Savings Estimate per Discrete Instance ►
7.4 14.8 18.5
Low Estimate of Total Number of Instances 95 703 1,406 1,758
Most Likely Estimate of Total Number of Instances
190 1,406 2,812 3,515
High Estimate of Total Number of Instances 238 1,761 3,522 4,403

Advanced Heat Recovery Deployment COMM-55870 | November 15, 2016 GTI 64 | P a g e
References 1. Minnesota Gas Energy Efficiency Potential, Final Report, Page 104, March 2009,
Navigant Consulting 2. Predicting the Speed of Technology Introduction, Dr. Jordi Robert-Ribes,
(http://jordi.pro/bass/index.php)