advanced membrane technologies stanford … membrane technologies stanford university, may 07, 2008...
TRANSCRIPT

Advanced Membrane TechnologiesStanford University, May 07, 2008Advanced Membrane TechnologiesStanford University, May 07, 2008
Membrane Types and Factors Affecting
Membrane Performance
Mark Wilf, Ph.D.Tetra Tech

Outline
Membrane filtration (low pressure applications)
•Membrane materials and modules configuration
•Modes of operation
•Relevant R&R directions
Reverse osmosis and NF membranes (high pressure
applications)
•Membrane materials and modules configuration
•Modes of operation
•Relevant R&D directions

Membrane filtration

um
A
RELATIVE
SIZE OF
COMMON
MATERIALS
MOLECULARWEIGHT
0.001
10
0.01
100
0.1
1000
1.0
10 4
10
10 5
100 1000
10 6 10 7
100 200 5,000 20,000 100,000 500,000
Aqueous salts
Metal ions
Sugars
FILTRATION
TECHNO-
LOGY
Pyrogens
Virus
Colloidal silica
Albumin protein
Bacteria
Carbon black Paint pigment
Yeast cells
Milled flour
Beach sand
Pollens
Reverse Osmosis and NFReverse Osmosis and NF
UltrafiltrationUltrafiltration
MicrofiltrationMicrofiltration
ParticleParticle filtrationfiltration
THE FILTRATION SPECTRUMTHE FILTRATION SPECTRUM

UF/MF terms
TMP – trans membrane pressure
TMP = (Pf + Pc)/2 – Pp
Pf = feed pressure
Pc = concentrate pressure
Pp = permeate pressure
SP – specific permeability
SP = Q/(Am * TMP)
Q – filtrate flow rate
Am – membrane area

MWCO Determination. Feed Pressure 1 bar (15 psi)
0
20
40
60
80
100
1.E+03 1.E+04 1.E+05 1.E+06 1.E+07
Molecular weight, Daltons
Rejection [%
]90% rejection for 200,000 MW

Commercial MF/UF membrane material
CA – Cellulose acetate
PS – polysulfone
PES – Polyether sulfone
PAN – Polyacrilonitrile
PVDF – Polyvinylidiene flouride
PP – Polypropylene
PE – Polyethylene
PVC – Polyvinyl chloride

Important membrane material property
High porosity
Narrow pore distribution or sharp MWCO
High polymer strength: elongation, high burst and
collapse pressure
Good polymer flexibility
Permanent hydrophilic character
Wide range of pH stability
Good chlorine tolerance
Low cost
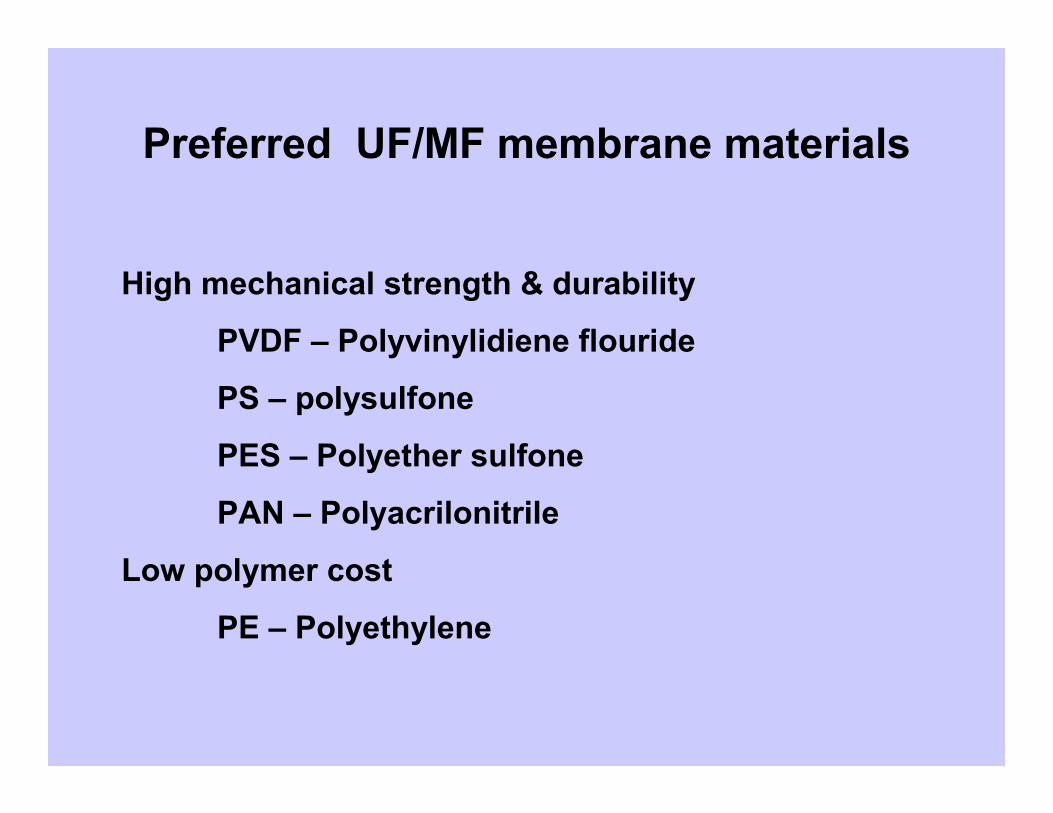
Preferred UF/MF membrane materials
High mechanical strength & durability
PVDF – Polyvinylidiene flouride
PS – polysulfone
PES – Polyether sulfone
PAN – Polyacrilonitrile
Low polymer cost
PE – Polyethylene

Membrane manufacturing and
configuration
Spinning – capillary
Casting – flat sheet
Extrusion and stretching – capillary, flat sheet
Thermally induced phase separation (TIPS)
Supported, unsupported membranes
Hollow fibers modules, spiral modules, plate and
frame modules, other configurations

Bore liquid
reservoir
Pump
Polymer dope reservoir
Gear pump
Spinneret
Spinneret detail
Coagulation bath Rinse bath
collection drum
Polymer dope Bore liquid
Capillary membrane manufacturing process


PRESSURE DRIVEN CAPILLARY
TECHNOLOGY

Pressure driven membrane cross section
inside – out operation
Separating
Layer
Outside
LumenLumenLumenLumen
(Feed)(Feed)(Feed)(Feed)
FiltrationFiltrationFiltrationFiltration
Flow PathFlow PathFlow PathFlow Path

Separating
Layer
Outside
(Feed)
LumenLumenLumenLumen
(Filtrate)(Filtrate)(Filtrate)(Filtrate)
Filtration Filtration Filtration Filtration
flow flow flow flow
directiondirectiondirectiondirection
Pressure driven membrane cross section
outside – in operation

Potting Resin
Feed
Filtrate
Core Tube
Filtrate
Concentrate
End Cap
•Quick release end cap
•Integral connection with filtrate core tube
•100% Hydraulic sealing
•Maximize membrane area
•Light weight & streamlined design
Configuration of pressure driven, capillary membrane module

0.8 mm fibre 1.2 mm fibreHYDRAcap 40: 30 m2 (320 ft2) 19 m2 (200 ft2)
HYDRAcap 60: 46 m2 (500 ft2) 30 m2 (320 ft2)
Example of pressure driven membrane module

TMP = (Pf + Pc)/2 – Pp
SP = Q/(Am * TMP)
Example of permeability results
219 (8.9)750 (29)SP, l/m2-hr (gfd/psi)
46.5 (500)46.5 (500)Am, m2 (ft2)
5,100 (32,300)3,500 (22,000)Q, l/hr (gpd)
0.50 (7.2)0.10 (1.5)TMP, bar (psi)
0.15 (2.2)0.10 (1.5)Pp, bar (psi)
0.60 (8.5)0.15 (2.2)Pc, bar (psi)
0.70 (10.1)0.25 (3.6)Pf, bar (psi)
Field
conditions
New
membrane
Test parameter

Integrity test procedure
(ASTM D6908-03)
Off line tests
• Bubble point test
• Pressure hold test
• Diffusive air flow test
• Vacuum hold test
Continuous (on line) tests
• Particle passage counting/monitoring
• Marked particles passage
• Turbidity measurements
• Acoustic sensing

Integrity test procedure
pressure or vacuum hold
Pressure decay rate (PDR)
PDR = (Pi-Pf)/t
Pi – initial pressure
Pf – final pressure
t – time interval
PDR = PDR (measured) – rate of diffusion
Vacuum decay rate (VDR)
VDR = VDR (measured) – rate of diffusion

Integrity test sequence
HYDRABLOC™ Pressure Decay Rates with One
Broken Fiber
0
2
4
6
8
10
12
0 2 4 6 8 10 12
Pressure Decay T ime, minutes
Pressure, psi
0
0.1
0.2
0.3
0.4
0.5
0.6
0.7
0.8
Pressure, bar
10xHYDRAcap60 24xHYDRAcap60
20xHYDRAcap60 48xHYDRAcap60
Diffusion Only (No Breaks) Single Module

Schematics of pressure driven capillary unit

PRESSURE DRIVEN CAPILLARY SYSTEM
Every 1 – 7 days20 minVerification of
membrane
integrity
Integrity test
Every 1 – 6
months
2 – 4 hrFoulants
removal
Cleaning in
place
Once – twice a
day
1 – 15 minFoulanlts
removal
Chemicals
enhanced
backwash
(CEB)
Every 15 – 60
min
30 – 60 secFoulants
removals
Backwash
Continuous15 – 60 minPermeate
production
Forward flow
FrequencyDurationObjectiveProcess step

Isometric GA of HYDRAbloc 2D1288
Pressurized UF train ~ 2MGD filtrate flow

Separating
Layer
Outside
(Feed)
LumenLumenLumenLumen
(Filtrate)(Filtrate)(Filtrate)(Filtrate)
Filtration Filtration Filtration Filtration
flow flow flow flow
directiondirectiondirectiondirection
Vacuum driven membrane cross section
outside – in operation

CEB1 CEB2 CEB3
Air blower
Vacuum pump
Backwas
h pump
Filtrate
pump
CIP1 CIP2
Strainer 100 m
Filtrate
storage &
backwash
tank
Cleaning chemicals Backwash chemicals
Schematics of vacuum driven capillary unit

VACUUM DRIVEN CAPILLARY SYSTEM
Every 1 – 7 days20 minVerification of
membrane
integrity
Integrity test
Every 1 – 6
months
2 – 5 hrFoulants
removal
Cleaning in
place
Twice a day –
once per week
1 – 15 minFoulanlts
removal
Chemicals
enhanced
backwash
(CEB)
Every 15 – 60
min
15 – 60 secFoulants
removals
Backwash &
tank
deconcentration
Continuous15 – 60 minPermeate
production
Permeation
FrequencyDurationObjectiveProcess step

ZeeWeedZeeWeed®® 1000 Cassette1000 Cassette
for lower solids for lower solids
applications applications
Cassette capacity
1,500-2,000 m3/d

Submersible membrane train configuration

ZeeWeed® 500
Cassette for High
Solids Applications
Cassette capacity750 - 1,000 m3/d in MBR
2,500 - 3,500 m3/d in water
filtration

85 – 92 42 – 70 (25 – 40)Seawater
filtration
85 – 92 34 – 85 (20 – 50) Tertiary filtration
90 – 97 60 – 130 (35 – 75) Potable water
Recovery rate
range, %
Flux rate range,
l/m2-hr (gfd)
Application

Membrane filtration – commercial
products

Aquasource
CA
High hydrophilic, very
wettable
Pore size 0.01 µm
35 to100kD
Fibre id 0.93 mm
Cl2 resistance quite high
pH tolerance 3.5 – 8.5
Membrane materials
Modified PS
Moderately hydrophilic,
wettable
Pore size 0.01 µm
35 to100kD
Fibre id 0.96 mm
Cl2 resistance quite high
pH tolerance 1 – 13


Inge
Membrane
•Modified PES
•Moderately hydrophilic, easily wettable
• Pore size; UF 10 - 25 nm
• Fibre id, 0.9 mm; od 4.3 mm
• Cl2 resistance moderately high
• pH tolerance 1.5 - 13

Multibore MembraneMembrane
• 7 single capillaries combined into one fiber
• PES blended with a strong, hydrophilic polymer
• asymmetric membrane formed from polymer blend
• regular foam structure as active layer support
• burst pressure > 13 bar (190 psi)

Norit
Membrane• PES/PVP
• Hydrophilic, easily wettable
• Pore size; UF 20 - 25 nm
• Fibre id, 0.8 mm (1.5 mm); od 1.3 mm (2.5 mm)
• Cl2 resistance moderately high
• pH tolerance 1.5 – 13
•Module diameter – 200 mm
•Membrane area – 40 m2

Norit – UF train 7000m3/day (1.9 mgd)

Memcor (Siemens) submersible – CMF S

Memcor (Siemens) pressurized – CP

Membrane Fouling in Wastewater
Reclamation
• Fouling Processes
– Organic Adsorption
– Colloidal Material
– Biogrowth
– Scaling

100
150
200
250
300
350
400Feed pressure, psi
0
1
2
3
4
5
Energ
y use kwhr/kgallon
Energy
Pressure
Energy
Pressure
Conventional
pretreatment
Membrane
pretreatment
Effect of pretreatment on operating parameters in
wastewater reclamation systems

FeCl3
Cl2
RO wastewater reclamation with membrane pretreatment
Cl2
Acid and/or
SI
Wastewater
treatment plant
Secondary
effluent
CO2

Orange County, CA GWR System
• 86 MGD MF System
• 70 MGD RO System
• 70 MGD UV System
• MF System
– Recovery: 90%
– 0.2 micron pore
• RO System
– Recovery: 80% - 85%
– 5 mgd per train
– Flux rate: 12 gfd
• UV System
– Low Pressure/High Output
– 8 trains with 3 vessels per train
– Hydrogen
peroxide
MF ROBarrier
Recharge
Basins
Backwash/
Waste to
Head of
Plant
Concentrate
Secondary
Effluent
Ocean
Outfall
AOP

Iron/Alum for
P reduction
Denitrification
DO < 0.2
Nitrification
DO > 2.0
RecirculationSludge
disposal
Filtrate
Raw
sewage Aerated anoxic
0.2 < DO < 0.8
Nitrogen and phosphorus reduction process
(three stages)

A Basic MBR Production Train
• 1.Biological reactor
• 2.Membranes
• 3.Permeate pump &
• air blower
• 4. Control panel
• 5. Permeate & air
• piping
1
2
43
5

R&D directions – membrane filtration
• Lower cost of membrane products
• Reduction of energy requirement
• Permanent hydrophilic membranes
• Reduction of fouling tendency
• Easy identification of integrity breach
• Simplified system configuration
• Replacement of chemical membrane
cleaning with biological processes

Desalination

Energy usage in desalination processes
0
2
4
6
8
10
12
14
16
18
20
MSF MED VC SWRO BWRO WW
RECL
Energy, kwhr/m3
Evaporation Reverse Osmosis
MSF – Multistage flash, MED – Multieffect distillation, VC – Vapor compression,
SWRO – Sea water RO, BWRO – Brackish water RO, WWRECL- Wastewater reclamation

COMMERCIAL MEMBRANES AND
MEMBRANE MODULE
CONFIGURATIONS

N HC
O
C
O
NH
C O
NH
O
O O
O
O
O
C
C
C
C
C
C
C
O
O
O
H
H
H
H
H H
H
3
3
3
2
Chemical structure of cellulose triacetate (A) and polyamide (B)
membrane material
A
B
H H

Support fabric
Trough with polymer solution
Finished polysulfone UF
membrane
Manufacturing process of polysulfone membrane support

Polysulfone
membrane
Amine solution
TMC
solution
Amine rinse bath
Oven
PA membrane
Manufacturing process of polyamide membrane barrier on polysulfone
support

Semipermeablemembrane layer~2000 Angstrom
Microporouspolymeric support
Fabric backing
0.2 mm0.008"

Fabric backingPolymeric supportPA membrane surface

0.0
1.0
2.0
3.0
4.0
5.0
6.0
7.0
8.0
9.0
1969 1975 1982 1982 1990 1995 2004 2006
Spec. flux, l/m
2-h
r-bar & salt p
assage, %
Spec flux
Salt Pass
Cellulose
acetate
Polyamide
Evolution of performance of brackish membranes

0.0
0.2
0.4
0.6
0.8
1.0
1.2
1.4
1.6
1978 1986 1990 1994 1995 1998 2004 2006
Spec. flux, l/m2-h
r-bar & salt passage, %
Spec flux
Salt Pass
CA PA
Evolution of performance of seawater membranes
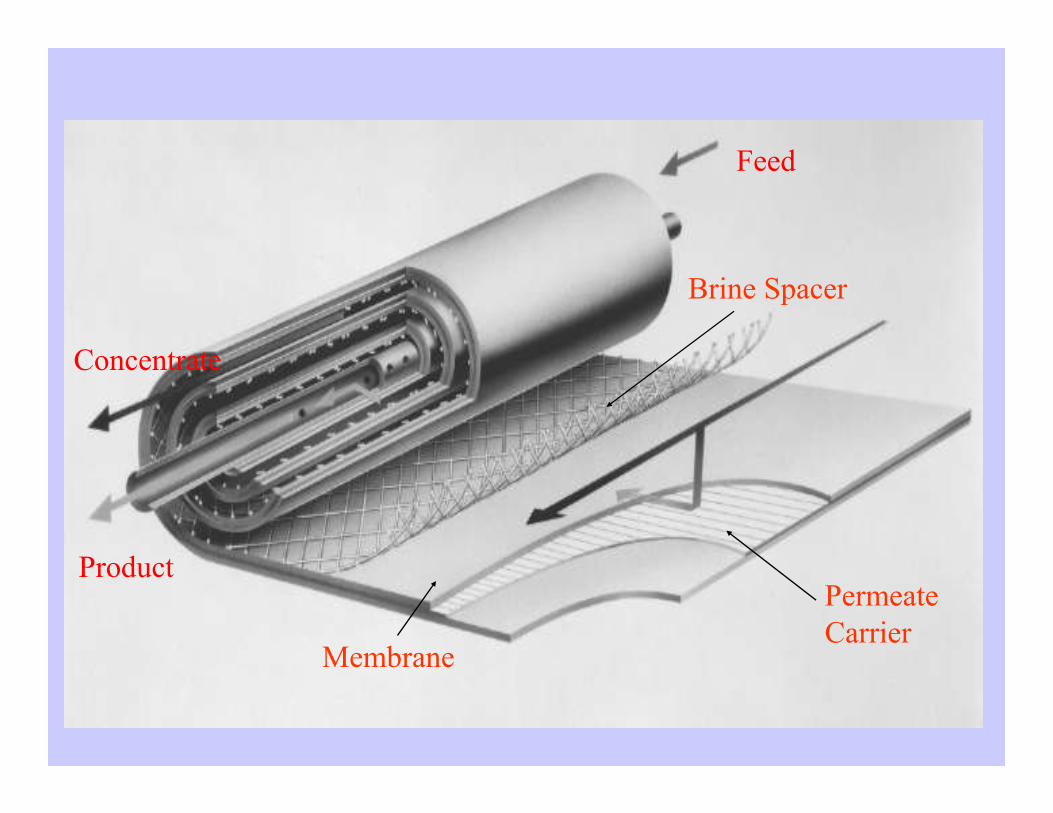
Feed
Concentrate
Product
Membrane
Permeate
Carrier
Brine Spacer

Feed channel
Feed spacer
configuration
0.7 mm (0.031”)
Configurations of feed channel and feed spacer net

Osmotic pressure is function
of concentration and temperature
56.1 bar
(813 psi)
48.8 bar
(708 psi)
24.5 bar
(355 psi)
13.2 bar
(191 psi)
3.2 bar
(46 psi)
ππππ@ 15C
(59 F)
59.0 bar
(856 psi)
51.3 bar
(744 psi)
25.7 bar
(372 psi)
13.9 bar
(201 psi)
3.3 bar
(48 psi)
ππππ@ 30C
(86 F)
80,00070,00035,00020,0005,000Salinity,
ppm TDS

RO TERMS
NDP - net driving pressure
Driving force of the water transport (flux)
through the membrane.
NDP = Pf - Pos - Pp - 0.5 ∗∗∗∗ Pd (+ Permos)
Pf - feed pressure
Pos – average feed osmotic pressure
Pp - permeate pressure
Pd - pressure drop across RO
element
Permos - permeate osmotic pressure

Seawater system: 40,000 ppm TDS, 50% recovery
20
30
40
50
60
70
0 1 2 3 4 5 6 7 8
Element position
Pressure, bar
Concentrate
pressure
Feed
pressure
Net driving
pressure
Osmotic
pressure

Concentration factor in RO system
0.0
2.0
4.0
6.0
8.0
10.0
12.0
0 20 40 60 80 100
Recovery rate, %
Concentration factor
Concentrate
Arithmetic
average
Logarithmic
average
CF = 1/(1-R)
CF = 0.5*(1+1/(1-R))
CF = ln(1/(1-R))/R

ions concentration
level in feed
Concentration polarization
Membrane

RO TERMS
TCF - temperature correction factor
Temperature affects water and salt
transport across the membrane,
approximately at the same magnitude.
The transport rate changes at about 3%
per degree C.
TCF = 1/exp(2700∗∗∗∗(1/(273+t)-1/298))
t – temperature C

RO TERMS
Water transport, Qw :
Qw = Kw ∗∗∗∗ A ∗∗∗∗ NDP ∗∗∗∗ TCF
Kw – water transport coefficient
A - membrane area
Salt transport, Qs :
Qs = Ks ∗∗∗∗ A ∗∗∗∗ ∆∆∆∆C ∗∗∗∗ TCF
Ks – salt transport coefficient
∆∆∆∆C - salt concentration gradient

RO TERMS
Permeate salinity
Cp ∝∝∝∝ Qs/Qw
= Ks ∗∗∗∗ A ∗∗∗∗ ∆∆∆∆C ∗∗∗∗ TCF/ Kw ∗∗∗∗ A ∗∗∗∗ NDP ∗∗∗∗ TCF
= Ks ∗∗∗∗ ∆∆∆∆C / Kw ∗∗∗∗ NDP
∆∆∆∆C ∝ ∝ ∝ ∝ recovery rate
NDP ∝ ∝ ∝ ∝ feed pressure

8” and 16” diameter elements
8” element
Membrane area
40m2 (430 ft2)
Nominal flow
45 m3/day
(12,000 gpd)
Avg. field flow
19 m3/day
(5,000 gpd)
16” element
Membrane area
140 m2 (1,500 ft2)
Nominal flow
155 m3/day
(41,000 gpd)
Avg. field flow
68 m3/day
(18,000 gpd)

Permeate flow per vessel at an average
permeate flux rate of 20.4 l/m2-hr (12 GFD)
477 m3/day
(126,000 GPD)
136 m3/day
(36,000 GPD)
127 m3/day
(33,600 GPD)
7
545 m3/day
(144,000 GPD)
156 m3/day
(41,300 GPD)
145 m3/day
(38,400 GPD)
8
117 m3/day
(31,000 GPD)
8 – 40 m2/el.
(430 ft2/el.)
408 m3/day
(108,000 GPD)
109 m3/day
(28,800 GPD)
6
340 m3/day
(90,000 GPD)
5
272 m3/day
(72,000 GPD)
4
16” – 140 m2/el.
(1,500 ft2/el.)
8’ – 37 m2/el.
(400 ft2/el.)
Elements
per vessel

Water flow in a pressure vessel assembly
10 m3/hr (44 gpm)
feed5 m3/hr (22 gpm)
permeate
5 m3/hr (22 gpm)
concentrate

Two Stage RO System
PG
PG
Pressure vessel,
1st stage
Pressure vessel,
1st stage
Pressure vessel,
1st stage
Pressure vessel,
1st stage
Pressure vessel,
2nd stage
Pressure vessel,
2nd stage
Concentrate
Permeate
Feed
FI
FI

Two-stage brackish unit, 32:14 (7M) array
4.0 X 2.9 X 8 m, 8000 m3/d
13.1 X 9.5 X 26’, 2.1 mgd Feed manifold
Concentrate manifold
Permeate manifold
Permeate sampling panel
Local display panel

RO membrane categories
Nanofiltration for color removal
Nanofiltration for sulfate reduction
Nanofiltration for hardness reduction
Low pressure brackish RO
High rejection brackish RO
Low pressure seawater RO
High rejection seawater RO

1.7 (1.0)1.3 (0.8)11.1 (6.5)6.6 (3.9)17.4 (10.2)Relative salt transport:
salt passage∗∗∗∗flux rate
15.7
(0.63)
11.9
(0.48)
8.7 (0.35)7.2 (0.29)7.7 (0.31)Permeability, l/m2-hr-
bar (gfd/psi)
55.9
(32.9)
42.5
(25.0)
24.7
(14.5)
33.2
(19.5)
34.8 (20.5)Test flux rate, l/m2-hr
(gfd)
97.097.055.080.050.0Salt rejection,
47.3
(12,500)
37.9
(10,000)
21.9
(5,800)
29.5
(7,800)
31.0
(8,200)
Permeate flow, m3/d
(gpd)
37.1 (400)37.1 (400)37.1 (400)37.1 (400)37.1 (400)Membrane area, m2 (ft2)
NF-270NF-90SU620FESNA-LFHydracoreElement model
Commercial offering of nanofiltration RO membrane
modules

0.344
(0.202)
0.491
(0.289)
0.218
(0.128)
0.308
(0.181)
0.261
(0.153)
Relative salt transport:
salt passage∗∗∗∗flux rate
6.0 (0.24)7.7 (0.31)6.2 (0.25)8.2 (0.33)5.0(0.20)Permeability, l/m2-hr-bar
(gfd/psi)
49.1
(28.9)
49.1
(28.9)
43.5
(25.6)
51.3
(30.2)
43.5
(25.6)
Test flux rate, l/m2-hr
(gfd)
99.3099.099.5099.6099.60Salt rejection,
48.1
(12,700)
48.1
(12,700)
41.6
(11,000)
49.2
(13,000)
41.6
(11,000)
Permeate flow, m3/d
(gpd)
40.9 (440)40.9
(440)
40.0 (430)40.0 (430)40.0 (430)Membrane area, m2 (ft2)
BW30 LE-
440
BW30-
XLE440
TMG20-
430
ESPA4+ESPA2+Element model
Commercial offering of brackish RO membrane modules

0.114
(0.067)
0.078
(0.046)
0.069
(0.041)
0.076
(0.045)
0.055
(0.032)
Relative salt transport:
salt passage∗∗∗∗flux rate
1.5 (0.06)1.2 (0.05)1.0 (0.04)1.5 (0.06)1.0 (0.04)Permeability, l/m2-hr-
bar (gfd/psi)
38.2 (22.5)31.3 (18.4)27.6 (16.3)38.2 (22.5)27.6
(16.3)
Test flux rate, l/m2-hr
(gfd)
99.7099.7599.7599.8099.80Salt rejection,
34.1(9,000)26.5 (7,000)24.6 (6,500)34.1
(9,000)
24.6
(6,500)
Permeate flow, m3/d
(gpd)
37.1 (400)37.1 (400)37.1 (400)37.1 (400)37.1 (400)Membrane area, m2
(ft2)
SW30HR-
XLE
SW30HR-
LE
TM820-400SWC5SWC4+Element model
Commercial offering of seawater RO membrane modules

SPECIAL NANOFILTRATION
MEMBRANE
(HYDRACORE)

HYDRACoRe
• Nanofiltration for color removal
• 1000 MWCO
• 50% salt rejection, minimizes product
water instability and need for post
treatment
• 8,200 gpd for a 365 sq ft element
• Chlorine tolerant

Surface of HydraCoRe at
4000 X magnificationTypical Interfacial
Polyamide RO Membrane
HydraCoRe Membrane

HydraCoRe ion rejection
Anion
Cation
A- A2-
Cl SO4
Molecular
Weight
35 96
M+ Na 23 50% 90%
M2+ Mg 24 20% 35%
Ca 40 12% -

Orange County Groundwater Basin Orange County Groundwater Basin
CrossCross--SectionSection

Irvine Ranch Project – membrane elements
testing
0.48 (11.9)0.43 (10.7)Specific flux
gfd/psi (l/m3-hr-bar)
0.28.513Calcium mg/L
48350500Conductivity uS/cm
<5<5200Color , CU
Conventional
Nanofiltration
permeate
HydraCoRe
permeate
FeedParameter

Irvine Ranch Plant hydraulics
Permeate – 28,000 m3/day (7.35 MGD), Concentrate – 2400
m3/day (0.64 MGD), Recovery – 92%
102 m3/hr
(450 gpm)
1,160 m3/hr
(5,100 gpm)

Irvine Ranch Plant concentrate flow reduction
Permeate – 30,000 m3/day (7.90 MGD), Concentrate – 600 m3/day
(0.16 MGD), Recovery – 98%
25 m3/hr
(111 gpm)
1,330 m3/hr
(5,485 gpm)
R = 85%
R = 92%

Feed Permeate Concentrate
Irvine Ranch NF Plant: Feed, Permeate
and Concentrate Samples

B(OH)3 (aq) + H2O H+(aq) +B(OH)4- (aq)
High water pH shifts equilibrium to the right
Low water pH shifts equilibrium to the left

Seawater RO system. Recovery rate 50%.
Boron concentration in feed 5.0 ppm
1.122788.0
1.326747.5
1.530707.0
1.530706.5
Boron in permeate,
ppm
Boron passage, %Boron rejection, %Feed pH

Brackish RO system. Recovery rate 85%.
Boron concentration in feed 2.0 ppm
55
55
55
55
Boron in
passage, %
1.11.9958.0
1.11.9957.5
1.11.9957.0
1.11.9956.5
Boron in
permeate, ppm
Boron in
permeate, ppm
Boron passage,
%
Feed pH
Brackish membranes Seawater membranes

Boron species distribution at 25 C
0.0
0.1
0.2
0.3
0.4
0.5
0.6
0.7
0.8
0.9
1.0
6 7 8 9 10 11 12
pH of solution
Fra
ction o
f B(O
H)4
-
Low salinity
Seawater
Concentrate

Second pass RO system. Recovery rate
90%. Boron concentration in feed 1.4 ppm
0.2138310.4
0.4287210.0
0.752489.5
1.070309.0
Boron in permeate,
ppm
Boron passage, %Boron rejection, %Feed pH

Single pass system with pH adjustment of the 1st pass
feed
100
50
50
NaOH
pH = 7.5 - 8.6
B = 5.0 ppm
pH = 10.4
B = < 1.0 ppm
Pass 1
Rec. = 50%
Seawater RO. Combined recovery rate 50%
Scale
inhibitor

R&D directions – reverse osmosis
• Selective rejection of dissolved species
• Higher boron rejection
• Increased water permeability without
increasing solute transport
• Reduction of fouling tendency
• Control of biofouling in seawater systems
• Replacement of chemical membrane
cleaning with biological processes
• Reduction of scaling tendency in brackish
RO processes