advanced multi-product coal utilization by-product processing plant...
TRANSCRIPT

Advanced Multi-Product Coal Utilization By-Product Processing Plant
Technical Progress Report for the Period : 1 July 2005 to 31 September 2005
Principal Authors: John Groppo and Thomas Robl
October 2005
U. S. Department of Energy Cooperative Agreement No. DE-FC26-03NT410781
Center for Applied Energy Research 2540 Research Park Drive
University of Kentucky Lexington, KY 40511

DISCLAIMER
This report was prepared as an account of work sponsored by an agency of the United States Government. Neither the United States Government nor any agency thereof, nor any employees, makes any warranty, expressed or implied, or assumes any legal liability or responsibility for the accuracy, completeness, or usefulness of any information, apparatus, product, or process disclosed, or represents that its use would not infringe privately owned rights. Reference herein to any specific commercial product, process, or service by trade name, trademark, manufacturer, or otherwise does not necessarily constitute or imply its endorsement, recommendation, or favoring by the United States Government or any agency thereof. The views and opinions of the authors expressed herein do not necessarily state or reflect that of those of the United States Government or any agency thereof.

ABSTRACT
The objective of the project is to build a multi-product ash beneficiation plant at Kentucky Utilities 2,200-MW Ghent Generating Station, located in Carroll County, Kentucky. This part of the study includes an investigation of the primary classification characteristics of the ash feedstock excavated from the lower ash pond at Ghent Station. The classification testing was conducted using a continuous demonstration-scale primary classifier that was operated at a production rate of 1 to 6 tons/hr. Samples were taken while the classifier was operated under a variety of conditions in order to determine the range of conditions were the unit could be efficiently operated. Although good classification results were achieved under a variety of operating conditions, coarse rejection efficiency decreased with increasing feed rate. It was determined that the maximum feed rate to the primary classifier for efficient classification should be 50 gpm of slurry at 15% solids with a throughput of 2.3 tons/hr.
Froth flotation was evaluated to reduce the primary classifier overflow to below 3.0% LOI. A variety of flotation conditions were evaluated and it was determined that a minimum retention time of 6 minutes was necessary with a collector dosage of 1.2 lbs/ton and a frother dosage of 0.2 lbs/ton. These conditions produced a tailings product with 2.3% LOI at a reagent cost of 0.65 $/ton of flotation feed.
TABLE OF CONTENTS
Section Page No. Disclaimer…………………………………………………………………………………2 Abstract……………………………………………………………………………………3 List of Figures………………………………………………………………......................5 Executive Summary……………………………………………………………………….6 Introduction………………………………………………………………..........................7 Field Demnstration Testing..……………………………………………………………... 7
Primary Classification …………………………………………………….….… 7 Flotation Testing …….…………………………………………………………..14 Conclusions………………………………………………………………………………23

LIST OF FIGURES Figure 1. Equipment Layout for Slurry Preparation and Primary Classification .……… 8 Figure 2. Effect of Feed Rate on Primary Classification at 11.5% Feed Solids.….……. 9 Figure 3. Effect of Feed Rate on Primary Classification at 17.5% Feed Solids………..10 Figure 4. Effect of Feed Rate on Primary Classification at 25% Feed Solids ..……..…10 Figure 5. Effect of Feed Rate on Yield for Varying Feed Solids …...…..……………...11 Figure 6. Effect of Feed Rate on -5 micron Recovery for Varying Feed Solids…....…..11 Figure 7. Effect of Feed Rate +100 mesh Rejection for Varying Feed Solids………….12 Figure 8. Effect of Underflow Rate on Primary Classification at 11.5% Feed Solids.…13 Figure 9. Effect of Underflow Rate on Primary Classification at 17.5% Feed Solids.…13 Figure 10. Effect of Underflow Rate on Primary Classification at 25% Feed Solids .....14 Figure 11. Effect of Collector Dosage at 20 gpm Feed Rate .………………………….15 Figure 12. Effect of Frother Dosage at 20 gpm Feed Rate .….………………………...16 Figure 13. Effect of Collector Dosage at 30 gpm Feed Rate …………………………...16 Figure 14. Effect of Frother Dosage at 30 gpm Feed Rate .…………………………….17 Figure 15. Effect of Collector Dosage at 40 gpm Feed Rate ..…………………………17 Figure 16. Effect of Frother Dosage at 40 gpm Feed Rate……………....……………...18 Figure 17. Effect of Collector Dosage at 50 gpm Feed Rate .…………………………..18 Figure 18. Effect of Frother Dosage at 50 gpm Feed Rate ……………………………..19 Figure 19. Effect of Collector Dosage on Tailings Grade .……………………………..19 Figure 20. Effect of Frother Dosage on Tailings Grade ………………………………..20 Figure 21. Effect of Retention Time on Tailings Grade ………………………………..21 Figure 22. Effect of Reagent Cost on Tailings Grade ...………………………………..21 Figure 23. Release Analysis and Flotation Results ……………………………………..22

EXECUTIVE SUMMARY The project area is located in Carroll County, Kentucky, approximately one mile northeast of Ghent, Kentucky. The lower ash pond is situated immediately adjacent to U.S. Highway 42 on the southwest corner of the Ghent power plant site. Disposal of ash into the 120-acre pond began when the Ghent power plant became operational in 1973 and continued over a period of 20 years until the upper ash pond became operational in 1993. The Ghent power plant has four separate generating units. Units 1 and 2 burn a high sulfur coal and an Appalachian low sulfur compliance coal. Units 3 and 4 have multi-fuel burners and are fueled by a mixture of low sulfur subbituminous and bituminous coal. The coals burned within these units were subjected to major and trace elemental analyses, mercury analysis, and loss-on-ignition (LOI) tests. Approximately 150 tons of pond ash was excavated from the Ghent site and processed to remove coarse bottom ash and vegetation that could cause plugging problems in the pilot demonstration unit. The excavated ash was dry-screened at 3/8”; the -3/8” ash was stockpiled adjacent to the pilot demonstration unit while the +3/8” was returned to the pond for storage. Primary classification was shown to be effective for rejecting coarse (+100 mesh) material from the pond ash while maintaining high recovery of -100 mesh and particularly -5 µm ash. The classifier used was capable of efficiently providing this separation under a variety of feed rates and pulp densities, but +100 mesh rejection decreased with increasing feed rate. Operating the classifier at a feed rate of 40 to 50 gpm provided the primary classification desired to meet the project objectives Froth flotation was evaluated to reduce the LOI of the primary classifier overflow to below 3%. A minimum retention time of 6 minutes was required to provide LOI reduction to 2.5% LOI using 1.2 lbs/ton collector and 0.23 lbs/ton frother. Reagent costs to provide acceptable grade tailings were 0.50 to 1.00 $/ton of flotation feed and longer retention times did not provide any significant benefit in terms of performance. Demonstration plant flotation results were consistent with release analysis results, indicating that no further significant improvement in flotation performance could be expected with optimization of other variables.

INTRODUCTION
This project will complete the final design and construction of an ash beneficiation plant that will produce a variety of high quality products including pozzolan, mineral filler, fill sand, and carbon. All of the products from the plant are expected to have value and be marketable. The ash beneficiation process uses a combination of hydraulic classification, spiral concentration and separation, and froth flotation. The advanced coal ash beneficiation processing plant will be built at Kentucky Utility’s 2,200 MW Ghent Power Plant in Carrollton, Kentucky. The technology was developed at the University of Kentucky Center for Applied Energy Research (CAER) and is being commercialized by CEMEX Inc. with support from LG&E Energy, Inc., the UK CAER, and the U.S.DoE.
This technical report includes research that was conducted during the third quarter of 2005. The focus of the effort was on hydraulic classification and froth flotation. The hydraulic classification circuit was operated by generating a feed slurry comprised of feed ash from the pond that had been excavated and screened at 3/8 inch in order to remove vegetation (plant roots, weeds, etc.) and coarse bottom ash that could potentially plug pumps. The primary classifier was fed at a variety of feed rates, pulp densities and underflow withdrawal rates in order to determine the effect of these variables on operating performance. Samples were taken when the classifier was operating at steady-state conditions and analyzed to determine performance under the various operating conditions. All appropriate scale-up data was archived and will be presented in a later report.
Once the appropriate range of operating parameters for the primary classifier were determined, the classifier overflow (-100 mesh) was diverted to a bank of froth flotation cells for flotation evaluation. Flotation conditions (retention time, reagent addition rates, etc.) were varied and the cells were sampled at steady-state to determine the effectiveness of flotation for reducing the LOI of the classified slurry. Again, all appropriate scale-up data was archived and will be presented in a later report.
FIELD DEMONSTRATION TESTING Primary Classification Testing efforts focused on feed slurry preparation and primary classification. The equipment layout is shown in Figure 1. The feed for all testing was prepared as a slurry by transferring the -3/8” stockpiled ash into a 500 gallon primary mix tank with a conveyor that was fed by a Bobcat loader. The tank was filled with the appropriate amount of water and mixed by circulating with a centrifugal pump at a rate of 100 gpm. Once the desired pulp density was achieved, the contents of the primary mix tank were diverted to a second 500 gallon tank which served as the classification feed tank. As the slurry was transferred into the classification feed tank, it was passed across an oversize screen (6 mesh) to remove coarse ash and vegetation. The -6 mesh slurry was circulated by a centrifugal pump, again at a rate of 100 gpm, and agitated with a mechanical impeller.

Classification Feed Tank
Classification Feed Pump
Primary Classifier
Oversize
Screen
Primary Mix Tank
Centrifugal Pump
Figure 1. Equipment Layout for Slurry Preparation and Primary Classification. To conduct classification testing, feed slurry was diverted into the primary classifier at the desired rate which was monitored with an ultrasonic flowmeter. The feed slurry enters the primary classifier through a constant-head feed box in order to minimize fluctuations. The feed slurry enters near t he base of the primary classifier and impinges on an inclined plate to divert the particles upward. Fine particle and remain in suspension and overflow the device while coarse particles settle and are removed from the base of the classifier by a variable speed pump. To ensure feed consistency, preliminary tests were conducted by re-circulating the classifier products (overflow and underflow) back to the classification feed tank, so as to operate in a closed slurry loop. Tests were conducted by allowing the classifier to operate at the desired conditions for a minimum of 30 minutes, regularly checking the flow rate of each product stream (i.e., overflow, underflow and feed), and then obtaining representative samples of each product. Samples were returned to the laboratory where they were weighed, filtered and dried to determine percent solids and a detailed size distribution by a combination of screening and laser diffraction. During testing, an additional set of slurry samples were also taken in known volume containers to accurately determine the specific gravity of the slurry so that an accurate mass balance for each test could be calculated.
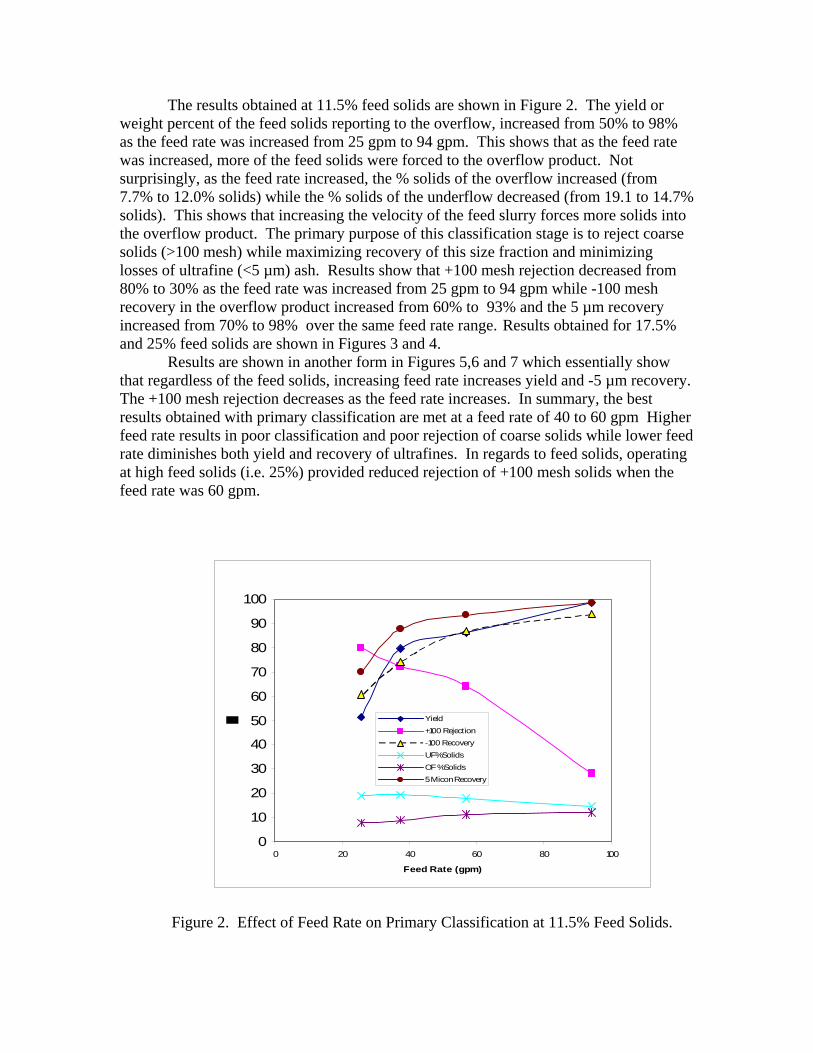
The results obtained at 11.5% feed solids are shown in Figure 2. The yield or weight percent of the feed solids reporting to the overflow, increased from 50% to 98% as the feed rate was increased from 25 gpm to 94 gpm. This shows that as the feed rate was increased, more of the feed solids were forced to the overflow product. Not surprisingly, as the feed rate increased, the % solids of the overflow increased (from 7.7% to 12.0% solids) while the % solids of the underflow decreased (from 19.1 to 14.7% solids). This shows that increasing the velocity of the feed slurry forces more solids into the overflow product. The primary purpose of this classification stage is to reject coarse solids (>100 mesh) while maximizing recovery of this size fraction and minimizing losses of ultrafine (<5 µm) ash. Results show that +100 mesh rejection decreased from 80% to 30% as the feed rate was increased from 25 gpm to 94 gpm while -100 mesh recovery in the overflow product increased from 60% to 93% and the 5 µm recovery increased from 70% to 98% over the same feed rate range. Results obtained for 17.5% and 25% feed solids are shown in Figures 3 and 4. Results are shown in another form in Figures 5,6 and 7 which essentially show that regardless of the feed solids, increasing feed rate increases yield and -5 µm recovery. The +100 mesh rejection decreases as the feed rate increases. In summary, the best results obtained with primary classification are met at a feed rate of 40 to 60 gpm Higher feed rate results in poor classification and poor rejection of coarse solids while lower feed rate diminishes both yield and recovery of ultrafines. In regards to feed solids, operating at high feed solids (i.e. 25%) provided reduced rejection of +100 mesh solids when the feed rate was 60 gpm.
0
10
20
30
40
50
60
70
80
90
100
0 20 40 60 80 100
Feed Rate (gpm)
Yield+100 Rejection-100 RecoveryUF% Solids OF % Solids5 Micon Recovery
Figure 2. Effect of Feed Rate on Primary Classification at 11.5% Feed Solids.

0
10
20
30
40
50
60
70
80
90
100
0 20 40 60 80 100
Feed Rate (gpm)
Yield+100 Rejection-100 RecoveryUF% Solids OF % Solids5 Micon Recovery
Figure 3. Effect of Feed Rate on Primary Classification at 17.5% Feed Solids.
0
10
20
30
40
50
60
70
80
90
100
0 20 40 60 80 100
Feed Rate (gpm)
Yield+100 Rejection-100 RecoveryUF% Solids OF % Solids5 Micon Recovery
Figure 4. Effect of Feed Rate on Primary Classification at 25% Feed Solids.

0
10
20
30
40
50
60
70
80
90
100
0 10 20 30 40 50 60 70 80 90 100
Feed Rate, gpm
5.0%11.5%17.5%25.0%
Yiel
d, %
Figure 5. Effect of Feed Rate on Yield for Varying Feed Solids.
0
10
20
30
40
50
60
70
80
90
100
0 10 20 30 40 50 60 70 80 90 100Feed Rate, gpm
11.5%17.5%25.0%
-5 m
icro
n R
ecov
ery,
%
Figure 6. Effect of Feed Rate on -5 micron Recovery for Varying Feed Solids.
0
10
20
30
40
50
60
70
80
90
100
0 20 40 60 80 100
Feed Rate, gpm
5.0%11.5%17.5%25.0%
+100
Mes
h Re
ject
ion,
%
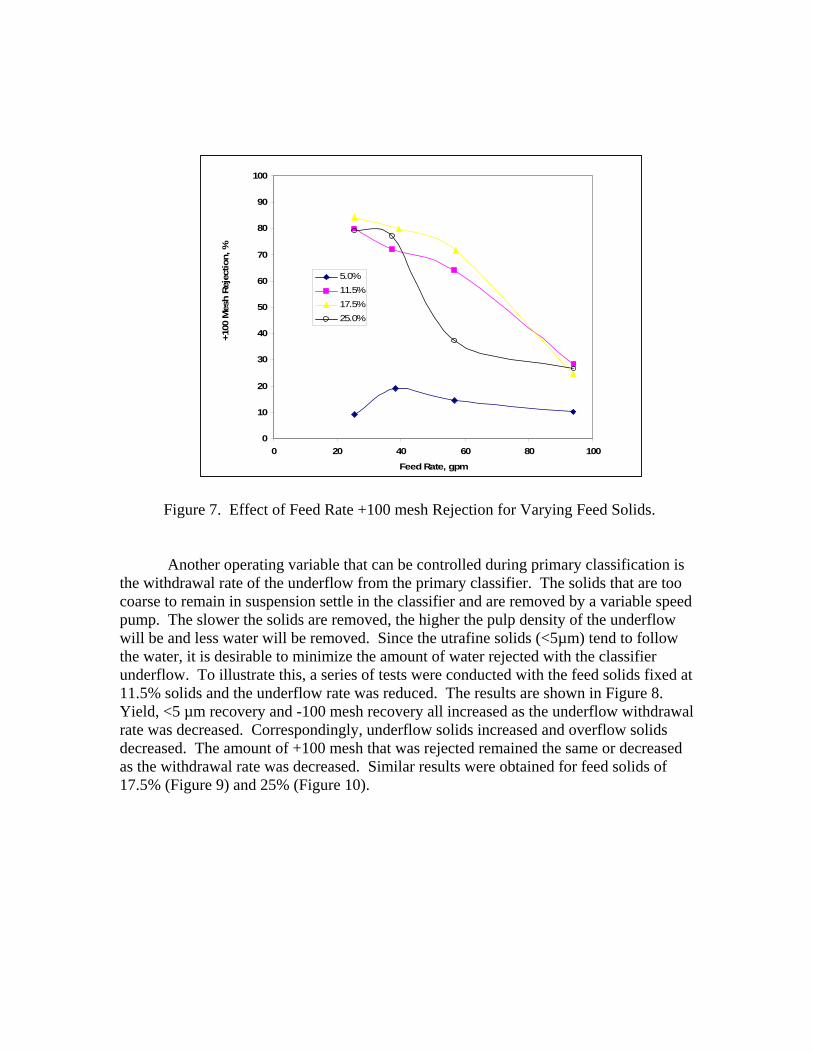
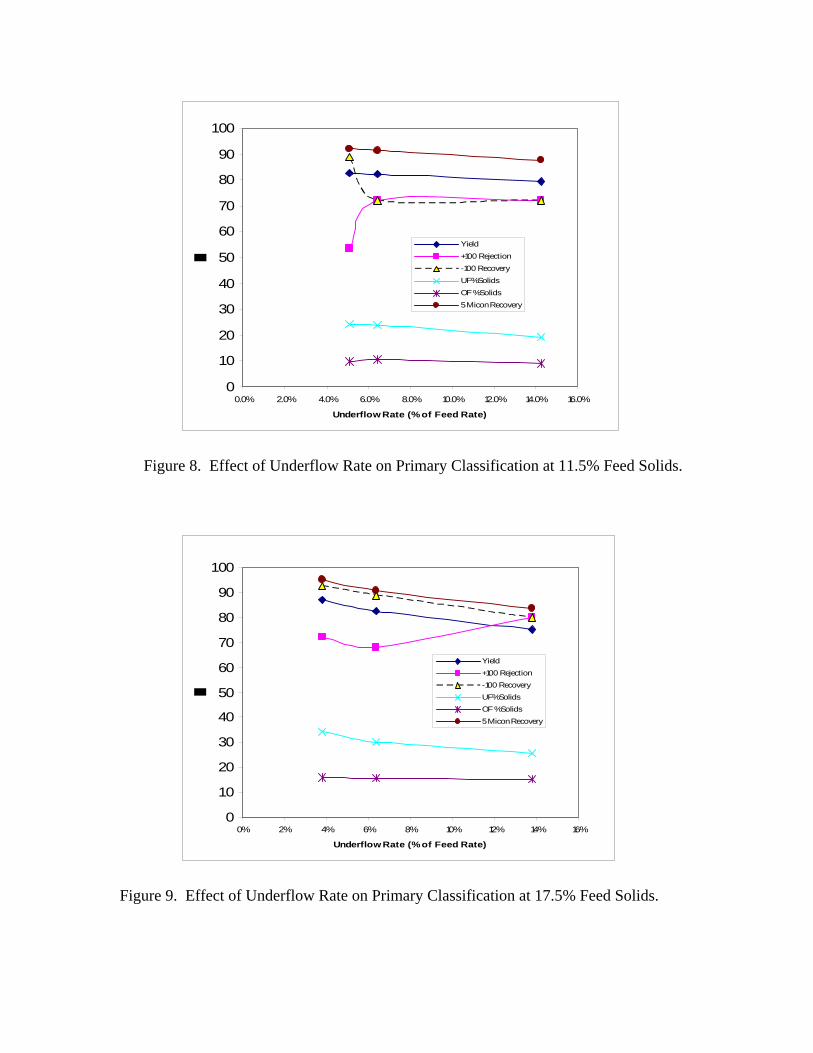
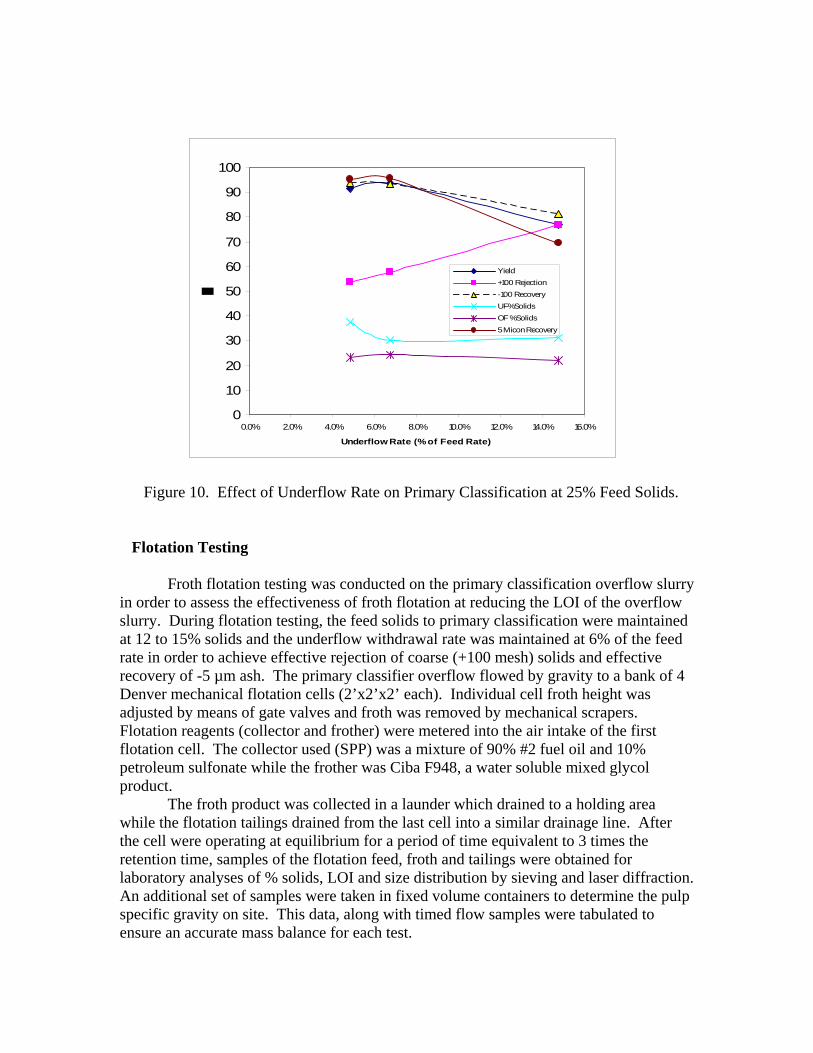
Figure 7. Effect of Feed Rate +100 mesh Rejection for Varying Feed Solids. Another operating variable that can be controlled during primary classification is the withdrawal rate of the underflow from the primary classifier. The solids that are too coarse to remain in suspension settle in the classifier and are removed by a variable speed pump. The slower the solids are removed, the higher the pulp density of the underflow will be and less water will be removed. Since the utrafine solids (<5µm) tend to follow the water, it is desirable to minimize the amount of water rejected with the classifier underflow. To illustrate this, a series of tests were conducted with the feed solids fixed at 11.5% solids and the underflow rate was reduced. The results are shown in Figure 8. Yield, <5 µm recovery and -100 mesh recovery all increased as the underflow withdrawal rate was decreased. Correspondingly, underflow solids increased and overflow solids decreased. The amount of +100 mesh that was rejected remained the same or decreased as the withdrawal rate was decreased. Similar results were obtained for feed solids of 17.5% (Figure 9) and 25% (Figure 10).
0
10
20
30
40
50
60
70
80
90
100
0.0% 2.0% 4.0% 6.0% 8.0% 10.0% 12.0% 14.0% 16.0%
Underflow Rate (% of Feed Rate)
Yield+100 Rejection-100 RecoveryUF% Solids OF % Solids5 Micon Recovery
Figure 8. Effect of Underflow Rate on Primary Classification at 11.5% Feed Solids.
0
10
20
30
40
50
60
70
80
90
100
0% 2% 4% 6% 8% 10% 12% 14% 16%
Underflow Rate (% of Feed Rate)
Yield+100 Rejection-100 RecoveryUF% Solids OF % Solids5 Micon Recovery
Figure 9. Effect of Underflow Rate on Primary Classification at 17.5% Feed Solids.
0
10
20
30
40
50
60
70
80
90
100
0.0% 2.0% 4.0% 6.0% 8.0% 10.0% 12.0% 14.0% 16.0%
Underflow Rate (% of Feed Rate)
Yield+100 Rejection-100 RecoveryUF% Solids OF % Solids5 Micon Recovery
Figure 10. Effect of Underflow Rate on Primary Classification at 25% Feed Solids. Flotation Testing Froth flotation testing was conducted on the primary classification overflow slurry in order to assess the effectiveness of froth flotation at reducing the LOI of the overflow slurry. During flotation testing, the feed solids to primary classification were maintained at 12 to 15% solids and the underflow withdrawal rate was maintained at 6% of the feed rate in order to achieve effective rejection of coarse (+100 mesh) solids and effective recovery of -5 µm ash. The primary classifier overflow flowed by gravity to a bank of 4 Denver mechanical flotation cells (2’x2’x2’ each). Individual cell froth height was adjusted by means of gate valves and froth was removed by mechanical scrapers. Flotation reagents (collector and frother) were metered into the air intake of the first flotation cell. The collector used (SPP) was a mixture of 90% #2 fuel oil and 10% petroleum sulfonate while the frother was Ciba F948, a water soluble mixed glycol product. The froth product was collected in a launder which drained to a holding area while the flotation tailings drained from the last cell into a similar drainage line. After the cell were operating at equilibrium for a period of time equivalent to 3 times the retention time, samples of the flotation feed, froth and tailings were obtained for laboratory analyses of % solids, LOI and size distribution by sieving and laser diffraction. An additional set of samples were taken in fixed volume containers to determine the pulp specific gravity on site. This data, along with timed flow samples were tabulated to ensure an accurate mass balance for each test.

The results obtained with a feed rate of 20 gpm are shown in Figure 11. Increasing the collector dosage from 0.8 to 2.4 lbs/ton reduced the tailings grade from 2.82 to 2.28% LOI with minimal changes in froth grade. The Tailings yield was reduced from 94% to 86% over the same dosage range.
01020
3040506070
8090
100
0.75 1.25 1.75 2.25 2.75
SPP Dosage, #/ton
1.0
1.5
2.0
2.5
3.0
3.5
4.0
Tailings Yield Froth Grade Tailings Grade
0.3 #/ton Frother
Taili
ngs
Yiel
d, %
Taili
ngs
Gra
de, %
LO
I
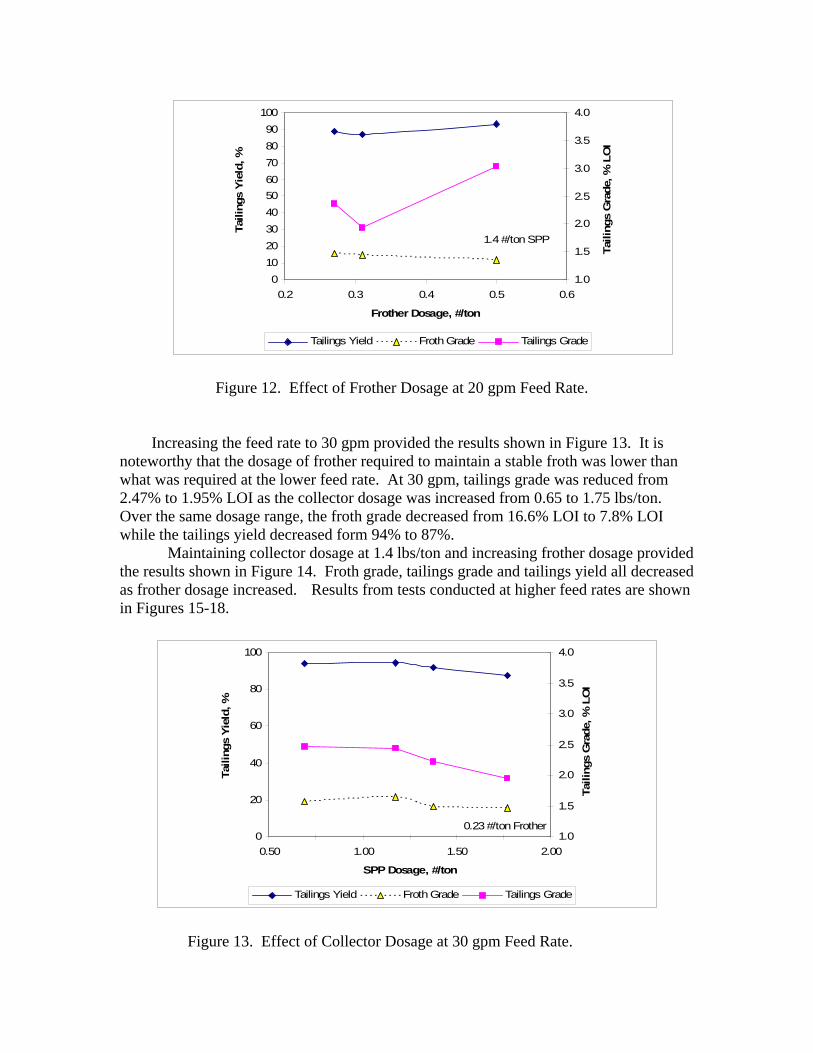
Figure 11. Effect of Collector Dosage at 20 gpm Feed Rate. When the collector dosage was fixed at 1.4 lbs/ton, increasing frother dosage from 0.27 to 0.31 lbs/ton reduced the tailings LOI to 1.93%, but further increasing the frother to 0.5 lbs/ton actually increased the tailings grade to 3.0% LOI (Figure 12). Tailings yield increased marginally as frother dosage was increased and froth grade diminished. One aspect that is not shown in the data provided is that operating at a frother dosage of as high as 0.5 lbs/ton would be difficult due to the excessive volume of froth that is generated.
0102030405060708090
100
0.2 0.3 0.4 0.5 0.6
Frother Dosage, #/ton
1.0
1.5
2.0
2.5
3.0
3.5
4.0
Tailings Yield Froth Grade Tailings Grade
1.4 #/ton SPPTa
iling
s Yi
eld,
%
Taili
ngs
Gra
de, %
LO
I
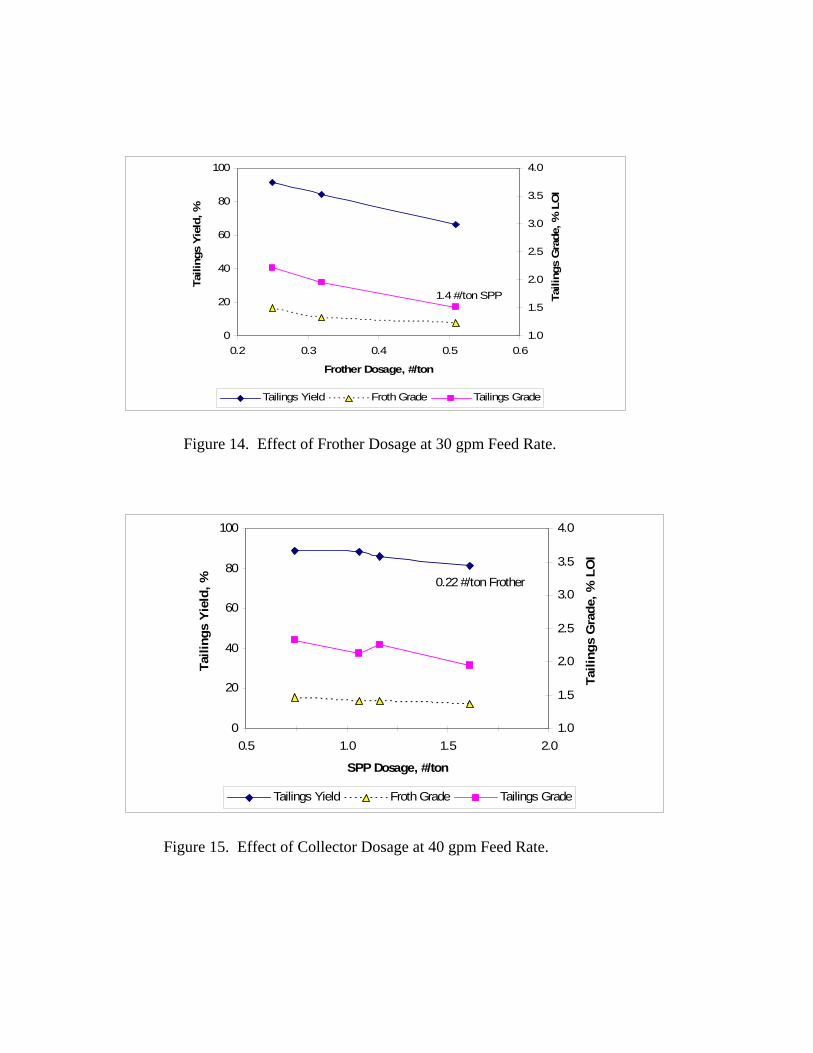
Figure 12. Effect of Frother Dosage at 20 gpm Feed Rate. Increasing the feed rate to 30 gpm provided the results shown in Figure 13. It is noteworthy that the dosage of frother required to maintain a stable froth was lower than what was required at the lower feed rate. At 30 gpm, tailings grade was reduced from 2.47% to 1.95% LOI as the collector dosage was increased from 0.65 to 1.75 lbs/ton. Over the same dosage range, the froth grade decreased from 16.6% LOI to 7.8% LOI while the tailings yield decreased form 94% to 87%. Maintaining collector dosage at 1.4 lbs/ton and increasing frother dosage provided the results shown in Figure 14. Froth grade, tailings grade and tailings yield all decreased as frother dosage increased. Results from tests conducted at higher feed rates are shown in Figures 15-18.
0
20
40
60
80
100
0.50 1.00 1.50 2.00
SPP Dosage, #/ton
1.0
1.5
2.0
2.5
3.0
3.5
4.0
Tailings Yield Froth Grade Tailings Grade
0.23 #/ton Frother
Taili
ngs
Yie
ld, %
Taili
ngs
Gra
de, %
LO
I
Figure 13. Effect of Collector Dosage at 30 gpm Feed Rate.
0
20
40
60
80
100
0.2 0.3 0.4 0.5 0.6
Frother Dosage, #/ton
1.0
1.5
2.0
2.5
3.0
3.5
4.0
Tailings Yield Froth Grade Tailings Grade
1.4 #/ton SPP
Taili
ngs
Yiel
d, %
Taili
ngs
Gra
de, %
LO
I
Figure 14. Effect of Frother Dosage at 30 gpm Feed Rate.
0
20
40
60
80
100
0.5 1.0 1.5 2.0
SPP Dosage, #/ton
1.0
1.5
2.0
2.5
3.0
3.5
4.0
Tailings Yield Froth Grade Tailings Grade
0.22 #/ton Frother
Taili
ngs
Yiel
d, %
Taili
ngs
Gra
de, %
LO
I
Figure 15. Effect of Collector Dosage at 40 gpm Feed Rate.

0
20
40
60
80
100
0.2 0.25 0.3 0.35 0.4
Frother Dosage, #/ton
1.0
1.5
2.0
2.5
3.0
3.5
4.0
Tailings Yield Froth Grade Tailings Grade
1.2 #/ton SPPTa
iling
s Yi
eld,
%
Taili
ngs
Gra
de, %
LO
I
Figure 16. Effect of Frother Dosage at 40 gpm Feed Rate.
0
20
40
60
80
100
0.4 0.9 1.4
SPP Dosage, #/ton
1.0
1.5
2.0
2.5
3.0
3.5
4.0
Tailings Yield Froth Grade Tailings Grade
0.18 #/ton Frother
Taili
ngs
Yiel
d, %
Taili
ngs
Gra
de, %
LO
I
Figure 17. Effect of Collector Dosage at 50 gpm Feed Rate.

0
20
40
60
80
100
0 0.1 0.2 0.3 0.4
Frother Dosage, #/ton
1.0
1.5
2.0
2.5
3.0
3.5
4.0
Tailings Yield Froth Grade Tailings Grade
1.2 #/ton SPP
Taili
ngs
Yiel
d, %
Taili
ngs
Gra
de, %
LO
I
Figure 18. Effect of Frother Dosage at 50 gpm Feed Rate. Since the role of the flotation collector is to selectively increase the hydrophobicity of carbon particles, increasing the collector dosage should reduce the tailings LOI, provided sufficient frother is present to generate a stable froth. As shown in Figure 19, tailings grade did decrease with increasing collector dosage for each feed rate. The lowest grade tailings were obtained with a feed rate of 40 gpm.
0.0
0.5
1.0
1.5
2.0
2.5
3.0
0.5 1.0 1.5 2.0 2.5
SPP Dosage, #/ton
20 gpm30 gpm40 gpm50 gpm
Taili
ngs
Gra
de, %
LO
I
Figure 19. Effect of Collector Dosage on Tailings Grade.
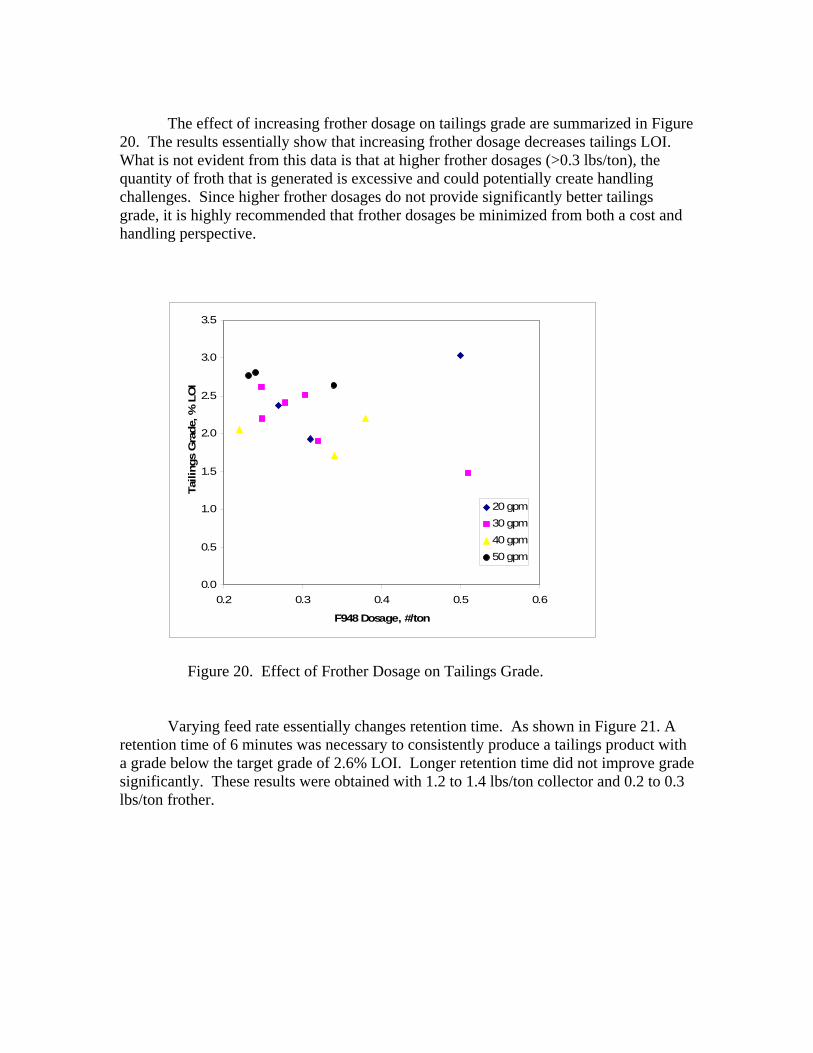
The effect of increasing frother dosage on tailings grade are summarized in Figure 20. The results essentially show that increasing frother dosage decreases tailings LOI. What is not evident from this data is that at higher frother dosages (>0.3 lbs/ton), the quantity of froth that is generated is excessive and could potentially create handling challenges. Since higher frother dosages do not provide significantly better tailings grade, it is highly recommended that frother dosages be minimized from both a cost and handling perspective.
0.0
0.5
1.0
1.5
2.0
2.5
3.0
3.5
0.2 0.3 0.4 0.5 0.6
F948 Dosage, #/ton
20 gpm30 gpm40 gpm50 gpm
Taili
ngs
Gra
de, %
LO
I
Figure 20. Effect of Frother Dosage on Tailings Grade. Varying feed rate essentially changes retention time. As shown in Figure 21. A retention time of 6 minutes was necessary to consistently produce a tailings product with a grade below the target grade of 2.6% LOI. Longer retention time did not improve grade significantly. These results were obtained with 1.2 to 1.4 lbs/ton collector and 0.2 to 0.3 lbs/ton frother.

0.0
0.5
1.0
1.5
2.0
2.5
3.0
3.5
4.0
4.5
4 6 8 10 12
Retention Time, minutes
20 gpm30 gpm40 gpm50 gpm
Taili
ngs
Gra
de, %
LO
I
Figure 21. Effect of Retention Time on Tailings Grade. Figure 22 summarizes the reagent cost data using bulk chemical costs (0.40 $/lb for SPP and 0.85 $/lb frother). Acceptable tailings grades were achieved with a reagent cost of 0.50 to 1.00 $/ton.
0.0
0.5
1.0
1.5
2.0
2.5
3.0
3.5
4.0
0.00 0.50 1.00 1.50
Reagent Cost, $/ton
20 gpm30 gpm40 gpm50 gpm
Taili
ngs
Gra
de, %
LO
I
Figure 22. Effect of Reagent Cost on Tailings Grade.
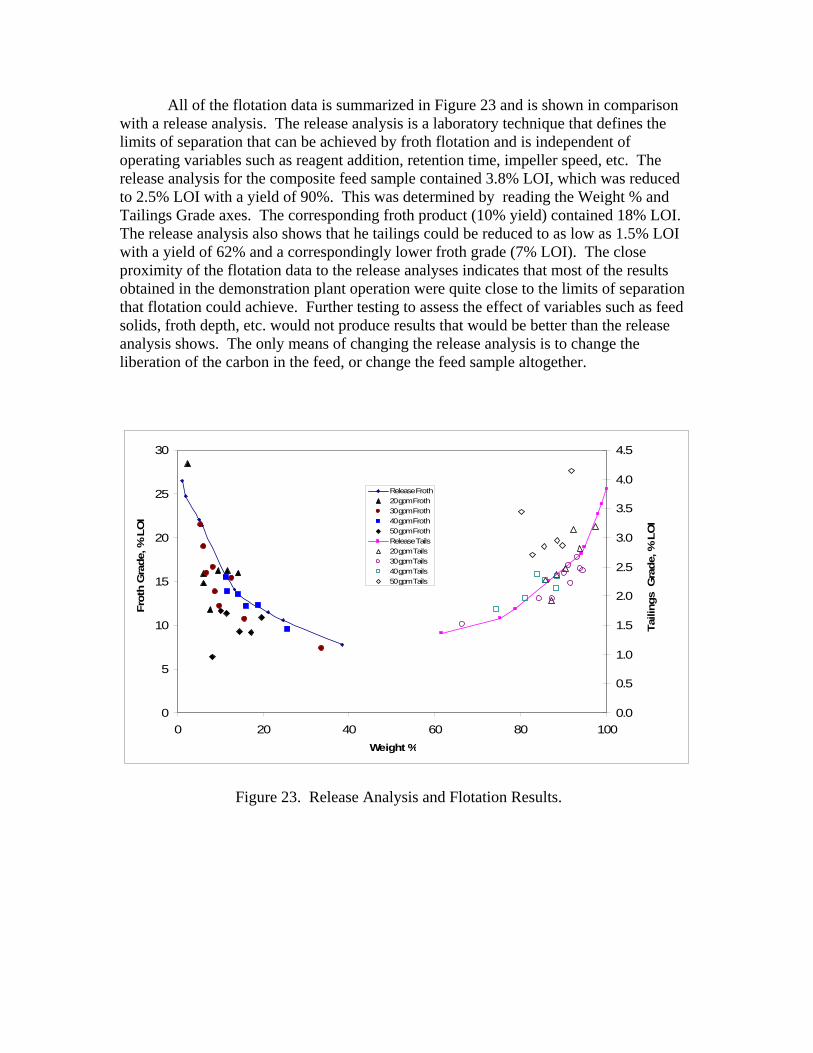
All of the flotation data is summarized in Figure 23 and is shown in comparison with a release analysis. The release analysis is a laboratory technique that defines the limits of separation that can be achieved by froth flotation and is independent of operating variables such as reagent addition, retention time, impeller speed, etc. The release analysis for the composite feed sample contained 3.8% LOI, which was reduced to 2.5% LOI with a yield of 90%. This was determined by reading the Weight % and Tailings Grade axes. The corresponding froth product (10% yield) contained 18% LOI. The release analysis also shows that he tailings could be reduced to as low as 1.5% LOI with a yield of 62% and a correspondingly lower froth grade (7% LOI). The close proximity of the flotation data to the release analyses indicates that most of the results obtained in the demonstration plant operation were quite close to the limits of separation that flotation could achieve. Further testing to assess the effect of variables such as feed solids, froth depth, etc. would not produce results that would be better than the release analysis shows. The only means of changing the release analysis is to change the liberation of the carbon in the feed, or change the feed sample altogether.
0
5
10
15
20
25
30
0 20 40 60 80 100Weight %
0.0
0.5
1.0
1.5
2.0
2.5
3.0
3.5
4.0
4.5
Release Froth20 gpm Froth30 gpm Froth40 gpm Froth50 gpm FrothRelease Tails20 gpm Tails30 gpm Tails40 gpm Tails50 gpm Tails
Frot
h G
rade
, % L
OI
Taili
ngs
Gra
de, %
LO
I
Figure 23. Release Analysis and Flotation Results.

CONCLUSIONS Primary classification was shown to be effective for rejecting coarse (+100 mesh) material from the pond ash while maintaining high recovery of -100 mesh and -5 µm ash. The classifier used was capable of efficiently providing this separation under a variety of conditions, but +100 mesh rejection decreased as feed rate increased. Operating the classifier at a feed rate of 40 to 50 gpm provided the primary classification desired to meet the project objectives. Necessary data was collected to enable scale-up to larger design basis. Froth flotation was evaluated to reduce the LOI of the primary classifier overflow to below 3%. A minimum retention time of 6 minutes was required to provide LOI reduction to 2.5% LOI using 1.2 lbs/ton collector and 0.23 lbs/ton frother. Reagent costs to provide acceptable grade tailings were 0.50 to 1.00 $/ton of flotation feed. Demonstration plant flotation results were consistent with release analysis results, indicating that no further significant improvement in flotation performance could be expected with additional testing.