advanced solutions to capture mobility data: …...the overall goal of the advanced solutions to...
TRANSCRIPT

Advanced Solutions to Capture Mobility Data: CloudThink and Mobility as a Service Final Report Contract Number: DTRT57-13-C-10038
Start Date: 24 June 2013 End Date: 23 June 2015
Summary of Work Performed The overall goal of the Advanced Solutions to Capture Mobility Data: CloudThink and Mobility as a Service project is the creation of hardware and software to support data collection and analysis of multimodal transit. Collecting, storing and retrieving these data in a user friendly way is key to making transit and mobility data useful to the user and future analyses.
For the project we defined guidelines for hardware and software supporting data collection and analysis for multimodal transit. We provide two complimentary approaches to mobility data. First, a vehicle hardware solution that simply and easily plugs into standard OBDII ports on modern vehicles provides comprehensive and robust data about vehicle use and travel. Second, a smartphone app records mobility data using standard smartphone sensors including accelerometers, GPS and compass data. For the smartphone app, we created transit mode identification methods to distinguish different mobility transit types from each other. Both components automatically transmit data to a central server for ease of use and simplified data access for the user.
We also developed server-side data cleaning and synchronization to improve the robustness of the data, coordinate disparate data sources based on time, and reduce errors. For example, GPS data transmitted when a GPS sensor is unavailable or not ready can lead to reports of locations at 0° Latitude and 0° Longitude. Identifying zero as invalid improves the robustness of the data collection system. Furthermore, we collect data from multiple disparate sources. By coordinating all data collection with a synchronized clock, the data can be sorted and cross-referenced based on timestamp to allow analyses across multiple different sensor sources.
To test the system we performed example data collection for fixed and variable routes. Fixed routes refer to routes planned in advanced with a priori knowledge of the true values for mode of transit. Variable routes refer to free form data collection without prior knowledge about mode of transit.
As a result of our project efforts, we created a system for collection of Clean and Synchronized Data, methods for the Identification of Transit Mode, which in turn informs simple methods for Origin-Destination Identification.

CloudThink In-Vehicle Hardware The CloudThink hardware, referred to here as the “CARduino,” is an ARM7-based
interface device capable of communication with vehicular CANbus networks and uploading data via a 2.5G cellular interface. The CARduino is capable of merging On-Board Diagnostic (OBD) information, data from integral motion and context sensors, and proprietary CANbus information to allow the creation of real-time virtual vehicle mirrors called Avacars. The CARduino supports all CANbus-based OBDII and EOBD vehicles. In the United States, CANbus was required starting in model year 2008, but many models as far back as 2004 supported CAN.
Hardware Specifications
• ARM7-TDMI Processor (LPC2129) • Dual channel CANbus Interface (OBDII + Secondary networks) • microSD card slot for data buffering • Telit GE864-GPS 2.5G GSM and GPS module • Sensors: GPS, 3-axis gyroscope, 2x 3-axis accelerometers • FreeRTOS Operating System & Scheduler • OTA (Over the Air) update capability in hardware (server requires additional
software development) • microSD Bootloader for in-situ upgrades
Comprehensive details of the CloudThink hardware are provided in the CARduino
User Guide text file, on the provided CD-ROM.
Route Determination and Mode of Transportation We compared the motion model hardware and software analysis to the ground truth to determine how well the system performs and to what extent one could rely on such a system to predict transit mode.

Figure 1: Minimum and Maximum Accelerations scatter plot
Figure 1 shows a scatterplot of four different transit modes based on maximum acceleration and minimum acceleration. Maximum acceleration is defined for this purpose as the maximum acceleration magnitude observed by the accelerometer during a 5 second period. Minimum acceleration is the minimum acceleration magnitude observed by the accelerometer during a 5 second period. The plot shows several clusters of data for running, walking, bicycling, driving and standing still.
Bicycling and vehicle travel such as in cars or on a bus (and presumably on a motorcycle) have similar characteristics. As a result these classes are unified into one vehicle-transit class. Also, the use of CloudThink enabled vehicle travel provides a highly reliable method for identifying vehicle transit.
Table 1: Minimum and Maximum Acceleration-based Classification
Actual Mode \ Classification Walking Running Stationary Vehicle Walking 97.2% 0.3% 0% 2.5% Running 1.8% 98.2% 0% 0% Stationary 0% 0% 99.4% 0.06% Vehicle 29.9% 0% 3.1%% 67.0% CloudThink - - - 100%
CloudThink enabled vehicles provide fully reliable classification for vehicle travel.

Origin-Destination Determination As part of the original vision for the project, we identified origin-destination data as useful data for marking the beginnings and endings of transit data. We identified anticipated difficulties including momentary transitions and noise. Post hoc identification of momentary transitions and noise is possible, however real-time identification of transitions is more difficult. Furthermore, the need or desire for GPS information marking the beginning or ending of a transit mode necessitates identifying the transition in the moment rather than during post processing.
The systems developed offer numerous approaches to identifying the origin and destination of trips. Procedures for classifying trip origin and destination rely heavily on a priori knowledge about the traveler. For example, if key locations are known in advance then Origin-Destination post processing becomes an easier task based on GPS location tracking. However, for this project we are interested in determining the capabilities of the M2aS system for indicating the origin and destinations of a multi-modal trip. We are also interested in reducing the GPS energy use in the smartphone application. The desire for origin-destination information and low GPS use are at odds with each other. Without GPS information we can’t identify the origin or destination of a multi-modal trip. We would be able to determine the length of the trip and the modes used, however the actual locations of the start, transit mode transitions, and end require GPS. Therefore, the goal of the project is to collect the needed GPS information in an efficient manner. Typical transit tracking makes heavy use of GPS by constantly monitoring and recording GPS values.
Figure 2 shows the identification of origin and destination within a multimodal travel. Since we recognize that stationary moments can interrupt any travel mode, we ignore transitions involving stationary movement. The trip begins in the upper left where the user walks from the green marker to the first cluster of red markers also in the upper left portion of the map. This cluster of red markers indicates the transition from walking to travel by bus. The first cluster corresponds to the bus stop at the corner of Massachusetts Avenue and Hancock Street in Cambridge, Massachusetts. This identification is consistent with the ground truth for the trip. The second set of identified mode changes is shown on the set of red markers in the lower right of the map in Figure 2. These markers correspond to the bus stop at the corner of Massachusetts Avenue and Albany Street, which is also consistent with the ground truth for the trip. The GPS locations for the end of the trip while walking within MIT buildings, reveals a fundamental difficulty with GPS. GPS is not accurate indoors.
Overall, Figure 2 shows the potential for origin and destination and multimodal travel identification. The methods used are robust to brief misclassification of transit mode due to outlier removal and data filtering. However, limitations on the accuracy of transit mode classification, as documented in the CLIN0003 report, has the potential to generate persistent misclassification due to the fact that interaction with the smartphone in transit can lead to misclassification (e.g., talking on the phone while walking).
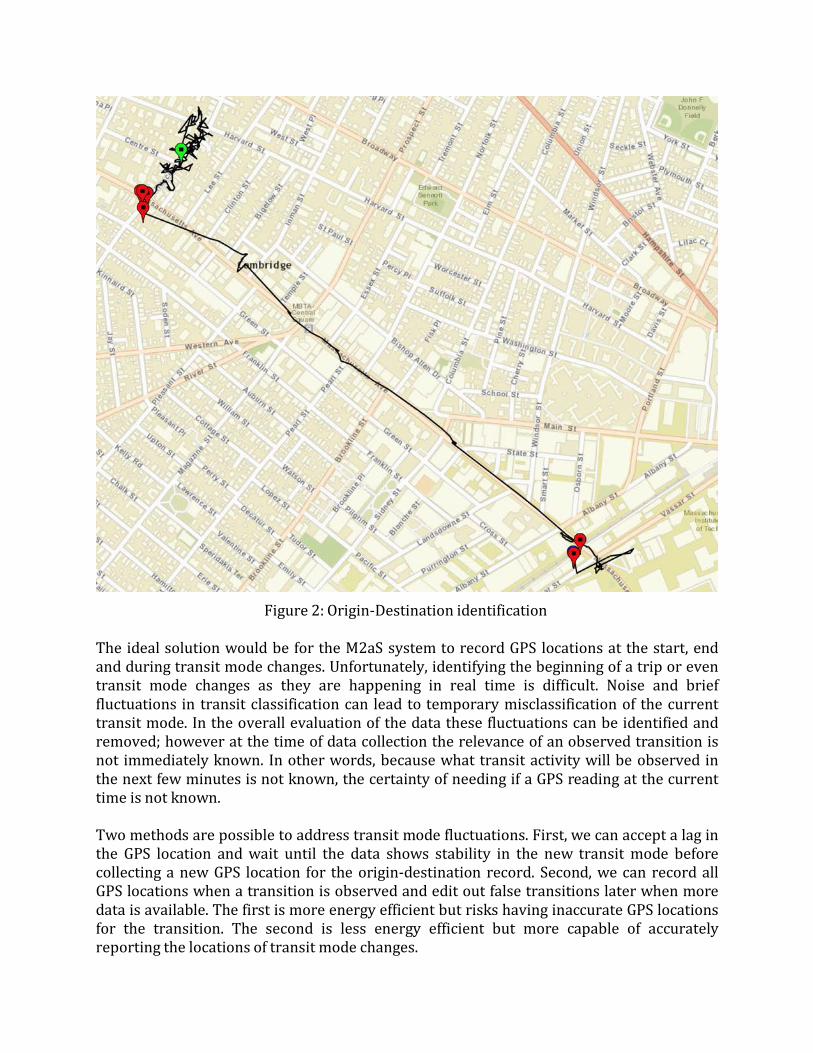
Figure 2: Origin-Destination identification The ideal solution would be for the M2aS system to record GPS locations at the start, end and during transit mode changes. Unfortunately, identifying the beginning of a trip or even transit mode changes as they are happening in real time is difficult. Noise and brief fluctuations in transit classification can lead to temporary misclassification of the current transit mode. In the overall evaluation of the data these fluctuations can be identified and removed; however at the time of data collection the relevance of an observed transition is not immediately known. In other words, because what transit activity will be observed in the next few minutes is not known, the certainty of needing if a GPS reading at the current time is not known.
Two methods are possible to address transit mode fluctuations. First, we can accept a lag in the GPS location and wait until the data shows stability in the new transit mode before collecting a new GPS location for the origin-destination record. Second, we can record all GPS locations when a transition is observed and edit out false transitions later when more data is available. The first is more energy efficient but risks having inaccurate GPS locations for the transition. The second is less energy efficient but more capable of accurately reporting the locations of transit mode changes.

Alternatively, the M2aS system could operate on time-based GPS data collection like typical route trackers and collect rich GPS information at a higher energy cost. The basic trade off is more energy use yields more accurate data.
The area where our system works particularly well is combining smartphone motion-based monitoring with our connected-car hardware. In this case transitions between vehicle travel are highly accurate since transitions are detected based on wireless connection to the car hardware and comprehensive vehicle data from the car’s CANbus. Additionally, GPS tracking is built into the connected car hardware thereby eliminating battery limitations on GPS data collection.
Multimodal data fusion takes place server-side and is done on a per-application basis. The mobile applications and in-vehicle hardware upload as separate data streams, but may be linked and rendered together provided an application has a priori knowledge of related cars and occupants. In this way, it is possible to “stitch together” transit histories, e.g. for visualization or route histories, or to synchronize timestamps to enrich data while in the vehicle with mobile application acceleration data.
For Smartphone-based origin destination tracking, the best results occur when GPS data is collected with a consistent update rate (e.g., every minute or every 5 minutes). With more GPS data, post-processing of the transit mode data can reveal transit transitions and correlate the transition times to GPS locations. The drawback is frequent GPS data collection leads to faster battery drain.
Evaluation Criteria As part of the CLIN0002 Deliverable, we included a list of evaluation criteria for the Advanced Solutions to Capture Mobility Data project.
1. We will demonstrate the collection of relevant data with data files from smartphones detailing the data collected including location, speed, and IMU parameters (e.g., acceleration). We have collected at least 50MB of data using the iOS application. We have collected at least 50 MB of data using the Android application. We have collected at least 50 miles of data from at least three different vehicles. We log accelerometer data at a rate of at least 10Hz. We are capable of collecting GPS data at rates up to 1Hz (lower rates are often used to increase battery life). We collect gyroscope (when available on the smartphone) at a rate greater than or equal to 10 Ha. We collect magnetic field data (when available) at a rate greater than or equal to 3Hz.
2. We will demonstrate integration with CloudThink by showing that Ma2S data is successfully logged to the cloud server. We have successfully logged at least 25 trips of Ma2S data to a CloudThink server.
3. We will demonstrate the Android and iOS apps for Ma2S by delivering the application software in installable format.

The Android version of the app can be found on the Google Play Store at: https://play.google.com/store/apps/details?id=com.jsiegel.mitmotionapp&hl=en. The iOS version of the app can be found on the iTunes Store at: https://itunes.apple.com/us/app/cloudthink-motion-context/id847636184?mt=8. Source code for the two apps is provided on the CD-ROM included with the Hardware deliverables.
4. We will demonstrate route determination and mode of transportation by showing route and mode of transportation identification for multiple routes including multiple modes of transit. Route determination relies solely on the accuracy and sampling rate of the GPS used on the vehicle or within the smartphone. Lower sampling rates require less battery power, however at a cost of greater potential inaccuracy. Mode of Transportation classification works well with the smartphone with over 95% accuracy for controlled conditions for walking, running and stationary movements and over 65% accuracy for wheeled vehicle travel. Our studies have shown that ‘non-controlled’ conditions that include making a phone call during transit can lead to misclassification. Use of CloudThink technology for detecting and recording vehicle transit is effectively 100% accurate and fills in a potential gap in the smartphone app capabilities.
5. We will demonstrate the integration of a user prompt for input in the Ma2S and will show the use of user input data for validating mode inferences. The provided app in Point #3 includes user prompts for input. We have collected at least 25 trips of data with user provided input.
6. We will demonstrate access to transportation data through a webservice with example data displayed on a webpage that accesses the CloudThink server, instead of processed and rendered on the smartphone itself. The example webservice can be accessed at https://api.cloud-think.com. Please note that, due to the security measures in use, the url will only work with the https:// prefix instead of the more typical http:// prefix.
The username and password for DOT-Volpe to test the system are: REDACTED.
Figure 3 shows an example of the data that can be accessed through the webservice, a frontend for the RESTful API.
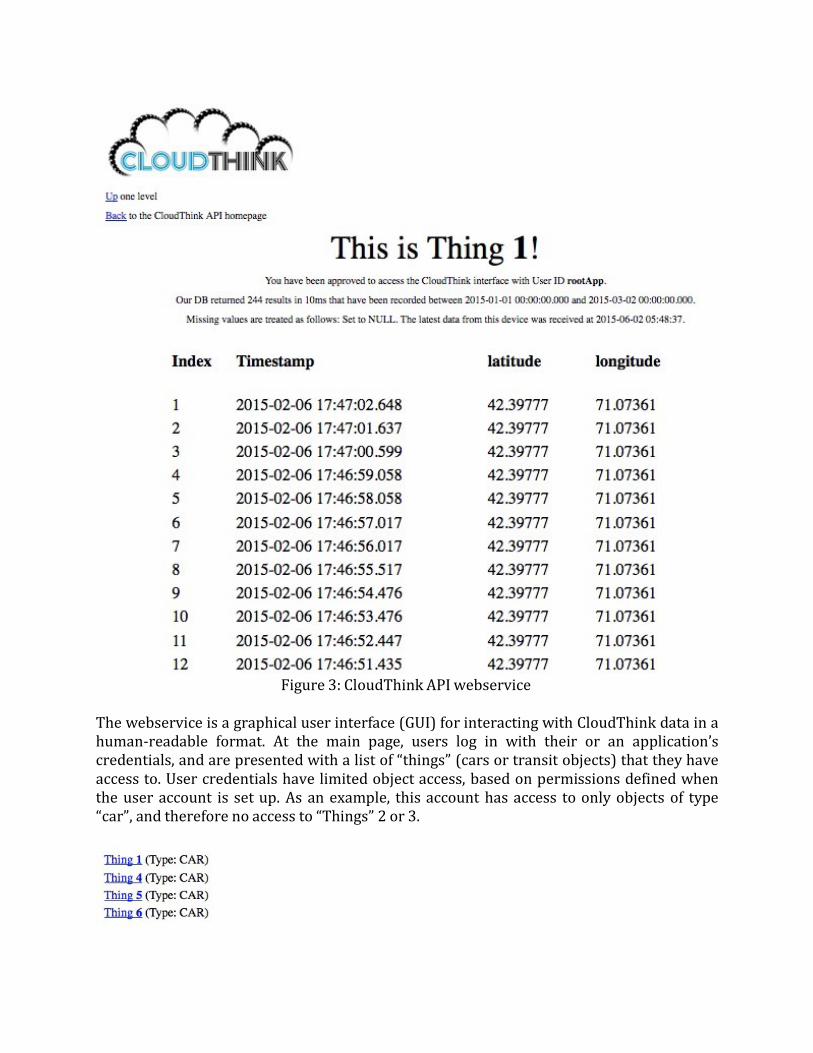
Figure 3: CloudThink API webservice
The webservice is a graphical user interface (GUI) for interacting with CloudThink data in a human-readable format. At the main page, users log in with their or an application’s credentials, and are presented with a list of “things” (cars or transit objects) that they have access to. User credentials have limited object access, based on permissions defined when the user account is set up. As an example, this account has access to only objects of type “car”, and therefore no access to “Things” 2 or 3.

Clicking on an object shows an overview of datapoints with timestamps for each object, as shown below.
To prevent applications or users from easily scraping all available data, parameters recorded are not listed by name. Instead, these parameters must be requested in the URL directly. If data does not exist, an empty set is returned. An example URL with data parameters in the query and a windowed timestamp appears here: https://api.cloud- think.com/things/1/?parameters=latitude,longitude&startTime=20150101&endTime=201 50302
As with any other request, the returned data set is empty if the user supplies invalid credentials or the object does not exist.
7. We will demonstrate the addition of public weather and traffic data (metadata) to Ma2S collected data with example data showing collected data with weather condition data (e.g. weather underground) and available public traffic data. An example webservice that shows access to weather and traffic data is available at: http://api.cloud- think.com/WebApp.php.
This is the “non secure” API address’s webpage. The site that loads is a demonstration application that shows the most recent location of “Thing 1,” with overlaid weather data and transit data. Weather data is scraped from WeatherUnderground as the screen size or map scale is updated, while traffic data updates from Google Traffic each time the webpage is resized. The weather is represented as conventional weather-related icons, such as partly cloudy (depicted in the image below).
This application may give an “Error, unknown error” on some browser configurations. This could be due to the use of a self-signed security certificate, to reduce the cost of software development. In a production environment, this error would not occur. Temporarily disabling certificate validation will solve the error.

Figure 4: Weather and Traffic Data
Figure 4 illustrates the weather and traffic data that can be accessed through the webservice. Different color lines indicate traffic levels along roads with green corresponding to low traffic conditions and red corresponding to high traffic conditions. Weather iconography indicates weather conditions. For example in Figure 4, there is a cloud icon above the “Cambridge” city label. This cloud icon indicates cloudy conditions in the area. The same application can be extended using the same code and data sources to include historic data; however, due to the added cost of accessing historic data, the demonstration application focuses on real-time data which is provided free of charge.
8. We will demonstrate user acceptability by surveying initial test users on their perception of battery use. Battery use is highly dependent on the sampling rates selected within the Ma2S apps. Higher sampling rates result in higher battery use. When set at moderate to low sampling rates, battery use is less noticeable than when sampling at high rates. Users have not reported significant battery loss at low sampling rates.
9. We will demonstrate data collection in a fault-tolerant way by showing robustness to GPS and GSM disconnection. We successfully collected at least one-half hour of vehicle data with the GPS and GSM antennae blocked (or disconnected) and transmitted the buffered data after GPS and GSM connections were re-established. To this end, we have been able to demonstrate successful file uploads of entire drives upon the shutoff of the unit, which indicate an entire drive could be reconstituted from buffered data provided a connection was available at the time of vehicle shutoff.

10. We will demonstrate near real-time delivery of information by showing access to vehicle data on the CloudThink server. We are able to send vehicle data to the CloudThink server within five seconds of the time stamp associated with the most recent data point collected. By comparing data on the server to its own clock (comparing GPS time with time of data received at a server with a synchronized clock) we see that the latency between data collection and delivery can be less than five seconds. In practice, we buffer data for longer than 5 seconds to improve communication performance and battery life, and bandwidth constraints limit data visualization rates to below 0.2 Hz.
11. We will demonstrate the synchronization of data collected from the serial CAN bus by comparing raw and synchronized data streams and showing proper temporal binning of data. We successfully collect at least three different data types from the serial CAN bus with timestamp data, including engine speed, vehicle speed, and mass air flow rate. The other 23 legislated OBD parameters are accessible using similar methods.
12. We will demonstrate automated error/outlier removal from the database by showing the raw transportation mode identification data compared to the corrected data. By comparing raw and filtered datasets we show that for cases where errors in the raw data exist, the corrected data matches better with ‘ground truth’. Figure 5 shows raw data compared to filtered data. The filtered data removes outliers and errors based on GPS position and consistency of classified movements. GPS outliers include GPS locations that differ significantly from other location points in the transit set. Such outliers in terms of location can safely be ignored. Since the goal is to identify multi-modal transit, we make the assumption that any transit mode of interest will last for longer than a few seconds. Therefore, we identify transit outliers as modes of transit where the mode lasts for less than 25 seconds.
(a) Classification from Raw Data (b) Classification from Filtered Data
Figure 5: Comparison of Filtered Data to Raw Data 13. We will demonstrate operation in a “plug and forget” fashion by establishing zero- configuration CloudThink vehicle hardware. As part of the Hardware Deliverable we have included one example of the CloudThink hardware that is plug-and-forget. Simply plug the

OBDII cable into the OBDII port on any US vehicle produced after 2008 and the hardware will automatically log information to the CloudThink servers. This example device also contains a SIM card for wireless communication temporarily active and paid for by MIT for testing purposes. This SIM card will be deactivated at the conclusion of the project. We have also included hardware that can be configured to work with other communication and servers. These examples will need a SIM card for communication and configuration to designate the server to which data should be sent.
14. We will demonstrate a very low battery drain by measuring the rate of battery discharge with and without the app running. As stated in point#4 battery use is dependent on the data sampling rates selected within the app. Rates can be selected to meet the battery needs of the user. Experiments on battery drain were conducted by allowing the phone to sit in airplane mode, with the screen on lowest brightness, with battery life checked every 5 minutes by visual inspection (screen turned on and value read). The phone was fully charged, and when the battery dropped from 100% to 99%, the nearest 5 minute interval was recorded. Results show that the 1Hz sampling rate had a 14% impact on battery life, while 100Hz had a 79% impact on battery life. The results shown here are for an iPhone 5S, running iOS 8.
Table 2: Battery Drain Experimental Results
Case Hz % Depleted Time Measured
Estimated Longevity (m)
% Decrease vs. Baseline
Baseline 0 1
7
7
0.0% 1Hz Sampling
1 1
6
6
-14.3%
10Hz Sampling 10
1
4
4
-35.7%
100Hz Sampling 100 1
1
1
-78.6%
The results of the sampling rate vs. battery life decrease highlight nonlinear (shown in Figure 5). This indicates a high sensitivity to increasing the data capture rate, which is at odds with classification accuracy. There are a few options that could be used in future work to reduce impact on battery life, such as sampling at a high rate at regular, infrequent intervals, or relying on the mobile operating system for motion classification (which has better low-level control of sensors and can modulate power drivers with more degrees of freedom). It should also be noted that, as batteries in phones degrade with time, use, and charging cycles, the results from one phone are not indicative of the results another, similar phone may achieve.

% R
educ
tion
in B
atte
ry
0
-10
0 50 100
-20
-30
-40
-50
-60
-70
-80 Sample Frequency (Hz)
Figure 5: Impact of Sampling Frequency on Battery Life
15. We will demonstrate data security by implementing an SSL certificate on the Cloud server to authenticate the server and assure data validity for end-use applications. Usernames and passwords for login information are transmitted in Base64-encoded format to make man-in-the-middle interception more complex, and passwords stored in our database are not be stored in plaintext, instead using a salted hash. Where feasible, SSL encryption is used to protect data being sent between the server and end-use application, and data exposure is minimized by keeping processing local to the server. Data transmitted from the hardware device or application to the storage server uses existing telecommunication infrastructure for security and privacy. Throughout the project, MIT consulted with Dr. Simon Mayer, a computer scientist affiliated with ETH Zurich in Switzerland (now working for Siemens), to ensure a reasonable development path was selected. Dr. Mayer provided feedback and design critique throughout the project.
Findings During the development and testing of the CloudThink and Mobility as a Service project, we identified several aspects about mobility, communication, and analysis.
While we developed an accelerometer-based mode of transit identification method, recently introduced API functionality from the Android and iOS operating systems provide their own motion classifying methods. These ‘native’ functions operate with reduced power consumption compared to dedicated software loggers due to tighter integration with the OS. Misclassifications trouble both OS and dedicated algorithms; accelerometers alone are not sufficient to reliably classify all types of transit. However, the MIT algorithm provides greater accuracy than the OS algorithm, though power consumption is orders of magnitude greater. Future work should try to make use of low-level DSP and dedicated sensors, such as motion coprocessors found in modern Apple phones, due to reduced computation and
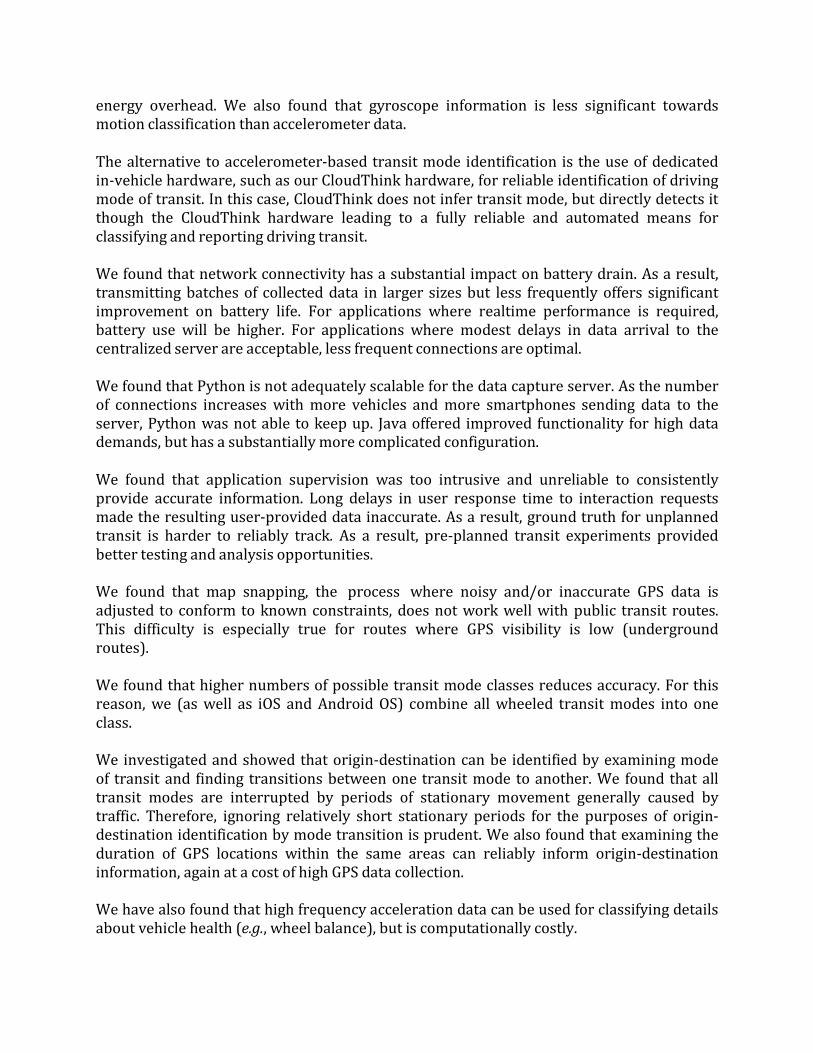
energy overhead. We also found that gyroscope information is less significant towards motion classification than accelerometer data.
The alternative to accelerometer-based transit mode identification is the use of dedicated in-vehicle hardware, such as our CloudThink hardware, for reliable identification of driving mode of transit. In this case, CloudThink does not infer transit mode, but directly detects it though the CloudThink hardware leading to a fully reliable and automated means for classifying and reporting driving transit.
We found that network connectivity has a substantial impact on battery drain. As a result, transmitting batches of collected data in larger sizes but less frequently offers significant improvement on battery life. For applications where realtime performance is required, battery use will be higher. For applications where modest delays in data arrival to the centralized server are acceptable, less frequent connections are optimal.
We found that Python is not adequately scalable for the data capture server. As the number of connections increases with more vehicles and more smartphones sending data to the server, Python was not able to keep up. Java offered improved functionality for high data demands, but has a substantially more complicated configuration.
We found that application supervision was too intrusive and unreliable to consistently provide accurate information. Long delays in user response time to interaction requests made the resulting user-provided data inaccurate. As a result, ground truth for unplanned transit is harder to reliably track. As a result, pre-planned transit experiments provided better testing and analysis opportunities.
We found that map snapping, the process where noisy and/or inaccurate GPS data is adjusted to conform to known constraints, does not work well with public transit routes. This difficulty is especially true for routes where GPS visibility is low (underground routes).
We found that higher numbers of possible transit mode classes reduces accuracy. For this reason, we (as well as iOS and Android OS) combine all wheeled transit modes into one class.
We investigated and showed that origin-destination can be identified by examining mode of transit and finding transitions between one transit mode to another. We found that all transit modes are interrupted by periods of stationary movement generally caused by traffic. Therefore, ignoring relatively short stationary periods for the purposes of origin- destination identification by mode transition is prudent. We also found that examining the duration of GPS locations within the same areas can reliably inform origin-destination information, again at a cost of high GPS data collection.
We have also found that high frequency acceleration data can be used for classifying details about vehicle health (e.g., wheel balance), but is computationally costly.

We have found that the iOS motion classification algorithm appears to be more accurate than the Android analogue. We speculate that the difference might be due to higher hardware variability between the numerous Android phone options available. Furthermore we found that the iOS and Android apps were difficult to support. It is not possible to support all mobile phones and all operating systems – despite the best efforts and intentions of Android, hardware differences make it difficult to handle even just the most popular handsets. Sensor access lags far behind the rest of mobile API development.
We found synchronization to be a challenge, GPS is a good way to synchronize multiple devices, however GPS is not always available to provide a timestamp, especially at startup or underground on public transit. For data where GPS eventually becomes available, it is possible to use the internal time counter to “backplot” for synchronization – this approach works for all but the shortest trip segments.
Conclusions and Recommendations The introduction of dedicated hardware for motion classification on mobile smartphones partway through the project significantly changes the outlook of the Mobility as a Service smartphone apps. Using the mobile phone OS to identify motion context was not a consideration at the beginning of the project, but future work in this area must take these opportunities into account. As the OS solutions for motion classification improve over time they could offer lower battery use and higher accuracy context. Furthermore, external dedicated sensors (and batteries) such as FitBit could be used to identify motions for walking or running.
The amount of data transmitted to the data server can be reduced with a thick-client (preprocessed) model. In this manner, the data is reduced to the conclusions and key elements so that data amounts are less. Increasing the time between data uploads (higher buffering) will also reduce apparent noise, bandwidth use and energy consumption. Furthermore, data could be stored locally on the smartphone until more opportune times for data transmission such as when the phone is plugged in or connected to WiFi. The result would reduce the availability of real-time data, but improvements to the user experience would be significant.
Next-generation hardware should incorporate a Real Time Clock Controller (RTCC) to improve data synchronization by ensuring a valid timestamp remains even after device power is removed.
For the current scope of the CloudThink and Mobility as a Service project, MySQL is sufficient. For larger scale deployment of CloudThink and Ma2S, a framework better suited for large data should be used, such as Hadoop.