advanced techniques for anti-debugging ilja nevolin
TRANSCRIPT
Ilja Nevolin
Advanced Techniques For Anti-Debugging
Academic year 2016-2017Faculty of Engineering and ArchitectureChair: Prof. dr. ir. Rik Van de WalleDepartment of Electronics and Information Systems
Master of Science in Information Engineering TechnologyMaster's dissertation submitted in order to obtain the academic degree of
Counsellors: Ir. Bert Abrath, Dr. Bart CoppensSupervisor: Prof. dr. ir. Bjorn De Sutter
Preface
Back in high school I stumbled upon the world of software reverse engineering. It inspired me
and I have spent a few weeks playing with tools such as Ollydbg and IDA. At that time I had
a limited vision regarding this industry and did not further continue in that direction.
As the years went by I found myself in the master’s year and had the privilege to choose a subject
for my dissertation. Out of the near one hundred proposals, there was just one that stood out
for me. Maybe it was because of the nostalgic feelings of a time when reverse engineering seemed
such a mysterious and fascinating world. As I am writing this preface and joyfully reflecting on
all of the things I have learned in the past few months, I must admit it was more than worth
the effort.
I would like to thank everyone who was involved and helped me execute this dissertation. A
special thanks goes out to my supervisors prof. dr. ir. Bjorn De Sutter for such a great
experience and opportunity, dr. Bart Coppens and ir. Bert Abrath for their diligent support,
great advice and profound knowledge. A big thanks to ir. Jens Vanden Broeck for helping me
figure out various problems along the way. Lastly, I want to thank my family and close friends
for their immense support, as it kept me going strong.
Assent to loan
“The author gives permission to make this master dissertation available for consultation and to
copy parts of this master dissertation for personal use. In the case of any other use, the copyright
terms have to be respected, in particular with regard to the obligation to state expressly the
source when quoting results from this master dissertation.”
Ilja Nevolin, June 2017
Advanced anti-debugging techniquesby
Ilja Nevolin
Master’s dissertation submitted in order to obtain the academic degree of
Master of Science in Information Engineering Technology
Academic year 2016-2017
Supervisors: prof. dr. ir. Bjorn De Sutter, dr. Bart Coppens, ir. Bert Abrath
Department of Electronics and Information Systems
Chair: prof. dr. ir. Rik Van de Walle
Faculty of Engineering and Architecture
Ghent University
Abstract
In this dissertation we look for new strategies to protect software from debugging attacks. These
advanced anti-debugging techniques are based upon an existing self-debugging implementation
with migrated code fragments from the main application to the debugger’s context. Even though
this is a promising solution it does come with four flaws. First we will attempt to improve the
stealthiness of context switches between the application and its debugger. Secondly we look for
alternative ways to pass the destination address to the debugger’s context. Third, we develop
a method for validating and distinguishing explicit from randomly occurring context switches.
Finally we analyse different approaches to enhance the debugger’s protection against static and
dynamic analysis. Our research solely focuses on the protection of executable binaries, but it
may be generalized for other files such as dynamically linked libraries.
Keywords
Anti-debugging, self-debugging, reverse engineering
Geavanceerde anti-debugging techniekenIlja Nevolin
Begeleiders: prof. dr. ir. Bjorn De Sutter, dr. Bart Coppens en ir. Bert Abrath
Abstract—In deze thesis gaan we op zoek naar technieken om debugging-aanvallen tegen te gaan. We gaan hiertoe bestaande zelf-debugging tech-nieken uitbreiden tot geavanceerde anti-debugging technieken. Bij zelf-debugging worden vooraf geselecteerde codefragmenten getransformeerden verplaatst uit de context van de debuggee naar die van de debugger. Dereeds bestaande zelf-debugging implementatie [1] had een viertal tekortko-mingen op vlak van beveiliging die we trachtten weg te werken. Ten eerstehebben wij alternatieve technieken onderzocht om invocaties van contextswitches te obfusceren. Ten tweede gingen we op zoek naar alternatieve me-thoden om het doeladres van een gemigreerde codefragment door te gevenaan de debugger. Ten derde ontworpen wij een methode om expliciete con-text switches te onderscheiden van toevallige fouten. Tot slot analyseerdenwij verschillende aanpakken om de debugger te beschermen tegen dynami-sche als statische analyse. Ons onderzoek beperkte zich tot het beveiligenvan binaire uitvoerbare bestanden, maar in principe kan ze ook op biblio-theken toegepast worden.
Kernwoorden—Anti-debugging, zelf-debugging, reverse engineering
I. INLEIDING
SOFTWARE is nagenoeg onmisbaar in onze digitale maat-schappij. De organisaties die verantwoordelijk zijn voor
de ontwikkeling en distributie van software zijn ervan bewustdat hun producten onderhevig kunnen zijn aan Man-At-The-End(MATE) aanvallen zoals reverse engineering. Vele softwarepro-ducten bevatten ook code die de leveranciers geheim wensen tehouden, hoofdzakelijk wegens economische redenen. Een voor-beeld hiervan is een licentiesysteem die een aanvaller kan trach-ten te omzeilen om zo volledige toegang te krijgen tot betaaldemodules. Omdat auteursrechten te weinig bescherming biedenop dit vlak, is het noodzakelijk om software op andere manierente gaan beveiligen.
Aanvallers bezitten verschillende reverse engineering toolsdie hun kunnen helpen om de werking van een bepaald soft-wareproduct te achterhalen en de beveiliging ervan te omzeilen.Aangezien er verschillende aanvalsvectoren zijn, bestaan er dus-danig ook verscheidene beveiligingstechnieken. Spijtig genoegkan elke techniek omzeild worden, mits voldoende tijd, midde-len en geduld. Hieruit leiden we af dat ons doel is om aanvallerszo veel mogelijk te vertragen, zodat ze hopelijk de hoop opge-ven of een ander doelwit zoeken.
Een welbekende aanvalstechniek is debugging die gebruikmaakt van een debugger. Debuggers zijn kleine programma’sdie aanvallers kunnen gebruiken om bijvoorbeeld software dy-namisch te analyseren en eventueel aan te vallen. Om deze aan-vallen tegen te gaan bestaan er anti-debugging technieken dietrachten om het gebruik van debuggers te bemoeilijken. Spijtiggenoeg zijn de meeste anti-debugging implementaties vrij sim-pel, dus ook eenvoudig te omzeilen door aanvallers en analisten[5].
In deze thesis bouwen we verder op een bestaand onder-zoek over een geavanceerdere anti-debugging techniek: Zelf-debugging met gemigreerde codefragmenten, die zeer moeilijkte omzeilen valt waardoor debuggen bijna onmogelijk wordt. De
beveiliging geleverd door deze zelf-debugging techniek steuntop twee karakteristieken: Ten eerste is elk modern besturings-systeem ontwikkeld om slechts een debugger toe te laten perproces. Zelf-debugging zorgt ervoor dat een programma een ei-gen debugger kan aanmaken en deze laten koppelen aan zichzelf(de debuggee). Hieruit volgt dat een aanvaller geen eigen debug-ger meer kan koppelen na de initialisatie van de zelf-debugger.Zelfs al slaagt een aanvaller er in om als eerste zijn debuggeraan te koppelen, dan kan men ervoor zorgen dat de debuggeein een oneindige lus terecht komt zoals Figuur 1 dit illustreertdoor middel van C pseudocode. In onze implementatie van zelf-debugging wordt de debugger aangemaakt door het initieel pro-ces dat zichzelf dupliceert d.m.v. een fork systeemaanroep [9].
Debuggee:
bool RUN = 0;while(!RUN);main();
Debugger:
if (attach(debuggee)){debuggee.RUN=1;
}loop_debug();
Fig. 1: Pseudocode zelf-debugging.
Het is zeker mogelijk dat een aanvaller de zelf-debugger ont-koppelt en zo plaats vrijmaakt voor zijn eigen debugger. Tentweede, als oplossing hiervoor werd zelf-debugging uitgebreidmet het concept van gemigreerde codefragmenten. Software-ontwikkelaars kunnen bepaalde, vaak cruciale, codefragmentenlaten migreren uit de context van de debuggee naar die van dedebugger. Figuur 2 illustreert het controleverloop gebruikma-kend van zelf-debugging met gemigreerde codefragmenten. Dedebugger wordt nu verantwoordelijk om deze fragmenten uit tevoeren als de debuggee er om vraagt en zal vervolgens de con-text van de debuggee aanpassen. In de debuggee worden dezefragmenten vervangen door stubs, met als enig doel de debuggeraan te spreken en de nodige informatie door te geven. Omdat dedebugger niet weet wanneer en welk gemigreerd fragment uit-
Fig. 2: Zelf-debugging met gemigreerde codefragmenten.
gevoerd moet worden, zal de stub deze informatie moeten voor-zien aan de debugger. Deze techniek is beter dan de meeste be-staande anti-debugging technieken wegens het feit dat deze zelfaangemaakte debugger onmisbaar wordt. Met andere woorden,als een aanvaller een poging maakt ze te ontkoppelen kan de ap-plicatie verkeerde resultaten genereren en/of mogelijks crashen.Dit komt doordat de (cruciale) gemigreerde codefragmenten nietworden uitgevoerd.
II. ZELF-DEBUGGING VERBETEREN
A. Context switch invocaties
De originele zelf-debugging techniek waarop wij voortbou-wen gebruikt breakpoint (BKPT) instructies in de stubs om eencontext switch te veroorzaken. Het doel van een context switchis om de debuggee te onderbreken en de controle over te ge-ven aan de debugger. Vervolgens kan de debugger de juiste ge-migreerde codefragment uitvoeren, de context van de debuggeeaanpassen en tot slot de controle terug aan de debuggee geven.BKPT instructies komen in de praktijk zelden voor en onthullenin ons geval de gebruikte beveiligingstechniek. We hebben ver-schillende manieren onderzocht om de controle over te dragennaar de debugger die we nu bespreken:
• Delen door nul: Ons eerst concept was om een aritmeti-sche bewerking te gebruiken zodat er een SIGFPE signaal [7]de context switch zou veroorzaken. We kozen voor een de-ling door nul, hiervoor hebben we de BKPT vervangen dooreen UDIV(/SDIV) instructie. Uit onze experimenten bleek dezestrategie niet volledig te werken als verwacht. In de plaatsvan een SIGFPE werd er een SIGILL signaal [7] gegenereerd.Dit signaal geeft aan dat er een ongeldige instructie uitgevoerdwerd. Concreter betekent dit dat de uitgevoerde instructie nietondersteund wordt door de microprocessor. De UDIV/SDIV in-structies zijn namelijk optioneel en dus niet geımplementeerdvoor bepaalde ARM versies [10].Het feit dat de deze method geen SIGFPE, maar een SIGILL,veroorzaakt is geen probleem op zich. Niet elke aanvaller is opde hoogte van het feit dat UDIV/SDIV instructies niet onder-steund zijn. Vanuit hun perspectief zal bij het deassembleren,van het beveiligd bestand, blijken dat UDIV/SDIV als geldigeinstructies weergegeven worden. Hierdoor blijft deze methodezeker en vast bruikbaar en vormt een potentieel beter alternatiefop BKPT instructies.
• Ongeldige instructies: De voorgaande techniek gebruikma-kend van UDIV/SDIV liet ons toe om ongeldige instructies ver-der te analyseren. Het idee was om een set van 32-bit waar-den te vinden die ongeldige instructies voorstellen. Zo konelke stub een willekeurige instructie uit deze set gebruiken omeen SIGILL te genereren. Al deze varianten, uitgezonderdUDIV/SDIV, worden spijtig genoeg expliciet weergegeven alsongeldige instructies bij het deassembleren. Hierdoor onthultdeze techniek informatie over de gebruikte beveiliging en is hetniet aangeraden ze verder te gebruiken.
• Data-alignering: Bepaalde instructies die gebruik maken vanadressen, om data te laden en op te slaan, hebben enkele vereis-ten. Een hiervan is data-alignering, die legt vast dat alle adressen
Fig. 3: SIGSEGV variant een.
correct gealigneerd moeten zijn. Indien deze instructies een on-gealigneerd adres raadplegen dan zou er een SIGBUS signaal[7] optreden en dus ook een context switch. Volgens de ARMv7handleiding zijn de instructies in kwestie respectievelijk LDRD,STRD, LDM en STM [12]. Uit enkele experimenten bleek dezestelling deels ongeldig. De reden hiervoor is te vinden in de Li-nux kernel: de module genaamd “mem alignment” herstelt on-gealigneerde adressen en verhindert zo SIGBUS signalen [11],[13]. Men kan deze module eventueel uitzetten zodat er altijdeen SIGBUS optreedt. Spijtig genoeg staat ze standaard aange-schakeld waardoor deze techniek verder onbruikbaar wordt.
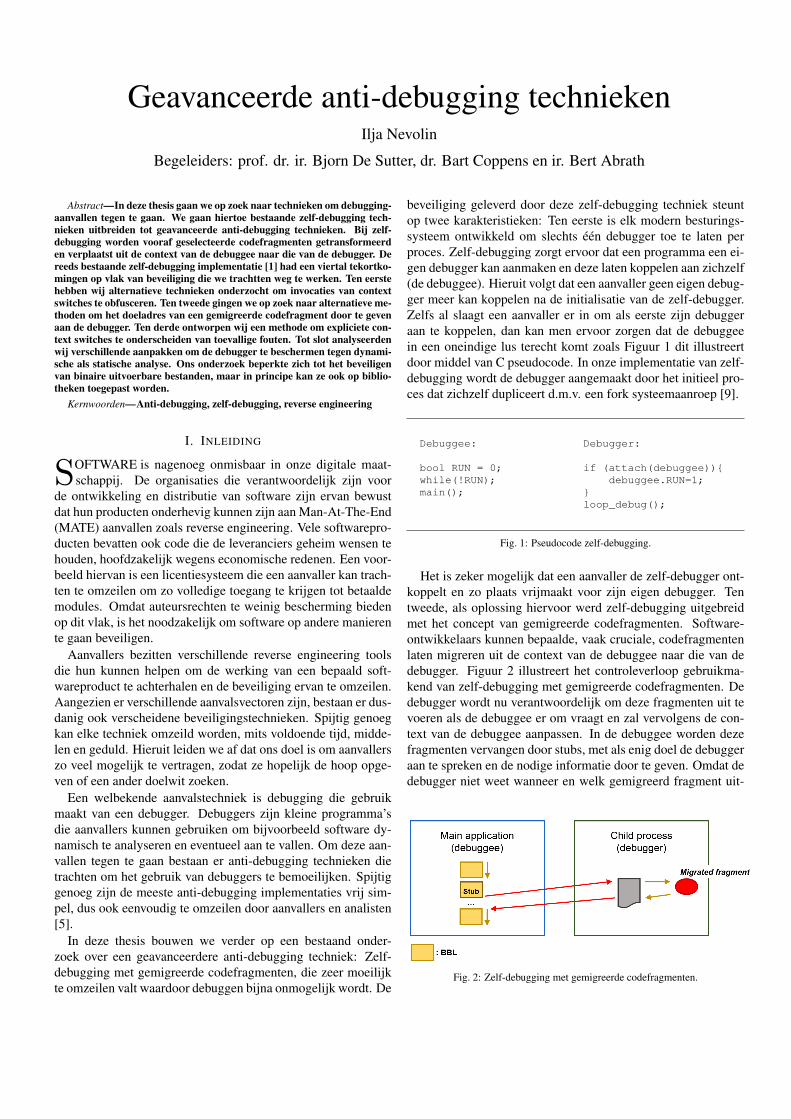
• Segmentatiefouten: Een tweede, striktere, vereiste vanlaad- en opslaginstructies is dat er geen ongebruikt/onbestaandeadressen geraadpleegd mogen worden. Verder nog, indien eenlaad-/opslaginstructie een poging maakt tot data op een adresdat niet bestaat of waartoe ze geen lees-/schrijfrechten heeft danwordt er een SIGSEGV signaal [7] gegenereerd. Deze eigen-schap geldt voor alle varianten van laad- en opslaginstructies, inwat volgt passen wij deze toe.Een eerste variant van onze techniek, zie Figuur 3, assigneerteen willekeurig ongeldig adres aan een willekeurig maar be-schikbaar register. In plaats van een BKPT instructie gebrui-ken we nu eenvoudige en willekeurige laad-/opslaginstructie b.v.LDR/STR met als tweede operand ons gekozen register. Dezelaatste instructie zal een SIGSEGV signaal veroorzaken en dusook een context switch tot gevolg hebben. Merk op dat wij eenongeldig adres gebruiken die in het bereik ligt van 0xC0000000en 0xFFFFFFFF beiden inclusief. Dit adresbereik is gereser-veerd door en voor de kernel, waardoor alle toegang vanuit degebruikersomgeving resulteert in een SIGSEGV signaal [14].
Een variant van deze techniek zal niet langer zelf laad- en/of op-slaginstructies toevoegen die een SIGSEGV veroorzaken, maarlaten we ze reeds bestaande instructies uit de code hergebruiken.Een voordeel hiervan is dat wij een aanvaller meer gaan verwar-ren. Voor de aanvaller wordt het dus nog lastiger om de softwareaan te vallen omdat deze bestaande instructies niet zomaar ge-wijzigd mogen worden. Dit bekomen we door alle mogelijkekandidaten voor laad- en/of opslaginstructies op te sporen. Ver-volgens bepalen we per stub een doorsnede van alle kandidatenwaarvan de tweede operand een vrij register is op dat ogenblik.Ten slotte voegen we een branch/jump instructie toe naar eenwillekeurige kandidaat uit deze doorsnede.
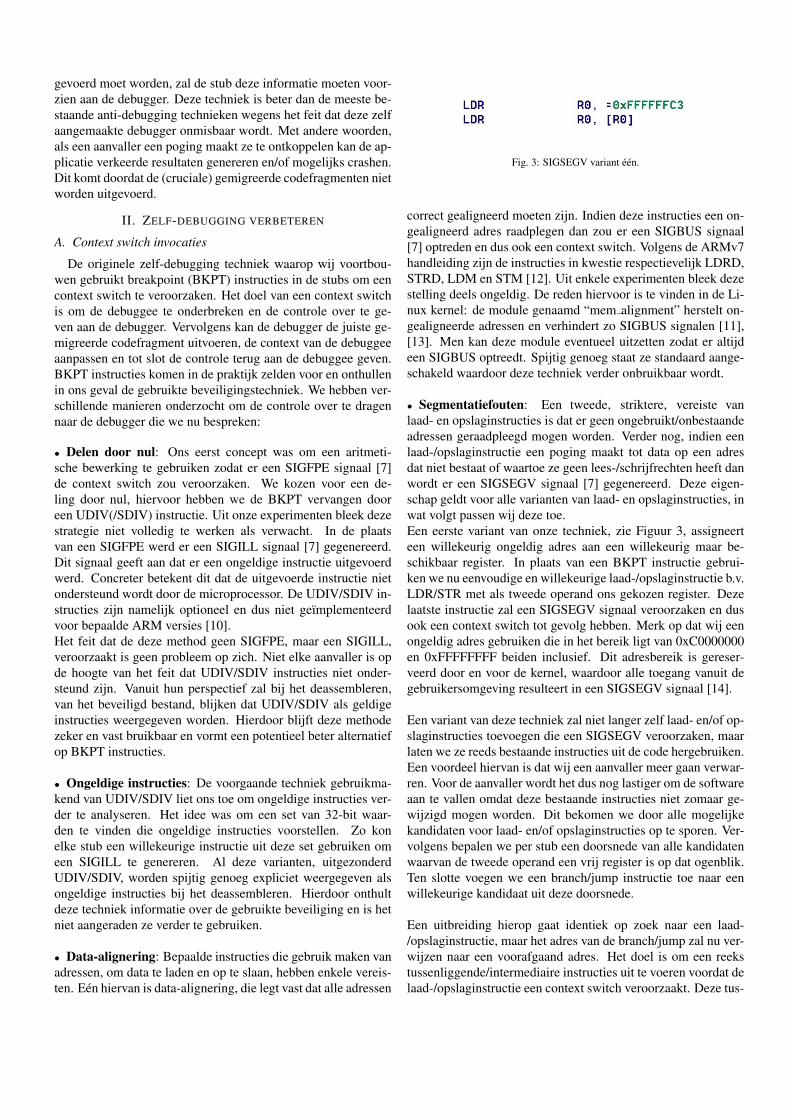
Een uitbreiding hierop gaat identiek op zoek naar een laad-/opslaginstructie, maar het adres van de branch/jump zal nu ver-wijzen naar een voorafgaand adres. Het doel is om een reekstussenliggende/intermediaire instructies uit te voeren voordat delaad-/opslaginstructie een context switch veroorzaakt. Deze tus-
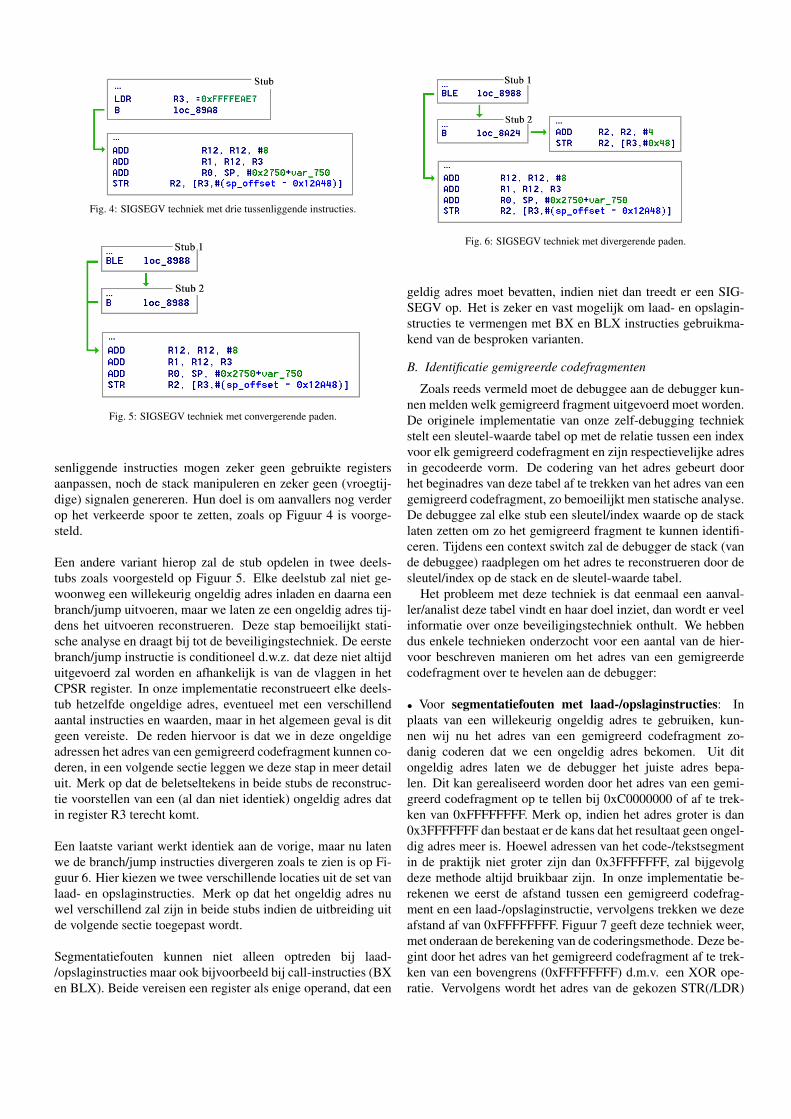
Fig. 4: SIGSEGV techniek met drie tussenliggende instructies.
Fig. 5: SIGSEGV techniek met convergerende paden.
senliggende instructies mogen zeker geen gebruikte registersaanpassen, noch de stack manipuleren en zeker geen (vroegtij-dige) signalen genereren. Hun doel is om aanvallers nog verderop het verkeerde spoor te zetten, zoals op Figuur 4 is voorge-steld.
Een andere variant hierop zal de stub opdelen in twee deels-tubs zoals voorgesteld op Figuur 5. Elke deelstub zal niet ge-woonweg een willekeurig ongeldig adres inladen en daarna eenbranch/jump uitvoeren, maar we laten ze een ongeldig adres tij-dens het uitvoeren reconstrueren. Deze stap bemoeilijkt stati-sche analyse en draagt bij tot de beveiligingstechniek. De eerstebranch/jump instructie is conditioneel d.w.z. dat deze niet altijduitgevoerd zal worden en afhankelijk is van de vlaggen in hetCPSR register. In onze implementatie reconstrueert elke deels-tub hetzelfde ongeldige adres, eventueel met een verschillendaantal instructies en waarden, maar in het algemeen geval is ditgeen vereiste. De reden hiervoor is dat we in deze ongeldigeadressen het adres van een gemigreerd codefragment kunnen co-deren, in een volgende sectie leggen we deze stap in meer detailuit. Merk op dat de beletseltekens in beide stubs de reconstruc-tie voorstellen van een (al dan niet identiek) ongeldig adres datin register R3 terecht komt.
Een laatste variant werkt identiek aan de vorige, maar nu latenwe de branch/jump instructies divergeren zoals te zien is op Fi-guur 6. Hier kiezen we twee verschillende locaties uit de set vanlaad- en opslaginstructies. Merk op dat het ongeldig adres nuwel verschillend zal zijn in beide stubs indien de uitbreiding uitde volgende sectie toegepast wordt.
Segmentatiefouten kunnen niet alleen optreden bij laad-/opslaginstructies maar ook bijvoorbeeld bij call-instructies (BXen BLX). Beide vereisen een register als enige operand, dat een
Fig. 6: SIGSEGV techniek met divergerende paden.
geldig adres moet bevatten, indien niet dan treedt er een SIG-SEGV op. Het is zeker en vast mogelijk om laad- en opslagin-structies te vermengen met BX en BLX instructies gebruikma-kend van de besproken varianten.
B. Identificatie gemigreerde codefragmenten
Zoals reeds vermeld moet de debuggee aan de debugger kun-nen melden welk gemigreerd fragment uitgevoerd moet worden.De originele implementatie van onze zelf-debugging techniekstelt een sleutel-waarde tabel op met de relatie tussen een indexvoor elk gemigreerd codefragment en zijn respectievelijke adresin gecodeerde vorm. De codering van het adres gebeurt doorhet beginadres van deze tabel af te trekken van het adres van eengemigreerd codefragment, zo bemoeilijkt men statische analyse.De debuggee zal elke stub een sleutel/index waarde op de stacklaten zetten om zo het gemigreerd fragment te kunnen identifi-ceren. Tijdens een context switch zal de debugger de stack (vande debuggee) raadplegen om het adres te reconstrueren door desleutel/index op de stack en de sleutel-waarde tabel.
Het probleem met deze techniek is dat eenmaal een aanval-ler/analist deze tabel vindt en haar doel inziet, dan wordt er veelinformatie over onze beveiligingstechniek onthult. We hebbendus enkele technieken onderzocht voor een aantal van de hier-voor beschreven manieren om het adres van een gemigreerdecodefragment over te hevelen aan de debugger:
• Voor segmentatiefouten met laad-/opslaginstructies: Inplaats van een willekeurig ongeldig adres te gebruiken, kun-nen wij nu het adres van een gemigreerd codefragment zo-danig coderen dat we een ongeldig adres bekomen. Uit ditongeldig adres laten we de debugger het juiste adres bepa-len. Dit kan gerealiseerd worden door het adres van een gemi-greerd codefragment op te tellen bij 0xC0000000 of af te trek-ken van 0xFFFFFFFF. Merk op, indien het adres groter is dan0x3FFFFFFF dan bestaat er de kans dat het resultaat geen ongel-dig adres meer is. Hoewel adressen van het code-/tekstsegmentin de praktijk niet groter zijn dan 0x3FFFFFFF, zal bijgevolgdeze methode altijd bruikbaar zijn. In onze implementatie be-rekenen we eerst de afstand tussen een gemigreerd codefrag-ment en een laad-/opslaginstructie, vervolgens trekken we dezeafstand af van 0xFFFFFFFF. Figuur 7 geeft deze techniek weer,met onderaan de berekening van de coderingsmethode. Deze be-gint door het adres van het gemigreerd codefragment af te trek-ken van een bovengrens (0xFFFFFFFF) d.m.v. een XOR ope-ratie. Vervolgens wordt het adres van de gekozen STR(/LDR)
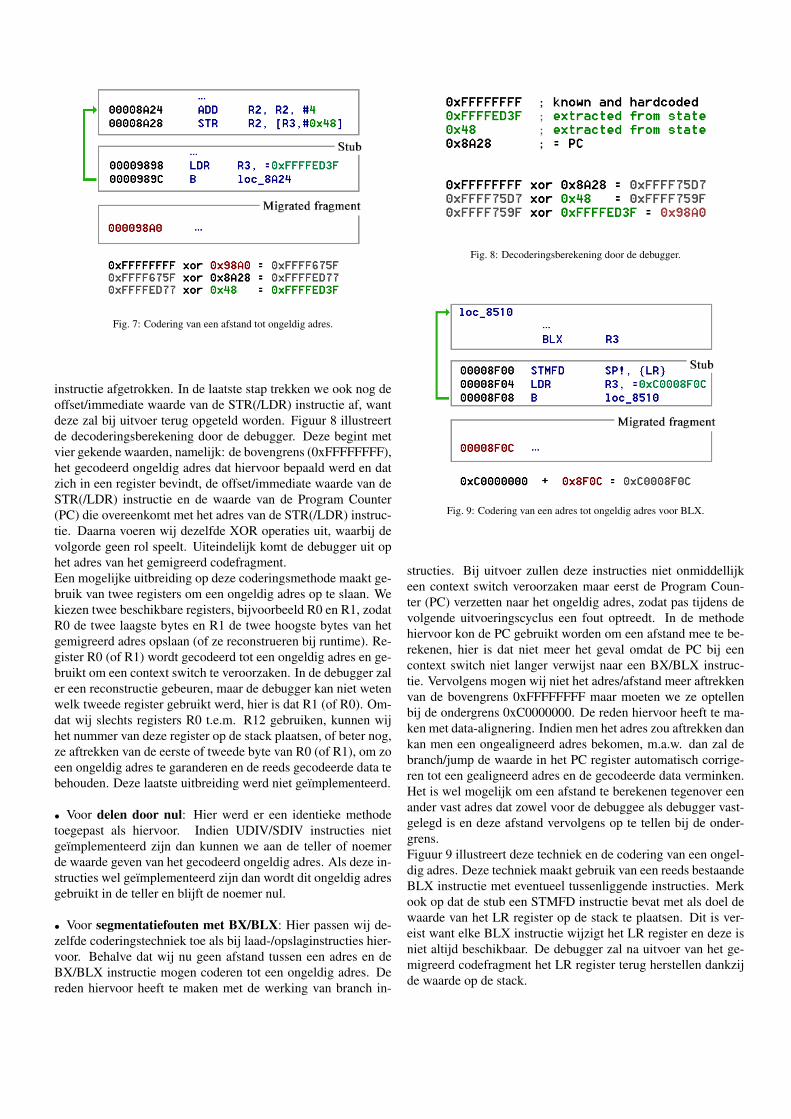
Fig. 7: Codering van een afstand tot ongeldig adres.
instructie afgetrokken. In de laatste stap trekken we ook nog deoffset/immediate waarde van de STR(/LDR) instructie af, wantdeze zal bij uitvoer terug opgeteld worden. Figuur 8 illustreertde decoderingsberekening door de debugger. Deze begint metvier gekende waarden, namelijk: de bovengrens (0xFFFFFFFF),het gecodeerd ongeldig adres dat hiervoor bepaald werd en datzich in een register bevindt, de offset/immediate waarde van deSTR(/LDR) instructie en de waarde van de Program Counter(PC) die overeenkomt met het adres van de STR(/LDR) instruc-tie. Daarna voeren wij dezelfde XOR operaties uit, waarbij devolgorde geen rol speelt. Uiteindelijk komt de debugger uit ophet adres van het gemigreerd codefragment.Een mogelijke uitbreiding op deze coderingsmethode maakt ge-bruik van twee registers om een ongeldig adres op te slaan. Wekiezen twee beschikbare registers, bijvoorbeeld R0 en R1, zodatR0 de twee laagste bytes en R1 de twee hoogste bytes van hetgemigreerd adres opslaan (of ze reconstrueren bij runtime). Re-gister R0 (of R1) wordt gecodeerd tot een ongeldig adres en ge-bruikt om een context switch te veroorzaken. In de debugger zaler een reconstructie gebeuren, maar de debugger kan niet wetenwelk tweede register gebruikt werd, hier is dat R1 (of R0). Om-dat wij slechts registers R0 t.e.m. R12 gebruiken, kunnen wijhet nummer van deze register op de stack plaatsen, of beter nog,ze aftrekken van de eerste of tweede byte van R0 (of R1), om zoeen ongeldig adres te garanderen en de reeds gecodeerde data tebehouden. Deze laatste uitbreiding werd niet geımplementeerd.
• Voor delen door nul: Hier werd er een identieke methodetoegepast als hiervoor. Indien UDIV/SDIV instructies nietgeımplementeerd zijn dan kunnen we aan de teller of noemerde waarde geven van het gecodeerd ongeldig adres. Als deze in-structies wel geımplementeerd zijn dan wordt dit ongeldig adresgebruikt in de teller en blijft de noemer nul.
• Voor segmentatiefouten met BX/BLX: Hier passen wij de-zelfde coderingstechniek toe als bij laad-/opslaginstructies hier-voor. Behalve dat wij nu geen afstand tussen een adres en deBX/BLX instructie mogen coderen tot een ongeldig adres. Dereden hiervoor heeft te maken met de werking van branch in-
Fig. 8: Decoderingsberekening door de debugger.
Fig. 9: Codering van een adres tot ongeldig adres voor BLX.
structies. Bij uitvoer zullen deze instructies niet onmiddellijkeen context switch veroorzaken maar eerst de Program Coun-ter (PC) verzetten naar het ongeldig adres, zodat pas tijdens devolgende uitvoeringscyclus een fout optreedt. In de methodehiervoor kon de PC gebruikt worden om een afstand mee te be-rekenen, hier is dat niet meer het geval omdat de PC bij eencontext switch niet langer verwijst naar een BX/BLX instruc-tie. Vervolgens mogen wij niet het adres/afstand meer aftrekkenvan de bovengrens 0xFFFFFFFF maar moeten we ze optellenbij de ondergrens 0xC0000000. De reden hiervoor heeft te ma-ken met data-alignering. Indien men het adres zou aftrekken dankan men een ongealigneerd adres bekomen, m.a.w. dan zal debranch/jump de waarde in het PC register automatisch corrige-ren tot een gealigneerd adres en de gecodeerde data verminken.Het is wel mogelijk om een afstand te berekenen tegenover eenander vast adres dat zowel voor de debuggee als debugger vast-gelegd is en deze afstand vervolgens op te tellen bij de onder-grens.Figuur 9 illustreert deze techniek en de codering van een ongel-dig adres. Deze techniek maakt gebruik van een reeds bestaandeBLX instructie met eventueel tussenliggende instructies. Merkook op dat de stub een STMFD instructie bevat met als doel dewaarde van het LR register op de stack te plaatsen. Dit is ver-eist want elke BLX instructie wijzigt het LR register en deze isniet altijd beschikbaar. De debugger zal na uitvoer van het ge-migreerd codefragment het LR register terug herstellen dankzijde waarde op de stack.
C. Context switches valideren
In de originele techniek, gebruikmakend van BKPT instruc-ties, werd er een SIGTRAP signaal gegenereerd die een contextswitch veroorzaakt. Toen werd er vanuit gegaan dat alle contextswitches ten gevolge van SIGTRAP signalen door een stub ver-oorzaakt werden en niet door een fout in de code. Nu dat wijandere instructies gebruiken zou het kunnen gebeuren dat sig-nalen zoals SIGSEGV en SIGILL elders veroorzaakt worden inde code. Om een onderscheid te kunnen maken tussen beide ge-vallen moet er een strategie voorzien worden. Dit is interessantvoor ons, de ontwikkelaars, om fouten op te sporen. Maar ookals de ontwikkelaar een eigen speciaal gedrag wil implemente-ren voor onvoorziene fouten.
Een eerste mogelijke methode maakt gebruik van de stack.We leggen een verzameling van 32-bit waarden vast (b.v.0xF123F456 en 0xF0102030). Voor elke stub kiezen wij eenwillekeurige waarde uit deze verzameling en plaatsen we dezeop de stack. Bij een context switch kan de debugger validerenals de SIGSEGV/SIGILL veroorzaakt werd door onze stub ofniet. Dit gebeurt door de waarde bovenaan de stack te vergelij-ken met elke waarde uit de verzameling, indien ze niet voorkomtdan weet de debugger dat er een onvoorziene fout optrad. Merkop dat hoe meer unieke waarden we vastleggen, des te groter dekans wordt dat er valse positieven kunnen optreden.
In onze implementatie kozen wij voor een andere techniek,waarbij we gebruik maakten van de sleutel-waarde tabel metde gemigreerde adressen. Hoewel het niet aangeraden is dezenog te gebruiken zullen we alle adreswaarden verminken doormiddel van een XOR operatie met een willekeurig gekozen 32-bit masker. Nu zal het vinden van deze tabel voor een aan-valler/analist weinig informatie onthullen en bijdrage leveren.Maar wij gebruikten deze verminkte adressen om er contextswitches mee te valideren. Eerst lieten we onze debugger hetadres bepalen van een gemigreerd codefragment gebruikmakendvan alle beschikbare informatie, deze zal incorrect zijn indien decontext switch niet vanuit een stub voortkwam. Vervolgens test-ten we het bekomen adres met alle adreswaarden uit de tabel.Tijdens het testen zal dit adres ook verminkt moet worden methetzelfde masker. Als de debugger een match vindt dan wetenwij met zeer grote zekerheid dat de context switch niet het re-sultaat was van een onvoorziene fout.
D. Beveiligen van de debugger
Tot nu toe was onze debugger niet voorzien van enige anti-debugging bescherming. Hier volgen enkele technieken waar-van de meeste slechts proof-of-concept implementaties zijn.
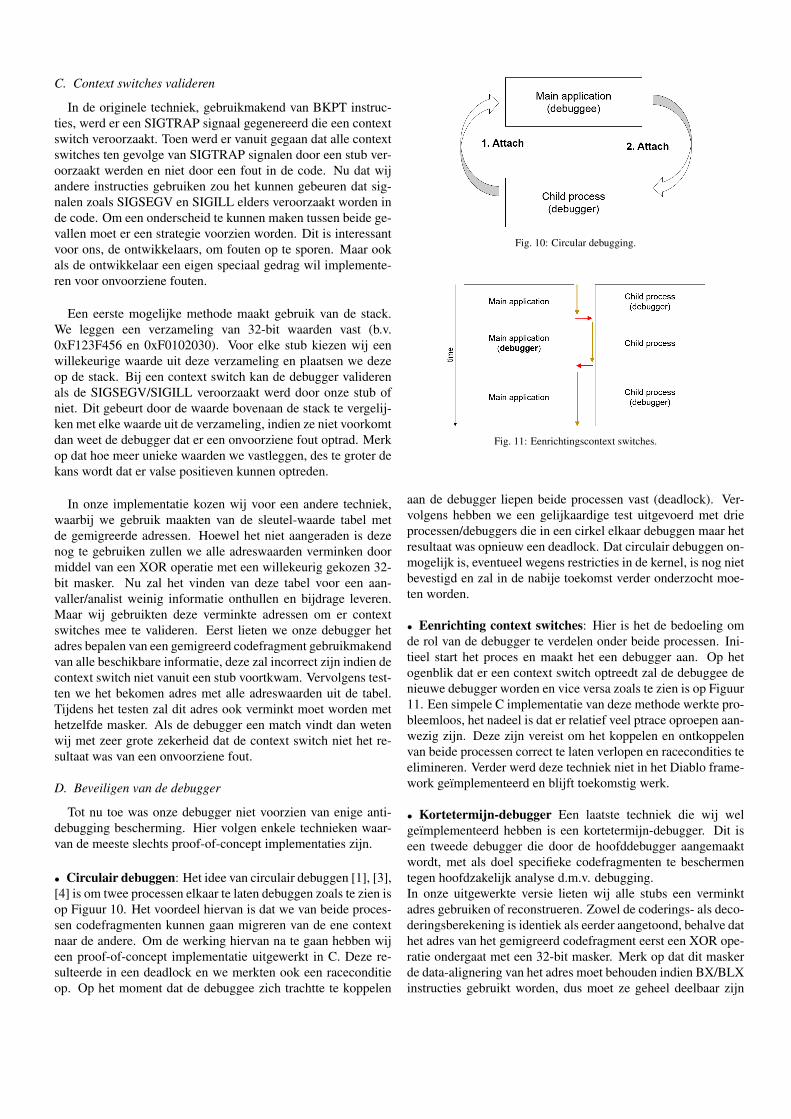
• Circulair debuggen: Het idee van circulair debuggen [1], [3],[4] is om twee processen elkaar te laten debuggen zoals te zien isop Figuur 10. Het voordeel hiervan is dat we van beide proces-sen codefragmenten kunnen gaan migreren van de ene contextnaar de andere. Om de werking hiervan na te gaan hebben wijeen proof-of-concept implementatie uitgewerkt in C. Deze re-sulteerde in een deadlock en we merkten ook een raceconditieop. Op het moment dat de debuggee zich trachtte te koppelen
Fig. 10: Circular debugging.
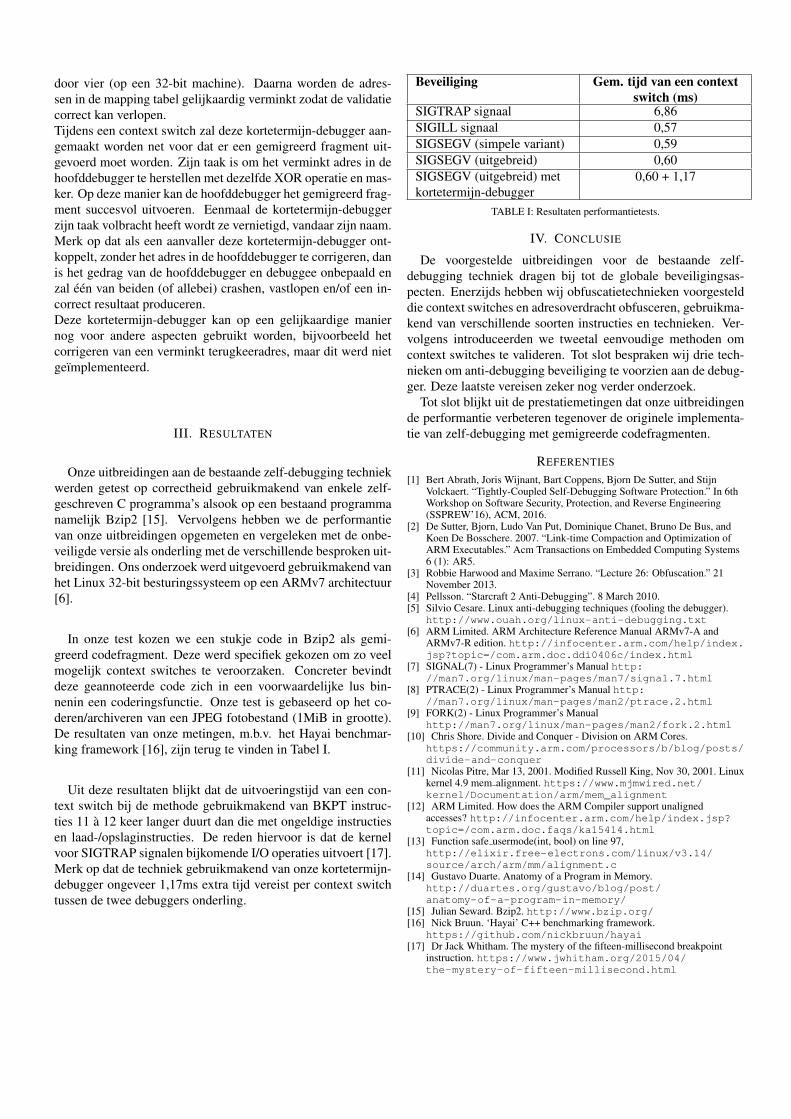
Fig. 11: Eenrichtingscontext switches.
aan de debugger liepen beide processen vast (deadlock). Ver-volgens hebben we een gelijkaardige test uitgevoerd met drieprocessen/debuggers die in een cirkel elkaar debuggen maar hetresultaat was opnieuw een deadlock. Dat circulair debuggen on-mogelijk is, eventueel wegens restricties in de kernel, is nog nietbevestigd en zal in de nabije toekomst verder onderzocht moe-ten worden.
• Eenrichting context switches: Hier is het de bedoeling omde rol van de debugger te verdelen onder beide processen. Ini-tieel start het proces en maakt het een debugger aan. Op hetogenblik dat er een context switch optreedt zal de debuggee denieuwe debugger worden en vice versa zoals te zien is op Figuur11. Een simpele C implementatie van deze methode werkte pro-bleemloos, het nadeel is dat er relatief veel ptrace oproepen aan-wezig zijn. Deze zijn vereist om het koppelen en ontkoppelenvan beide processen correct te laten verlopen en racecondities teelimineren. Verder werd deze techniek niet in het Diablo frame-work geımplementeerd en blijft toekomstig werk.
• Kortetermijn-debugger Een laatste techniek die wij welgeımplementeerd hebben is een kortetermijn-debugger. Dit iseen tweede debugger die door de hoofddebugger aangemaaktwordt, met als doel specifieke codefragmenten te beschermentegen hoofdzakelijk analyse d.m.v. debugging.In onze uitgewerkte versie lieten wij alle stubs een verminktadres gebruiken of reconstrueren. Zowel de coderings- als deco-deringsberekening is identiek als eerder aangetoond, behalve dathet adres van het gemigreerd codefragment eerst een XOR ope-ratie ondergaat met een 32-bit masker. Merk op dat dit maskerde data-alignering van het adres moet behouden indien BX/BLXinstructies gebruikt worden, dus moet ze geheel deelbaar zijn
door vier (op een 32-bit machine). Daarna worden de adres-sen in de mapping tabel gelijkaardig verminkt zodat de validatiecorrect kan verlopen.Tijdens een context switch zal deze kortetermijn-debugger aan-gemaakt worden net voor dat er een gemigreerd fragment uit-gevoerd moet worden. Zijn taak is om het verminkt adres in dehoofddebugger te herstellen met dezelfde XOR operatie en mas-ker. Op deze manier kan de hoofddebugger het gemigreerd frag-ment succesvol uitvoeren. Eenmaal de kortetermijn-debuggerzijn taak volbracht heeft wordt ze vernietigd, vandaar zijn naam.Merk op dat als een aanvaller deze kortetermijn-debugger ont-koppelt, zonder het adres in de hoofddebugger te corrigeren, danis het gedrag van de hoofddebugger en debuggee onbepaald enzal een van beiden (of allebei) crashen, vastlopen en/of een in-correct resultaat produceren.Deze kortetermijn-debugger kan op een gelijkaardige maniernog voor andere aspecten gebruikt worden, bijvoorbeeld hetcorrigeren van een verminkt terugkeeradres, maar dit werd nietgeımplementeerd.
III. RESULTATEN
Onze uitbreidingen aan de bestaande zelf-debugging techniekwerden getest op correctheid gebruikmakend van enkele zelf-geschreven C programma’s alsook op een bestaand programmanamelijk Bzip2 [15]. Vervolgens hebben we de performantievan onze uitbreidingen opgemeten en vergeleken met de onbe-veiligde versie als onderling met de verschillende besproken uit-breidingen. Ons onderzoek werd uitgevoerd gebruikmakend vanhet Linux 32-bit besturingssysteem op een ARMv7 architectuur[6].
In onze test kozen we een stukje code in Bzip2 als gemi-greerd codefragment. Deze werd specifiek gekozen om zo veelmogelijk context switches te veroorzaken. Concreter bevindtdeze geannoteerde code zich in een voorwaardelijke lus bin-nenin een coderingsfunctie. Onze test is gebaseerd op het co-deren/archiveren van een JPEG fotobestand (1MiB in grootte).De resultaten van onze metingen, m.b.v. het Hayai benchmar-king framework [16], zijn terug te vinden in Tabel I.
Uit deze resultaten blijkt dat de uitvoeringstijd van een con-text switch bij de methode gebruikmakend van BKPT instruc-ties 11 a 12 keer langer duurt dan die met ongeldige instructiesen laad-/opslaginstructies. De reden hiervoor is dat de kernelvoor SIGTRAP signalen bijkomende I/O operaties uitvoert [17].Merk op dat de techniek gebruikmakend van onze kortetermijn-debugger ongeveer 1,17ms extra tijd vereist per context switchtussen de twee debuggers onderling.
Beveiliging Gem. tijd van een contextswitch (ms)
SIGTRAP signaal 6,86SIGILL signaal 0,57SIGSEGV (simpele variant) 0,59SIGSEGV (uitgebreid) 0,60SIGSEGV (uitgebreid) metkortetermijn-debugger
0,60 + 1,17
TABLE I: Resultaten performantietests.
IV. CONCLUSIE
De voorgestelde uitbreidingen voor de bestaande zelf-debugging techniek dragen bij tot de globale beveiligingsas-pecten. Enerzijds hebben wij obfuscatietechnieken voorgestelddie context switches en adresoverdracht obfusceren, gebruikma-kend van verschillende soorten instructies en technieken. Ver-volgens introduceerden we tweetal eenvoudige methoden omcontext switches te valideren. Tot slot bespraken wij drie tech-nieken om anti-debugging beveiliging te voorzien aan de debug-ger. Deze laatste vereisen zeker nog verder onderzoek.
Tot slot blijkt uit de prestatiemetingen dat onze uitbreidingende performantie verbeteren tegenover de originele implementa-tie van zelf-debugging met gemigreerde codefragmenten.
REFERENTIES
[1] Bert Abrath, Joris Wijnant, Bart Coppens, Bjorn De Sutter, and StijnVolckaert. “Tightly-Coupled Self-Debugging Software Protection.” In 6thWorkshop on Software Security, Protection, and Reverse Engineering(SSPREW’16), ACM, 2016.
[2] De Sutter, Bjorn, Ludo Van Put, Dominique Chanet, Bruno De Bus, andKoen De Bosschere. 2007. “Link-time Compaction and Optimization ofARM Executables.” Acm Transactions on Embedded Computing Systems6 (1): AR5.
[3] Robbie Harwood and Maxime Serrano. “Lecture 26: Obfuscation.” 21November 2013.
[4] Pellsson. “Starcraft 2 Anti-Debugging”. 8 March 2010.[5] Silvio Cesare. Linux anti-debugging techniques (fooling the debugger).
http://www.ouah.org/linux-anti-debugging.txt[6] ARM Limited. ARM Architecture Reference Manual ARMv7-A and
ARMv7-R edition. http://infocenter.arm.com/help/index.jsp?topic=/com.arm.doc.ddi0406c/index.html
[7] SIGNAL(7) - Linux Programmer’s Manual http://man7.org/linux/man-pages/man7/signal.7.html
[8] PTRACE(2) - Linux Programmer’s Manual http://man7.org/linux/man-pages/man2/ptrace.2.html
[9] FORK(2) - Linux Programmer’s Manualhttp://man7.org/linux/man-pages/man2/fork.2.html
[10] Chris Shore. Divide and Conquer - Division on ARM Cores.https://community.arm.com/processors/b/blog/posts/divide-and-conquer
[11] Nicolas Pitre, Mar 13, 2001. Modified Russell King, Nov 30, 2001. Linuxkernel 4.9 mem alignment. https://www.mjmwired.net/kernel/Documentation/arm/mem_alignment
[12] ARM Limited. How does the ARM Compiler support unalignedaccesses? http://infocenter.arm.com/help/index.jsp?topic=/com.arm.doc.faqs/ka15414.html
[13] Function safe usermode(int, bool) on line 97,http://elixir.free-electrons.com/linux/v3.14/source/arch/arm/mm/alignment.c
[14] Gustavo Duarte. Anatomy of a Program in Memory.http://duartes.org/gustavo/blog/post/anatomy-of-a-program-in-memory/
[15] Julian Seward. Bzip2. http://www.bzip.org/[16] Nick Bruun. ‘Hayai’ C++ benchmarking framework.
https://github.com/nickbruun/hayai[17] Dr Jack Whitham. The mystery of the fifteen-millisecond breakpoint
instruction. https://www.jwhitham.org/2015/04/the-mystery-of-fifteen-millisecond.html
CONTENTS i
Contents
1 Introduction 1
1.1 Problem statement . . . . . . . . . . . . . . . . . . . . . . . . . . . . . . . . . . . 3
1.2 Aims of the dissertation . . . . . . . . . . . . . . . . . . . . . . . . . . . . . . . . 4
1.3 Structure of the dissertation . . . . . . . . . . . . . . . . . . . . . . . . . . . . . . 4
2 Related work 5
2.1 Preliminaries . . . . . . . . . . . . . . . . . . . . . . . . . . . . . . . . . . . . . . 5
2.2 The Linux operating system . . . . . . . . . . . . . . . . . . . . . . . . . . . . . . 5
2.2.1 Ptrace system call . . . . . . . . . . . . . . . . . . . . . . . . . . . . . . . 6
2.2.2 Signals and handlers . . . . . . . . . . . . . . . . . . . . . . . . . . . . . . 6
2.2.3 Process layout . . . . . . . . . . . . . . . . . . . . . . . . . . . . . . . . . 7
2.3 ARM architecture . . . . . . . . . . . . . . . . . . . . . . . . . . . . . . . . . . . 8
2.3.1 ARM registers . . . . . . . . . . . . . . . . . . . . . . . . . . . . . . . . . 8
2.3.2 Register liveness . . . . . . . . . . . . . . . . . . . . . . . . . . . . . . . . 9
2.3.3 ARM instruction set . . . . . . . . . . . . . . . . . . . . . . . . . . . . . . 9
2.4 Reverse engineering . . . . . . . . . . . . . . . . . . . . . . . . . . . . . . . . . . . 10
2.5 Static analysis . . . . . . . . . . . . . . . . . . . . . . . . . . . . . . . . . . . . . 11
2.6 Dynamic analysis . . . . . . . . . . . . . . . . . . . . . . . . . . . . . . . . . . . . 11
2.7 Protections against reverse engineering . . . . . . . . . . . . . . . . . . . . . . . . 12
2.7.1 Code obfuscation . . . . . . . . . . . . . . . . . . . . . . . . . . . . . . . . 12
2.7.2 Self-modifying code . . . . . . . . . . . . . . . . . . . . . . . . . . . . . . 13
2.7.3 Anti-debugging . . . . . . . . . . . . . . . . . . . . . . . . . . . . . . . . . 14
2.8 Diablo framework . . . . . . . . . . . . . . . . . . . . . . . . . . . . . . . . . . . . 18
CONTENTS ii
3 Advanced anti-debugging techniques 20
3.1 Shortcomings of tightly-coupled self-debugging . . . . . . . . . . . . . . . . . . . 20
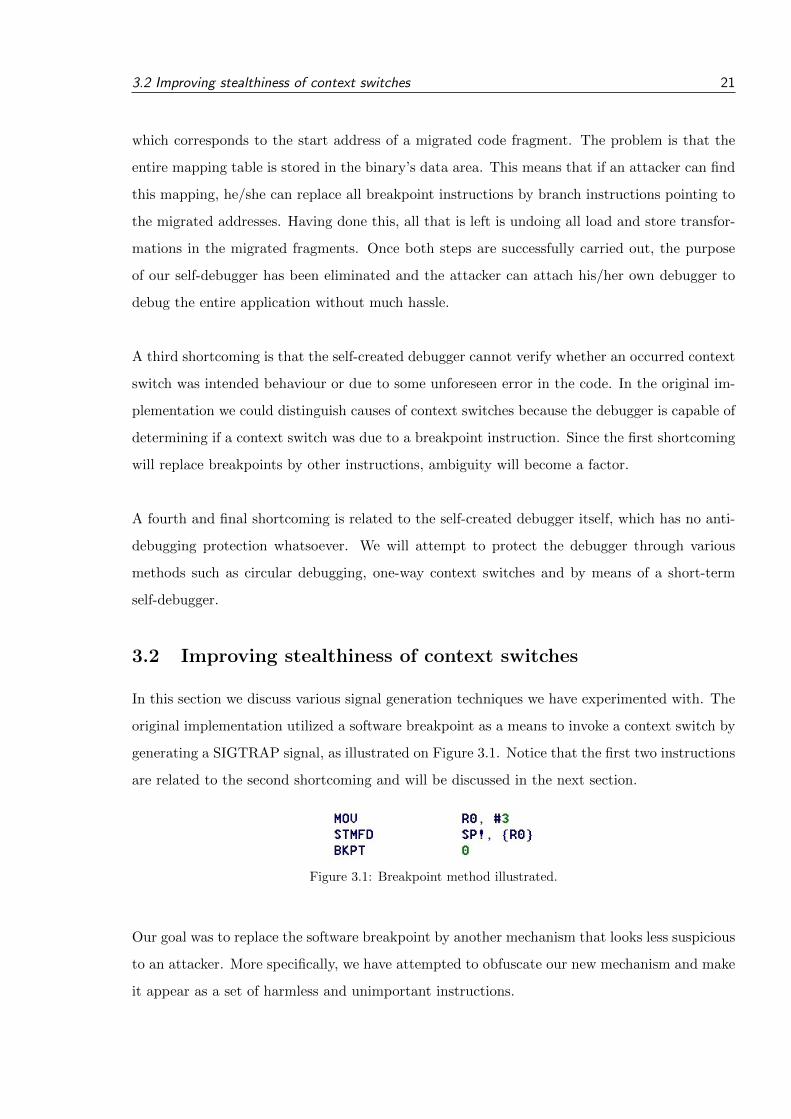
3.2 Improving stealthiness of context switches . . . . . . . . . . . . . . . . . . . . . . 21
3.2.1 Division by zero . . . . . . . . . . . . . . . . . . . . . . . . . . . . . . . . 22
3.2.2 Illegal instructions . . . . . . . . . . . . . . . . . . . . . . . . . . . . . . . 22
3.2.3 Data structure alignment . . . . . . . . . . . . . . . . . . . . . . . . . . . 23
3.2.4 Segmentation faults using load/store . . . . . . . . . . . . . . . . . . . . . 24
3.2.5 Segmentation faults using BX/BLX . . . . . . . . . . . . . . . . . . . . . 29
3.3 Identifying migrated fragments . . . . . . . . . . . . . . . . . . . . . . . . . . . . 30
3.3.1 Division by zero extended . . . . . . . . . . . . . . . . . . . . . . . . . . . 30
3.3.2 Segmentation faults using load/store extended . . . . . . . . . . . . . . . 31
3.3.3 Segmentation faults using BX/BLX extended . . . . . . . . . . . . . . . . 34
3.4 Context switch validation . . . . . . . . . . . . . . . . . . . . . . . . . . . . . . . 35
3.5 Protecting the debugger . . . . . . . . . . . . . . . . . . . . . . . . . . . . . . . . 36
3.5.1 Circular debugging . . . . . . . . . . . . . . . . . . . . . . . . . . . . . . . 36
3.5.2 One-way switches . . . . . . . . . . . . . . . . . . . . . . . . . . . . . . . . 38
3.5.3 Short-term self-debugger . . . . . . . . . . . . . . . . . . . . . . . . . . . . 39
3.5.4 Final words . . . . . . . . . . . . . . . . . . . . . . . . . . . . . . . . . . . 42
4 Evaluation 44
4.1 Correctness testing . . . . . . . . . . . . . . . . . . . . . . . . . . . . . . . . . . . 44
4.2 Execution overhead . . . . . . . . . . . . . . . . . . . . . . . . . . . . . . . . . . . 44
4.3 Self-debugging vulnerabilities . . . . . . . . . . . . . . . . . . . . . . . . . . . . . 46
5 Future work 47
6 Conclusion 48
A Bibliography 49
INTRODUCTION 1
Chapter 1
Introduction
Almost every single industry makes use of software in one way or another. The companies
responsible for the development and distribution of software are aware that their products are
prone to Man-At-The-End (MATE) attacks. Especially those which contain, for instance, unique
algorithms or a license verification system. To a lot of companies, securing such valuable assets
is critical and losing them could be a disaster.
On the other spectrum, hackers are at work trying to circumvent software protections for com-
pletely different motives. A MATE-attack, also referred to as reverse engineering, involves
obtaining a higher-level understanding of a target (malicious) application. Even governments
are oftentimes involved in reverse engineering for political reasons [13]. Last but not least,
security companies, such as anti-virus providers, invest large amounts of resources for reverse
engineering malware to better understand, detect and prevent it [14].
It is in the interest of a software company to safeguard its digital assets from malicious parties,
preventing them from completing their mission. Unfortunately they cannot fully rely on copy-
right laws for the protection of these assets. As a result various software protection techniques
are applied attempting to prevent a successful attack from taking place.
Even though many protection techniques have been invented, every single one of them can be
bypassed in one way or another. Consequently, protection strategies merely delay attackers
without any further guarantees. In some cases it is possible to make a protection quite difficult
to bypass, sometimes even for an experienced attacker.
One of such protection techniques is anti-debugging. As the name states, it prevents an attacker
from debugging the software. Since debugging is commonly used by attackers, integrating a
INTRODUCTION 2
well designed anti-debugging technique should strengthen the software’s defences. Most anti-
debugging implementations are based on very basic methods, usually provided by the operating
system, to detect whether a debugger is present or not. Unfortunately these are too simple and
can easily be bypassed even by novice attackers. More advanced anti-debugging techniques do
exist, such as self-debugging, and are usually much harder to detect and circumvent.
The core concept of self-debugging is based upon a restriction found on every modern operating
system, which is that every process can only be debugged by one debugger at a time. Even
the hardware itself is often designed to support a single debugger per process. In this case we
can make our application spawn its own debugger and attach it before the attacker attaches
his/hers. Even if the attacker still manages to attach his/her debugger first, then we can make
our application produce invalid results and/or crash by adding safeguards to check whether our
genuine debugger is present. An experienced attacker can see through this rudimentary strategy
and try to reverse engineer the self-created debugger to deal with this situation i.e. by detaching
it and re-attaching his/her own modified debugger.
An even more advanced implementation of self-debugging migrates certain code fragments from
the application’s context to the debugger’s context [1]. This means two things, firstly the
debugger becomes responsible for executing those migrated fragments. Secondly, when our
debugger becomes detached and/or replaced by that of an attacker, the application is deemed
to crash and/or produce invalid results. The reason is simply that the attacker’s debugger does
not have these migrated fragments in its memory. Thus by carefully choosing these fragments
we can ensure an incorrect program execution upon attack.
This advanced self-debugging strategy is quite effective for two main reasons. First, it fully pre-
vents the attacker from debugging the application. Secondly, if an attacker attempts to replace
the debugger then the application will malfunction and/or crash thus delaying the attacker in
his/her efforts. Our research further builds upon an existing implementation of this advanced
self-debugging strategy.
1.1 Problem statement 3
1.1 Problem statement
Self-debugging as portrayed here may appear to be the ultimate weapon against debugging at-
tacks. Unfortunately the basic implementations of self-debugging with migrated code fragments
can be circumvented in various ways. Which also means that it remains quite vulnerable to a
wide variety of attacks. What follows is a brief description of the four most obvious shortcomings:
1. First, the main process (debuggee) needs to invoke the debugger process whenever a mi-
grated code fragment should be executed. This transfer of control from one process to the
other is also referred to as a context switch. In the original implementation a breakpoint
instruction is used to invoke a context switch. These instructions are not stealthy at all
and reveal a major part of the protection strategy.
2. Secondly, the debuggee must pass critical information such that the debugger knows ex-
actly which migrated fragment to execute. The most obvious method is to pass the address
directly, another variant is to create a mapping which stores a set of distinct integers, each
mapped onto an address. In the latter case we only have to pass the integer value and not
the address, making it a little bit harder for an attacker to retrieve all addresses. Since
the mapping is stored in the binary, once discovered it reveals all migrated fragments.
3. Third, when using the breakpoint instruction we assume that all context switches were
due to our protection strategy. But since the first shortcoming attempts on replacing the
breakpoint by other error generating instructions we need a method for verifying whether
a context switch occurred due to our protection strategy or an error in the code.
4. Fourth, the debugger’s process itself is unprotected, unlike the main process, it has no
debugger attached onto itself. Consequently an attacker will have no difficulty attaching
his own debugger to the debugger’s process and reverse engineering it.
1.2 Aims of the dissertation 4
1.2 Aims of the dissertation
The first goal of this dissertation is to analyse and experiment with possible solutions for all four
problems. Secondly a selection is made of the most feasible solutions that can be automated and
implemented into an existing software protection framework called Diablo. Finally the methods
are tested and evaluated on existing software. In order to effectively evaluate our solutions,
throughout the dissertation, we put ourselves in the shoes of an attacker to see the reality
through their eyes as well.
1.3 Structure of the dissertation
Chapter one briefly discussed the problems and aims of the dissertation. Chapter two provides
a detailed overview of all important aspects one must be aware of before diving into further
chapters. The third chapter is dedicated to the realisation of our four shortcomings. In chapter
four we compare and evaluate our implementations and improvements. Chapter five mentions
which topics remain categorized as future work. Finally chapter six concludes our work.
RELATED WORK 5
Chapter 2
Related work
In this chapter we will explore the world of reverse engineering, how it works, and which tools
can be used. We will discuss various anti-debugging implementations and primarily focus on the
self-debugging technique. Finally the Diablo framework, including its most interesting features,
is briefly presented.
2.1 Preliminaries
It is generally true that the methods discussed in this dissertation are generic and can more
or less be implemented for all modern operating systems. We have used the Linux operating
system, and the target machine upon which our protected software is tested is a developer board
with an ARMv7 processor.
One of the reasons for the choice of an ARM architecture stems from the rapidly growing market
of wearables, smartphones, tablets, Internet-of-Thing devices, robots and the like, most of which
incorporate an ARM processor. A second reason is that the self-debugging implementation which
we have built upon has been designed for the ARM architecture.
2.2 The Linux operating system
As this dissertation is based on the Linux operating system, a few specific and important features
need to be introduced. Kindly note that some details described below could slightly vary between
different Linux distributions.
2.2 The Linux operating system 6
2.2.1 Ptrace system call
Ptrace is an API provided by the kernel and is used by all Linux debuggers [11]. Below is a
short list of its most relevant capabilities [16].
� Attach to a running process given the process id (PID),
� Pause a running process,
� Resume a paused process,
� Detach from a process,
� Read(write) data from(to) any specified and privileged address,
� Read(write) the value of registers,
� Get signal information; signals are discussed in the next section.
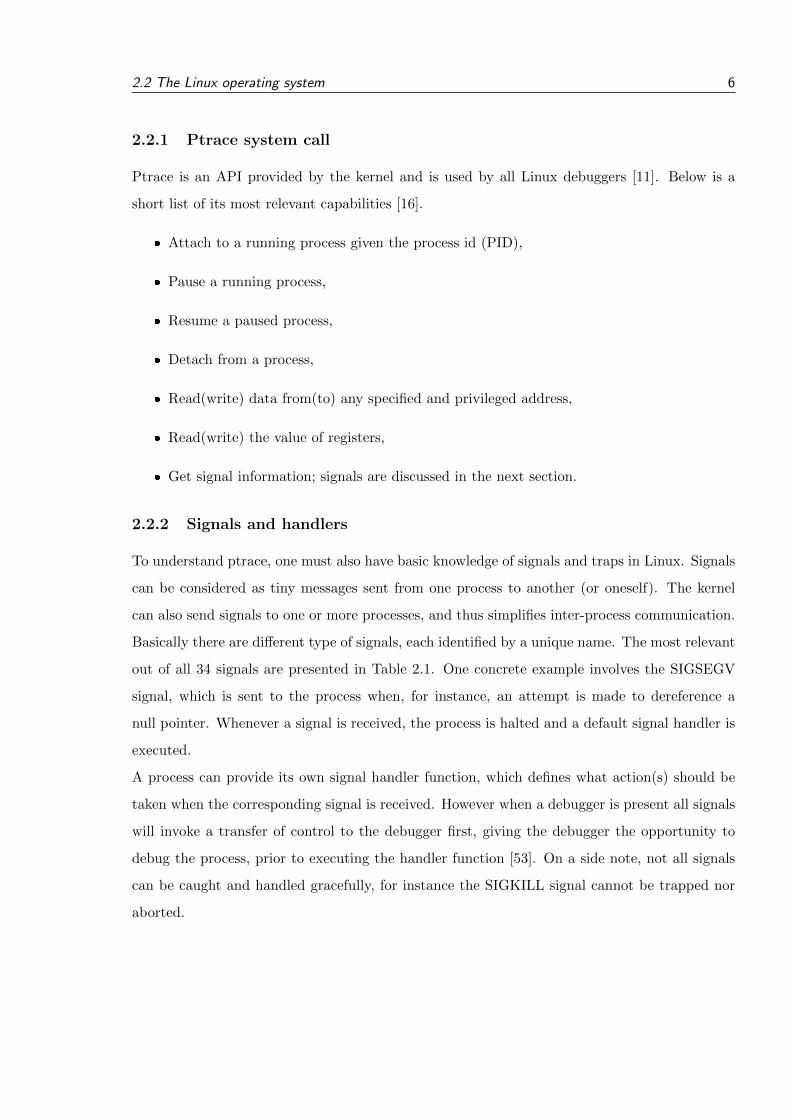
2.2.2 Signals and handlers
To understand ptrace, one must also have basic knowledge of signals and traps in Linux. Signals
can be considered as tiny messages sent from one process to another (or oneself). The kernel
can also send signals to one or more processes, and thus simplifies inter-process communication.
Basically there are different type of signals, each identified by a unique name. The most relevant
out of all 34 signals are presented in Table 2.1. One concrete example involves the SIGSEGV
signal, which is sent to the process when, for instance, an attempt is made to dereference a
null pointer. Whenever a signal is received, the process is halted and a default signal handler is
executed.
A process can provide its own signal handler function, which defines what action(s) should be
taken when the corresponding signal is received. However when a debugger is present all signals
will invoke a transfer of control to the debugger first, giving the debugger the opportunity to
debug the process, prior to executing the handler function [53]. On a side note, not all signals
can be caught and handled gracefully, for instance the SIGKILL signal cannot be trapped nor
aborted.
2.2 The Linux operating system 7
Signal name (signal number) Short description
SIGILL (4) Illegal Instruction
SIGTRAP (5) Trace/breakpoint trap
SIGFPE (8) Floating-point exception
SIGKILL (9) Kill signal
SIGBUS (10) Bus error (bad memory access)
SIGSEGV (11) Invalid memory reference
Table 2.1: Most relevant signals. [17]
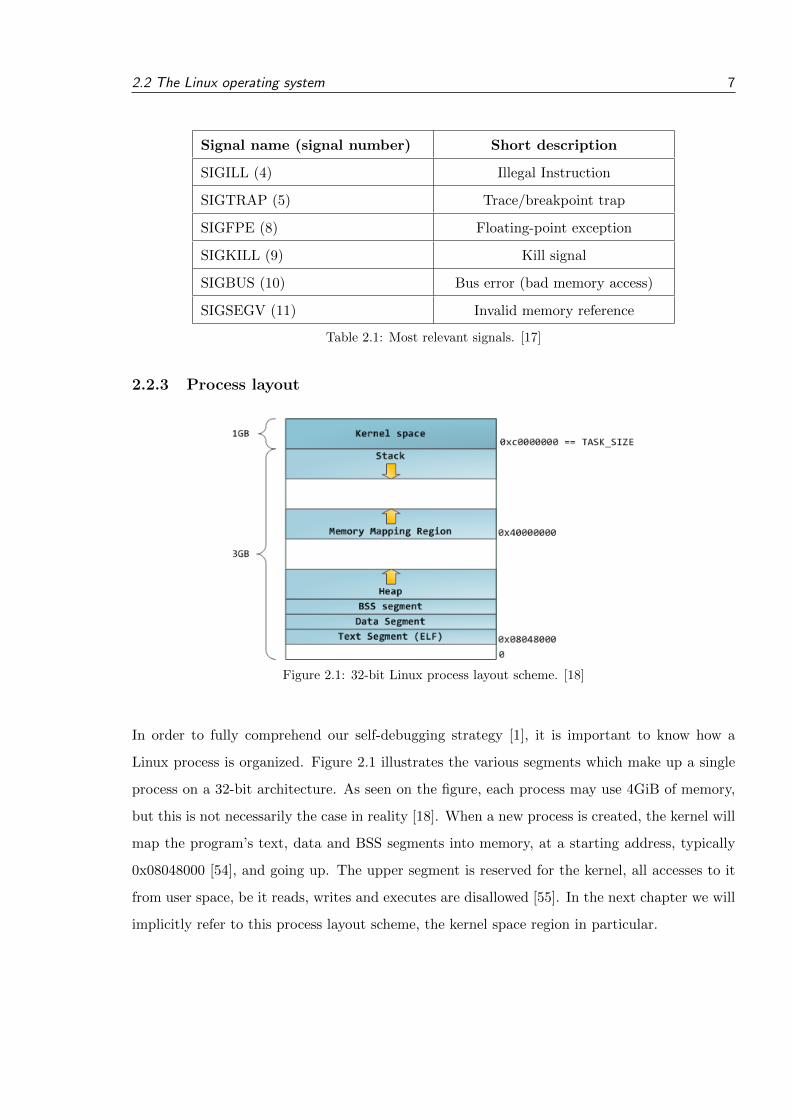
2.2.3 Process layout
Figure 2.1: 32-bit Linux process layout scheme. [18]
In order to fully comprehend our self-debugging strategy [1], it is important to know how a
Linux process is organized. Figure 2.1 illustrates the various segments which make up a single
process on a 32-bit architecture. As seen on the figure, each process may use 4GiB of memory,
but this is not necessarily the case in reality [18]. When a new process is created, the kernel will
map the program’s text, data and BSS segments into memory, at a starting address, typically
0x08048000 [54], and going up. The upper segment is reserved for the kernel, all accesses to it
from user space, be it reads, writes and executes are disallowed [55]. In the next chapter we will
implicitly refer to this process layout scheme, the kernel space region in particular.
2.3 ARM architecture 8
2.3 ARM architecture
The protection methods discussed throughout this dissertation are analysed using assembler/assembly
code, thus it is necessary to have some basic knowledge of the machine specifics. The following
sections briefly introduce our target environment’s machine, the ARMv7 processor [19].
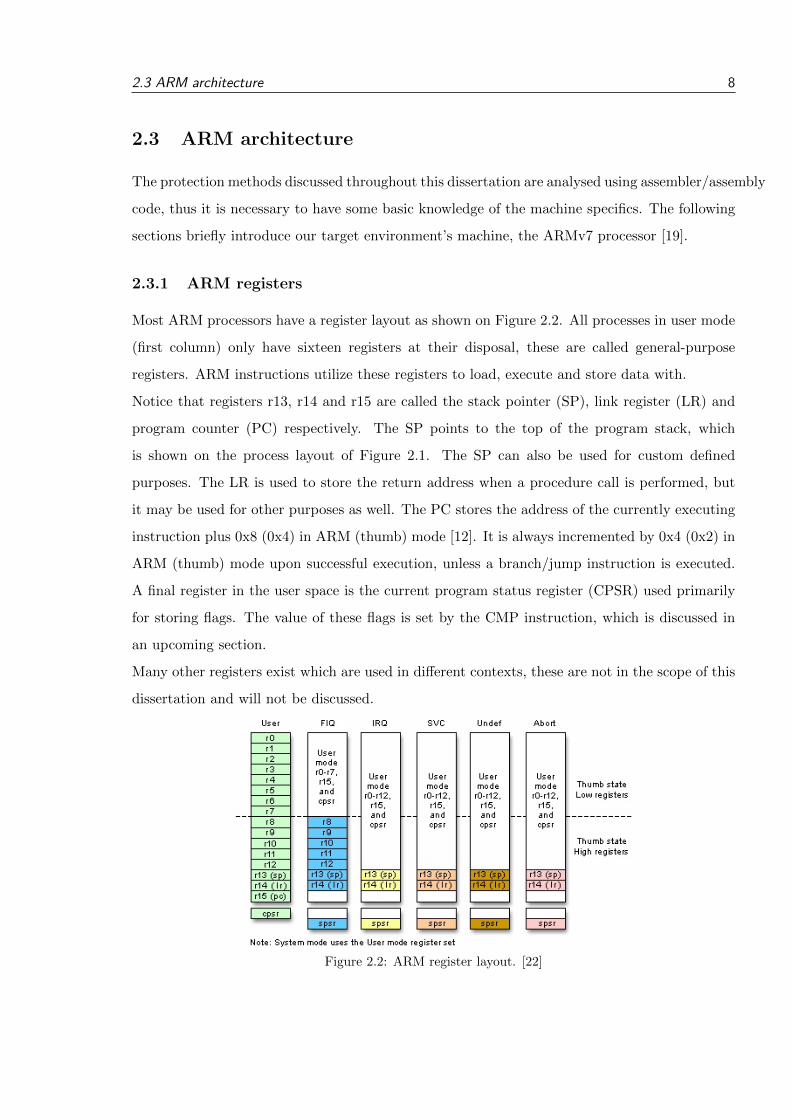
2.3.1 ARM registers
Most ARM processors have a register layout as shown on Figure 2.2. All processes in user mode
(first column) only have sixteen registers at their disposal, these are called general-purpose
registers. ARM instructions utilize these registers to load, execute and store data with.
Notice that registers r13, r14 and r15 are called the stack pointer (SP), link register (LR) and
program counter (PC) respectively. The SP points to the top of the program stack, which
is shown on the process layout of Figure 2.1. The SP can also be used for custom defined
purposes. The LR is used to store the return address when a procedure call is performed, but
it may be used for other purposes as well. The PC stores the address of the currently executing
instruction plus 0x8 (0x4) in ARM (thumb) mode [12]. It is always incremented by 0x4 (0x2) in
ARM (thumb) mode upon successful execution, unless a branch/jump instruction is executed.
A final register in the user space is the current program status register (CPSR) used primarily
for storing flags. The value of these flags is set by the CMP instruction, which is discussed in
an upcoming section.
Many other registers exist which are used in different contexts, these are not in the scope of this
dissertation and will not be discussed.
Figure 2.2: ARM register layout. [22]
2.3 ARM architecture 9
2.3.2 Register liveness
A major part of this dissertation involves inserting instructions into an already compiled binary.
At some point we will add arithmetic instructions, however we must choose its operands/registers
carefully. The reason is that inserting instructions into an already compiled binary can alter its
context/state, as a result the program could execute incorrectly.
Throughout the next chapter we mention the concept of liveness/availability of registers. This
implies that a liveness analysis is performed to determine which registers are alive or dead at a
specified position [2].
2.3.3 ARM instruction set
An aspiring reverse engineer should have a very deep understanding of ARM instructions, how-
ever for the contents of this dissertation it is not a requirement. Since just a few ARM instruc-
tions are used throughout this dissertation, just these need to be known and understood. For a
complete set of instructions and their details kindly refer to the appropriate ARM manual [19].
BKPT (breakpoint)
This instruction causes a software breakpoint to occur. When it is executed, the process is
temporarily stopped and control is transferred to a debugger which will decide what happens
next. When no debugger is present nor a custom signal handler defined, the process is terminated
by default.
Loads and stores
These instructions are used to load (store) values from (to) specified addresses. Types such as
LDR (STR) operate with a single register, while LDM (STM) can load (store) multiple values
from (to) multiple registers.
B (branch)
The branch instruction is used to jump to another PC-relative address in the program’s address
space. There are two common modes, first there is the unconditional mode where the jump is
guaranteed to take place. The second one is conditional, such that the jump will only happen
when a predefined condition (e.g. EQ) is satisfied, based on one or more flags in the CPSR
register.
2.4 Reverse engineering 10
BX (branch and exchange)
This instruction will branch to an absolute address contained in a specified register. A com-
mon application of a BX instruction can be found in subroutines, where it serves as a return
instruction [20].
BLX (branch with link and exchange)
This instruction works exactly the same way as the BX, but it will also set the link register
with the address following the BLX instruction. Such an instruction is used to make calls to
subroutines, where the subroutine finally returns to the address in the link register, usually
thanks to the BX instruction.
NOP (no-operation)
These instructions are executed but have no side effects on any registers nor memory, they do
however inflict a short delay. The real implementation of a NOP instruction is usually a MOV
operation such as MOV r0, r0 which copies one register back into itself. NOP instructions are
widely used for, but not limited to, memory alignment and synchronization [21]. But attackers
can use NOP instructions for other purposes such as tampering [6].
2.4 Reverse engineering
To protect ones’ software from attackers, one must be aware of all the possible attacks and how
an attacker does its job. Basically, reverse engineering is the art of obtaining a higher-level
understanding of an application.
Quite often an attacker will resolve to binary analysis. However reading binary code (machine
instructions) is not a trivial task. These can be converted into a assembly code, which is easier
to read and interpret, however not as easy as the original source code.
The reason why the assembly language is of such importance is due to the fact that transforming
binary code back into its original source code is not trivial and often considered impossible to
perfect [23].
An attack on a piece of software can be accomplished using various techniques, it does not
always involve binary analysis. For simplicity we can categorize all attacks into two basic types:
static and dynamic analysis.
2.5 Static analysis 11
2.5 Static analysis
This analysis strategy involves the process of inspecting assembly code, with the intention of
finding critical information, inner workings and/or other information.
To start off with this process, an attacker could use a disassembler to obtain an assembly rep-
resentation of a target binary. Once an attacker has found what he/she was looking for, he/she
can then alter the binary to override the original functionality through tampering. Tampering
is commonly done in a hex editor through pattern matching. It can even be automated by the
attacker and redistributed as a patch/crack for others to utilize. In large binaries the attacker
will have to manually go through all instructions until he/she encounters the ones that should
be patched/tampered, this is definitely not a trivial task.
There exist many other techniques and tools for static analysis, such as the construction of a
control-flow graph.
Control-flow graph
One may agree that manual static analysis may require a lot of time, patience and dedication.
As a result many useful tools have been developed that can simplify static analysis. One concrete
example of such a tool is IDA, developed by Hex-Rays. One of the most sought after features
this tool provides is the construction of a control flow graph (CFG). A CFG is a graph of all
the possible execution paths in a program. The nodes in the graph are basic blocks (BBLs) and
contain instructions which are executed in a linear fashion. Each BBL has a single entry point
and none of its instructions are branches/jumps except for one. The last instruction may be a
branch/jump, unless the program is about to exit or control is transferred in a different way.
The nodes themselves are linked together by all types of branch instructions. The total result
is a graphical representation of the program’s execution flow with its possible end states. When
a CFG is reconstructed from a binary without symbol information, then the reconstruction is
merely an approximation [26].
2.6 Dynamic analysis
For small binaries static analysis can get the job done, but for large ones the analyst may
consider using additional dynamic analysis methods. A common dynamic analysis strategy is
debugging. Just as a software developer uses a debugger to step through his/her code to find
2.7 Protections against reverse engineering 12
bugs, an attacker can use the same debugger for reverse engineering. Except that he/she does
not have access to the source code, instead only the assembly code is available. Many other
dynamic strategies exist, including but not limited to: hooking, library injection, tracing and
emulators [24, 25].
A debugger offers many useful features that can be beneficial to an attacker. One of the most
important ones is the ability to set breakpoints. These are inserted at specific addresses, such
that one can let the program run until a breakpoint is hit, consequently the program is halted
and control is transferred to the debugger. Furthermore we can execute instructions at our own
pace using debugging steps. We can also let the debugger show all registers’ values at a certain
position.
Yet another useful feature is a watchpoint, which halts the program’s execution when a certain
condition is met. A typical condition is when a predefined register or variable reaches a specified
value. Just as its name states, a watchpoint monitors the value of some piece of data.
These elementary features are an attacker’s best friends, but debuggers offer more complex
operations such as the possibility to record, reverse and replay executed instructions. One can
even alter and/or inject code into a running process.
2.7 Protections against reverse engineering
Now that we know and understand how attackers operate, we can discuss some of the coun-
termeasures. Keep in mind that, given enough time and/or resources, every single protection
technique can be circumvented in some way. The goal of protection is to delay the attacker as
long as possible, in the hope that the attacker will stop the attack or move on to an easier target.
One good protection method rarely suffices to increase the complexity of static and dynamic
analysis. In practice a variety of protections are combined [3, 4]. Over the years a variety of
protection techniques have been invented, some more effective and successful than others.
2.7.1 Code obfuscation
The goal of code obfuscation is to transform an input program P into another program P’ which
has the exact same functionality as P, and where some parts of P’ are made more difficult to
comprehend through either static or dynamic analysis [5].
2.7 Protections against reverse engineering 13
Opaque predicates
Opaque predicates are boolean expressions whose value is known to the obfuscator during the
obfuscation process, however their value is difficult to compute during static analysis. For
instance the expression F := (x(x + 1)%2) is true for all integers and F can be used in an
if-clause, such as if(F ) { B; } to hide the fact that B will always be executed [7, 8, 10].
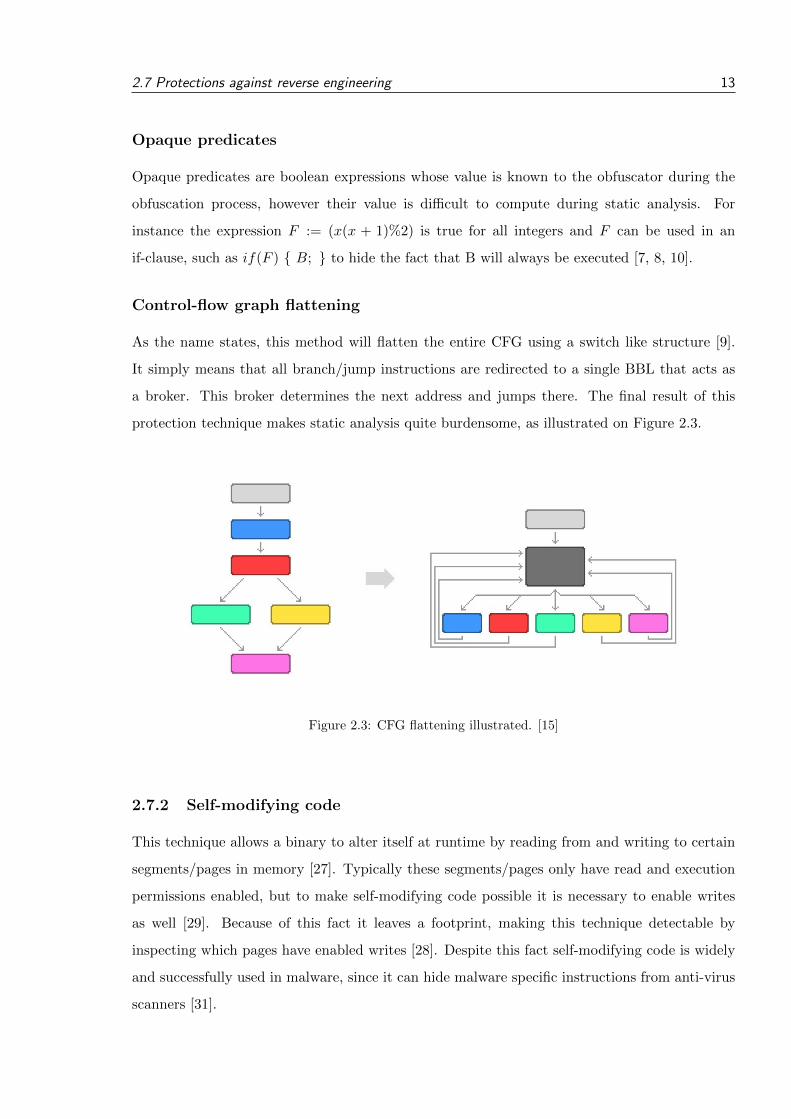
Control-flow graph flattening
As the name states, this method will flatten the entire CFG using a switch like structure [9].
It simply means that all branch/jump instructions are redirected to a single BBL that acts as
a broker. This broker determines the next address and jumps there. The final result of this
protection technique makes static analysis quite burdensome, as illustrated on Figure 2.3.
Figure 2.3: CFG flattening illustrated. [15]
2.7.2 Self-modifying code
This technique allows a binary to alter itself at runtime by reading from and writing to certain
segments/pages in memory [27]. Typically these segments/pages only have read and execution
permissions enabled, but to make self-modifying code possible it is necessary to enable writes
as well [29]. Because of this fact it leaves a footprint, making this technique detectable by
inspecting which pages have enabled writes [28]. Despite this fact self-modifying code is widely
and successfully used in malware, since it can hide malware specific instructions from anti-virus
scanners [31].
2.7 Protections against reverse engineering 14
Self-modifying code can also be used for a wide range of obfuscation strategies. Let us illustrate
one of the strategies where we try to hide a few critical instructions such that they will be only
revealed and executed when needed. Initially these instructions are encrypted using a simple
XOR operation using a predefined integer value as a mask. When the program reaches the
point where these encrypted instructions need to be executed, the program will call a function
that decrypts them using the very same XOR operation and the same mask value. Now the
instructions can be executed, and if the obfuscator wants to re-encrypt them then the same
function is called once more. The upside of this strategy is that static analysis does not reveal
these instructions, instead they will be displayed as meaningless data. It is possible to choose a
mask such that the original instructions are converted into a different set of instructions, instead
of simply appearing as meaningless data [30].
2.7.3 Anti-debugging
In Section 2.6 we have introduced the concept of debugging and how it can be used as part of an
attack. In this section we shall look at some realistic countermeasures to make debugging more
difficult. A variety of anti-debugging techniques exist, ranging from simple to very complex
ones.
False breakpoints
For starters, the most basic technique involves adding software breakpoints throughout the entire
application. So whenever an attacker tries to debug the process, he/she will be overwhelmed by
these breakpoints which continuously interrupt its debugger. It may be an obstacle for a novice
attacker, but an experienced attacker can search and replace all software breakpoints in under
a minute [32].
Debugging detection
Another quite common technique involves checking whether a debugger is present or not, most
operating systems provide one or more methods to detect whether a process has a debugger
attached to it. In practice such strategies can be circumvented relatively easily by tampering
with the binary and disabling instructions which are responsible for this protection [32, 44].
2.7 Protections against reverse engineering 15
Self-debugging
This anti-debugging technique may be considered as a better alternative to the more simplistic
methods. The idea is to let a process (debuggee) spawn and attach its own debugger, thus
preventing an attacker from using his/her debugger. The success of this method relies on the
kernel’s restriction: a process (A) can ptrace any other process (B) unless some other process
(C) is already using ptrace on that same process (B). At first sight this might appear to be a
very solid strategy against debugging, however nothing prevents an attacker from detaching the
current debugger and instead attaching his/her own, consequently this method is referred to as
loosely-coupled self-debugging.
Nanomites
This method builds upon the self-debugging technique by replacing many/all branch instruc-
tions by BKPT ones [45, 46]. Further, the debugger will have a look-up table which contains
information, preferably encrypted, regarding the replaced branch instructions. More specifically
it stores the type of branch, the destination address and the address of the corresponding BKPT
instruction.
When a BKPT is executed a context switch is invoked. The latter is a simple transfer of
control from the the debuggee to the debugger. This implies that the debuggee’s process is
halted and the debugger may then decide whether to resume or kill it. During a context switch
the debugger will read the debuggee’s PC value and look up the corresponding branch in the
look-up table. Once the branch has been found, it can change the debuggee’s PC value to the
appropriate destination address and resume its execution. However if the corresponding entry
is a conditional branch then the debugger will have to check the appropriate flags in the CPSR
register to determine whether it should change the PC’s value to the branch’s destination address
or continue executing the instruction following the BKPT. Finally if the branch involves linking
(BLX) then the Link Register needs to be assigned the address following the BKPT instruction.
This method is better than loosely-coupled self-debugging because the self-created debugger
becomes indispensable. If an attacker attempts to detach this debugger, the branch instructions
will not be executed thus the program is deemed to produce incorrect results and/or crash. To
circumvent this protection an attacker will have to try reverse engineering the debugger to obtain
the look-up table, then either incorporate it in his/her own debugger or replace all breakpoints
by the corresponding branch instructions.
2.7 Protections against reverse engineering 16
Nanomites are commonly used as an anti-dumping technique, which try to prevent an attacker
from taking a snapshot of a process at a particular point in time. Memory dumping has its
benefits when a target software involves unpacking, downloading and/or decrypting data into
executable code at runtime [46].
Tightly-coupled self-debugging
Partially based on the concept of nanomites and by taking the loosely-coupled self-debugging
method one step further, we can migrate, and transform predefined code fragments from the
main application to the debugger. Any attempt of detaching our debugger will lead to undefined
behaviour in the application due to these migrated and missing code fragments.
The following six steps describe how self-debugging is realized [1], while Figure 2.4 contains the
C code snippet.
1. In the first step the binary is executed and a process is created.
2. The main process will initiate a fork system call, which results in a child process that is
an exact copy of its parent process, including all register values. Which also means that
after the fork, both the parent and child process continue executing at the next instruction
after the fork call.
3. The child process should have a different behaviour. To accomplish this we use the return
value of the fork call. The child process, when successfully forked, always receives a zero as
return value, while the parent process either gets the child’s process id (PID) or a negative
value if forking failed.
4. Next, the parent process enters a conditional while loop, waiting for a variable ‘can run’
to be set by the debugger.
5. The child process performs the necessary ptrace calls to its parent and now becomes its
debugger. As soon as the debugger finishes its initialization routine, it then makes a ptrace
call to the parant process (debuggee) and sets the ‘can run’ variable to true.
6. The debugger enters a conditional while loop, monitoring all signals from the debuggee.
Simultaneously the debuggee exits its conditional while loop and starts executing its in-
tended code, represented by the function call to ‘main()’ in the figure.
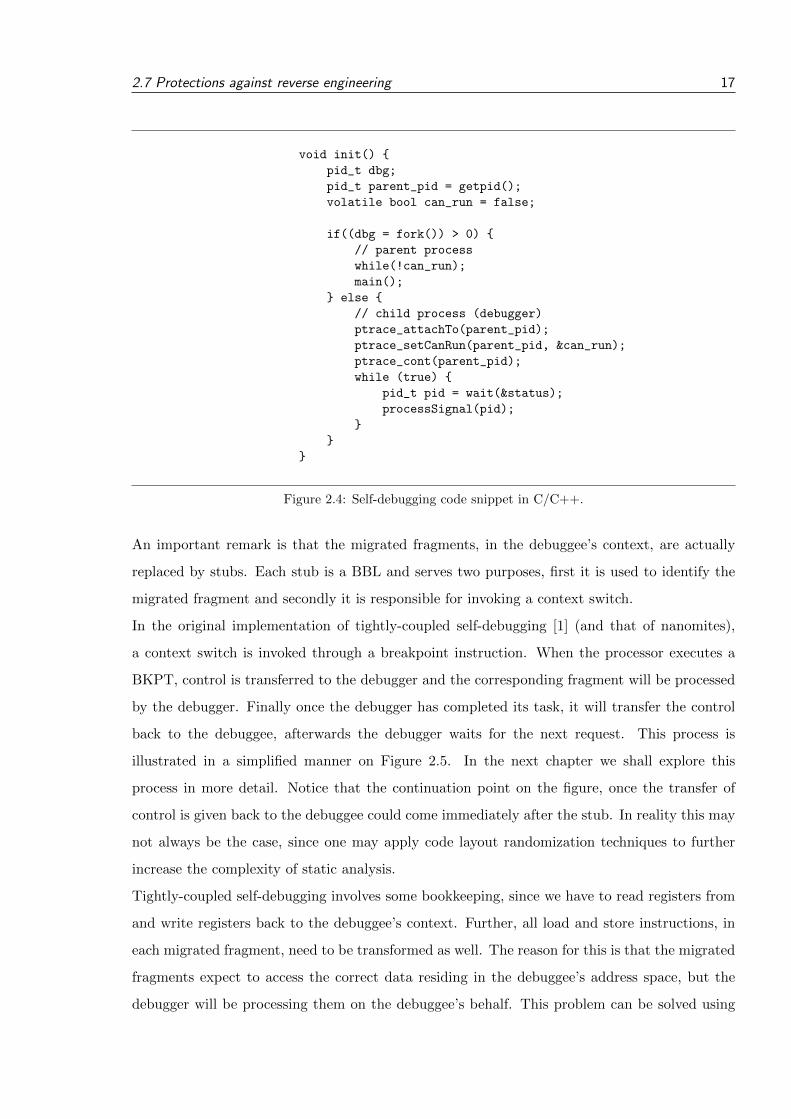
2.7 Protections against reverse engineering 17
void init() {
pid_t dbg;
pid_t parent_pid = getpid();
volatile bool can_run = false;
if((dbg = fork()) > 0) {
// parent process
while(!can_run);
main();
} else {
// child process (debugger)
ptrace_attachTo(parent_pid);
ptrace_setCanRun(parent_pid, &can_run);
ptrace_cont(parent_pid);
while (true) {
pid_t pid = wait(&status);
processSignal(pid);
}
}
}
Figure 2.4: Self-debugging code snippet in C/C++.
An important remark is that the migrated fragments, in the debuggee’s context, are actually
replaced by stubs. Each stub is a BBL and serves two purposes, first it is used to identify the
migrated fragment and secondly it is responsible for invoking a context switch.
In the original implementation of tightly-coupled self-debugging [1] (and that of nanomites),
a context switch is invoked through a breakpoint instruction. When the processor executes a
BKPT, control is transferred to the debugger and the corresponding fragment will be processed
by the debugger. Finally once the debugger has completed its task, it will transfer the control
back to the debuggee, afterwards the debugger waits for the next request. This process is
illustrated in a simplified manner on Figure 2.5. In the next chapter we shall explore this
process in more detail. Notice that the continuation point on the figure, once the transfer of
control is given back to the debuggee could come immediately after the stub. In reality this may
not always be the case, since one may apply code layout randomization techniques to further
increase the complexity of static analysis.
Tightly-coupled self-debugging involves some bookkeeping, since we have to read registers from
and write registers back to the debuggee’s context. Further, all load and store instructions, in
each migrated fragment, need to be transformed as well. The reason for this is that the migrated
fragments expect to access the correct data residing in the debuggee’s address space, but the
debugger will be processing them on the debuggee’s behalf. This problem can be solved using
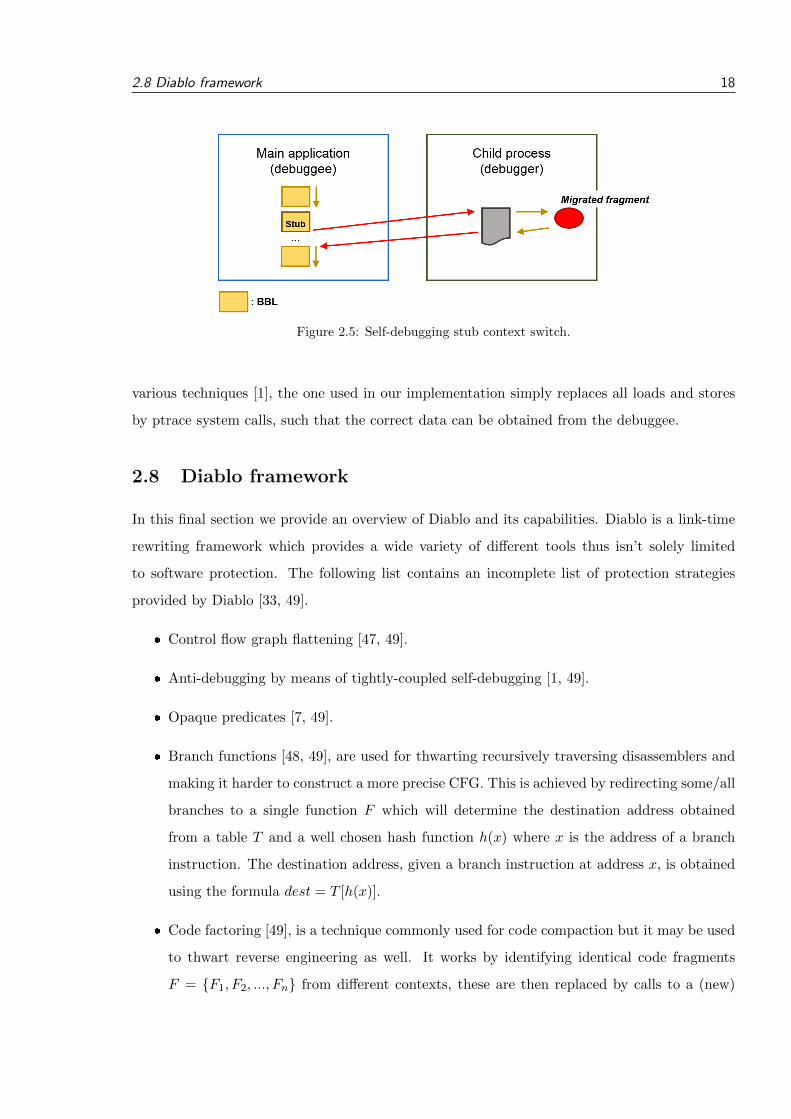
2.8 Diablo framework 18
Figure 2.5: Self-debugging stub context switch.
various techniques [1], the one used in our implementation simply replaces all loads and stores
by ptrace system calls, such that the correct data can be obtained from the debuggee.
2.8 Diablo framework
In this final section we provide an overview of Diablo and its capabilities. Diablo is a link-time
rewriting framework which provides a wide variety of different tools thus isn’t solely limited
to software protection. The following list contains an incomplete list of protection strategies
provided by Diablo [33, 49].
� Control flow graph flattening [47, 49].
� Anti-debugging by means of tightly-coupled self-debugging [1, 49].
� Opaque predicates [7, 49].
� Branch functions [48, 49], are used for thwarting recursively traversing disassemblers and
making it harder to construct a more precise CFG. This is achieved by redirecting some/all
branches to a single function F which will determine the destination address obtained
from a table T and a well chosen hash function h(x) where x is the address of a branch
instruction. The destination address, given a branch instruction at address x, is obtained
using the formula dest = T [h(x)].
� Code factoring [49], is a technique commonly used for code compaction but it may be used
to thwart reverse engineering as well. It works by identifying identical code fragments
F = {F1, F2, ..., Fn} from different contexts, these are then replaced by calls to a (new)
2.8 Diablo framework 19
single code fragment F . The goal is to make it harder for an attacker to analyse the
factored code and their surroundings.
� Layout randomization [49], is used for spreading chains of related basic blocks (e.g. chains
from one function) all over the binary. This thwarts static analysis because it is then no
longer obvious which blocks are related to each other.
Control-flow graph
Before Diablo can transform, optimize and add protection to binaries it must first construct
an easy to use representation of the program. Diablo will first disassemble the binary. From
the disassembled version it can construct a control-flow graph. Manipulating such a graph
representation of the program is easier and considerably less error-prone.
Once the CFG has been transformed and the required protection techniques applied, then the
CFG can be optimized and assembled back into a binary [35].
Diablo is capable of constructing a precise and correct CFG, which generally is not the case
for tools (such as IDA and others). The reason is that Diablo has access to the original source
code and symbol information in the object files. An attacker/analyst only has access to the
binary (machine instructions) without symbol information, and as a result any CFG that he/she
reconstructs will only be an approximation.
ADVANCED ANTI-DEBUGGING TECHNIQUES 20
Chapter 3
Advanced anti-debugging techniques
In the previous chapter we briefly described how tightly-coupled self-debugging works. Now we
look for new ways to improve this technique by attempting to eliminate some of its most obvious
shortcomings.
Our implementations solely focus on executable binaries, but they should work on dynamically
loaded libraries just as well. It is also important to note that the tightly-coupled self-debugging
technique which we will improve can vary by design/implementation. In our case the debuggee
and debugger are created from the same binary, by means of a fork system call. Alternatively,
it is possible to deploy the debugger as a separate binary which is launched by means of the
execve system call. Another crucial point is that the migrated code fragments have not been
altered in any way except for load and store transformations. It is possible to apply additional
transformations to enhance the protection, for instance, replacing all register operands in the
migrated fragments according to a predefined register mapping, e.g.: {R0 = R5, R1 = R6, ...}.
3.1 Shortcomings of tightly-coupled self-debugging
A first shortcoming is due to how signals are generated. The original implementation uses
software breakpoints to invoke a context switch, these are quite uncommon in production envi-
ronments, not stealthy and they leak details about the protection strategy.
A second shortcoming is related to how the debugger is notified regarding which migrated frag-
ment should be processed. In the original implementation, just before the breakpoint instruction,
an integer value is pushed onto the stack. This integer value is the index in a mapping table
3.2 Improving stealthiness of context switches 21
which corresponds to the start address of a migrated code fragment. The problem is that the
entire mapping table is stored in the binary’s data area. This means that if an attacker can find
this mapping, he/she can replace all breakpoint instructions by branch instructions pointing to
the migrated addresses. Having done this, all that is left is undoing all load and store transfor-
mations in the migrated fragments. Once both steps are successfully carried out, the purpose
of our self-debugger has been eliminated and the attacker can attach his/her own debugger to
debug the entire application without much hassle.
A third shortcoming is that the self-created debugger cannot verify whether an occurred context
switch was intended behaviour or due to some unforeseen error in the code. In the original im-
plementation we could distinguish causes of context switches because the debugger is capable of
determining if a context switch was due to a breakpoint instruction. Since the first shortcoming
will replace breakpoints by other instructions, ambiguity will become a factor.
A fourth and final shortcoming is related to the self-created debugger itself, which has no anti-
debugging protection whatsoever. We will attempt to protect the debugger through various
methods such as circular debugging, one-way context switches and by means of a short-term
self-debugger.
3.2 Improving stealthiness of context switches
In this section we discuss various signal generation techniques we have experimented with. The
original implementation utilized a software breakpoint as a means to invoke a context switch by
generating a SIGTRAP signal, as illustrated on Figure 3.1. Notice that the first two instructions
are related to the second shortcoming and will be discussed in the next section.
Figure 3.1: Breakpoint method illustrated.
Our goal was to replace the software breakpoint by another mechanism that looks less suspicious
to an attacker. More specifically, we have attempted to obfuscate our new mechanism and make
it appear as a set of harmless and unimportant instructions.
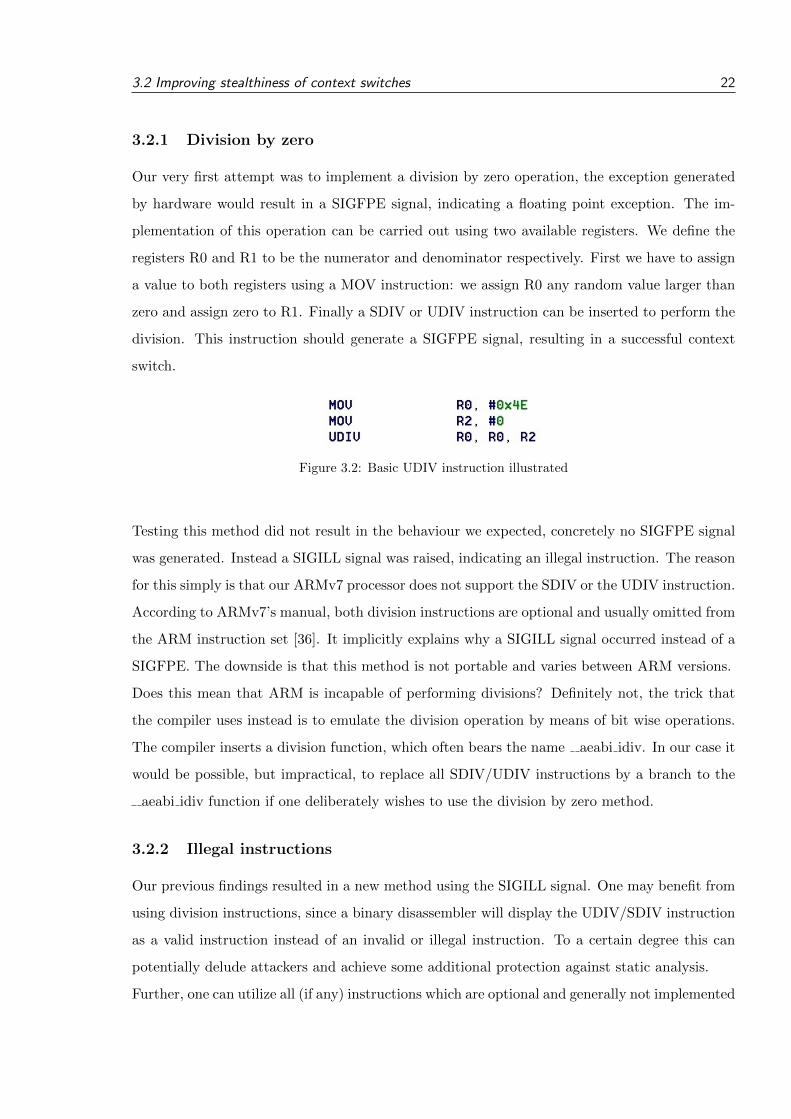
3.2 Improving stealthiness of context switches 22
3.2.1 Division by zero
Our very first attempt was to implement a division by zero operation, the exception generated
by hardware would result in a SIGFPE signal, indicating a floating point exception. The im-
plementation of this operation can be carried out using two available registers. We define the
registers R0 and R1 to be the numerator and denominator respectively. First we have to assign
a value to both registers using a MOV instruction: we assign R0 any random value larger than
zero and assign zero to R1. Finally a SDIV or UDIV instruction can be inserted to perform the
division. This instruction should generate a SIGFPE signal, resulting in a successful context
switch.
Figure 3.2: Basic UDIV instruction illustrated
Testing this method did not result in the behaviour we expected, concretely no SIGFPE signal
was generated. Instead a SIGILL signal was raised, indicating an illegal instruction. The reason
for this simply is that our ARMv7 processor does not support the SDIV or the UDIV instruction.
According to ARMv7’s manual, both division instructions are optional and usually omitted from
the ARM instruction set [36]. It implicitly explains why a SIGILL signal occurred instead of a
SIGFPE. The downside is that this method is not portable and varies between ARM versions.
Does this mean that ARM is incapable of performing divisions? Definitely not, the trick that
the compiler uses instead is to emulate the division operation by means of bit wise operations.
The compiler inserts a division function, which often bears the name aeabi idiv. In our case it
would be possible, but impractical, to replace all SDIV/UDIV instructions by a branch to the
aeabi idiv function if one deliberately wishes to use the division by zero method.
3.2.2 Illegal instructions
Our previous findings resulted in a new method using the SIGILL signal. One may benefit from
using division instructions, since a binary disassembler will display the UDIV/SDIV instruction
as a valid instruction instead of an invalid or illegal instruction. To a certain degree this can
potentially delude attackers and achieve some additional protection against static analysis.
Further, one can utilize all (if any) instructions which are optional and generally not implemented
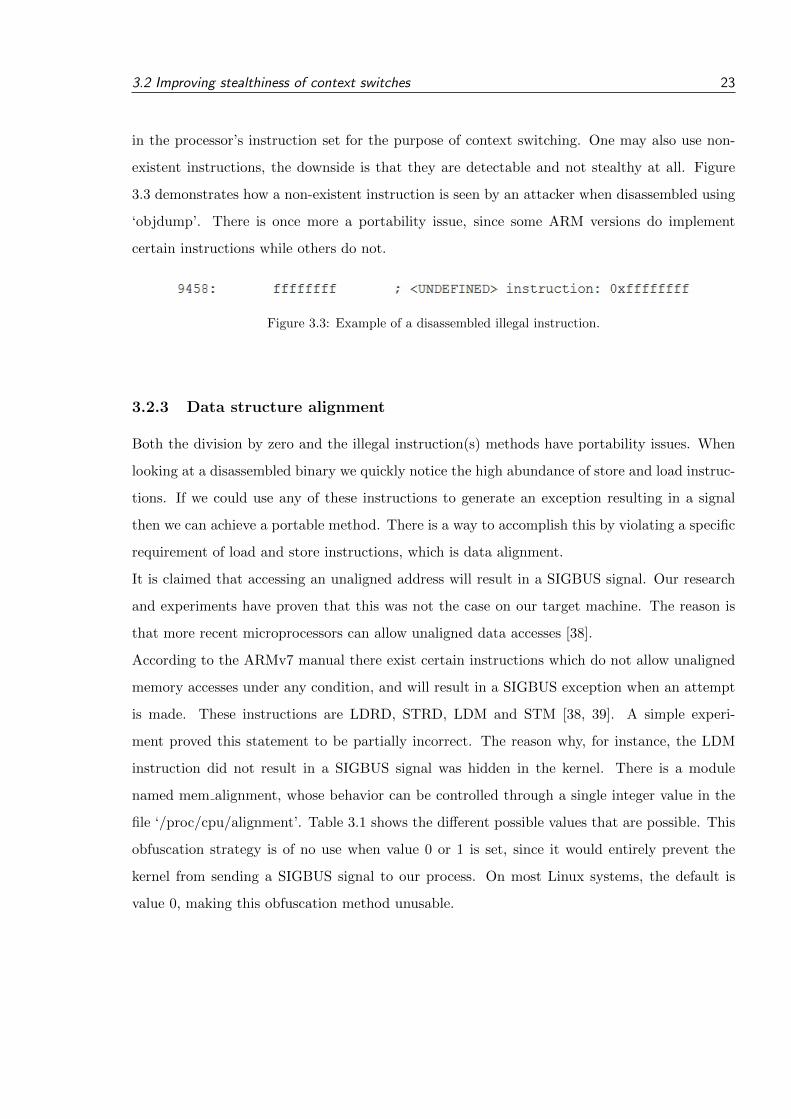
3.2 Improving stealthiness of context switches 23
in the processor’s instruction set for the purpose of context switching. One may also use non-
existent instructions, the downside is that they are detectable and not stealthy at all. Figure
3.3 demonstrates how a non-existent instruction is seen by an attacker when disassembled using
‘objdump’. There is once more a portability issue, since some ARM versions do implement
certain instructions while others do not.
Figure 3.3: Example of a disassembled illegal instruction.
3.2.3 Data structure alignment
Both the division by zero and the illegal instruction(s) methods have portability issues. When
looking at a disassembled binary we quickly notice the high abundance of store and load instruc-
tions. If we could use any of these instructions to generate an exception resulting in a signal
then we can achieve a portable method. There is a way to accomplish this by violating a specific
requirement of load and store instructions, which is data alignment.
It is claimed that accessing an unaligned address will result in a SIGBUS signal. Our research
and experiments have proven that this was not the case on our target machine. The reason is
that more recent microprocessors can allow unaligned data accesses [38].
According to the ARMv7 manual there exist certain instructions which do not allow unaligned
memory accesses under any condition, and will result in a SIGBUS exception when an attempt
is made. These instructions are LDRD, STRD, LDM and STM [38, 39]. A simple experi-
ment proved this statement to be partially incorrect. The reason why, for instance, the LDM
instruction did not result in a SIGBUS signal was hidden in the kernel. There is a module
named mem alignment, whose behavior can be controlled through a single integer value in the
file ‘/proc/cpu/alignment’. Table 3.1 shows the different possible values that are possible. This
obfuscation strategy is of no use when value 0 or 1 is set, since it would entirely prevent the
kernel from sending a SIGBUS signal to our process. On most Linux systems, the default is
value 0, making this obfuscation method unusable.
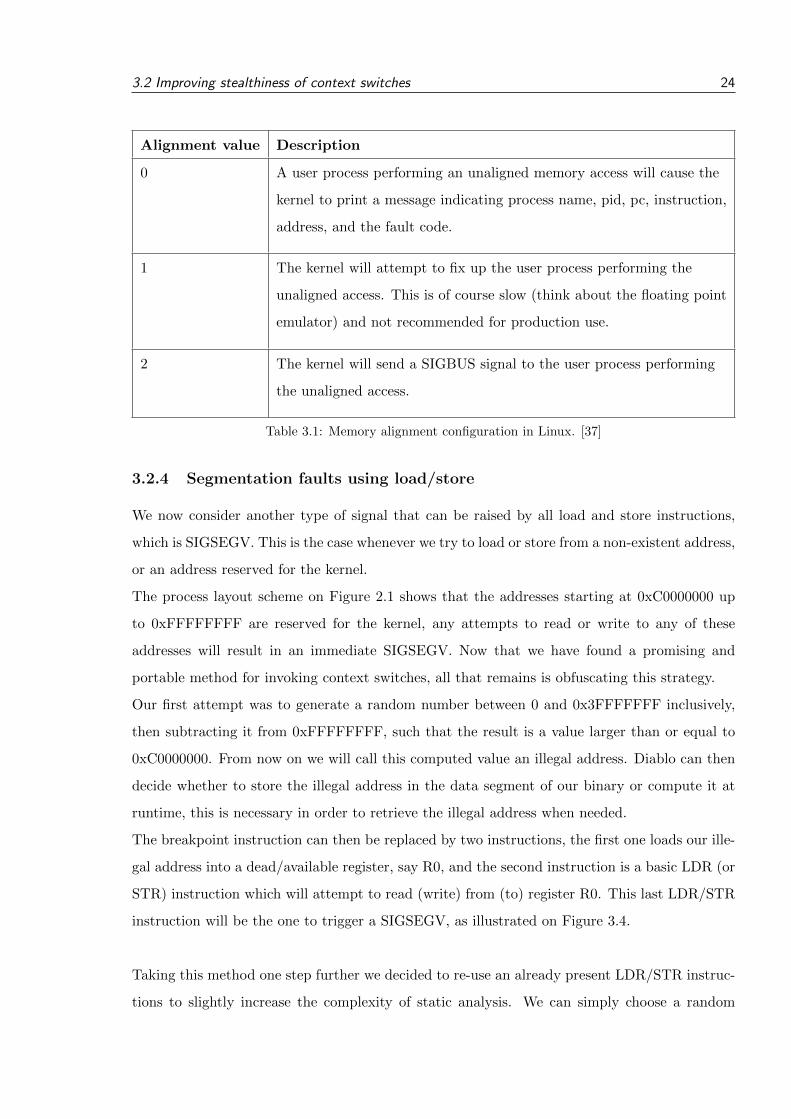
3.2 Improving stealthiness of context switches 24
Alignment value Description
0 A user process performing an unaligned memory access will cause the
kernel to print a message indicating process name, pid, pc, instruction,
address, and the fault code.
1 The kernel will attempt to fix up the user process performing the
unaligned access. This is of course slow (think about the floating point
emulator) and not recommended for production use.
2 The kernel will send a SIGBUS signal to the user process performing
the unaligned access.
Table 3.1: Memory alignment configuration in Linux. [37]
3.2.4 Segmentation faults using load/store
We now consider another type of signal that can be raised by all load and store instructions,
which is SIGSEGV. This is the case whenever we try to load or store from a non-existent address,
or an address reserved for the kernel.
The process layout scheme on Figure 2.1 shows that the addresses starting at 0xC0000000 up
to 0xFFFFFFFF are reserved for the kernel, any attempts to read or write to any of these
addresses will result in an immediate SIGSEGV. Now that we have found a promising and
portable method for invoking context switches, all that remains is obfuscating this strategy.
Our first attempt was to generate a random number between 0 and 0x3FFFFFFF inclusively,
then subtracting it from 0xFFFFFFFF, such that the result is a value larger than or equal to
0xC0000000. From now on we will call this computed value an illegal address. Diablo can then
decide whether to store the illegal address in the data segment of our binary or compute it at
runtime, this is necessary in order to retrieve the illegal address when needed.
The breakpoint instruction can then be replaced by two instructions, the first one loads our ille-
gal address into a dead/available register, say R0, and the second instruction is a basic LDR (or
STR) instruction which will attempt to read (write) from (to) register R0. This last LDR/STR
instruction will be the one to trigger a SIGSEGV, as illustrated on Figure 3.4.
Taking this method one step further we decided to re-use an already present LDR/STR instruc-
tions to slightly increase the complexity of static analysis. We can simply choose a random
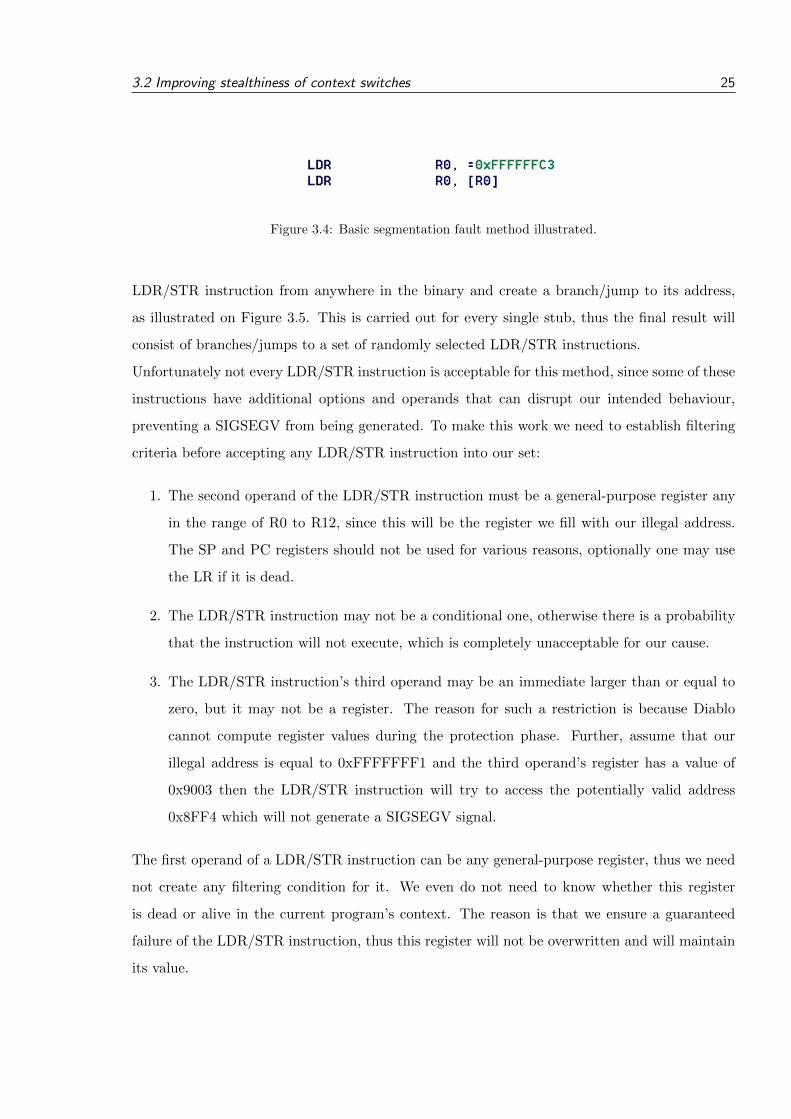
3.2 Improving stealthiness of context switches 25
Figure 3.4: Basic segmentation fault method illustrated.
LDR/STR instruction from anywhere in the binary and create a branch/jump to its address,
as illustrated on Figure 3.5. This is carried out for every single stub, thus the final result will
consist of branches/jumps to a set of randomly selected LDR/STR instructions.
Unfortunately not every LDR/STR instruction is acceptable for this method, since some of these
instructions have additional options and operands that can disrupt our intended behaviour,
preventing a SIGSEGV from being generated. To make this work we need to establish filtering
criteria before accepting any LDR/STR instruction into our set:
1. The second operand of the LDR/STR instruction must be a general-purpose register any
in the range of R0 to R12, since this will be the register we fill with our illegal address.
The SP and PC registers should not be used for various reasons, optionally one may use
the LR if it is dead.
2. The LDR/STR instruction may not be a conditional one, otherwise there is a probability
that the instruction will not execute, which is completely unacceptable for our cause.
3. The LDR/STR instruction’s third operand may be an immediate larger than or equal to
zero, but it may not be a register. The reason for such a restriction is because Diablo
cannot compute register values during the protection phase. Further, assume that our
illegal address is equal to 0xFFFFFFF1 and the third operand’s register has a value of
0x9003 then the LDR/STR instruction will try to access the potentially valid address
0x8FF4 which will not generate a SIGSEGV signal.
The first operand of a LDR/STR instruction can be any general-purpose register, thus we need
not create any filtering condition for it. We even do not need to know whether this register
is dead or alive in the current program’s context. The reason is that we ensure a guaranteed
failure of the LDR/STR instruction, thus this register will not be overwritten and will maintain
its value.
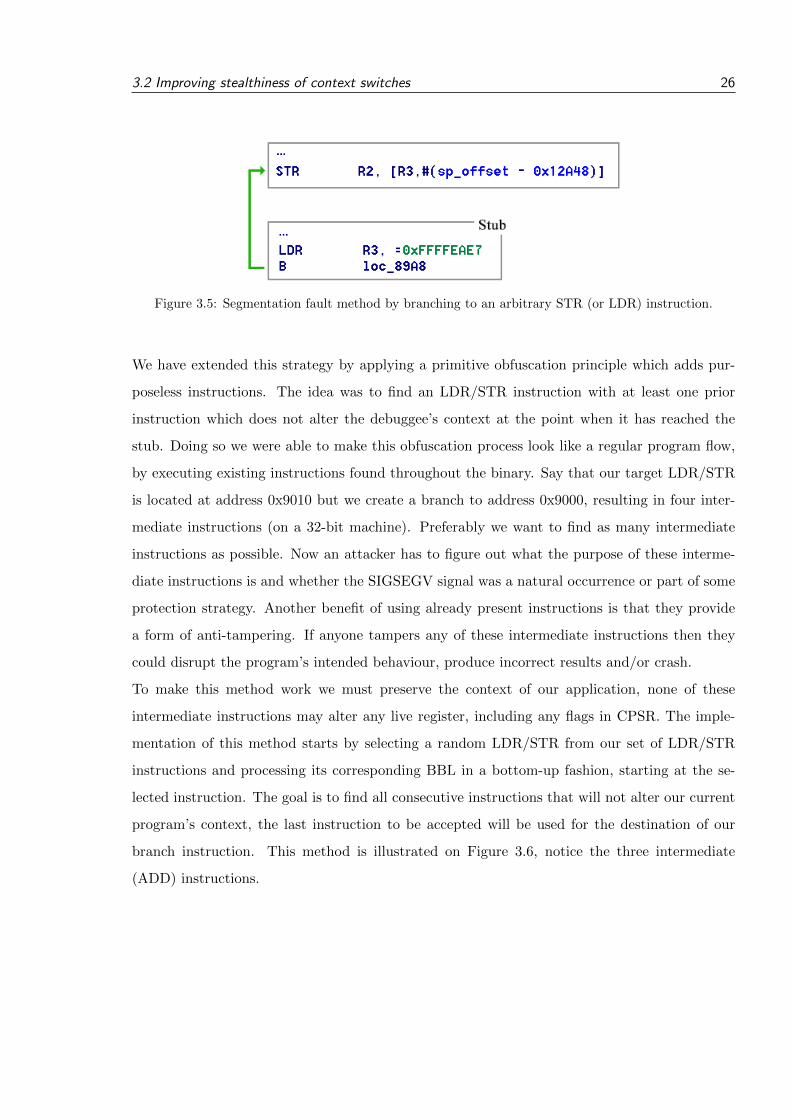
3.2 Improving stealthiness of context switches 26
Figure 3.5: Segmentation fault method by branching to an arbitrary STR (or LDR) instruction.
We have extended this strategy by applying a primitive obfuscation principle which adds pur-
poseless instructions. The idea was to find an LDR/STR instruction with at least one prior
instruction which does not alter the debuggee’s context at the point when it has reached the
stub. Doing so we were able to make this obfuscation process look like a regular program flow,
by executing existing instructions found throughout the binary. Say that our target LDR/STR
is located at address 0x9010 but we create a branch to address 0x9000, resulting in four inter-
mediate instructions (on a 32-bit machine). Preferably we want to find as many intermediate
instructions as possible. Now an attacker has to figure out what the purpose of these interme-
diate instructions is and whether the SIGSEGV signal was a natural occurrence or part of some
protection strategy. Another benefit of using already present instructions is that they provide
a form of anti-tampering. If anyone tampers any of these intermediate instructions then they
could disrupt the program’s intended behaviour, produce incorrect results and/or crash.
To make this method work we must preserve the context of our application, none of these
intermediate instructions may alter any live register, including any flags in CPSR. The imple-
mentation of this method starts by selecting a random LDR/STR from our set of LDR/STR
instructions and processing its corresponding BBL in a bottom-up fashion, starting at the se-
lected instruction. The goal is to find all consecutive instructions that will not alter our current
program’s context, the last instruction to be accepted will be used for the destination of our
branch instruction. This method is illustrated on Figure 3.6, notice the three intermediate
(ADD) instructions.
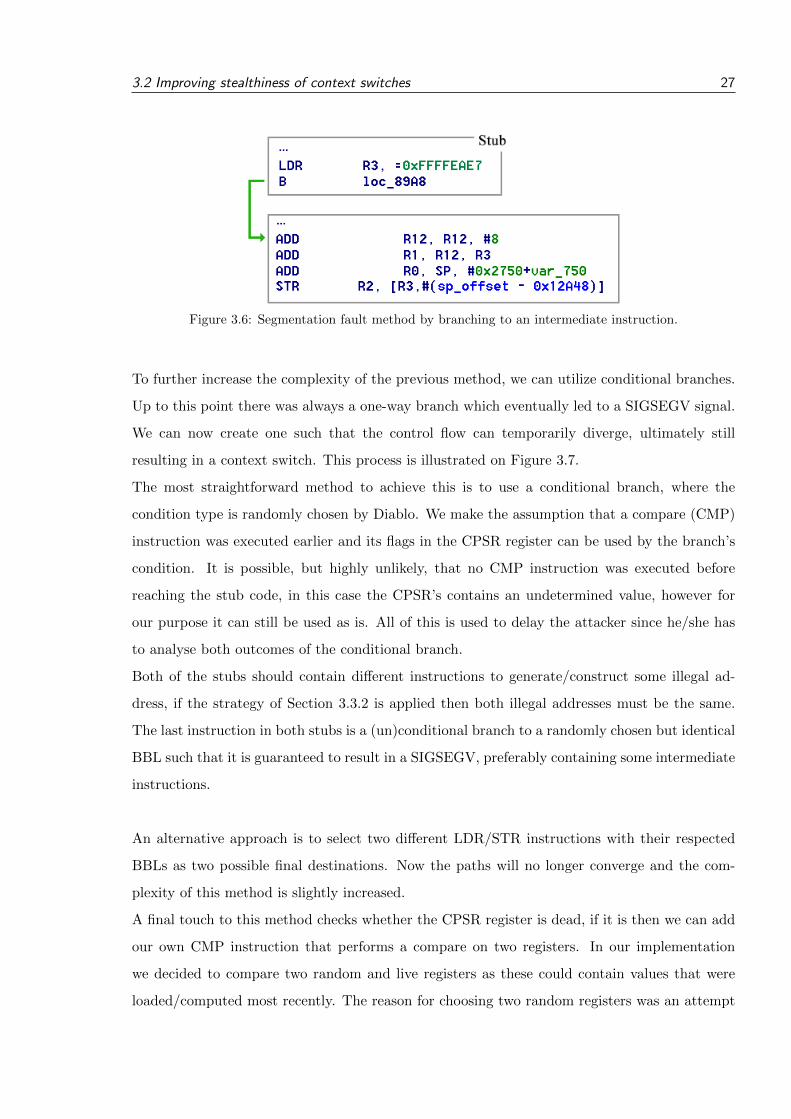
3.2 Improving stealthiness of context switches 27
Figure 3.6: Segmentation fault method by branching to an intermediate instruction.
To further increase the complexity of the previous method, we can utilize conditional branches.
Up to this point there was always a one-way branch which eventually led to a SIGSEGV signal.
We can now create one such that the control flow can temporarily diverge, ultimately still
resulting in a context switch. This process is illustrated on Figure 3.7.
The most straightforward method to achieve this is to use a conditional branch, where the
condition type is randomly chosen by Diablo. We make the assumption that a compare (CMP)
instruction was executed earlier and its flags in the CPSR register can be used by the branch’s
condition. It is possible, but highly unlikely, that no CMP instruction was executed before
reaching the stub code, in this case the CPSR’s contains an undetermined value, however for
our purpose it can still be used as is. All of this is used to delay the attacker since he/she has
to analyse both outcomes of the conditional branch.
Both of the stubs should contain different instructions to generate/construct some illegal ad-
dress, if the strategy of Section 3.3.2 is applied then both illegal addresses must be the same.
The last instruction in both stubs is a (un)conditional branch to a randomly chosen but identical
BBL such that it is guaranteed to result in a SIGSEGV, preferably containing some intermediate
instructions.
An alternative approach is to select two different LDR/STR instructions with their respected
BBLs as two possible final destinations. Now the paths will no longer converge and the com-
plexity of this method is slightly increased.
A final touch to this method checks whether the CPSR register is dead, if it is then we can add
our own CMP instruction that performs a compare on two registers. In our implementation
we decided to compare two random and live registers as these could contain values that were
loaded/computed most recently. The reason for choosing two random registers was an attempt
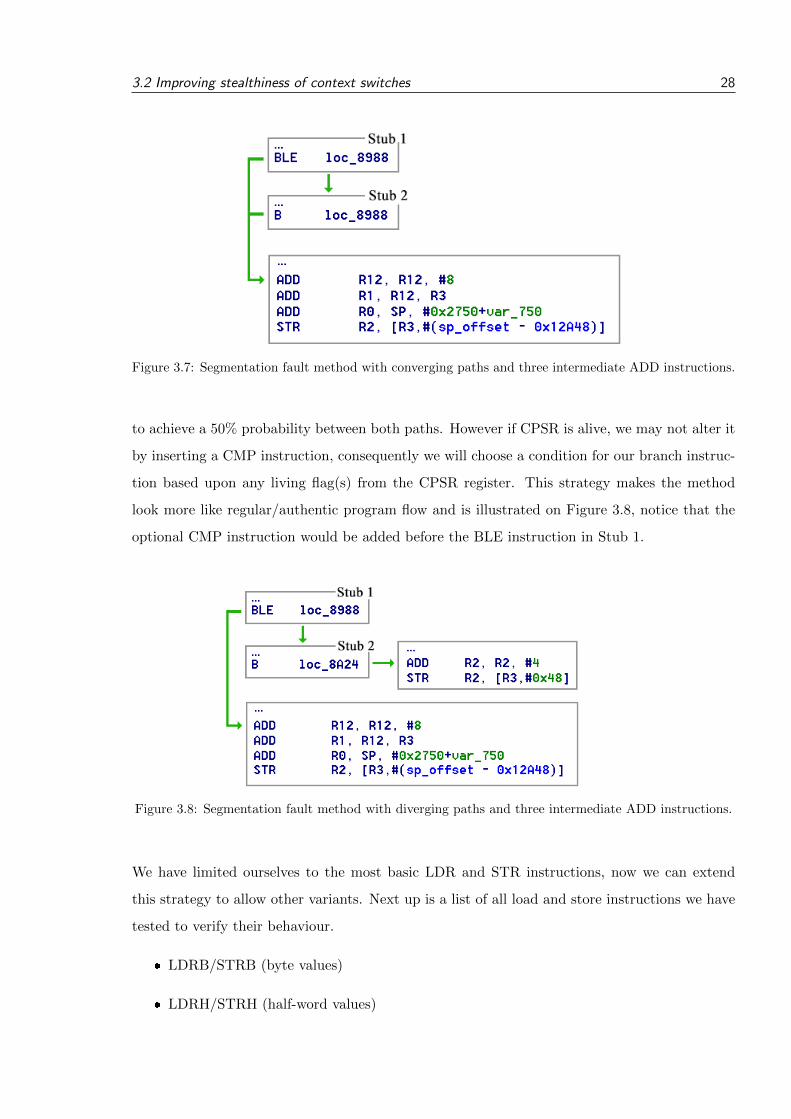
3.2 Improving stealthiness of context switches 28
Figure 3.7: Segmentation fault method with converging paths and three intermediate ADD instructions.
to achieve a 50% probability between both paths. However if CPSR is alive, we may not alter it
by inserting a CMP instruction, consequently we will choose a condition for our branch instruc-
tion based upon any living flag(s) from the CPSR register. This strategy makes the method
look more like regular/authentic program flow and is illustrated on Figure 3.8, notice that the
optional CMP instruction would be added before the BLE instruction in Stub 1.
Figure 3.8: Segmentation fault method with diverging paths and three intermediate ADD instructions.
We have limited ourselves to the most basic LDR and STR instructions, now we can extend
this strategy to allow other variants. Next up is a list of all load and store instructions we have
tested to verify their behaviour.
� LDRB/STRB (byte values)
� LDRH/STRH (half-word values)
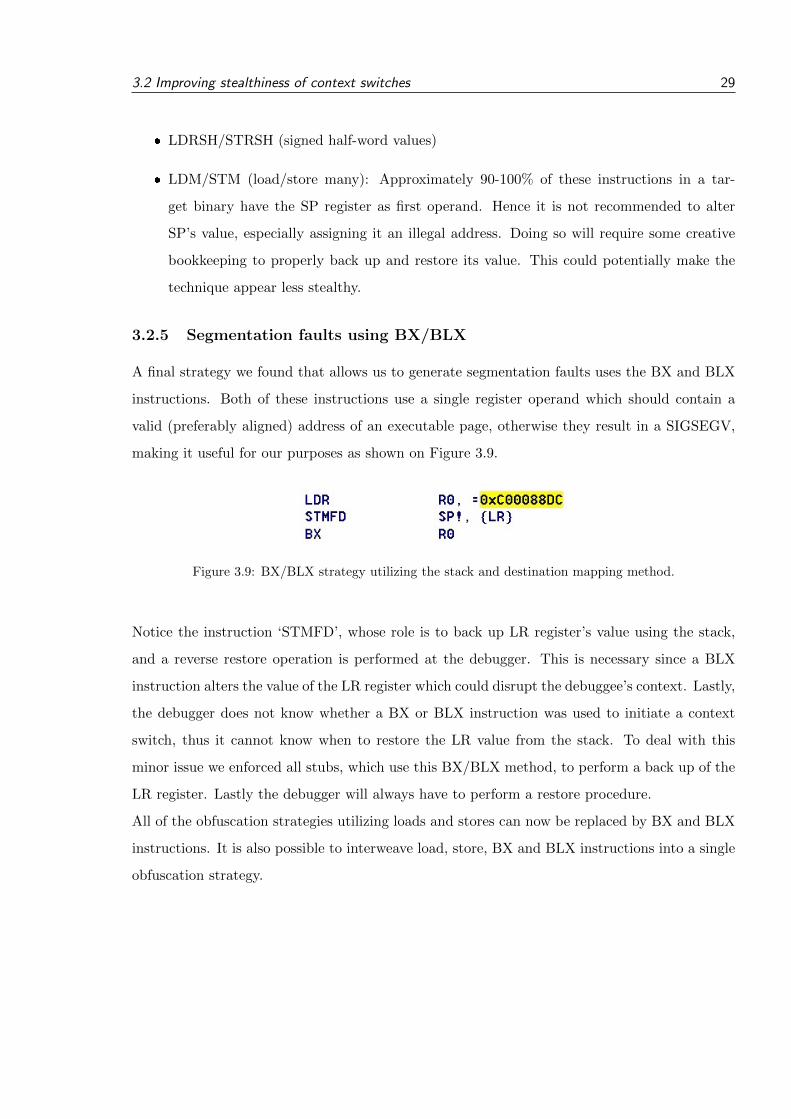
3.2 Improving stealthiness of context switches 29
� LDRSH/STRSH (signed half-word values)
� LDM/STM (load/store many): Approximately 90-100% of these instructions in a tar-
get binary have the SP register as first operand. Hence it is not recommended to alter
SP’s value, especially assigning it an illegal address. Doing so will require some creative
bookkeeping to properly back up and restore its value. This could potentially make the
technique appear less stealthy.
3.2.5 Segmentation faults using BX/BLX
A final strategy we found that allows us to generate segmentation faults uses the BX and BLX
instructions. Both of these instructions use a single register operand which should contain a
valid (preferably aligned) address of an executable page, otherwise they result in a SIGSEGV,
making it useful for our purposes as shown on Figure 3.9.
Figure 3.9: BX/BLX strategy utilizing the stack and destination mapping method.
Notice the instruction ‘STMFD’, whose role is to back up LR register’s value using the stack,
and a reverse restore operation is performed at the debugger. This is necessary since a BLX
instruction alters the value of the LR register which could disrupt the debuggee’s context. Lastly,
the debugger does not know whether a BX or BLX instruction was used to initiate a context
switch, thus it cannot know when to restore the LR value from the stack. To deal with this
minor issue we enforced all stubs, which use this BX/BLX method, to perform a back up of the
LR register. Lastly the debugger will always have to perform a restore procedure.
All of the obfuscation strategies utilizing loads and stores can now be replaced by BX and BLX
instructions. It is also possible to interweave load, store, BX and BLX instructions into a single
obfuscation strategy.
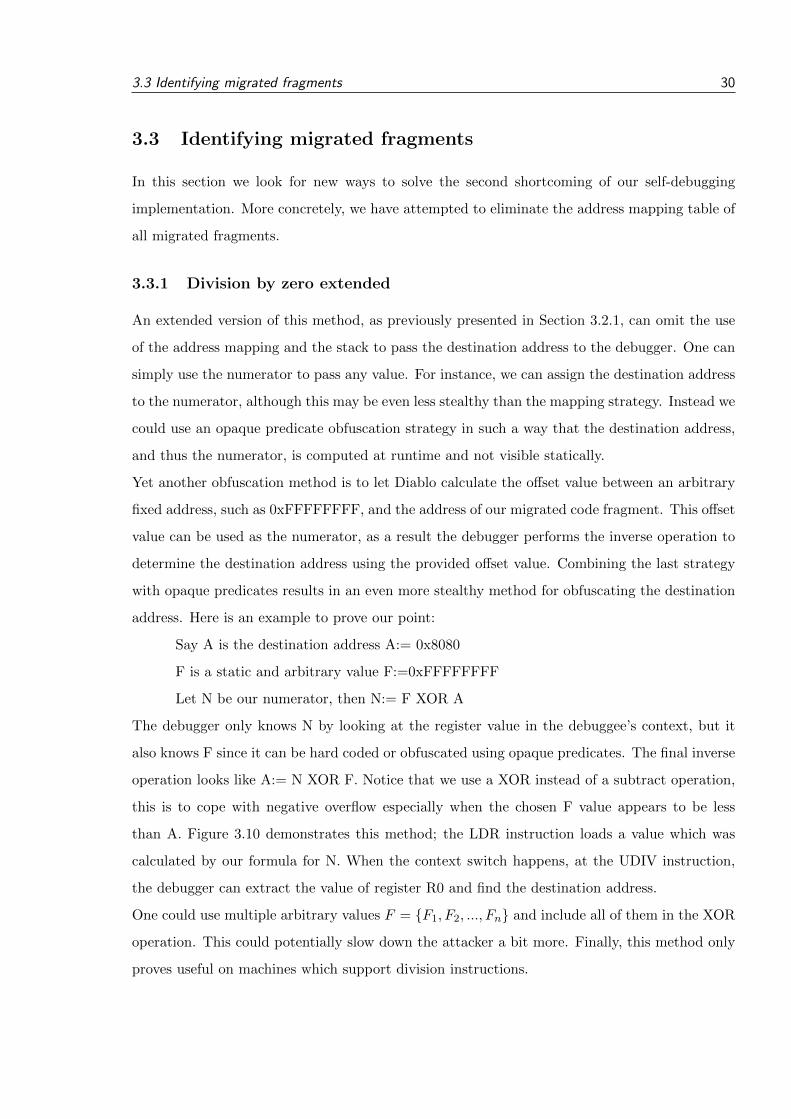
3.3 Identifying migrated fragments 30
3.3 Identifying migrated fragments
In this section we look for new ways to solve the second shortcoming of our self-debugging
implementation. More concretely, we have attempted to eliminate the address mapping table of
all migrated fragments.
3.3.1 Division by zero extended
An extended version of this method, as previously presented in Section 3.2.1, can omit the use
of the address mapping and the stack to pass the destination address to the debugger. One can
simply use the numerator to pass any value. For instance, we can assign the destination address
to the numerator, although this may be even less stealthy than the mapping strategy. Instead we
could use an opaque predicate obfuscation strategy in such a way that the destination address,
and thus the numerator, is computed at runtime and not visible statically.
Yet another obfuscation method is to let Diablo calculate the offset value between an arbitrary
fixed address, such as 0xFFFFFFFF, and the address of our migrated code fragment. This offset
value can be used as the numerator, as a result the debugger performs the inverse operation to
determine the destination address using the provided offset value. Combining the last strategy
with opaque predicates results in an even more stealthy method for obfuscating the destination
address. Here is an example to prove our point:
Say A is the destination address A:= 0x8080
F is a static and arbitrary value F:=0xFFFFFFFF
Let N be our numerator, then N:= F XOR A
The debugger only knows N by looking at the register value in the debuggee’s context, but it
also knows F since it can be hard coded or obfuscated using opaque predicates. The final inverse
operation looks like A:= N XOR F. Notice that we use a XOR instead of a subtract operation,
this is to cope with negative overflow especially when the chosen F value appears to be less
than A. Figure 3.10 demonstrates this method; the LDR instruction loads a value which was
calculated by our formula for N. When the context switch happens, at the UDIV instruction,
the debugger can extract the value of register R0 and find the destination address.
One could use multiple arbitrary values F = {F1, F2, ..., Fn} and include all of them in the XOR
operation. This could potentially slow down the attacker a bit more. Finally, this method only
proves useful on machines which support division instructions.
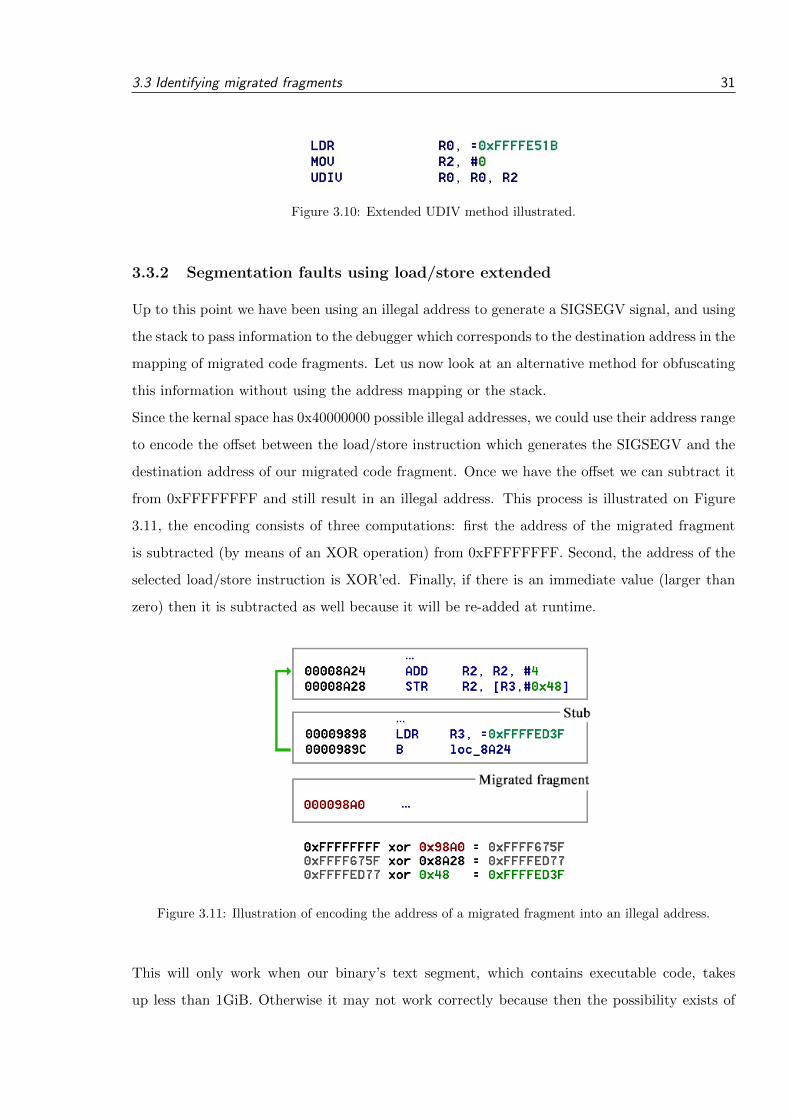
3.3 Identifying migrated fragments 31
Figure 3.10: Extended UDIV method illustrated.
3.3.2 Segmentation faults using load/store extended
Up to this point we have been using an illegal address to generate a SIGSEGV signal, and using
the stack to pass information to the debugger which corresponds to the destination address in the
mapping of migrated code fragments. Let us now look at an alternative method for obfuscating
this information without using the address mapping or the stack.
Since the kernal space has 0x40000000 possible illegal addresses, we could use their address range
to encode the offset between the load/store instruction which generates the SIGSEGV and the
destination address of our migrated code fragment. Once we have the offset we can subtract it
from 0xFFFFFFFF and still result in an illegal address. This process is illustrated on Figure
3.11, the encoding consists of three computations: first the address of the migrated fragment
is subtracted (by means of an XOR operation) from 0xFFFFFFFF. Second, the address of the
selected load/store instruction is XOR’ed. Finally, if there is an immediate value (larger than
zero) then it is subtracted as well because it will be re-added at runtime.
Figure 3.11: Illustration of encoding the address of a migrated fragment into an illegal address.
This will only work when our binary’s text segment, which contains executable code, takes
up less than 1GiB. Otherwise it may not work correctly because then the possibility exists of
3.3 Identifying migrated fragments 32
the offset being larger than 0x3FFFFFFF and consequently the illegal address will no longer
be illegal, thus no SIGSEGV will be generated. In real-world (commercial) software the text
segment (for embedded systems) is rarely larger than 10MiB, thus the offset will be less than
0x0A000000, making this strategy widely applicable.
When using this strategy one must pay close attention to load/store instructions whose immedi-
ate value is larger (less) than zero, since they can invalidate our encoded value. To solve this, we
can easily subtract (add) the immediate value from (to) the illegal address, since it will be added
(subtracted) again by the load/store at runtime. Since an immediate can have a maximum value
of 0xFFF [19], which simply means that our maximum allowed offset reduces to 0x3FFFF000. In
Diablo it is not trivial to obtain the final addresses of instructions, because these are computed
during the final phases long after our protection strategy has been applied. Hence we cannot
know, during the protection phase, whether the offset value will be larger/smaller/equal to the
immediate value. If this was somehow possible, we could choose whether to add or subtract
depending on their values and our maximum allowed offset would remain at 0x3FFFFFFF. Al-
ternatively one can disallow the usage of load/store instructions with non-zero immediate values
to preserve a maximum offset range. In reality the offset will typically be less than 10MiB, as a
result of this the immediate’s value has a negligible impact on the offset.
The debugger has also been modified to be able to reconstruct the destination address. Origi-
nally the debugger read and popped an integer value from the top of the stack which represents
the index in the address mapping table. But now the debugger will use ptrace to read the
contents of all registers from the debuggee. What makes this method easy to implement is
that the PC register remains unchanged simply because the load/store instruction failed. The
PC’s value is exactly the same as the address of our arbitrary load/store instruction which we
used for computing the offset. In the debugger we use bitwise operations to extract the register
containing the illegal address from the load/store instruction’s value. Then we can apply the
reverse operation, as illustrated on Figure 3.12, to obtain the address of the migrated code frag-
ment. This is possible since the debugger knows four crucial variables: the predefined address
0xFFFFFFFF, the illegal address itself which is stored in one of the registers, the Program
Counter which corresponds to the address of the load/store instruction and the immediate value
of this instruction. Once the debugger has finished processing the migrated fragment, it will set
the debuggee’s PC register to the appropriate return address to continue execution and send a
continuation signal to the debuggee.
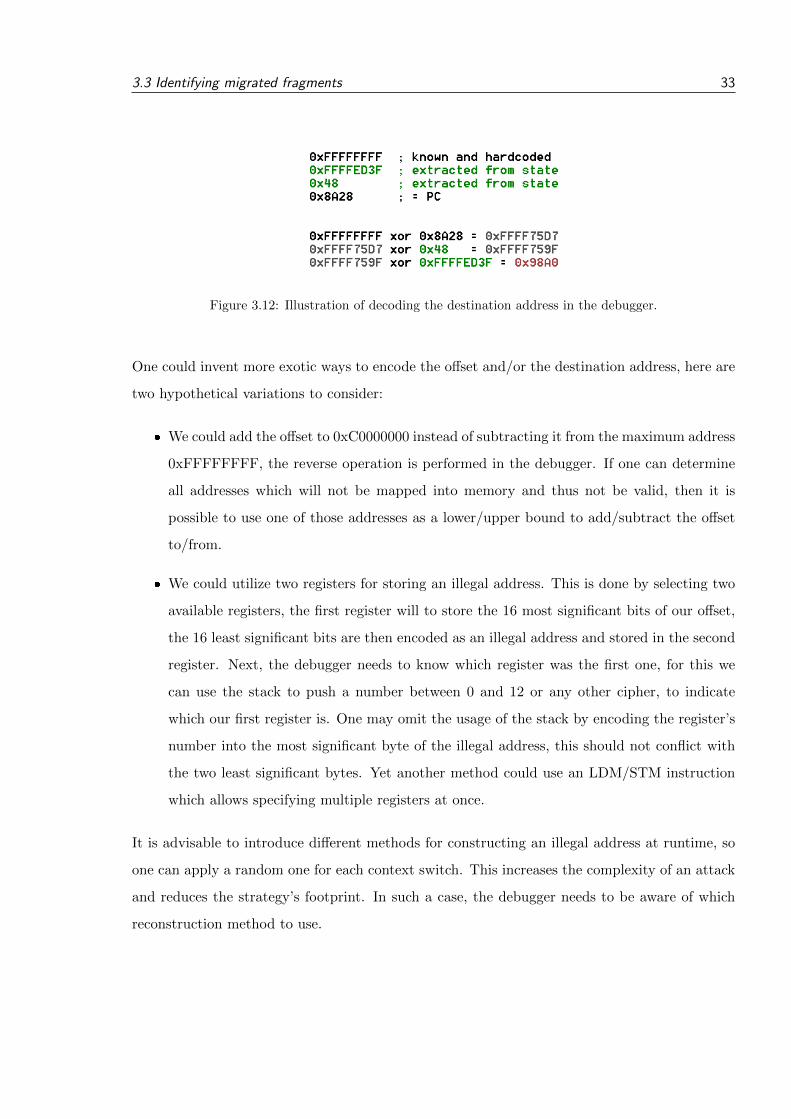
3.3 Identifying migrated fragments 33
Figure 3.12: Illustration of decoding the destination address in the debugger.
One could invent more exotic ways to encode the offset and/or the destination address, here are
two hypothetical variations to consider:
� We could add the offset to 0xC0000000 instead of subtracting it from the maximum address
0xFFFFFFFF, the reverse operation is performed in the debugger. If one can determine
all addresses which will not be mapped into memory and thus not be valid, then it is
possible to use one of those addresses as a lower/upper bound to add/subtract the offset
to/from.
� We could utilize two registers for storing an illegal address. This is done by selecting two
available registers, the first register will to store the 16 most significant bits of our offset,
the 16 least significant bits are then encoded as an illegal address and stored in the second
register. Next, the debugger needs to know which register was the first one, for this we
can use the stack to push a number between 0 and 12 or any other cipher, to indicate
which our first register is. One may omit the usage of the stack by encoding the register’s
number into the most significant byte of the illegal address, this should not conflict with
the two least significant bytes. Yet another method could use an LDM/STM instruction
which allows specifying multiple registers at once.
It is advisable to introduce different methods for constructing an illegal address at runtime, so
one can apply a random one for each context switch. This increases the complexity of an attack
and reduces the strategy’s footprint. In such a case, the debugger needs to be aware of which
reconstruction method to use.
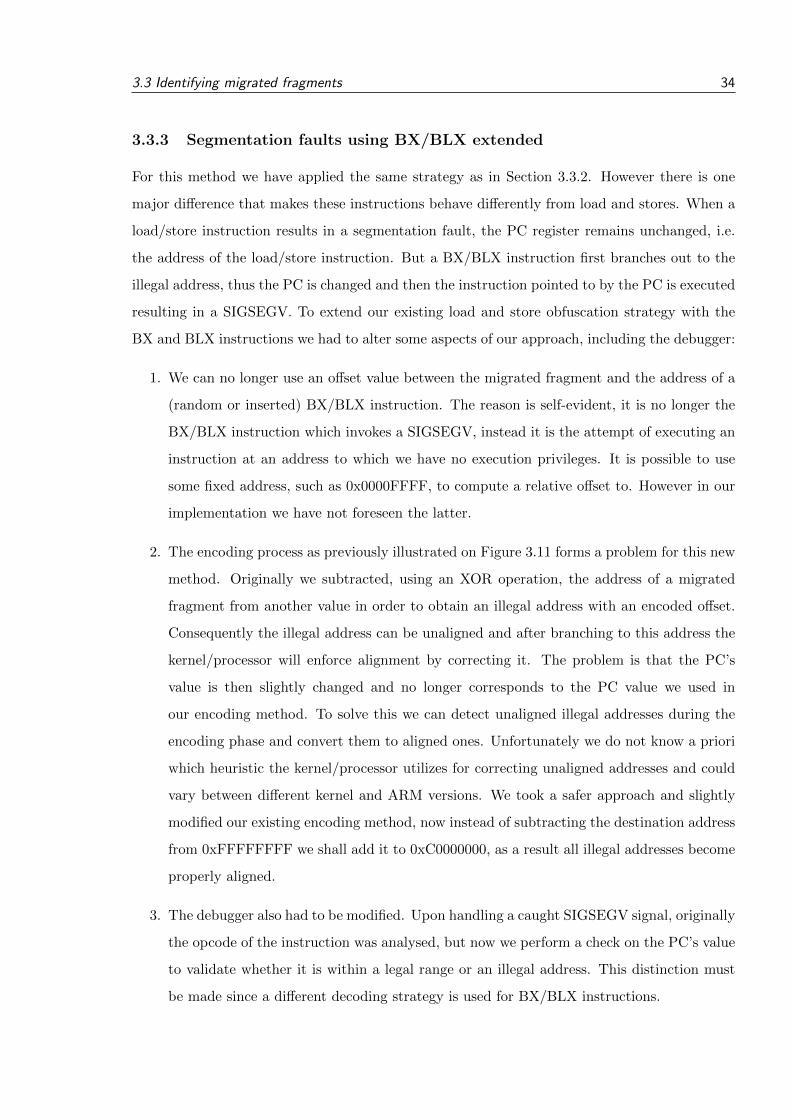
3.3 Identifying migrated fragments 34
3.3.3 Segmentation faults using BX/BLX extended
For this method we have applied the same strategy as in Section 3.3.2. However there is one
major difference that makes these instructions behave differently from load and stores. When a
load/store instruction results in a segmentation fault, the PC register remains unchanged, i.e.
the address of the load/store instruction. But a BX/BLX instruction first branches out to the
illegal address, thus the PC is changed and then the instruction pointed to by the PC is executed
resulting in a SIGSEGV. To extend our existing load and store obfuscation strategy with the
BX and BLX instructions we had to alter some aspects of our approach, including the debugger:
1. We can no longer use an offset value between the migrated fragment and the address of a
(random or inserted) BX/BLX instruction. The reason is self-evident, it is no longer the
BX/BLX instruction which invokes a SIGSEGV, instead it is the attempt of executing an
instruction at an address to which we have no execution privileges. It is possible to use
some fixed address, such as 0x0000FFFF, to compute a relative offset to. However in our
implementation we have not foreseen the latter.
2. The encoding process as previously illustrated on Figure 3.11 forms a problem for this new
method. Originally we subtracted, using an XOR operation, the address of a migrated
fragment from another value in order to obtain an illegal address with an encoded offset.
Consequently the illegal address can be unaligned and after branching to this address the
kernel/processor will enforce alignment by correcting it. The problem is that the PC’s
value is then slightly changed and no longer corresponds to the PC value we used in
our encoding method. To solve this we can detect unaligned illegal addresses during the
encoding phase and convert them to aligned ones. Unfortunately we do not know a priori
which heuristic the kernel/processor utilizes for correcting unaligned addresses and could
vary between different kernel and ARM versions. We took a safer approach and slightly
modified our existing encoding method, now instead of subtracting the destination address
from 0xFFFFFFFF we shall add it to 0xC0000000, as a result all illegal addresses become
properly aligned.
3. The debugger also had to be modified. Upon handling a caught SIGSEGV signal, originally
the opcode of the instruction was analysed, but now we perform a check on the PC’s value
to validate whether it is within a legal range or an illegal address. This distinction must
be made since a different decoding strategy is used for BX/BLX instructions.
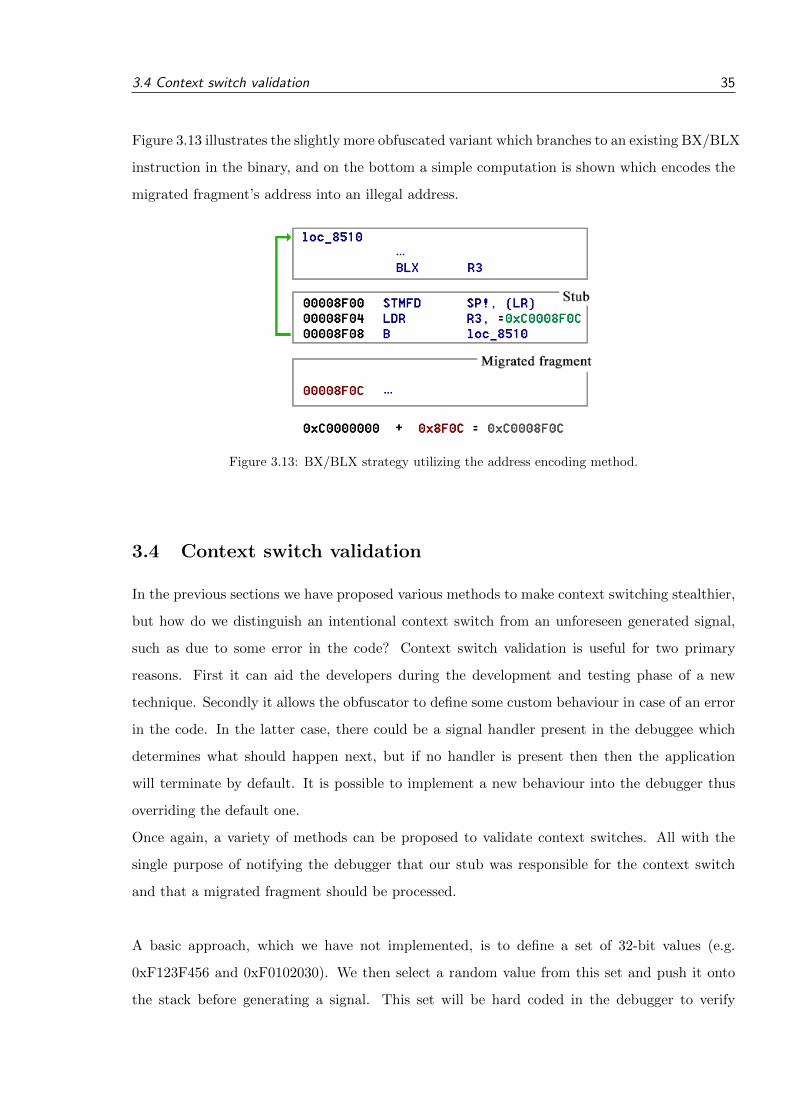
3.4 Context switch validation 35
Figure 3.13 illustrates the slightly more obfuscated variant which branches to an existing BX/BLX
instruction in the binary, and on the bottom a simple computation is shown which encodes the
migrated fragment’s address into an illegal address.
Figure 3.13: BX/BLX strategy utilizing the address encoding method.
3.4 Context switch validation
In the previous sections we have proposed various methods to make context switching stealthier,
but how do we distinguish an intentional context switch from an unforeseen generated signal,
such as due to some error in the code? Context switch validation is useful for two primary
reasons. First it can aid the developers during the development and testing phase of a new
technique. Secondly it allows the obfuscator to define some custom behaviour in case of an error
in the code. In the latter case, there could be a signal handler present in the debuggee which
determines what should happen next, but if no handler is present then then the application
will terminate by default. It is possible to implement a new behaviour into the debugger thus
overriding the default one.
Once again, a variety of methods can be proposed to validate context switches. All with the
single purpose of notifying the debugger that our stub was responsible for the context switch
and that a migrated fragment should be processed.
A basic approach, which we have not implemented, is to define a set of 32-bit values (e.g.
0xF123F456 and 0xF0102030). We then select a random value from this set and push it onto
the stack before generating a signal. This set will be hard coded in the debugger to verify
3.5 Protecting the debugger 36
whether the value at the top of the debuggee’s stack corresponds to any value in this set. In
case no match is found then we can conclude that some unexpected error occurred. But there
is a (small) probability for matching false positives, which is proportional to the size of the set.
In our implementation we have decided to take another route to validate context switches.
The idea was to re-use the address mapping table, which was originally used for identifying
migrated fragments by means of an index. To preserve the higher degree of obfuscation, we have
mutilated (by means of an XOR operation) all addresses in this mapping table using a random
static 32-bit mask. Doing so, the new values in the mapping will have very little meaning to an
attacker/analyst. Further, during a context switch, the debugger attempts to reconstruct the
destination address of a migrated fragment and compares this value (XOR’ed with the mask)
for equality against all addresses in the mapping table. If a match is found then we can more
or less assume that the context switch was not a random occurrence.
Iterating through the mapping table comes at a cost and has an O(n) time complexity, where
n represents the number of migrated code fragments. Since the final addresses are unknown
during the protection phase it is infeasible to sort them, if this was somehow possible then we
could guarantee an O(log(n)) time complexity thanks to the binary search algorithm. An even
better solution would be to incorporate a hashing algorithm with an O(1) time complexity.
3.5 Protecting the debugger
Up to this point, our debugger process did not have any protection whatsoever, making it vul-
nerable to a variety of attacks. Protecting the debugger against debugging is of high importance
because it can reveal how our self-debugger works. More specifically it might reveal how control
is transferred from the debuggee to the debugger, and the addresses of the migrated fragments.
3.5.1 Circular debugging
In this section we investigate whether the same anti-debugging strategy can be applied to the
debugger. It is assumed possible to establish a circular debugging [1, 50, 51] setting as illustrated
on Figure 3.14. A simple implementation of this technique proved it be quite challenging. Our
C proof-of-concept implementation can be seen on Figure 3.15, notice that the ptrace system
calls are wrapped in separate functions e.g. ‘attachTo’ represents a ptrace attach call. The code
consists of two major components:
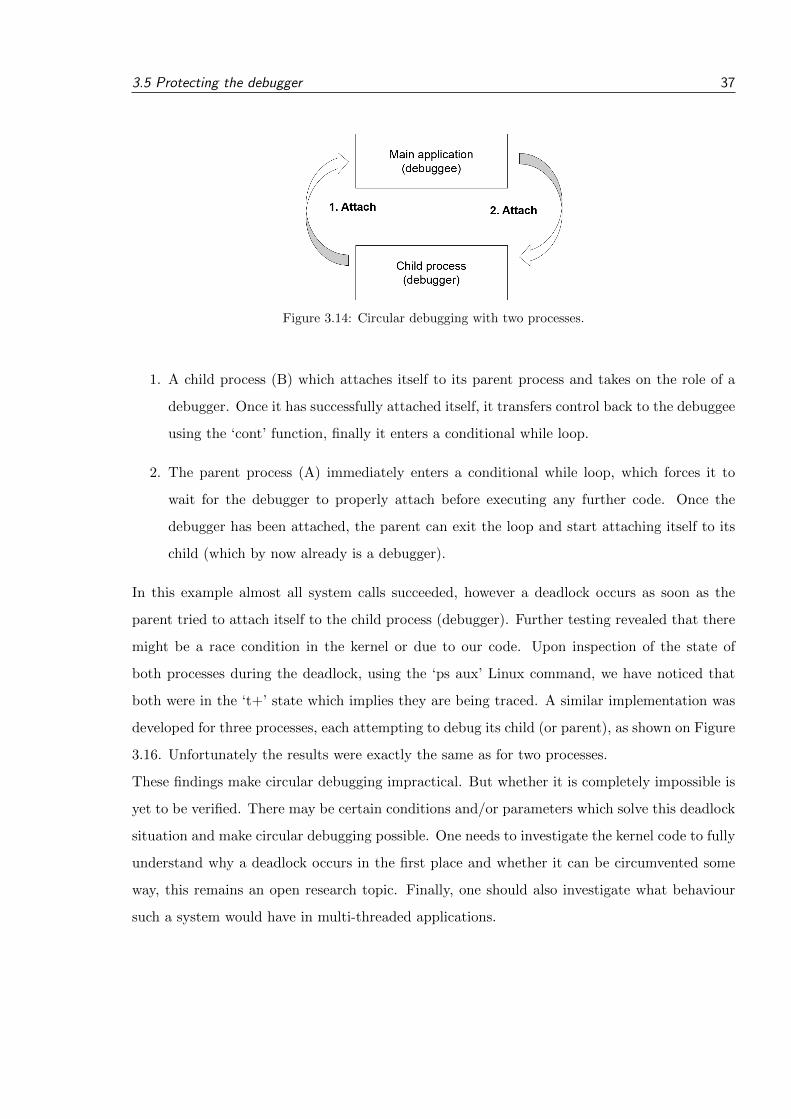
3.5 Protecting the debugger 37
Figure 3.14: Circular debugging with two processes.
1. A child process (B) which attaches itself to its parent process and takes on the role of a
debugger. Once it has successfully attached itself, it transfers control back to the debuggee
using the ‘cont’ function, finally it enters a conditional while loop.
2. The parent process (A) immediately enters a conditional while loop, which forces it to
wait for the debugger to properly attach before executing any further code. Once the
debugger has been attached, the parent can exit the loop and start attaching itself to its
child (which by now already is a debugger).
In this example almost all system calls succeeded, however a deadlock occurs as soon as the
parent tried to attach itself to the child process (debugger). Further testing revealed that there
might be a race condition in the kernel or due to our code. Upon inspection of the state of
both processes during the deadlock, using the ‘ps aux’ Linux command, we have noticed that
both were in the ‘t+’ state which implies they are being traced. A similar implementation was
developed for three processes, each attempting to debug its child (or parent), as shown on Figure
3.16. Unfortunately the results were exactly the same as for two processes.
These findings make circular debugging impractical. But whether it is completely impossible is
yet to be verified. There may be certain conditions and/or parameters which solve this deadlock
situation and make circular debugging possible. One needs to investigate the kernel code to fully
understand why a deadlock occurs in the first place and whether it can be circumvented some
way, this remains an open research topic. Finally, one should also investigate what behaviour
such a system would have in multi-threaded applications.
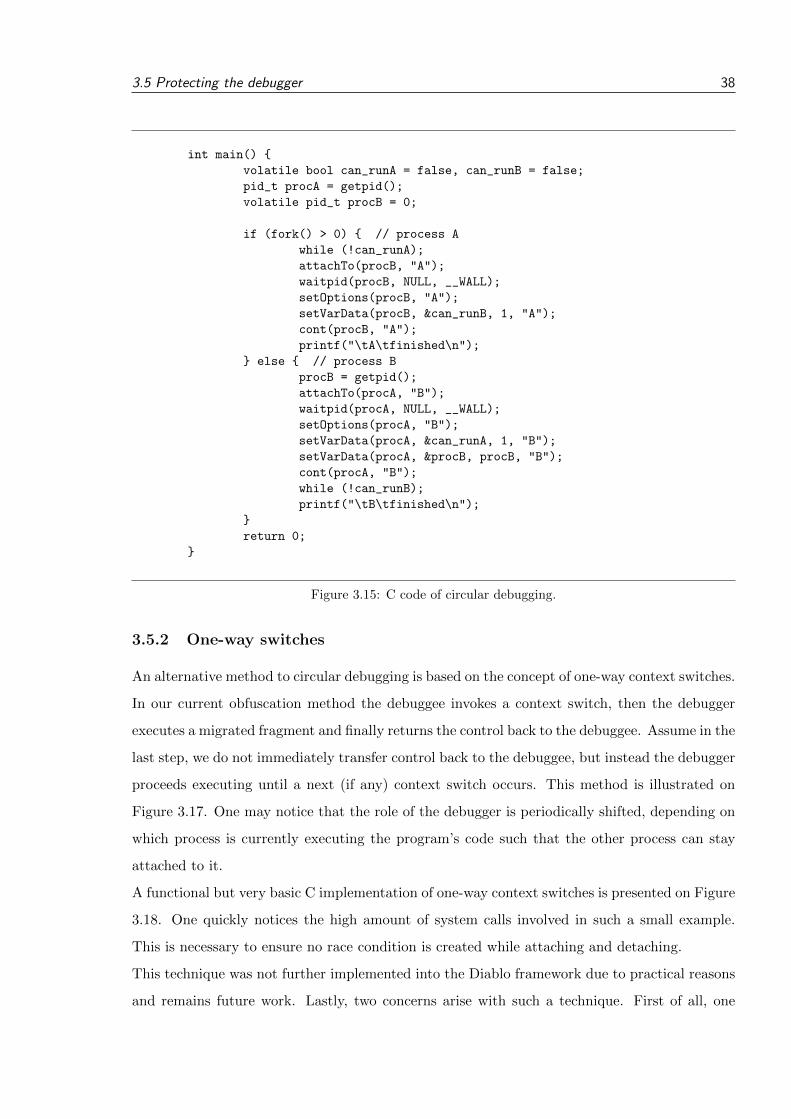
3.5 Protecting the debugger 38
int main() {
volatile bool can_runA = false, can_runB = false;
pid_t procA = getpid();
volatile pid_t procB = 0;
if (fork() > 0) { // process A
while (!can_runA);
attachTo(procB, "A");
waitpid(procB, NULL, __WALL);
setOptions(procB, "A");
setVarData(procB, &can_runB, 1, "A");
cont(procB, "A");
printf("\tA\tfinished\n");
} else { // process B
procB = getpid();
attachTo(procA, "B");
waitpid(procA, NULL, __WALL);
setOptions(procA, "B");
setVarData(procA, &can_runA, 1, "B");
setVarData(procA, &procB, procB, "B");
cont(procA, "B");
while (!can_runB);
printf("\tB\tfinished\n");
}
return 0;
}
Figure 3.15: C code of circular debugging.
3.5.2 One-way switches
An alternative method to circular debugging is based on the concept of one-way context switches.
In our current obfuscation method the debuggee invokes a context switch, then the debugger
executes a migrated fragment and finally returns the control back to the debuggee. Assume in the
last step, we do not immediately transfer control back to the debuggee, but instead the debugger
proceeds executing until a next (if any) context switch occurs. This method is illustrated on
Figure 3.17. One may notice that the role of the debugger is periodically shifted, depending on
which process is currently executing the program’s code such that the other process can stay
attached to it.
A functional but very basic C implementation of one-way context switches is presented on Figure
3.18. One quickly notices the high amount of system calls involved in such a small example.
This is necessary to ensure no race condition is created while attaching and detaching.
This technique was not further implemented into the Diablo framework due to practical reasons
and remains future work. Lastly, two concerns arise with such a technique. First of all, one
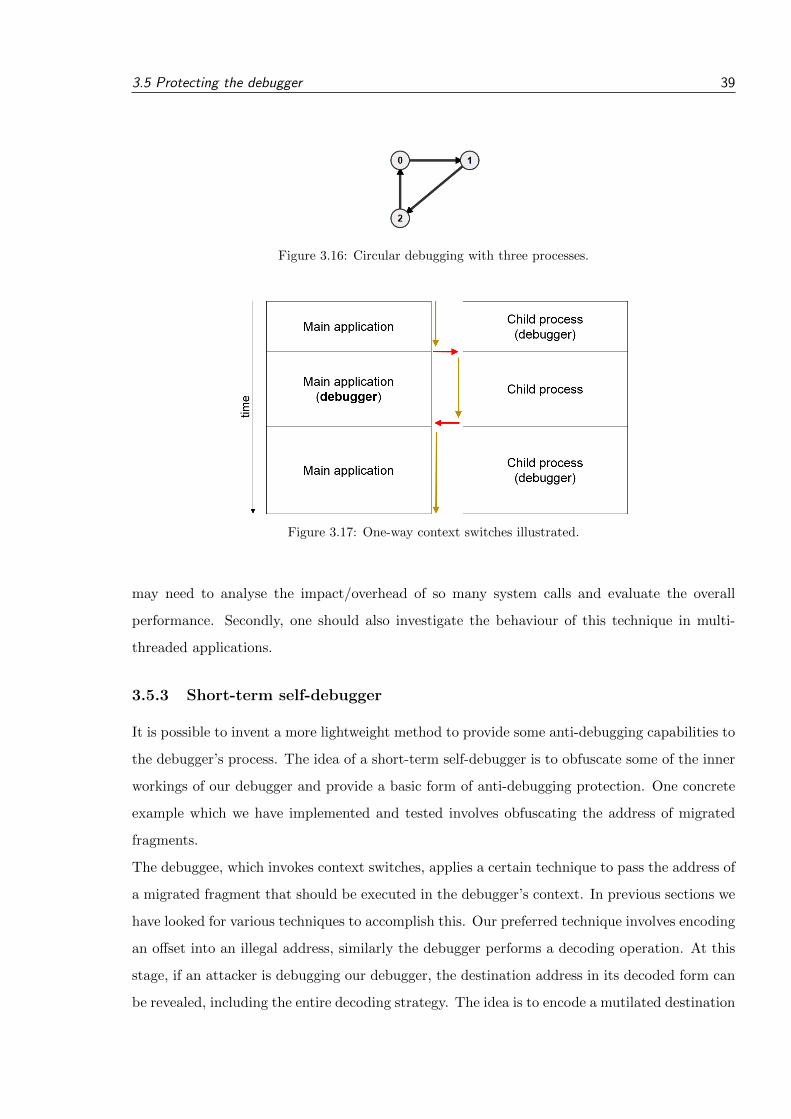
3.5 Protecting the debugger 39
Figure 3.16: Circular debugging with three processes.
Figure 3.17: One-way context switches illustrated.
may need to analyse the impact/overhead of so many system calls and evaluate the overall
performance. Secondly, one should also investigate the behaviour of this technique in multi-
threaded applications.
3.5.3 Short-term self-debugger
It is possible to invent a more lightweight method to provide some anti-debugging capabilities to
the debugger’s process. The idea of a short-term self-debugger is to obfuscate some of the inner
workings of our debugger and provide a basic form of anti-debugging protection. One concrete
example which we have implemented and tested involves obfuscating the address of migrated
fragments.
The debuggee, which invokes context switches, applies a certain technique to pass the address of
a migrated fragment that should be executed in the debugger’s context. In previous sections we
have looked for various techniques to accomplish this. Our preferred technique involves encoding
an offset into an illegal address, similarly the debugger performs a decoding operation. At this
stage, if an attacker is debugging our debugger, the destination address in its decoded form can
be revealed, including the entire decoding strategy. The idea is to encode a mutilated destination
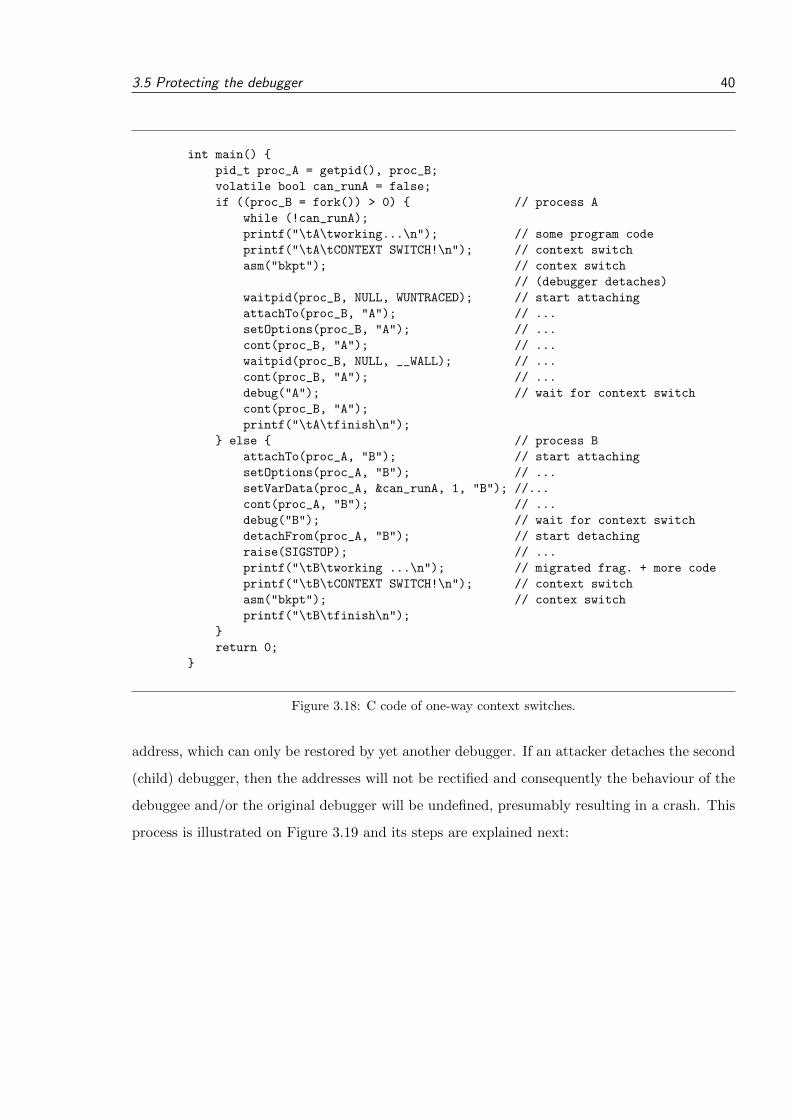
3.5 Protecting the debugger 40
int main() {
pid_t proc_A = getpid(), proc_B;
volatile bool can_runA = false;
if ((proc_B = fork()) > 0) { // process A
while (!can_runA);
printf("\tA\tworking...\n"); // some program code
printf("\tA\tCONTEXT SWITCH!\n"); // context switch
asm("bkpt"); // contex switch
// (debugger detaches)
waitpid(proc_B, NULL, WUNTRACED); // start attaching
attachTo(proc_B, "A"); // ...
setOptions(proc_B, "A"); // ...
cont(proc_B, "A"); // ...
waitpid(proc_B, NULL, __WALL); // ...
cont(proc_B, "A"); // ...
debug("A"); // wait for context switch
cont(proc_B, "A");
printf("\tA\tfinish\n");
} else { // process B
attachTo(proc_A, "B"); // start attaching
setOptions(proc_A, "B"); // ...
setVarData(proc_A, &can_runA, 1, "B"); //...
cont(proc_A, "B"); // ...
debug("B"); // wait for context switch
detachFrom(proc_A, "B"); // start detaching
raise(SIGSTOP); // ...
printf("\tB\tworking ...\n"); // migrated frag. + more code
printf("\tB\tCONTEXT SWITCH!\n"); // context switch
asm("bkpt"); // contex switch
printf("\tB\tfinish\n");
}
return 0;
}
Figure 3.18: C code of one-way context switches.
address, which can only be restored by yet another debugger. If an attacker detaches the second
(child) debugger, then the addresses will not be rectified and consequently the behaviour of the
debuggee and/or the original debugger will be undefined, presumably resulting in a crash. This
process is illustrated on Figure 3.19 and its steps are explained next:
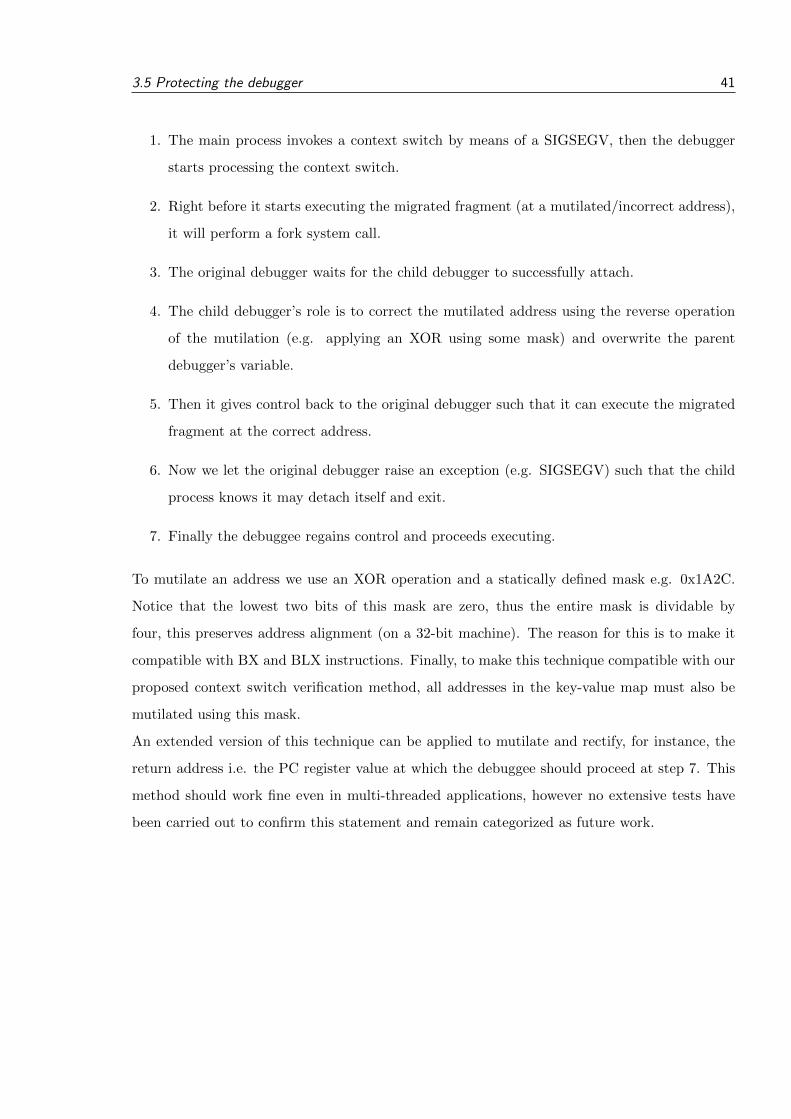
3.5 Protecting the debugger 41
1. The main process invokes a context switch by means of a SIGSEGV, then the debugger
starts processing the context switch.
2. Right before it starts executing the migrated fragment (at a mutilated/incorrect address),
it will perform a fork system call.
3. The original debugger waits for the child debugger to successfully attach.
4. The child debugger’s role is to correct the mutilated address using the reverse operation
of the mutilation (e.g. applying an XOR using some mask) and overwrite the parent
debugger’s variable.
5. Then it gives control back to the original debugger such that it can execute the migrated
fragment at the correct address.
6. Now we let the original debugger raise an exception (e.g. SIGSEGV) such that the child
process knows it may detach itself and exit.
7. Finally the debuggee regains control and proceeds executing.
To mutilate an address we use an XOR operation and a statically defined mask e.g. 0x1A2C.
Notice that the lowest two bits of this mask are zero, thus the entire mask is dividable by
four, this preserves address alignment (on a 32-bit machine). The reason for this is to make it
compatible with BX and BLX instructions. Finally, to make this technique compatible with our
proposed context switch verification method, all addresses in the key-value map must also be
mutilated using this mask.
An extended version of this technique can be applied to mutilate and rectify, for instance, the
return address i.e. the PC register value at which the debuggee should proceed at step 7. This
method should work fine even in multi-threaded applications, however no extensive tests have
been carried out to confirm this statement and remain categorized as future work.
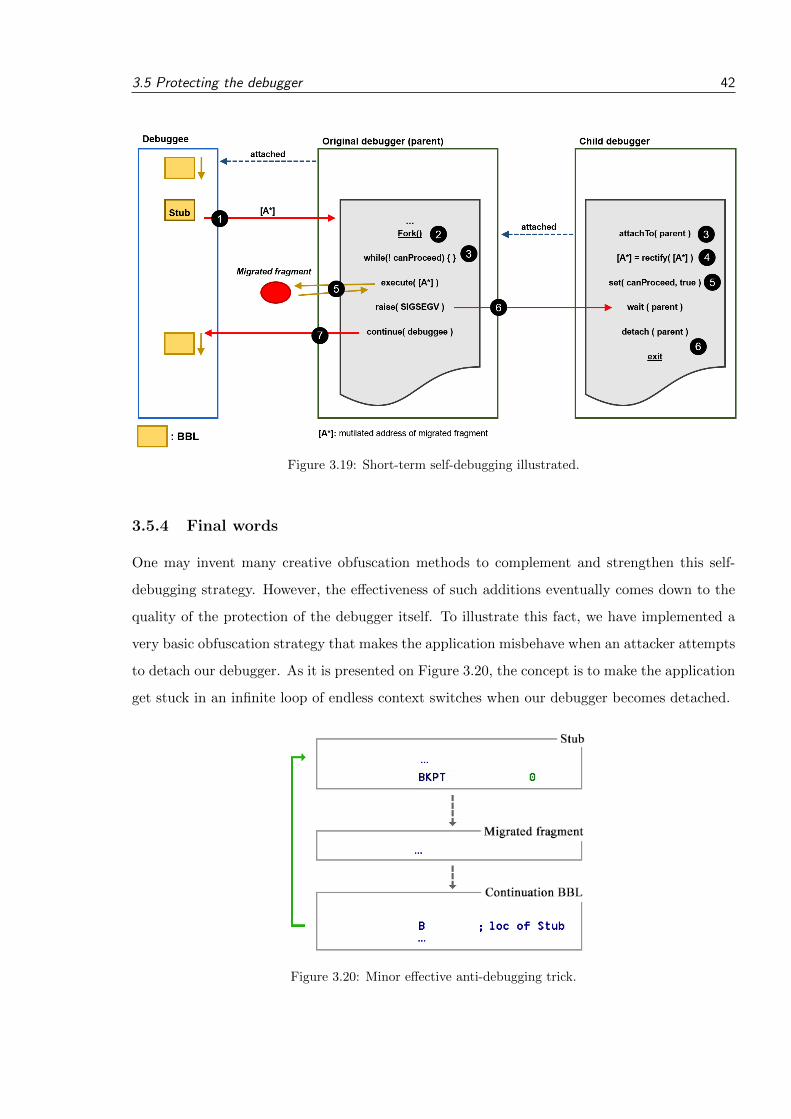
3.5 Protecting the debugger 42
Figure 3.19: Short-term self-debugging illustrated.
3.5.4 Final words
One may invent many creative obfuscation methods to complement and strengthen this self-
debugging strategy. However, the effectiveness of such additions eventually comes down to the
quality of the protection of the debugger itself. To illustrate this fact, we have implemented a
very basic obfuscation strategy that makes the application misbehave when an attacker attempts
to detach our debugger. As it is presented on Figure 3.20, the concept is to make the application
get stuck in an infinite loop of endless context switches when our debugger becomes detached.
Figure 3.20: Minor effective anti-debugging trick.
3.5 Protecting the debugger 43
The trick is to let our debugger increment the PC’s value by 0x4 (or 0x2 in thumb mode) to escape
the loop. If an attacker’s (partially reverse engineered) debugger does not have this measure
implemented then it might turn out to be an effective protection method. In a more advanced
version, the debugger could purposely let the loop execute a random number of times (e.g.
between 5 and 10) before correcting the PC’s value and allowing the debuggee to proceed. One
can add a numerous amount of similar techniques to make our self-debugger more indispensable,
but it will only be as effective as the complexity of reverse engineering our self-debugger.
EVALUATION 44
Chapter 4
Evaluation
The original version of the tightly-coupled self-debugging protection technique has been exten-
sively tested on real-world software [1]. In this chapter we primarily focus on evaluating the
performance aspects of our proposed improvements: context switch invocation, migrated code
fragment identification, context switch validation and debugger protection. All tests were carried
out solely for binaries (not libraries), using the ARMv7 platform on a SABRE Lite developer
board with Linux (Linaro 13.08) kernel version 3.0.35.
4.1 Correctness testing
All our proposed and implemented techniques have been properly and successfully tested on self-
written C/C++ toy applications and real-world software Bzip2 [40]. The number of protected
code fragments ranged between one and six inclusively. Each code fragment contained between
one and eight lines of code. Our existing self-debugging implementation is not able to protect
just any piece of code, for instance, functions such as ‘fileno’, ‘fread’, ‘fclose’ and some other
standard C library functions are not supported. The reason why is that the debuggee can
open file(s) for reading/writing purposes, thus migrating a function call such as ‘fclose’ to the
debugger will not allow the debugger to close the same file(s) simply because it is a different
process.
4.2 Execution overhead
Our tests were designed to measure and illustrate the performance overhead on a real-world
application. The application we have chosen for testing was Bzip2 version 1.0.6 [40]. Further,
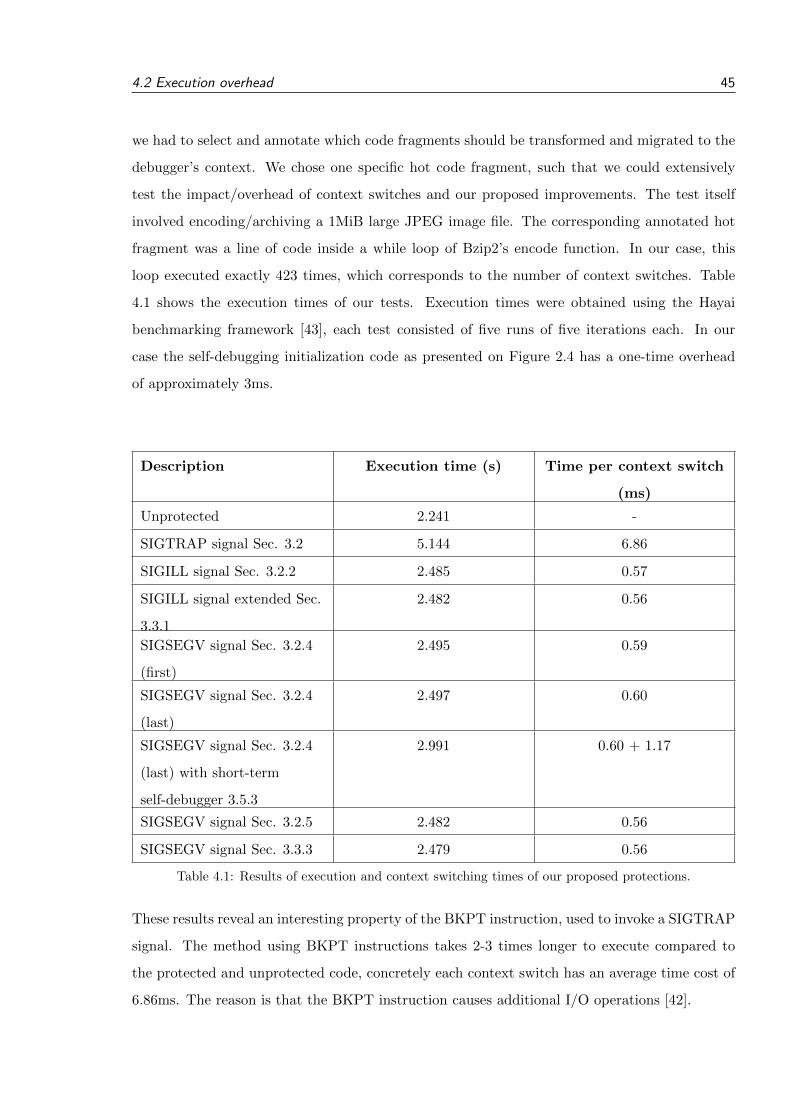
4.2 Execution overhead 45
we had to select and annotate which code fragments should be transformed and migrated to the
debugger’s context. We chose one specific hot code fragment, such that we could extensively
test the impact/overhead of context switches and our proposed improvements. The test itself
involved encoding/archiving a 1MiB large JPEG image file. The corresponding annotated hot
fragment was a line of code inside a while loop of Bzip2’s encode function. In our case, this
loop executed exactly 423 times, which corresponds to the number of context switches. Table
4.1 shows the execution times of our tests. Execution times were obtained using the Hayai
benchmarking framework [43], each test consisted of five runs of five iterations each. In our
case the self-debugging initialization code as presented on Figure 2.4 has a one-time overhead
of approximately 3ms.
Description Execution time (s) Time per context switch
(ms)
Unprotected 2.241 -
SIGTRAP signal Sec. 3.2 5.144 6.86
SIGILL signal Sec. 3.2.2 2.485 0.57
SIGILL signal extended Sec.
3.3.1
2.482 0.56
SIGSEGV signal Sec. 3.2.4
(first)
2.495 0.59
SIGSEGV signal Sec. 3.2.4
(last)
2.497 0.60
SIGSEGV signal Sec. 3.2.4
(last) with short-term
self-debugger 3.5.3
2.991 0.60 + 1.17
SIGSEGV signal Sec. 3.2.5 2.482 0.56
SIGSEGV signal Sec. 3.3.3 2.479 0.56
Table 4.1: Results of execution and context switching times of our proposed protections.
These results reveal an interesting property of the BKPT instruction, used to invoke a SIGTRAP
signal. The method using BKPT instructions takes 2-3 times longer to execute compared to
the protected and unprotected code, concretely each context switch has an average time cost of
6.86ms. The reason is that the BKPT instruction causes additional I/O operations [42].
4.3 Self-debugging vulnerabilities 46
Further, we see that both the SIGILL and SIGSEGV signals perform considerably faster com-
pared to the SIGTRAP signal and are not much slower compared to the unprotected version.
The average time cost using a SIGSEGV/SIGILL signal lies between 0.50ms and 0.60ms per
context switch. Also notice that the SIGSEGV method which uses the short-term self-debugger
technique has an additional overhead of 494ms (including 3ms due to the initialization routine),
which comes down to a total of 1.77ms per context switch.
The migrated code fragments have all their load/store instructions transformed, such that they
can use ptrace to load/store from the debuggee’s context. These ptrace calls induce a small
overhead of 3.4us for reads and 2.3us for writes [1]. Relative to the cost of context switches
themselves, a moderate amount of transformed loads/stores should have a negligible impact on
the overall overhead. In real-world software one should consider annotating code fragments with
these results in mind. Especially in high-performance scenarios, it is advisable to annotate code
fragments before and/or after hot code areas.
4.3 Self-debugging vulnerabilities
To evaluate any protection strategy, one could make an attempt to attack it. Complementary
to the goal of this dissertation, we have looked for a few ways/hacks to circumvent our own
self-debugging method. It definitely proved to be quite burdensome for not very experienced
attackers. Initially we have attempted to detach the debugger and attach a GNU debugger, which
was only able to correctly debug the process to the point of a first context switch. Because of this
anti-debugging protection, the only method we could utilize for reverse engineering a toy binary
was through static analysis. In a MATE attack one has full control over the operating system,
including the kernel, thus an attacker can find various ways to circumvent our self-debugging
techniques [1].
There is one concrete example of a hack which, hypothetically, can separate the debuggee from
the debugger, making it possible to completely debug both processes individually.
When an application with our self-debugging strategy is running, the process id of the debugger
(TracerPid) can be found in the file ‘/proc/[PID]/status’ (PID is the debuggee’s process id).
An attacker, having full control over the kernel, can modify the kernel at will to allow him/her
attach two debuggers, to the debuggee and debugger respectively. Some creativity will be
required from his/her part to make the context switches execute properly. Statements made
regarding this hack are yet to be tested and verified.
FUTURE WORK 47
Chapter 5
Future work
In the previous chapter we have looked at various shortcomings and proposed improvements
with regards to our advanced anti-debugging technique by means of self-debugging. But many
more improvements will be required as time passes. Unfortunately no protection technique shall
ever suffice, as long as attackers are a potential threat that is. When a technique is circumvented
it generally becomes less effective and one is pretty much obliged to improve it.
That being said, there are various improvements necessary with regards to this dissertation. A
very important one is to figure out whether circular debugging can be implemented and further
evaluate its effectiveness. The same should be done for the one-way context switch strategy.
Our short-term self-debugger can also be extended to support many more capabilities.
Yet another important research subject involves multi-threaded applications in combination with
all three debugger protection strategies.
Last but not least, when our self-debugging technique is applied to multiple libraries used in a
single solution it will conflict. The reason is self-evident, as each library will spawn a new child
process which attempts to become the debugger for the single parent process. It is possible to
let each debugger verify whether another debugger is already present or not, but how should it
know if the already present debugger is malicious? Questions like these remain unanswered.
CONCLUSION 48
Chapter 6
Conclusion
In this dissertation we have looked for improvements to an existing anti-debugging technique by
means of self-debugging with migrated code fragments, solely focusing on executable binaries.
New methods have been proposed for invoking context switches and passing address information
from the debuggee to the debugger. A selection had to be made, consisting of instructions
which can generate a Linux signal under certain conditions and/or violations. Further, various
techniques were proposed which allowed us to pass information to the debugger in a stealthy
and obscure manner, mostly this was an obfuscated 32-bit value representing the address of
a migrated code fragment. Next, two simple strategies were proposed for validating a context
switch, to determine whether it was due to an error in the code or generated by a stub. Finally we
have proposed three code obfuscation and anti-debugging protection strategies for the debugger,
which for a large part remain future work.
The performance and execution overhead of our self-debugging technique comes at a cost of
no more than two milliseconds per context switch. In the end, the overal performance and
overhead will highly depend on the amount of generated context switches and the annotated
code fragment(s).
BIBLIOGRAPHY 49
Appendix A
Bibliography
[1] Bert Abrath, Joris Wijnant, Bart Coppens, Bjorn De Sutter, and Stijn Volckaert.
“Tightly-Coupled Self-Debugging Software Protection.” In 6th Workshop on Software
Security, Protection, and Reverse Engineering (SSPREW’16), ACM, 2016.
[2] Bjorn De Sutter, Bruno De Bus and Koen De Bosschere. “Link-Time Binary Rewriting
Techniques for Program Compaction”, Vol. 27, No. 5, pages 882-945, September 2005, pp.
898-899.
[3] Bjorn De Sutter, Paolo Falcarin, Brecht Wyseur, Cataldo Basile, Mariano Ceccato,
Jerome d’Annoville, Michael Zunke. “A reference architecture for software protection.” In
13th Working IEEE/IFIP Conference on Software Architecture (WICSA), 5-8 April 2016.
[4] Mariano Ceccato, Paolo Tonella, Aldo Basile, Bart Coppens, Bjorn De Sutter, Paolo
Falcarin, and Marco Torchiano. “How professional hackers understand protected code
while performing attack tasks”, May 20 - 28, 2017.
[5] Boaz Barak, Oded Goldreich, Rusell Impagliazzo, Steven Rudich, Amit Sahai, Salil
Vadhan, and Ke Yang. “On the (im)possibility of obfuscating programs”. Volume 59 Issue
2, April 2012, Article No. 6.
[6] Viticchie, Alessio, Cataldo Basile, Andrea Avancini, Mariano Ceccato, Bert Abrath, and
Bart Coppens. 2016. “Reactive Attestation: Automatic Detection and Reaction to
Software Tampering Attacks.” In SPRO’16: PROCEEDINGS OF THE 2016 ACM
WORKSHOP ON SOFTWARE PROTECTION. Vienna, Austria: Association for
Computing Machinery (ACM).
BIBLIOGRAPHY 50
[7] C. Collberg, C. Thomborson, and D. Low. “Manufacturing cheap, resilient, and stealthy
opaque constructs.” In Proc. 25th. ACM Symposium on Principles of Programming
Languages (POPL 1998), pp. 184-196, January 1998.
[8] Anirban Majumdar, Clark Thomborson, and Stephen Drape. “A Survey of Control-Flow
Obfuscations”. December 2006.
[9] Sandrine Blazy and Alix Trieu. “Formal verification of control-flow graph flattening”.
January 18 - 19, 2016.
[10] Stephen Drape. “Obfuscation of Abstract Data Types”. University of Oxford, 2004, p16.
[11] Pradeep Padala. Playing with ptrace, Part I.
http://www.linuxjournal.com/article/6100
[12] ARM Limited. Register-relative and PC-relative expressions. http://infocenter.arm.
com/help/index.jsp?topic=/com.arm.doc.dui0473j/dom1359731173886.html
[13] Seth Rosenblatt. Russian government gathers intelligence with malware: report.
https://www.cnet.com/news/
russian-government-gathers-intelligence-with-malware-report/
[14] Steve Morgan. Cybersecurity market report.
http://cybersecurityventures.com/cybersecurity-market-report/
[15] Jscrambler. Control Flow Flattening.
https://blog.jscrambler.com/jscrambler-101-control-flow-flattening/
[16] PTRACE(2) - Linux Programmer’s Manual
http://man7.org/linux/man-pages/man2/ptrace.2.html
[17] SIGNAL(7) - Linux Programmer’s Manual
http://man7.org/linux/man-pages/man7/signal.7.html
[18] Gustavo Duarte. Anatomy of a Program in Memory.
http://duartes.org/gustavo/blog/post/anatomy-of-a-program-in-memory/
[19] ARM Limited. ARM Architecture Reference Manual ARMv7-A and ARMv7-R edition.
http:
//infocenter.arm.com/help/index.jsp?topic=/com.arm.doc.ddi0406c/index.html
BIBLIOGRAPHY 51
[20] ARM Group. Register usage in subroutine calls.
http://www.keil.com/support/man/docs/armasm/armasm_dom1359731145503.htm
[21] Alan Clements. The No Operation Instruction. http://alanclements.org/nops.html
[22] Saurabh Sengar. ARM Architecture Basics.
https://saurabhsengarblog.wordpress.com/2015/12/
[23] Katerina Troshina, Alexander Chernov, Yegor Derevenets. C Decompilation: Is It
Possible?
http://decompilation.info/sites/all/files/articles/Cdecompilation.pdf
[24] F-Secure. Reverse Engineering Malware Dynamic Analysis of Binary Malware II.
https://mycourses.aalto.fi/pluginfile.php/441370/mod_resource/content/1/
DynamicAnalysis_II_2017.pdf
[25] Greg Hoglund and Gary McGraw. Reverse Engineering and Program Understanding.
http://www.informit.com/articles/article.aspx?p=353553&seqNum=5
[26] Johannes Kinder and Dmitry Kravchenko. “Alternating control flow reconstruction”,
January 22 - 24, 2012.
[27] Encrypted Self Modifying Code.
https://www.gilgalab.com.br/blog/2013/01/18/Self-modifying-code.html
[28] Reno Robert. Defeating anti-debugging techniques using IDA and x86 emulator plugin.
http:
//v0ids3curity.blogspot.be/2013/05/defeating-anti-debugging-techniques.html
[29] Shane Tully. “Writing a Self-Mutating x86 64 C Program”. Dec 29, 2013.
https://shanetully.com/2013/12/writing-a-self-mutating-x86_64-c-program/
[30] Madou, Matias, Bertrand Anckaert, Patrick Moseley, Saumya Debray, Bjorn De Sutter,
and Koen De Bosschere. 2006. “Software Protection Through Dynamic Code Mutation.”
Ed. J Song, T Kwon, and M Yung. Lecture Notes in Computer Science 3786: 194206.
[31] Joshua Cannell. Obfuscation: Malware’s best friend. https://blog.malwarebytes.com/
threat-analysis/2013/03/obfuscation-malwares-best-friend/
BIBLIOGRAPHY 52
[32] Silvio Cesare. “Linux anti-debugging techniques (fooling the debugger).” January 1999
http://www.ouah.org/linux-anti-debugging.txt
[33] The ASPIRE FP7 project framework repository.
https://github.com/aspire-fp7/framework
[34] Alex Allain. Compiling and Linking.
http://www.cprogramming.com/compilingandlinking.html
[35] De Sutter, Bjorn, Ludo Van Put, Dominique Chanet, Bruno De Bus, and Koen De
Bosschere. 2007. “Link-time Compaction and Optimization of ARM Executables.” Acm
Transactions on Embedded Computing Systems 6 (1): AR5.
[36] Chris Shore. Divide and Conquer - Division on ARM Cores.
https://community.arm.com/processors/b/blog/posts/divide-and-conquer
[37] Nicolas Pitre, Mar 13, 2001. Modified Russell King, Nov 30, 2001. Linux kenrel 4.9
mem alignment.
https://www.mjmwired.net/kernel/Documentation/arm/mem_alignment
[38] ARM Limited. How does the ARM Compiler support unaligned accesses? http:
//infocenter.arm.com/help/index.jsp?topic=/com.arm.doc.faqs/ka15414.html
[39] Function safe usermode(int, bool) on line 97,
http://elixir.free-electrons.com/linux/v3.14/source/arch/arm/mm/alignment.c
[40] Julian Seward. Bzip2. http://www.bzip.org/
[41] Andrew S. Tanenbaum, Todd Austin. ”Structured Computer Organization, sixth edition”
Pearson Education Limited, ISBN 13: 9780273769248
[42] Dr Jack Whitham. The mystery of the fifteen-millisecond breakpoint instruction.
https://www.jwhitham.org/2015/04/the-mystery-of-fifteen-millisecond.html
[43] Nick Bruun. “Hayai” C++ benchmarking framework.
https://github.com/nickbruun/hayai
[44] P. Ferrie. The ultimate anti-debugging reference. http://anti-reversing.com/
Downloads/Anti-Reversing/The_Ultimate_Anti-Reversing_Reference.pdf, April
2011.
BIBLIOGRAPHY 53
[45] Paul Moon. “The Use of Packers, Obfuscators and Encryptors in Modern Malware.” 4
March 2015.
[46] Peter Ferrie, Senior Anti-Virus Researcher, Microsoft Corporation. “Anti-unpacker tricks”.
[47] C. Wang. “A security architecture for survivability mechanisms.” PhD thesis, University
of Virginia, 2001
[48] Linn, C., & Debray, S. (2003). “Obfuscation of executable code to improve resistance to
static disassembly.” In V. Atluri, & P. Liu (Eds.), “Proceedings of the ACM Conference
on Computer and Communications Security” (pp. 290-299)
[49] Bart Coppens, Bjorn De Sutter. “ASPIRE D2.06 Binary Code Obfuscation Report.” 13
May 2015. https://aspire-fp7.eu/sites/default/files/D2.
06-Binary-Code-Obfuscation-Report.pdf
[50] Robbie Harwood and Maxime Serrano. “Lecture 26: Obfuscation.” 21 November 2013.
[51] Pellsson. “Starcraft 2 Anti-Debugging”. 8 March 2010.
[52] G. Developers. GDB: The GNU Project Debugger.
https://www.gnu.org/software/gdb/
[53] How to debug program with signal handler for SIGSEGV. http://stackoverflow.com/
questions/3414860/how-to-debug-program-with-signal-handler-for-sigsegv
[54] ELF Sections & Segments and Linux VMA Mappings.
http://nairobi-embedded.org/040_elf_sec_seg_vma_mappings.html
[55] Jonathan Corbet. Supervisor mode access prevention.
https://lwn.net/Articles/517475/
